
Submitted:
21 November 2024
Posted:
25 November 2024
You are already at the latest version
Abstract
Toll-like receptor (TLR) signaling pathway is part of the innate immune program that might destroy the cancer cells within a tissue if properly activated and the malignant cells’ defense system is inhibited. Activation of the TLR pathway induces production of pro-inflammatory cytokines and upregulation of costimulatory molecules, impacting initiation, advancement, and control of cancers by regulating the inflammatory microenvironment. Publicly accessible transcriptomic profiles of three cancer nodules and the surrounding normal tissue isolated from a surgically removed prostate tumor were used to determine the cancer-induced alterations of the TLR and chemokine (CHS) signaling pathways, and their interplay. Our analysis revealed that the deep cancer-related topology remodeling is different not only between patients but even between equally graded cancer nodules within the same tumor. We found also that cancer reorganized the transcriptomic networks interconnecting the two pathways via their shared genes, inducing novel expression coordination while removing others. The reorganization was different among the cancer nodules, indicating distinct changes in the molecular mechanisms of the immune response and the need to personalize the anti-cancer treatment beyond the patient him/herself to the main cancer nodules in the tumor.
Keywords:
CCL15
; CCL16
; CCR6
; FADD
; GNB1
; IRF5
; NFKBIA
; RAC3
; TLR4
; TYK2
1. Introduction
Toll-like receptors are a key family of pattern recognition receptors in the innate immune system and play a fundamental role in host defenses [1]. The activation of TLR signaling pathways prevents not only pathogen infection by recognizing pathogen-associated molecular patterns (PAMPs) [2] but also cancer by recognizing dangerous endogenous damage-associated molecular patterns (DAMPs) [3]. Once TLRs recognize their ligands, an intracellular signaling cascade is triggered to activate master transcriptional factors including NF-κB and IRFs to induce pro-inflammatory cytokines, upregulate costimulatory molecules, and secrete interferons [4]. These activations control tumor immune microenvironments and affect T cell anti-tumor activity.
Prostate cancer (PCa) is the most common cancer in men worldwide [5]. Althoughmost PCa in the early stages can be managed by hormone therapies, some of them inevitably will become hormone deprivation-resistant, metastatic, and deadly, a condition known as metastatic castration-resistant PCa (mCRPC). Patients with mCRPC often fail to respond to current treatments, including cancer immunotherapy. We recently found that prostate cancer cells express a repertoire of TLRs and activation of TLR5 by the bacterial protein flagellin, a known TLR5 agonist, induces robust anti-tumor immune responses along with NF-κB activation in prostate cancer [6].
This study complements two previous publications [7,8] with the analysis of the cancer-induced remodeling of the Toll-like receptor signaling pathway (hereafter denoted TLR) and its interplay with the chemokine signaling pathway (CHS) in the three cancer nodules harbored by a surgically removed prostate tumor.
Such analysis provides insight into the transcriptomic behavior of the prostate cancer cells and innate and adaptive immunities. Understanding the remodeling of the TLR might provide a new strategy for developing novel personalized gene therapies for this malignancy [9], including the use of TLR agonists [10].
2. Materials and Methods
2.1. PROSTATE tissues
We re-analyzed the gene expression profiles of three cancer nodules and the normal surrounding tissue of a surgically removed prostate tumor from a 65y old black man deposited (together with the experimental protocols) on the publicly accessible NCBI Gene Expression Omnibus [11,12,13]. The three cancer nodules were denoted as “A”, “B”, and “C”; “A” is the primary cancer nodule (Gleason Score GS = 4 + 5 = 9), while nodules “B” and “C” (each with GS = 4 + 4 = 8). Point (~ 2mm) biopsies from each cancer nodule and surrounding normal tissue (denoted as “N”) were split into four biological replicas and the total RNA extracted and hybridized with Agilent-026652 Whole Human Genome Microarray 4x44K v2 [14].
2.2. Transcriptomic Characterization of Individual Genes (Appendix A)
The expression levels of adequately quantified genes (by spots with no corrupt pixels and foreground fluorescence larger than twice the background) were normalized to that of the median gene of that microarray. Each gene “i” was characterized in every prostate region “c” by the primary independent variables: AVEi(c), REV i(c) and COR ij(c), that are mathematically defined in Appendix A for each condition/region “c”.
AVEi(c) (formula A1) is the average normalized expression level over biological replicas normalized to the median gene expression.
REV i(c) (formula A2) is the mid-interval of the chi-square estimate of the expression coefficient of variation of the normalized to the median expression levels of a gene among the biological replicas of a given region.
COR ij(c) (formula A3) is the correlation coefficient of the (log2) normalized to the median expression levels of genes “i” and “j” in the region “c”. As proved recently [15], given the technical noise of the microarray technology, the configuration function of the transcriptome is suitable for approximating the set of all possible pair-wise correlations among gene expressions in biological replicas.
There are three statistically significant types of expression correlation:
i. 1 ≥ COR ij(c) ≥ 0.95, synergistic expression (i.e. expressions of both genes fluctuate synchronously across biological replicas);
ii. -0.95 ≥ COR ij(c) ≥ -1, antagonistic expression (i.e. expressions of the two genes fluctuate in antiphase (when is up the other is down) across biological replicas);
iii. |COR ij(c)| <0.05, independent expressions (i.e. expression change of one gene has no consequences for the other one).
We used also the derived characteristics Relative Control Strength “RCS” (A4), Relative Expression Control “REC” (A5), Coordination degree “COORD”, and Gene Commanding Height “GCH” (A6).
RCS indicates how stable is that gene expressed among the biological replicas of the profiled region with respect to the median gene, the log2 ratio in the definition of REC dividing the genes into equally two subsets with symmetric positive and negative values. High positive RECs point out genes whose expression control is very strict, most likely because their right expression levels are critical for the cell survival and phenotypic expression. By contrast, the most negative RECs pinpoint genes whose expressions may loosely fluctuate, as they might be vectors of adaptation to the changing environment.
COORD = percentage of synergistically expressed gene pairs + percentage of antagonistically expressed pairs - percentage of independently expressed genes within the analyzed pathways. Together, the percentage of synergistically expressed gene pairs and the percentage of antagonistically expressed pairs indicate how much coupled (i.e. influencing each-other the expression) are the genes in the functional pathway
GCH combines the expression control and the expression coordination with all other genes and serves to identify the Gene Master Regulators (GMRs, top GCH) of the entire transcriptome or just of selected functional pathways in the profiled region.
2.3. Transcriptomic Characterization of Functional Pathways and Their Interplay
In this study, we resume the pathway analyses from previous papers ([7,8]) with the KEGG [16]-derived signaling pathways CHS ([17]) and TLR ([18]), and their transcriptomic interplay through the shared genes. All transcriptomic characteristics of individual genes were after that ranked and averaged over the pathway(s) they belong.
2.4. Quantification of Transcriptomic Regulation (Appendix A)
A gene is significantly regulated in the cancer nodule (A, B or C) with respect to the normal tissue (N) when it satisfies the composite criterion (A7). It requires that |x| (the absolute fold-change of the expression ratio x (A8), negative for down-regulation) exceeds the corresponding cut-off value (“CUT”) and the p-value of the heteroscedastic t-test for the means’ equality is less than 0.05. CUT (A9), computed for each gene in the two-region comparison, accounts for both biological variability across the replicas and technical noise of the probing spots. Fold-change formulas (A10 & A11) quantify the changes of REC and GCH.
3. Results
135 out of 191 CHS and 76 out of 109 TLR KEGG-identified genes were profiled and analyzed in this report. Transcripts of missing genes were either not probed by the used Agilent microarray platform, or amount below the detectable limit (i.e. yielding a foreground fluorescence signal less than twice the background in the hybridized spot), or were hybridized to microarray spots with either corrupted or saturated pixels in at least one sample. The analyzed pathways share 33 genes, out of which we quantified 28: AKT1/2/3, CCL3/3L3, CCL4L2, CCL5. CHUCK, CXCL9/10/11, IKBKB/G, MAP2K1, MAPK1/10, NFKB1, NFKBIA, PIK3CA/B/D, PIK3R1/2/3, RAC1, RELA, STAT1/2.
3.1. The three CHS and TLR genes with the highest expression level (largest AVE)
We began by identifying the top three genes with the highest average expression level (AVE) in three prostate cancer nodules (A, B, C) and the surrounding normal tissue (N) (Table 1, expression ratios in Table S1 from the Supplementary Materials).
In the surrounding normal tissue “N”, the top three CHS genes were GNAI2, RAC3, and STAT2 (common to both pathways). Interestingly, GNAI2 and STAT2 were also expressed at levels close to the normal one (no significant regulation) in the cancer nodules, suggesting their important roles in the immune response in the entire prostate tissue. However, RAC3 expression was lower in all three cancer nodules compared to the normal tissue (expression ratios: x(A vs N) = -2.11; x(B vs N) = -1.51, x(C vs N) = -1.35), indicating that RAC3 down-regulation may contribute to decreased cell proliferation, migration, and invasion in prostate cancer [19].
Among the CHS genes, CXCL14 (positive fold-changes: x(A vs N) = 6.69; x(B vs N) = 7.17, x(C vs N) = 4.58) and NFKBIA (x(A vs N) = 2.23; x(B vs N) = 2.90, x(C vs N) = 1.60) had high expression levels in all three cancer nodules but not in the surrounding normal tissue. The up-regulation of these genes underscores their important roles in prostate cancer development. In the analysis of TLR genes, IRF7 was also highly expressed in all three cancer nodules (although twice more in B than in C) but not in the surrounding normal tissue (expression ratios: x(A vs N) = 3.02; x(B vs N) = 4.15, x(C vs N) = 2.05).
3.2. The Three Most Controlled CHS and TLR Genes in Each Profiled Region
The REC analysis identifies the most critical CHS and TLR genes for cell survival and phenotypic expression in the cancer nodules “A”, “B”, “C”, and the normal tissue “N”. Table 2 presents the REC values (formula A5) of the top three genes in each profiled region. The fold-changes (negative for down-regulation, formula A10) of the Relative Control Strength (formula A4) in the cancer nodules with respect to “N” are presented in Table S2 from the Supplementary Materials.
Within the CHS pathway, the most controlled genes (highest positive REC values) in the cancer nodules were: GNB1 (“A”), MAPK1 (“B”) and CCL16 (“C”). According to the FC scores, each of these genes had an impressive increase of the control strengh with respect to the normal tissue in one nodule but not in the other two. Thus, GNB1 had:
FC(A vs N) = 23.99, FC(B vs N) = 1.38, FC(C vs N) = 2.04, MAPK1 had: FC(A vs N) = 2.14, FC(B vs N) = 9.92, FC(C vs N) = 2.07, while CCL16 had: FC(A vs N) = -1.11, FC(B vs N) = 2.08, FC(C vs N) = 9.53.
The situation is similar within the TLR pathway where the most controlled gene in one cancer nodule had lower fold-change increases in the other nodules. Thus, TYK2 had FC(A vs N) = 27.98, FC(B vs N) = 6.05, FC(C vs N) = 1.11, TOLLIP had: FC(A vs N) = 5.07, FC(B vs N) = 13.19, FC(C vs N) = -1.10, more control in “B” but even less control in “C” than in “N”), and IRF5 had: FC(A vs N) = 2.19, FC(B vs N) = 1.45, FC(C vs N) = 6.82.
On the opposite side, the control strength of the top three CHS genes in N exhibited a substantial reduction in each of the three cancer nodules. Thus, the control strength of the top CHS gene, CCL15, was reduced by: FC(A vs N) = -25.22, FC(B vs N) = -5.21, FC(C vs N) = -6.29. The control stength of VAV2 was reduced by: FC(A vs N) = -8.23, FC(B vs N) = -7.91, that of KRAS by FC(A vs N) = -3.29, FC(B vs N) = -6.66 and FC(C vs N) = -2.60. Although less impressive, the control strength of the top TLR genes was also reduced in the cancer nodules. Thus, PIK3R1 had FC(A vs N) = -3.49, TBK1 had FC(B vs N) = -3.12, FC(C vs N) = -2.45, PIK3CA had: FC(A vs N) = -1.60, FC(B vs N) = -2.29, FC(C vs N) = -3.04.
The most important conclusion of this analysis is that the homeostatic expression control mechanisms are different among the cancer nodules, even equally pathologicaly graded and harbored by the same tumor.
3.3. The Three Least Controlled CHS and TLR Genes in Each Profiled Region
The REC analysis identified also the CHS and TLR genes whose loose expression control (largest negative REC values) make them suitable as adaptation vectors to the environmental change. Table 3 presents the least controlled three genes in each profiled region, while Table S3 from the Supplementary Materials presents the fold-changes of the control strength with respect to “N”.
Interestingly, genes such as CCL15 jumped from being very strictly controlled in the normal tissue (REC = 2.75) to being very loosely controlled in nodule C (REC = -1.91), meaning an over 25x increase in the Relative Expression Variation (REV). CCL19 was the least controlled in the equally graded nodules “B” and “C”, but not in “A” and even less controlled in “N”. Within the TLR pathway, the least controlled genes in nodules “A” (TICAM2) and “B” (CXCL11) had also relaxed control in the normal tissue.
It is important to note that in the primary cancer nodule A, the expression control of TLR4 is substantially reduced (by 4.14x, i.e. by 314%). However, the control in the equally graded nodules is increased by 1.40x (i.e. 40%) in B and by 2.28x (i.e. 128%) in C (Table S3). These results indicate major switches in the cell’s priorities in controlling the expression levels of critical genes.
Since the least controlled genes might be used by the cell as adaptation vectors to accommodate various local environmental conditions, these results indicate that the transcriptomic molecular mashinery might be adjusted in various ways to respond the environmental challenges.
3.4. Regulation of the TLR-Signaling Pathway In The Cancer Nodules Compared To The Surrounding Normal Tissue
Figure 1 presents the statistically significant regulation of the genes included in the KEGG-determined Toll-like receptor signaling pathway [16] in the cancer nodules “A”, “B” and “C” with respect to the surrounding normal tissue “N”.
Overall, the common features among the three nodules are the upregulation of the cell surface TLRs (TLR1/2/6 and TLR4) and of the associated CD14. Furthermore, these cell surface TLRs activate via intracellular signaling cascades the transcriptional factors NF-kB and IFNs that trigger the response of the innate and then adaptive immune system. Of note is that even the equally graded cancer nodules “B” and “C” from the same tumor exhibit differences in the gene expression regulation, proving the tumor transcriptomic heterogeneity. Thus, out of the 76 quantified genes, 17 (22.37%) were up- and 10 (13.16%) were down-regulated in “B”, while 13 (17.11%) were up- and 4 (5.26%) were down-reguled in “C”. Nodule “A” prensented 20 (26.32%) up- and 9 (11.84%) down-regulated genes. Although the significat reglation profiles were different among the three cancer nodules, no TLR gene was oppositelly regulated in two nodes.
3.5. Regulation of the Chemokine Signaling (CHS) Pathway
Figure 2 presents the statistically significant regulation of the genes included in the KEGG-determined Chemokine signaling pathway [17] in the cancer nodules “A”, “B” and “C” with respect to the surrounding normal tissue “N”. Of note is that even the equally graded cancer nodules “B” and “C” from the same tumor exhibit differences in the gene expression regulation, proving the tumor transcriptomic heterogeneity. Thus, out of the 135 quantified genes in this pathway, 24 (17.78%) were up- and 21 (15.56%) were down-regulated in “B”, while 25 (18.52%) were up- and 8 (5.93%) were down-regulated in “C”. Nodule “A” presented 32 (23.70%) up- and 20 (14.81%) down-regulated genes. Although the significant regulation profiles were different among the three cancer nodules, no CHS gene was oppositely regulated in two nodes. A number of 28 genes were included in both TLR and CHS signaling pathways: AKT1/2/3, CCL3, CCL3L3, CCL4L2, CCL5, CHUK, CXCL9/10/11, IBKB/G, MAP2K1, MAPK1/10, NFKB1, NFKBIA, PIK3CA/B/D, PIK3R1/2/3, RAC1, RELA, STAT1/2. We considered these common genes as connectors between the two pathways.
3.6. Remodeling of the TLR-CHS Interplay
3.6.1. Significant Expression Coordination
Figure 3 presents the (p < 0.05) statistically significant positive (i.e. synergistic) and negative (antagonistic) expression coordination of the TLR-signaling pathway genes with the CHS signaling pathway genes through the 28 shared genes in the surrounding normal prostate tissue “N” (a) and the three cancer nodules. Of note are the significant increases of the coordination scores (COORD) from 1.09% and 2.50% in “N” to 8.97% and 13.51% in “A”, 4.52% and 6.79% in “B”, and 3.43% and 6.73% in “C”. It is also important to observe the substantial differences among the cancer nodules collected from the same tumor even when they were equally graded. The coordination differences indicate that cancer-triggered remodeling of the TLR-CHS transcriptomic interplay is dependent on the local, never exactly repeating conditions.
3.6.2. Significant Expression Independence
Figure 4 presents the (p < 0.05) statistically significant expression independence of the TLR and CHS genes with their 28 common hubs in the normal tissue “N” (a) and the three cancer nodules. Significant expression independence means that there is no functional pathway (including, but not limited to TRL and CHS signaling ones) where the encoded proteins by the two genes might directly interact.
We found substantial decreases of the percentages of independently expressed genes, from 5.90% and 4,94% in “N” to 2.84% and 2.02% in “A”, 3.64% and 2.80% in “B”, and 3.43% and 2.80% in “C”. The percentage of the independently expressed gene pairs has negative contribution to the overall coordination score “COORD” provided in Figure 3 for the transcriptomic interplay of the CHS and TLR signaling pathways through the shared genes.
3.6.3. Prostate Cancer Couples Several Normally Independently Expressed TLR and CHS genes
Figure 5 presents the (p < 0.05) statistically significant independently expressed TLR-CHS gene pairs in the normal tissue that were turned into (p < 0.05) statistically significant synergistically or antagonistically expressed genes. The 28 genes shared by the two pathways were excluded from this analysis and only the pairs with significant changes in their expression coordination are presented. Of note is that cancer made genes that are normally independently expressed to coordinate their expression fluctuations, indicating deep remodeling of the molecular mechanisms. It is important to observe the inter-nodule differences in the significant gene expression coupling, even between equally graded nodules from the same tumor. Thus, in nodule “A”, 11 independently expressed gene-pairs were turned into synergistically and 11 into antagonistically expressed, in “B”, 6 were turned synergistically and 4 antagonistically, while in “C”, 10 were turned synergistically and 7 antagonistically expressed.
3.6.4. Prostate Cancer Decouples Several Coordinately Expressed TLR and CHS Gene-Pairs in the Normal Tissue
We found that cancer not only couples genes that are normally independenly expressed but also that it decouples genes whose expression is normally significantly synergistically or antagonistically coordinated. Figure 6 presents part of the significantly coordinatelly expressed TLR-CHS gene-pairs (shared genes excluded) in the normal tissue that were decoupled in the cancer nodules. Of note are again the substantial differences among the three cancer nodules with 6 coordinatelly expressed gene-pairs turned into independently expressed in “A”, 8 in “B” and 5 in “C”.
3.6.5. Prostate Cancer Switches to the Opposite the Normal Coupling of Several Gene Pairs
We found that in addition to coupling some normally independently expressed genes or decoupling genes whose expressions are significantly correlated, cancer also switches the normal type of expression coordination. Figure 7 presents part of the TLR-CHS gene pairs whose normal significant synergistic or antagonistic expression was switched to the opposite by cancer. Of note are again the differences among the three cancer nodules. Thus, “A” turned 6 synergistic pairs into antagonistic and 3 antagonistic into synergistic, “B” turned 3 synergistic into antagonistic and 3 antagonistic into synergistic, and “C” turned 5 synergistic into antagonistic and only one antagonistic into synergistic.
3.7. Key Influential Genes in the CHS and TLR Signaling Pathways
In addition to being strctly controlled because its right level is critical for the cell physiology, expression of a key gene is also a major regulator of the transcription of many other genes. Analysis from the GCH score perspective (definition formula A6) revealed distinct patterns of influential genes across the three prostate cancer nodules and the surrounding normal tissue “N”, highlighting the heterogeneous nature of the disease. In nodule “A”, the top three influential genes were GNB1, JAK2, and TYK2, while nodule “B” showed a predominance of CCR6, CCR1, and BCAR1. Nodule “C” exhibited a different pattern with CCL16, PLCB1, and PREX1 as the most influential genes. The surrounding normal tissue “N” displayed yet another distinct profile with CCL15, PRKCD, and VAV2 emerging as the top influential genes (Table 4). Table S4 in the Supplementary material gives the fold-changes (negative for down-regulation) of the GCH scores in the cancer nodules with respect to “N”.
4. Discussion
Although limited to three cancer nodules and the surrounding normal tissue from a surgically removed prostate tumor, our all-inclusive transcriptomic analysis provides new insights into the dynamic regulation of the toll-like receptors and chemokine signaling pathways. The investigation was carried out from the perspective of the Genomic Fabric Perspective that provides the most theoretically possible comprehensive characterization of the transcriptome [20].
The observed heterogeneity of the gene expression profile, control and networking across the cancer nodules of the tumor highlights the complexity of prostate cancer biology. These results may inform future personalized therapeutic strategies aimed at targeting specific signaling pathways that are dysregulated in prostate cancer, with the potential to develop more personalized and effective treatments.
The present report confirms our prior observations regarding the unrepeatability of the cancer-induced remodeling of the transcriptomic topology not only from person to person but also among the cancer nodules (even those equally graded) from the same tumor. The transcriptomic uniqueness of the investigated prostate cancer nodules was before disclosed for the P53-signaling, apoptosis, block of differentiation, evading apoptosis, immortality, insensitivity to anti-growth signals, proliferation, resistance to chemotherapy, and sustained angiogenesis [7]. A similar conclusion resulted from the analysis of: mTOR signaling, metabolic genes and expression coordination of AKT2 with its partners central to the KEGG-constructed prostate cancer pathway [21] in another prostate tumor [8]. The standard immortalized prostate cancer cell lines LNCaP [22,23] and DU145 [24,25] presented also substantial differences in the transcriptomic organization. The singleness of the cancer nodules seems to be not limited to the prostate tumors but extended to all poly-clonal malignancies. Meaningful inter-nodule differences were found through analysis of: chemokine and VEGF signaling, apoptosis, basal transcription factors, cell cycle, oxidative phosphorylation, and RNA polymerase pathways in a case of metastatic clear cell renal cell carcinoma [15,26].
The observation that GNAI2 maintained the highest expression levels across tumor (normal and cancerous) regions (Table 1) suggests that the malignancy does not alter the fundamental role of the encoded protein (Giα2) in the chemokine signaling. Although not statistically significant, GNAI2 slight over-expression in all nodules: x(A vs N) = 1.19, x(B vs N) = 1.65, x(C vs N) = 1.18 (Table S1) justifies why Giα2 is essential also for the prostate cancer cell migration [27]. An interesting paper [28] has shown that the GNAI2 expression decreased in the early stage of ovarian cancer but increased compared to normal in advanced cancers.
The differential expression of several key genes between normal and cancerous tissues provides insight into potential cancer-specific mechanisms. For instance, the downregulation of RAC3 in cancer nodules, contrary to its high expression in normal tissue, indicates a possible tumor-suppressive role that contradicts some previous findings in other cancer types [19]. This discrepancy might reflect tissue-specific functions or temporal dynamics of cancer progression [29].
The upregulation of CXCL14 in all cancer nodules aligns with previous findings [30], while the elevated expression of NFKBIA (Table 1) is somehow surprising, suggesting a more complex regulation of CHS and TLR signaling pathways in prostate cancer. NFKBIA encodes IκBα, which binds and inhibits the NF-κB complex [30]. This could indicate an intricate feedback mechanism attempting to maintain cellular homeostasis in the face of persistent inflammatory signaling. The up-regulation of IRF7 (Table S1), a critical transcription factor in type I interferon responses, is still not enough explored in the context of potential gene therapy of prostate cancer [31].
The results from Table 2 listing the most strictly controlled genes indicate that the phenotypic expression of histo-pathologically distinct regions in the same tumor depends on most likely different sets of critical genes, even for equally pathologically graded nodules. GNB1, shown to promote malignancy in the colon [32], was the most controlled gene in “A” (but not in “B” and “C”) while MAPK1, a valuable target in anti-cancer therapy [33], was the most controlled in “B” (but not in “A” and “C”). Effectiveness of intra-tumoral injection of CCL16 [34], the most controlled in “C” (but not in “A” and “B”) might be explained by its significant downregulation in prostate cancer. The control of GRK5, known for its regulating power in prostate cancer metastases [35], increased by 6.62x in “B” with respect to “N” but stayed practically the same in “C” (FC(C vs N) = 1.12).
Table 3 shows that the most likely adaptation genes are also different among the cancer nodules. Our analysis revealed dramatic shifts in gene expression control between normal and cancerous tissues. The observation that CCL15 transformed from being strictly controlled in normal tissue to loosely controlled in cancer nodules suggests a significant disruption of normal regulatory immune response mechanisms [36,37]. Conversely, we found a spectacular increase of the expression control of TYK2 (FC(A vs N) = 27.98) and GNB1 (FC(A vs N) = 23.99) in nodule “A” (but to a much lesser extent in “B” and “C”). These results indicate that each cancer clone selectively enforce strict regulation of certain signaling components [35,38] while allowing others to vary widely.
The identification of 28 shared genes between TLR and CHS signaling pathways provides insight into the interconnected nature of these inflammatory response networks [39,40,41,42]. The consistent upregulation of cell surface TLRs (TLR1/2/6 and TLR4) and CD14 across all three nodules suggests a common mechanism for enhanced immune surveillance or inflammation in prostate cancer. This is further supported by the activation of downstream NF-κB and interferon signaling pathways [43,44,45,46,47].
Given the prominent role of TLR4 in immune system signaling [48] and its potential use as a prostate cancer biomarker [49], it is puzzling to note its loosed control in nodule “C” while its control is even stricter in the other two nodules with respect to “N”. This is another indication of the dependency of cellular homeostasis on the local environmental conditions.
One of the most striking observations is the evidence for substantial tumor heterogeneity, even between equally graded nodules from the same tumor, as illustrated in Figure 1bc and Figure 2bc. The differential significant regulation patterns observed in nodules B and C not only as affected genes but also as percentages (22.37% vs. 17.11% up-regulated and 13.16% vs. 5.26% down-regulated TLR genes, respectively) emphasize the importance of considering intra-tumoral heterogeneity in therapeutic strategies [50,51,52,53,54].
For instance, while three TLR signaling mitogen-activated kinases (MAP2K2, MAP2K3, MAPK13) were upregulated and four (MAP2K4, MAP2K6, MAPK9, MAPK10, MAPK11) were down-regulated in ”B”, only MAP2K3 was upregulated and MAP2K6 was down-regulated in “C” (Figure 1). The differential regulation of the mitogen-activated kinases in the two equally graded nodules indicates that participation of the MAPK signaling [55] to the “development, invasion, metastasis, and drug resistance” [56] of cancer cells is not uniform even across the same prostate. Also, while four CHS signaling guanine nucleotide binding proteins (GNB1, GNG10, GNG4, GNG5) were upregulated and three (GNB4, GNG12, GNG7) were down-regulated in “A”, only two genes (GNG7, GNG8) were down-regulated in “B” and no gene was up- or down-regulated in “C” (Figure 2).
The coordination analysis is based on the “Principle of Transcriptomic Stoichiometry” (PTS) [57] requiring expression correlation of the genes whose encoding products are linked in a functional pathway. This principle, theoretically ensuring the efficiency of the functional pathways, extends to the gene networking the classical Dalton’s Law of Multiple Proportion from chemistry [58]. Like the chemical elements that can combine in multiple proportions to produce various molecules, the genes can also be networked in several ways to respond the stringent necessities of the cells in their actual environment.
Figure 3 presents a remarkable increase in coordination scores from normal tissue (1.09% and 2.50%) to cancer nodules (up to 8.97% and 13.51% in nodule A), suggesting that cancer development involves extensive remodeling of pathway interactions [59,60]. This increased coordination degree (higher in the primary nodule “A” than in the secondary “B” and “C”) might represent a more rigid signaling state that could potentially be exploited on novel therapeutic avenues. Of note are also the different ways by which the genes are networked in the four investigated regions, especially between nodules “B” and “C”, a strong argument that the personalization of the cancer gene therapy should go beyond the individual to the most aggressive cancer clones from the tumor.
Identification of the gene pairs whose expression coordination is statistically significant was complemented in each profiled prostate region with the independently expressed gene-pairs. The independent expression analysis selects genes that are not linked within or between any functional pathway(s) in the profiled region, although they can be coordinated in other tissues. Figure 4 shows substantial decreases of the percentages of independently expressed genes, from 5.90% and 4,94% in “N” to 2.84% and 2.02% in “A”, 3.64% and 2.80% in “B”, and 3.43% and 2.80% in “C”. Like the spectrum of the expression coordination in Figure 3, the spectrum of the expression independence in Figure 4 is not repeatable even among the cancer nodules from the same tumor, making less likely to be repeated from person to person.
The transformation of independently expressed gene-pairs in normal tissue into coordinately expressed pairs in cancer, and vice versa, reveals the extensive rewiring of cellular signaling networks during cancer development [61,62,63].
Of particular interest is the switching of gene pair relationships from synergistic to antagonistic expression (or vice versa) in cancer tissue. For instance, the antagonistic pairs MAPK11-NFKBIA and SOS2-NFKBIA in “N” are turned into synergic ones in “A”, while the synergist pair CCL17-CXCL10 in “N” is reversed into an antagonistic one in “A”. In a synergistic pair, the expressions of the two genes are stimulating each-other either directly or through a common transcription factor, while in an antagonistic pair the two genes are inhibiting each-other. These changes suggest that cancerization not only alter individual gene expression but fundamentally reorganize the relationships between signaling components [64,65]. The findings of this analysis question the “universality” of the functional pathways as designed by various specialized software, KEGG [16] and Ingenuity PathAssist [66] included.
The prostate cancer intratumor heterogeneity was revealed in previous studies through coordination analysis of gene networks involved in metabolism [7], enzymatic activity [8], as well in expression coordination of AKT2, MTOR [8], and PTEN with their partners [20]. The unrepeatable remodeling of the gene network among cancer nodules of was also reported in a case of clear cell renal cell carcinoma (ccRCC) for all KEGG-designed functional pathways of the excretory system [15,67], chemokine signaling, basal transcription factors, RNA polymerase, and cell cycle [26]. In thyroid cancer investigations, we analyzed the remodeling of the functional pathways involved in the genetic information processing [68], oxidative phosphorylation [69], or those by which the ncRNAs regulate apoptosis [70].
A significant result of the present study is the hierarchization of the CHS and TLR signaling genes in the four regions with respect to their gene commanding height (GCH) score (Table 4, fold-changes in Table S4). GCH combines the strength of the expression control and expression coordination. High expression control stipulates the importance of that gene for the cell physiology, while high coordination degree indicates how influential it is on the expressions of other genes [71].
As expected, we found different hierarchies in the four regions (Table 4), as well as substantial GCH score changes for the same gene from one region to another (Table S4). For instance, the GCH score of CCL15, a chemokine protective factor for both liver and lung neoplasms [72], was reduced by 122.87x in “A”, 12.42x in “B” and 10.65x in “C”. This substantial reduction of the GCH score means that while experimental manipulation of this gene might have strong (even lethal) repercussions on the healthy tissue, it will have practically no effect on the cancer cells.
The downgrade of VAV2, known to activate RhoA that mediates prostate cancer cell–cell repulsion required for metastasis [73], mainly by substantially reducing its expression control (Table 2), increases the flexibility of the cancer cells to adapt to different local environments. We found also that the EPH receptor A4 (EPHA4), a mediator of the contact inhibition locomotion [74] through regulating Vav2-RhoA was significantly down-regulated in all three cancer nodules by: x(A vs N) = -3.35, x(B vs N) = -7.20, x(C vs N) = -6.34.
The relevance of FADD, an important receptor protein involved in transmitting apoptosis initiation signals [75,76] was significantly reduced in nodule “C” (FC(C vs N) = -17.41), to a lesser extent in nodule “B” (FC(B vs N) = -3.25) and much lesser in “A” (FC(A vs N) = -1.45). In contrast, the GCH score of RIPK1, an essential regulator for necrosis induced by tumor necrosis factor α (TNF-α) [77], increased more in nodule “A” (FC(A vs N) = 4.56) than in the other two nodules (FC(B vs N) = 1.16; FC(C vs N) = 2.04). Our results indicate that the molecular mechanisms for cancer cell survival and proliferation are not uniform across the malignant part of the surgically removed prostate. Furthermore, in a previous work (Figure S1 in Ref. [7]), we reported the inter-nodule heterogeneity of the regulation of genes associated with: block of differentiation, evading apoptosis, immortality, insensitivity to anti-growth signals, proliferation, resistance to chemotherapy, and sustained angiogenesis.
Although not regulated in any cancer nodule with respect to “N”, TOLLIP, encoding an autophagy product protein produced during prostate cancer development [78], had a substantial increase of the expression control strength (and implicit relevance) in nodule B. Interestingly, the same gene exhibited a decrease of the expression control strength in nodule C (Table S2). In contrast, the significantly upregulated IRF5 in all three cancer regions (x(A vs N) = 1.57, x(B vs N) = 2.20, x(C vs N) = 1.94), part of the so-called “seven gene signature of the neuroendocrine prostate cancer” [79], had a higher relevance increase in nodule “C” (FC(C vs N) = 6.20) than in “B” (FC(B vs N) = 1.63) or “A” (FC(A vs N) = 2.40) (Table S4). –
5. Conclusions
The substantial differences in the expression level, control and inter-coordination even between two equally graded cancer nodules from the same tumor invalidates the cancer gene biomarker paradigm [80], regardless of its wide usage [81,82]. Our Genomic Fabric approach [83] extends to novel characteristics (expression control and gene networking) of the recognized transcriptomic heterogeneity of prostate cancer [51,52,53]. Moreover, the reported results confirm the “Stem Cell Theory” [54,84,85] claiming that “the same genetic abnormalities and microenvironmental aberrations lead to different biological effects and clinical outcomes”. On top of this, the GCH analysis identifies also the Gene Master Regulators (GMR) [26] whose manipulation is expected to be the most consequential for the persistence of that phenotype [86]. Given that the set of major cancer nodules GMRs are singled out for each person, they are the most legitimate targets of a personalized gene therapy [7,8].
Comparing the top CHS and TLR genes with the GMRs of these regions (determined in [7]) indicates the importance of the two analyzed immune response pathways for the entire transcriptomes. Thus, in “N”, with GCH = 16.84 (CCL15) and GCH = 7.28 (FADD) both CHS and TLR are far below GCH = 74 of TOR1A (torsin family 1, member A), an important regulator in lipid metabolism [87]. With GCH = 34.15 (GNB1) and GCH = 11.86 (RIPK1) they are far below GCH = 149 of ENTPD2 (ectonucleoside triphosphate diphosphohydrolase 2), in “A”, part of 7-gene prognosis signature of gastric cancer [88]. In “B”, with GCH = 5.46 (CCR6) and GCH = 7.21 (TOLLIP) are below AP5M1 (adaptor-related protein complex 5, mu 1 subunit, a.k.a. MUDENG), recognized for its pro-apoptotic function [89]. Finally, in “C”, with GCH = 14.72 (CCL16) and GCH = 11.34 (RIPK1) both CHS and TLR are below GCH = 49 of BAIAP2L1 (BAI1-associated protein 2-like 1, a.k.a. IRTKS), reported as up-regulated in many tumors [90]. The comparison of the GCHs shows that, at least for this patient, manipulation of the CHS and TLR would not be lethal in any region of the prostate.
The idea of gene master regulators of prostate cancer was used by several other groups, but they are limited to only the expression levels of certain transcription factors [91,92,93,94] or tumor suppressors involved in major processes like adipogenesis [95] or cell-cycle [96]. Nevertheless, our GMRs offer a distinct perspective by considering how critical is the right transcription level for the cell survival (revealed by the expression control across biological replicas) and how influential that gene (through significant expression correlations with other genes). However, because of the unrepeatable nature of the transcriptomic topology, the real value of the GMRs of one person can be tested only on that person. In addition, given the dynamics of the local conditions, the GMRs change in time, so their validation test should be performed not too late from the identification moment.
Supplementary Materials
The following supporting information can be downloaded at the website of this paper posted on Preprints.org.
Author Contributions
Conceptualization, D.A.I. and D.Z.; methodology, D.A.I.; software, D.A.I..; formal analysis, S.A.I.; data curation, D.Z.; writing—original draft preparation, D.A.I.; writing—review and editing, D.Z. All authors have read and agreed to the published version of the manuscript.
Funding
This research received no external funding.
Institutional Review Board Statement
The study, conducted according to the guidelines of the Declaration of Helsinki, was part of Dr. Iacobas’s project approved by the Institutional Review Boards (IRBs) of the New York Medical College (NYMC) and Westchester Medical Center (WMC) Committees for Protection of Human Subjects. The approved IRB (L11,376 from 2 October 2015) granted access to frozen cancer specimens from the WMC Pathology Archives and depersonalized pathology reports, waiving the patients’ informed consent.
Informed Consent Statement
Patient consent was waived due to depersonalized pathology reports of the frozen tissues.
Data Availability Statement
Expression data are available from publicly accessible gene datasets GSE183889, GSE168718, GSE133906 from https://www.ncbi.nlm.nih.gov/gds/?term=iacobas%2C+prostate.
Conflicts of Interest
The authors declare no conflicts of interest.
Appendix A (software details in [71])
- 1.
- Normalized Average expression level (AVE)
Where: is the net fluorescence (background subtractd foreground) of spot probing that gene in replica k (=1,2,3,4) of region c, is the net fluorescence of the median gene and is the average net fluorescence over all biological replicas.
- 2.
- Relative Expression Variation (REV)
Where: is the coeficient of variation of the normalized expression level over the biological replicas and χ is the chi-square score with the probability β (usually 0.05) and ri degrees of freedom (= ni -1, ni = 4Ri; Ri = numbr of spots probing redundantly gene i.
- 3.
- Correlation (COR) of expression levels of two genes
Where correl is the pair-wise Pearson correlation coefficient between the logarithms of the normalized to the median net fluorescences of the two genes over the biological replicas of that region.
- 4.
- Relative Control Strength (RCS)
- 5.
- Relative Expression Control (REC)
Positive REC’s indicate stricter expression control while negative values indicate looser control with respect to that of the median gene in the profiled region.
- 6.
- Gene Commanding Height (GCH)
- 7.
- Significant regulation of the individual genes’ expression levels
∀i & ∀cancer = A,B,C, gene “i" is significantly regulated in nodule “cancer” with respect to the normal tissue if:
Where:
- 8.
- Fold-change (FC) of the Relative Control Strength:
References
- Carpenter, S.; O'Neill, LAJ. From periphery to center stage: 50 years of advancements in innate immunity. Cell.; 187(9):2030-2051. [CrossRef]
- Janeway, C.A. Jr. Pillars article: approaching the asymptote? Evolution and revolution in immunology. Cold spring harb symp quant biol. 1989. 54: 1-13. J Immunol. 2013; 191(9):4475-87. PMID: 24141854.
- Matzinger, P. Tolerance, danger, and the extended family. Annu Rev Immunol. 1994; 12:991-1045. [CrossRef] [PubMed]
- Medzhitov, R.; Iwasaki, A. Exploring new perspectives in immunology. Cell. 2024; 187(9):2079-2094. [CrossRef]
- De Nunzio, C.; Lombardo, R. Best of 2022 in prostate cancer and prostatic diseases. Prostate Cancer Prostatic Dis. 2023; 26(1):5-7. [CrossRef]
- Liang, H.; Zhang, L.; Liu, Z.; Hoden, B.; DeRubeis, D.; Zhang, Y.; Wang, F.; Zhang, D. Upregulation of TLR5 indicates a favorable prognosis in prostate cancer. Prostate. 2023; 83(11):1035-1045. [CrossRef]
- Iacobas, S.; Iacobas, D.A. A Personalized Genomics Approach of the Prostate Cancer. Cells 2021, 10, 1644. [CrossRef]
- Iacobas, S.; Iacobas, D.A. Personalized 3-Gene Panel for Prostate Cancer Target Therapy. Curr. Issues Mol. Biol. 2022, 44, 360-382. [CrossRef]
- Gambara, G.; De Cesaris, P.; De Nunzio, C.; Ziparo, E.; Tubaro, A.; Filippini, A.; Riccioli, A. Toll-like receptors in prostate infection and cancer between bench and bedside. J Cell Mol Med. 2013; 17(6):713-22. [CrossRef]
- Park, S.; Kim, G.; Choi, A.; Kim, S.; Yum, J.S.; Chun, E.; Shin, H. Comparative network-based analysis of toll-like receptor agonist, L-pampo signaling pathways in immune and cancer cells. Sci Rep. 2024; 14(1):17173. [CrossRef]
- Gene Commanding Height (GCH) Hierarchy in the Cancer Nucleus and Cancer-Free Resection Margins from a Surgically Removed Prostatic Adenocarcinoma of a 65y Old Black Man. [(accessed on 1 May, 2024)]; Available online: https://www.ncbi.nlm.nih.gov/geo/query/acc.cgi?&acc=GSE133906.
- Genomic Fabric Remodeling in Prostate Cancer. [(accessed on 1 May, 2024)]; Available online: https://www.ncbi.nlm.nih.gov/geo/query/acc.cgi?acc=GSE168718.
- Transcriptomic Heterogeneity of the Prostate Cancer. [(accessed on 1 May, 2024)]; Available online: https://www.ncbi.nlm.nih.gov/geo/query/acc.cgi?acc=GSE183889.
- Agilent-026652 Whole Human Genome Microarray 4x44K v2. (accessed on 1 May, 2024). Available on line at: https://www.ncbi.nlm.nih.gov/geo/query/acc.cgi?acc=GPL10332.
- Iacobas, D.A.; Obiomon, E.A.; Iacobas, S. Genomic Fabrics of the Excretory System’s Functional Pathways Remodeled in Clear Cell Renal Cell Carcinoma. Curr. Issues Mol. Biol. 2023, 45, 9471-9499. [CrossRef]
- KEGG: Kyoto Encyclopedia of Genes and Genomes. Available online at: www.kegg.jp. Accessed 05/22/2024.
- Toll-like receptor pathway [(accessed on 1 May, 2024)]; Available online at: https://www.genome.jp/pathway/hsa04620. (Accessed on July 21, 2024).
- Chemokine signaling pathway - Homo sapiens (human). Available online at: https://www.genome.jp/pathway/hsa04062. (Accessed on July 21, 2024).
- Cheng, C.; Song, D.; Wu, Y.; Liu, B. RAC3 Promotes Proliferation, Migration and Invasion via PYCR1/JAK/STAT Signaling in Bladder Cancer. Front Mol Biosci 2020, 7, 218. [CrossRef]
- Iacobas DA. Powerful Quantifiers for Cancer Transcriptomics. World J Clinical Oncology 2020, 11(9):679-704. https://www.wjgnet.com/2218-4333/full/v11/i9/679.htm.
- Prostate cancer. Available on line at: https://www.genome.jp/pathway/hsa05215. Accessed on: 11/02/2024.
- Horoszewicz, J.S.; Leong, S.S.; Kawinski, E.; Karr, J.P.; Rosenthal, H.; Chu, T.M.; Mirand, E.A.; Murphy, G.P. LNCaP model of human prostatic carcinoma. Cancer Res. 1983, 43, 1809–1818.
- Remodeling of DNA Transcription Genomic Fabric in Capridine-Treated LNCaP Human Prostate Cancer Cell Line. Available online: https://www.ncbi.nlm.nih.gov/geo/query/acc.cgi?acc=GSE72414 (accessed on 11/01/2024.
- Alimirah, F.; Chen, J.; Basrawala, Z.; Xin, H.; Choubey, D. DU-145 and PC-3 human prostate cancer cell lines express androgen receptor: Implications for the androgen receptor functions and regulation. FEBS Lett. 2006, 580, 2294–2300.
- Remodeling of Major Genomic Fabrics and Their Interplay in Capridine-Treated DU145 Classic Human Prostate Cancer. Available online at: https://www.ncbi.nlm.nih.gov/geo/query/acc.cgi?acc=GSE72333 (accessed on 1/01/2024).
- Iacobas, D.A.; Mgbemena, V.; Iacobas, S.; Menezes, K.M.; Wang, H.; Saganti, P.B. Genomic fabric remodeling in metastatic clear cell renal cell carcinoma (ccRCC): A new paradigm and proposal for a personalized gene therapy approach. Cancers 2020, 12, 3678. [CrossRef]
- Zhong, M.; Clarke, S.; Vo, B.T.; Khan, S.A. The essential role of Giα2 in prostate cancer cell migration. Mol Cancer Res. 2012; 10(10):1380-8. [CrossRef]
- Raymond, J.R. Jr.; Appleton, K.M.; Pierce, J.Y.; Peterson, Y.K. Suppression of GNAI2 message in ovarian cancer. J Ovarian Res. 2014; 7:6. [CrossRef]
- Sena, L.A.; Salles, D.C.; Engle, E.L.; Zhu, Q.; Tukachinsky, H.; Lotan, T.L, Antonarakis ES. Mismatch repair-deficient prostate cancer with parenchymal brain metastases treated with immune checkpoint blockade. Cold Spring Harb Mol Case Stud. 2021; 7(4):a006094. [CrossRef]
- Schwarze, S.R.; Luo, J.; Isaacs, W.B.; Jarrard, D.F. Modulation of CXCL14 (BRAK) expression in prostate cancer. Prostate 2005, 64, 67-74. [CrossRef]
- Zhao, Y.; Chen, W.; Zhu, W.; Meng, H.; Chen, J.; Zhang, J. Overexpression of Interferon Regulatory Factor 7 (IRF7) Reduces Bone Metastasis of Prostate Cancer Cells in Mice. Oncol Res. 2017; 25(4):511-522. [CrossRef]
- Qi, F.; Gao, N.; Li, J.; Zhou, C.; Jiang, J.; Zhou, B.; Guo, L.; Feng, X.; Ji, J.; Cai, Q. et al. A multidimensional recommendation framework for identifying biological targets to aid the diagnosis and treatment of liver metastasis in patients with colorectal cancer. Mol Cancer. 2024; 23(1):239. [CrossRef]
- Mohite, P.; Lokwani, D.K.; Sakle, N.S. Exploring the therapeutic potential of SGLT2 inhibitors in cancer treatment: integrating in silico and in vitro investigations. Naunyn Schmiedebergs Arch Pharmacol. 2024; 397(8):6107-6119. [CrossRef]
- Mauri, G.; Chiodoni, C.; Parenza, M.; Arioli, I.; Tripodo, C.; Colombo, M.P. Ultrasound-guided intra-tumor injection of combined immunotherapy cures mice from orthotopic prostate cancer. Cancer Immunol Immunother. 2013; 62(12):1811-9. [CrossRef]
- Chakraborty, P.K.; Zhang, Y.; Coomes, A.S.; Kim, W.J.; Stupay, R.; Lynch, L.D.; Atkinson, T.; Kim, J.I.; Nie, Z.; Daaka, Y. G protein-coupled receptor kinase GRK5 phosphorylates moesin and regulates metastasis in prostate cancer. Cancer Res 2014, 74, 3489-3500. [CrossRef]
- Hongo, H.; Kosaka, T.; Takayama, K.I.; Baba, Y.; Yasumizu, Y.; Ueda, K.; Suzuki, Y.; Inoue, S.; Beltran, H.; Oya, M. G-protein signaling of oxytocin receptor as a potential target for cabazitaxel-resistant prostate cancer. PNAS Nexus 2024, 3, pgae002. [CrossRef]
- Nickols, N.G.; Nazarian, R.; Zhao, S.G.; Tan, V.; Uzunangelov, V.; Xia, Z.; Baertsch, R.; Neeman, E.; Gao, A.C.; Thomas, G.V.; et al. MEK-ERK signaling is a therapeutic target in metastatic castration resistant prostate cancer. Prostate Cancer Prostatic Dis 2019, 22, 531-538. [CrossRef]
- Liu, H.; Yin, J.; Wang, H.; Jiang, G.; Deng, M.; Zhang, G.; Bu, X.; Cai, S.; Du, J.; He, Z. FOXO3a modulates WNT/beta-catenin signaling and suppresses epithelial-to-mesenchymal transition in prostate cancer cells. Cell Signal 2015, 27, 510-518. [CrossRef]
- Huang, R.; Guo, L.; Gao, M.; Li, J.; Xiang, S. Research Trends and Regulation of CCL5 in Prostate Cancer. Onco Targets Ther 2021, 14, 1417-1427. [CrossRef]
- Aldinucci, D.; Borghese, C.; Casagrande, N. The CCL5/CCR5 Axis in Cancer Progression. Cancers (Basel) 2020, 12. [CrossRef]
- Vindrieux, D.; Escobar, P.; Lazennec, G. Emerging roles of chemokines in prostate cancer. Endocr Relat Cancer 2009, 16, 663-673. [CrossRef]
- Maeda, S.; Motegi, T.; Iio, A.; Kaji, K.; Goto-Koshino, Y.; Eto, S.; Ikeda, N.; Nakagawa, T.; Nishimura, R.; Yonezawa, T.; et al. Anti-CCR4 treatment depletes regulatory T cells and leads to clinical activity in a canine model of advanced prostate cancer. J Immunother Cancer 2022, 10. [CrossRef]
- Rogers, E.N.; Jones, D.Z.; Kidd, N.C.; Yeyeodu, S.; Brock, G.; Ragin, C.; Jackson, M.; McFarlane-Anderson, N.; Tulloch-Reid, M.; Sean Kimbro, K.; et al. Toll-like receptor-associated sequence variants and prostate cancer risk among men of African descent. Genes Immun 2013, 14, 347-355. [CrossRef]
- Mulholland, D.J.; Kobayashi, N.; Ruscetti, M.; Zhi, A.; Tran, L.M.; Huang, J.; Gleave, M.; Wu, H. Pten loss and RAS/MAPK activation cooperate to promote EMT and metastasis initiated from prostate cancer stem/progenitor cells. Cancer Res 2012, 72, 1878-1889. [CrossRef]
- Ide, H.; Nakagawa, T.; Terado, Y.; Kamiyama, Y.; Muto, S.; Horie, S. Tyk2 expression and its signaling enhances the invasiveness of prostate cancer cells. Biochem Biophys Res Commun 2008, 369, 292-296. [CrossRef]
- Lu, Z.; Wu, C.; Zhu, M.; Song, W.; Wang, H.; Wang, J.; Guo, J.; Li, N.; Liu, J.; Li, Y.; et al. Ophiopogonin D' induces RIPK1-dependent necroptosis in androgen-dependent LNCaP prostate cancer cells. Int J Oncol 2020, 56, 439-447. [CrossRef]
- Vuk-Pavlovic, S.; Bulur, P.A.; Lin, Y.; Qin, R.; Szumlanski, C.L.; Zhao, X.; Dietz, A.B. Immunosuppressive CD14+HLA-DRlow/- monocytes in prostate cancer. Prostate 2010, 70, 443-455. [CrossRef]
- Deveci Ozkan, A.; Kaleli, S.; Onen, H.I.; Sarihan, M.; Guney Eskiler, G.; Kalayci Yigin, A.; Akdogan, M. Anti-inflammatory effects of nobiletin on TLR4/TRIF/IRF3 and TLR9/IRF7 signaling pathways in prostate cancer cells. Immunopharmacol Immunotoxicol. 2020; 42(2):93-100. [CrossRef]
- Takahashi, I.; Takagi, K.; Yamaguchi-Tanaka, M.; Sato, A.; Sato, M.; Miki, Y.; Ito, A.; Suzuki, T. Toll-like receptor (TLR) 4 is a potent prognostic factor in prostate cancer associated with proliferation and invasion. Pathol Res Pract. 2024; 260:155379. [CrossRef]
- Tolkach, Y.; Kristiansen, G. The Heterogeneity of Prostate Cancer: A Practical Approach. Pathobiology 2018, 85, 108–116. [CrossRef]
- Berglund, E.; Maaskola, J.; Schultz, N.; Friedrich, S.; Marklund, M.; Bergenstråhle, J.; Tarish, F.; Tanoglidi, A.; Vickovic, S.; Larsson, L.; et al. Spatial maps of prostate cancer transcriptomes reveal an unexplored landscape of heterogeneity. Nat. Commun. 2018, 9, 2419. [CrossRef]
- Brady, L.; Kriner, M.; Coleman, I.; Morrissey, C.; Roudier, M.; True, L.D.; Gulati, R.; Plymate, S.R.; Zhou, Z.; Birditt, B.; et al. Inter- and intra-tumor heterogeneity of metastatic prostate cancer determined by digital spatial gene expression profiling. Nat. Commun. 2021, 12, 1426. [CrossRef]
- Kulac, I.; Roudier, M.P.; Haffner, M.C. Molecular Pathology of Prostate Cancer. Surg. Pathol. Clin. 2021, 14, 387–401.
- Tu, S.-M.; Zhang, M.; Wood, C.G.; Pisters, L.L. Stem Cell Theory of Cancer: Origin of Tumor Heterogeneity and Plasticity. Cancers 2021, 13, 4006. [CrossRef]
- MAPK signaling pathway. Available online at: https://www.genome.jp/pathway/hsa04010. Accessed on 11/12/2024.
- Huang, R.H.; Zeng, Q.M.; Jiang, B.; Xu, G.; Xiao, G.C.; Xia, W.; Liao, Y.F.; Wu, Y.T.; Zou, J.R.; Qian, B. et al. Overexpression of DUSP26 gene suppressed the proliferation, migration, and invasion of human prostate cancer cells. Exp Cell Res. 2024; 442(2):114231. [CrossRef]
- Iacobas, D.A.; Iacobas, S.; Lee, P.R.; Cohen, J.E.; Fields, R.D. Coordinated Activity of Transcriptional Networks Responding to the Pattern of Action Potential Firing in Neurons. Genes 2019, 10, 754. [CrossRef]
- Basic Laws of Chemistry–Theories–Principles. Available online: https://azchemistry.com/basic-laws-of-chemistry. Accessed on 10/11/2024.
- Wang, J.; Ouyang, X.; Zhu, W.; Yi, Q.; Zhong, J. The Role of CXCL11 and its Receptors in Cancer: Prospective but Challenging Clinical Targets. Cancer Control 2024, 10732748241241162. [CrossRef]
- Ullah, A.; Jiao, W.; Shen, B. The role of proinflammatory cytokines and CXC chemokines (CXCL1-CXCL16) in the progression of prostate cancer: insights on their therapeutic management. Cell Mol Biol Lett 2024, 29, 73. [CrossRef]
- Zhao, S.; Zhang, Y.; Zhang, Q.; Wang, F.; Zhang, D. Toll-like receptors and prostate cancer. Front Immunol 2014, 5, 352. [CrossRef]
- Michalaki, V.; Syrigos, K.; Charles, P.; Waxman, J. Serum levels of IL-6 and TNF-alpha correlate with clinicopathological features and patient survival in patients with prostate cancer. Br J Cancer 2004, 90, 2312-2316. [CrossRef]
- Bak, S.P.; Barnkob, M.S.; Bai, A.; Higham, E.M.; Wittrup, K.D.; Chen, J. Differential requirement for CD70 and CD80/CD86 in dendritic cell-mediated activation of tumor-tolerized CD8 T cells. J Immunol 2012, 189, 1708-1716. [CrossRef]
- Chen, S.; Deng, B.; Zhao, F.; You, H.; Liu, Y.; Xie, L.; Song, G.; Zhou, Z.; Huang, G.; Shen, W. Silencing SPP1 in M2 macrophages inhibits the progression of castration-resistant prostate cancer via the MMP9/TGFbeta1 axis. Transl Androl Urol 2024, 13, 1239-1255. [CrossRef]
- Messex, J.K.; Byrd, C.J.; Thomas, M.U.; Liou, G.Y. Macrophages Cytokine Spp1 Increases Growth of Prostate Intraepithelial Neoplasia to Promote Prostate Tumor Progression. Int J Mol Sci 2022, 23. [CrossRef]
- Krämer, A.; Green, J.; Pollard, J, Jr.; Tugendreich, S. Causal analysis approaches in Ingenuity Pathway Analysis. Bioinformatics. 2014; 30(4):523-30. [CrossRef]
- KEGG-designed functional pathways of the excretory system. Available online at: https://www.kegg.jp/pathway/hsa04960 / 04961 / 04962 / 04964 / 04964 / 04966. Accessed 11/10/2024.
- Iacobas, D.A.; Iacobas, S. Papillary Thyroid Cancer Remodels the Genetic Information Processing Pathways. Genes 2024, 15, 621. [CrossRef]
- Iacobas, D.A. Biomarkers, Master Regulators and Genomic Fabric Remodeling in a Case of Papillary Thyroid Carcinoma. Genes 2020, 11, 1030. [CrossRef]
- Iacobas, D.A.; Tuli, N.Y.; Iacobas, S.; Rasamny, J.K.; Moscatello, A.; Geliebter, J.; Tiwari, R.K. Gene master regulators of papillary and anaplastic thyroid cancers. Oncotarget. 2017; 9(2):2410-2424. [CrossRef]
- Iacobas, S.; Ede, N.; Iacobas, D.A. The Gene Master Regulators (GMR) Approach Provides Legitimate Targets for Personalized, Time-Sensitive Cancer Gene Therapy. Genes 2019, 10, 560. [CrossRef]
- Cui, K.; Song, N.; Fan, Y.; Zeng, L.; Shi, P.; Wang, Z.; Su, W.; Wang, H. A two-sample Mendelian randomization analysis: causal association between chemokines and pan-carcinoma. Front Genet. 2023; 14:1285274. [CrossRef]
- Batson, J.; Maccarthy-Morrogh, L.; Archer, A.; Tanton, H.; Nobes, C.D. EphA receptors regulate prostate cancer cell dissemination through Vav2-RhoA mediated cell-cell repulsion. Biol Open. 2014; 3(6):453-62. [CrossRef]
- Batson, J.; Astin, J.W.; Nobes, C.D. Regulation of contact inhibition of locomotion by Eph-ephrin signalling. J. Microsc. 2013; 251, 232–241 10.1111/jmi.12024.
- Wang, C.; Jiang, X.; Zhao, Q.; Xie, Z.; Cai, H. The diagnostic or prognostic values of FADD in cancers based on pan-cancer analysis. Biomed Rep. 2023; 19(5):77. [CrossRef]
- Zhang, Z.; Zhang, F.; Xie, W.; Niu, Y.; Wang, H.; Li, G.; Zhao, L.; Wang, X.; Xie, W. Induced Necroptosis and Its Role in Cancer Immunotherapy. Int. J. Mol. Sci. 2024, 25, 10760. [CrossRef]
- McCann, C.; Crawford, N.; Majkut, J.; Holohan, C.; Armstrong, C.W.D.; Maxwell, P.J.; Ong, C.W.; LaBonte, M.J.; McDade, S.S.; Waugh, D.J. et al. Cytoplasmic FLIP(S) and nuclear FLIP(L) mediate resistance of castrate-resistant prostate cancer to apoptosis induced by IAP antagonists. Cell Death Dis. 2018; 9(11):1081. [CrossRef]
- Ahmed, M.; Lai, T.H.; Zada, S.; Hwang, J.S.; Pham, T.M.; Yun, M.; Kim, D.R. Functional Linkage of RKIP to the Epithelial to Mesenchymal Transition and Autophagy during the Development of Prostate Cancer. Cancers 2018, 10, 273. [CrossRef]
- Sabater, A.; Sanchis, P.; Seniuk, R.; Pascual, G.; Anselmino, N.; Alonso, D.F.; Cayol, F.; Vazquez, E.; Marti, M.; Cotignola, J.; et al. Unmasking Neuroendocrine Prostate Cancer with a Machine Learning-Driven Seven-Gene Stemness Signature That Predicts Progression. Int. J. Mol. Sci. 2024, 25, 11356. [CrossRef]
- Iacobas, D.A. Advanced Molecular Solutions for Cancer Therapy—The Good, the Bad, and the Ugly of the Biomarker Paradigm. Curr. Issues Mol. Biol. 2024, 46, 1694-1699. [CrossRef]
- Manceau, C.; Fromont, G.; Beauval, J.-B.; Barret, E.; Brureau, L.; Créhange, G.; Dariane, C.; Fiard, G.; Gauthé, M.; Mathieu, R.; et al. Biomarker in Active Surveillance for Prostate Cancer: A Systematic Review. Cancers 2021, 13, 4251. [CrossRef]
- Moghaddam, S.; Jalali, A.; O’Neill, A.; Murphy, L.; Gorman, L.; Reilly, A.-M.; Heffernan, Á.; Lynch, T.; Power, R.; O’Malley, K.J.; et al. Integrating Serum Biomarkers into Prediction Models for Biochemical Recurrence Following Radical Prostatectomy. Cancers 2021, 13, 4162. [CrossRef]
- Iacobas, D.A. The Genomic Fabric Perspective on the Transcriptome Between Universal Quantifiers and Personalized Genomic Medicine. Biol Theory 2016, 11, 123–137 (2016). [CrossRef]
- Tu, S.-M.; Trikannad, A.K.; Vellanki, S.; Hussain, M.; Malik, N.; Singh, S.R.; Jillella, A.; Obulareddy, S.; Malapati, S.; Bhatti, S.A.; et al. Stem Cell Origin of Cancer: Clinical Implications beyond Immunotherapy for Drug versus Therapy Development in Cancer Care. Cancers 2024, 16, 1151. [CrossRef]
- Tu, S.-M.; Chen, J.Z.; Singh, S.R.; Maraboyina, S.; Gokden, N.; Hsu, P.-C.; Langford, T. Stem Cell Theory of Cancer: Clinical Implications for Cellular Metabolism and Anti-Cancer Metabolomics. Cancers 2024, 16, 624. [CrossRef]
- Iacobas, D.A.; Iacobas, S. Towards a Personalized Cancer Gene Therapy: A Case of Clear Cell Renal Cell Carcinoma. Cancer & Oncol Res 2017; 5(3): 45-52. [CrossRef]
- Teleman, A.A. Role for Torsin in Lipid Metabolism. Dev Cell. 2016; 38(3):223-4. [CrossRef]
- Wu, L.H.; Wang, X.X.; Wang, Y.; Wei, J.; Liang, Z.R.; Yan, X.; Wang, J. Construction and validation of a prognosis signature based on the immune microenvironment in gastric cancer. Front Surg. 2023; 10:1088292. [CrossRef]
- Muthu, M.; Chun, S.; Gopal, J.; Park, G.-S.; Nile, A.; Shin, J.; Shin, J.; Kim, T.-H.; Oh, J.-W. The MUDENG Augmentation: A Genesis in Anti-Cancer Therapy? Int. J. Mol. Sci. 2020, 21, 5583. [CrossRef]
- Cui, X.; Shang, X.; Xie, J.; Xie, C.; Tang, Z.; Luo, Q.; Wu, C.; Wang, G.; Wang, N.; He, K. et al. Cooperation between IRTKS and deubiquitinase OTUD4 enhances the SETDB1-mediated H3K9 trimethylation that promotes tumor metastasis via suppressing E-cadherin expression. Cancer Lett. 2023; 575:216404. [CrossRef]
- de Almeida, F.N.; Vasciaveo, A.; Antao, A.M.; Zou, M.; Di Bernardo, M.; de Brot, S.; Rodriguez-Calero, A.; Chui, A.; Wang, A.L.E.; Floc'h, N. et al. A forward genetic screen identifies Sirtuin1 as a driver of neuroendocrine prostate cancer. bioRxiv [Preprint]. [CrossRef]
- German, B.; Alaiwi, S.A.; Ho, K.L.; Nanda, J.S.; Fonseca, M.A.; Burkhart, D.L.; Sheahan, A.V.; Bergom, H.E.; Morel, K.L.; Beltran, H. et al. MYBL2 Drives Prostate Cancer Plasticity: Inhibiting Its Transcriptional Target CDK2 for RB1-Deficient Neuroendocrine Prostate Cancer. Cancer Res Commun. 2024; 4(9):2295-2307. [CrossRef]
- Kim, M.; Tamukong, P.; Galvan, G.C.; Yang, Q.; De Hoedt, A.; Freeman, M.R.; You, S.; Freedland, S. Prostate cancers with distinct transcriptional programs in Black and White men. Genome Med. 2024; 16(1):92. [CrossRef]
- Moran, B.; Rahman, A.; Palonen, K.; Lanigan, F.T.; Gallagher, W.M. Master transcriptional regulators in cancer: discovery via reverse engineering approaches and subsequent validation. Cancer Res. 2017; 77:2186–90. [CrossRef]
- Sledziona, J.; Burikhanov, R.; Araujo, N.; Jiang, J.; Hebbar, N.; Rangnekar, V.M. The Tumor Suppressor Par-4 Regulates Adipogenesis by Transcriptional Repression of PPARγ. Cells 2024, 13, 1495. [CrossRef]
- Zhou, Q.; Wu, F.; Chen, Y.; Fu, J.; Zhou, L.; Xu, Y.; He, F.; Gong, Z.; Yuan, F. Reynoutria multiflora (Thunb.) Moldenke and its ingredient suppress lethal prostate cancer growth by inducing CDC25B-CDK1 mediated cell cycle arrest. Bioorg Chem. 2024; 152:107731. [CrossRef]
Figure 1.
Significant expression regulation of the TLR-signaling pathway genes in the cancer nodules “A” (a), “B” (b), “C” (c) with respect to the normal surrounding tissue “N”. Regulated genes: AKT2/3 (v-akt murine thymoma viral oncogene homolog 2/3), CCL3 (chemokine (C-C motif) ligand 3), CD14 (CD14 molecule), CHUK (conserved helix-loop-helix ubiquitous kinase), CTSK (cathepsin K), CXCL9/10/11 (chemokine (C-X-C motif) ligand 9/10/11), IFNAR1 (interferon (alpha, beta and omega) receptor 1), IKBKG (inhibitor of kappa light polypeptide gene enhancer in B-cells, kinase gamma), IRAK1 (interleukin-1 receptor-associated kinase 1), IRF3/5/7/9 (interferon regulatory factor 3/5/7/9), JAK1 (Janus kinase 1), MAP2K1/2/3/4/6/7 (mitogen-activated protein kinase kinase 1/2/3/4/6/7), MAP3K7 (mitogen-activated protein kinase kinase kinase 7), MAPK9/10/11/13 (mitogen-activated protein kinase 9/10/11/13), MYD88 (myeloid differentiation primary response 88), NFKB1 (nuclear factor of kappa light polypeptide gene enhancer in B-cells 1), NFKBIA (nuclear factor of kappa light polypeptide gene enhancer in B-cells inhibitor, alpha), PIK3R1 (phosphoinositide-3-kinase, regulatory subunit 1 (alpha)), RAC1 (ras-related C3 botulinum toxin substrate 1 (rho family, small GTP binding protein Rac1)), SPP1 (secreted phosphoprotein 1), STAT1 (signal transducer and activator of transcription 1, 91kDa), TBK1 (TANK-binding kinase 1/2/3/4/5), TICAM1 (toll-like receptor adaptor molecule 1), TLR1/2/3/4/5 (toll-like receptor 1), TNF (tumor necrosis factor), TRAF6 (TNF receptor-associated factor 6, E3 ubiquitin protein ligase).
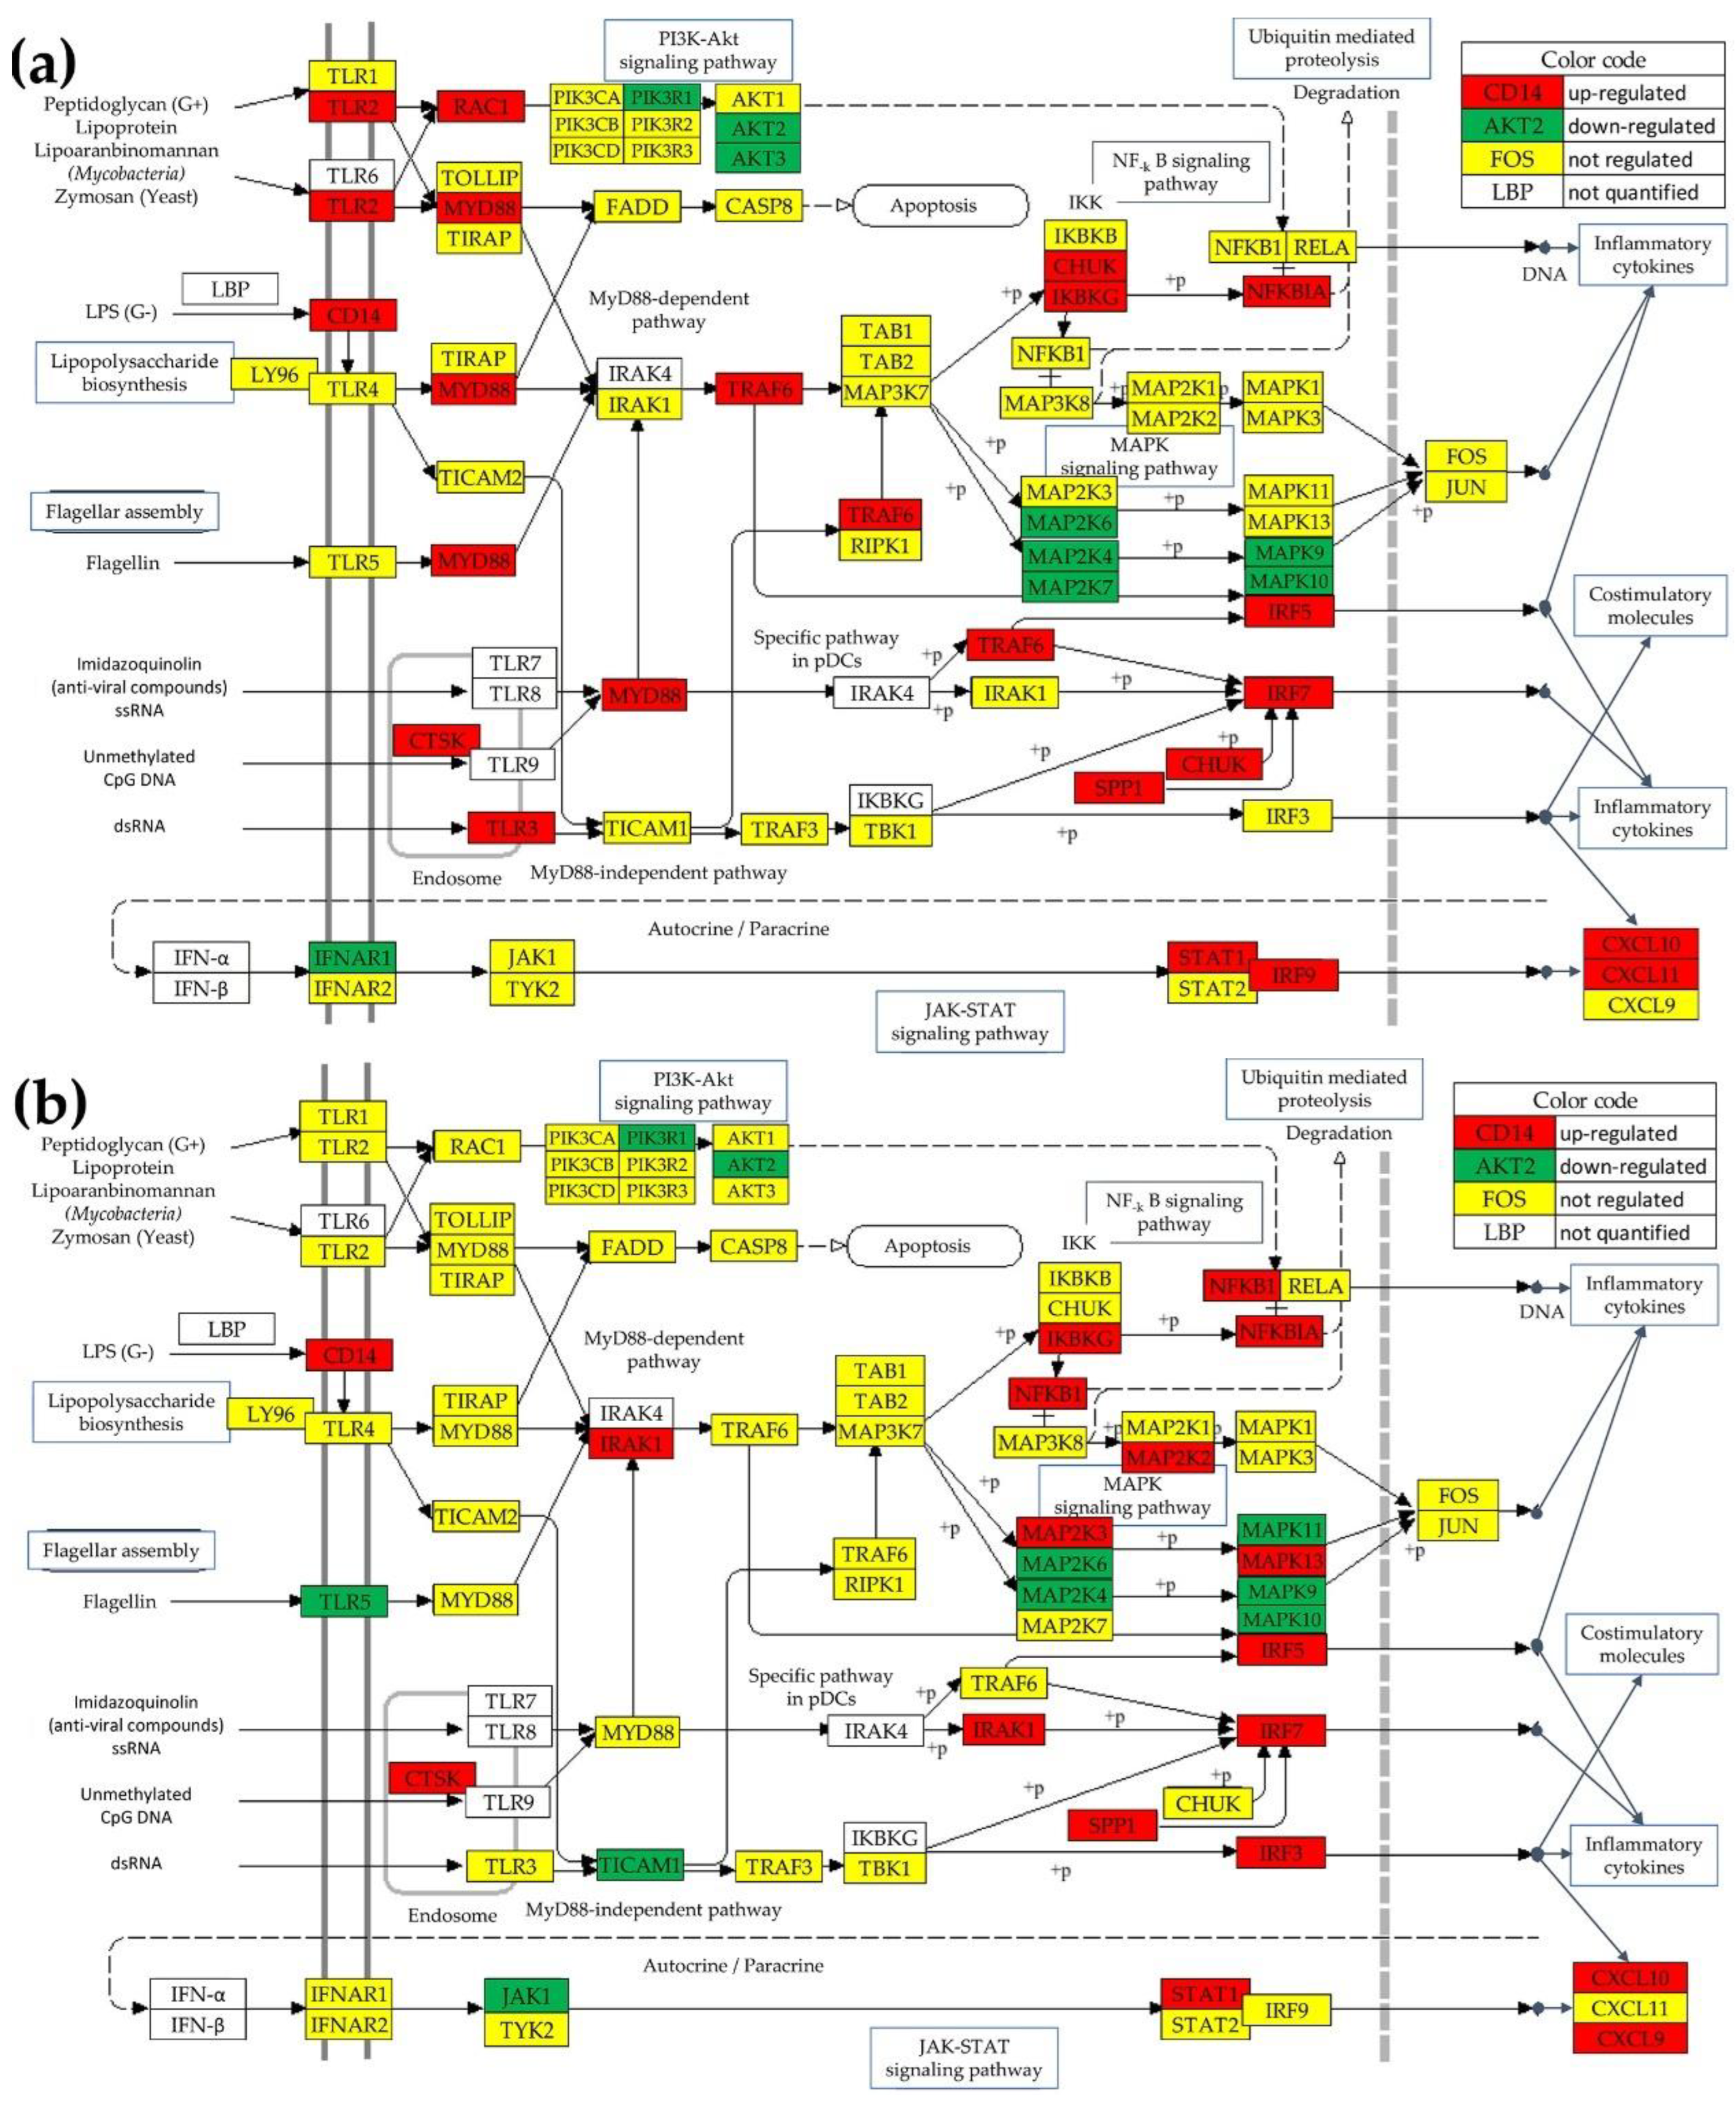
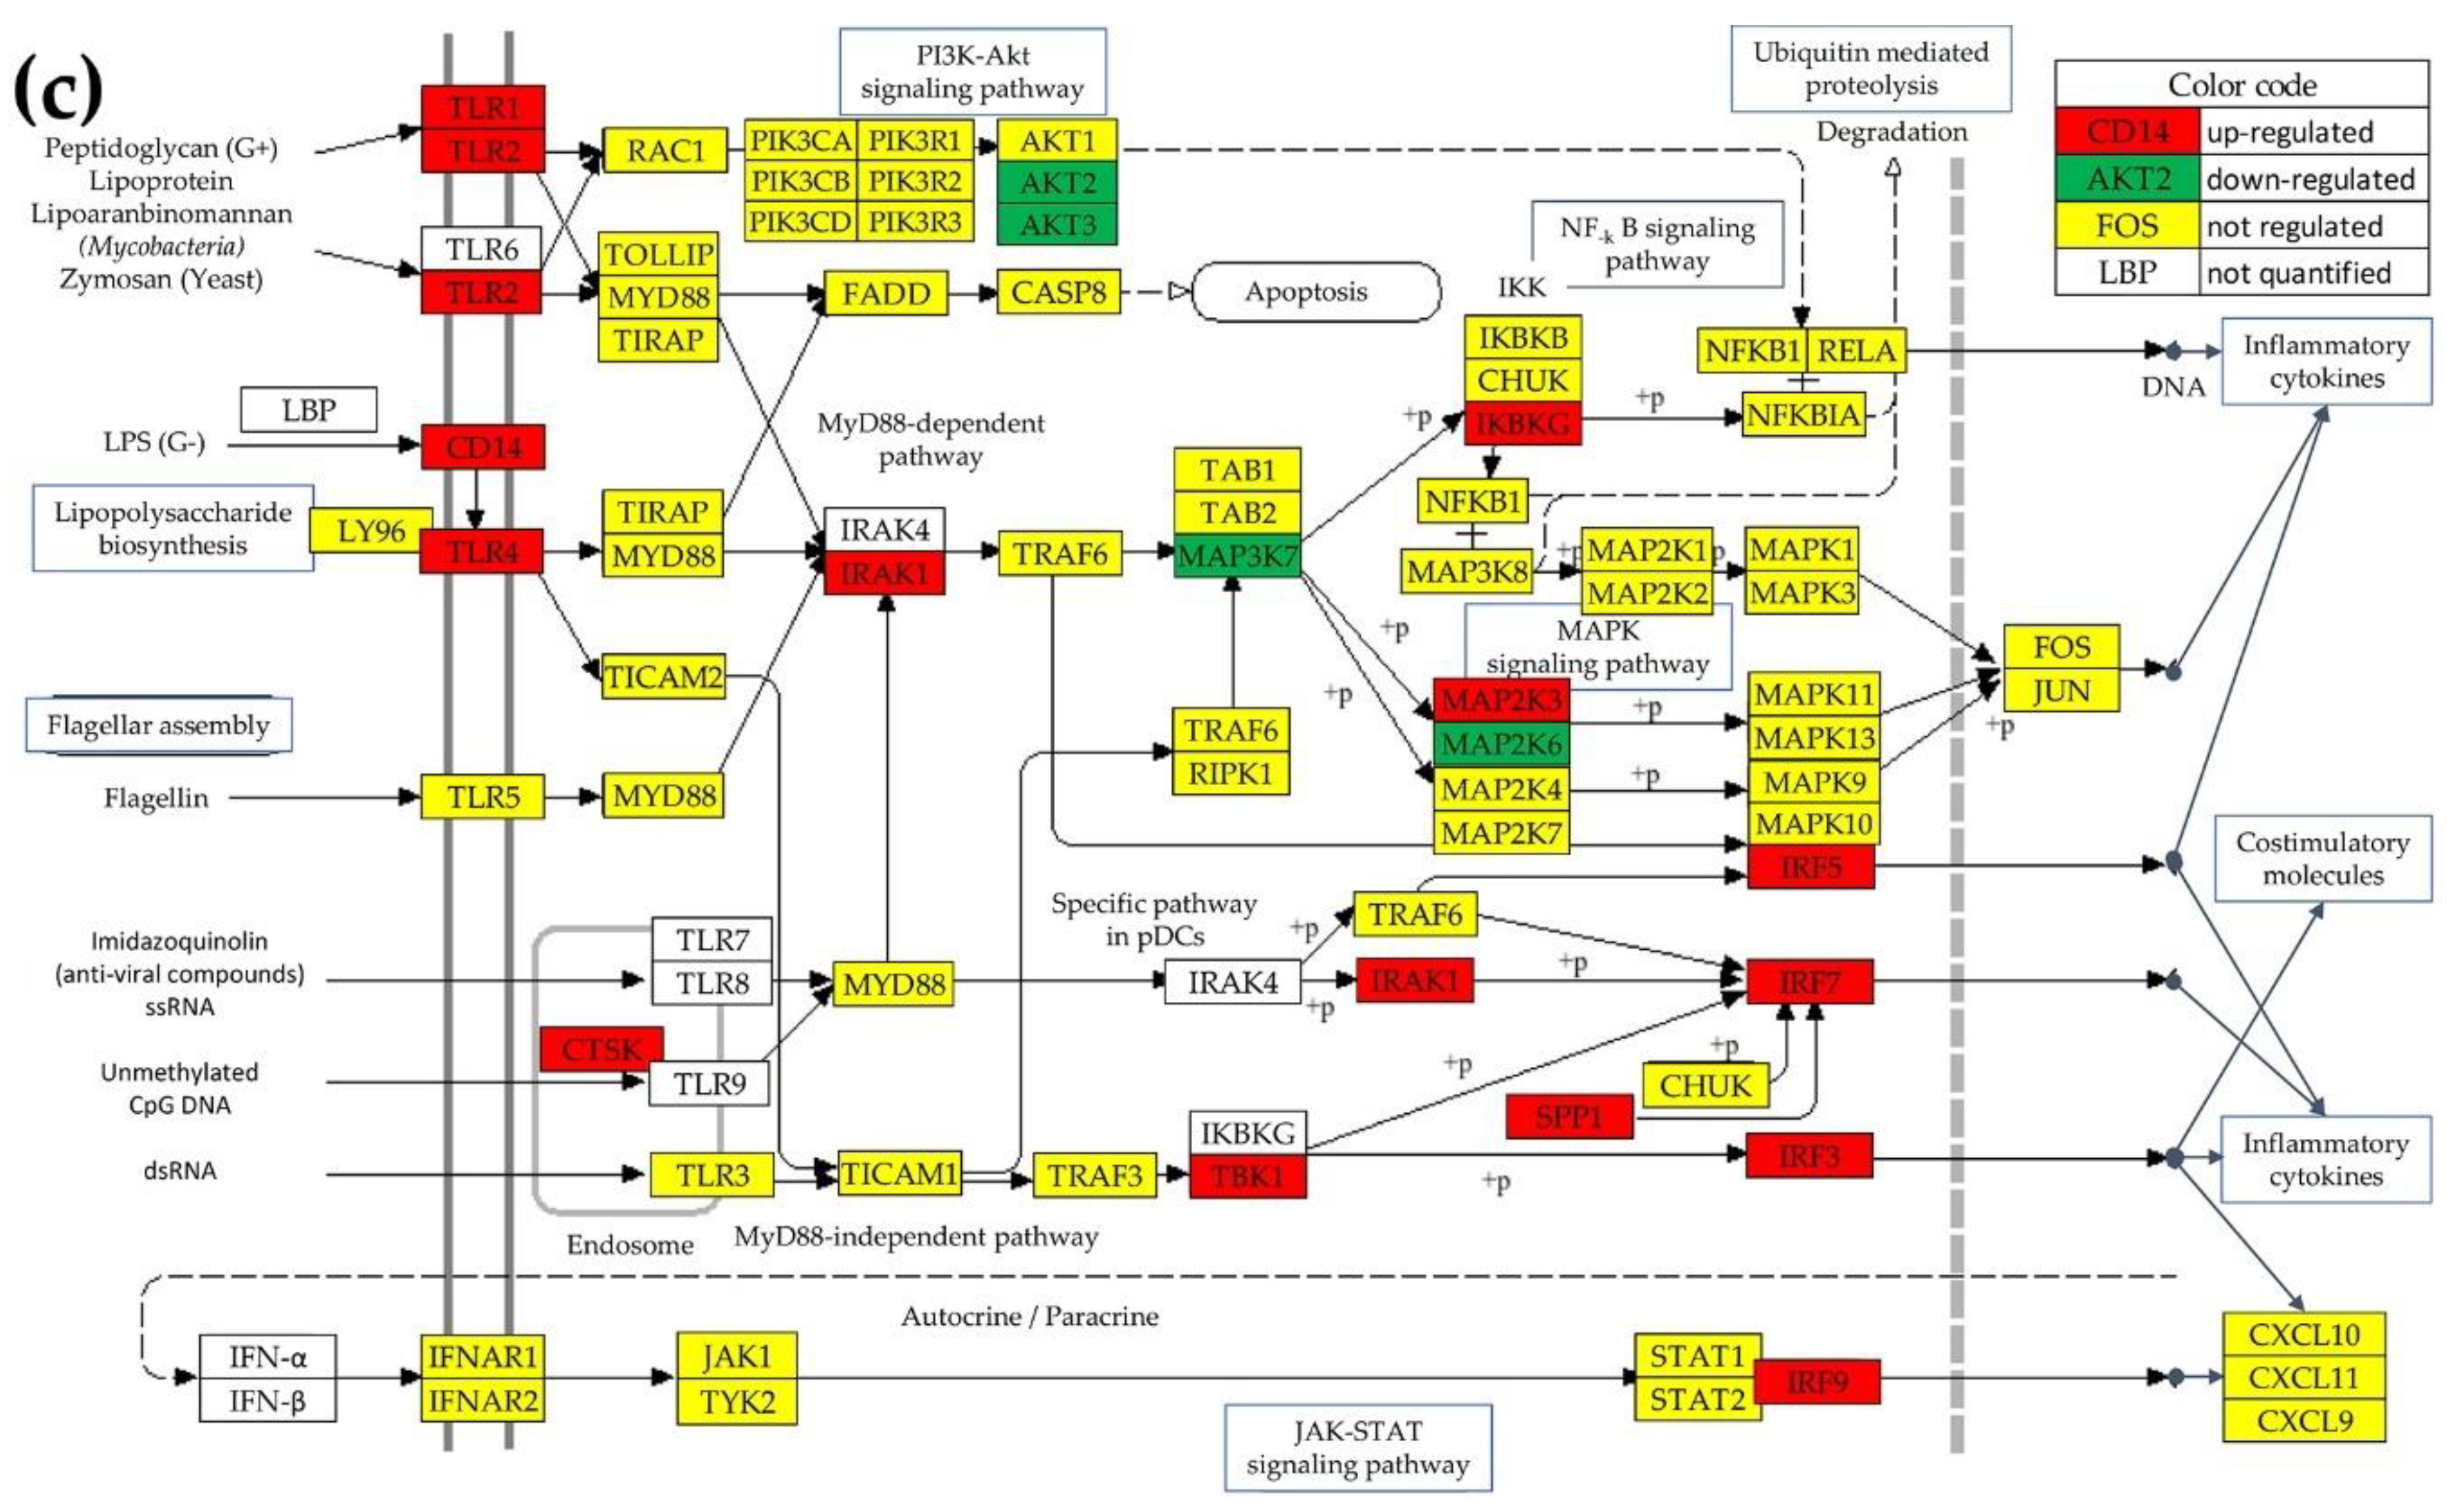
Figure 2.
Significant expression regulation of the chemokine signaling pathway genes in the cancer nodules “A” (a), “B” (b), “C” (c) with respect to the normal tissue “N”. Regulated genes: ADCY1/3/4/6 (adenylate cyclase 1/3/4/6), AKT2/3, ARBB1/2 (arrestin, beta 1/2), BCAR1 (BCAR1 scaffold protein, Cas family member), CCL14/15/16/18/2/3 (chemokine (C-C motif) ligand 3/14/15/16/18/2), CHUK, CXCL5/9/10/11/12/13/14/16, FOXO3 (forkhead box O3), GNAQ (guanine nucleotide binding protein (G protein), q polypeptide), GNB1/4 (guanine nucleotide binding protein (G protein), beta polypeptide 1/4), GNG4/5/7/8/10/12 (guanine nucleotide binding protein (G protein), gamma 4/5/7/8/10/12), GRK6 (G protein-coupled receptor kinase 6), GSK3B (glycogen synthase kinase 3 beta), HRAS (Harvey rat sarcoma viral oncogene homolog), IKBKG, JAK2/3 (Janus kinase 2/3), LYN (LYN proto-oncogene, Src family tyrosine kinase), MAP2K1, MAPK10, NFKB1, PAK1 (p21 protein (Cdc42/Rac)-activated kinase 1), PARD3 (par-3 family cell polarity regulator), PIK3CG (phosphatidylinositol-4,5-bisphosphate 3-kinase, catalytic subunit gamma), PIK3R1, PLCB1/2 (phospholipase C, beta 1/2), PLCG1/2 (phospholipase C, gamma 1/2), PREX1 (phosphatidylinositol-3,4,5-trisphosphate-dependent Rac exchange factor 1), PRKACA/B (protein kinase, cAMP-dependent, catalytic, alpha/beta), PRKCZ (protein kinase C, zeta), PTK2B (protein tyrosine kinase 2 beta), PXN (paxillin), RAC1/3, RAF1 (Raf-1 proto-oncogene, serine/threonine kinase), RAP1A/B (member of RAS oncogene family), RHOA (ras homolog family member A), SHC2 (SHC adaptor protein 2), SRC (SRC proto-oncogene, non-receptor tyrosine kinase), STAT1/5B, VAV1/2 (vav 1/2 guanine nucleotide exchange factor), XCL1 (chemokine (C motif) ligand 1), XCR1 (chemokine (C motif) receptor 1).
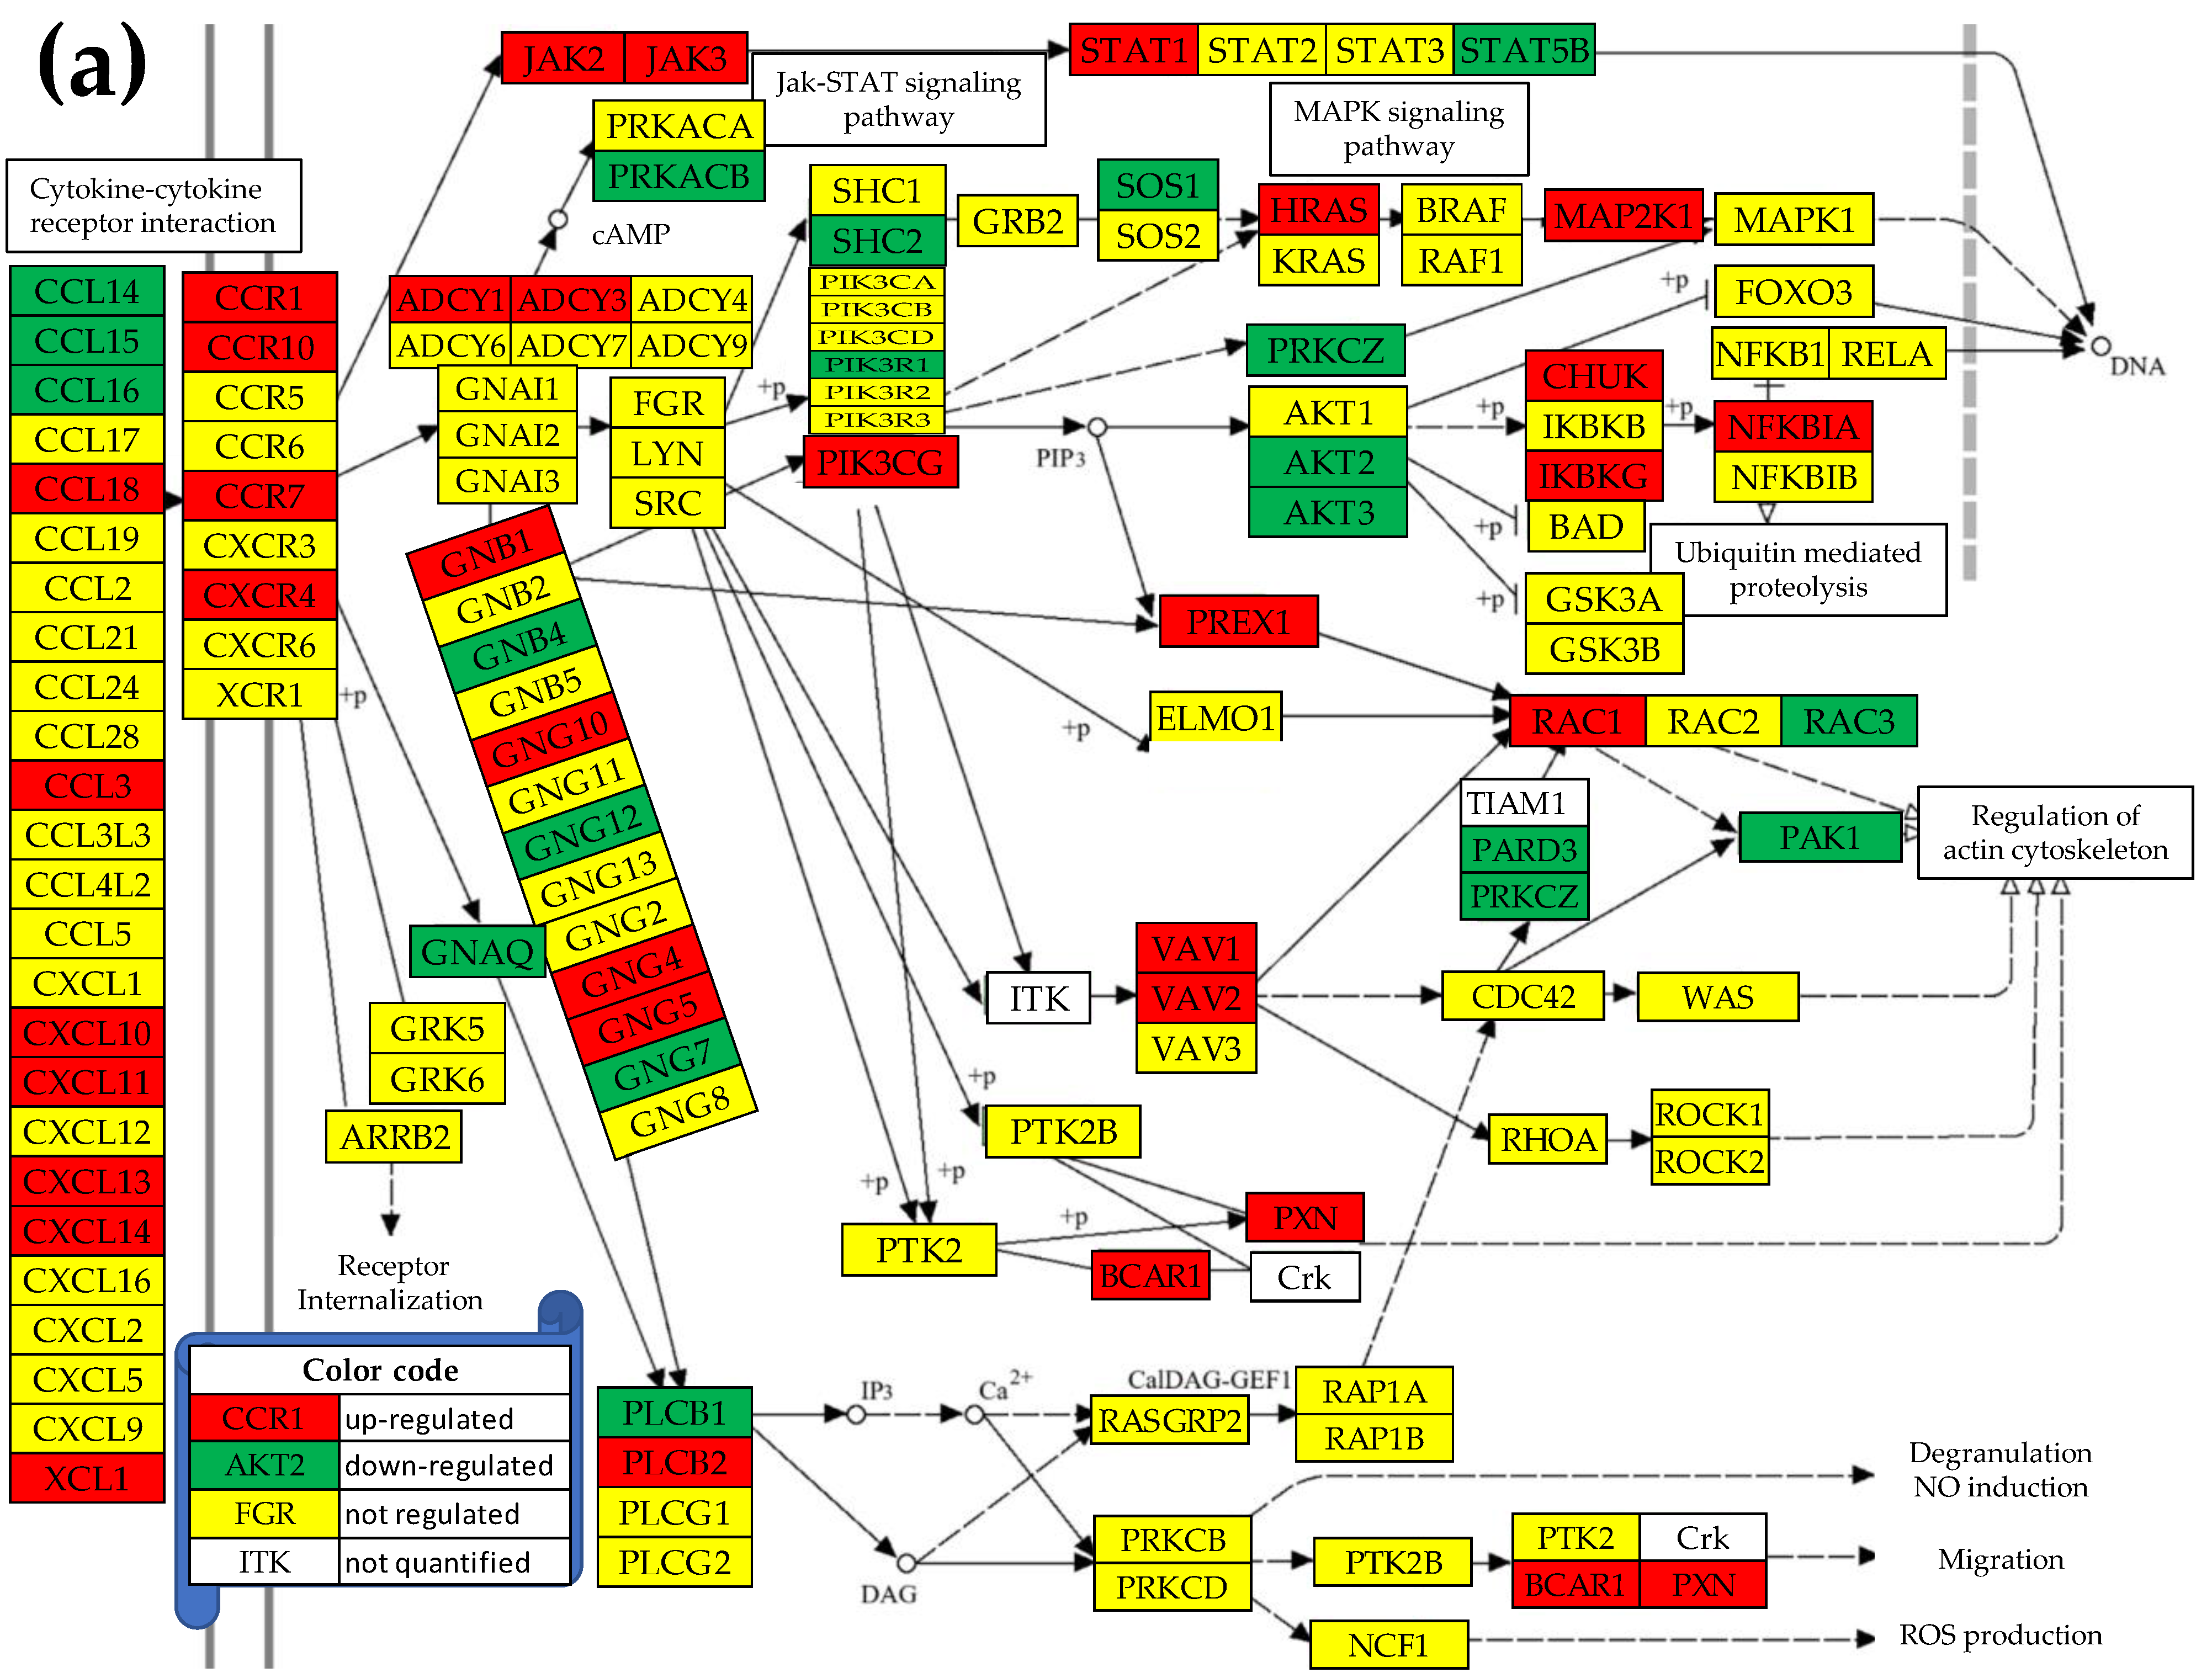
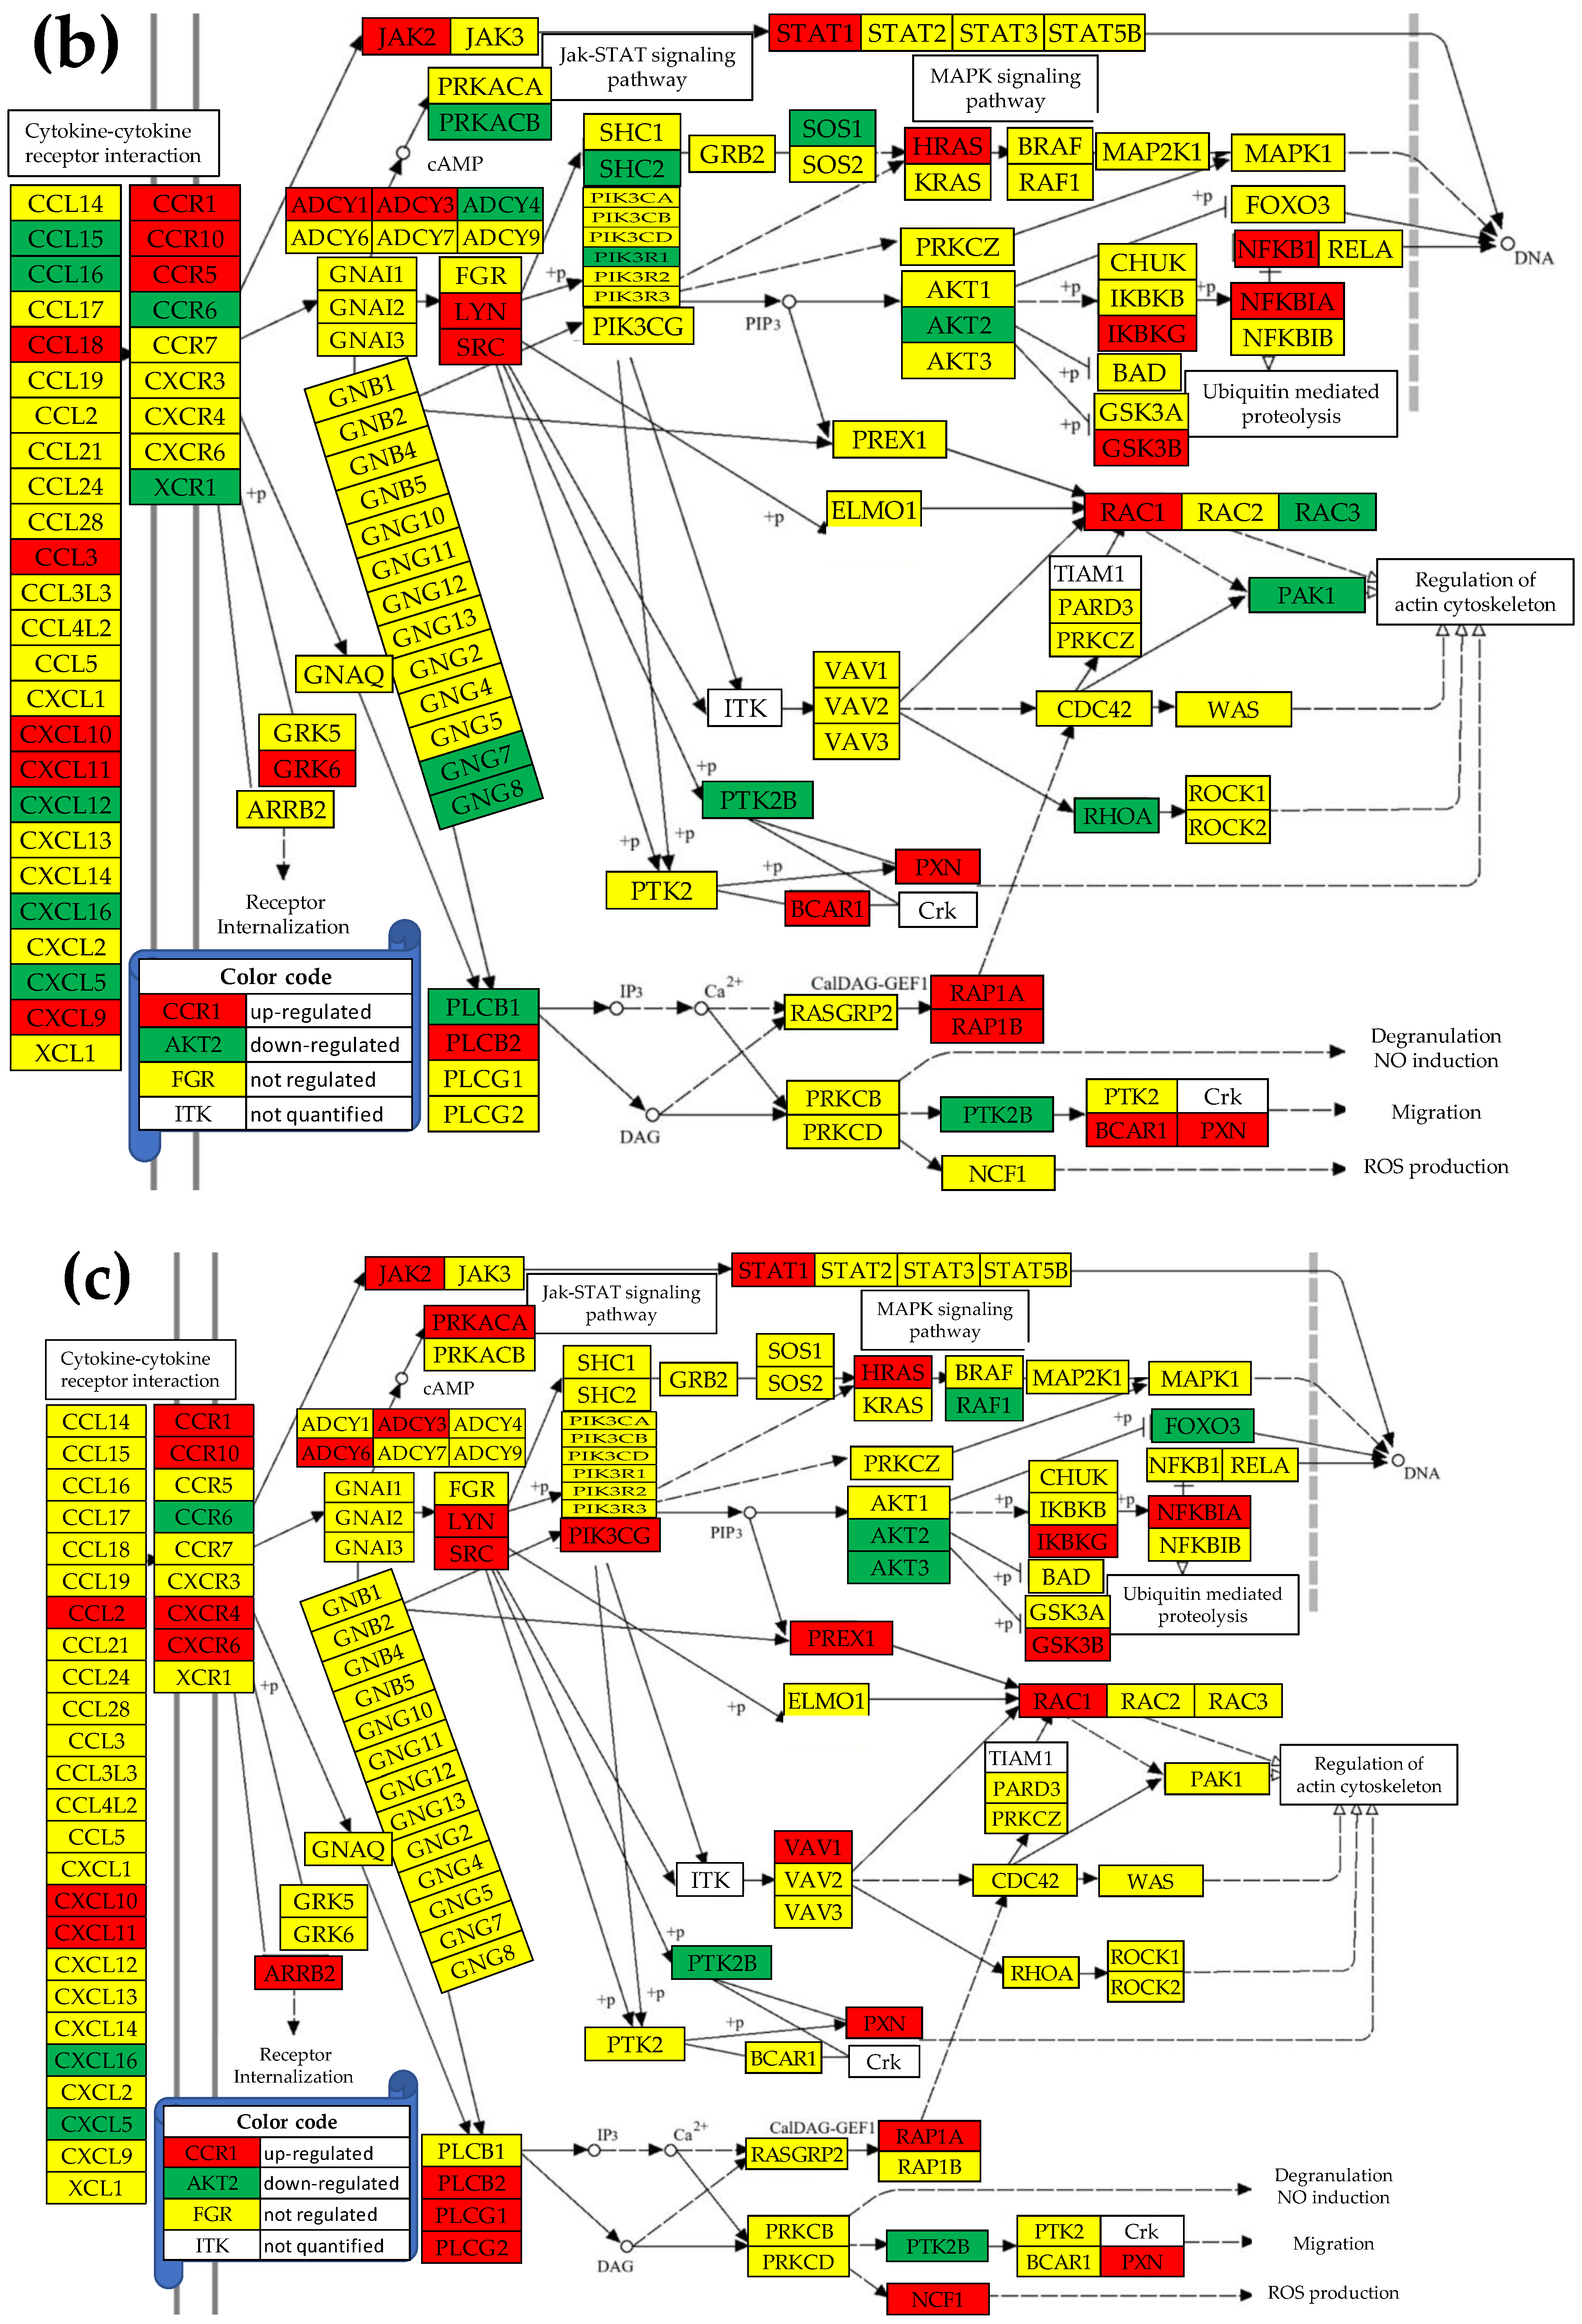
Figure 3.
Significant expression coordination of the TLR and CHS signaling pathway genes through the 28 genes shared by the two pathways in: (a) the normal prostate tissue “N”, (b) the cancer nodule “A”, (c) the cancer nodule “B”, and (d) the cancer nodule “C”. A red/blue line indicates that connected genes are (p < 0.05) statistically significantly synergistically/antagonistically expressed. A missing line between two genes means a lack of statistical significance in their expression coordination. The red/green/yellow background of the gene symbol indicates up-/down-/not significant expression regulation in that nodule with respect to the normal tissue.
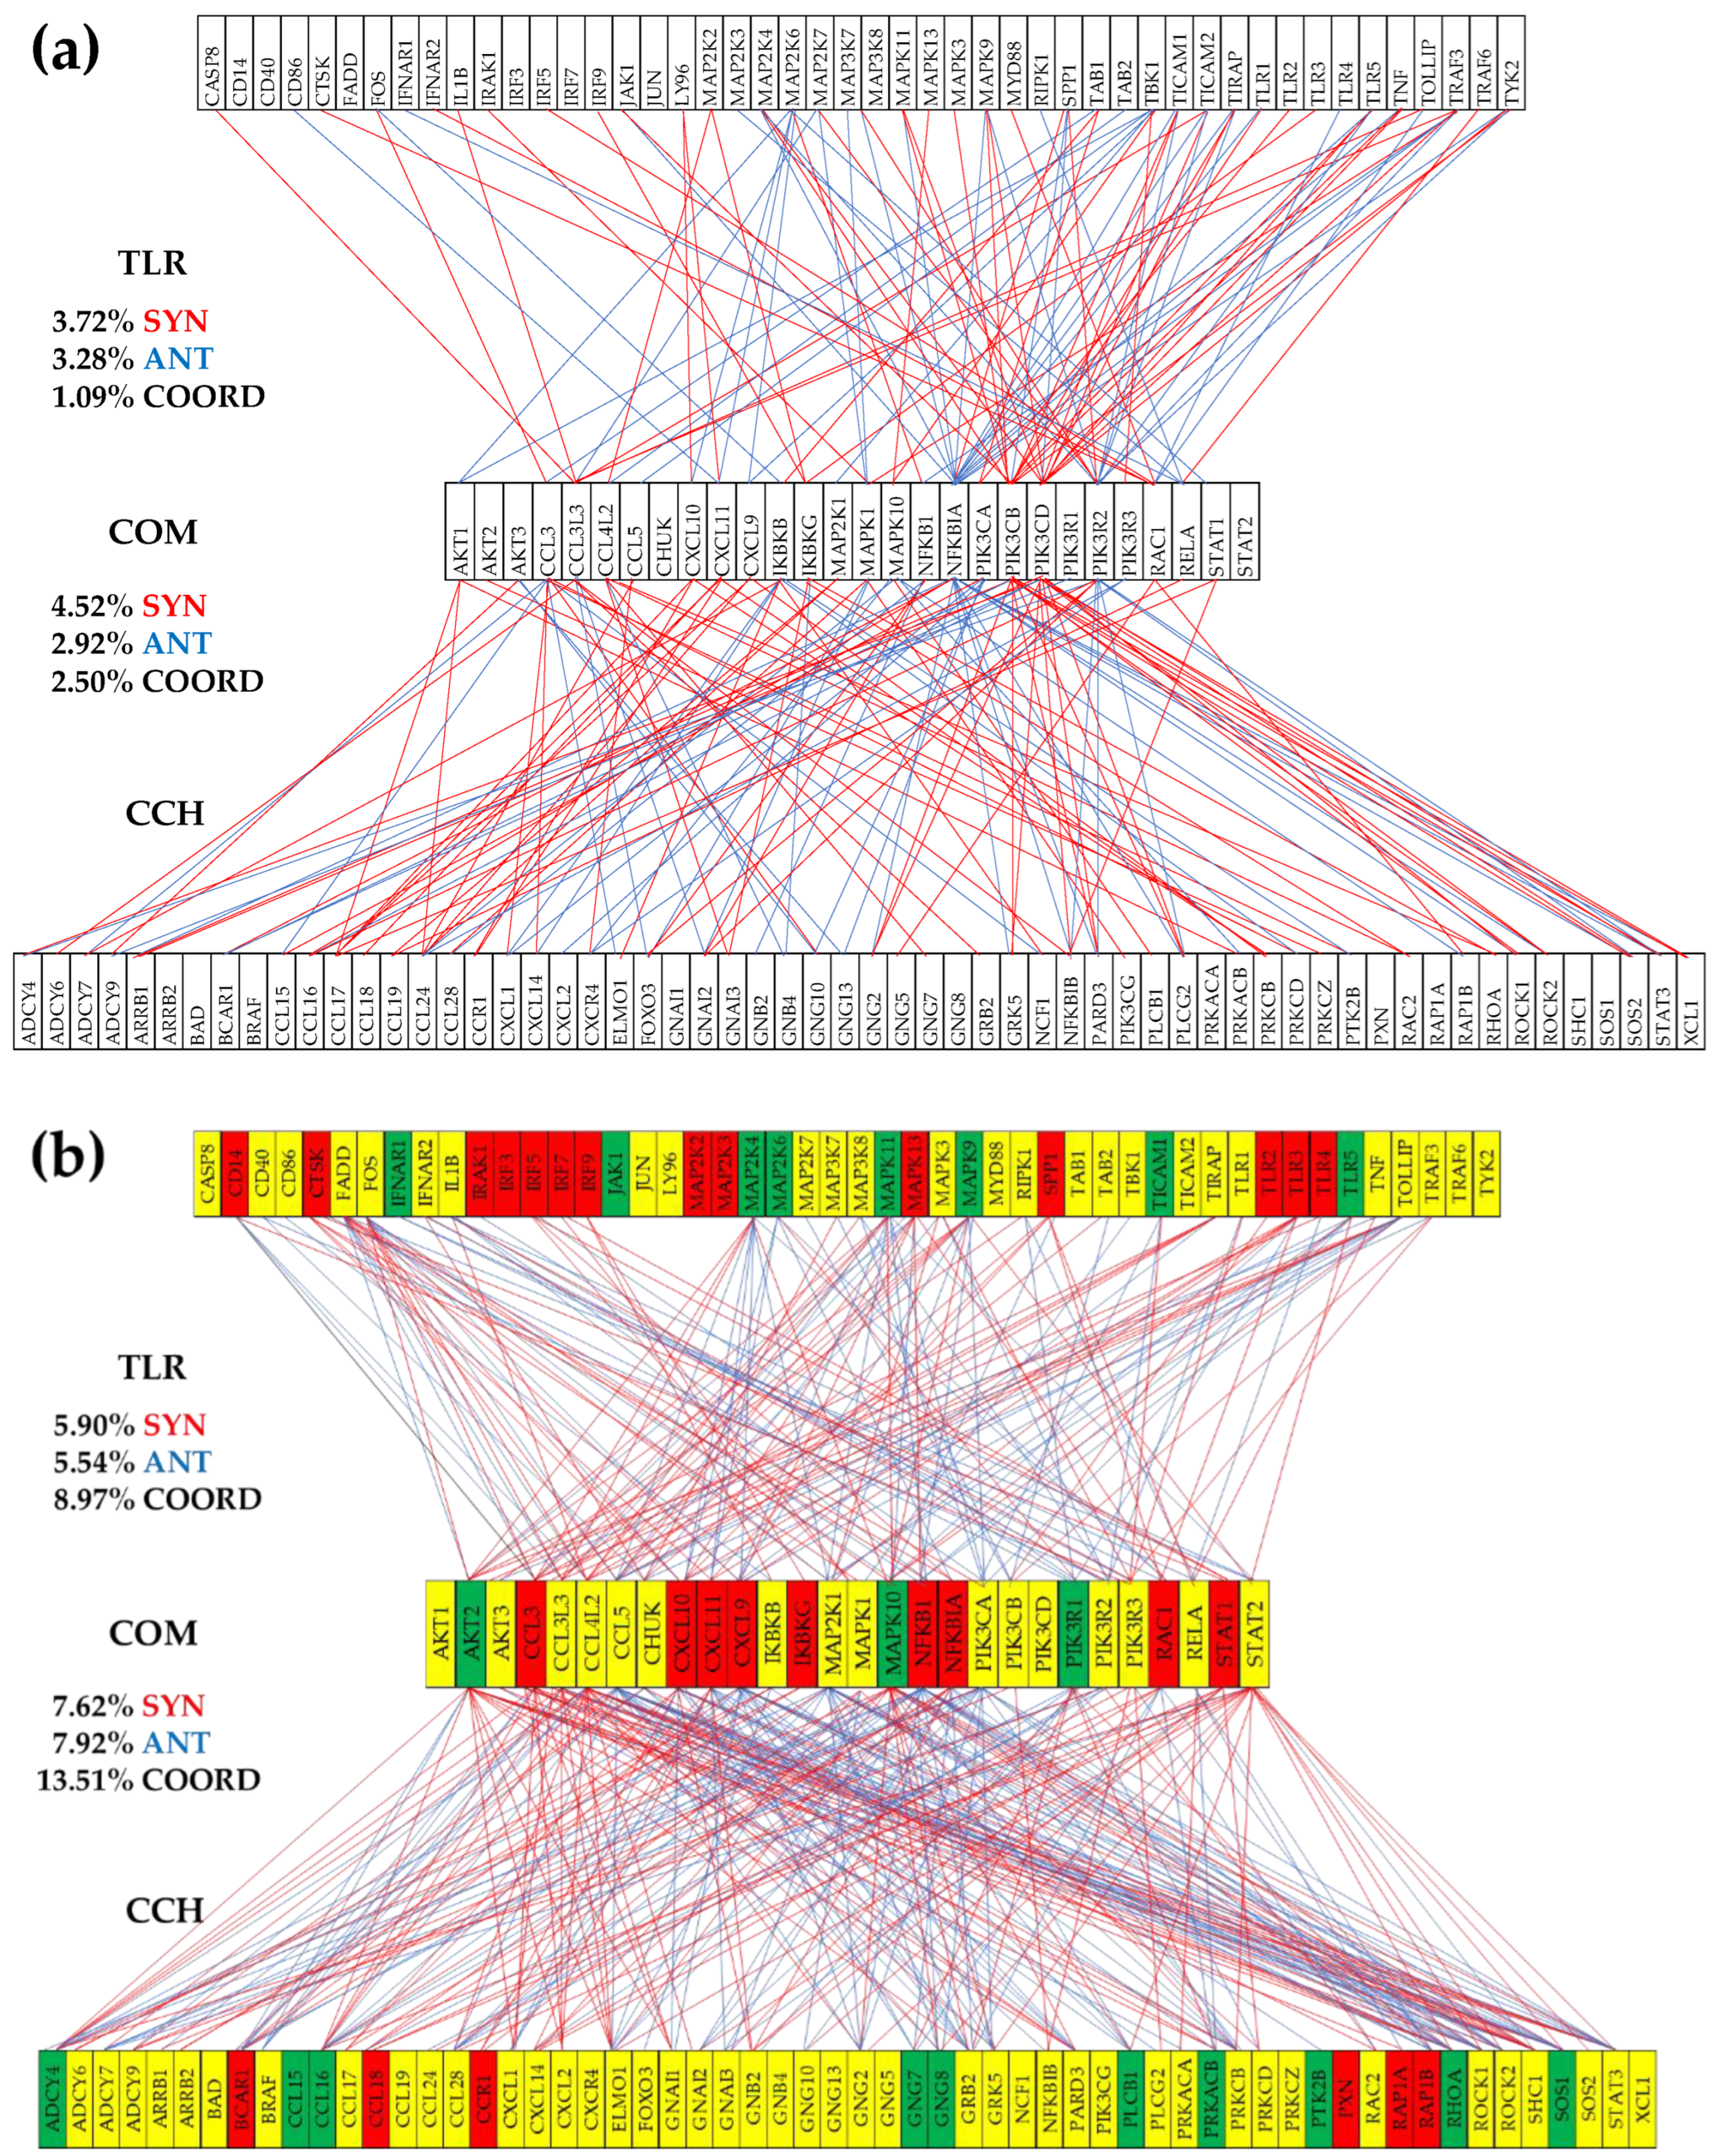
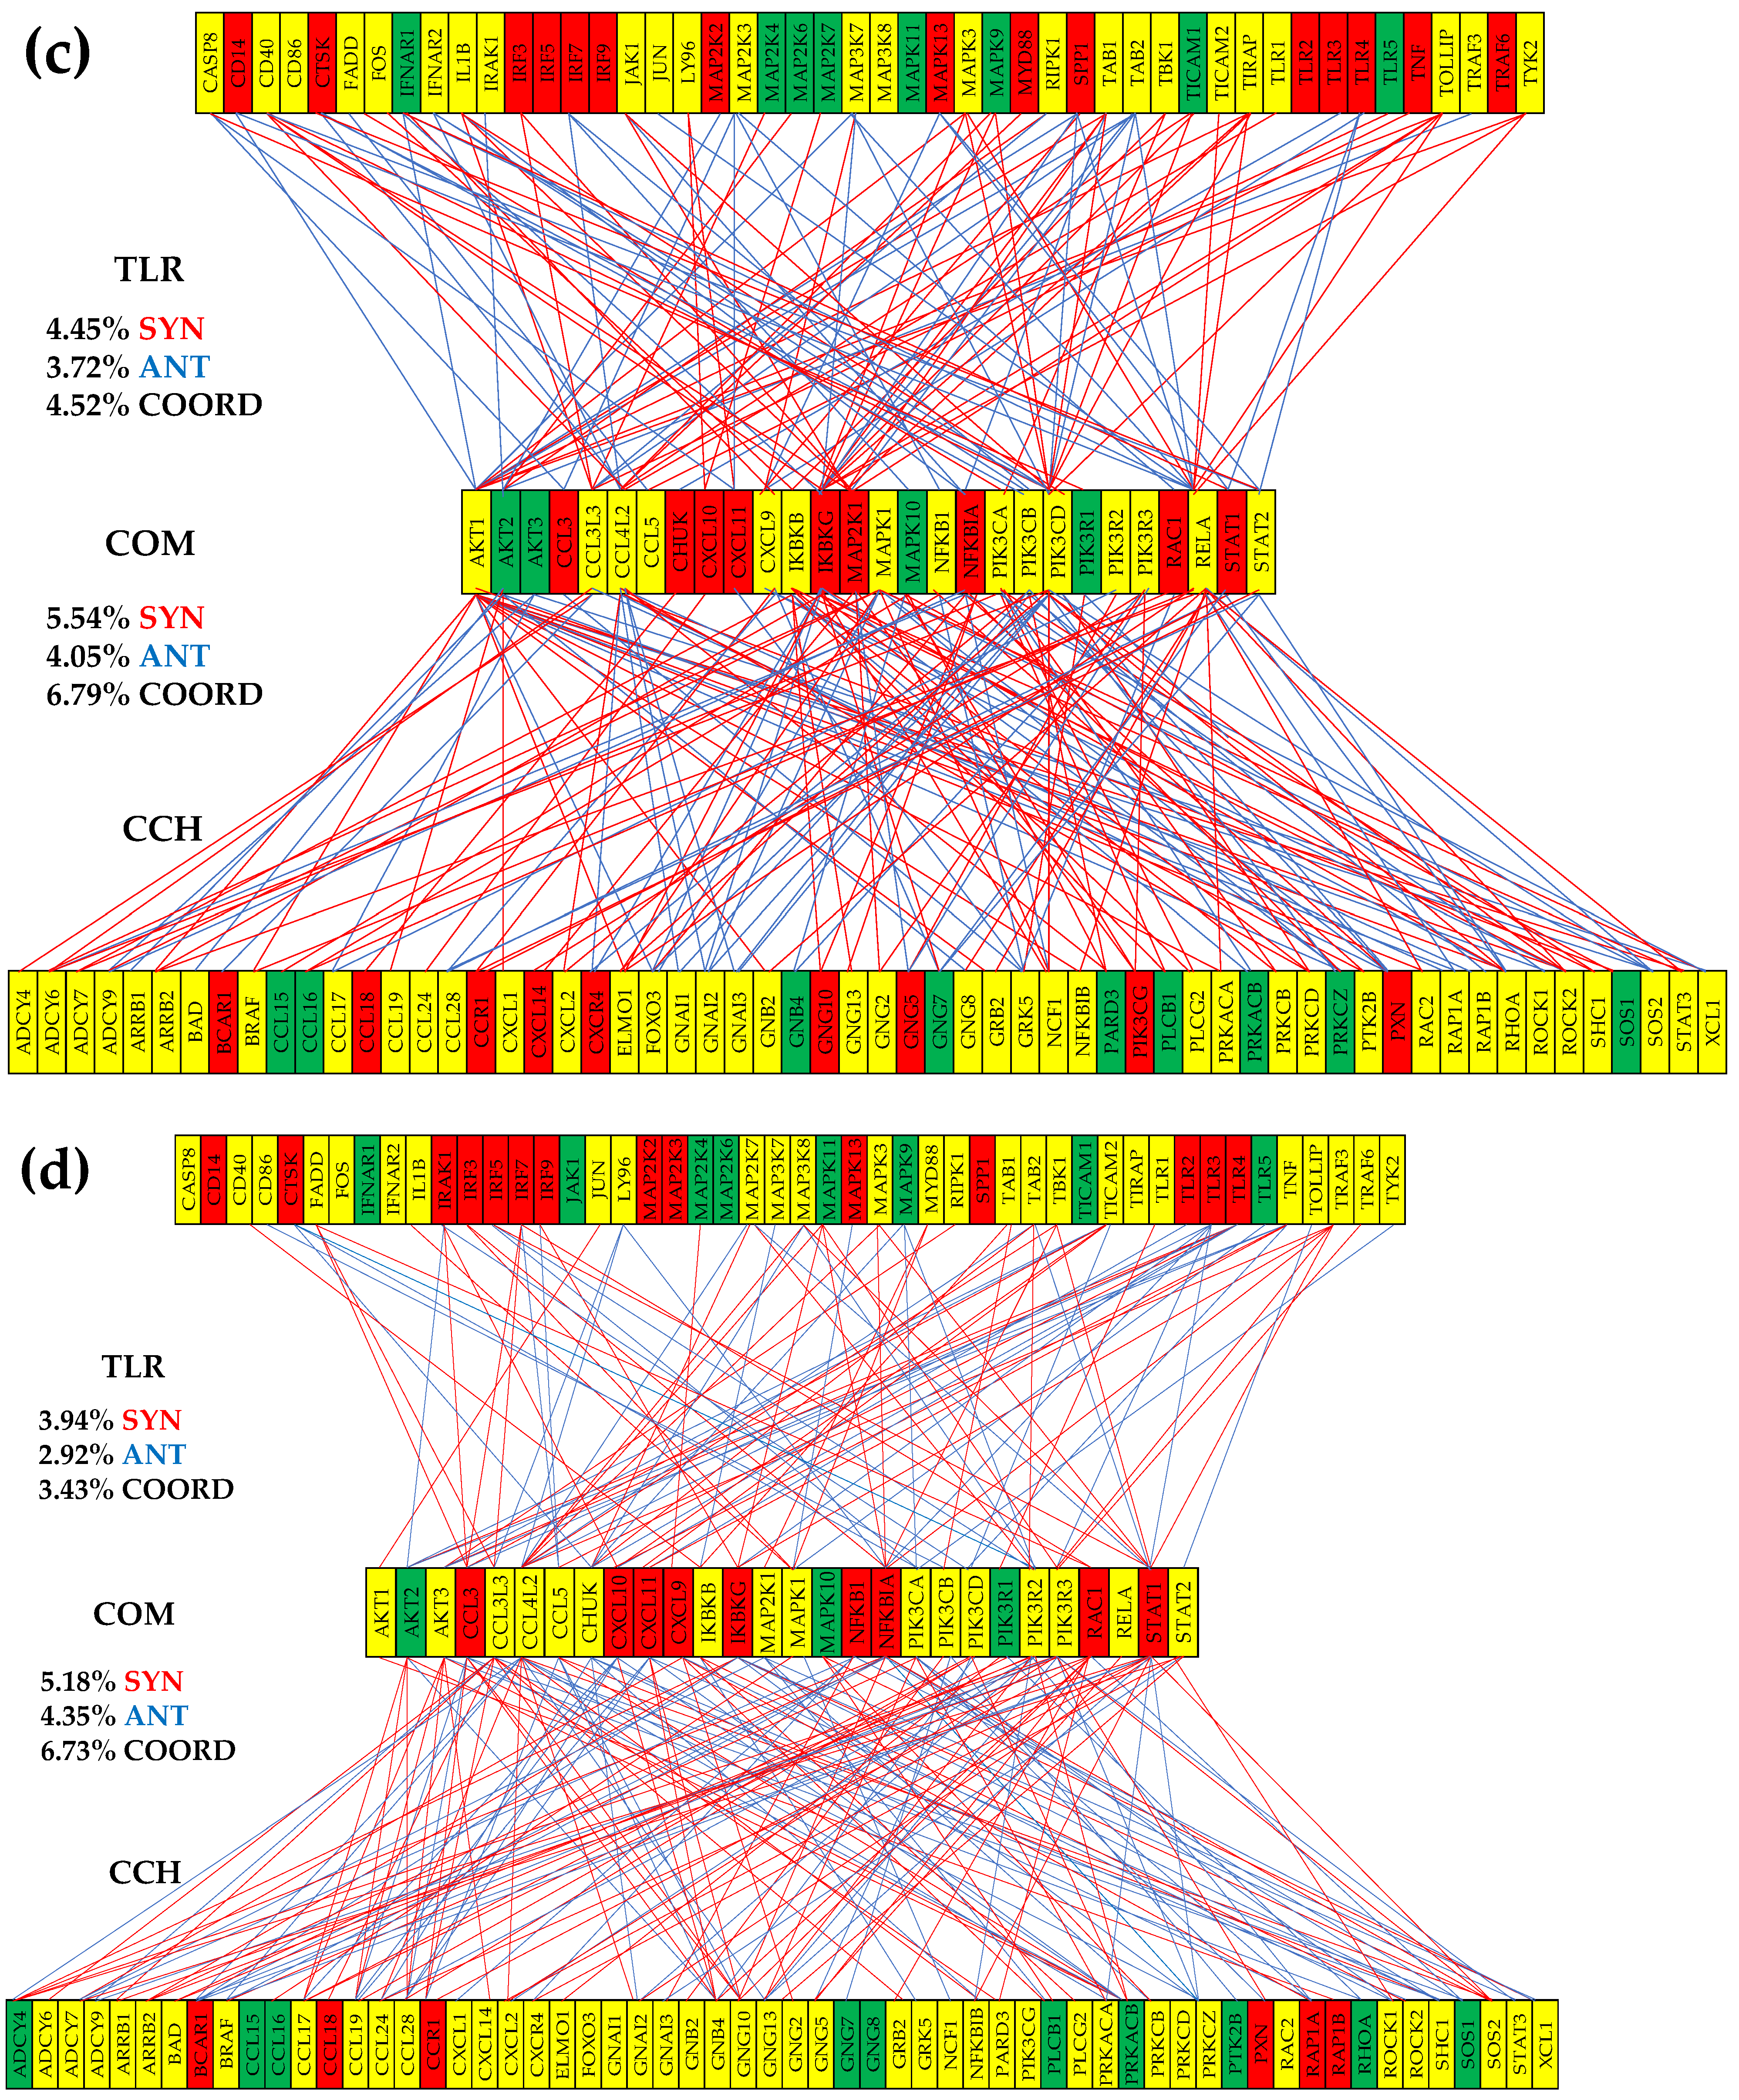
Figure 4.
The (p < 0.05) statistically significant independently expressed TLR and CHS genes with their 28 common hubs in: (a) the normal tissue “N” (b) cancer nodule “A”, (c) cancer nodule “B”, and (d) cancer nodule “C” Missing line means that the potential expression independence was not (p < 0.05) statistically significant. The red/green/yellow background of the gene symbol indicates up-/down-/not significant expression regulation in that nodule with respect to the normal tissue.
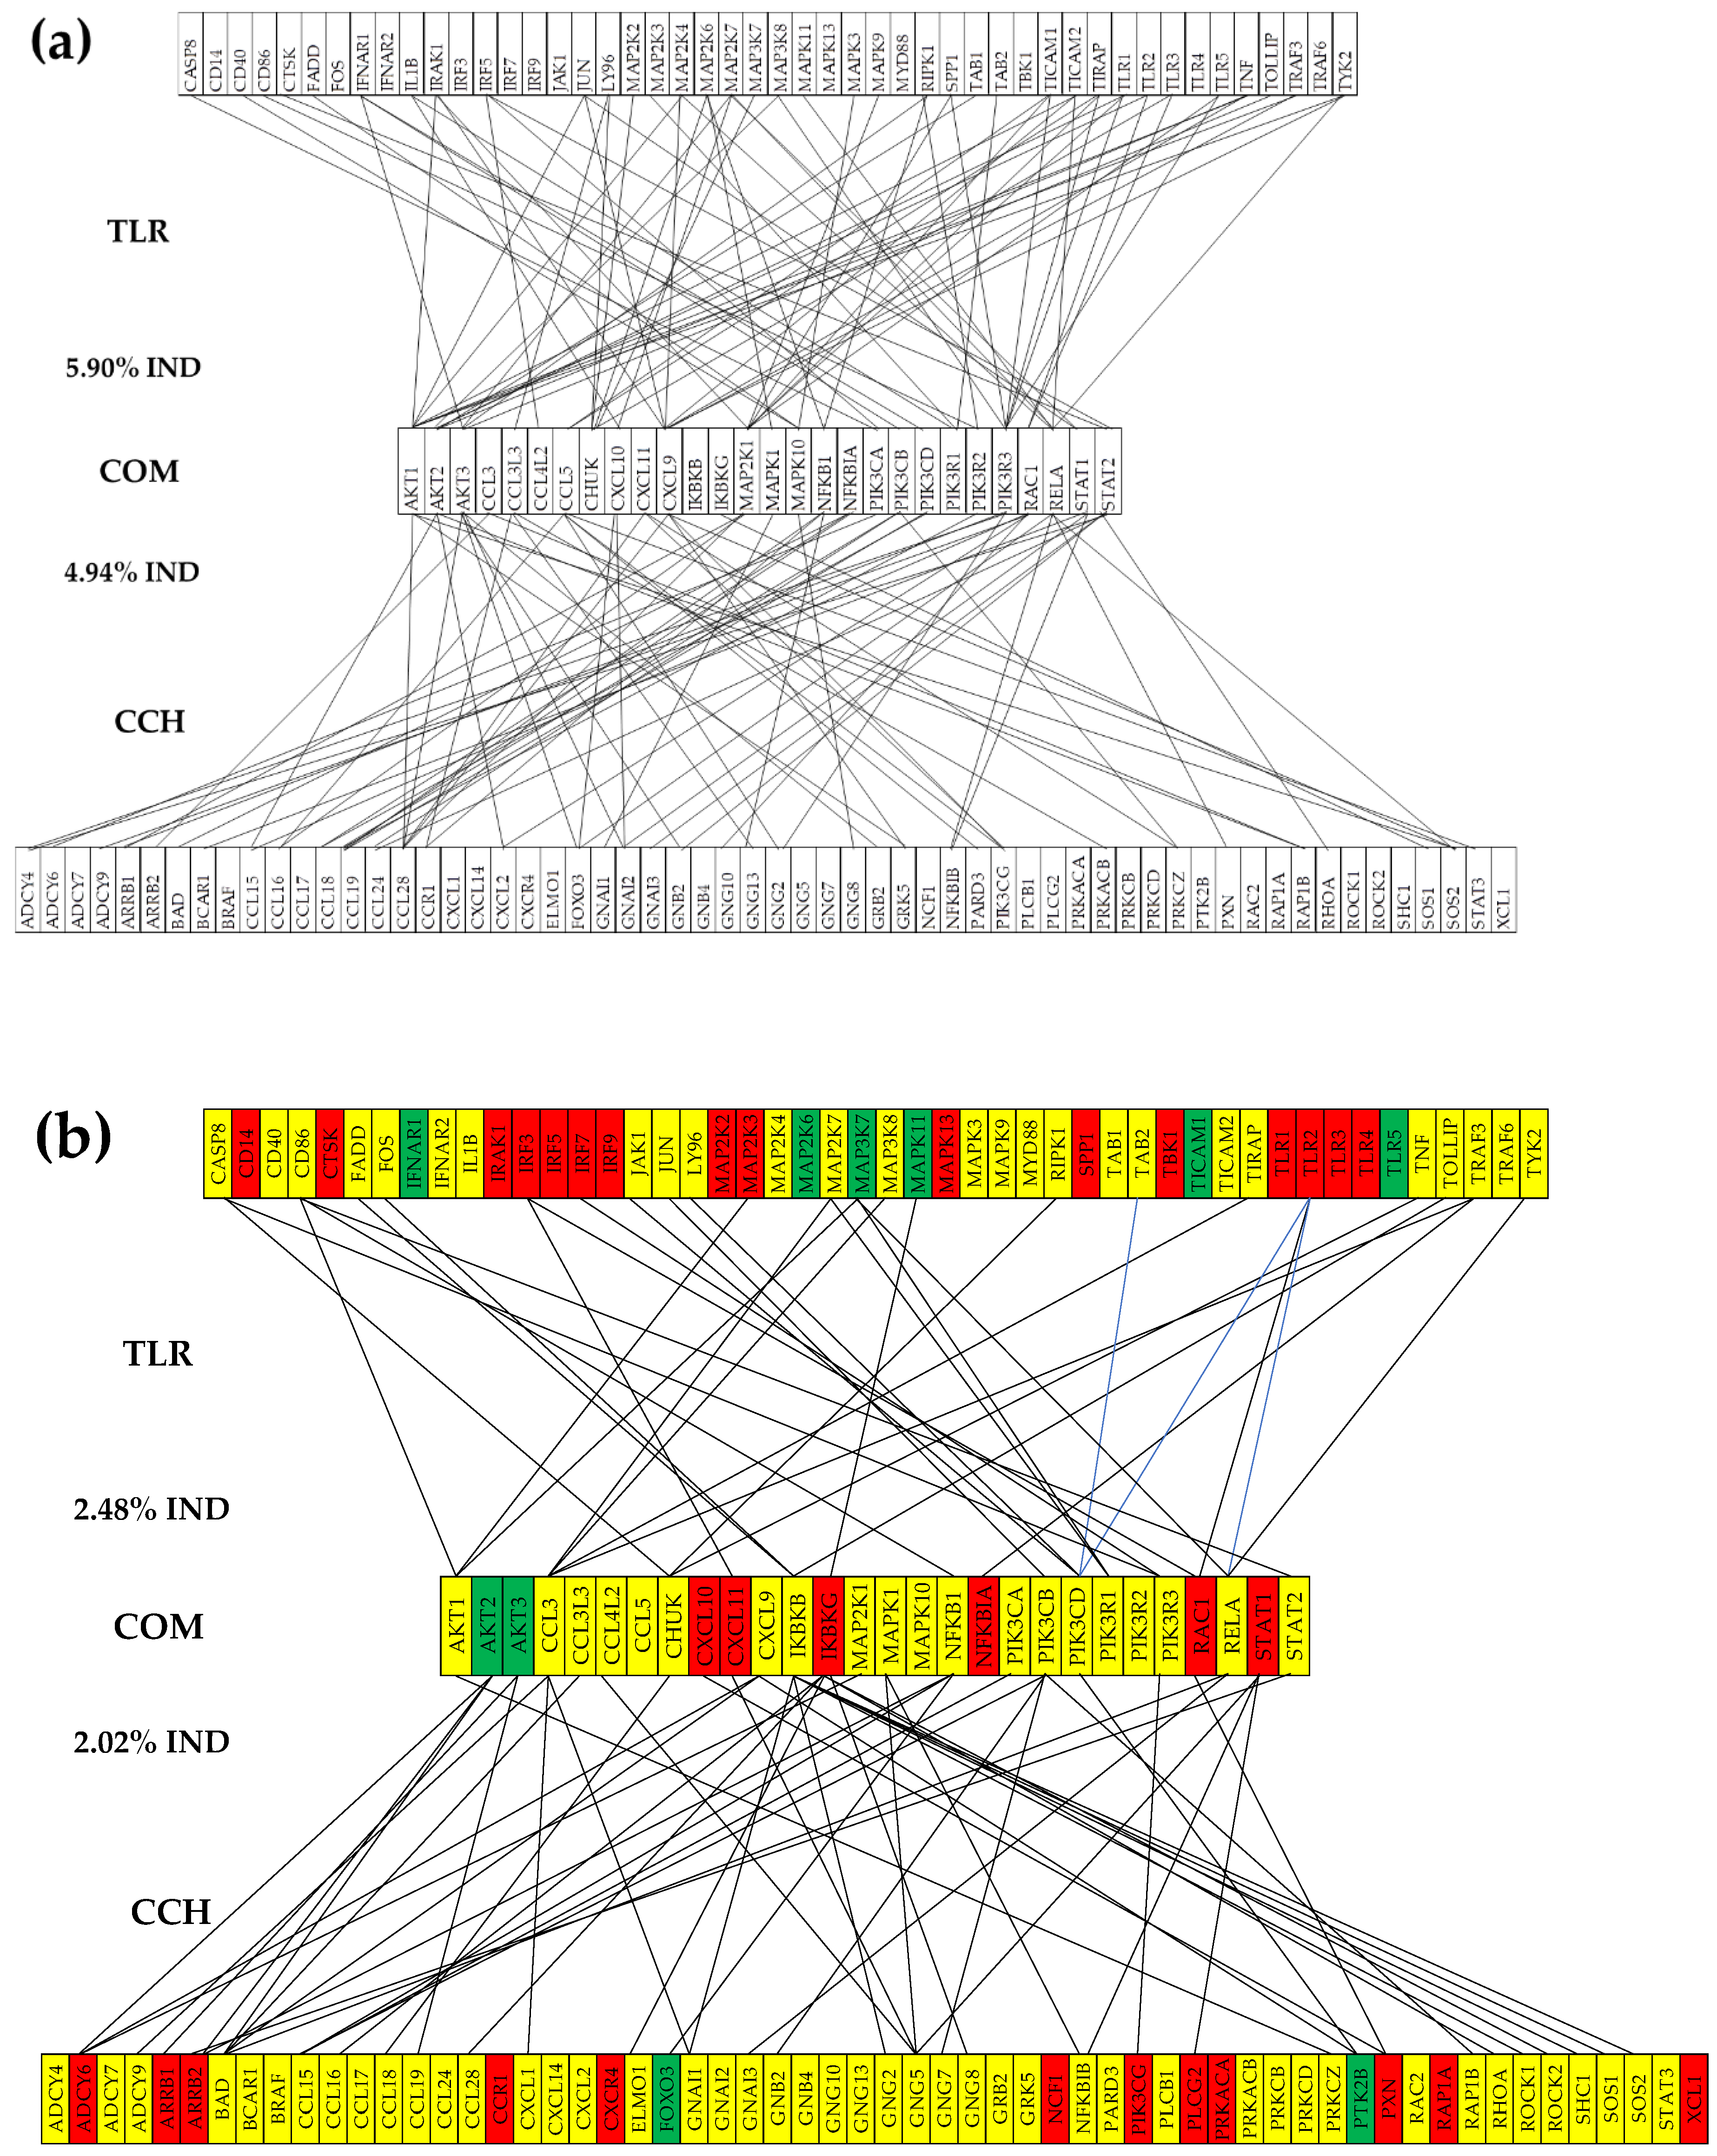
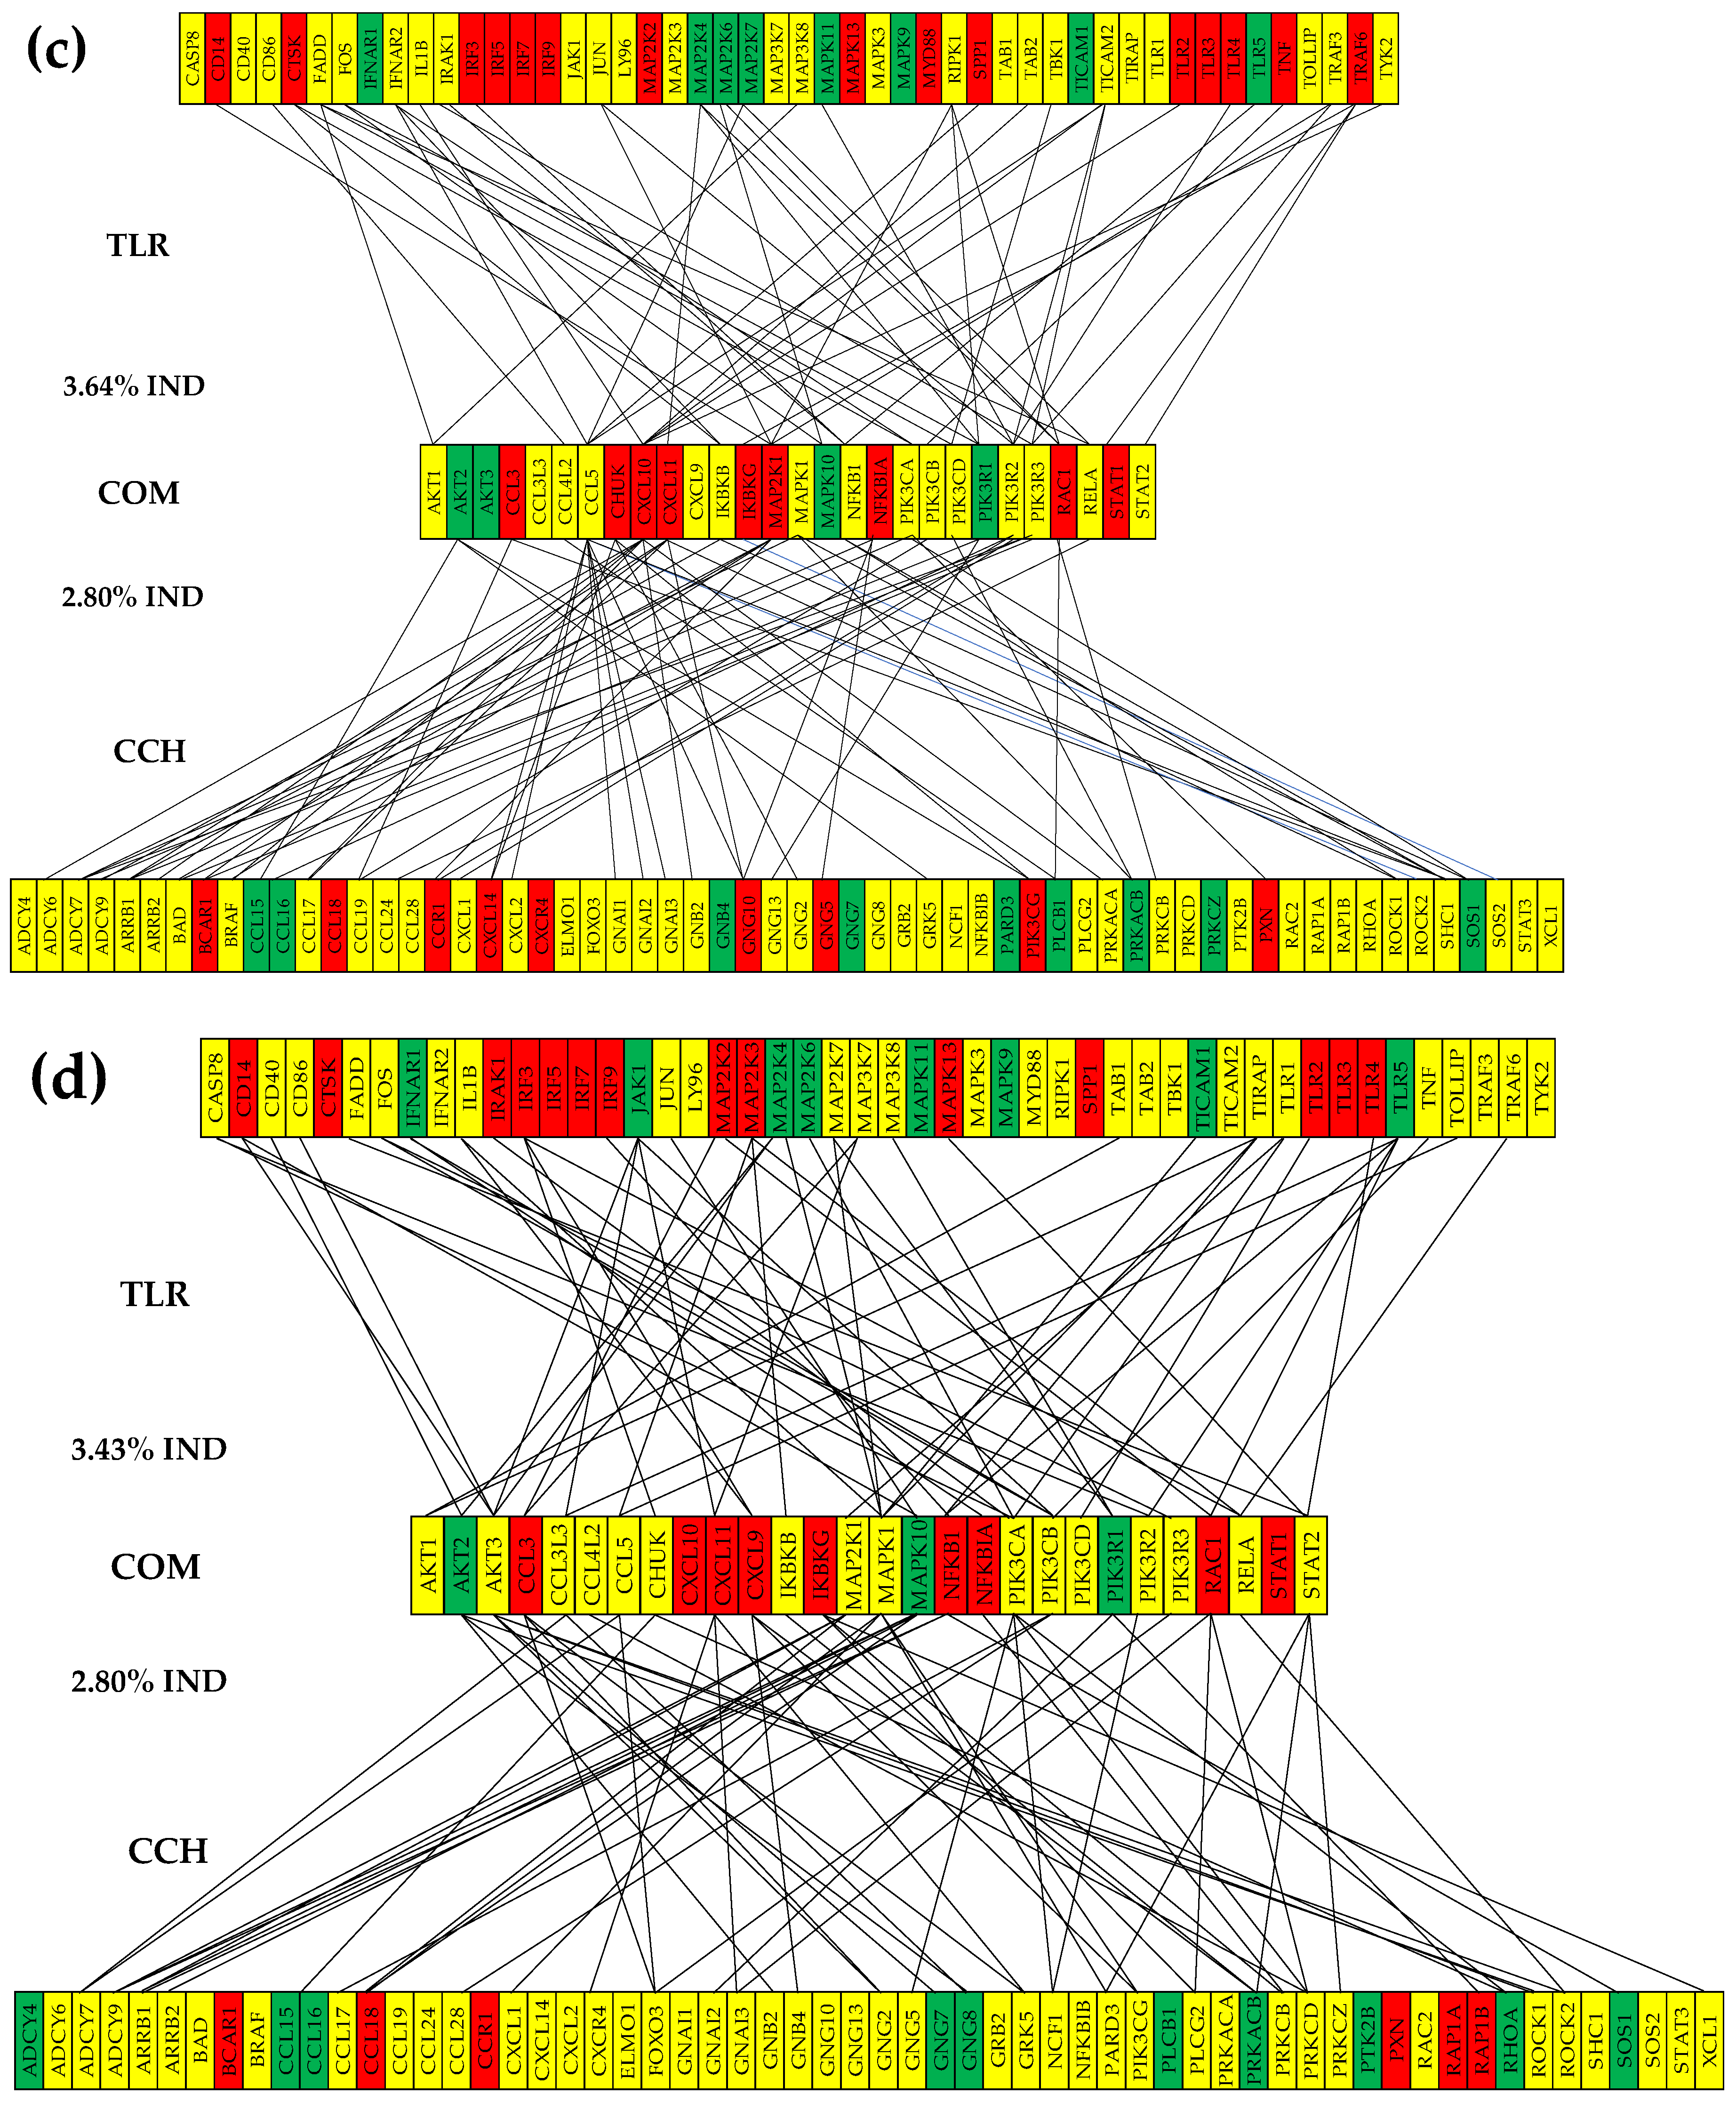
Figure 5.
(p < 0.05) statistically significant independently expressed gene pairs in the normal tissue “N” (black squares at the intersection of gene labeled rows and columns in panel (a)) that became (p < 0.05) statistically synergistically (red squares) or antagonistically (blue squares) expressed in the cancer nodules: (b) “A”, (c) “B”, and (d) “C”. Note the differences among the cancer nodules.
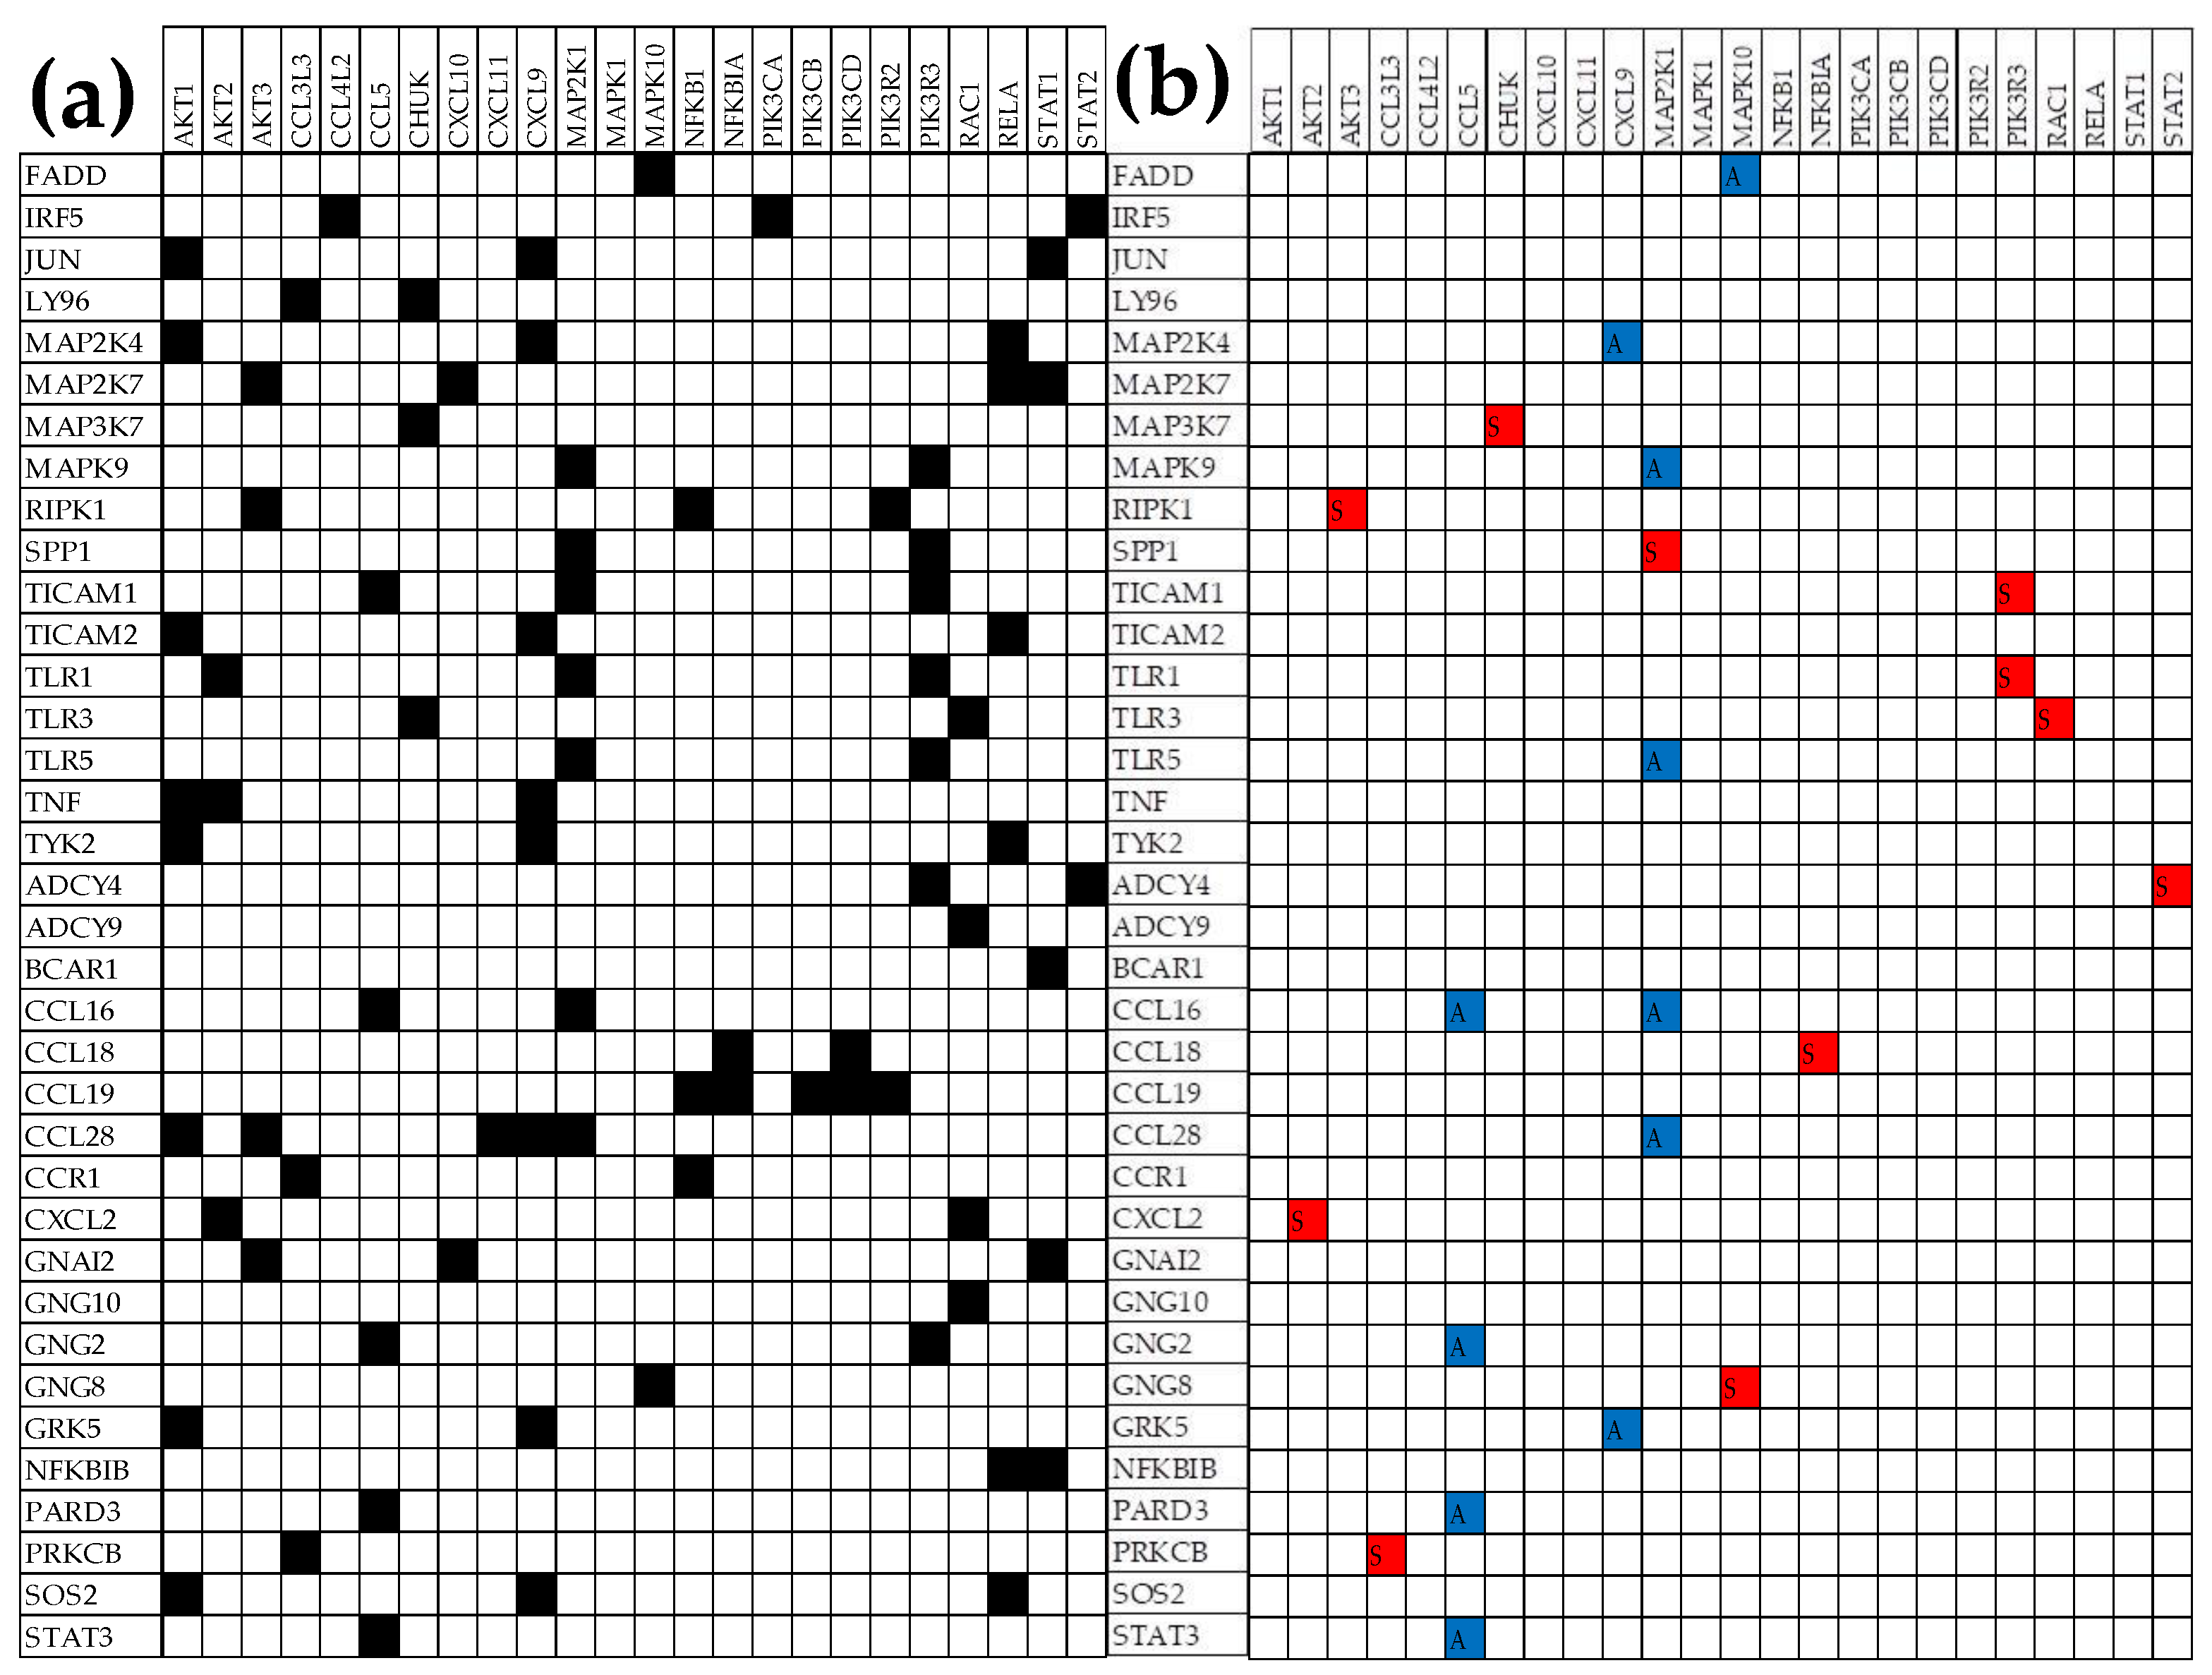
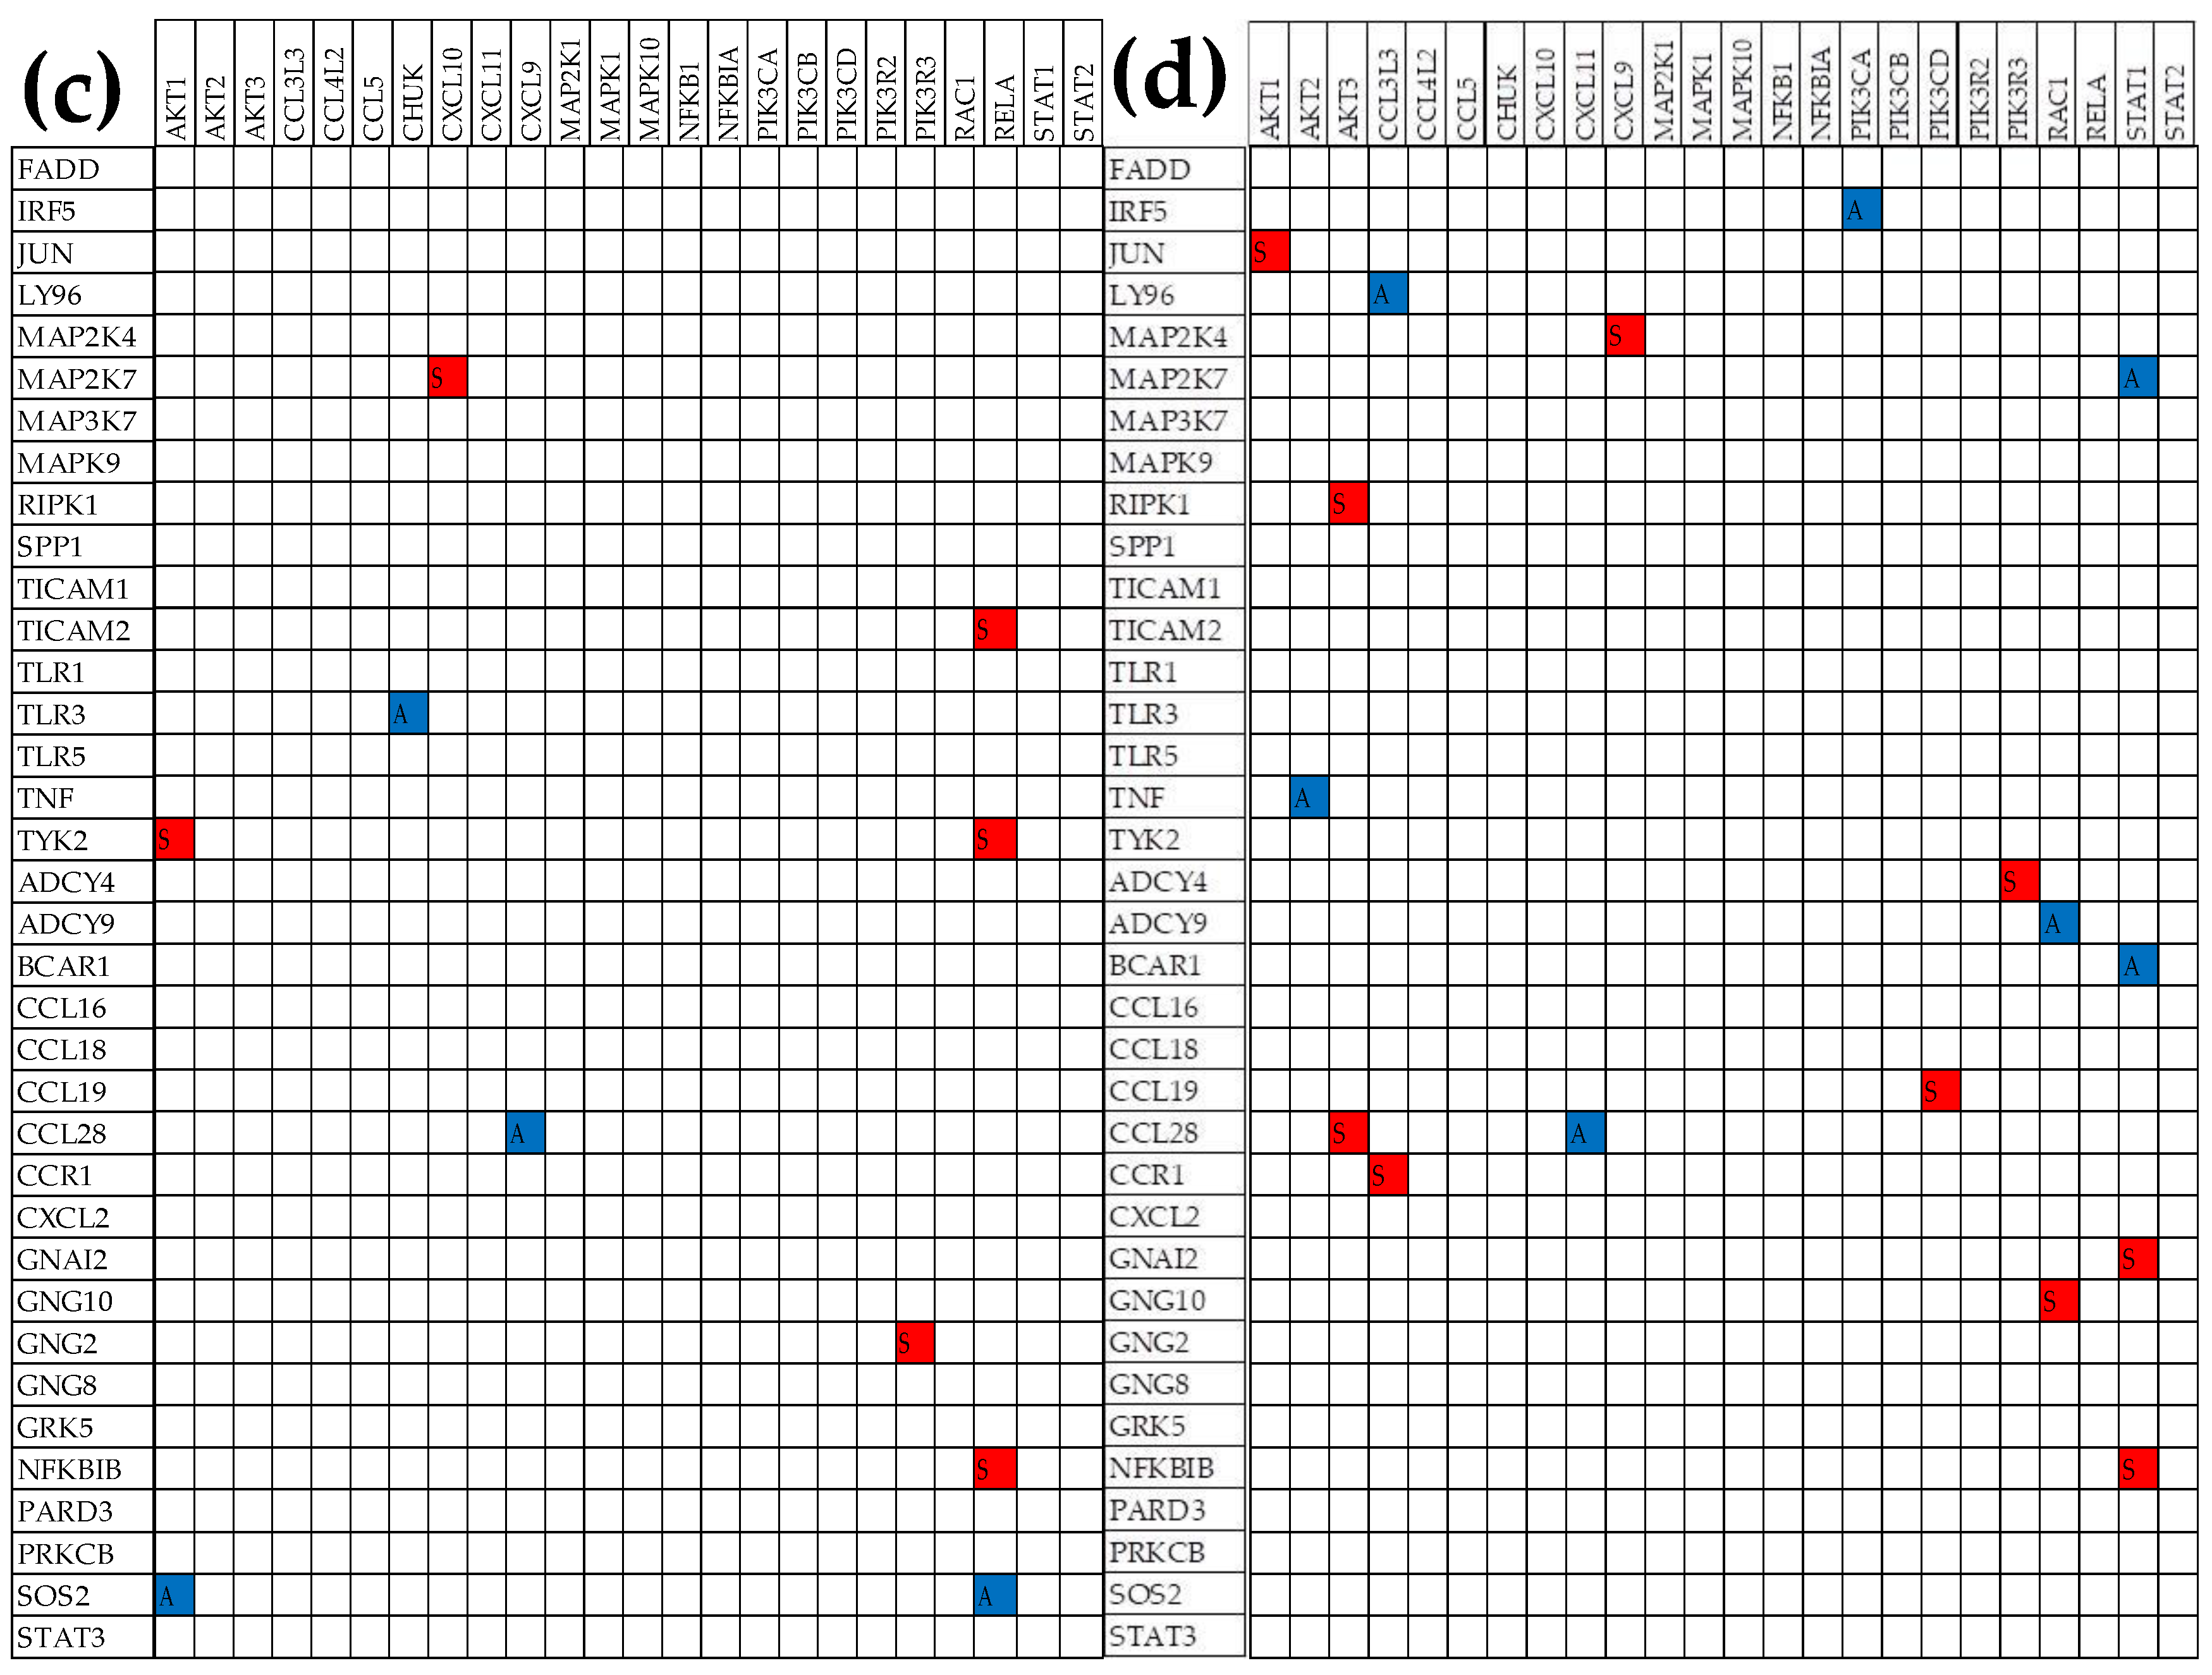
Figure 6.
Significantly synergistically (COR > 0.95; red squares) and antagonistically (COR < -0.95; blue squares) expressed TLR and CHS gene pairs in the normal tissue (pannel a) that were significantly decoupled (|COR| < 0.05; black squares) in the cancer nodules A (b), B (c) and C (d). Note the unrepeatability of the gene expression decoupling across the cancer nodules.
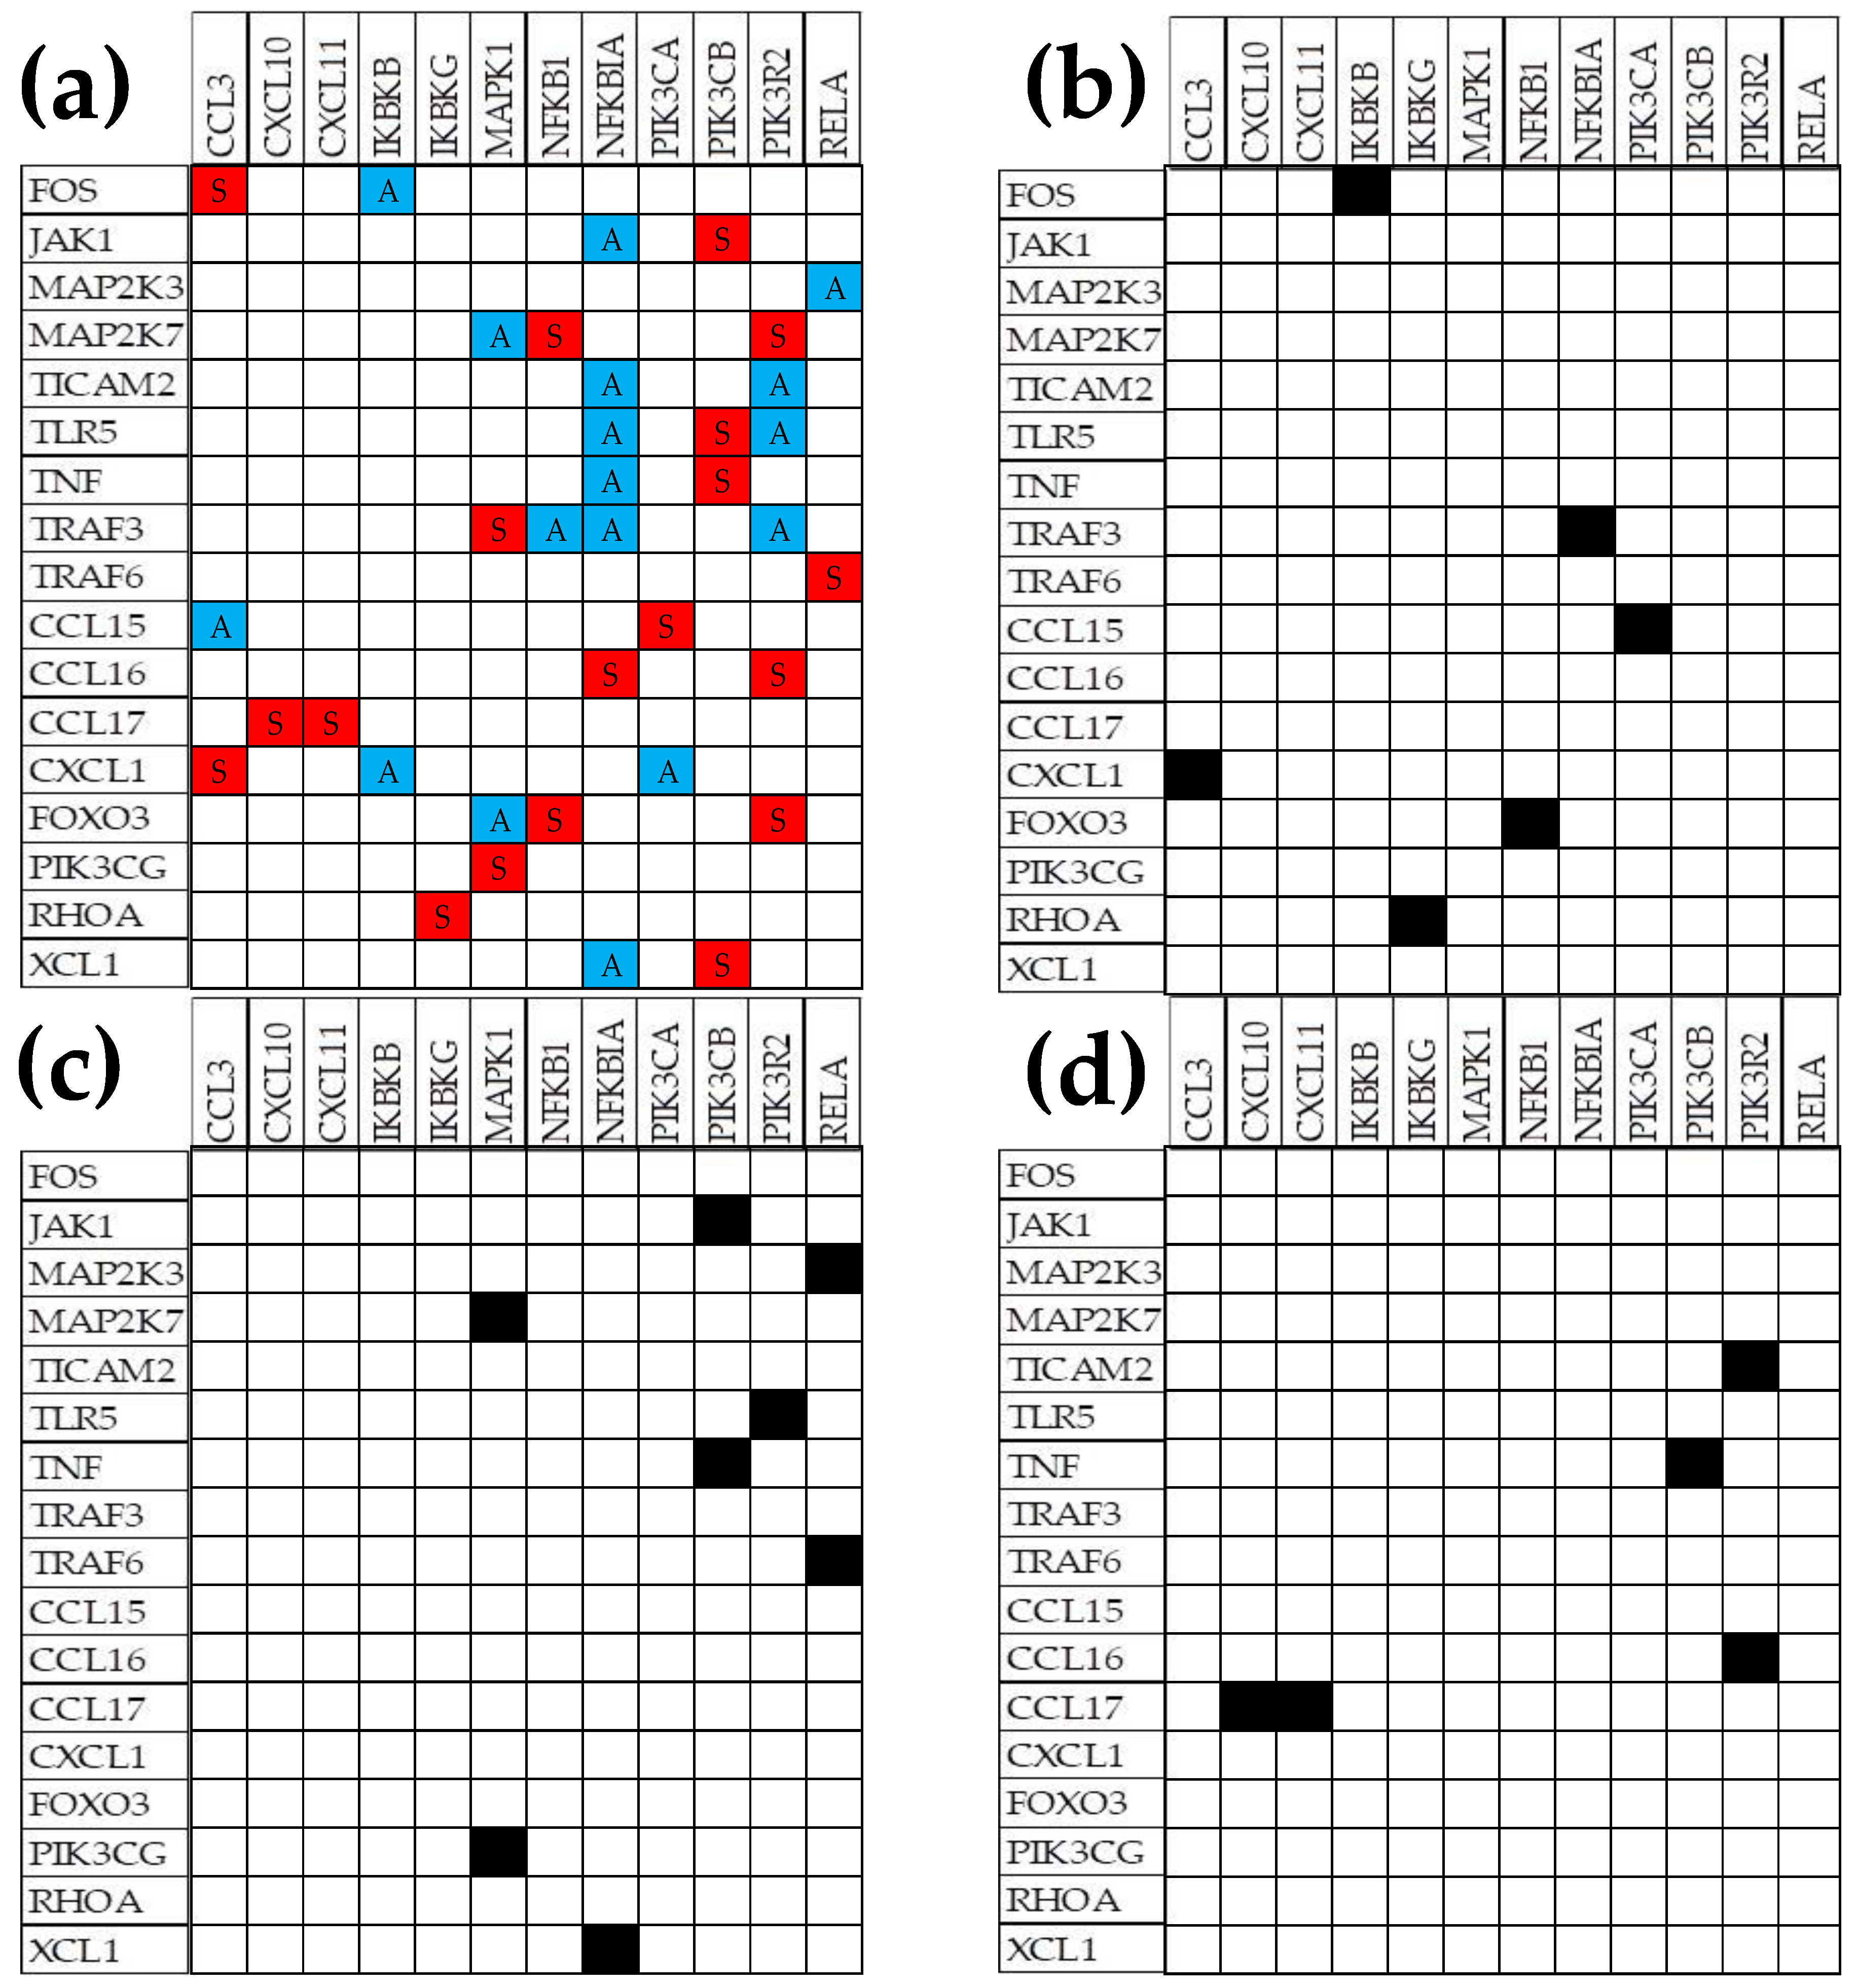
Figure 7.
TLR-CHS gene pairs whose normal significant synergistic (red squares) or antagonistic (blue squares) expression in (a) normal “N” tissue was switched to the opposite in the cancer nodules: (b) “A”, (c) “B”, and (d) “C”. Note the differences among the cancer nodules.
Figure 7.
TLR-CHS gene pairs whose normal significant synergistic (red squares) or antagonistic (blue squares) expression in (a) normal “N” tissue was switched to the opposite in the cancer nodules: (b) “A”, (c) “B”, and (d) “C”. Note the differences among the cancer nodules.
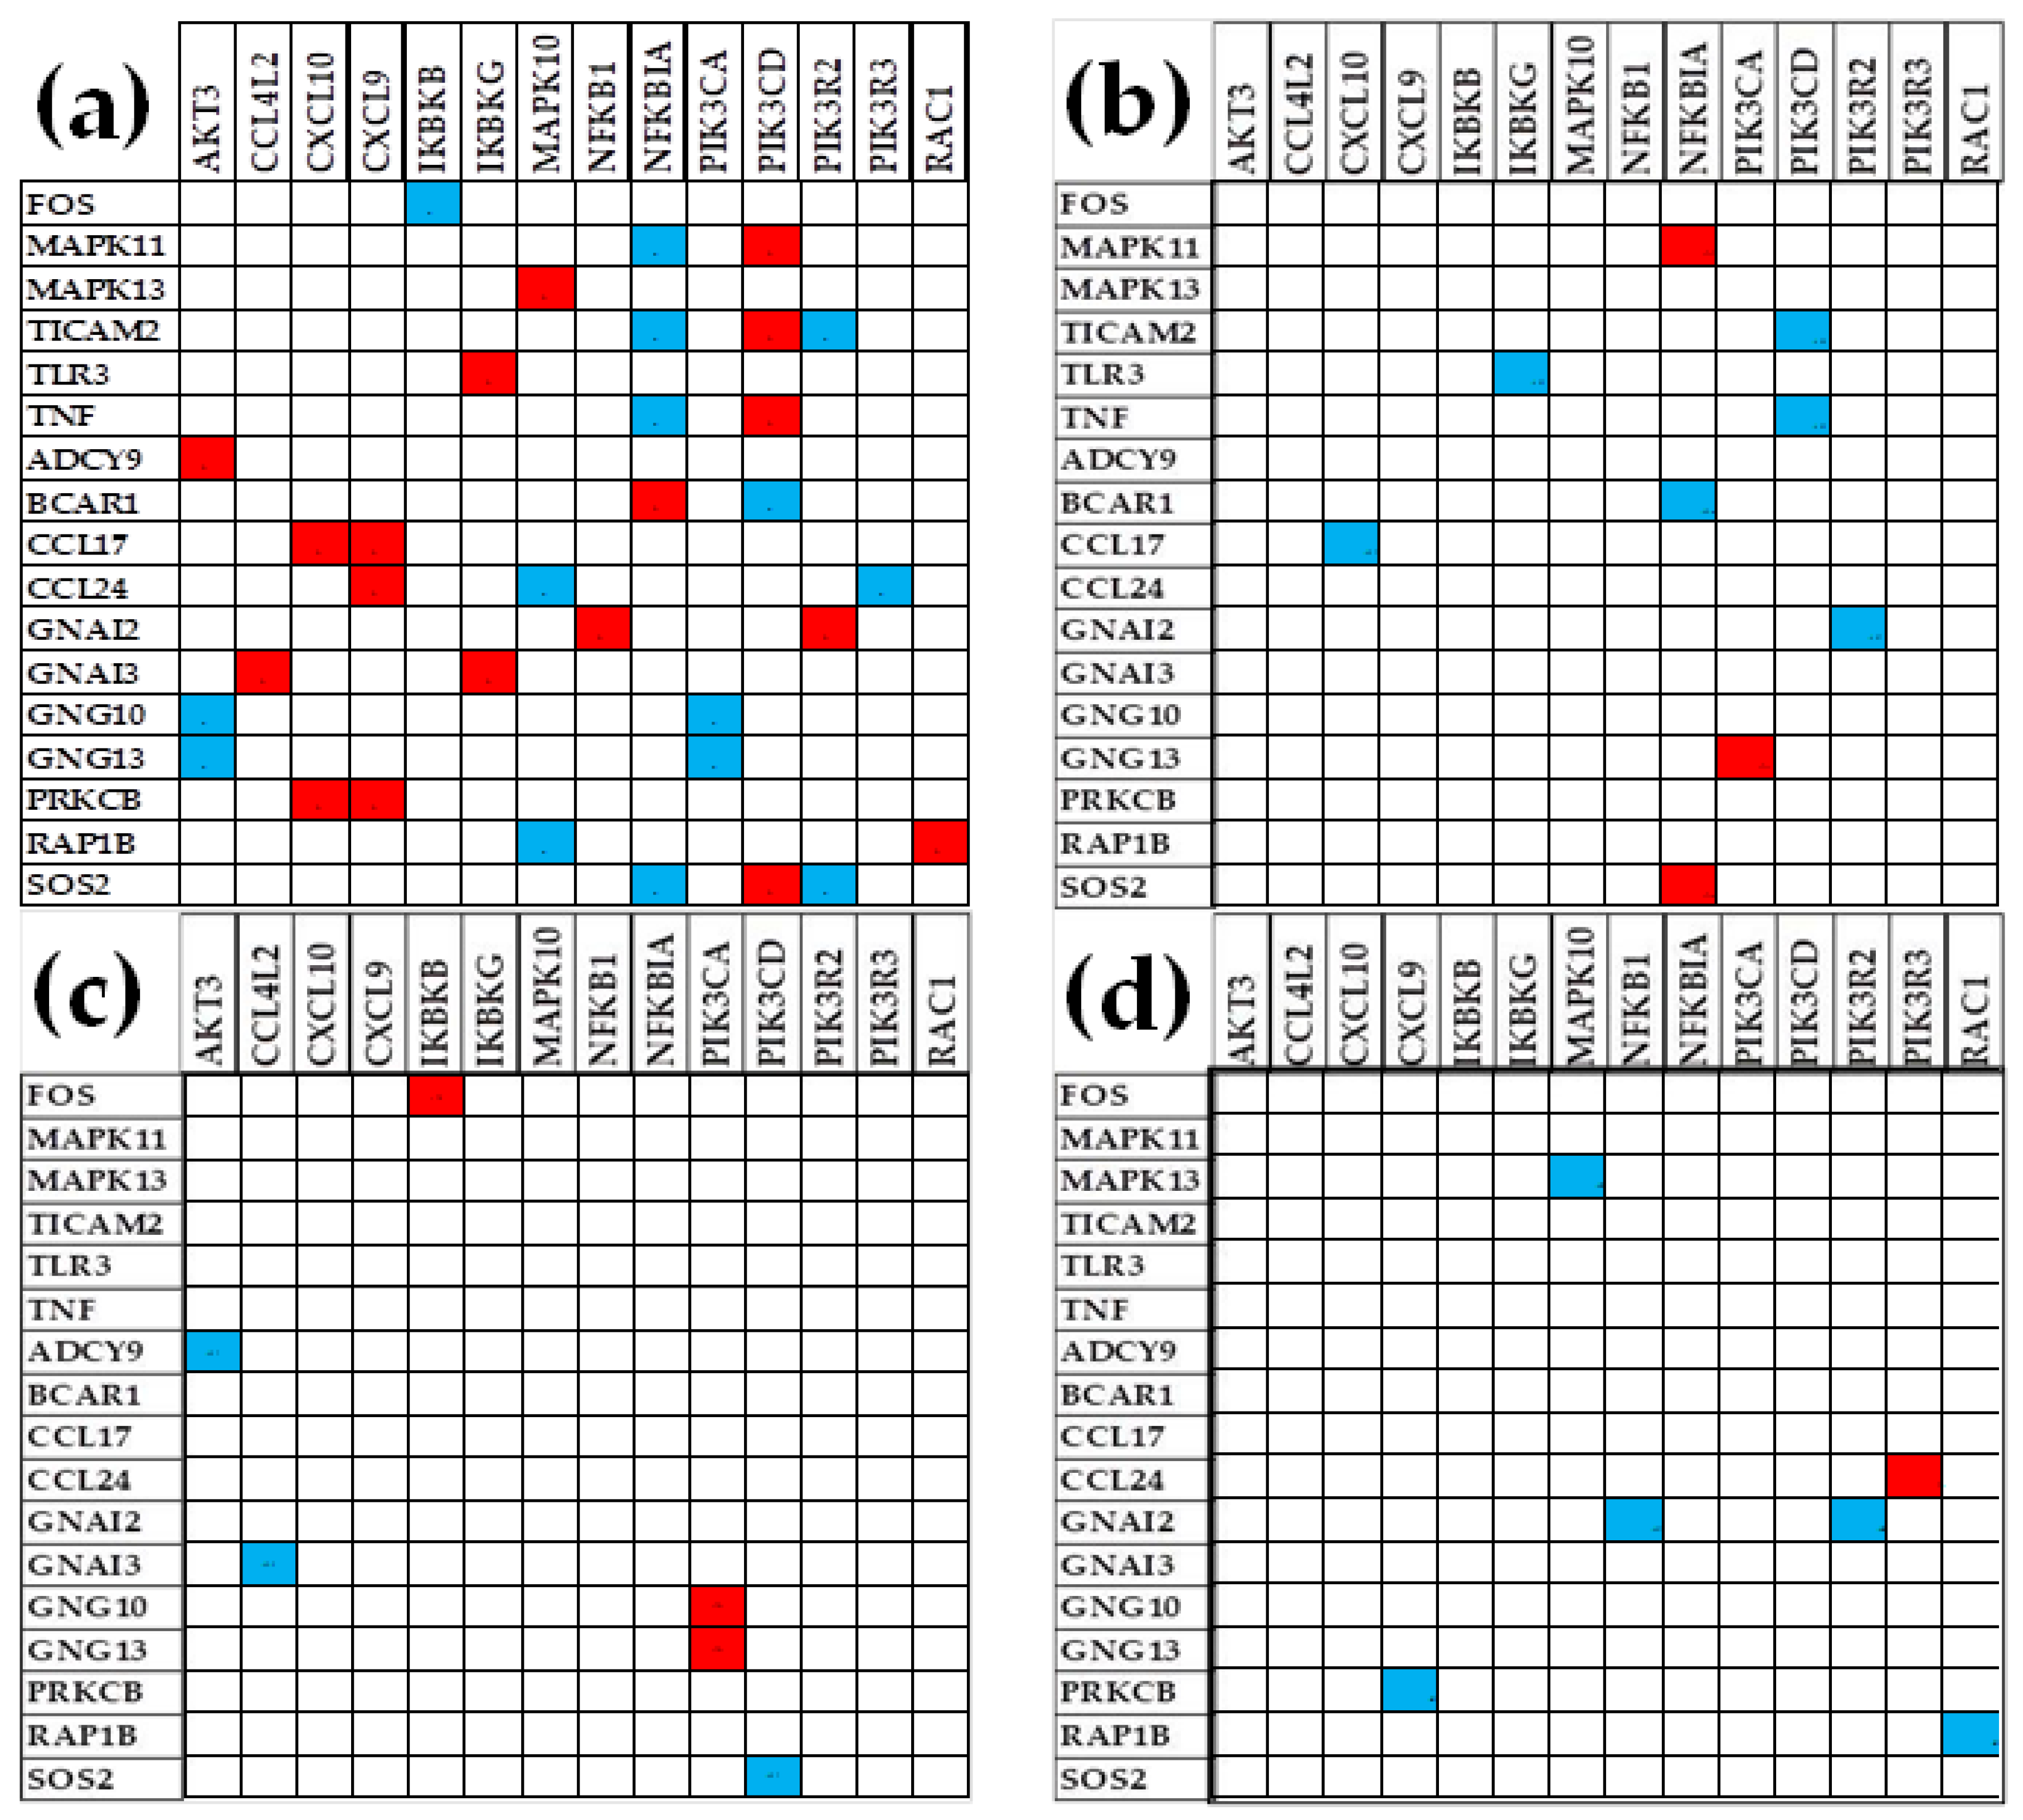

Table 1.
The three CHS and TLR genes with the largest expressions (AVE, grey background) in one region and the expression levels in the other regions. Numbers indicate how many times the expression of that gene is larger than the expression of the median gene in the profiled region.
Table 1.
The three CHS and TLR genes with the largest expressions (AVE, grey background) in one region and the expression levels in the other regions. Numbers indicate how many times the expression of that gene is larger than the expression of the median gene in the profiled region.
| CHEMOKINE SIGNALING | |||||
|---|---|---|---|---|---|
| Gene | Description | N | A | B | C |
| GNAI2 | guanine nucleotide-binding protein (G protein), alpha inhibiting activity polypeptide 2 | 58 | 69 | 96 | 68 |
| RAC3 | ras-related C3 botulinum toxin substrate 3 (rho family, small GTP binding protein | 23 | 11 | 15 | 17 |
| STAT2 | signal transducer and activator of transcription 2 | 18 | 16 | 22 | 24 |
| GNAI2 | guanine nucleotide-binding protein (G protein), alpha inhibiting activity polypeptide 2 | 58 | 69 | 96 | 68 |
| CXCL14 | chemokine (C-X-C motif) ligand 14 | 5 | 33 | 36 | 23 |
| NFKBIA | guanine nucleotide-binding protein (G protein), alpha inhibiting activity polypeptide 2 | 15 | 32 | 42 | 23 |
| GNAI2 | guanine nucleotide-binding protein (G protein), alpha inhibiting activity polypeptide 2 | 58 | 69 | 96 | 68 |
| NFKBIA | nuclear factor of kappa light polypeptide gene enhancer in B-cells inhibitor, alpha | 15 | 32 | 42 | 23 |
| CXCL14 | chemokine (C-X-C motif) ligand 14 | 5 | 33 | 36 | 23 |
| GNAI2 | guanine nucleotide binding protein (G protein), alpha inhibiting activity polypeptide 2 | 58 | 69 | 96 | 68 |
| STAT2 | signal transducer and activator of transcription 2 | 18 | 16 | 22 | 24 |
| NFKBIA | nuclear factor of kappa light polypeptide gene enhancer in B-cells inhibitor, alpha | 15 | 32 | 42 | 23 |
| TOLL-LIKE RECEPTOR SIGNALING | |||||
| STAT2 | signal transducer and activator of transcription 2 | 18 | 16 | 22 | 24 |
| MAP2K7 | mitogen-activated protein kinase kinase 7 | 17 | 12 | 16 | 14 |
| PIK3R2 | phosphoinositide-3-kinase, regulatory subunit 2 (beta) | 15 | 16 | 16 | 13 |
| NFKBIA | nuclear factor of kappa light polypeptide gene enhancer in B-cells inhibitor, alpha | 15 | 32 | 42 | 23 |
| IRF7 | interferon regulatory factor 7 | 10 | 31 | 42 | 21 |
| PIK3R2 | phosphoinositide-3-kinase, regulatory subunit 2 (beta) | 15 | 16 | 16 | 13 |
| NFKBIA | nuclear factor of kappa light polypeptide gene enhancer in B-cells inhibitor, alpha | 15 | 32 | 42 | 23 |
| IRF7 | interferon regulatory factor 7 | 10 | 31 | 42 | 21 |
| STAT2 | signal transducer and activator of transcription 2 | 18 | 16 | 22 | 24 |
| STAT2 | signal transducer and activator of transcription 2 | 18 | 16 | 22 | 24 |
| NFKBIA | nuclear factor of kappa light polypeptide gene enhancer in B-cells inhibitor, alpha | 15 | 32 | 42 | 23 |
| IRF7 | interferon regulatory factor 7 | 10 | 31 | 42 | 21 |
Table 2.
The three most controlled genes (top positive REC scores, grey background) in each region and their scores in the other regions for comparison. Note that the most controlled three genes are different not only between the normal tissue and the cancer nodules in general, but even between equally pathologically graded nodules.
| CHEMOKINE SIGNALING | Region | ||||
|---|---|---|---|---|---|
| Gene | Description | N | A | B | C |
| CCL15 | chemokine (C-C motif) ligand 15 | 2.75 | -1.91 | 0.37 | 0.10 |
| VAV2 | vav 2 guanine nucleotide exchange factor | 2.39 | -0.65 | -0.59 | 2.37 |
| KRAS | Kirsten rat sarcoma viral oncogene homolog | 1.73 | 0.01 | -1.00 | 0.35 |
| GNB1 | guanine nucleotide-binding protein (G protein), beta polypeptide 1 | -0.40 | 4.18 | 0.06 | 0.63 |
| CXCL16 | chemokine (C-X-C motif) ligand 16 | 0.18 | 2.06 | 0.06 | -1.01 |
| FOXO3 | forkhead box O3 | 0.49 | 2.02 | 0.76 | -0.51 |
| MAPK1 | mitogen-activated protein kinase 1 | -0.72 | 0.38 | 2.59 | 0.33 |
| GRK5 | G protein-coupled receptor kinase 5 | -1.24 | 0.26 | 1.55 | -1.07 |
| CCL16 | chemokine (C-C motif) ligand 16 | 0.40 | 0.25 | 1.46 | 3.65 |
| CCL16 | chemokine (C-C motif) ligand 16 | 0.40 | 0.25 | 1.46 | 3.65 |
| VAV2 | vav 2 guanine nucleotide exchange factor | 2.39 | -0.65 | -0.59 | 2.37 |
| PLCB1 | phospholipase C, beta 1 (phosphoinositide-specific) | -0.69 | -0.53 | 0.13 | 2.29 |
| TOLL-LIKE RECEPTOR SIGNALING | |||||
| PIK3R1 | phosphoinositide-3-kinase, regulatory subunit 1 (alpha) | 1.56 | -0.24 | 1.09 | 1.34 |
| TBK1 | TANK-binding kinase 1 | 1.34 | 1.46 | -0.30 | 0.05 |
| PIK3CA | phosphatidylinositol-4,5-bisphosphate 3-kinase, catalytic subunit alpha | 1.30 | 0.62 | 0.10 | -0.31 |
| TYK2 | tyrosine kinase 2 | -1.85 | 2.95 | 0.74 | -1.71 |
| RIPK1 | receptor (TNFRSF)-interacting serine-threonine kinase 1 | 1.05 | 2.79 | 0.96 | 0.94 |
| CD14 | CD14 molecule | -0.41 | 1.83 | 1.76 | 0.66 |
| TOLLIP | toll interacting protein | -1.05 | 1.29 | 2.67 | -1.19 |
| MAPK1 | mitogen-activated protein kinase 1 | -0.72 | 0.38 | 2.59 | 0.33 |
| IRF3 | interferon regulatory factor 3 | 0.87 | 0.74 | 2.20 | -0.36 |
| IRF5 | interferon regulatory factor 5 | -0.11 | 1.02 | 0.43 | 2.66 |
| MAP2K3 | mitogen-activated protein kinase kinase 3 | 0.75 | 1.34 | 0.54 | 1.83 |
| CCL5 | chemokine (C-C motif) ligand 5 | -1.87 | -0.52 | -0.76 | 1.66 |
Table 3.
The three least controlled (lowest RECs) genes in each profiled region and their scores in the other regions. Note that the least controlled three genes are different not only between the normal tissue and the cancer nodules, but even between equally pathologically graded nodules.
Table 3.
The three least controlled (lowest RECs) genes in each profiled region and their scores in the other regions. Note that the least controlled three genes are different not only between the normal tissue and the cancer nodules, but even between equally pathologically graded nodules.
| CHEMOKINE SIGNALING | Region | ||||
|---|---|---|---|---|---|
| Gene | Description | N | A | B | C |
| GNG13 | guanine nucleotide-binding protein (G protein), gamma 13 | -2.90 | -0.81 | -1.12 | -0.25 |
| FGR | FGR proto-oncogene, Src family tyrosine kinase | -2.82 | 0.11 | -0.02 | -0.23 |
| CXCL9 | chemokine (C-X-C motif) ligand 9 | -2.48 | -1.37 | 0.76 | -1.50 |
| CCL15 | chemokine (C-C motif) ligand 15 | 2.75 | -1.91 | 0.37 | 0.10 |
| CCL14 | chemokine (C-C motif) ligand 14 | -1.66 | -1.54 | -1.13 | -1.47 |
| CXCL11 | chemokine (C-X-C motif) ligand 11 | -2.18 | -1.44 | -1.62 | -0.88 |
| CCL19 | chemokine (C-C motif) ligand 19 | -1.99 | 0.90 | -1.91 | -2.41 |
| CCL17 | chemokine (C-C motif) ligand 17 | -0.38 | -0.15 | -1.75 | 0.54 |
| CXCL11 | chemokine (C-X-C motif) ligand 11 | -2.18 | -1.44 | -1.62 | -0.88 |
| CCL19 | chemokine (C-C motif) ligand 19 | -1.99 | 0.90 | -1.91 | -2.41 |
| NFKB1 | nuclear factor of kappa light polypeptide gene enhancer in B-cells 1 | 0.91 | -0.82 | 0.64 | -2.23 |
| CXCL9 | chemokine (C-X-C motif) ligand 9 | -2.48 | -1.37 | 0.76 | -1.50 |
| TOLL-LIKE RECEPTOR SIGNALING | |||||
| CD86 | CD86 molecule | -3.10 | -0.49 | -1.12 | -1.41 |
| FOS | FBJ murine osteosarcoma viral oncogene homolog | -2.70 | -1.56 | -0.83 | -1.92 |
| CXCL9 | chemokine (C-X-C motif) ligand 9 | -2.48 | -1.37 | 0.76 | -1.50 |
| TICAM2 | TICAM2 – TIR domain-containing adaptor molecule 2 | -0.83 | -2.27 | -0.63 | 0.17 |
| SPP1 | secreted phosphoprotein 1 | -1.22 | -1.61 | -0.28 | 0.28 |
| FOS | FBJ murine osteosarcoma viral oncogene homolog | -2.70 | -1.56 | -0.83 | -1.92 |
| CXCL11 | chemokine (C-X-C motif) ligand 11 | -2.18 | -1.44 | -1.62 | -0.88 |
| TNF | tumor necrosis factor | -0.89 | -0.39 | -1.60 | -0.49 |
| CD86 | CD86 molecule | -3.10 | -0.49 | -1.12 | -1.41 |
| NFKB1 | nuclear factor of kappa light polypeptide gene enhancer in B-cells 1 | 0.91 | -0.82 | 0.64 | -2.23 |
| FOS | FBJ murine osteosarcoma viral oncogene homolog | -2.70 | -1.56 | -0.83 | -1.92 |
| TLR4 | toll-like receptor 4 | 0.15 | 1.34 | 0.64 | -1.90 |
Table 4.
The top three CHS and TLR genes (highest GCH scores) in each profiled region and the corresponding scores in the other regions. Note the change in the gene hierarchy not only between normal and cancer tissues but also between the equally graded cancer nodules “B” and “C” in the same tumor.
Table 4.
The top three CHS and TLR genes (highest GCH scores) in each profiled region and the corresponding scores in the other regions. Note the change in the gene hierarchy not only between normal and cancer tissues but also between the equally graded cancer nodules “B” and “C” in the same tumor.
| CHEMOKINE SIGNALING | |||||
|---|---|---|---|---|---|
| Gene | Description | N | A | B | C |
| CCL15 | chemokine (C-C motif) ligand 15 | 16.84 | 0.14 | 1.36 | 1.58 |
| PRKCD | protein kinase C, delta | 9.96 | 2.26 | 1.62 | 3.66 |
| VAV2 | vav 2 guanine nucleotide exchange factor | 9.22 | 2.32 | 1.57 | 3.79 |
| GNB1 | guanine nucleotide binding protein (G protein), beta polypeptide 1 | 1.94 | 34.15 | 1.51 | 4.54 |
| JAK2 | Janus kinase 2 | 1.93 | 9.99 | 4.50 | 3.21 |
| TYK2 | tyrosine kinase 2 | 0.79 | 8.75 | 3.13 | 1.07 |
| CCR6 | chemokine (C-C motif) receptor 6 | 1.36 | 4.07 | 5.46 | 1.22 |
| CCR1 | chemokine (C-C motif) receptor 1 | 1.98 | 4.40 | 4.88 | 3.32 |
| BCAR1 | BCAR1 scaffold protein, Cas family member | 1.94 | 3.30 | 4.81 | 4.51 |
| CCL16 | chemokine (C-C motif) ligand 16 | 4.03 | 4.20 | 2.63 | 14.72 |
| PLCB1 | phospholipase C, beta 1 (phosphoinositide-specific) | 1.13 | 2.48 | 1.47 | 9.67 |
| PREX1 | phosphatidylinositol-3,4,5-trisphosphate-dependent Rac exchange factor 1 | 2.14 | 1.87 | 2.03 | 8.07 |
| TOLL-LIKE RECEPTOR SIGNALING | |||||
| FADD | Fas (TNFRSF6)-associated via death domain | 7.28 | 5.03 | 2.24 | 0.42 |
| IKBKB | inhibitor of kappa light polypeptide gene enhancer in B-cells, kinase beta | 5.86 | 1.04 | 0.91 | 1.21 |
| MAP2K4 | mitogen-activated protein kinase kinase 4 | 5.80 | 2.35 | 2.23 | 3.08 |
| RIPK1 | receptor (TNFRSF)-interacting serine-threonine kinase 1 | 2.60 | 11.86 | 3.01 | 5.31 |
| CD14 | CD14 molecule | 1.20 | 9.79 | 2.58 | 5.27 |
| TOLLIP | toll interacting protein | 1.08 | 9.03 | 7.21 | 1.45 |
| TOLLIP | toll interacting protein | 1.08 | 9.03 | 7.21 | 1.45 |
| MAPK1 | mitogen-activated protein kinase 1 | 1.50 | 2.69 | 6.40 | 3.53 |
| MAP3K7 | mitogen-activated protein kinase kinase kinase 7 | 4.33 | 4.40 | 6.02 | 2.77 |
| IRF5 | interferon regulatory factor 5 | 1.83 | 4.40 | 2.99 | 11.34 |
| IL1B | interleukin 1, beta | 0.76 | 2.60 | 1.17 | 5.48 |
| RIPK1 | receptor (TNFRSF)-interacting serine-threonine kinase 1 | 2.60 | 11.86 | 3.01 | 5.31 |
Disclaimer/Publisher’s Note: The statements, opinions and data contained in all publications are solely those of the individual author(s) and contributor(s) and not of MDPI and/or the editor(s). MDPI and/or the editor(s) disclaim responsibility for any injury to people or property resulting from any ideas, methods, instructions or products referred to in the content. |
© 2024 by the authors. Licensee MDPI, Basel, Switzerland. This article is an open access article distributed under the terms and conditions of the Creative Commons Attribution (CC BY) license (http://creativecommons.org/licenses/by/4.0/).
Copyright: This open access article is published under a Creative Commons CC BY 4.0 license, which permit the free download, distribution, and reuse, provided that the author and preprint are cited in any reuse.


