
Submitted:
31 March 2025
Posted:
01 April 2025
You are already at the latest version
Abstract
Prostate tumor heterogeneity questions the value of the widely used biomarker paradigm for cancer diagnostic and therapy. We hypothesize that each histopathologically distinct tissue region has an unrepeatable dynamic transcriptome organization. The hypothesis was validated by quantifying the transcriptomic topologies and interplay of the toll-like receptors and chemokine signaling pathways in point biopsies of three cancer nodules and surrounding normal tissue from a surgically removed cancerous prostate. Raw expression data was collected from publicly accessible GEO datasets, but the theory and associated mathematical algorithms can be applied to any gene expression datasets of at least four biological replicas of each condition/tissue region to be compared. Our analysis revealed that the deep cancer-related topology remodeling is different even between equally graded cancer nodules within the same tumor, indicating distinct molecular mechanisms of the immune response. Moreover, cancer reorganized the transcriptomic networks interconnecting the two pathways via their shared genes, inducing novel expression coordination while removing others. We also found that genes associated with the immune response have low commanding heights, explaining the limited effectiveness of anti-prostate cancer immunotherapies in treating prostate cancer to date. Our results indicate the necessity to personalize the anti-cancer therapy beyond individual patient to his/her cancer nodules.
Keywords:
cancer biomarkers
; chemokine signaling
; control of transcripts’ abundance
; CXCL14
; gene expression inter-coordination
; genomic fabric theory
; GNAI2
; toll-like receptor signaling
; tumor heterogeneity
; VAV2
1. Introduction
For decades, scientists tried to make sense of the enormous complexity of the malignant transformation of tissue by looking at certain gene biomarkers that in the case of prostate cancer can be collected from blood, urine, and tissue (e.g., [1,2]). As of March 1st, 2025, PubMed lists 49,009 publications related to prostate cancer biomarkers. It was (and still is) widely believed that the altered sequence (e.g., [3]), 3D configuration (e.g., [4]), or expression level (e.g., [5]) of one (or a few) critical gene(s) might command a particular form of cancer to everybody. Large spectrum of mutation types (e.g., [6]) and mechanisms of expression regulation (e.g., [7]) have been identified so far and included in publicly accessible databases like TCGA - The Cancer Genome Atlas [8] and NCI GDC Data Portal [9]. Gene biomarkers were allegedly identified through meta-analyses of sequence and/or expression data collected by several labs from large populations of individuals sharing common symptoms (e.g., [10]). For diagnostic purposes, several bioassays (e.g., [11,12] are now commercially available to detect substitutions, insertions, deletions, copy-number alterations, and intron regions causing gene rearrangements, while others (e.g., [13,14]) identify expression regulation of selected genes (“transcriptomic signature”, e.g., [15]).
However, despite being widely embraced by the scientific community, basing numerous generously funded research grants, and providing excellent business tools for industry, the biomarker hypothesis (BMH) is: 1) biologically false, 2) resulted and validated through noisy experiments with disputable statistical interpretation, and 3) has no value for both cancer diagnostic and treatment [16]. The predictive values of the alleged cancer test kits [10,11,12,13,14] are also disputable since the number of potential outcomes exceeds by far the human population on Earth [16].
BMH is biologically false because:
a. The biomarker is not the single gene affected (e.g., [17,18]. Together with the alleged biomarker mutation, unrepeatable dynamic combinations of 3+ mil mutations are present at any moment in every cell of the body. Most of these mutations (whose contribution is neglected without any proof that they are negligible) are randomly generated by the inherent stochastic nature of the chemical reactions involved in DNA replication. The same observation is also valid for the expression regulation: together with the alleged biomarker, hundreds other genes are significantly regulated in dynamic unrepeatable combination. Interestingly, the set of regulated genes is not only different among cancer-stricken individuals (e.g., [19]) but also among different cancer nodules in the same tumor (e.g., [20,21]).
b. The biomarker could not be the same for everybody even in apparently similar clinical conditions. In addition to race (e.g., [22,23]), sex (e.g., [24,25]) and age (e.g., [26,27]), it depends also on unrepeatable and dynamic personal features of the patient. Such unique combination of cancer modulating factor includes but it is not limited to: his/her personal and family medical history (e.g., [28,29]), diet (e.g., [30,31], exposure to stress [32,33], radiation [34,35,36], or carcinogens [37,38,39,40].
The 4.2 release (01/30/2025) of the GDC Data Portal [9] lists 2,940,240 consequential mutations affecting 22,534 genes in 44,736 studied cancer cases. Searching by primary sites (69 in total) reveals that: i) practically every gene was found as mutated (albeit in different ways) in at least one case of almost all cancer forms and ii) that in any cancer group, mutations of almost all genes were identified. These observations question the legitimate specificity of the biomarkers.
c. The biomarkers were identified by comparing the DNA-sequence or transcripts abundance with the genome and transcriptome of an abstract human, resulting from averaging the features of healthy-considered individuals. The initial standard human reference genome [41] was updated into human pangenomes (e.g., [42]), one version incorporating the genomes of 47 genetically diverse individuals [43]. Yet, the single valid reference is the normal tissue of the individual whose cancer is analyzed, a strategy already adopted by us (e.g., [20,21,44] and several other groups (e.g., [45,46,47,48], and incorporated in large databases of paired tumor-normal whole genome sequences [49]. Moreover, restoring what is normal for that individual and not for the abstract human reference should be the main purpose of any anti-cancer therapy.
d. In most cases, BMH used to design functional pathways (e.g., [50]) does not consider the internal structure in distinct zones of the investigated organ as described in histology atlases (e.g., [51]). It does not account also for never repeating genomic heterogeneity of tumors harboring several histopathologically distinct regions [52,53,54,55], presumably developed from independent malign clones, [56], immersed in the masse of the otherwise normal tissue. Neither GDC Data Portal [7], nor TCGA [6] say anything about what part of the tissue was profiled in each experiment and whether the tumors included in the databases had similar heterogeneities.
BMH was proposed and validated based on disputable meta-analyses of technically noisy experiments,
Any platform for DNA-sequencing, RNA-sequencing, microarrays, Expression BeadChips, and Affymetrix, is affected by 30-40% technical noise, regardless of the technology and wet protocol used. The technical noise can be determined by comparing sequences and expressions in technical replicas of the samples. However, because of highcosts of genomics experiments, very few investigators determined the technical noise of their method before starting the experiments (we did). Moreover, one should also consider the possible human errors and the differences among platforms, labs and protocols used to generate the databases.
BMH was allegedly “validated” in engineered (knockouts/haploinsufficient e.g., [57]) or engrafted [58]) animal models and human cell cultures like: DU145 (e.g., [59]), LNCaP (e.g., [60]), or PC3 (e.g., [61]) for prostate cancer. However, besides being not human, manipulation of a gene in an engineered animal model has ripple effects on many other genes whose contribution is neglected without evidence that they are negligible. Introducing human cancer cells into the tissue of an animal triggers the immune response that changes the microenvironment of the inserted cells, with direct genomic consequences. Moreover, in a homo-cellular culture, cancer cells lack interaction with other cell types, with significant consequences for their transcriptomes, as proved by us by comparing the expression profiles of astrocytes and oligodendrocytes in separate cultures and co-cultured in insert systems [62,63].
BMH resulted from meta-analyses comparing large populations of healthy and cancer-affected populations, showing that the average biomarker expression in a cancer population is significantly different from that in reference population. However, it does not mean that the two distributions do not overlap, so with respect to that biomarker, an individual human might be in both populations [16]. Moreover, in order to keep the statistical significance through large number of individuals, in most analyses the considered populations were not stratified as race, sex, age group, hormonal activity and other important favoring factors.
BMH has little value for cancer gene therapy
Biomarkers are selected from the most frequently altered genes in humans presenting similar cancer phenotypes. The frequent alteration means that their sequence, configuration, and/or expression level are less protected by the cellular homeostatic mechanisms, as for the minor players in the cell life. Therefore, we speculate that restoration to their normal state pursued by targeted gene therapies may be of little consequence [16].
2. Working Hypothesis and Theory
In contrast to BMH, our Genomic Fabric Hypothesis (GFH) states that: each histopathologically distinct region of a tissue has unrepeatable and dynamic transcriptome organization. If true, GFH would imply that the altered molecular structure of no gene (or a fixed subset of a few genes) is solely responsible for a particular type of malignization in everybody and that any cancer phenotype is compatible with a wide spectrum of transcriptomic topologies.
To test GFH, we developed the Genomic Fabric Theory (GFT) that fully characterizes the transcriptome by the gene expression profile, control of transcripts’ abundances and gene clustering in statistically significant transcriptomic networks. GFT is suitable to analyze transcriptomic experiments performed with any platform on 4 or more biological replicas to get statistically significant results, albeit more than 4 replicas do not increase the accuracy because of the inherent technical noise. GFT attaches three independent features to every properly quantified gene “i” in a particular condition or tumor region “c”: AVE (average expression level of all spots redundantly probing the same gene across biological replicas), REC (relative expression control) and COR (expression correlation with each other gene “j” in that condition).
AVE is normalized to the median gene expression in that condition:
where: is the net fluorescence (background subtracted foreground) of spot probing that gene in replica k (=1,2,3,4) of region c, is the net fluorescence of the median gene and is the average net fluorescence over all biological replicas of the same region.
REC is computed using the midinterval of the χ2 distribution of the coefficient of variation of the normalized expression level across biological replicas:
Positive REC’s indicate stricter expression control while negative values indicate looser control with respect to that of the median gene in the profiled region. It is natural to assume that genes critical for the cell phenotype expression, survival, and proliferation are subjected to a stricter control of their expression levels, while those used for addapting the environmental changes are allowed to fluctuate.
COR is the pair-wise Pearson correlation coefficient of the (log2) of the normalized expression levels of the two genes:
As recently proved [21], given the technical noise of the transcriptomic technologies, the con-figuration function of the transcriptome (defined by the gene clusters) is satisfactorily approximated with the set of all possible pair-wise correlations among gene expressions in biological replicas.
In the case of four biological replicas, there are three statistically significant types of expression correlation:
i). 1 ≥ COR ≥ 0.95, synergistic expression (i.e., expressions of both genes fluctuate synchronously across biological replicas);
ii). -0.95 ≥ COR ≥ -1, antagonistic expression (i.e., expressions of the two genes fluctuate in antiphase (when one is up, the other is down) across biological replicas);
iii). |COR| <0.05, independent expressions (i.e., expression change of one gene has no consequences for the other one).
COORD = percentage of synergistically expressed gene pairs plus percentage of antagonistically expressed pairs minus percentage of independently expressed genes within the analyzed pathways. Together, the percentage of synergistically expressed gene pairs and the percentage of antagonistically expressed pairs indicate how much coupled (i.e., influencing each-others expression) the genes are in the functional pathway.
The three independent features of individual gene expression are complemented with the derived characteristic GCH – gene commanding height:
GCH is used to hierarchize the genes according to their expression control and coordination with expression with other genes. We assumed and verified [44,64] that manipulation of genes with higher GCH has larger consequences on the transcriptome, the top gene, named Gene Master Regulator (GMR) being the most influential, whose silence might be lethal for the cell.
Expression of a gene is considered significantly regulated in a cancer nodule with respect to the normal surrounding tissue of the tumor if it satisfies the composite criterion of the absolute fold-change “x” exceeding the cut-off “CUT” and the less than 0.05 p-value of the heteroscedastic t- test of means’ equality. “CUT” is computed for each gene to account for the combined effects of the technical noise of the used platform and the variability across the biological replicates:
3. Method of Validation
3.1. Genomic Data
We tested our hypothesis on the KEGG-constructed pathways TLR (toll-like receptor signaling [65]) and CHS (chemokine signaling, [66]) in three cancer nodules (denoted as “A”, “B”, “C”) and the surrounding normal tissue (“N”) isolated from a surgically removed prostate tumor.
The 50g tumor, covering 90% of the prostate, was collected through robotic--assisted radical prostatectomy from a 65y old black man whose adenocarcinoma invaded the bilateral seminal vesicles. The dominant nodule “A”, located in the left posterior quadrant from the apex to the base, received the total Gleason score of 9/10 (4 + 5), while the secondary nodules “B” and “C”, located mid gland, were equally graded 8/10 (4 + 4). The apical, bladder base, and peripheral margins of the excision were negative for adenocarcinoma and were used as reference tissue “N”. Point biopsies from the “A”, “B”, “C” and “N” regions were split into four biological replicas and the total RNA from each was extracted and hybridized with Agilent-026652 Whole Human Genome Microarray 4x44K v2 [67]. The experiments were carried out in Iacobas’ lab using its optimized wet protocol and the associated high-quality standards. The expression results and procedure description were deposited in the publicly available Gene Expression Omnibus (GEO) database [68]. The present report complements two previously published works on this and another tumor as well as on the standard LNCaP and DU145 cell lines [20,69].
3.2. Rationale
Toll-like receptors are a key family of pattern-recognition receptors in the innate immune system and play a fundamental role in host defenses [70]. The activation of TLR signaling pathways prevents not only pathogen infection by recognizing pathogen-associated molecular patterns (PAMPs) [71] but also cancer by recognizing dangerous endogenous damage-associated molecular patterns (DAMPs) [72]. Once TLRs recognize their ligands, an intracellular signaling cascade is triggered to activate master transcriptional factors including NF-κB and IRFs to induce pro-inflammatory cytokines, upregulate costimulatory molecules, and secrete interferons [73]. These activations control tumor immune microenvironments and affect T-cell anti-tumor activity.
Prostate cancer (PCa) is the most common cancer in men worldwide [74]. Although most PCa in early stages can be managed by hormone therapies, some of them inevitably will become hormone deprivation-resistant, metastatic, and deadly, a condition known as metastatic castration-resistant PCa (mCRPC). Patients with mCRPC often fail to respond to current treatments, including cancer immunotherapy. We recently found that prostate cancer cells express a repertoire of TLRs and activation of TLR5 by the bacterial protein flagellin, a known TLR5 agonist, induces robust anti-tumor immune responses along with NF-κB activation in prostate cancer [75].
The present analysis provides insight into the transcriptomic behavior of prostate cancer cells and innate and adaptive immunities. Understanding the remodeling of the TLR might provide a new strategy for developing novel personalized gene therapies for this malignancy [76], including the use of TLR agonists [77].
4. Results
135 out of 191 CHS and 76 out of 109 TLR KEGG-identified genes were profiled and analyzed in this report. Transcripts of missing genes were either not probed by the used Agilent microarray platform, or their amount was below the detectable limit (i.e., yielding a foreground fluorescence signal less than twice the background in the hybridized spot), or were hybridized to microarray spots with either corrupted or saturated pixels in at least one sample. The analyzed pathways share 33 genes, out of which we quantified 28: AKT1/2/3, CCL3/3L3, CCL4L2, CCL5, CHUK, CXCL9/10/11, IKBKB/G, MAP2K1, MAPK1/10, NFKB1, NFKBIA, PIK3CA/B/D, PIK3R1/2/3, RAC1, RELA, STAT1/2.
4.1. The Three CHS and TLR Genes with the Highest Expression Level (Largest AVE)
We began by identifying the top three genes with the highest average expression level (AVE) in three prostate cancer nodules (A, B, C) and the surrounding normal tissue (N) (Table 1, expression ratios with respect to the normal tissue in Table S1 from the Supplementary Materials).
In the surrounding normal tissue “N”, the top three CHS genes were GNAI2, RAC3, and STAT2 (common to both pathways). Interestingly, GNAI2 and STAT2 were also expressed at levels close to the normal one (no significant regulation) in the cancer nodules, suggesting their important roles in the immune response in the entire prostate tissue regardless of the regional malignization degree.
However, expression of RAC3, a recognized biomarker of the prostate cancer [78], was lower in all three cancer nodules compared to the normal tissue (expression ratios: x(A vs N) = -2.11; x(B vs N) = -1.51, x(C vs N) = -1.35), indicating that RAC3 down-regulation may contribute to decreased cell proliferation, migration, and invasion in prostate cancer [79]. Our result about RAC3 down-regulation, albeit not substantial, contradicts (for this patient) meta-analyses reports about the overall up-regulation of this gene in prostate cancer (e.g., [80,81], questioning the BMH validity.
Among the CHS genes, CXCL14 (positive fold-changes with respect to the normal tissue: x(A vs N) = 6.69; x(B vs N) = 7.17, x(C vs N) = 4.58) and NFKBIA (x(A vs N) = 2.23; x(B vs N) = 2.90, x(C vs N) = 1.60) had high expression levels in all three cancer nodules but not in the surrounding normal tissue. The up-regulation of these genes underscores their important roles in prostate cancer development [82,83]. In the analysis of TLR genes, IRF7 was also highly expressed in all three cancer nodules (although twice more in B than in C) but not in the surrounding normal tissue (expression ratios: x(A vs N) = 3.02; x(B vs N) = 4.15, x(C vs N) = 2.05).
4.2. The Three Most Controlled CHS and TLR Genes in Each Profiled Region
The REC analysis identifies the most critical CHS and TLR genes for cell survival and phenotypic expression in the cancer nodules “A”, “B”, “C”, and the normal tissue “N”. Table 2 presents the REC values (formula 2) of the top three genes in each profiled region. The fold-changes (negative for down-regulation) of the Relative Control Strength (formula A4) in the cancer nodules with respect to “N” are presented in Table S2 from the Supplementary Materials.
Within the CHS pathway, the most controlled genes (highest positive REC values) in the cancer nodules were: GNB1 (“A”), MAPK1 (“B”) and CCL16 (“C”). According to the FC scores, each of these genes had an impressive increase of the control strength with respect to the normal tissue in one nodule but not in the other two. Thus, GNB1 had:
FC(A vs N) = 23.99, FC(B vs N) = 1.38, FC(C vs N) = 2.04, MAPK1 had: FC(A vs N) = 2.14, FC(B vs N) = 9.92, FC(C vs N) = 2.07, while CCL16 had: FC(A vs N) = -1.11, FC(B vs N) = 2.08, FC(C vs N) = 9.53. Interstingly, GNB1 was reported to have a role in promoting malignancy in colon [84]. The high control of MAPK1 justifies its identification as a core target in the quercetin treatment of the prostate cancer [85], while CCL16 is a pro-tumor chemokine in hepatocellular carcinoma [86].
The situation is similar within the TLR pathway where the most controlled gene in one cancer nodule had lower fold-change increases in the other nodules. Thus, TYK2, part of an 8-gene prognostic model in pancreatic cancer [87], had FC(A vs N) = 27.98, FC(B vs N) = 6.05, FC(C vs N) = 1.11. TOLLIP, a predictor of renal cell carcinoma [88], had: FC(A vs N) = 5.07, FC(B vs N) = 13.19, FC(C vs N) = -1.10, (more control in “B” but even less control in “C” than in “N”). IRF5, a significant gene in digestive cancers [89], had: FC(A vs N) = 2.19, FC(B vs N) = 1.45, FC(C vs N) = 6.82.
On the opposite side, the control strength of the top three CHS genes in “N” exhibited a substantial reduction in each of the three cancer nodules. Thus, the control strength of the top CHS gene, CCL15, predomintly expressed in hepatocellular carcinoma [90], was reduced by: FC(A vs N) = -25.22, FC(B vs N) = -5.21, FC(C vs N) = -6.29. The control strength of VAV2, involved in metastasis proliferation [91], was reduced by: FC(A vs N) = -8.23,
FC(B vs N) = -7.91. The control strength of KRAS, whose mutation might trigger lung cancer [92], decreased by FC(A vs N) = -3.29, FC(B vs N) = -6.66 and FC(C vs N) = -2.60. Although less impressive, the control strength of the top TLR genes was also reduced in the cancer nodules. Thus, PIK3R1, whose mutations are linked to metastatic castration-sensitive prostate cancer [93] had FC(A vs N) = -3.49, TBK1, an activator of prostate cancer dormancy [94], had FC(B vs N) = -3.12, FC(C vs N) = -2.45, while PIK3CA, part of the active axis PI3K/Akt/mTOR in prostate cancer [95], had: FC(A vs N) = -1.60, FC(B vs N) = -2.29, FC(C vs N) = -3.04.
4.3. The three least controlled CHS and TLR genes in each profiled region
The REC analysis also identified the CHS and TLR genes whose loose expression control (largest negative REC values) makes them suitable as adaptation vectors to environmental change. Table 3 presents the three least controlled genes in each profiled region, while Table S3 from the Supplementary Materials presents the fold-changes of the control strength with respect to “N”.
Interestingly, CCL19, a protective factor for prostate cancer [96], negatively controlled in “N”, was the least controlled in the equally graded nodules “B” and “C”, but not in “A”. Within the TLR pathway, the least controlled genes in nodules “A” (TICAM2) and “B” (CXCL11) had also relaxed control in the normal tissue. Since the least controlled genes might be used by the cell as adaptation vectors to accommodate various local environmental conditions (as in biological replicates), these results indicate that the transcriptomic molecular machinery might be adjusted in various ways to respond the environmental challenges.
In summary, the above REC analyses revealed that i) cancer alters the gene expression homeostatic controlling mechanisms and ii) the alterations are not uniform across the tumor but clone-dependent.
4.4. Regulation of the TLR-Signaling Pathway in the Cancer Nodules
Figure 1 presents the statistically significant regulation of the genes included in the KEGG-determined Toll-like receptor signaling pathway [65] in the cancer nodules “A”, “B” and “C” with respect to the surrounding normal tissue “N”. Of note is that even the equally graded cancer nodules “B” and “C” from the same tumor exhibit differences in the gene expression regulation, proving the transcriptomic uniqueness of the cancer nodules. Thus, out of the 76 quantified genes, 17 (22.37%) were up- and 10 (13.16%) were down-regulated in “B”, while 13 (17.11%) were up- and 4 (5.26%) were down-regulated in “C”. Nodule “A” presented 20 (26.32%) up- and 9 (11.84%) down-regulated genes. Although the significant regulation profiles were different among the three cancer nodules, no TLR gene was oppositely regulated in two nodules. Interesting, CTSK, a promoter of the cancer cell proliferation [97] and CD14, involved in tumor development [98], were upregulated in all cancer nodules.
4.5. Regulation of the Chemokine Signaling (CHS) Pathway
Figure 2 presents the statistically significant regulation of the genes included in the KEGG-determined chemokine signaling pathway [66] in the cancer nodules “A”, “B” and “C” with respect to the surrounding normal tissue “N”. Yellow background of the gene symbols in Figure 1 and Figure 2 does not mean that expression level did not change in the cancer nodules with respect to the normal tissue but that the change was not statistically significant from the perspective of our composite criterion (equations 6 - 8).
Of note is that even the equally graded cancer nodules “B” and “C” from the same tumor exhibit differences in the gene expression regulation, proving the tumor transcriptomic heterogeneity. Thus, out of the 135 quantified genes in this pathway, 24 (17.78%) were up- and 21 (15.56%) were down-regulated in “B”, while 25 (18.52%) were up- and 8 (5.93%) were down-regulated in “C”. Nodule “A” presented 32 (23.70%) up- and 20 (14.81%) down-regulated genes. Although the significant regulation profiles were different among the three cancer nodules, no CHS gene was oppositely regulated in two nodules.
4.6. Remodeling of the TLR-CHS Interplay
4.6.1. Significant Expression Coordination
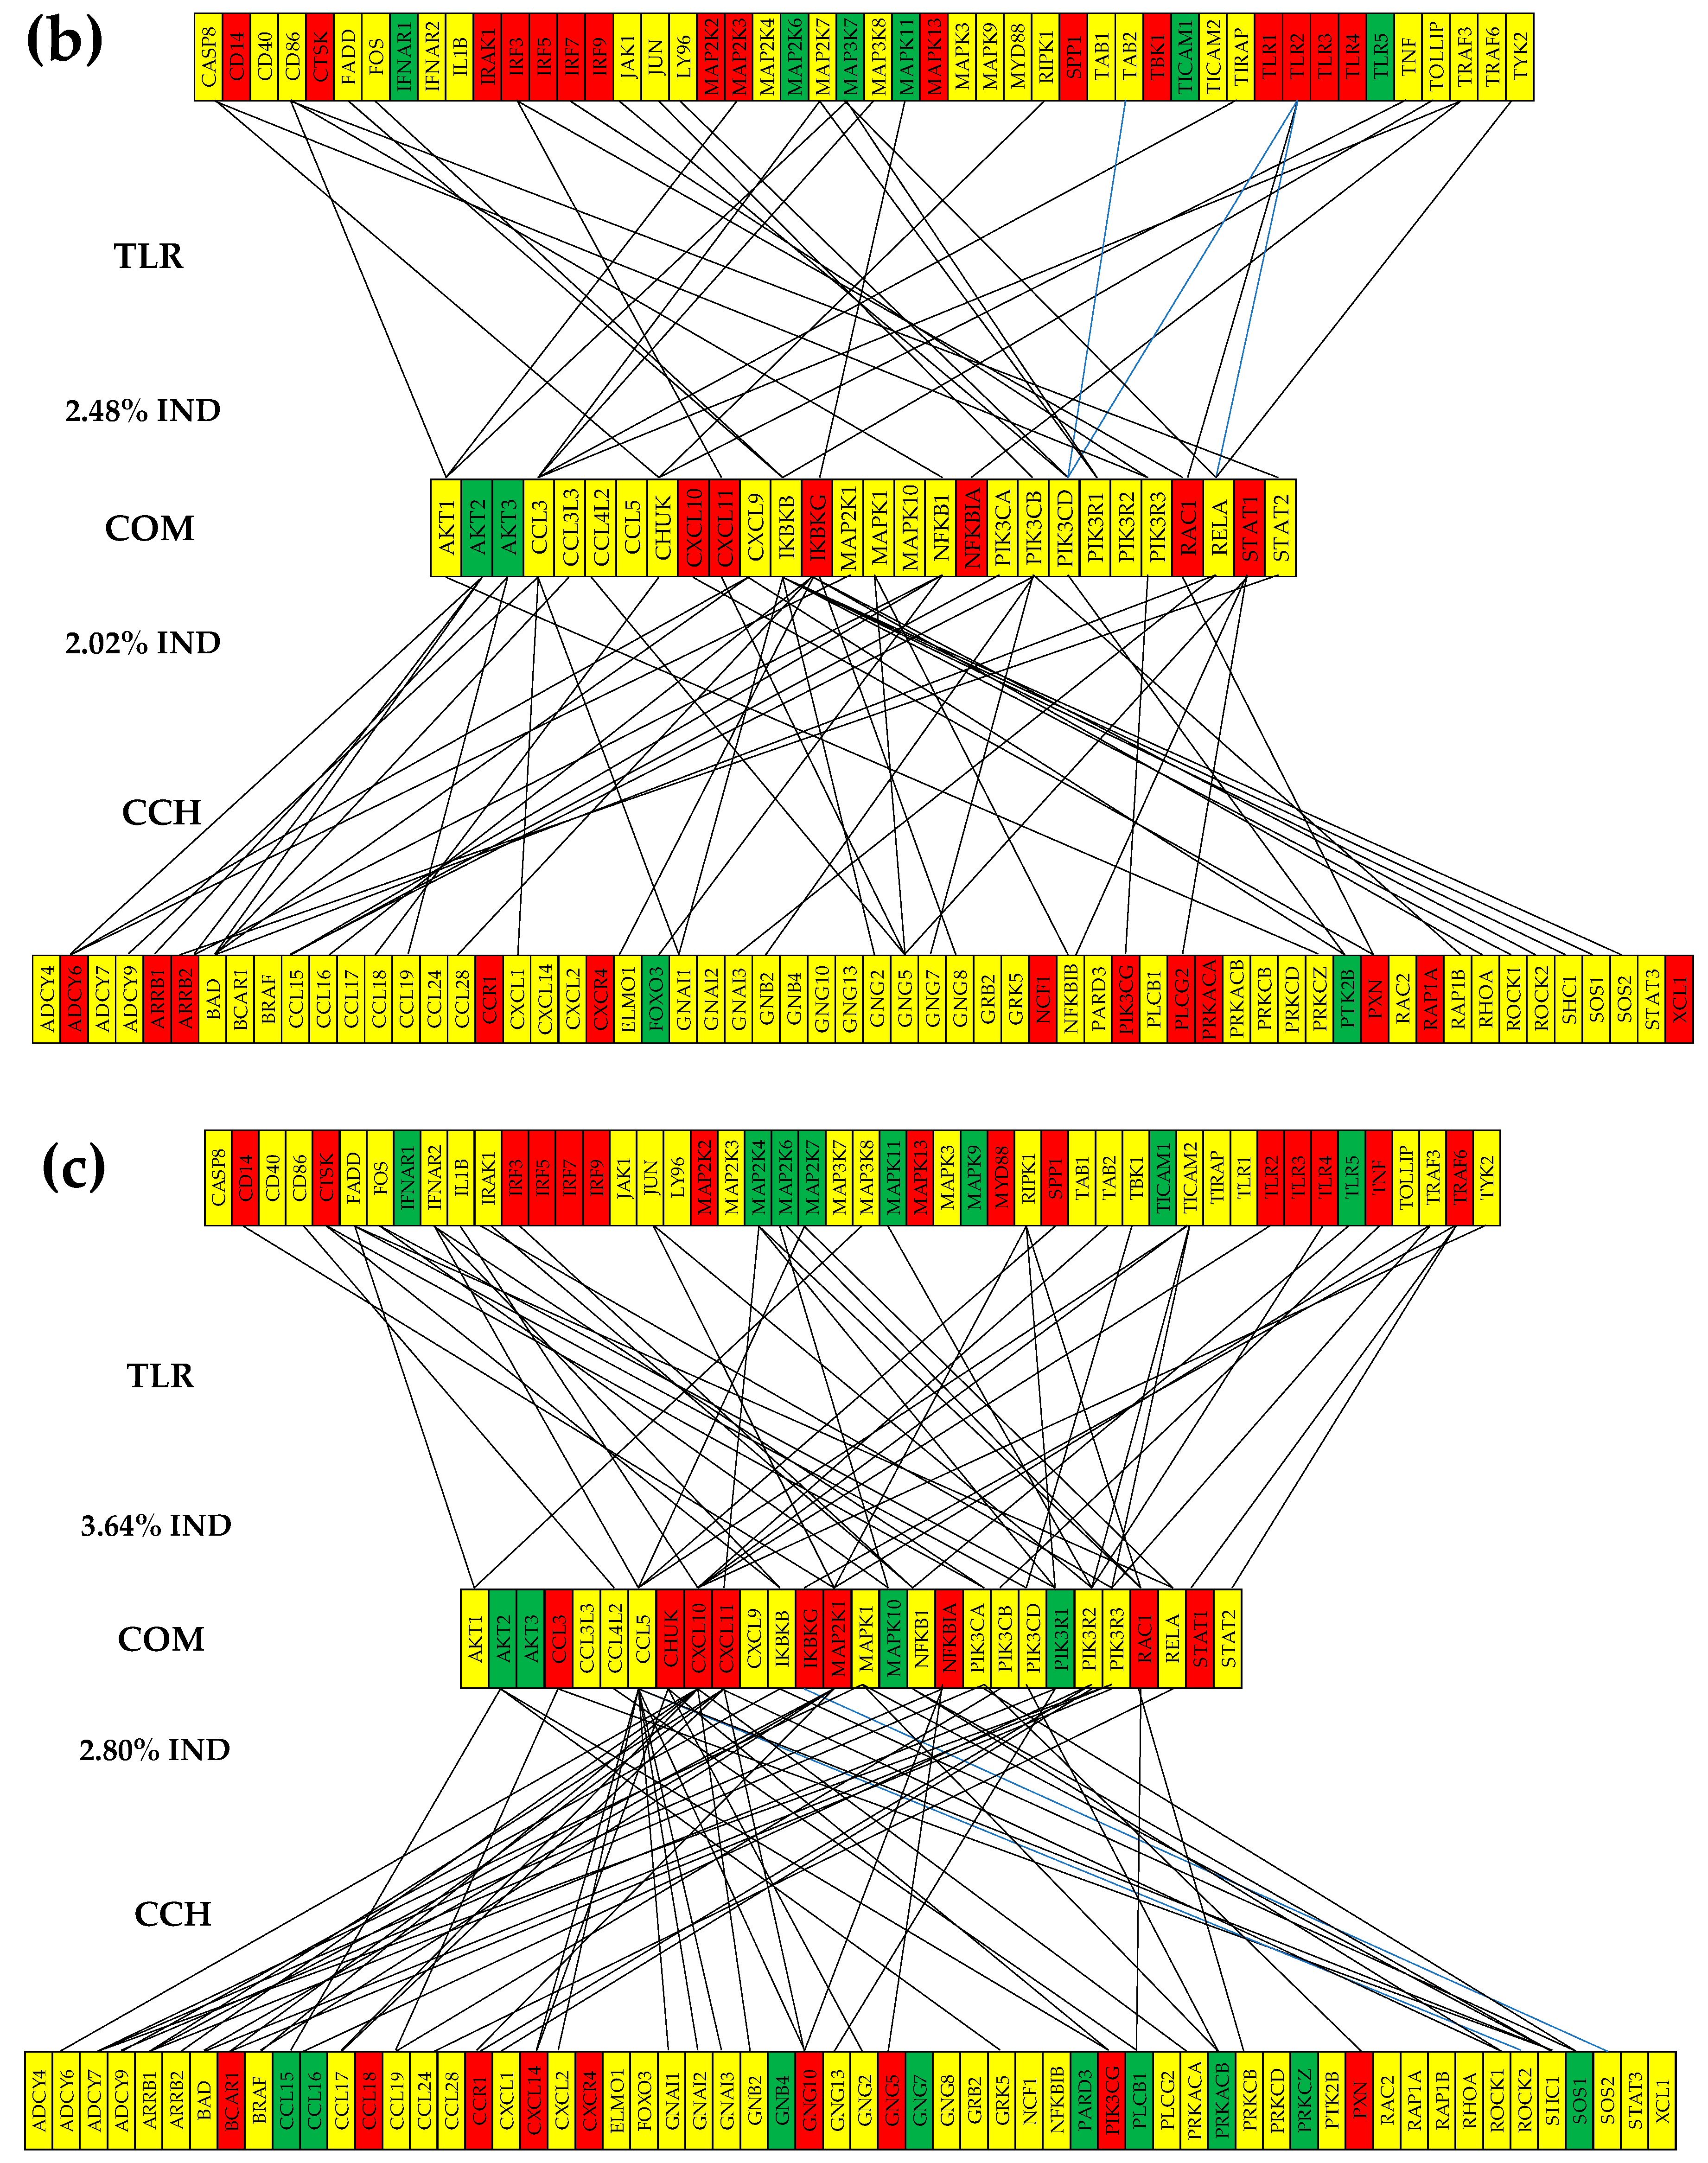
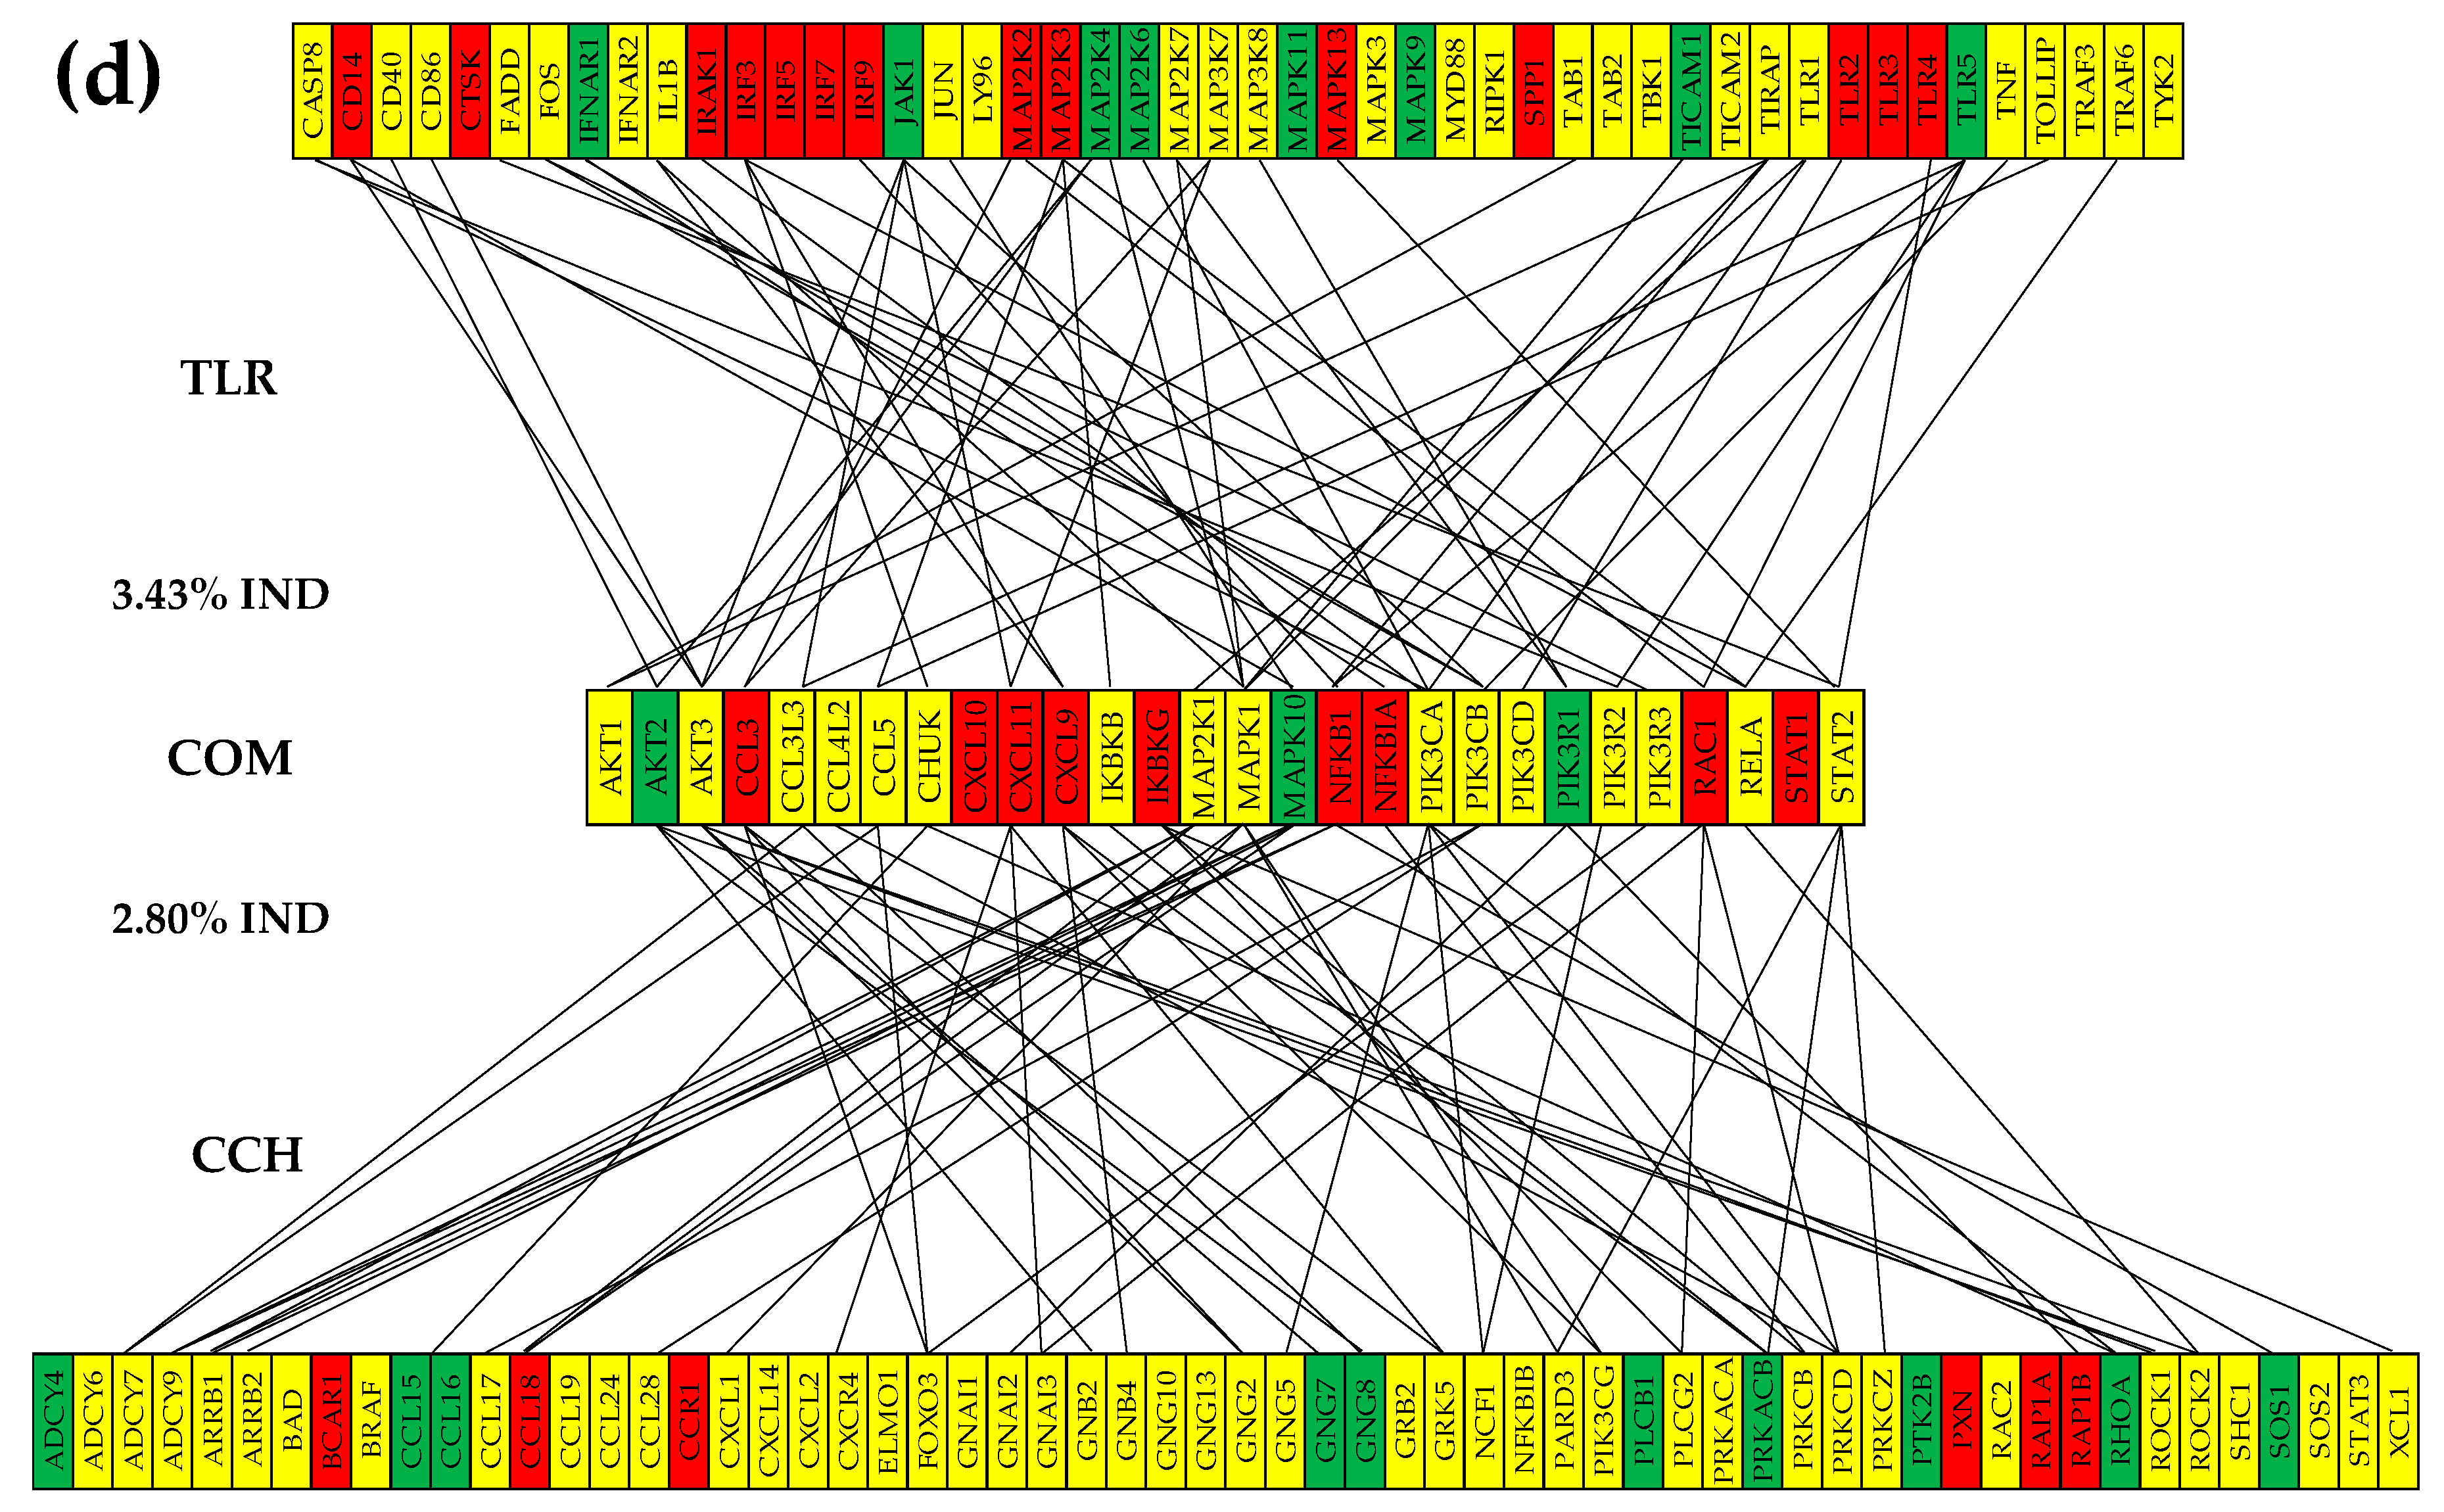
Figure 3 presents the (p < 0.05) statistically significant positive (i.e., synergistic) and negative (antagonistic) expression coordination of the TLR-signaling pathway genes with the CHS signaling pathway genes through the 28 shared genes in the surrounding normal prostate tissue “N” (a) and the three cancer nodules. Of note are the significant increases of the coordination scores (COORD) from 1.09% and 2.50% in N to 8.97% and 13.51% in “A”, 4.52% and 6.79% in “B”, and 3.43% and 6.73% in “C”. It is also important to observe the substantial differences among the cancer nodules even when they were collected from the same tumor and “B” and “C” were equally graded. The coordination differences indicate that cancer-triggered remodeling of the TLR-CHS transcriptomic interplay is dependent on the local, never exactly repeating conditions.
Figure 3.
The (p < 0.05) statistically significant positive (i.e., synergistic) and negative (antagonistic) expression coordination of the TLR-signaling pathway genes with the CHS signaling pathway genes through the 28 shared genes in the surrounding normal prostate tissue “N” (a) and the three cancer nodules.
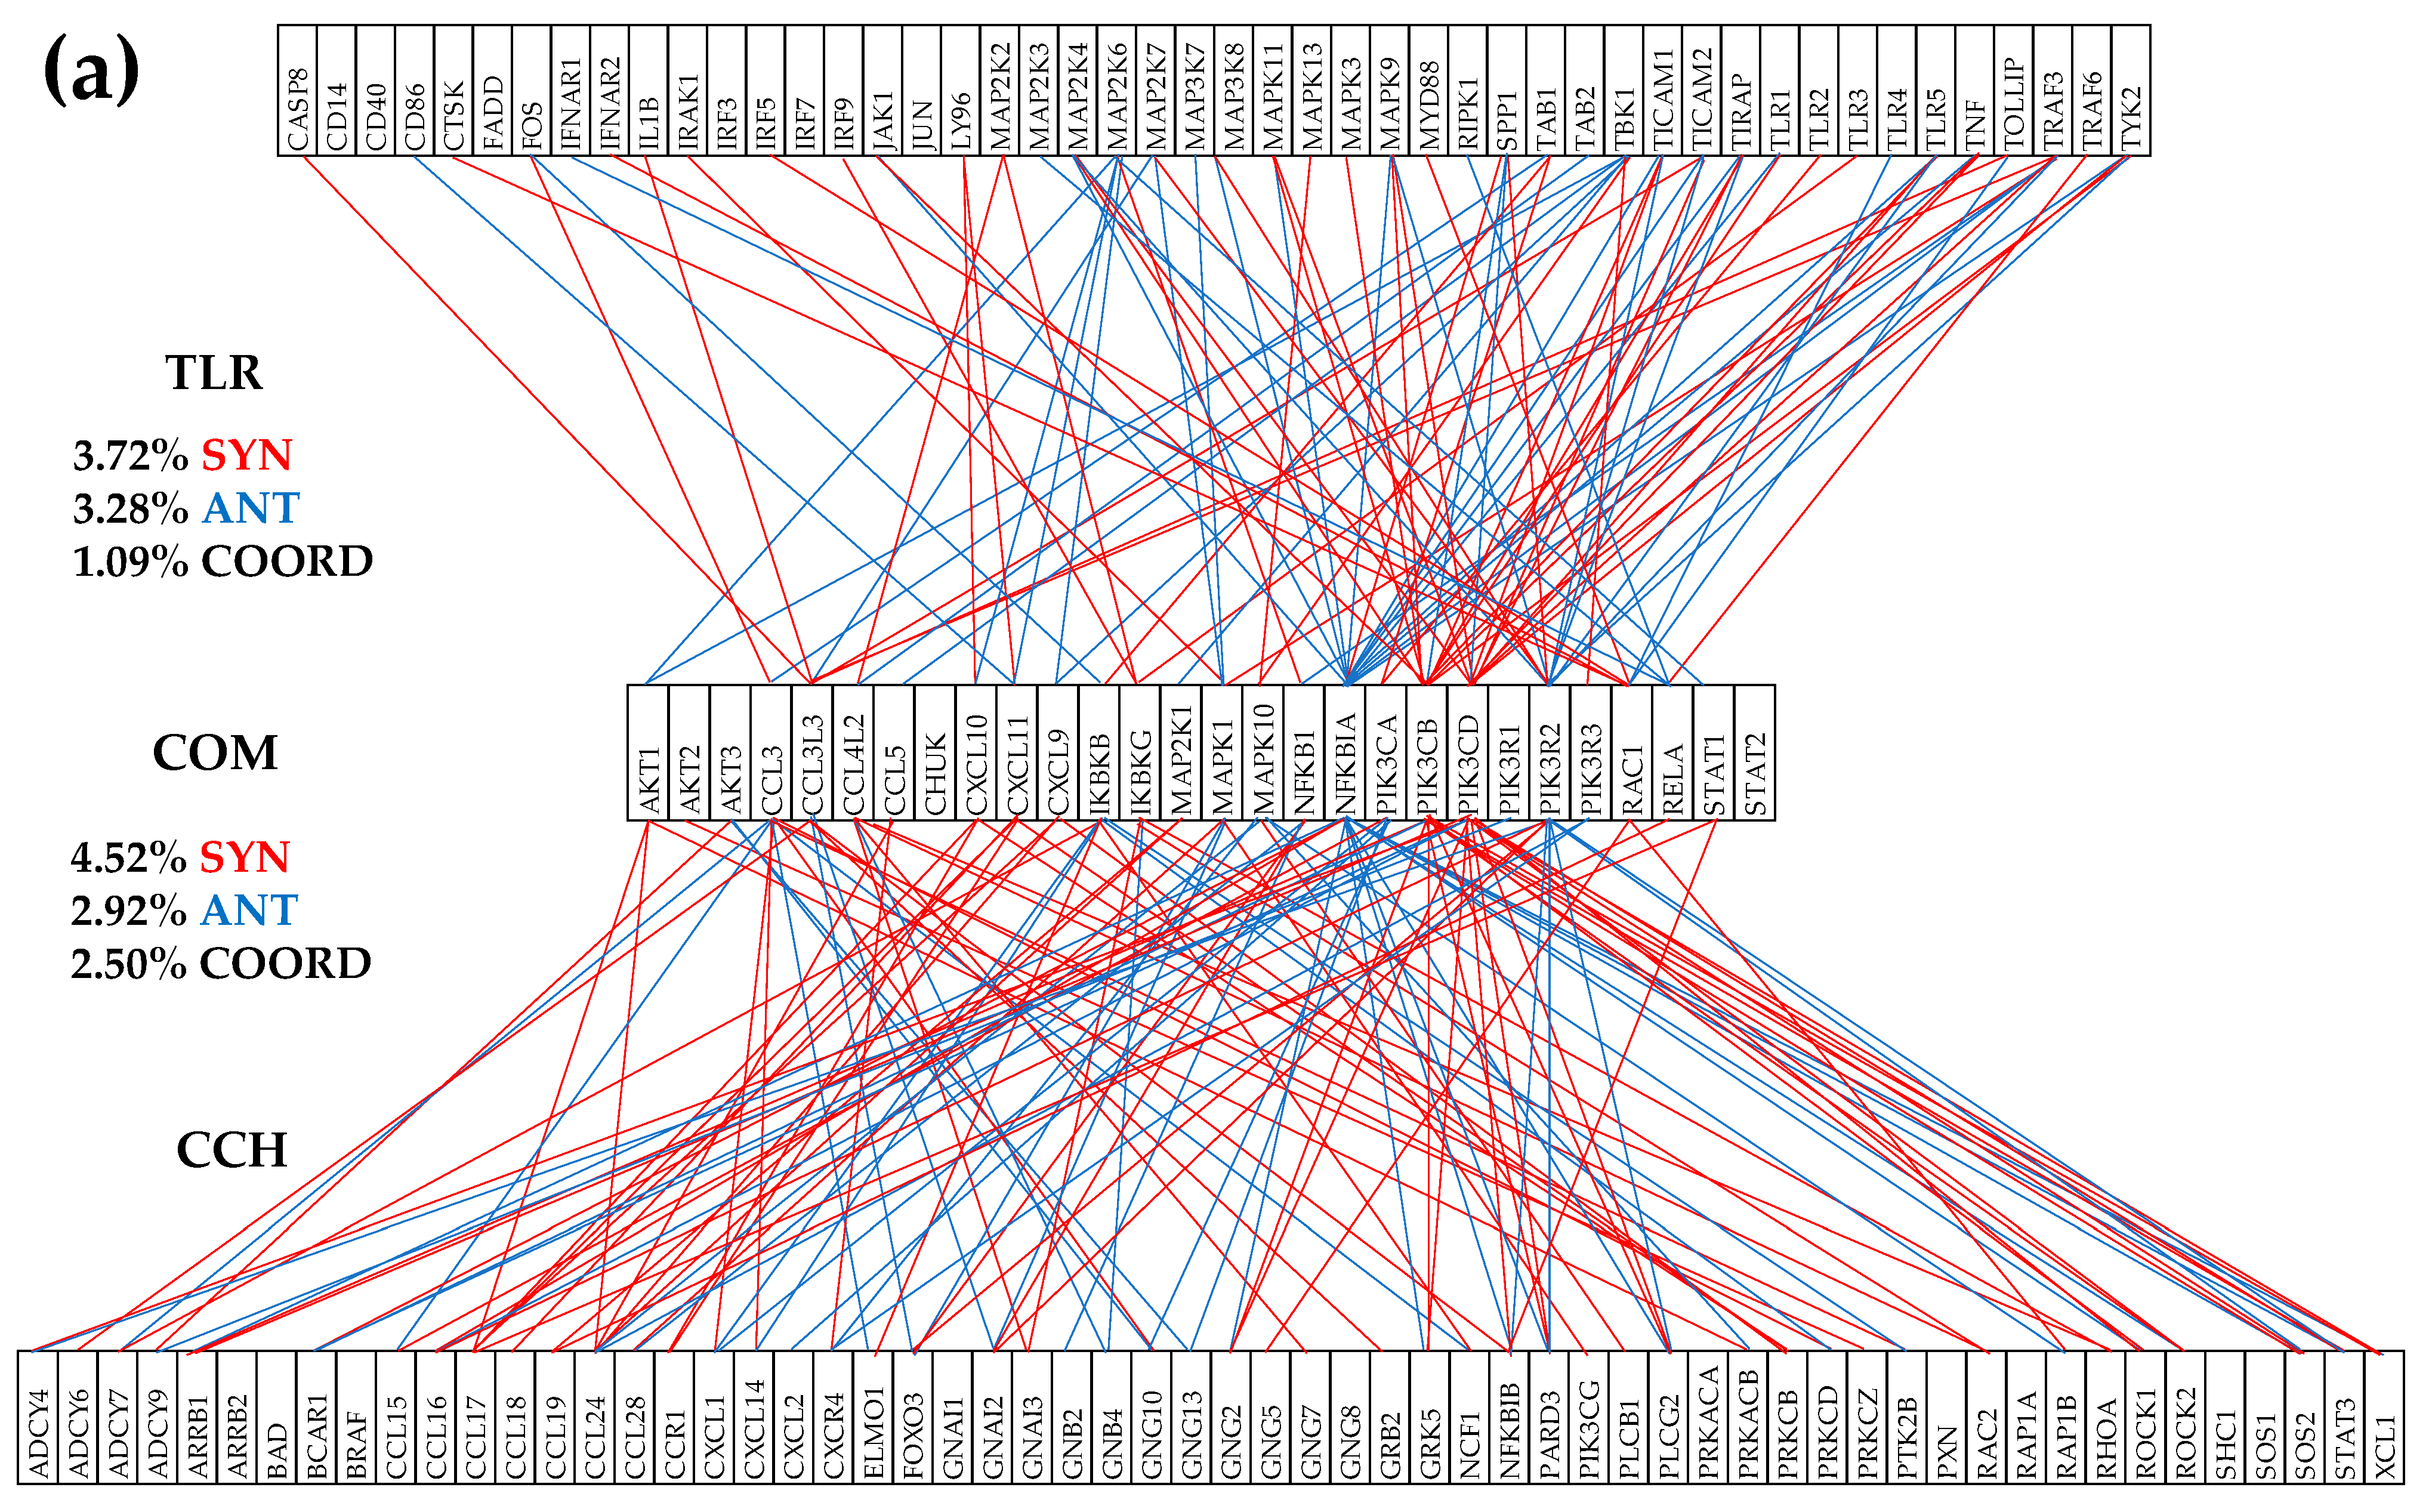
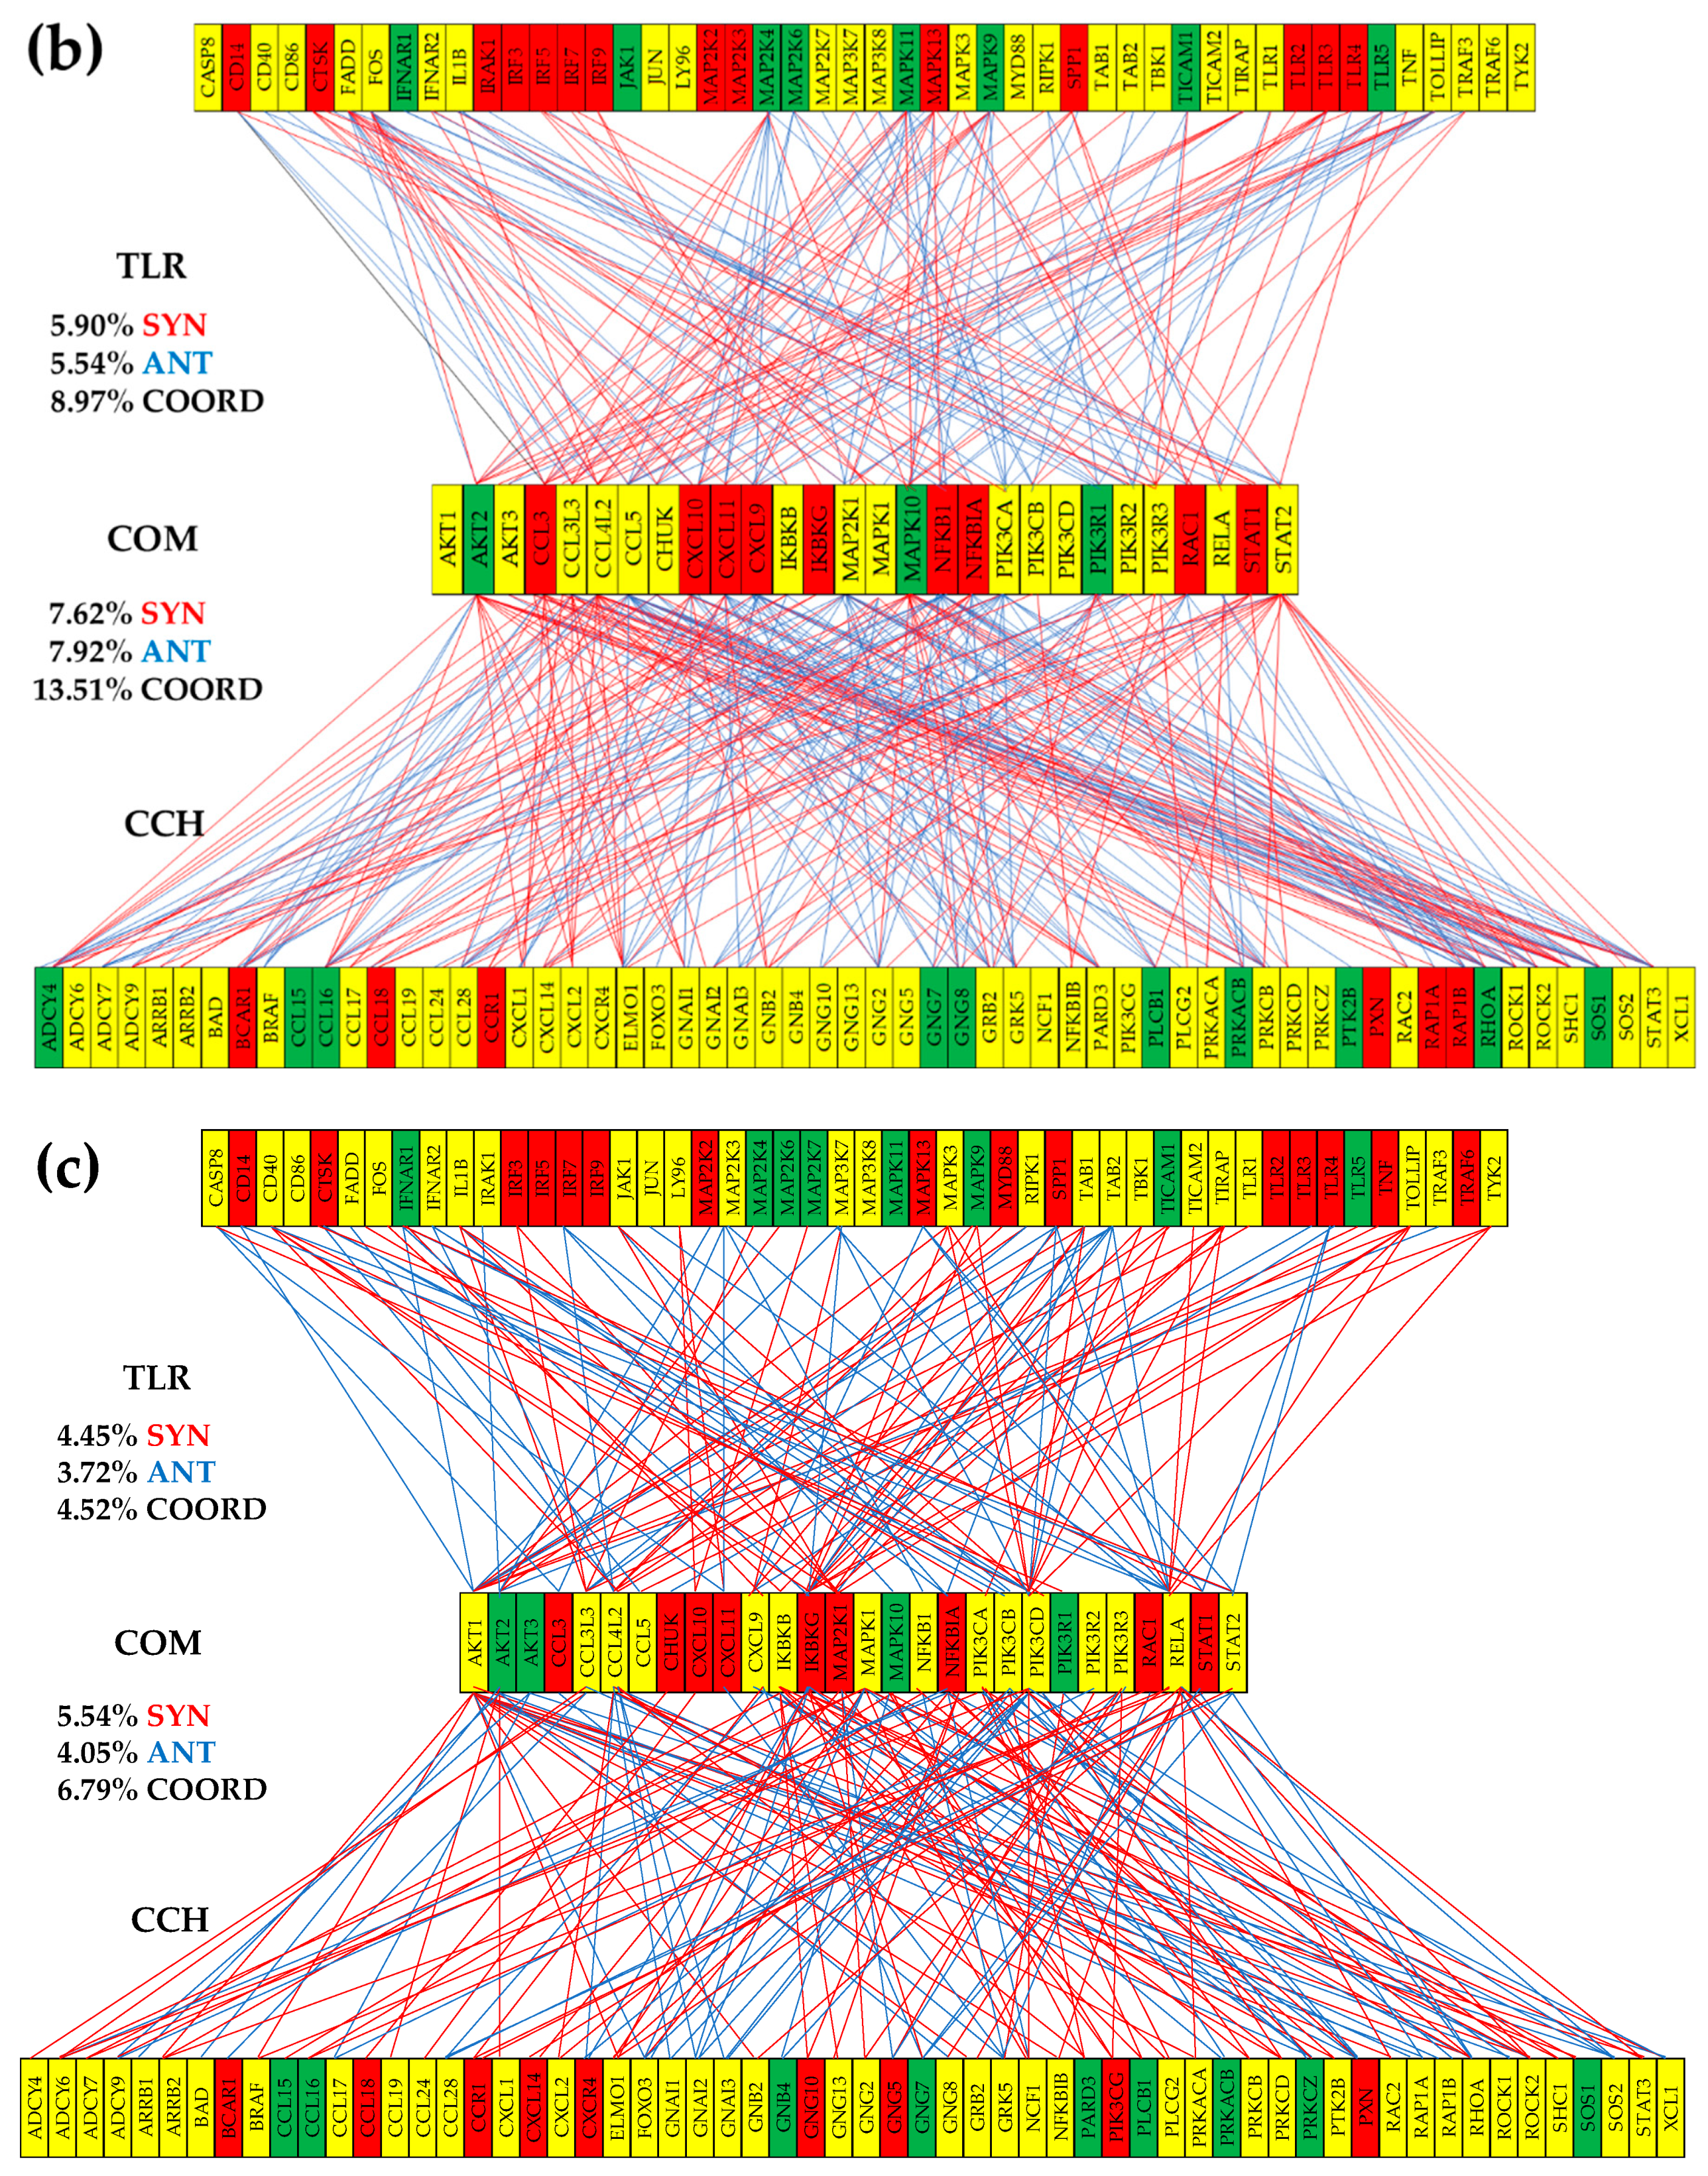
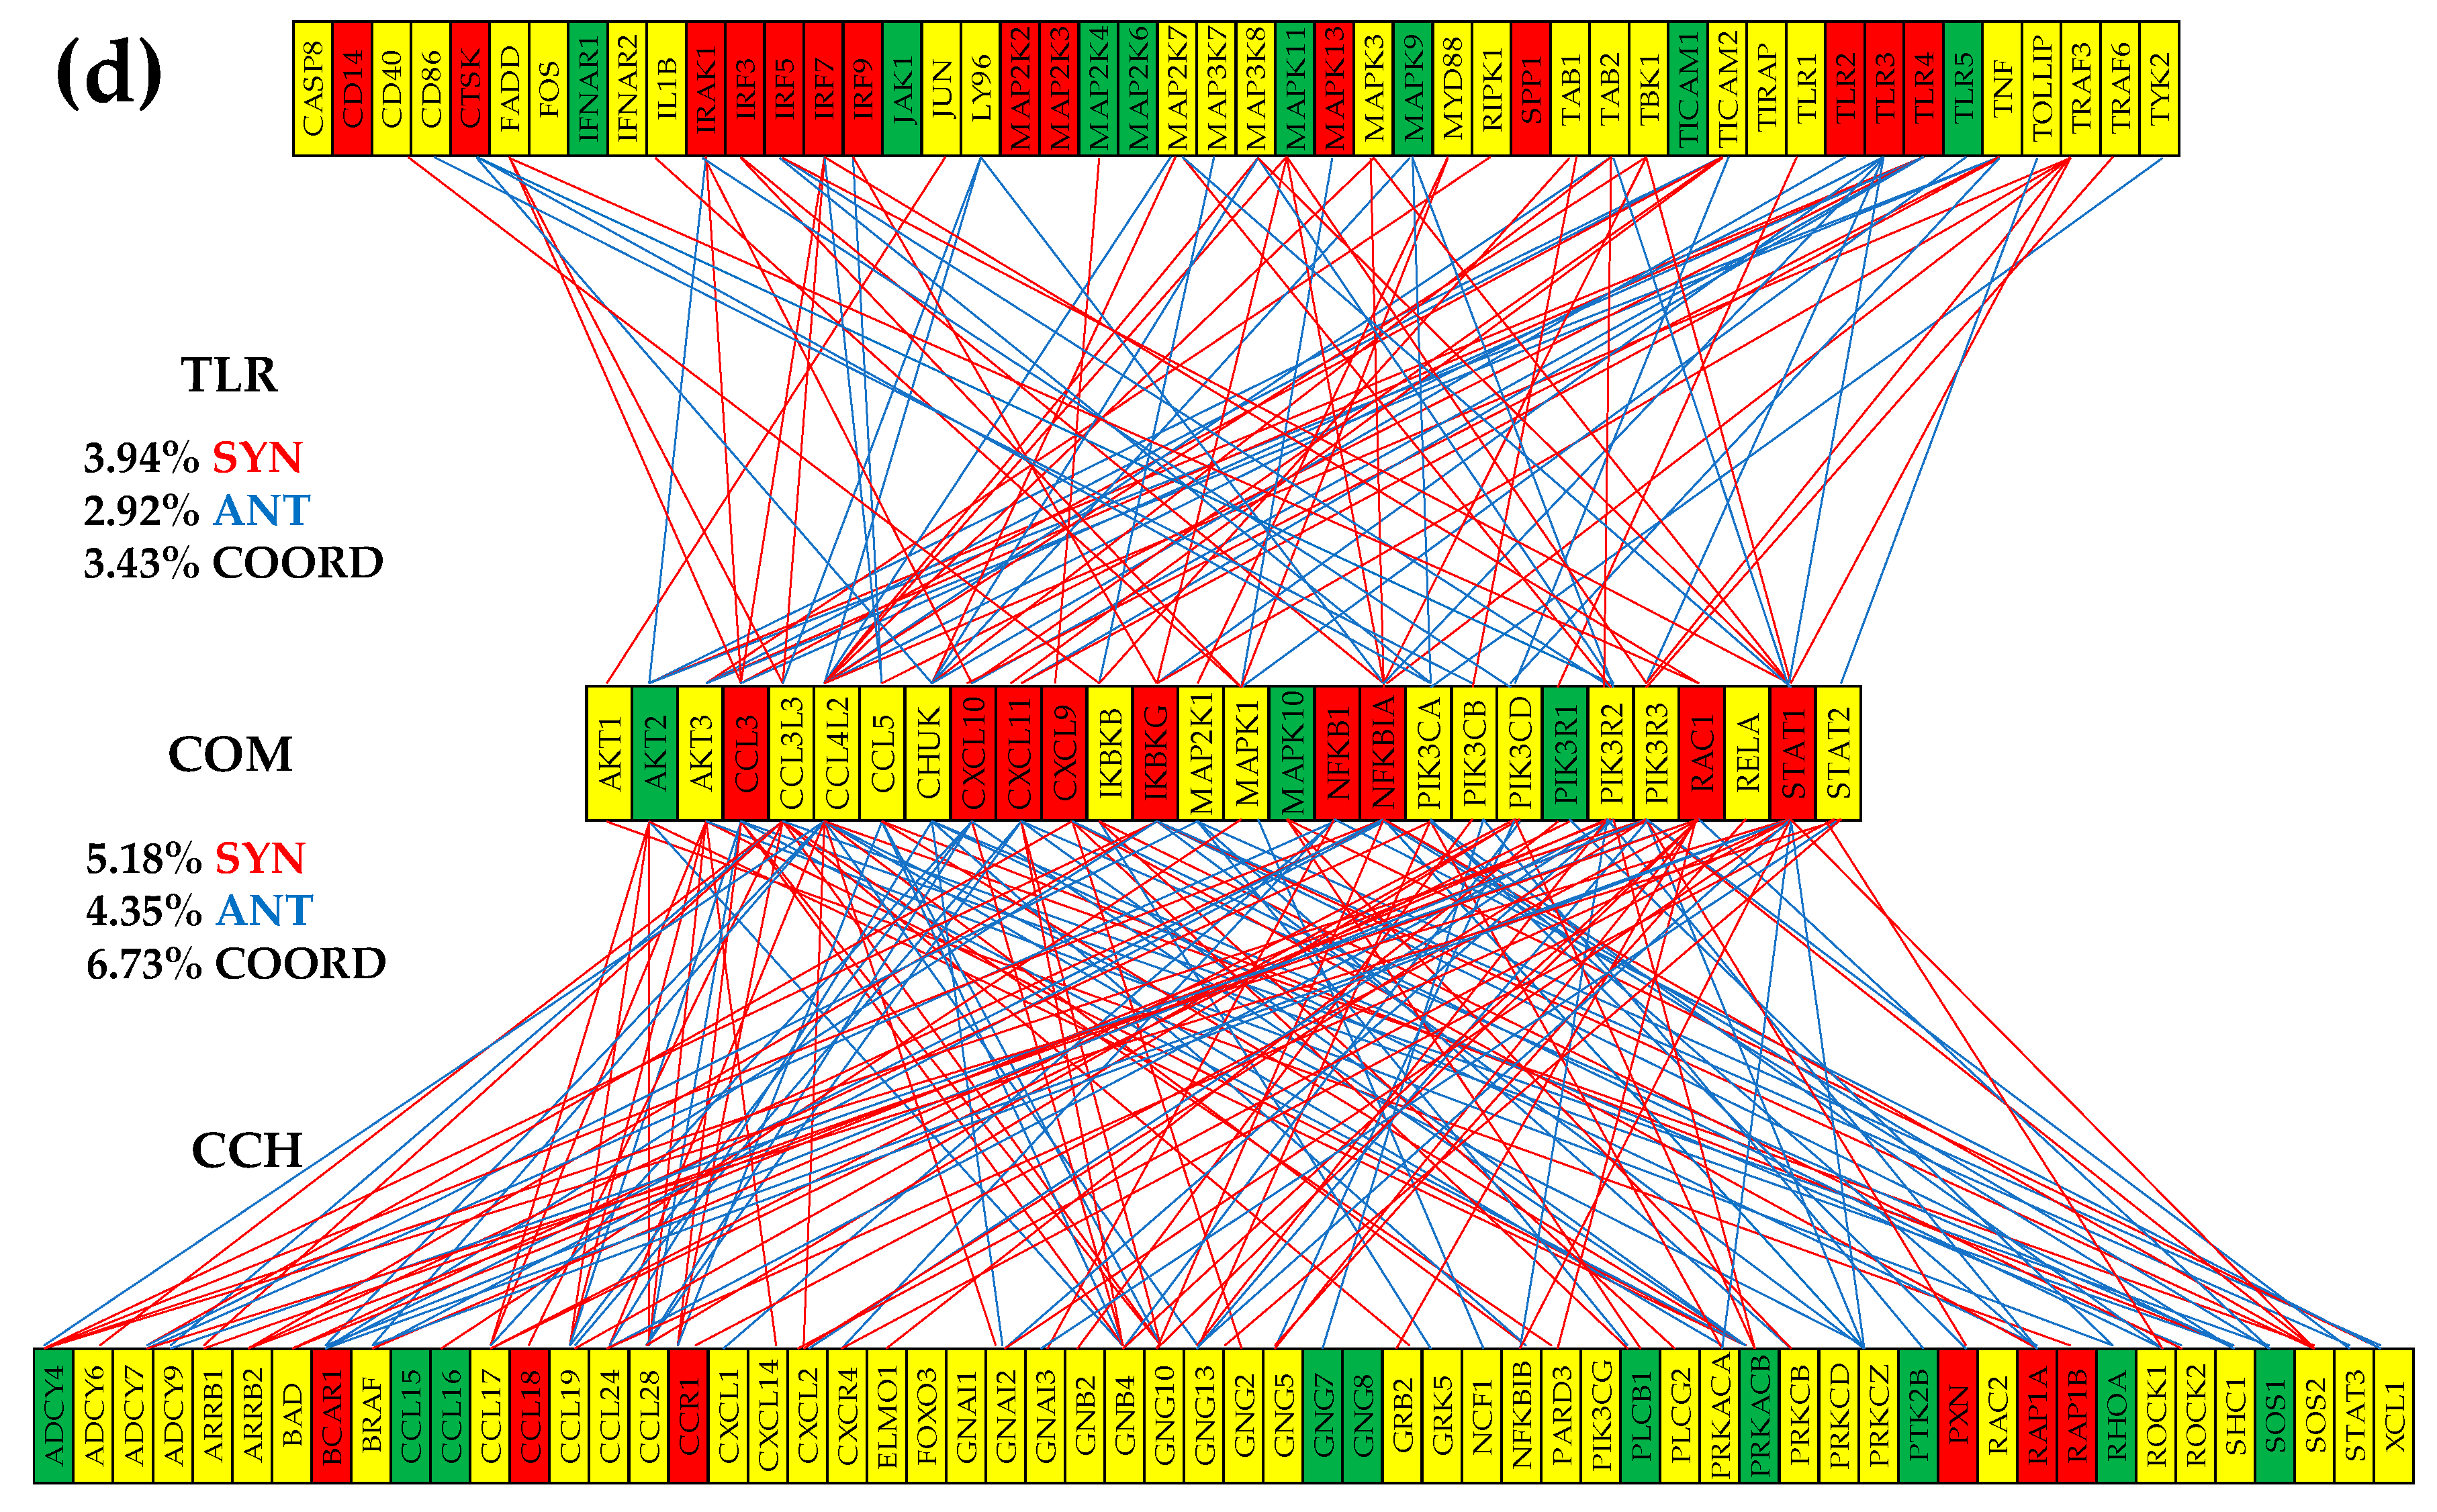
Figure 4.
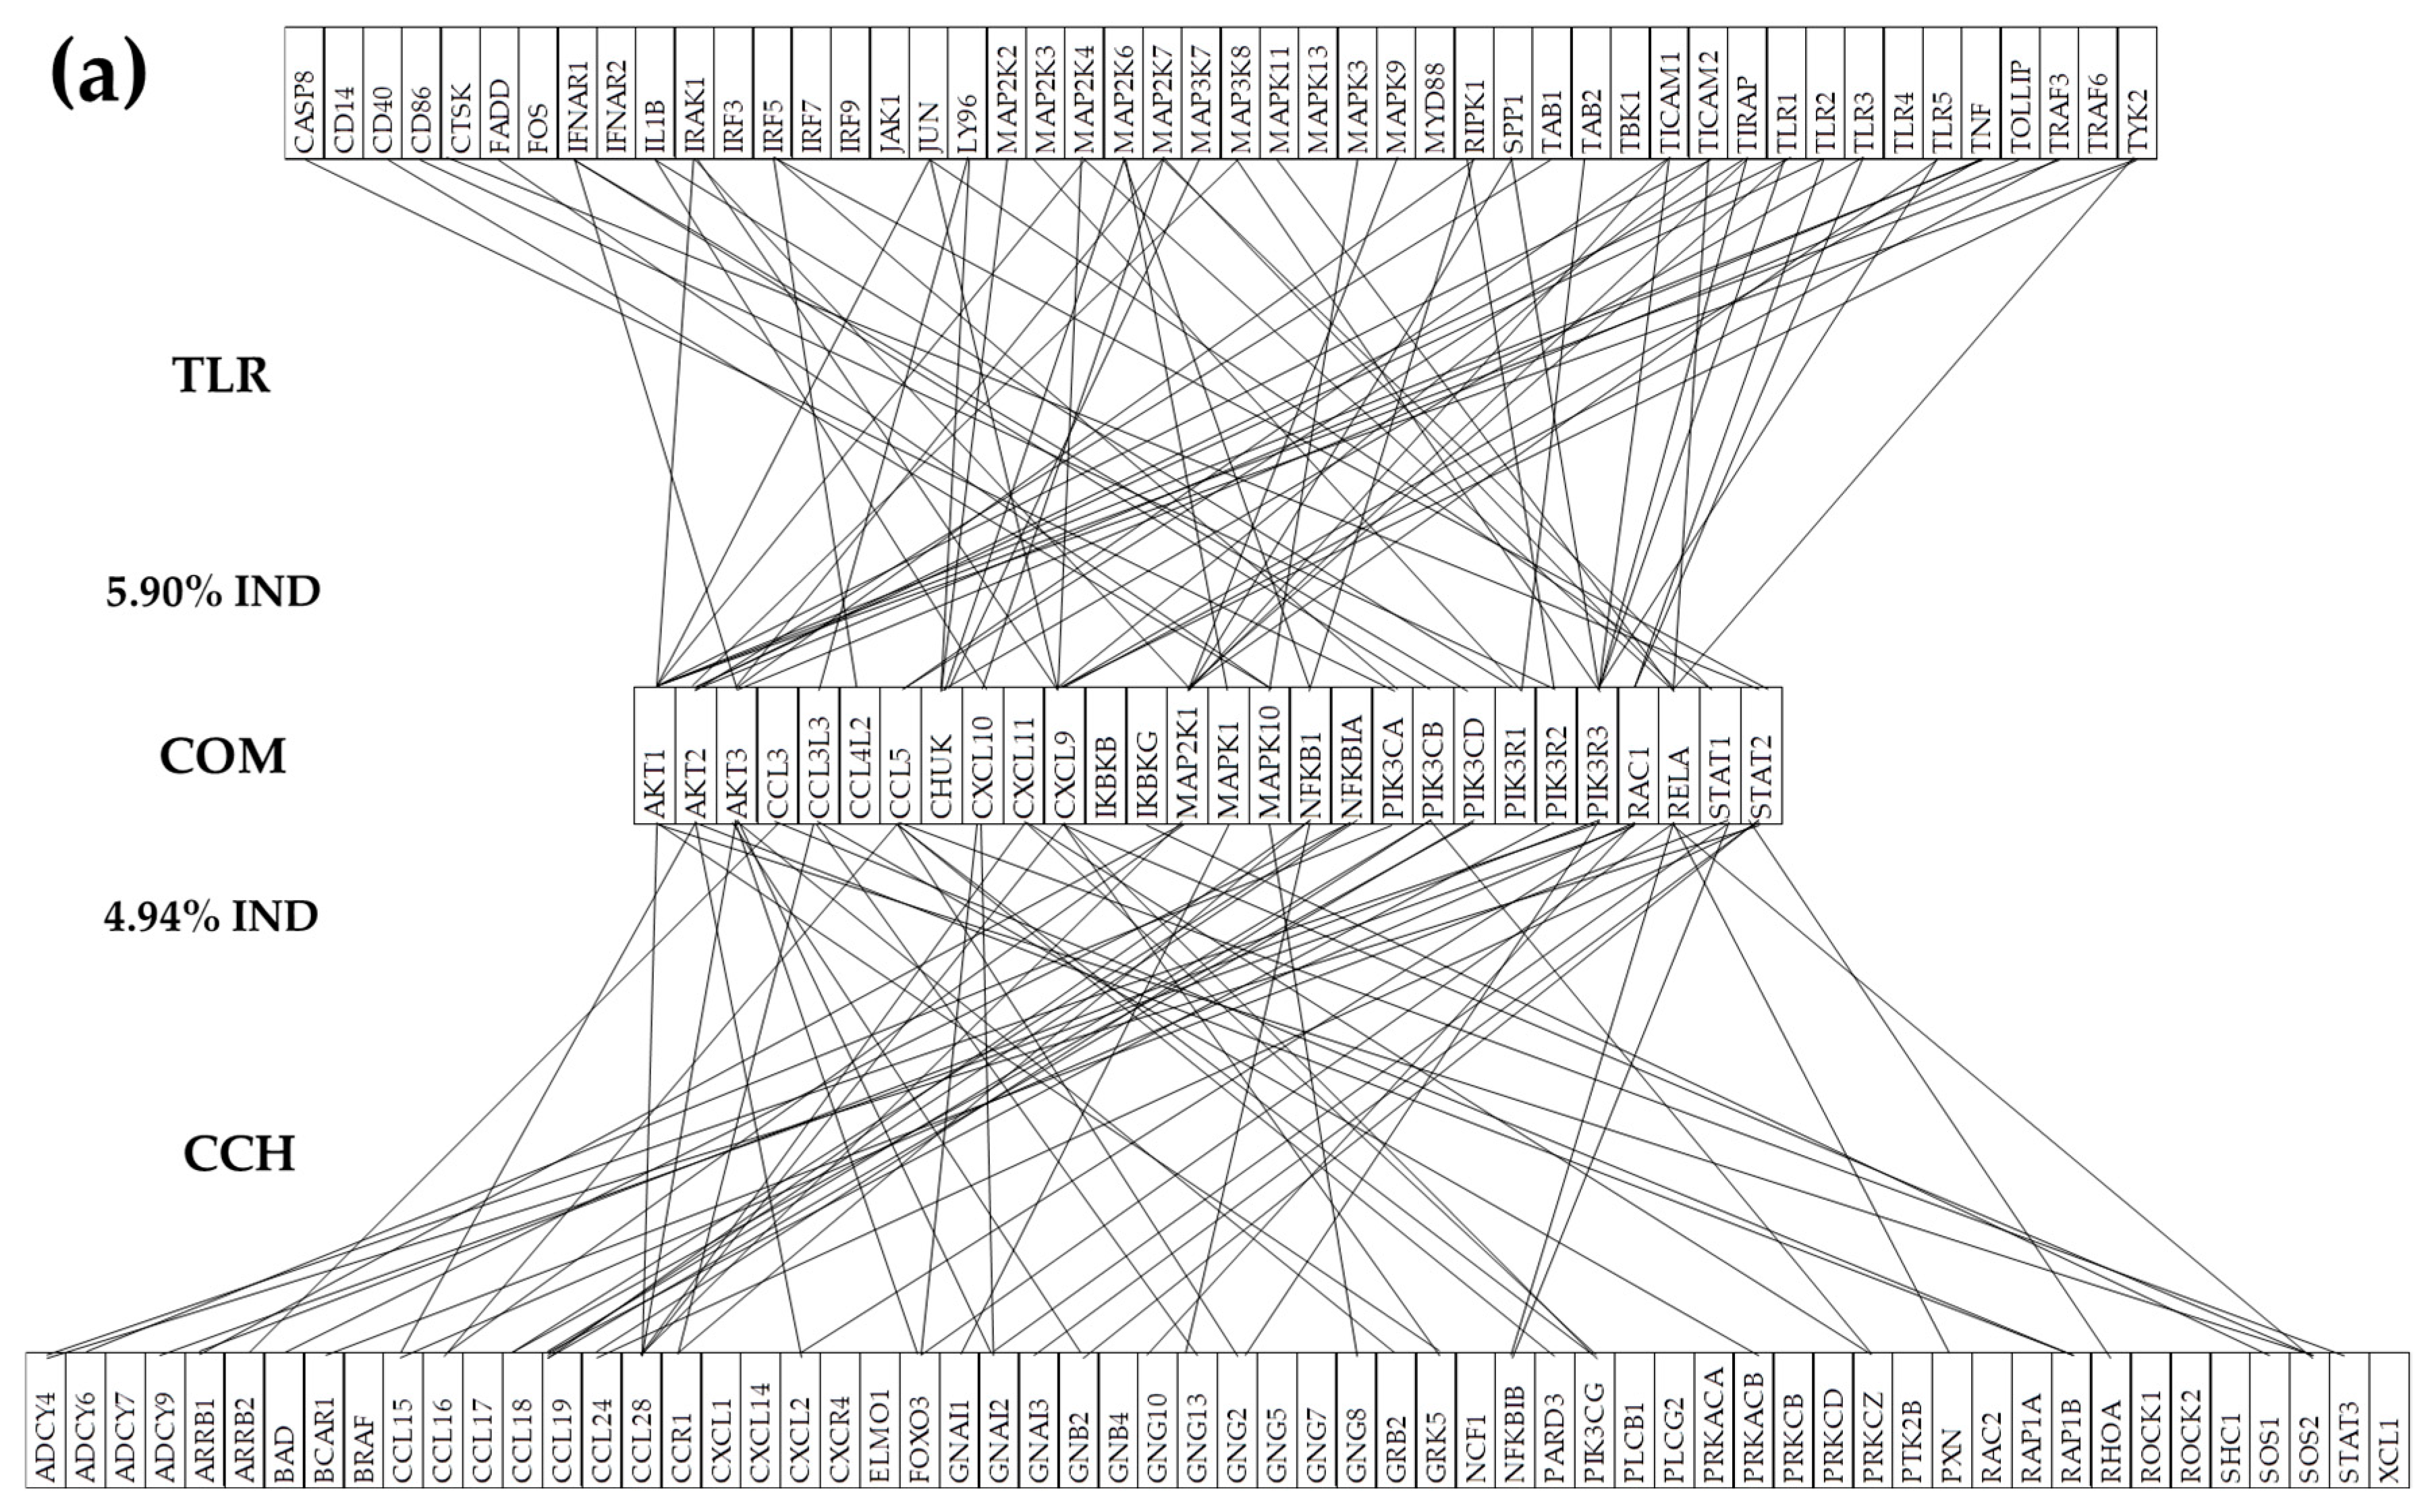
The (p < 0.05) statistically significant independently expressed TLR and CHS genes with their 28 common hubs in normal tissue “N” (a) and three cancer nodules: “A” (b), “B” (c), and “C” (d). A missing line means that the potential expression independence was not (p < 0.05) statistically significant. The red/green/yellow background of the gene symbol indicates up-/down-/not significant expression regulation in that nodule with respect to the normal tissue.
Figure 4.
The (p < 0.05) statistically significant independently expressed TLR and CHS genes with their 28 common hubs in normal tissue “N” (a) and three cancer nodules: “A” (b), “B” (c), and “C” (d). A missing line means that the potential expression independence was not (p < 0.05) statistically significant. The red/green/yellow background of the gene symbol indicates up-/down-/not significant expression regulation in that nodule with respect to the normal tissue.
4.6.2. Prostate Cancer Couples Several Normally Independently Expressed TLR and CHS Genes
Figure 5 presents the (p < 0.05) statistically significant independently expressed TLR-CHS gene pairs in the normal tissue that were turned into (p < 0.05) statistically significant synergistically or antagonistically expressed genes. Of note is that cancer made genes that are normally independently expressed to coordinate their expression fluctuations, indicating deep remodeling of the molecular mechanisms. It is important to observe the inter-nodule differences in the significant gene expression coupling, even between equally graded nodules from the same tumor.
4.6.3. Cancer Decouples Several Coordinately Expressed TLR and CHS Gene-Pairs in the Normal Tissue
We found that cancer not only couples some genes that are normally independently expressed but also that it decouples other genes whose expression is normally significantly synergistically or antagonistically coordinated. Figure 6 presents part of the significantly coordinately expressed TLR and CHS gene-pairs in the normal tissue that was decoupled in the cancer nodules. Of note are the substantial differences among the three cancer nodules.
4.6.4. Cancer Switches to the Opposite the Coupling Type of Some Gene Pairs in the Normal Tissue
We found that in addition to coupling some normally independently expressed genes or decoupling genes whose expressions are significantly correlated, cancer also switches the normal type of expression coordination. Figure 7 presents part of the TLR-CHS gene pairs whose normal significant synergistic or antagonistic expression was switched to the opposite by cancer.
4.7. Key Influential Genes in the CHS and TLR Signaling Pathways
Analysis from the GCH perspective revealed distinct patterns of influential genes across the three prostate cancer nodules and the surrounding normal tissue, highlighting the heterogeneous nature of the disease. In nodule “A”, the top three influential genes were GNB1, JAK2, and TYK2, while nodule “B” showed a predominance of CCR6, CCR1, and BCAR1. Nodule “C” exhibited a different pattern with CCL16, PLCB1, and PREX1 as the most influential genes. The surrounding normal tissue (N) displayed yet another distinct profile with CCL15, PRKCD, and VAV2 emerging as the top influential genes (Table 4). This variation in influential genes among different nodules underscores the molecular heterogeneity of prostate cancer.
5. Discussion
Although limited to three cancer nodules and the surrounding normal tissue from only one surgically removed prostate tumor, our all-inclusive analysis proved that each cancer nodule has its own “transcriptomic personality”, enough to invalidate BMH and verify GFH. Obviously, finding large transcriptomic differences between equally pathologically graded cancer nodules in the same tumor would make it very unlikely to find transcriptomic uniformity across distinct individuals as predicted by BMH. Moreover, even though we investigated only two (albeit major) functional pathways, most likely, inter-nodule transcriptomic differences extend to all other components of the immune system. However, further studies on several other functional pathways and with larger cohorts would increase confidence in our working hypothesis. Yet, we do hope that this study provided new insights into the dynamic regulation of the toll-like receptors and chemokine signaling pathways. The investigation was carried out from the perspective of the Genomic Fabric Paradigm that allows the most theoretically possible comprehensive characterization of the transcriptome [99].
Despite that Agilent microarray platform explores only the genes probed (with non-uniform redundancy) by its 44k spots, missing numerous other transcripts variants, it was considered comprehensive enough to invalidate BMH and test GFH. In addition to lower price, our wet protocol makes Agilent microarrays less technically noisy than Illumina RNA-sequencing platforms (MiSeq, NextSeq500 and HiSeq 4000) we used so far as probed by profiling technical replicates. Moreover, profiling the four quarters of point biopsies minimizes the sample collecting errors caused by the tumor heterogeneity.
The observed heterogeneity of the gene expression profile, control, and networking across the cancer nodules of the tumor highlights the complexity of prostate cancer biology. These results may inform future personalized therapeutic strategies aimed at targeting specific signaling pathways that are dysregulated in prostate cancer, with the potential to develop more personalized and effective treatments.
The present report confirms our prior observations regarding the unrepeatability of the cancer-induced remodeling of the transcriptomic topology not only from person to person but also among the cancer nodules (even those equally graded) from the same tumor. The transcriptomic uniqueness of the investigated prostate cancer nodules here was also disclosed by us before for the P53-signaling, apoptosis, block of differentiation, evading apoptosis, immortality, insensitivity to anti-growth signals, proliferation, resistance to chemotherapy, and sustained angiogenesis [69]. A similar conclusion resulted from the analysis of: mTOR signaling, metabolic genes and expression coordination of AKT2 with its partners central to the KEGG-constructed prostate cancer pathway [50] in another prostate tumor [20]. The standard immortalized prostate cancer cell lines LNCaP [100] and DU145 [101] also exhibited substantial differences in the transcriptomic organization [20,102,103].
The singleness of the cancer nodules seems to be not limited to the prostate tumors but extended to all poly-clonal malignancies. Meaningful inter-nodule differences were found through analysis of: chemokine and VEGF signaling, apoptosis, basal transcription factors, cell cycle, oxidative phosphorylation, renal cell carcinoma, and RNA polymerase pathways in a case of metastatic clear cell renal cell carcinoma [21,104].
The observation that GNAI2 maintained the highest expression levels across tumor (normal and cancerous) regions (Table 1) suggests that the malignancy does not alter the fundamental role of the encoded protein (Giα2) in the chemokine signaling. Although not statistically significant, GNAI2 had slight over-expression in all nodules: x(A vs N) = 1.19, x(B vs N) = 1.65, x(C vs N) = 1.18 (Table S1) justifies why Giα2 is essential for the prostate cancer cell migration [105]. An interesting paper [106] has shown that the GNAI2 expression decreased in the early stage of ovarian cancer but increased compared to normal in advanced cancers.
The differential expression of several key genes between normal and cancerous tissues provides insight into potential cancer-specific mechanisms. For instance, the downregulation of RAC3 in cancer nodules, contrary to its high expression in normal tissue, indicates a possible tumor-suppressive role that contradicts some previous findings in other cancer types [79,80,81]. This discrepancy might reflect tissue-specific functions or temporal dynamics of cancer progression (107).
The upregulation of CXCL14 in all cancer nodules aligns with previous findings [108], while the elevated expression of NFKBIA (Table 1) is somehow surprising, suggesting a more complex regulation of CHS and TLR signaling pathways in prostate cancer. NFKBIA encodes IκBα which inhibits the NF-κB complex, while activation of NF-κB is associated with Gleason grade increase [109]. This could indicate an intricate feedback mechanism attempting to maintain cellular homeostasis in the face of persistent inflammatory signaling. The upregulation of IRF7 (Table S1), a critical transcription factor in type I interferon responses, suggests the need to further explore potential IRF7 gene therapy of prostate cancer [110,111].
Table 2 and Table 3 present for the first time the Relative Expression Control (REC, formula (3)) of the most and least controlled TLR and CHS genes in a prostate tumor. REC values indicate what immune response genes are critical for the survival and proliferation and what genes ensure cell adaptability to not regulating environmental changes. Of note from these tables is that the phenotypic expression of histopathologically distinct regions in the same tumor depends on different sets of critical genes, even for equally pathologically graded nodules. GNB1, shown to promote malignancy in the colon [84], was the most controlled gene in “A” (but not in “B” and “C”) while MAPK1, a valuable target in anti-cancer therapy [112], was the most controlled in “B” (but not in “A” and “C”). Effectiveness of intra-tumoral injection of CCL16 [113], the most controlled in “C” (but not in “A” and “B”) might be explained by its significant down-regulation in prostate cancer. The control of GRK5, known for its regulating power in prostate cancer metastases [114], increased by 6.62x in “B” with respect to “N” but stayed practically the same in “C” (FC(C vs N) = 1.12).
Our analysis revealed dramatic shifts in gene expression control between normal and cancerous tissues. The observation that CCL15 transformed from being strictly controlled in normal tissue to loosely controlled in cancer nodules suggests a significant disruption of normal regulatory immune response mechanisms [115,116]. Conversely, the tightened control of TYK2 and GNB1 in nodule “A” (but much lesser in “B” and “C”) indicates that cancer cells may selectively enforce strict regulation of certain immune response components [117,118,119] while allowing others to vary widely.
The identification of 28 shared genes between TLR and CHS signaling pathways provides insight into the interconnected nature of these inflammatory response networks [120,121]. The consistent upregulation of cell surface TLRs and CD14 across all three nodules suggests a common mechanism for enhanced immune surveillance or inflammation in prostate cancer [122,123]. This is further supported by the activation of downstream NF-kB and interferon signaling pathways [109,110].
Given the prominent role of TLR4 in immune system signaling [111] and its potential use as a prostate cancer biomarker [122], it is puzzling to note its loosed control in nodule “C” while its control is even stricter in the other two nodules with respect to “N”. This is another indication of the dependency of cellular homeostasis on local environmental conditions.
The substantial tumor heterogeneity, even between equally graded nodules from the same tumor, as illustrated for gene expression regulation in Figures 1bc and 2bc. The differential significant regulation patterns observed in nodules “B” and “C” not only as affected genes but also as percentages (22.37% vs. 17.11% up-regulated and 13.16% vs. 5.26% down-regulated TLR genes, respectively) emphasize the importance of considering intra-tumoral heterogeneity in therapeutic strategies [52,53,54,55]. For instance, while three TLR signaling mitogen-activated kinases (MAP2K2, MAP2K3, MAPK13) were upregulated and five(MAP2K4, MAP2K6, MAPK9, MAPK10, MAPK11) were down-regulated in “B”, only MAP2K3 was upregulated and MAP2K6 was down-regulated in “C” (Figure 1). The differential regulation of the mitogen-activated kinases in the two equally graded nodules indicates that participation of the MAPK signaling [124] to the “development, invasion, metastasis, and drug resistance” [125] of cancer cells is not uniform even across the same prostate. Also, while four CHS signaling guanine nucleotide-binding proteins (GNB1, GNG10, GNG4, GNG5) were upregulated and three (GNB4, GNG12, GNG7) were down-regulated in “A”, only two genes (GNG7, GNG8) were down-regulated in “B” and no gene was up- or down-regulated in “C” (Figure 2).
The coordination analysis is based on the “Principle of Transcriptomic Stoichiometry” (PTS) [126] requiring expression correlation of the genes whose encoding products are linked in a functional pathway. This principle, theoretically ensuring the efficiency of the functional pathways, extends to the gene networking the classical Dalton’s Law of Multiple Proportion from chemistry [127]. Like the chemical elements that can combine in multiple proportions to produce various molecules, the genes can also be networked in several ways to respond to the stringent necessities of the cells in their actual environment.
Figure 3 presents a remarkable increase in coordination scores from normal tissue (1.09% and 2.50%) to cancer nodules (up to 8.97% and 13.51% in nodule A), suggesting that cancer development involves extensive remodeling of pathways’ interplays [128,129]. We have also used coordination analysis to determine the disease-triggered remodeling of functional pathways’ interplays in a previous publication for CHS and neurotransmission [130]. This increased coordination degree (higher in the primary nodule “A” than in the secondary “B” and “C”) might represent a more rigid signaling state that could potentially be exploited on novel therapeutic avenues. Of note are also the different ways by which the genes are networked in the four investigated regions, especially between nodules “B” and “C”. This is a strong argument that the personalization of cancer gene therapy should consider the ripple effects on several functional pathways and go beyond the individual human to the most aggressive cancer clones from his/her tumor.
Identification of the gene pairs whose expression coordination is statistically significant was complemented in each profiled prostate region with the independently expressed gene-pairs. The independent expression analysis selects genes that are not linked within or between any functional pathway(s) in the profiled region, although they can be coordinated in other tissues. Figure 4 shows substantial decreases of the percentages of independently expressed genes. Like the spectrum of the expression coordination in Figure 3, the spectrum of the expression independence in Figure 4 is not repeatable even among the cancer nodules from the same tumor, making it less likely to be repeated from person to person.
The transformation of independently expressed gene-pairs in normal tissue into coordinately expressed pairs in cancer, and vice versa, reveals the extensive rewiring of cellular signaling networks during cancer development [131,132,133].
Of particular interest is the switching of gene pair relationships from synergistic to antagonistic expression (or vice versa) in cancer tissue. For instance, the antagonistic pairs MAPK11-NFKBIA and SOS2-NFKBIA in “N” are turned into synergic ones in “A”, while the synergist pair CCL17-CXCL10 in “N” is reversed into an antagonistic one in “A”. In a synergistic pair, the two genes stimulate each-other’s expression either directly or through a common transcription factor, while in an antagonistic pair the two genes are inhibiting each-other’s expression. These changes suggest that cancerization not only alters individual gene expression but fundamentally reorganizes the relationships between signaling components [134,135]. The findings of this analysis question the “universality” of the functional pathways as designed by specialized software such are KEGG [136] and Ingenuity PathAssist [137].
In addition to gene expression levels, the intratumor heterogeneity of prostate cancer was revealed in previous studies through coordination analysis of gene networks involved in metabolism [69], enzymatic activity [20], as well in expression coordination of AKT2, MTOR [20], and PTEN with their partners [99,138]. The unrepeatable remodeling of the gene network among cancer nodules was also reported in a case of clear cell renal cell carcinoma (ccRCC) for all KEGG-designed functional pathways of the excretory system [139], chemokine signaling, basal transcription factors, RNA polymerase, and cell cycle [21,104,140]. In thyroid cancer investigations we have analyzed the remodeling of the functional pathways involved in genetic information processing [141], oxidative phosphorylation [142], or those by which the ncRNAs regulate apoptosis [143]. As such, the present manuscript extends the previous findings about unrepeatable transcriptomic topology of cancer nodules to other major functional pathways.
A significant result of the present study is the hierarchization of the CHS and TLR signaling genes in the four regions with respect to their gene commanding height (GCH) score (Table 4, fold-changes in Table S4). GCH combines the strength of expression control and expression coordination. High expression control shows the importance of that gene for cell physiology, while high coordination degree indicates how influential it is on the expressions of other genes [44].
GMR, the gene with the highest GCH in a cancer nodule should be the main target of a gene therapy aiming to kill the composing cells of that nodule. However, manipulation of the cancer GMR sequence (or expression level or 3D configuration) would be an effective strategy to destroy the cancer cells and only the cancer cells if that gene has a very low GCH in the normal tissue. So far, this condition has been satisfied in all 6 cancer regions we investigated in two prostate tumors ([20], Figure 4), 3 in a clear cell renal cell carcinoma ([104], Figure 6) and 1 in a papillary thyroid cancer [142]. Moreover, each cancer nodule of the tumors and each cancer cell line investigated so far (prostate LNCaP [102] and DU145 [103], thyroid BCPAP and 8505C [144], lung A549 [145], and blood HL-60 [146]) had a distinct GMR. These findings in surgically removed tumors and immortalized cell lines prove the uniqueness of the cancer transcriptomic topology in each cancer clone and the falsehood of the biomarker hypothesis.
Comparing the top CHS and TLR genes with the GMRs of these regions (determined in [69]) indicates the lack of importance of the two analyzed immune response pathways for the entire prostate transcriptomes of the studied man. Thus, in “N”, with GCH = 16.84 (CCL15) and GCH = 7.28 (FADD) both CHS and TLR top genes are far below GCH = 69 of MRPS12 (mitochondrial ribosomal protein S12), a prognostic oncogene in ovarian cancer that controls the “susceptibility to aminoglycoside antibiotics” [147]. In “A”, with GCH = 34.15 (GNB1) and GCH = 11.86 (RIPK1) the top immune response genes are far below GCH = 149 of ENTPD2 (ectonucleoside triphosphate diphosphohydrolase 2), part of 7-gene prognosis signature of gastric cancer [148]. In “B”, with CCR6 (GCH = 5.46) and TOLLIP (GCH = 7.21) are below the GCH = 36 of AP5M1 (adaptor-related protein complex 5, mu 1 subunit, a.k.a. MUDENG), recognized for its pro-apoptotic function [149]. Finally, in “C”, with GCH = 14.72 (CCL16) and GCH = 11.34 (RIPK1) both CHS and TLR are below GCH = 49 of BAIAP2L1 (BAI1-associated protein 2-like 1, a.k.a. IRTKS), reported as up-regulated in many tumors [150]. The comparison of the GCH scores shows that, at least for this patient, manipulation of the expressions of CHS and TLR genes would not be lethal in any region of the prostate. In a previous study on the same tumor ([20], Figure 6) we speculated about the expected expression regulations of the metabolic genes controlled by the respective GMR in each cancer nodule: ENTPD2 in “A”, AP5M1 in “B” and BAIAP2L1 in “C”. However, given the low GCH of CHS and TLR genes in these tumor regions, the effects of their expression manipulation is much less predictable.
The idea of gene master regulators of prostate cancer was used by several other groups, but they limited this designation to only the expression levels of certain transcription factors [151,152,153,154] or tumor suppressors involved in major processes like adipogenesis [155], or cell-cycle [156]. Nevertheless, our GMR hypothesis offers a distinct perspective by considering how critical is the right transcription level for cell survival (revealed by the expression control across biological replicas) and how influential is that gene through expression correlations with other genes. However, because of the unrepeatable nature of the transcriptomic topology, the real value of the GMRs of one person can be tested only on that person. In addition, given the dynamics of the local conditions, the GMRs most likely change in time, so their validation test should be performed not too late from the identification moment.
As expected, we found different hierarchies in the four regions (Table 4), as well as substantial GCH score changes for the same gene from one region to another (Table S4). For instance, the GCH score of CCL15, a chemokine protective factor for both liver and lung neoplasms [96], was reduced by 122.87x in “A”, 12.42x in “B” and 10.65x in “C”. This substantial reduction of the GCH score means that while experimental manipulation of this gene might have strong (even lethal) repercussions on the healthy tissue, it will have practically no effect on the cancer cells.
The downgrade of VAV2, known to activate RhoA that mediates prostate cancer cell–cell repulsion required for metastasis [157], mainly by substantially reducing its expression control (Table 2), increases the flexibility of the cancer cells to adapt to different local environments. We found also that the EPH receptor A4 (EPHA4), a mediator of the contact inhibition locomotion [158] through regulating Vav2-RhoA was significantly down-regulated in all three cancer nodules by: x(A vs N) = -3.35, x(B vs N) = -7.20, x(C vs N) = -6.34.
The relevance of FADD, an important receptor protein involved in transmitting apoptosis initiation signals [159,160] was significantly reduced in nodule “C” (FC(C vs N) = -17.41), to a lesser extent in nodule “B” (FC(B vs N) = -3.25) and much lesser in “A” (FC(A vs N) = -1.45). In contrast, the GCH score of RIPK1, an essential regulator for necrosis induced by tumor necrosis factor α (TNF-α) [161,162,163], increased more in the primary nodule “A” (FC(A vs N) = 4.56) than in the other two nodules (FC(B vs N) = 1.16; FC(C vs N) = 2.04). Our results indicate that the molecular mechanisms for cancer cell survival and proliferation are not uniform across the malignant part of the surgically removed prostate. Furthermore, in previous work (Figure S1 in Ref. [69]), we reported the inter-nodule heterogeneity of the regulation of genes associated with: block of differentiation, evading apoptosis, immortality, insensitivity to anti-growth signals, proliferation, resistance to chemotherapy, and sustained angiogenesis.
Although not regulated in any cancer nodule with respect to “N”, TOLLIP, encoding an autophagy product protein produced during prostate cancer development [88], had a substantial increase of the expression control strength (and implicit relevance) in nodule “B”. Interestingly, the same gene exhibited a decrease of the expression control strength in nodule C (Table S2). In contrast, the significantly upregulated IRF5 in all three cancer regions (x(A vs N) = 1.57, x(B vs N) = 2.20, x(C vs N) = 1.94), part of the so-called “seven gene signature of the neuroendocrine prostate cancer” [164], had a higher relevance increase in nodule “C” (FC(C vs N) = 6.20) than in “B” (FC(B vs N) = 1.63) or “A” (FC(A vs N) = 2.40) (Table S4).
6. Conclusions
The present study proves that each histopathologically distinct region of a tissue has an unrepeatable dynamic transcriptome organization. The substantial differences in expression level, control and inter-coordination even between two equally graded cancer nodules from the same tumor invalidates the cancer gene biomarker paradigm [16], regardless of its wide usage (e.g.,: [164,165,166,167,168]) even when targeting immune response genes (e.g.,: [169,170,171,172]). Our Genomic Fabric approach [173] extends to novel characteristics (expression control and gene networking) the recognized transcriptomic heterogeneity of prostate cancer [52,53,54,55]. Moreover, the reported results confirm the “Stem Cell Theory” [56,174,175] claiming that “the same genetic abnormalities and micro-environmental aberrations lead to different biological effects and clinical outcomes”. On top of this, the GCH analysis identifies also the Gene Master Regulators (GMR) [20,69] whose manipulation might be the most consequential for the persistence of that phenotype [44,64,142]. The genomic uniqueness of the cancer nodules makes their GMRs the most legitimate targets of personalized gene therapy. Finally, the finding that the top TLR and CHS signaling genes in the investigated cancer nodules have substantially lower GCH scores than the GMRs of these investigated nodules justifies the characterization of prostate cancer as “immunology cold” [176], Therefore, stimulating the immune response may not be an effective anti-cancer strategy, explaining the limited results of immunotherapy trials [177,178].
We are aware that gene transcription and transcript translation into protein exhibit a complex correlation [179], something like acceleration and speed of a vehicle: the gene is transcribed when the cell needs to increase or replenish the protein content. Since in addition to translation, protein abundance is affected by several post-translational modifications, and the genes’ expressions correlations do not exactly overlap the protein-protein interactions [180] our results are relevant only at the transcriptomic level and integration with epigenetic and proteomic data are needed to strength the conclusion. his section is not mandatory but can be added to the manuscript if the discussion is unusually long or complex.
Note: Part of this report was included in the preprint [181].
Supplementary Materials
The following supporting information can be downloaded at the website of this paper posted on Preprints.org. Table S1: Expression ratios (negative for down-regulation, Italics) of the top CHS and TLR signaling genes in cancer nodules “A”, “B”, and “C” compared to normal tissue “N”; Table S2: Fold-change (negative for down-regulation, Italics) of the expression control strength of the top controlled genes in cancer nodules “A”, “B”, and “C” compared to normal tissue “N”. Table S3: Fold-change (negative for down-regulation, Italics) of the expression control strength of the least controlled genes in cancer nodules “A”, “B”, and “C” compared to normal tissue “N”. Table S4: Fold-change (negative for down-regulation, Italics) of the Gene Commanding Height scores of the key genes in cancer nodules “A”, “B”, and “C” compared to normal tissue “N”.
Author Contributions
Conceptualization: D.A.I. and D.Z.; data curation: D.Z. and M.B.; formal analysis: D.A.I. and S.I.; Investigation: D.A.I, and S.I.; methodology: D.A.I. and S.I.; project administration: D.A.I. and D.Z.; resources: D.A.I., D.D. and D.Z.; software, supervision: D.A.I. and D.Z.; validation: D.A.I. and D.Z.; Visualization: D.A.I. and S.I.; writing—original draft: D.A.I.; writing—review and editing, D.D., D.Z. and MB. All authors have read and agreed to the published version of the manuscript.
Funding
This research received no external funding.
Institutional Review Board Statement
Gene expression data were obtained in a study approved at the time by New York Medical College and Westchester Medical Center (WMC) Committees for Protection of Human Subjects, commonly known as Institutional Review Boards (IRBs) by L-11,376 (“Quantifying cancer-associated remodeling of key genomic fabrics”, PI. DA Iacobas). The approval granted access to frozen cancer specimens from the WMC Pathology Archives and depersonalized pathology reports, waiving patient’s informed consent.
Informed Consent Statement
Patient consent was waived due to the use of only depersonalized pathology reports.
Data Availability Statement
Expression data (GSE183889, GSE168718, GSE133906) analyzed for this study can be found in the NCBI/GEO website (https://www.ncbi.nlm.nih.gov/gds/?term=iacobas%2C+prostate)
Conflicts of Interest
The authors declare no conflicts of interest.
Abbreviations
The following abbreviations are used in this manuscript:
AVE Average expression level across biological replicas
CHS Chemokine signaling
COORD Coordination degree
COR Expression Control
GCH Gene Commanding Height
GMR Gene Master Regulator
REC Relative Expression Control
REV Relative Expression Variation
RSC Relative Strength Control
TLR Toll-like Receptor
References
- Kohaar, I.; Petrovics, G.; Srivastava, S. A Rich Array of Prostate Cancer Molecular Biomarkers: Opportunities and Challenges. Int J Mol Sci. 2019, 20, 1813. [Google Scholar] [CrossRef] [PubMed]
- Boehm, B.E.; York, M.E.; Petrovics, G.; Kohaar, I.; Chesnut, G.T. Biomarkers of Aggressive Prostate Cancer at Diagnosis. Int. J. Mol. Sci. 2023, 24, 2185. [Google Scholar] [CrossRef] [PubMed]
- Jiang, C.; Hong, Z.; Liu, S.; Hong, Z.; Dai, B. Roles of CDK12 mutations in PCa development and treatment. Biochim Biophys Acta Rev Cancer. 2024, 1880, 189247. [Google Scholar] [CrossRef]
- Zhou, T.; Feng, Q. Androgen receptor signaling and spatial chromatin organization in castration-resistant prostate cancer. Front Med (Lausanne). 2022, 9, 924087. [Google Scholar] [CrossRef]
- Akele, M.; Iervolino, M.; Van Belle, S.; Christ, F.; Debyser, Z. Role of LEDGF/p75 (PSIP1) in oncogenesis. Insights in molecular mechanism and therapeutic potential. Biochim Biophys Acta Rev Cancer 2024, .1880, 189248. [Google Scholar] [CrossRef]
- Yang, R.K.; Alvarez, H.; Lucas, A.S.; Roy-Chowdhuri, S.; Rashid, A.; Chen, H.; et al. Microsatellite instability and high tumor mutational burden detected by next generation sequencing are concordant with loss of mismatch repair proteins by immunohistochemistry. Cancer Genet. 2024, 290-291, 44-50. Cancer Genet. [CrossRef]
- Diaw, L.; Woodson, K.; Gillespie, J.W. Prostate cancer epigenetics: a review on gene regulation. Gene Regul Syst Bio. 2007, 1, 313–25. [Google Scholar] [CrossRef]
- The Cancer Genome Atlas (TCGA) Research Network. Available at: https://www.cancer.gov/tcga (Accessed on January 4, 2025).
- Harmonized Cancer Datasets Genomic Data Commons Data Portal. Available at: https://portal.gdc.cancer.gov (Accessed January 2, 2025).
- Valencia., I.; Nuzzo, P.V.; Francini, E.; Ravera, F.; Fanelli, G.N.; Bleve, S.; et al. Gene Signature for Predicting Metastasis in Prostate Cancer Using Primary Tumor Expression Profiles. medRxiv [Preprint]. 2024,. [CrossRef]
- Foundation Medicine. Available at: https://www.foundationmedicine.com/genomic-testing (Accessed December 12, 2024).
- Invitae Multi-Cancer Panel. Available at: https://www.invitae.com/us/providers/test-catalog/test-01101 (Accessed December 11, 2024).
- Nanostring nCounter® Panels & Assays. Available at: https://www.nanostring.com/products/gene-expression-panels/gene-expression-panels-overview (Accessed, December 12, 2024).
- TissueScan™ Cancer and Normal Tissue cDNA Arrays. Available at: https://www.origene.com/products/tissues (Accessed December 12, 2024).
- Shen, M.; García-Marqués, F.; Muruganantham, A.; Liu, S.; White, J.R.; Bermudez, A.; et al. Identification of a 5-gene signature panel for the prediction of prostate cancer progression. Br J Cancer. 2024, 131, 1748–1761. [Google Scholar] [CrossRef]
- Iacobas, D.A. Advanced Molecular Solutions for Cancer Therapy-The Good, the Bad, and the Ugly of the Biomarker Paradigm. Curr. Issues Mol. Biol. 2024, 46, 1694–1699. [Google Scholar] [CrossRef]
- Dixcy Jaba Sheeba, J.M.; Hegde, S.; Tamboli, N.; Nadig, N.; Keshavamurthy, R.; Ranganathan, P. Gene expression signature of castrate resistant prostate cancer. Gene. 2024, 925, 148603. [Google Scholar] [CrossRef]
- Garzotto, M.; Kopp, R.P. Gene-expression profiling of localized prostate cancer: still miles to go before we sleep. Future Oncol. 2016, 12, 273–6. [Google Scholar] [CrossRef]
- Li, Y.; Hsu, S.H.; Wang, R.; Theprungsirikul, P.; Neparidze, N.; Chang, S.H.; et al. Associations Between Patient Characteristics and Progression to Multiple Myeloma Among Patients With Monoclonal Gammopathy of Undetermined Significance: A Systematic Review. Clin Lymphoma Myeloma Leuk. 2024, S2152-2650(24)02444-3. [CrossRef]
- Iacobas, S.; Iacobas, D.A. Personalized 3-Gene Panel for Prostate Cancer Target Therapy. Curr. Issues Mol. Biol. 2022, 44, 360–382. [Google Scholar] [CrossRef] [PubMed]
- Iacobas, D.A.; Obiomon, E.A.; Iacobas, S. Genomic Fabrics of the Excretory System’s Functional Pathways Remodeled in Clear Cell Renal Cell Carcinoma. Curr Issues Mol Biol. 2023, 45, 9471–9499. [Google Scholar] [CrossRef] [PubMed]
- Geynisman, D.M.; John, W.S.; Miller, T.A.; Asgarisabet, P.; Guttenplan, S.B.; Yin, X.; et al. Racial differences in real-world outcomes of first-line therapies for advanced renal cell carcinoma. Oncologist. 2024, oyae354. [Google Scholar] [CrossRef] [PubMed]
- Creed, J.H.; Berglund, A.E.; Rounbehler, R.J.; Awasthi, S.; Cleveland, J.L.; Park, J.Y.; Yamoah, K.; Gerke, T.A. Commercial Gene Expression Tests for Prostate Cancer Prognosis Provide Paradoxical Estimates of Race-Specific Risk. Cancer Epidemiol Biomarkers Prev. 2020, 29, 246–253. [Google Scholar] [CrossRef]
- Anbarasu, S.; Anbarasu, A. Cancer-biomarkers associated with sex hormone receptors and recent therapeutic advancements: a comprehensive review. Med Oncol. 2023, 40, 171. [Google Scholar] [CrossRef]
- The Importance of Sex in the Discovery of Colorectal Cancer Prognostic Biomarkers. Int J Mol Sci. 2021, 22, 1354. [CrossRef]
- Lau, C.E.; Robinson, O. DNA methylation age as a biomarker for cancer. Int J Cancer. 2021, 148, 2652–2663. [Google Scholar] [CrossRef]
- Kallai, A.; Ungvari, Z.; Fekete, M.; Maier, A.B.; Mikala, G.; Andrikovics, H.; et al. Genomic instability and genetic heterogeneity in aging: insights from clonal hematopoiesis (CHIP), monoclonal gammopathy (MGUS), and monoclonal B-cell lymphocytosis (MBL). Geroscience. 2025, 47, 703–720. [Google Scholar] [CrossRef]
- Liu, Y.; Hao, H.; Guo, X.; Xu, J.; Kang, L; Zheng, G.; Zhao, H. Rare pancreatic carcinosarcoma in a patient with medical history of esophageal cancer: A case report and literature review. Medicine (Baltimore). 2019, 98, e15238. [CrossRef]
- Clift, K.; Macklin-Mantia, S.; Barnhorst, M. Comparison of a Focused Family Cancer History Questionnaire to Family History Documentation in the Electronic Medical Record. J Prim Care Community Health. 2022, 13, 21501319211069756. [CrossRef]
- Rodríguez-Molinero, J.; Migueláñez-Medrán, B.D.C.; Puente-Gutiérrez, C.; Delgado-Somolinos, E.; Martín Carreras-Presas, C.; Fernández-Farhall, J.; López-Sánchez, A.F. Association between Oral Cancer and Diet: An Update. Nutrients. 2021, 13, 1299. [Google Scholar] [CrossRef]
- Maddineni, G.; Xie, J.J.; Brahmbhatt, B.; Mutha, P. Diet and carcinogenesis of gastric cancer. Curr Opin Gastroenterol. 2022, 38, 588–591. [Google Scholar] [CrossRef]
- Kruk, J.; Aboul-Enein, B.H.; Bernstein, J.; Gronostaj, M. ; Psychological Stress and Cellular Aging in Cancer: A Meta-Analysis. Oxid Med Cell Longev. 2019, 1270397. [Google Scholar] [CrossRef]
- Effects of laughter therapy on improving physical and psychological symptoms among cancer patients: a systematic review and meta-analysis. Support Care Cancer. 2025, 33, 230. [CrossRef]
- Grimes, D.R. Radiofrequency Radiation and Cancer: A Review. JAMA Oncol. 2022, 8, 456–461. [Google Scholar] [CrossRef] [PubMed]
- Holick, M.F. Sunlight, UV Radiation, Vitamin D, and Skin Cancer: How Much Sunlight Do We Need? Adv Exp Med Biol. 2020, 1268, 19–36. [Google Scholar] [CrossRef] [PubMed]
- Gupta, S.; Sharma, R.S.; Singh, R. Non-ionizing radiation as possible carcinogen. Int J Environ Health Res. 2022, 32, 916–940. [Google Scholar] [CrossRef]
- Larsen, K.; Rydz, E.; Peters, C.E. Inequalities in Environmental Cancer Risk and Carcinogen Exposures: A Scoping Review. Int J Environ Res Public Health. 2023, 20, 5718. [Google Scholar] [CrossRef] [PubMed]
- Roje, B.; Zhang, B.; Mastrorilli, E.; Kovačić, A.; Sušak, L.; Ljubenkov, I. et. Gut microbiota carcinogen metabolism causes distal tissue tumours. Nature. 2024, 632, 1137–1144. [Google Scholar] [CrossRef]
- Ge, G.Z.; Xu, T.R.; Chen, C. Tobacco carcinogen NNK-induced lung cancer animal models and associated carcinogenic mechanisms. Acta Biochim Biophys Sin (Shanghai). 2015, 47, 477–87. [Google Scholar] [CrossRef]
- Liu, S.; Saunders, M.; Mak, T.W. Chemical carcinogens: implications for cancer treatment. J Clin Invest. 2023, 133, e174319. [Google Scholar] [CrossRef]
- Lander, E.S.; Linton, L.M.; Birren, B.; Nusbaum, C.; Zody, M.C.; Baldwin, J, et al. Initial sequencing and analysis of the human genome. Nature. 2001. 409 (6822): 860–921.20.
- Bian, P.P.; Zhang, Y.; Jiang, Y. Pan-genome: setting a new standard for high-quality reference genomes. Yi Chuan. 2021, 43, 1023–1037. [Google Scholar] [CrossRef]
- Liao, W.W.; Asri, M.; Ebler, J.; Doerr, D.; Haukness, M.; Hickey, G.; et al. A draft human pangenome reference. Nature. 2023. 617 (7960): 312–324. Bibcode:2023Natur.617..312L. [CrossRef]
- Iacobas, D.A.; Tuli, N.Y.; Iacobas, S.; Rasamny, J.K.; Moscatello, A.; Geliebter, J.; Tiwari, R.K. Gene master regulators of papillary and anaplastic thyroid cancers. Oncotarget. 2017, 9, 2410–2424. [Google Scholar] [CrossRef]
- Liu, Y.; Weber, Z.; San Lucas, F.A.; Deshpande, A.; Jakubek, Y.A.; Sulaiman, R.; et al. Assessing inter-component heterogeneity of biphasic uterine carcinosarcomas. Gynecol Oncol. 2018, 151, 243–249. [Google Scholar] [CrossRef]
- Fujimoto, H.; Saito, Y.; Ohuchida, K.; Kawakami, E.; Fujiki, S.; Watanabe, T et al. Deregulated Mucosal Immune Surveillance through Gut-Associated Regulatory T Cells and PD-1+ T Cells in Human Colorectal Cancer. J. Immunol. 2018, 200, 3291–3303. [CrossRef]
- Yang, C.; Gong, J.; Xu, W.; Liu, Z.; Cui, D. Next-generation sequencing identified somatic alterations that may underlie the etiology of Chinese papillary thyroid carcinoma. Eur. J. Cancer Prev. 2023, 32, 264–274. [Google Scholar] [CrossRef] [PubMed]
- Clark, D.J.; Dhanasekaran, S.M.; Petralia, F.; Pan, J.; Song, X.; et al. Clinical Proteomic Tumor Analysis Consortium. Integrated Proteogenomic Characterization of Clear Cell Renal Cell Carcinoma. Cell 2019, 179, 964–983.e31. [CrossRef]
- Solovyov, A.; Behr, J.M.; Hoyos, D.; Banks, E.; Drong, A.W.; Thornlow, B.; et al. Pan-cancer multi-omic model of LINE-1 activity reveals locus heterogeneity of retrotransposition efficiency. Nat Commun. 2025, 16, 2049. [Google Scholar] [CrossRef] [PubMed]
- Prostate cancer. Available at: https://www.genome.jp/pathway/hsa05215. (Accessed December 12, 2024). 12 December.
- Young, B.; O’Dowd, G.; Woodford, P. Wheater’s functional histology: a text and colour atlas (6th ed.). Philadelphia: Elsevier. 2013. pp. 347–8. ISBN 9780702047473.
- Kulac, I.; Roudier, M.P.; Haffner, M.C. Molecular Pathology of Prostate Cancer. Surg. Pathol. Clin. 2021, 14, 387–401. [Google Scholar] [CrossRef]
- Tolkach, Y.; Kristiansen, G. The Heterogeneity of Prostate Cancer: A Practical Approach. Pathobiology 2018, 85, 108–116. [Google Scholar] [CrossRef]
- Berglund, E.; Maaskola, J.; Schultz, N.; Friedrich, S.; Marklund, M.; Bergenstråhle, J.; et al. Spatial maps of prostate cancer transcriptomes reveal an unexplored landscape of heterogeneity. Nat. Commun. 2018, 9, 2419. [Google Scholar] [CrossRef]
- Brady, L.; Kriner, M.; Coleman, I.; Morrissey, C.; Roudier, M.; True, L.D.; et al. Inter- and intra-tumor heterogeneity of metastatic prostate cancer determined by digital spatial gene expression profiling. Nat. Commun. 2021, 12, 1426. [Google Scholar] [CrossRef]
- Tu, S.M.; Zhang, M.; Wood, C.G.; Pisters, L.L. Stem Cell Theory of Cancer: Origin of Tumor Heterogeneity and Plasticity. Cancers, 2021, 13, 4006. [CrossRef]
- Ankathatti Narayanaswamy, I.; Kattepur, A.K.; Raju, K.; Perumal, V.; Ramalingam, R.; Raavi, V.; et al. Shugoshin 1 expression in various cancers: a potential target for therapy. Clin Transl Oncol. 2024. [CrossRef] [PubMed]
- Frame, G.; Huang, X.; Haas, R.; Khan, K.A.; Leong, H.S.; Kislinger, T.; et al. Accelerated growth and local progression of radiorecurrent prostate cancer in an orthotopic bioluminescent mouse model. Sci Rep. 2024, 14, 31205. [Google Scholar] [CrossRef]
- Wei, X.; Liang, J.; Huang, H.; Yang, D.; Wang, X.; Wang, X.; et al. TMED3 promotes prostate cancer via FOXO1a and FOXO3a phosphorylation. Oncol Res. 2024, 33, 161–169. [Google Scholar] [CrossRef]
- Oliveira-Rizzo, C.; Colantuono, C.L; Fernández-Alvarez, A.J.; Boccaccio, G.L; Garat, B.; Sotelo-Silveira, J.R.; et al. Multi-Omics Study Reveals Nc886/vtRNA2-1 as a Positive Regulator of Prostate Cancer Cell Immunity. J Proteome Res. 2024, 24, 433–448. [Google Scholar] [CrossRef]
- Brunie, M.; Robichaud, M.A.; Touaibia, M.; Martin, L.J. The Activation of the CCND1 Promoter by AP-1 and SOX Transcription Factors in PC3 Prostate Cancer Cells Can Be Prevented by Anacardic Acid Analogs. Cell Biochem Biophys. 2024. [Google Scholar] [CrossRef] [PubMed]
- Iacobas, S.; Iacobas, D.A. Astrocyte proximity modulates the myelination gene fabric of oligodendrocytes. Neuron Glia Biol. 2010, 6, 157–69. [Google Scholar] [CrossRef] [PubMed]
- Iacobas, D.A.; Iacobas, S.; Stout, R.F.; Spray, D.C. Cellular Environment Remodels the Genomic Fabrics of Functional Pathways in Astrocytes. Genes (Basel). 2020, 11, 520. [Google Scholar] [CrossRef] [PubMed]
- Iacobas, S.; Ede, N.; Iacobas, D.A. The Gene Master Regulators (GMR) Approach Provides Legitimate Targets for Per-sonalized, Time-Sensitive Cancer Gene Therapy. Genes, 2019, 10, 560. [CrossRef]
- Toll-like receptor pathway. Available online at: https://www.genome.jp/pathway/hsa04620 (Accessed December 12, 2024). 12 December 0462.
- Chemokine signaling pathway - Homo sapiens. Available online at: https://www.genome.jp/pathway/hsa04062 (Accessed December 12, 2024).
- Agilent-026652 Whole Human Genome Microarray 4x44K v2. Available online at: https://www.ncbi.nlm.nih.gov/geo/query/acc.cgi?acc=GPL10332. (Accessed December 12, 2024).
- Gene Commanding Height (GCH) Hierarchy in the Cancer Nucleus and Cancer-Free Resection Margins from a Surgically Removed Prostatic Adenocarcinoma of a 65y Old Black Man. Available online at: https://www.ncbi.nlm.nih.gov/geo/query/acc.cgi?&acc=GSE133906. (Accessed December 12, 2024).
- Iacobas, S.; Iacobas, D.A. A Personalized Genomics Approach of the Prostate Cancer. Cells, 2021, 10, 1644. [CrossRef]
- Carpenter, S.; O’Neill, L.A.J. From periphery to center stage: 50 years of advancements in innate immunity. Cell. 2024, 187, 2030–2051. [Google Scholar] [CrossRef]
- Janeway, C.A. Jr. Pillars article: approaching the asymptote? Evolution and revolution in immunology. Cold spring harb symp quant biol. 1989. 54, 1-13. J Immunol. 2013, 191, 4475-87. [PubMed]
- Matzinger, P. Tolerance, danger, and the extended family. Annu Rev Immunol. 1994, 12, 991–1045. [Google Scholar] [CrossRef] [PubMed]
- Medzhitov, R.; Iwasaki, A. Exploring new perspectives in immunology. Cell. 2024, 187, 2079–2094. [Google Scholar] [CrossRef]
- De Nunzio, C.; Lombardo, R. Best of 2022 in prostate cancer and prostatic diseases. Prostate Cancer Prostatic Dis. 2023, 26, 5–7. [Google Scholar] [CrossRef]
- Liang, H.; Zhang, L.; Liu, Z.; Hoden, B.; DeRubeis, D.; Zhang, Y.; et al. Upregulation of TLR5 indicates a favorable prognosis in prostate cancer. Prostate. 2023, 83, 1035–1045. [Google Scholar] [CrossRef]
- Gambara, G.; De Cesaris, P.; De Nunzio, C.; Ziparo, E.; Tubaro, A.; Filippini, A.; et al. Toll-like receptors in prostate infection and cancer between bench and bedside. J Cell Mol Med. 2013, 17, 713–22. [Google Scholar] [CrossRef]
- Park, S.; Kim, G.; Choi, A.; Kim, S.; Yum, J.S.; Chun, E.; et al. Comparative network-based analysis of toll-like recep-tor agonist, L-pampo signaling pathways in immune and cancer cells. Sci Rep. 2024, 14, 17173. [Google Scholar] [CrossRef]
- Borziak, K.; Finkelstein, J. Gene Expression Markers of Prognostic Importance for Prostate Cancer Risk in Patients with Benign Prostate Hyperplasia. Annu Int Conf IEEE Eng Med Biol Soc. 2022, 2022, 73–76. [Google Scholar] [CrossRef] [PubMed]
- Cheng, C.; Song, D.; Wu, Y.; Liu, B. RAC3 Promotes Proliferation, Migration and Invasion via PYCR1/JAK/STAT Signaling in Bladder Cancer. Front Mol Biosci 2020, 7, 218. [Google Scholar] [CrossRef] [PubMed]
- Engers, R.; Ziegler, S.; Mueller, M.; Walter, A.; Willers, R.; Gabbert, H.E. Prognostic relevance of increased Rac GTPase expression in prostate carcinomas. Endocr Relat Cancer. 2007, 14, 245–56. [Google Scholar] [CrossRef] [PubMed]
- Kudryavtseva, A.V.; Lukyanova, E.N.; Kharitonov, S.L.; Nyushko, K.M.; Krasheninnikov, A.A.; Pudova, E.A.; et al. Bioinformatic identification of differentially expressed genes associated with prognosis of locally advanced lymph node-positive prostate cancer. J Bioinform Comput Biol. 2019, 17, 1950003. [Google Scholar] [CrossRef]
- Tang, L.; Chen, X.; Hou, J.; Wei, X. CXCL14 in prostate cancer: complex interactions in the tumor microenvironment and future prospects. J Transl Med. 2025, 23, 9. [Google Scholar] [CrossRef]
- Chen, J.; Ying, X.M.; Huang, X.M.; Huang, P.; Yan, S.C. Association between polymorphisms in selected inflammatory response genes and the risk of prostate cancer. Onco Targets Ther. 2016, 9, 223–9. [Google Scholar] [CrossRef]
- Qi, F.; Gao, N.; Li, J.; Zhou, C.; Jiang, J.; Zhou, B.; et al. A multidimensional recommendation framework for identifying biological targets to aid the diagnosis and treatment of liver metastasis in patients with colorectal cancer. Mol Cancer. 2024, 23, 239. [Google Scholar] [CrossRef]
- Kalungi, F.; Nsubuga, A.; Anywar, G. Network analysis and molecular docking studies of quercetin as a potential treatment for prostate cancer. In Silico Pharmacol. 2023, 11, 24. [Google Scholar] [CrossRef]
- Chi, H.C.; Lin, Y.H.; Wu, Y.H.; Chang, C.C.; Wu, C.H.; Yeh, C.T.; et al. CCL16 is a pro-tumor chemokine that recruits monocytes and macrophages to promote hepatocellular carcinoma progression. Am J Cancer Res. 2024, 14, 3600–3613. [Google Scholar] [CrossRef]
- Ni, D.; Wu, J.; Pan, J.; Liang, Y.; Xu, Z.; Yan, Z.; et al. The value of a metabolic and immune-related gene signature and adjuvant therapeutic response in pancreatic cancer. Front Genet. 2025, 15, 1475378. [Google Scholar] [CrossRef]
- Kowalewski, A.; Jaworski, D.; Borowczak, J.; Maniewski, M.; Szczerbowski, K.; Antosik, P.; et al. TOLLIP Protein Expression Predicts Unfavorable Outcome in Renal Cell Carcinoma. Int J Mol Sci. 2022, 23, 14702. [Google Scholar] [CrossRef] [PubMed]
- Yao, L.; Chen, X.; Fang, Y.; Huang, Y.; Wu, K.; Huang, X. et. Multi-Omics Analysis of Aberrances and Functional Implications of IRF5 in Digestive Tract Tumours. J Cell Mol Med. 2025, 29, e70433. [Google Scholar] [CrossRef] [PubMed]
- Wang, C.; Dong, D.; Zhao, N.; Liu, Y.; Bai, C.; Hua, J.; et al. Tumor-derived CCL15 regulates RNA m6A methylation in cancer-associated fibroblasts to promote hepatocellular carcinoma growth. Cancer Lett. 2024, 611, 217420. [Google Scholar] [CrossRef] [PubMed]
- Ahmat Amin, M.K.B.; Shimizu, A.; Zankov, D.P.; Sato, A.; Kurita, S.; Ito, M.; et al. Epithelial membrane protein 1 promotes tumor metastasis by enhancing cell migration via copine-III and Rac1. Oncogene. 2018, 37, 5416–5434. [Google Scholar] [CrossRef]
- Skoulidis, F.; Li, B.T.; Dy, G.K.; Price, T.J.; Falchook, G.S.; Wolf, J.; et al. Sotorasib for Lung Cancers with KRAS p.G12C Mutation. N Engl J Med. 2021, 384, 2371–2381. [Google Scholar] [CrossRef] [PubMed]
- Sutera, P.; Kim, J.; Kumar, R.; Deek, R.A.; Stephenson, R.; Mayer, T.; et al. PIK3/Akt/mTOR pathway alterations in metastatic castration-sensitive prostate cancer. Prostate. 2024, 84, 1301–1308. [Google Scholar] [CrossRef]
- Kim, J.K.; Jung, Y.; Wang, J.; Joseph, J.; Mishra, A.; Hill, E.E.; et al. TBK1 regulates prostate cancer dormancy through mTOR inhibition. Neoplasia. 2013, 15, 1064–74. [Google Scholar] [CrossRef]
- Tang, K.D.; Ling, M.T. Targeting drug-resistant prostate cancer with dual PI3K/mTOR inhibition. Curr Med Chem. 2014, 21, 3048–56. [Google Scholar] [CrossRef]
- Cui, K.; Song, N.; Fan, Y.; Zeng, L.; Shi, P.; Wang, Z.; et al. A two-sample Mendelian randomization analysis: causal association between chemokines and pan-carcinoma. Front Genet. 2023, 14, 1285274. [Google Scholar] [CrossRef]
- Qian, D.; He, L.; Zhang, Q.; Li, W.; Tang, D.; Wu, C.; et al. Cathepsin K: A Versatile Potential Biomarker and Therapeutic Target for Various Cancers. Curr Oncol. 2022, 29, 5963–5987. [Google Scholar] [CrossRef]
- Ye, Z.; Deng, X.; Zhang, J.; Shao, R.; Song, C.; Zhao, J.; et al. Causal relationship between immune cells and prostate cancer: a Mendelian randomization study. Front Cell Dev Biol. 2024, 12, 1381920. [Google Scholar] [CrossRef] [PubMed]
- Iacobas, D.A. Powerful Quantifiers for Cancer Transcriptomics. World J Clinical Oncology 2020, 11, 679-704 https://www.wjgnet.com/2218-4333/full/v11/i9/679.htm.
- Horoszewicz, J.S.; Leong, S.S.; Kawinski, E.; Karr, J.P.; Rosenthal, H.; Chu, T.M.; et al. LNCaP model of human prostatic carcinoma. Cancer Res. 1983, 43, 1809–1818. [Google Scholar]
- Alimirah, F.; Chen, J.; Basrawala, Z.; Xin, H.; Choubey, D. DU-145 and PC-3 human prostate cancer cell lines express androgen receptor: Implications for the androgen receptor functions and regulation. FEBS Lett. 2006, 580, 2294–2300. [Google Scholar] [CrossRef] [PubMed]
- Remodeling of DNA Transcription Genomic Fabric in Capridine-Treated LNCaP Human Prostate Cancer Cell Line. Available online at: https://www.ncbi.nlm.nih.gov/geo/query/acc.cgi?acc=GSE72414 (Accessed December 12, 2024).
- Remodeling of Major Genomic Fabrics and Their Interplay in Capridine-Treated DU145 Classic Human Prostate Cancer. Available online at: https://www.ncbi.nlm.nih.gov/geo/query/acc.cgi?acc=GSE72333 (Accessed December 12, 2024).
- Iacobas, D.A.; Mgbemena, V.; Iacobas, S.; Menezes, K.M.; Wang, H.; Saganti, P.B. Genomic fabric remodeling in metastatic clear cell renal cell carcinoma (ccRCC): A new paradigm and proposal for a personalized gene therapy approach. Cancers, 2020, 12, 3678. [CrossRef]
- Zhong, M.; Clarke, S.; Vo, B.T.; Khan, S.A. The essential role of Giα2 in prostate cancer cell migration. Mol Cancer Res. 2012, 10, 1380–8. [Google Scholar] [CrossRef] [PubMed]
- Raymond, J.R. Jr.; Appleton, K.M.; Pierce, J.Y.; Peterson, Y.K. Suppression of GNAI2 message in ovarian cancer. J Ovarian Res. 2014, 7, 6. [Google Scholar] [CrossRef]
- Sena, L.A.; Salles, D.C.; Engle, E.L.; Zhu, Q.; Tukachinsky, H.; Lotan, T.L.; et al. Mismatch repair-deficient prostate cancer with parenchymal brain metastases treated with immune checkpoint blockade. Cold Spring Harb Mol Case Stud. 2021, 7, a006094. [Google Scholar] [CrossRef]
- Schwarze, S.R.; Luo, J.; Isaacs, W.B.; Jarrard, D.F. Modulation of CXCL14 (BRAK) expression in prostate cancer. Prostate, 2005, 64, 67-74. [CrossRef]
- Mak, P.; Li, J.; Samanta, S.; Mercurio, A.M. ERβ regulation of NF-kB activation in prostate cancer is mediated by HIF-1. Oncotarget. 2015, 6, 40247–54. [Google Scholar] [CrossRef]
- Zhao, Y.; Chen, W.; Zhu, W.; Meng, H.; Chen, J.; Zhang, J. Overexpression of Interferon Regulatory Factor 7 (IRF7) Reduces Bone Metastasis of Prostate Cancer Cells in Mice. Oncol Res. 2017, 25, 511–522. [Google Scholar] [CrossRef]
- Deveci Ozkan, A.; Kaleli, S.; Onen, H.I.; Sarihan, M.; Guney Eskiler, G.; Kalayci Yigin, A.; et al. Anti-inflammatory effects of nobiletin on TLR4/TRIF/IRF3 and TLR9/IRF7 signaling pathways in prostate cancer cells. Immunopharmacol Immunotoxicol. 2020, 42, 93–100. [Google Scholar] [CrossRef]
- Mohite, P.; Lokwani, D.K.; Sakle, N.S. Exploring the therapeutic potential of SGLT2 inhibitors in cancer treatment: integrating in silico and in vitro investigations. Naunyn Schmiedebergs Arch Pharmacol. 2024, 397, 6107–6119. [Google Scholar] [CrossRef]
- Mauri, G.; Chiodoni, C.; Parenza, M.; Arioli, I.; Tripodo, C.; Colombo, M.P. Ultrasound-guided intra-tumor injection of combined immunotherapy cures mice from orthotopic prostate cancer. Cancer Immunol Immunother. 2013, 62, 1811–9. [Google Scholar] [CrossRef] [PubMed]
- Chakraborty, P.K.; Zhang, Y.; Coomes, A.S.; Kim, W.J.; Stupay, R.; Lynch, L.D.; et al. G protein-coupled receptor kinase GRK5 phosphorylates moesin and regulates metastasis in prostate cancer. Cancer Res 2014, 74, 3489–3500. [Google Scholar] [CrossRef] [PubMed]
- Li, X.; Chen, Y.; Dong, Y.; Ma, Z.; Zheng, W.; Lin, Y. Prediction of immune infiltration and prognosis for patients with gastric cancer based on the immune-related genes signature. Heliyon. 2023, 9, e22433. [Google Scholar] [CrossRef]
- Mundra, V.; Yang, Y.; von Itzstein, M.S.; Fattah, F.; Gonugunta, A.S.; Hannan, R.; et al. Systemic immune parameters after prior radiation therapy in patients receiving immune checkpoint inhibitors. Transl Oncol. 2023, 34, 101689. [Google Scholar] [CrossRef]
- Ide, H.; Nakagawa, T.; Terado, Y.; Kamiyama, Y.; Muto, S.; Horie, S. Tyk2 expression and its signaling enhances the invasiveness of prostate cancer cells. Biochem Biophys Res Commun, 2008, 369, 292-296. [CrossRef]
- Yuan, S.; Wang, L.; Zhang, H.; Xu, F.; Zhou, X.; Yu, L.; et al. Mendelian randomization and clinical trial evidence supports TYK2 inhibition as a therapeutic target for autoimmune diseases. EBioMedicine. 2023, 89, 104488. [Google Scholar] [CrossRef]
- Zhang, X.; Dong, K.; Zhang, J.; Kuang, T.; Luo, Y.; Yu, J.; et al. GNB1 promotes hepatocellular carcinoma progression by targeting BAG2 to activate P38/MAPK signaling. Cancer Sci. 2023, 114, 2001–2013. [Google Scholar] [CrossRef]
- Vindrieux, D.; Escobar, P.; Lazennec, G. Emerging roles of chemokines in prostate cancer. Endocr Relat Cancer, 2009, 16, 663-673. [CrossRef]
- Goleij, P.; Tabari, M.A.K.; Khandan, M.; Poudineh, M.; Rezaee, A.; Sadreddini, S.; et al. Genistein in focus: pharmacological effects and immune pathway modulation in cancer. Naunyn Schmiedebergs Arch Pharmacol. 2024. [Google Scholar] [CrossRef]
- Vuk-Pavlovic, S., Bulur, P.A., Lin, Y., Qin, R., Szumlanski, C.L., Zhao, X. et al. Immunosuppressive CD14+HLA-DRlow/- monocytes in prostate cancer. Prostate, 2010, 70, 443-455. [CrossRef]
- Takahashi, I.; Takagi, K.; Yamaguchi-Tanaka, M.; Sato, A.; Sato, M.; Miki, Y.; et al. Toll-like receptor (TLR) 4 is a potent prognostic factor in prostate cancer associated with proliferation and invasion. Pathol Res Pract. 2024, 260, 155379. [Google Scholar] [CrossRef]
- Nickols, N.G.; Nazarian, R.; Zhao, S.G.; Tan, V.; Uzunangelov, V.; Xia, Z.; et al. MEK-ERK signaling is a therapeutic target in metastatic castration resistant prostate cancer. Prostate Cancer Prostatic Dis, 2019, 22, 531-538. [CrossRef]
- Emelyanova, A.; Zolotovskaia, M.; Poddubskaya, E.; Modestov, A.; Buzdin, A.; Kuzmin, D. Activation of P38 MAPK Signaling Cascade is Linked with Clinical Outcomes and Therapeutic Responses in Human Cancers. Biochemistry (Mosc). 2024, 89, 2155–2173. [Google Scholar] [CrossRef]
- Iacobas, D.A.; Iacobas, S.; Lee, P.R.; Cohen, J.E.; Fields, R.D. Coordinated Activity of Transcriptional Networks Responding to the Pattern of Action Potential Firing in Neurons. Genes, 2019, 10, 754. [CrossRef]
- Basic Laws of Chemistry–Theories–Principles. Available online at: https://azchemistry.com/basic-laws-of-chemistry. (Accessed October 10, 2024.
- Wang, J.; Ouyang, X.; Zhu, W.; Yi, Q.; Zhong, J. The Role of CXCL11 and its Receptors in Cancer: Prospective but Challenging Clinical Targets. Cancer Control, 2024, 10732748241241162. [CrossRef]
- Ullah, A.; Jiao, W.; Shen, B. The role of proinflammatory cytokines and CXC chemokines (CXCL1-CXCL16) in the progression of prostate cancer: insights on their therapeutic management. Cell Mol Biol Lett, 2024, 29, 73. [CrossRef]
- Iacobas, D.; Wen, J.; Iacobas, S.; Schwartz, N.; Putterman, C. Remodeling of Neurotransmission, Chemokine, and PI3K-AKT Signaling Genomic Fabrics in Neuropsychiatric Systemic Lupus Erythematosus. Genes (Basel). 2021, 12, 251. [Google Scholar] [CrossRef]
- Zhao, S.; Zhang, Y.; Zhang, Q.; Wang, F.; Zhang, D. Toll-like receptors and prostate cancer. Front Immunol, 2014, 5, 352. [CrossRef]
- Michalaki, V., Syrigos, K., Charles, P., Waxman, J. Serum levels of IL-6 and TNF-alpha correlate with clinicopathological features and patient survival in patients with prostate cancer. Br J Cancer, 2004, 90, 2312-2316. [CrossRef]
- Bak, S.P.; Barnkob, M.S.; Bai, A.; Higham, E.M.; Wittrup, K.D.; Chen, J. Differential requirement for CD70 and CD80/CD86 in dendritic cell-mediated activation of tumor-tolerized CD8 T cells. J Immunol, 2012, 189, 1708-1716. [CrossRef]
- Chen, S.; Deng, B.; Zhao, F.; You, H.; Liu, Y.; Xie, L.; et al. Silencing SPP1 in M2 macrophages inhibits the progression of castration-resistant prostate cancer via the MMP9/TGFbeta1 axis. Transl Androl Urol, 2024, 13, 1239-1255. [CrossRef]
- Messex, J.K.; Byrd, C.J.; Thomas, M.U.; Liou, G.Y. Macrophages Cytokine Spp1 Increases Growth of Prostate Intraepithelial Neoplasia to Promote Prostate Tumor Progression. Int J Mol Sci, 2022, 23. [CrossRef]
- KEGG: Kyoto Encyclopedia of Genes and Genomes. Available online at: www.kegg.jp. (Accessed December 12, 2024).
- Krämer, A. , Green, J., Pollard, J, Jr., Tugendreich, S. Causal analysis approaches in Ingenuity Pathway Analysis. Bioinformatics. 2014, 30, 523–30. [Google Scholar] [CrossRef] [PubMed]
- Mulholland, D.J.; Kobayashi, N.; Ruscetti, M.; Zhi, A.; Tran, L.M.; Huang, J.; et al. Pten loss and RAS/MAPK activation cooperate to promote EMT and metastasis initiated from prostate cancer stem/progenitor cells. Cancer Res, 2012, 72, 1878-1889. [CrossRef]
- KEGG-designed functional pathways of the excretory system. Available online at: https://www.kegg.jp/pathway/hsa04960 / 04961 / 04962 / 04964 / 04964 / 04966. (Accessed December 12, 2024).
- Iacobas, D.A.; Iacobas, S. Towards a Personalized Cancer Gene Therapy: A Case of Clear Cell Renal Cell Carcinoma. Cancer & Oncol Res. 2017, 5, 45-52. [CrossRef]
- Iacobas, D.A.; Iacobas, S. Papillary Thyroid Cancer Remodels the Genetic Information Processing Path-ways. Genes, 2024, 15, 621. [CrossRef]
- Iacobas, D.A. Biomarkers, Master Regulators and Genomic Fabric Remodeling in a Case of Papillary Thyroid Carcinoma. Genes, 2020, 11, 1030. [CrossRef]
- Iacobas, D.A.; Tuli, N.Y.; Iacobas, S.; Rasamny, J.K.; Moscatello, A.; Geliebter, J.; et al. Gene master regulators of papillary and anaplastic thyroid cancers. Oncotarget. 2017, 9, 2410–2424. [Google Scholar] [CrossRef] [PubMed]
- Hierarchal gene master regulators of papillary (BCPAP) and anaplastic (8505C) thyroid cancer cell lines. Available online at: https://www.ncbi.nlm.nih.gov/geo/query/acc.cgi?acc=GSE97002 (Accessed December 12, 2024).
- Hierarchal gene master regulators of adenocarcinomic human alveolar basal epithelial cells A549. Available online at: https://www.ncbi.nlm.nih.gov/geo/query/acc.cgi?acc=GSE116361 (Accessed December 12, 2024).
- Transcriptomic effects of Capridine on the acute promyelocytic leukemia HL-60 cell line. Available online at: https://www.ncbi.nlm.nih.gov/geo/query/acc.cgi?acc=GSE72415 (Accessed December 12, 2024).
- Qiu, X.; Guo, D.; Du, J.; Bai, Y.; Wang, F. A novel biomarker, MRPS12 functions as a potential oncogene in ovarian cancer and is a promising prognostic candidate. Medicine (Baltimore). 2021, 100, e24898. [Google Scholar] [CrossRef] [PubMed]
- Wu, L.H.; Wang, X.X.; Wang, Y.; Wei, J.; Liang, Z.R.; Yan, X.; et al. Construction and validation of a prognosis signature based on the immune microenvironment in gastric cancer. Front Surg. 2023, 10, 1088292. [Google Scholar] [CrossRef]
- Muthu, M.; Chun, S.; Gopal, J.; Park, G.-S.; Nile, A.; Shin, J.; et al. The MUDENG Augmentation: A Genesis in Anti-Cancer Therapy? Int. J. Mol. Sci. 2020, 21, 5583. [Google Scholar] [CrossRef]
- Cui, X.; Shang, X.; Xie, J.; Xie, C.; Tang, Z.; Luo, Q.; et al. Cooperation between IRTKS and deubiquitinase OTUD4 enhances the SETDB1-mediated H3K9 trimethylation that promotes tumor metastasis via suppressing E-cadherin expression. Cancer Lett. 2023, 575, 216404. [Google Scholar] [CrossRef]
- de Almeida, F.N.; Vasciaveo, A.; Antao, A.M.; Zou, M.; Di Bernardo, M.; de Brot, S.; et al. A forward genetic screen identifies Sirtuin1 as a driver of neuroendocrine prostate cancer. bioRxiv [Preprint]. 2024,. [CrossRef]
- German, B.; Alaiwi, S.A.; Ho, K.L.; Nanda, J.S.; Fonseca, M.A.; Burkhart, D.L.; et al. MYBL2 Drives Prostate Cancer Plasticity: Inhibiting Its Transcriptional Target CDK2 for RB1-Deficient Neuroendocrine Prostate Cancer. Cancer Res Commun. 2024, 4, 2295–2307. [Google Scholar] [CrossRef]
- Kim, M.; Tamukong, P.; Galvan, G.C.; Yang, Q.; De Hoedt, A.; Freeman, M.R.; et al. Prostate cancers with distinct transcriptional programs in Black and White men. Genome Med. 2024, 16, 92. [Google Scholar] [CrossRef]
- Moran, B.; Rahman, A.; Palonen, K.; Lanigan, F.T.; Gallagher, W.M. Master transcriptional regulators in cancer: discov-ery via reverse engineering approaches and subsequent validation. Cancer Res. 2017, 77, 2186–90. [Google Scholar] [CrossRef]
- Sledziona, J.; Burikhanov, R.; Araujo, N.; Jiang, J.; Hebbar, N.; Rangnekar, V.M. The Tumor Suppressor Par-4 Regulates Adipogenesis by Transcriptional Repression of PPARγ. Cells 2024, 13, 1495. [Google Scholar] [CrossRef]
- Zhou, Q.; Wu, F.; Chen, Y.; Fu, J.; Zhou, L.; Xu, Y.; et al. (2024) Reynoutria multiflora (Thunb.) Moldenke and its ingredient suppress lethal prostate cancer growth by inducing CDC25B-CDK1 mediated cell cycle arrest. Bioorg Chem. 152, 107731. [CrossRef]
- Batson, J.; Maccarthy-Morrogh, L.; Archer, A.; Tanton, H.; Nobes, C.D. EphA receptors regulate prostate cancer cell dis-semination through Vav2-RhoA mediated cell-cell repulsion. Biol Open. 2014, 3, 453–62. [Google Scholar] [CrossRef] [PubMed]
- Batson, J.; Astin, J.W.; Nobes, C.D. Regulation of contact inhibition of locomotion by Ephephrin signalling. J. Microsc. 2013, 251, 232–241.
- Wang, C.; Jiang, X.; Zhao, Q.; Xie, Z.; Cai, H. The diagnostic or prognostic values of FADD in cancers based on pan-cancer analysis. Biomed Rep. 2023, 19, 77. [Google Scholar] [CrossRef] [PubMed]
- Zhang, Z.; Zhang, F.; Xie, W.; Niu, Y.; Wang, H.; Li, G.; et al. Induced Necroptosis and Its Role in Cancer Immunotherapy. Int. J. Mol. 2024, Sci. 25, 10760. [Google Scholar] [CrossRef]
- McCann, C.; Crawford, N.; Majkut, J.; Holohan, C.; Armstrong, C.W.D.; Maxwell, P.J.; et al. Cytoplasmic FLIP(S) and nuclear FLIP(L) mediate resistance of castrate-resistant prostate cancer to apoptosis induced by IAP antagonists. Cell Death Dis. 2018, 9, 1081. [Google Scholar] [CrossRef] [PubMed]
- Ahmed, M.; Lai, T.H.; Zada, S.; Hwang, J.S.; Pham, T.M.; Yun, M.; et al. Functional Linkage of RKIP to the Epithelial to Mesenchymal Transition and Autophagy during the Development of Prostate Cancer. Cancers 2018, 10, 273. [Google Scholar] [CrossRef]
- Lu, Z.; Wu, C.; Zhu, M.; Song, W.; Wang, H.; Wang, J.; et al. Ophiopogonin D’ induces RIPK1 dependent necroptosis in androgen dependent LNCaP prostate cancer cells. Int J Oncol, 2020, 56, 439-447. [CrossRef]
- Sabater, A.; Sanchis, P.; Seniuk, R.; Pascual, G.; Anselmino, N.; Alonso, D.F.; et al. Unmasking Neuroendocrine Prostate Cancer with a Machine Learning-Driven Seven-Gene Stemness Signature That Predicts Progression. Int. J. Mol. Sci. 2024, 25, 11356. [Google Scholar] [CrossRef]
- Manceau, C.; Fromont, G.; Beauval, J.-B.; Barret, E.; Brureau, L.; Créhange, G.; et al. Biomarker in Active Surveillance for Prostate Cancer: A Systematic Review. Cancers 2021, 13, 4251. [Google Scholar] [CrossRef]
- Moghaddam, S.; Jalali, A.; O’Neill, A.; Murphy, L.; Gorman, L.; Reilly, A.-M.; et al. Integrating Serum Biomarkers into Prediction Models for Biochemical Recurrence Following Radical Prostatectomy. Cancers, 2021, 13, 4162. [CrossRef]
- Hongo, H.; Kosaka, T.; Takayama, K.I.; Baba, Y.; Yasumizu, Y.; Ueda, K.; et al. G-protein signaling of oxytocin receptor as a potential target for cabazitaxel-resistant prostate cancer. PNAS Nexus, 2024. 3, pgae002. [CrossRef]
- Liu, H.; Yin, J.; Wang, H.; Jiang, G.; Deng, M.; Zhang, G.; et al. FOXO3a modulates WNT/beta-catenin signaling and suppresses epithelial-to-mesenchymal transition in prostate cancer cells. Cell Signal, 2015, 27, 510-518. [CrossRef]
- Huang, R.; Guo, L.; Gao, M.; Li, J.; Xiang, S. Research Trends and Regulation of CCL5 in Prostate Cancer. Onco Targets Ther, 2021, 14, 1417-1427. [CrossRef]
- Aldinucci, D.; Borghese, C.; Casagrande, N. The CCL5/CCR5 Axis in Cancer Progression. Cancers (Basel), 2020, 12. [CrossRef]
- Maeda, S.; Motegi, T.; Iio, A. Kaji, K.; Goto-Koshino, Y.; Eto, S. et al. Anti-CCR4 treatment depletes regulatory T cells and leads to clinical activity in a canine model of advanced prostate cancer. J Immunother Cancer, 2022, 10. [CrossRef]
- Rogers, E.N.; Jones, D.Z.; Kidd, N.C.; Yeyeodu, S.; Brock, G.; Ragin, C.; et al. Toll-like receptor-associated sequence variants and prostate cancer risk among men of African descent. Genes Immun, 2013, 14, 347-355. [CrossRef]
- Iacobas, D.A. The Genomic Fabric Perspective on the Transcriptome Between Universal Quantifiers and Personalized Genomic Medicine. Biol Theory 2016, 11, 123–137. [Google Scholar] [CrossRef]
- Tu, S.-M.; Trikannad, A.K.; Vellanki, S.; Hussain, M.; Malik, N.; Singh, S.R.; et al. Stem Cell Origin of Cancer: Clinical Implications beyond Immunotherapy for Drug versus Therapy Develop-ment in Cancer Care. Cancers, 2024, 16, 1151. [CrossRef]
- Tu, S.-M.; Chen, J.Z.; Singh, S.R.; Maraboyina, S.; Gokden, N.; Hsu, P.-C.; et al. Stem Cell Theory of Cancer: Clinical Implications for Cellular Metabolism and Anti-Cancer Metabolomics. Cancers, 2024, 16, 624. [CrossRef]
- San-Jose Manso, L.; Alfranca, A.; Moreno-Pérez, I.; Ruiz-Vico, M.; Velasco, C.; Toquero, P.; et al. Immunome profiling in prostate cancer: a guide for clinicians. Front Immunol. 2024, 15, 1398109. [Google Scholar] [CrossRef]
- Beer, T.M.; Kwon, E.D.; Drake, C.G.; Fizazi, K.; Logothetis, C.; Gravis, G.; et al. Randomized, double-blind, phase III trial of ipilimumab versus placebo in asymptomatic or minimally symptomatic patients with metastatic chemotherapy-naive castration-resistant prostate cancer. J Clin Oncol Off J Am Soc Clin Oncol. 2017, 35, 40–7. [Google Scholar] [CrossRef]
- Antonarakis, E.S.; Piulats, J.M.; Gross-Goupil, M.; Goh, J.; Ojamaa, K.; Hoimes, C.J.; et al. Pembrolizumab for treatment-refractory metastatic castration-resistant prostate cancer: multicohort, open-label phase II KEYNOTE-199 study. J Clin Oncol Off J Am Soc Clin Oncol. 2020, 38, 395–405. [Google Scholar] [CrossRef] [PubMed]
- Schwehn, P.M.; Falter-Braun, P. Inferring protein from transcript abundances using convolutional neural networks. BioData Mining 2025, 18, 18. [Google Scholar] [CrossRef] [PubMed]
- Mekic, R.; Zolotovskaia, M.A.; Sorokin, M.; Mohammad, T.; Shaban, N.; Musatov, I.; Tkachev, V.; et al. Number of human protein interactions correlates with structural, but not regulatory conservation of the respective genes. Front Genet. 2024, 15, 1472638. [Google Scholar] [CrossRef] [PubMed]
- Iacobas, D.A.; Zhang, D. Prostate cancer-induced remodeling of the topologies and in-terplay of the TLR (toll-like receptor) and chemokine signaling pathways, 2024,. [CrossRef]
Figure 1.
Significant expression regulation of the TLR-signaling pathway genes in cancer nodules “A” (a), “B” (b), and “C” (c) compared to normal surrounding tissue “N”. Regulated genes: AKT2/3 (v-akt murine thymoma viral oncogene homolog 2/3), CCL3 (chemokine (C-C motif) ligand 3), CD14 (CD14 molecule), CHUK (component of inhibitor of nuclear factor kappa B kinase complex), CTSK (cathepsin K), CXCL9/10/11 (chemokine (C-X-C motif) ligand 9/10/11), IFNAR1 (interferon alpha and beta receptor 1), IKBKG (inhibitor of kappa light polypeptide gene enhancer in B-cells, kinase gamma), IRAK1 (interleukin-1 receptor-associated kinase 1), IRF3/5/7/9 (interferon regulatory factor 3/5/7/9), JAK1 (Janus kinase 1), MAP2K1/2/3/4/6/7 (mitogen-activated protein kinase kinase 1/2/3/4/6/7), MAP3K7 (mitogen-activated protein kinase kinase kinase 7), MAPK9/10/11/13 (mitogen-activated protein kinase 9/10/11/13), MYD88 (myeloid differentiation primary response 88), NFKB1 (nuclear factor of kappa light polypeptide gene enhancer in B-cells 1), NFKBIA (nuclear factor of kappa light polypeptide gene enhancer in B-cells inhibitor, alpha), PIK3R1 (phosphoinositide-3-kinase, regulatory subunit 1 (alpha)), RAC1 (ras-related C3 botulinum toxin substrate 1 (rho family, small GTP binding protein Rac1)), SPP1 (secreted phosphoprotein 1), STAT1 (signal transducer and activator of transcription 1, 91kDa), TBK1 (TANK-binding kinase 1), TICAM1 (toll-like receptor adaptor molecule 1), TLR1/2/3/4/5 (toll-like receptor 1/2/3/4/5), TNF (tumor necrosis factor), TRAF6 (TNF receptor-associated factor 6, E3 ubiquitin protein ligase).
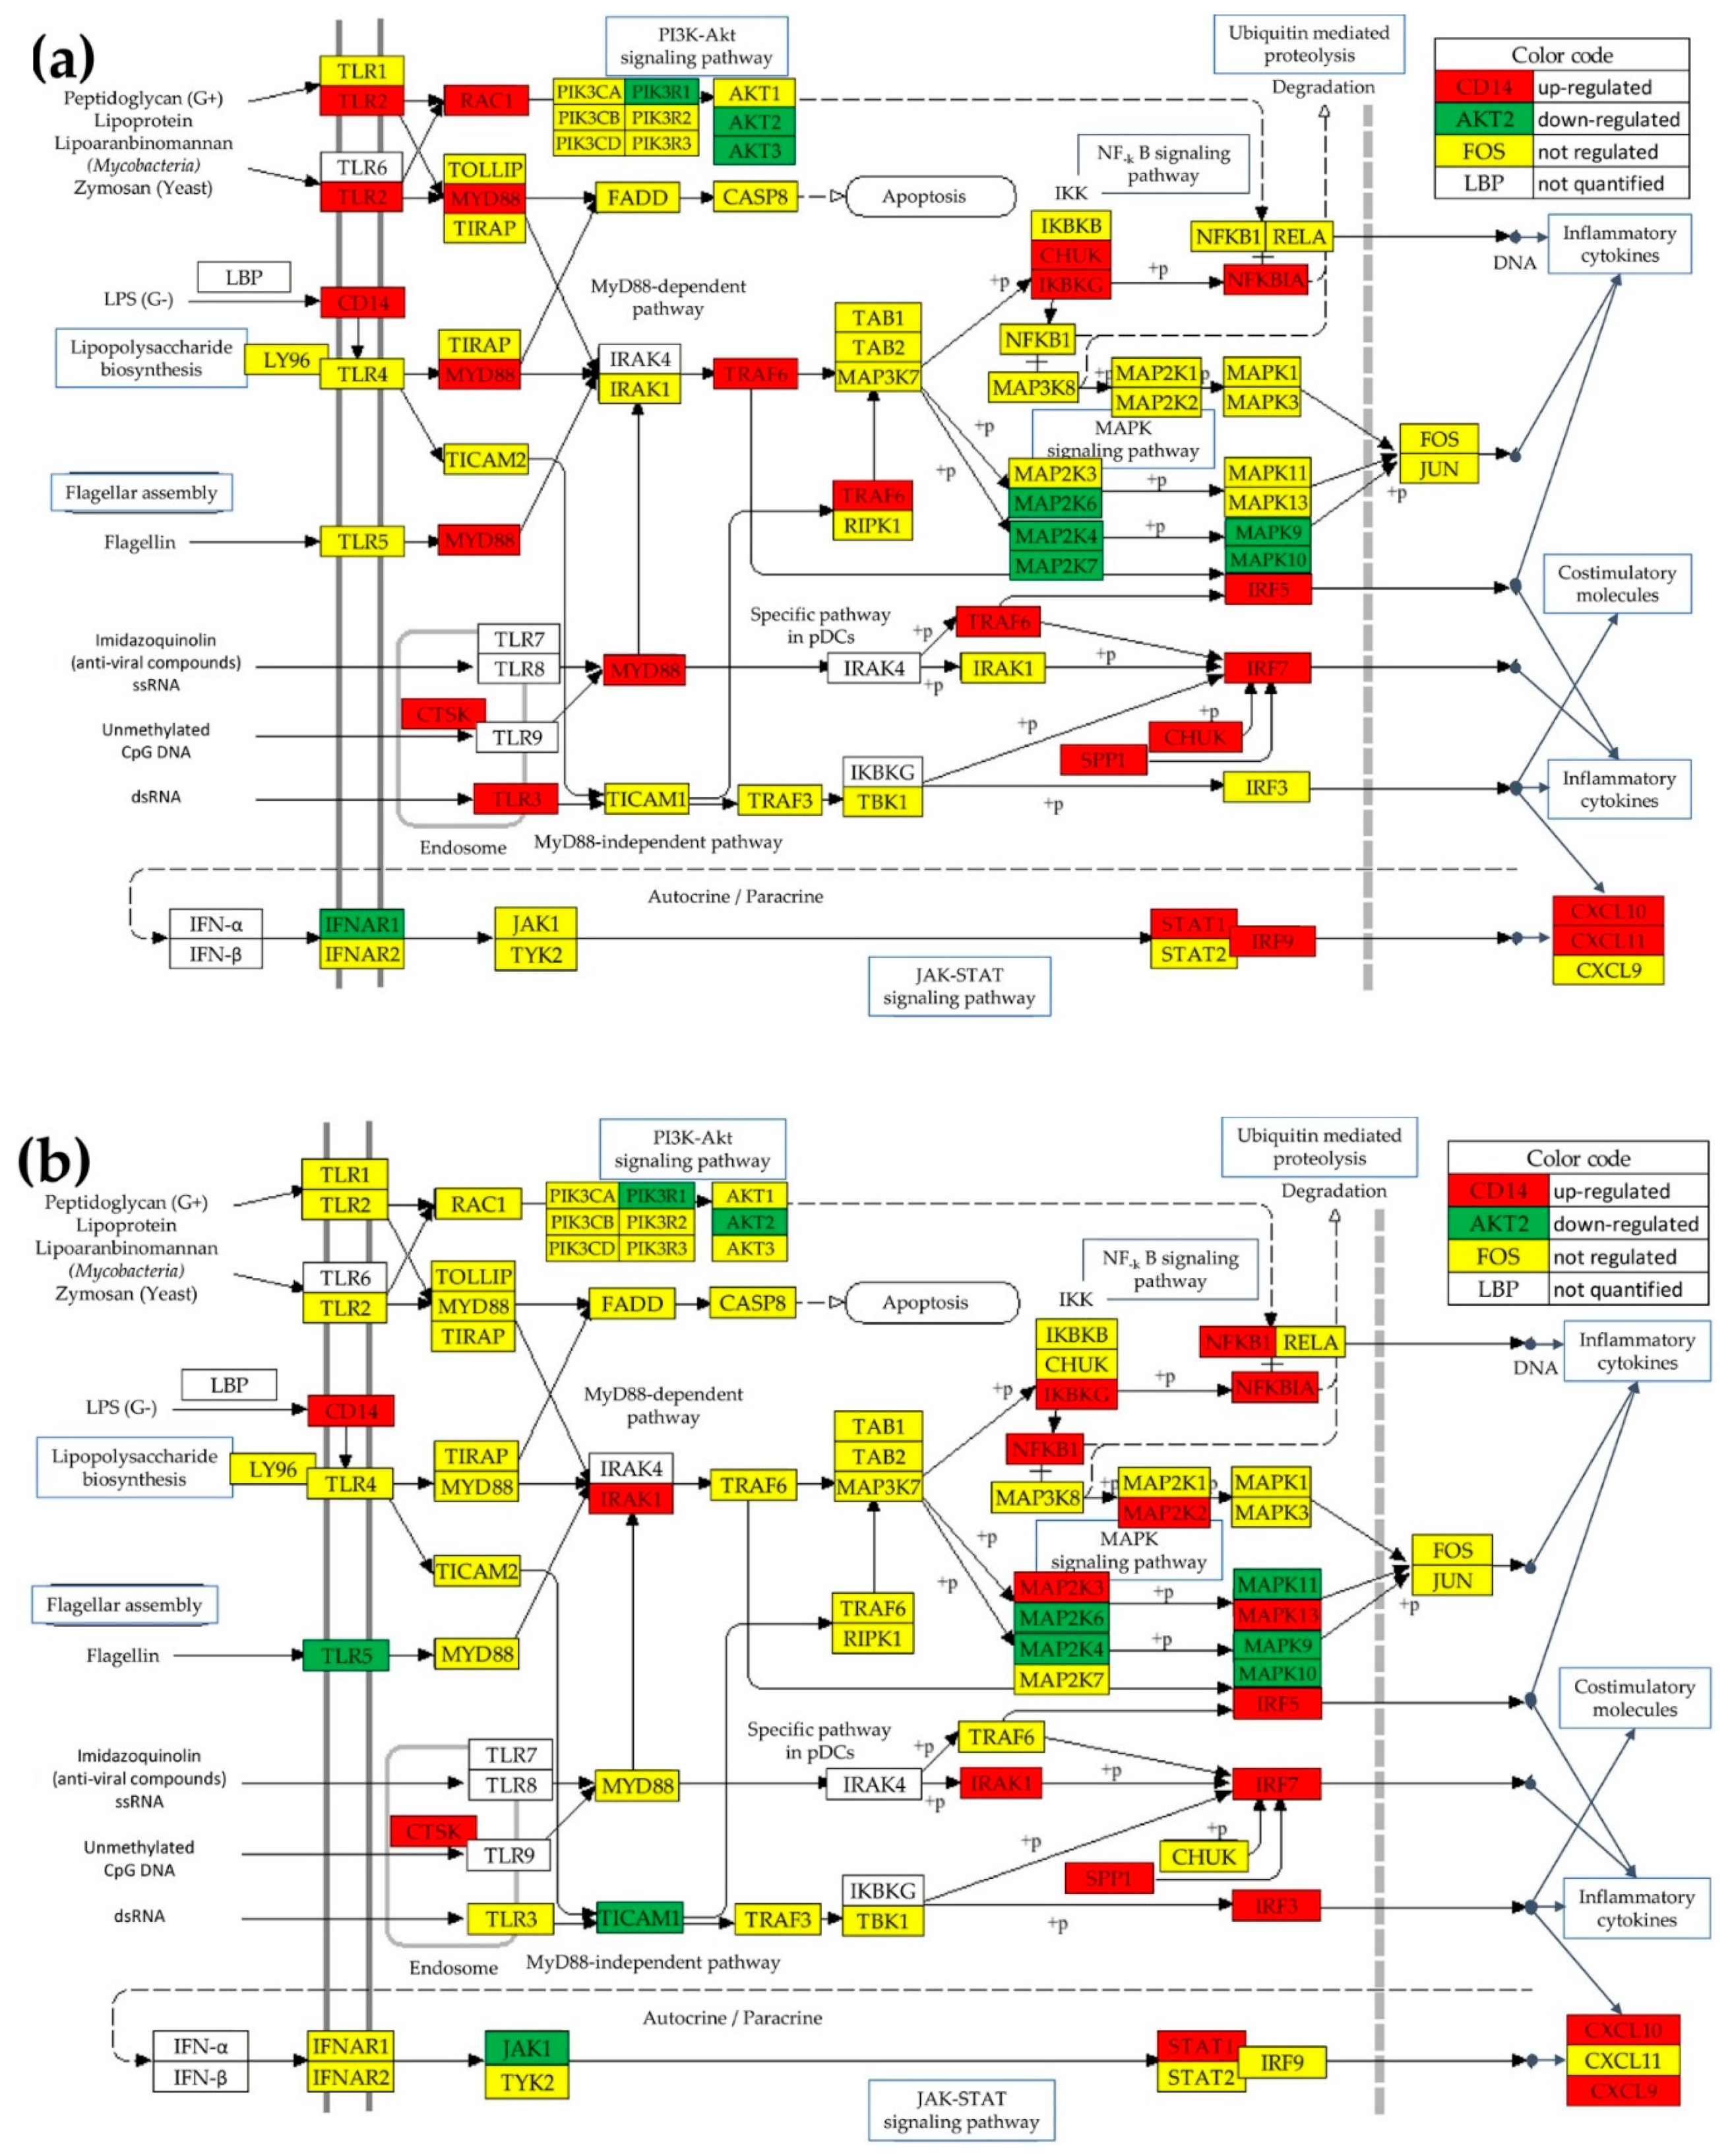
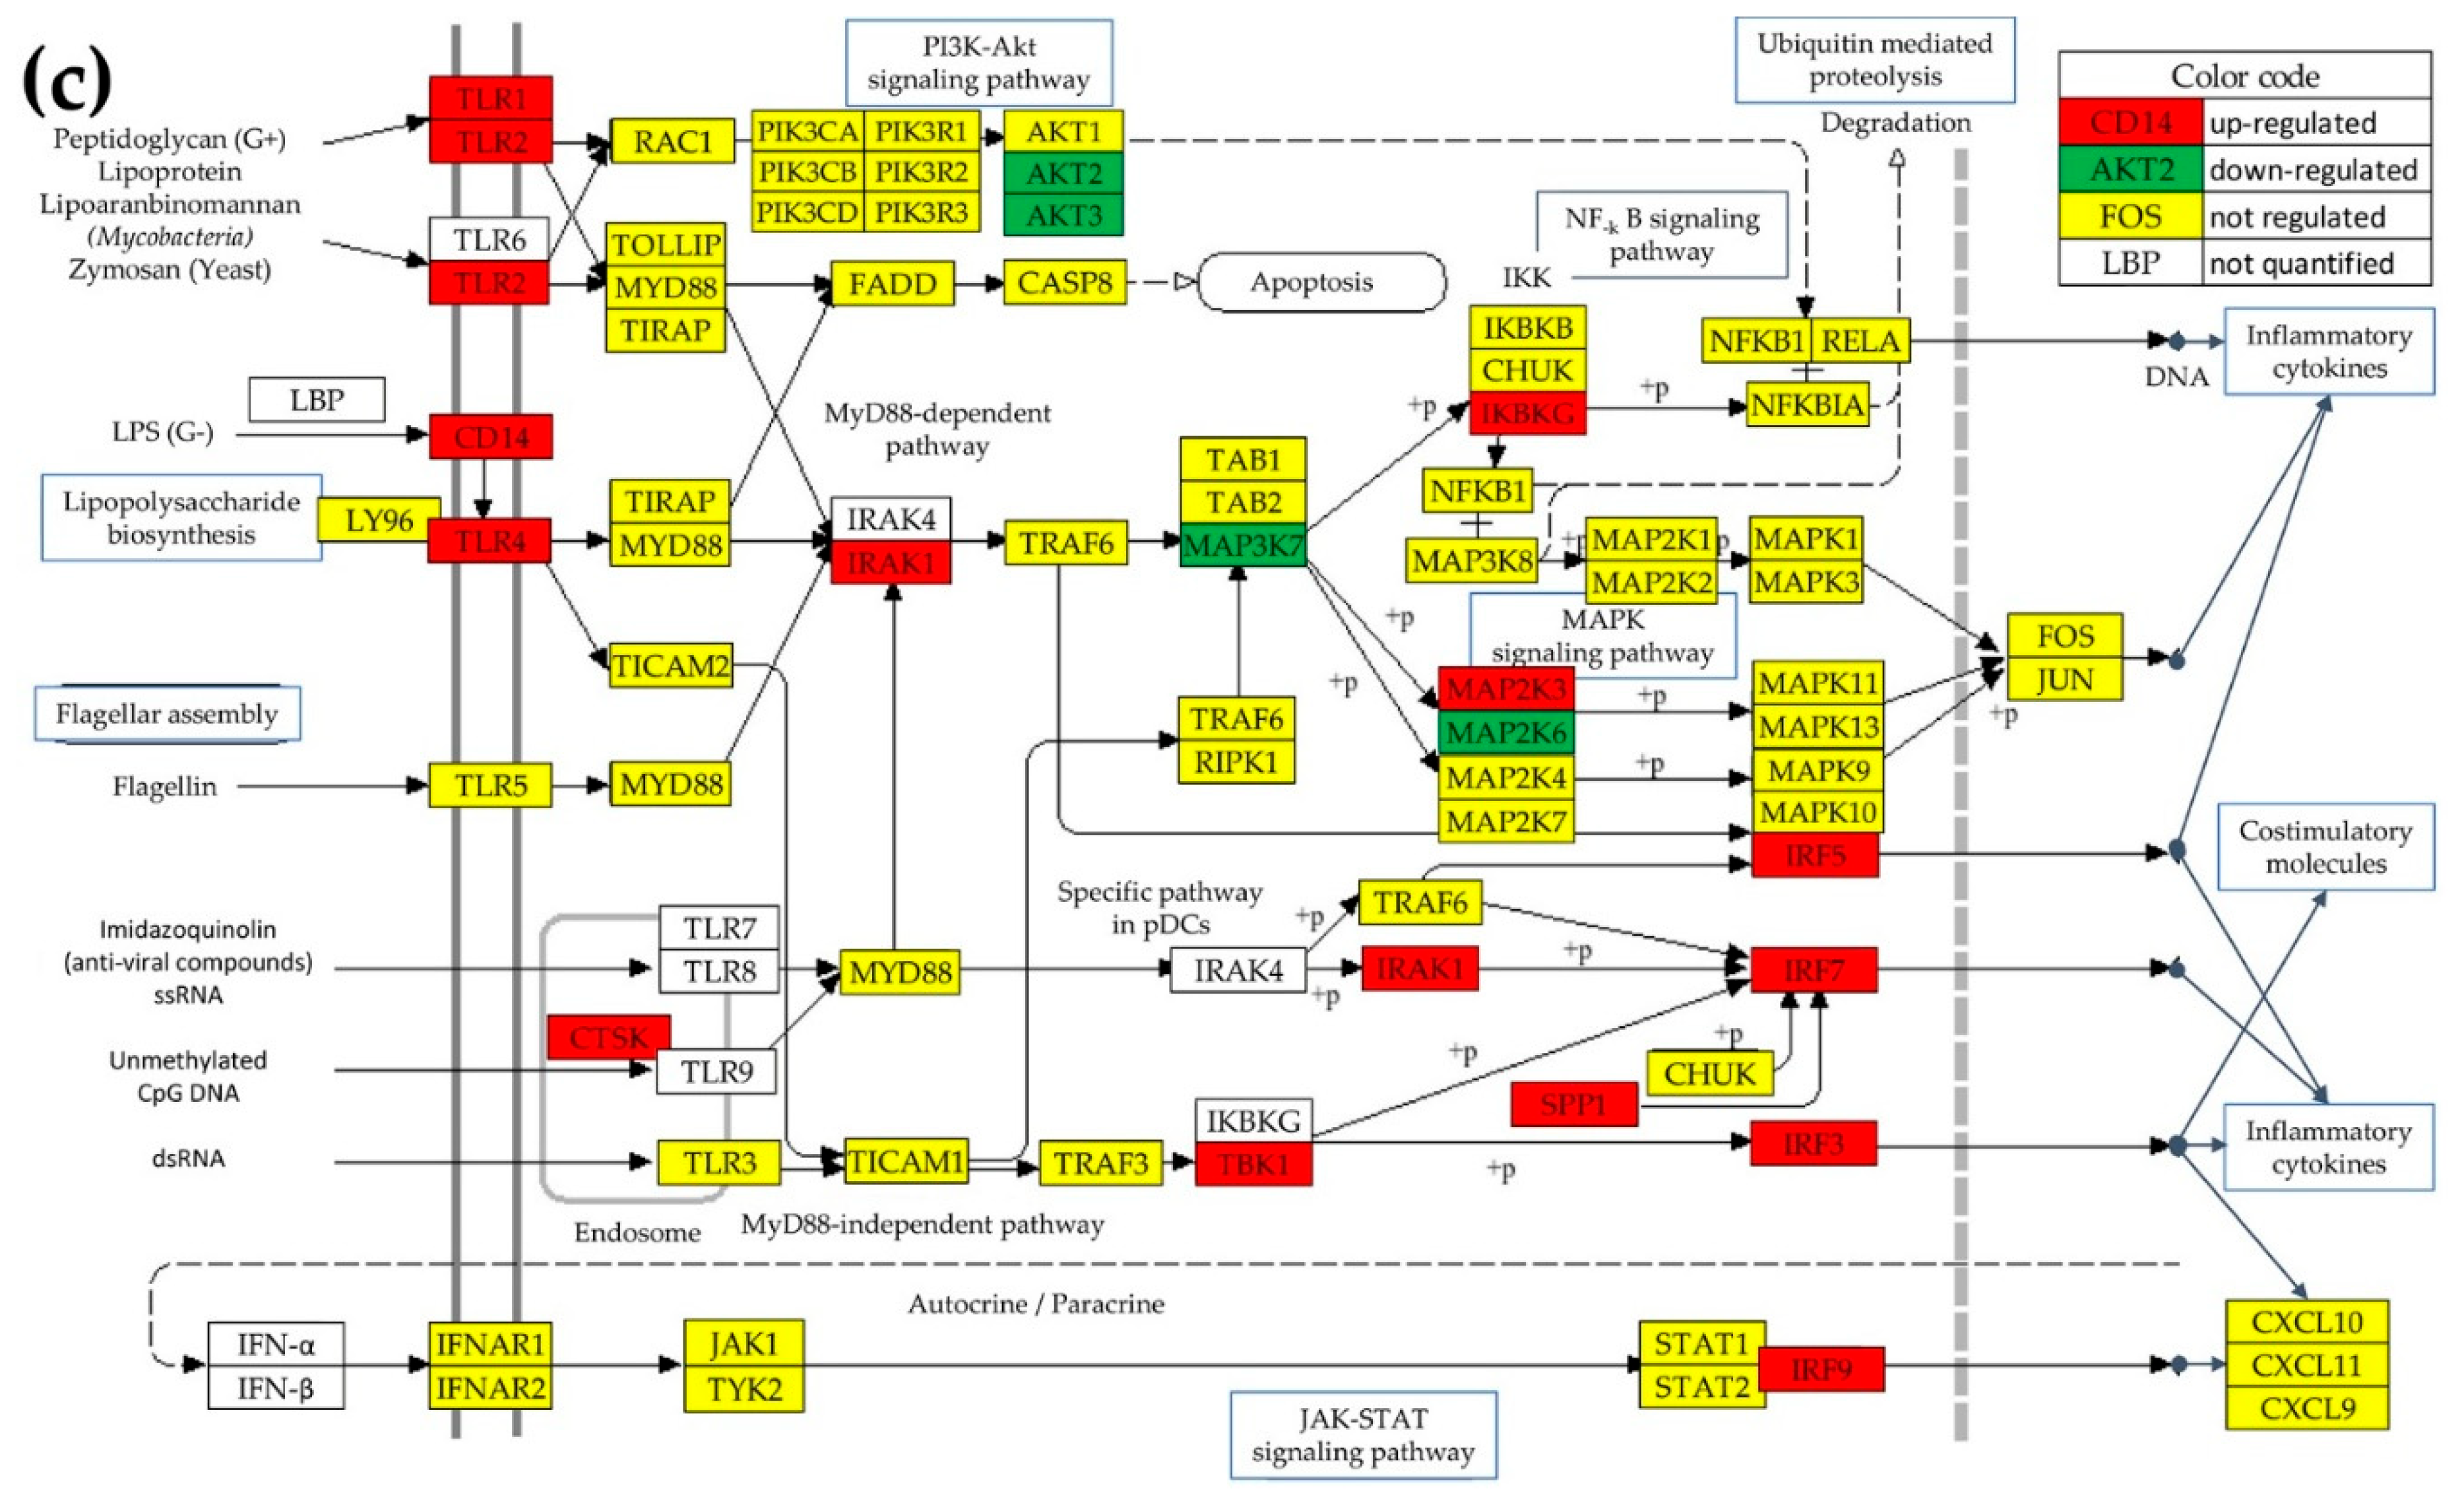
Figure 2.
Significant expression regulation of chemokine signaling pathway genes in the cancer nodules “A” (a), “B” (b), and “C” (c) compared to normal tissue “N”. Regulated genes: ADCY1/3/4/6 (adenylate cyclase 1/3/4/6), AKT2/3, ARBB1/2 (arrestin, beta 1/2), BCAR1 (BCAR1 scaffold protein, Cas family member), CCL2/3/14/15/16/18 (chemokine (C-C motif) ligand 2/3/14/15/16/18), CHUK, CXCL5/9/10/11/12/13/14/16, FOXO3 (forkhead box O3), GNAQ (guanine nucleotide binding protein (G protein), q polypeptide), GNB1/4 (guanine nucleotide binding protein (G protein), beta polypeptide 1/4), GNG4/5/7/8/10/12 (guanine nucleotide binding protein (G protein), gamma 4,/5,/7,/8,/10,/and 12), GRK6 (G protein-coupled receptor kinase 6), GSK3B (glycogen synthase kinase 3 beta), HRAS (Harvey rat sarcoma viral oncogene homolog), IKBKG, JAK2/3 (Janus kinase 2/3), LYN (LYN proto-oncogene, Src family tyrosine kinase), MAP2K1, MAPK10, NFKB1, PAK1 (p21 protein (Cdc42/Rac)-activated kinase 1), PARD3 (par-3 family cell polarity regulator), PIK3CG (phosphatidylinositol-4,5-bisphosphate 3-kinase, catalytic subunit gamma), PIK3R1, PLCB1/2 (phospholipase C, beta 1/2), PLCG1/2 (phospholipase C, gamma 1/2), PREX1 (phosphatidylinositol-3,4,5-trisphosphate-dependent Rac exchange factor 1), PRKACA/B (protein kinase, cAMP-dependent, catalytic, alpha/beta), PRKCZ (protein kinase C, zeta), PTK2B (protein tyrosine kinase 2 beta), PXN (paxillin), RAC1/3, RAF1 (Raf-1 proto-oncogene, serine/threonine kinase), RAP1A/B (member of RAS oncogene family), RHOA (ras homolog family member A), SHC2 (SHC adaptor protein 2), SRC (SRC proto-oncogene, non-receptor tyrosine kinase), STAT1/5B, VAV1/2 (vav 1/2 guanine nucleotide exchange factor), XCL1 (chemokine (C motif) ligand 1), XCR1 (chemokine (C motif) receptor 1).
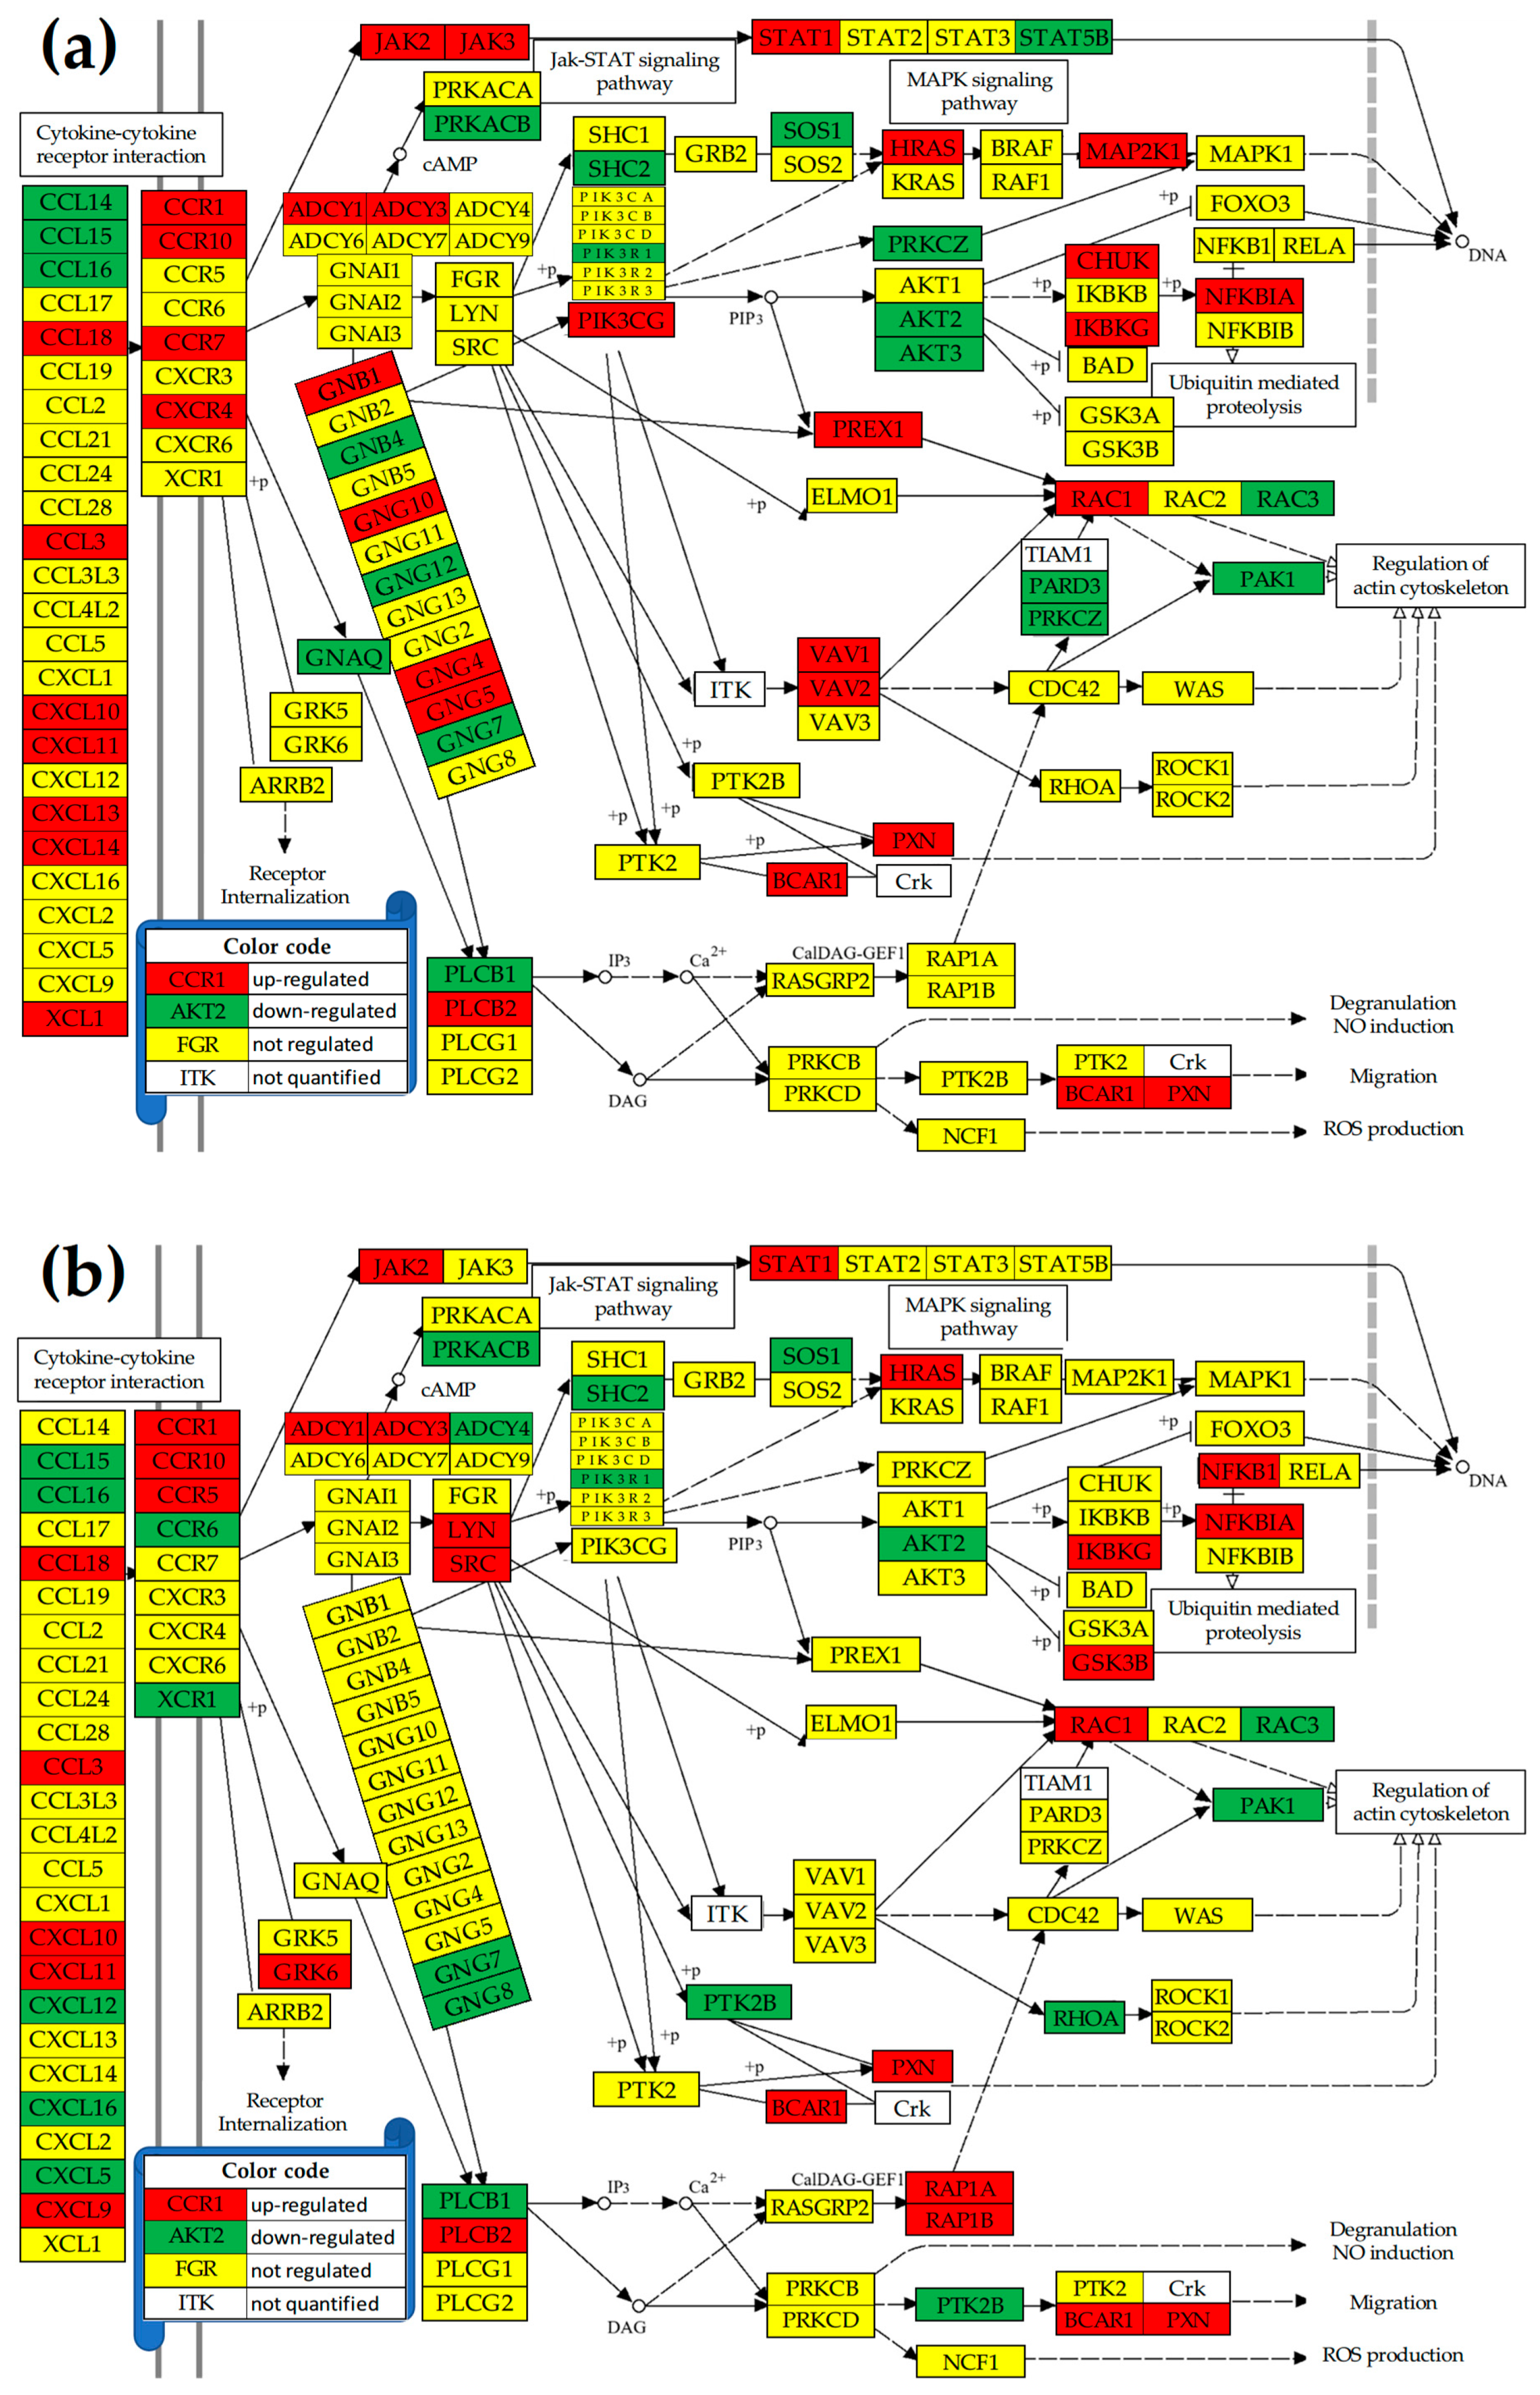
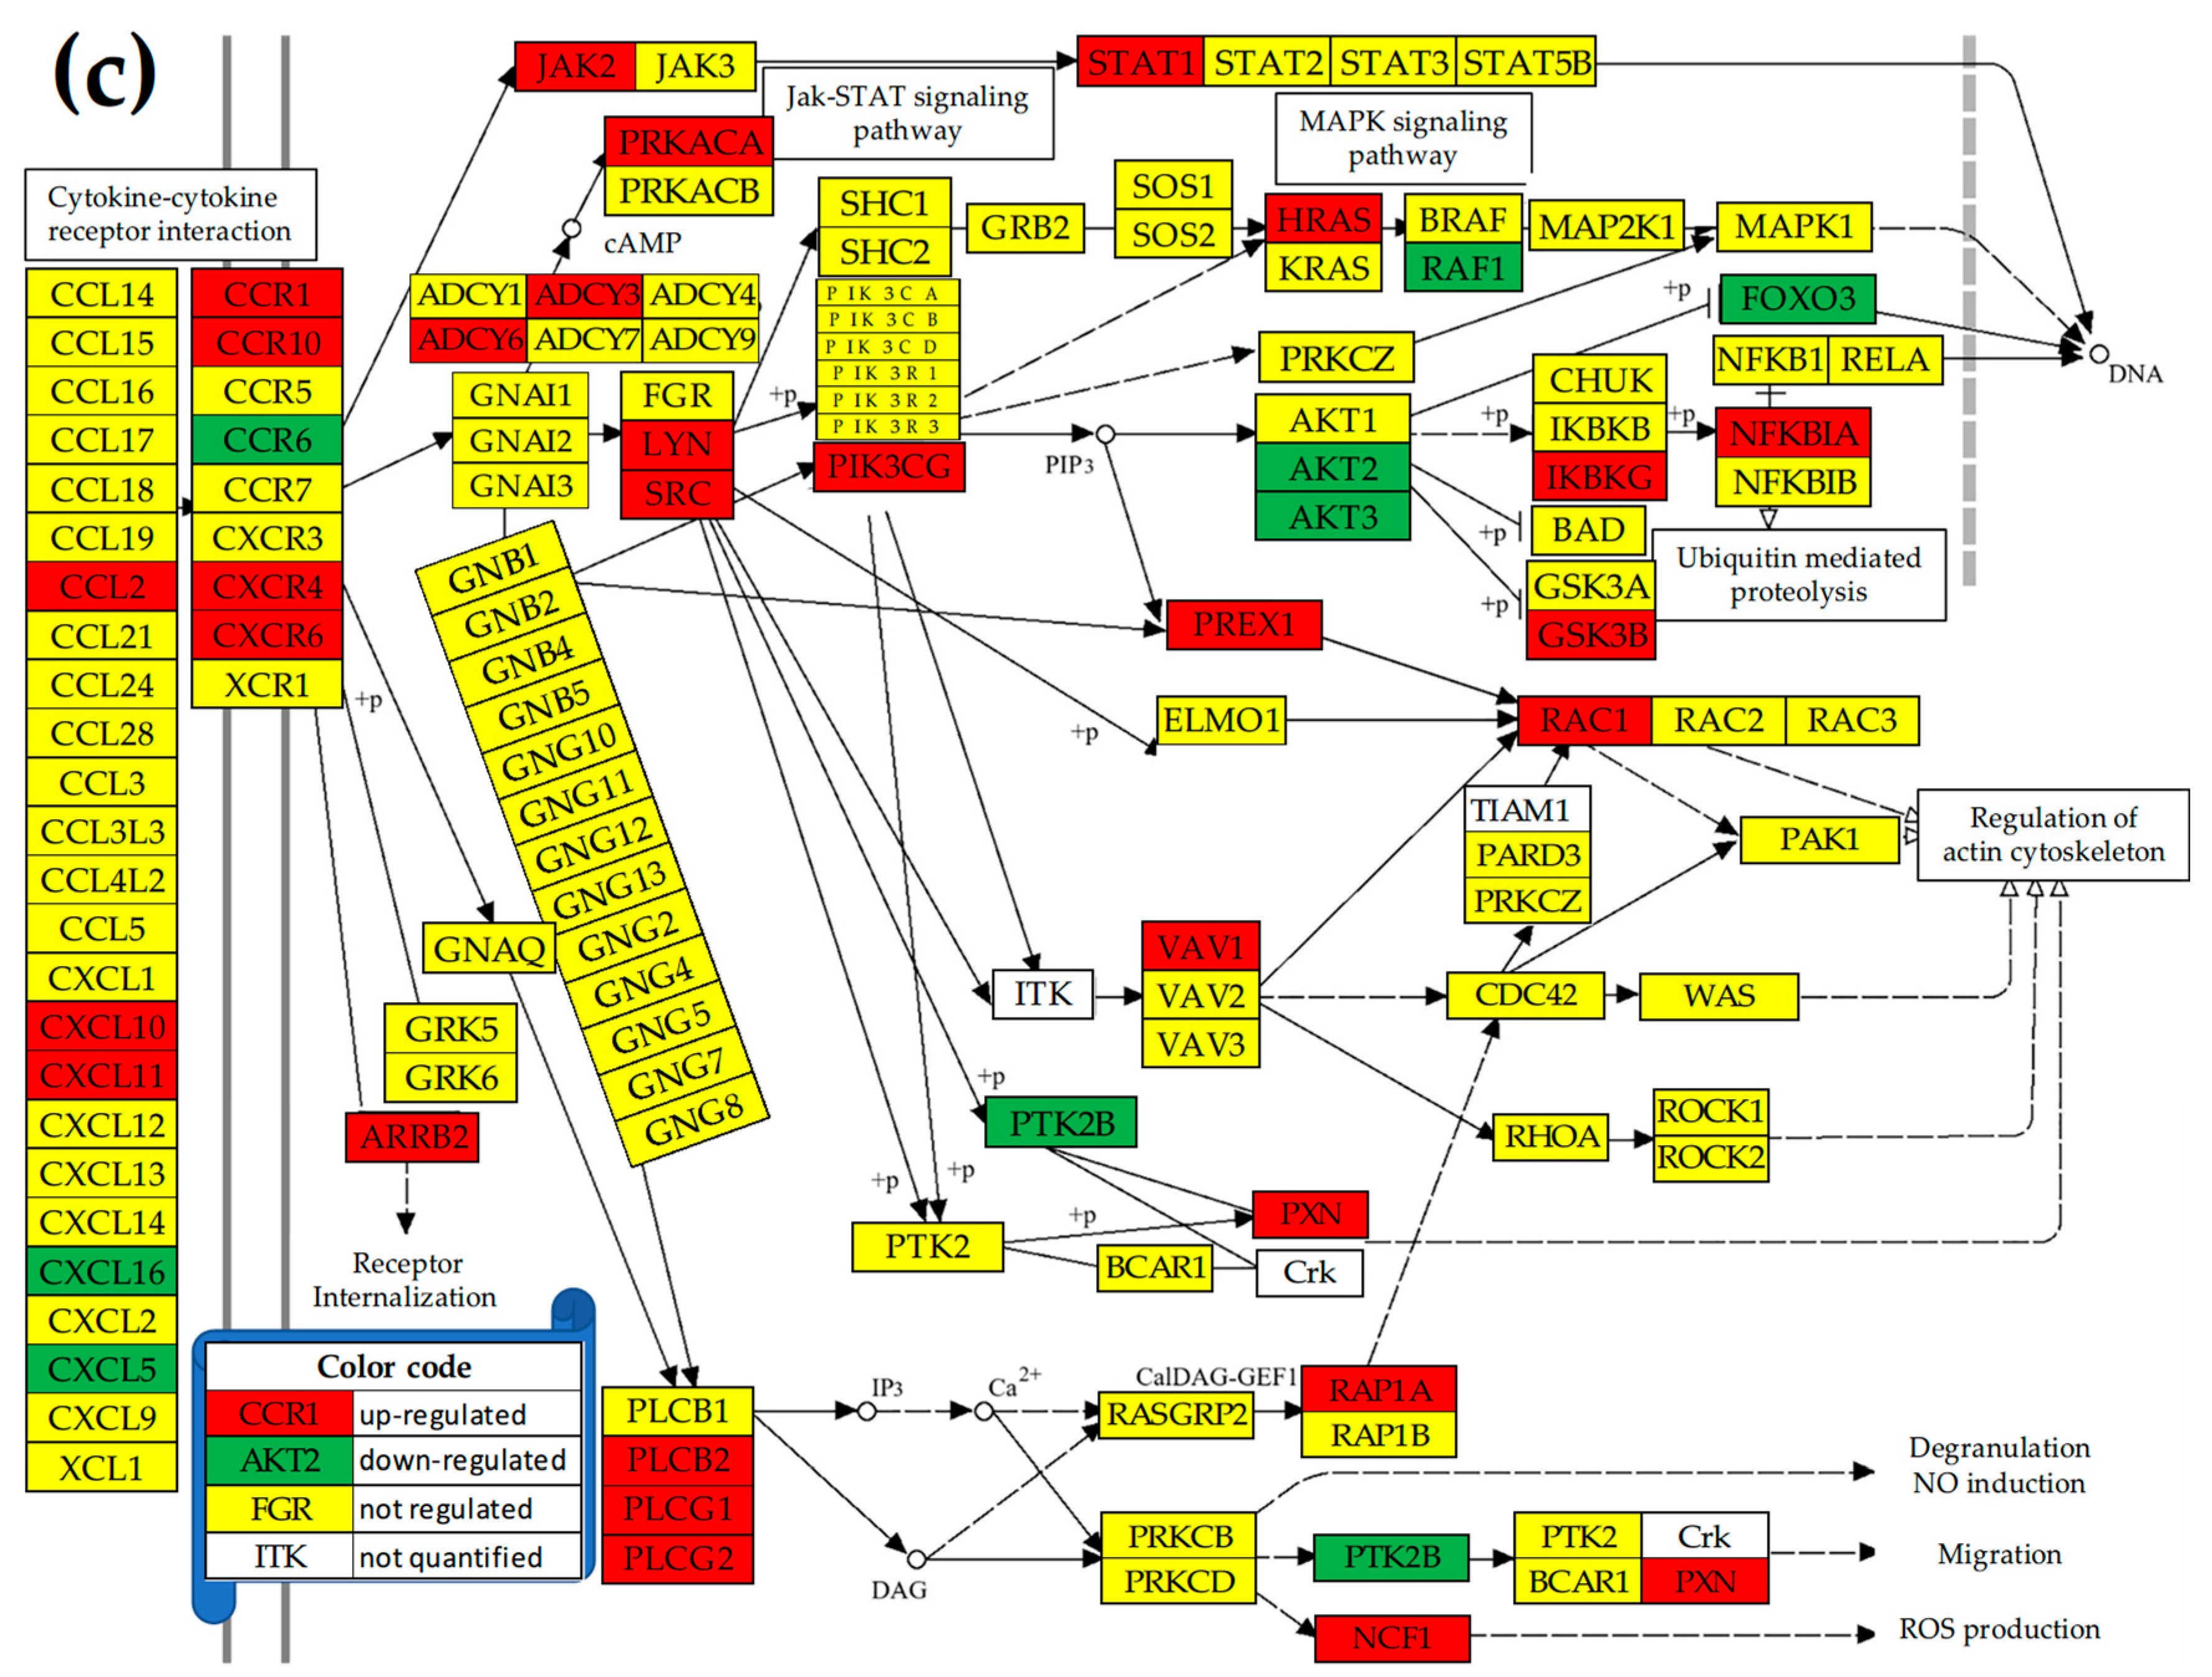
Figure 5.
(p < 0.05) statistically significant independently expressed gene pairs in normal tissue “N” (black squares at the intersection of gene labeled rows and columns in pannel (a)) that became statistically significant (synergistically (red squares) or antagonistically (blue squares) expressed in cancer nodules “A” (b), “B” (c), and “C” (d).
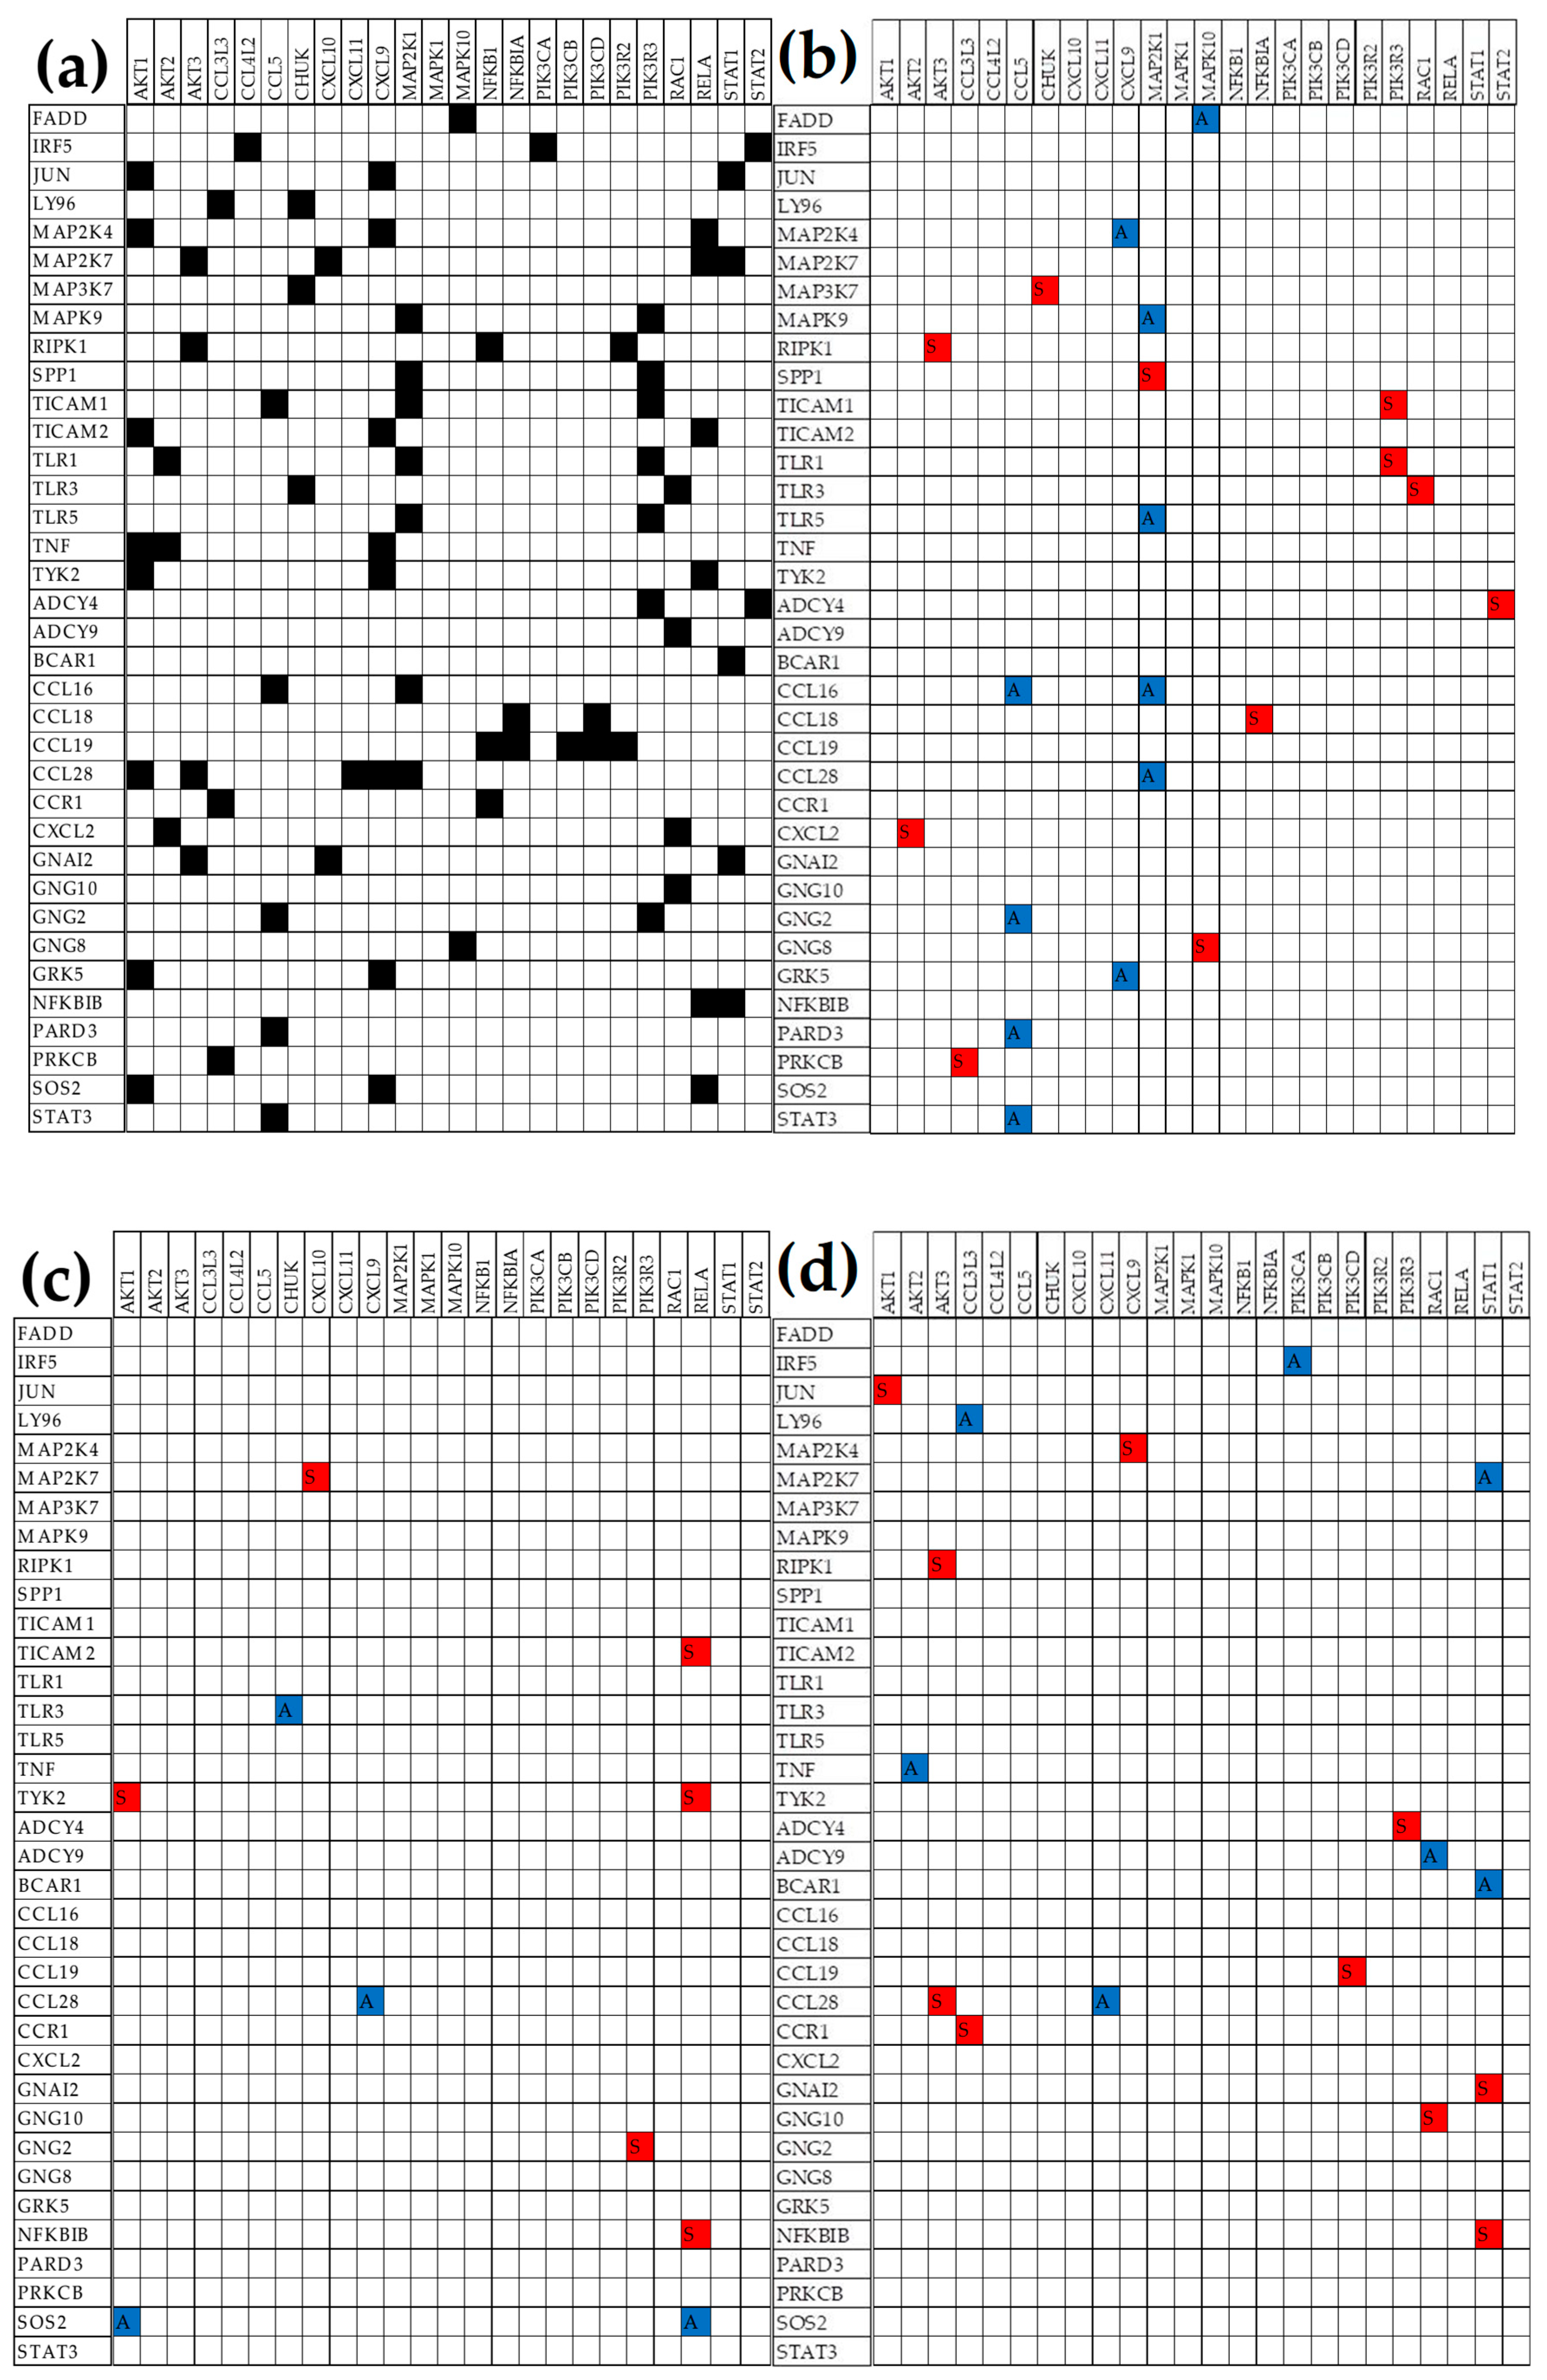
Figure 6.
(p < 0.05) Statistically significant synergistically (COR > 0.95; red squares) and antagonistically (COR < -0.95; blue squares) expressed TLR and CHS gene-pairs in normal tissue (pannel a) that became decoupled (|COR| < 0.05; black squares) in cancer nodules “A” (b), “B” (c), and “C” (d).
Figure 6.
(p < 0.05) Statistically significant synergistically (COR > 0.95; red squares) and antagonistically (COR < -0.95; blue squares) expressed TLR and CHS gene-pairs in normal tissue (pannel a) that became decoupled (|COR| < 0.05; black squares) in cancer nodules “A” (b), “B” (c), and “C” (d).
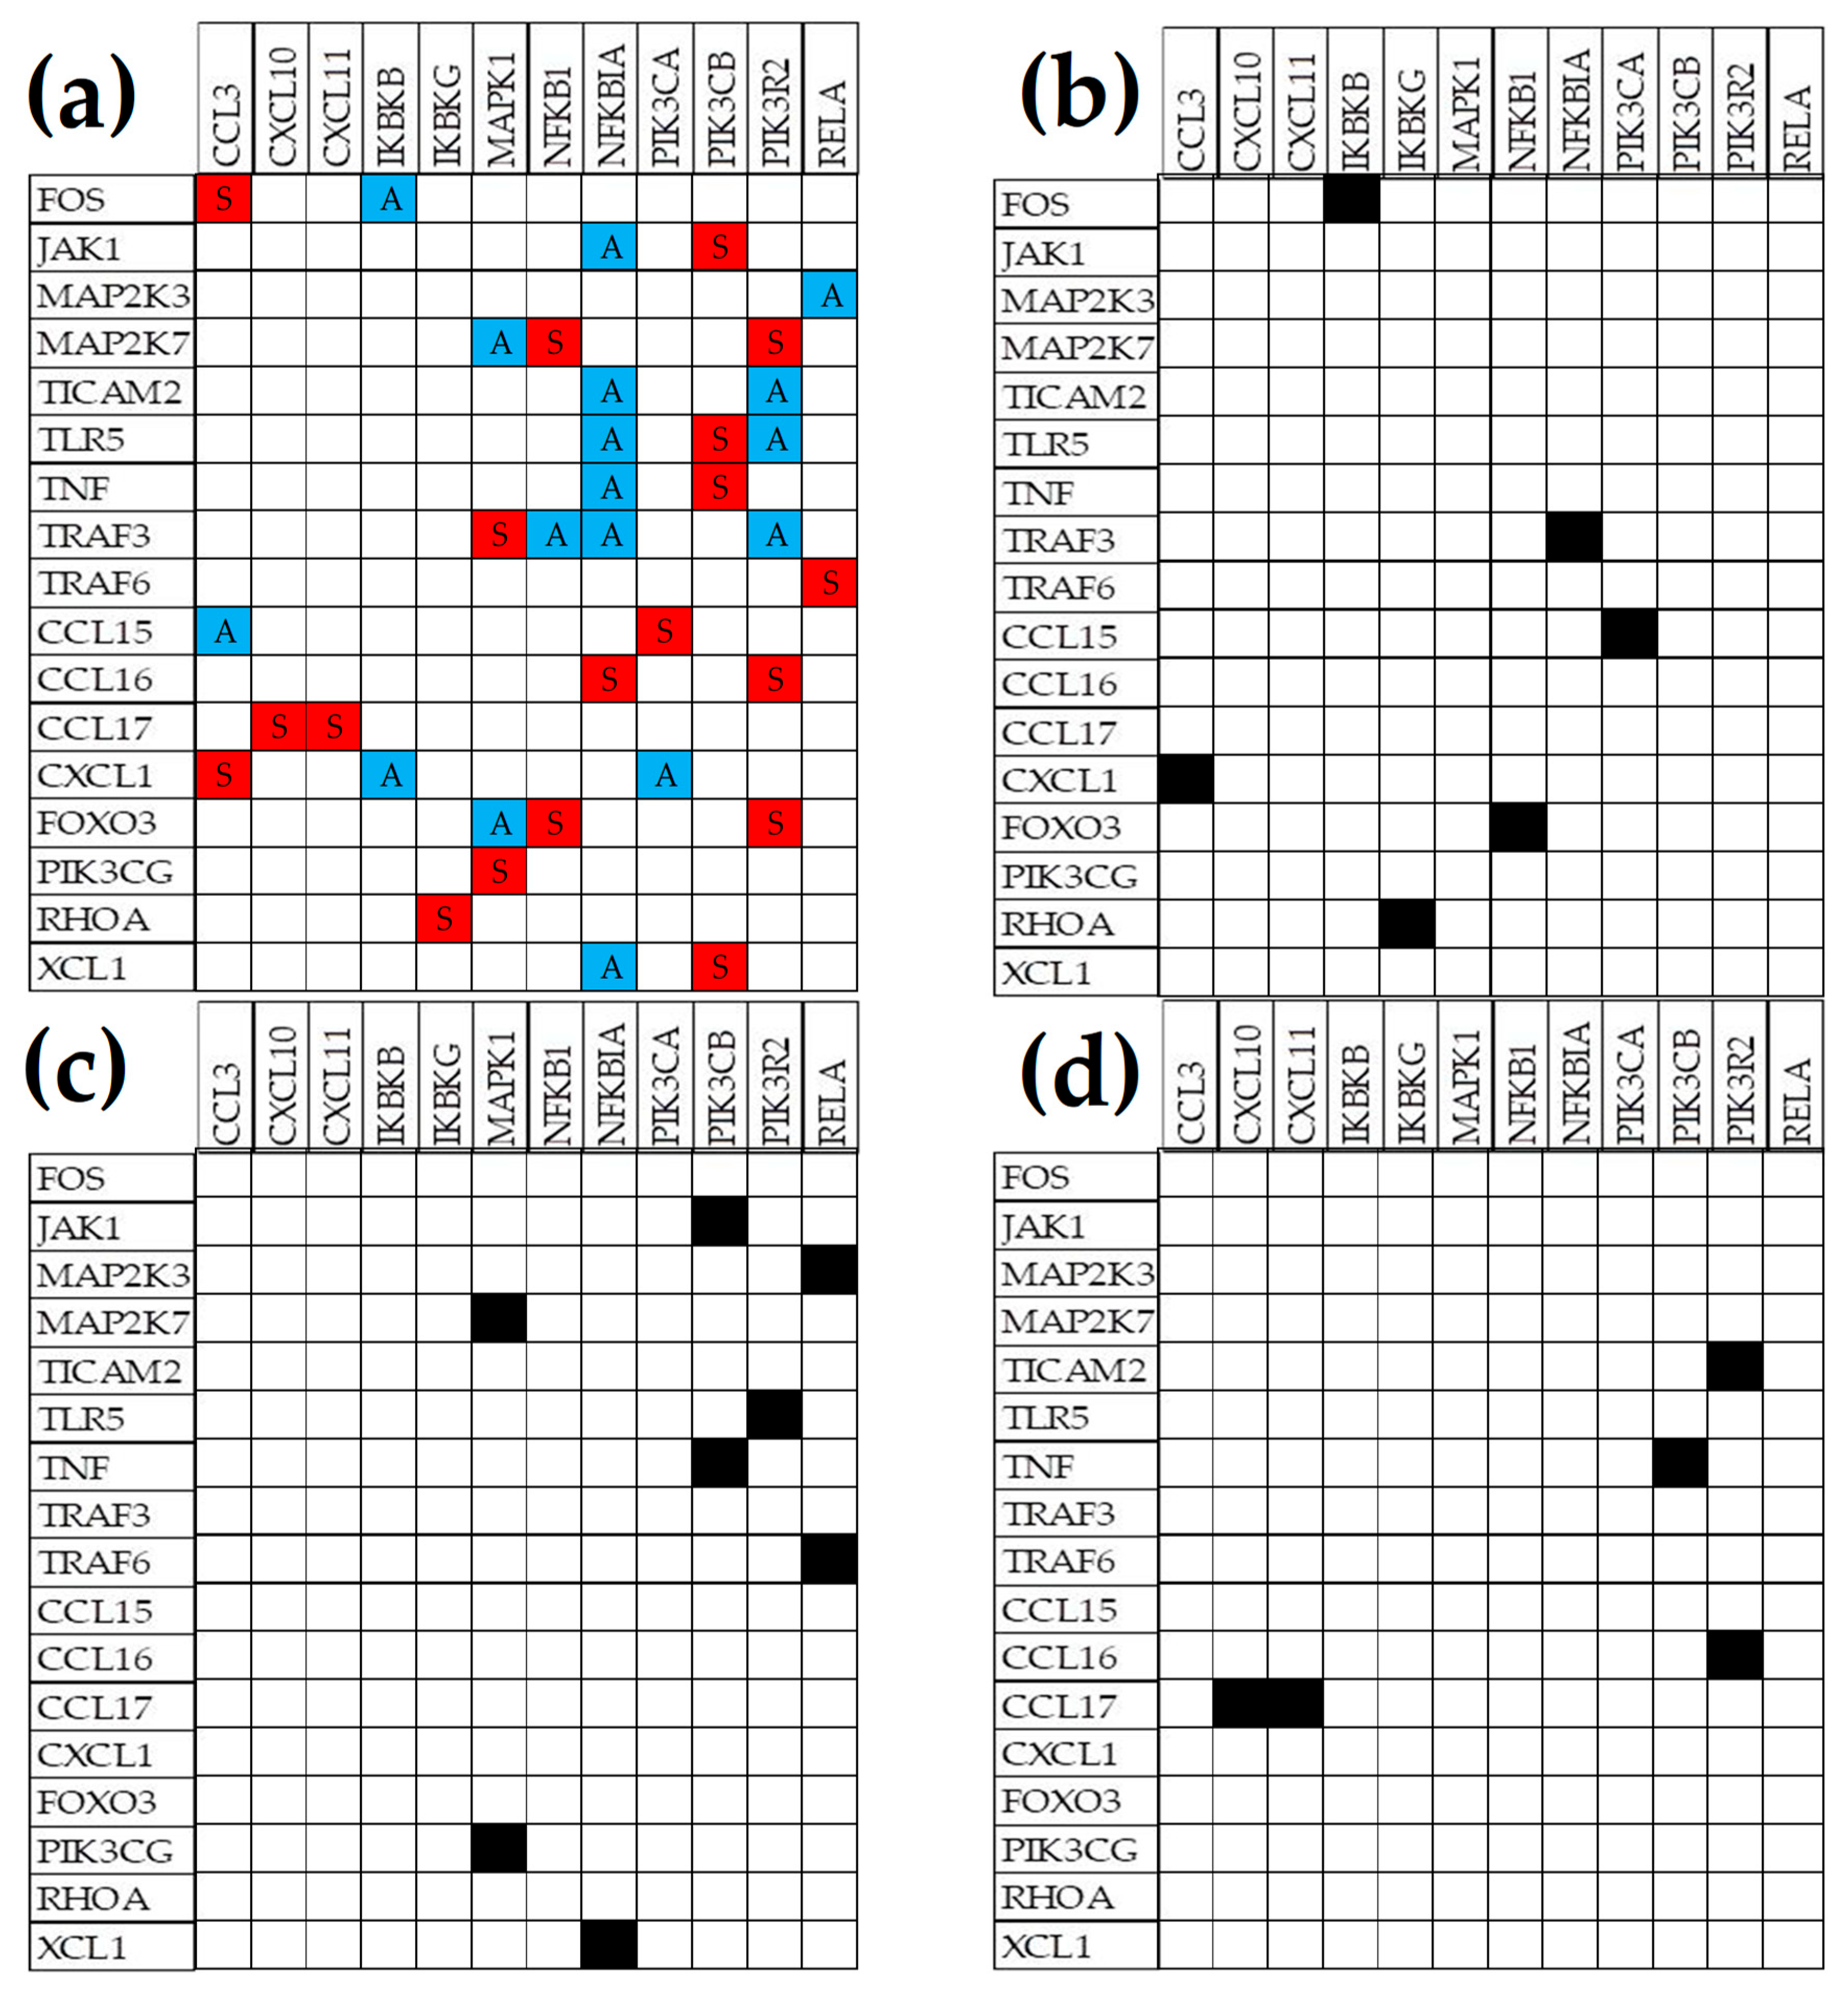
Figure 7.
TLR-CHS gene pairs with (p < 0.05) significant synergistic (red squares) or antagonistic (blue squares) expression in normal tissue (pannel a) that were switched to the opposite significant correlation in cancer nodules: “A” (b), “B” (c), and “C” (d).
Figure 7.
TLR-CHS gene pairs with (p < 0.05) significant synergistic (red squares) or antagonistic (blue squares) expression in normal tissue (pannel a) that were switched to the opposite significant correlation in cancer nodules: “A” (b), “B” (c), and “C” (d).
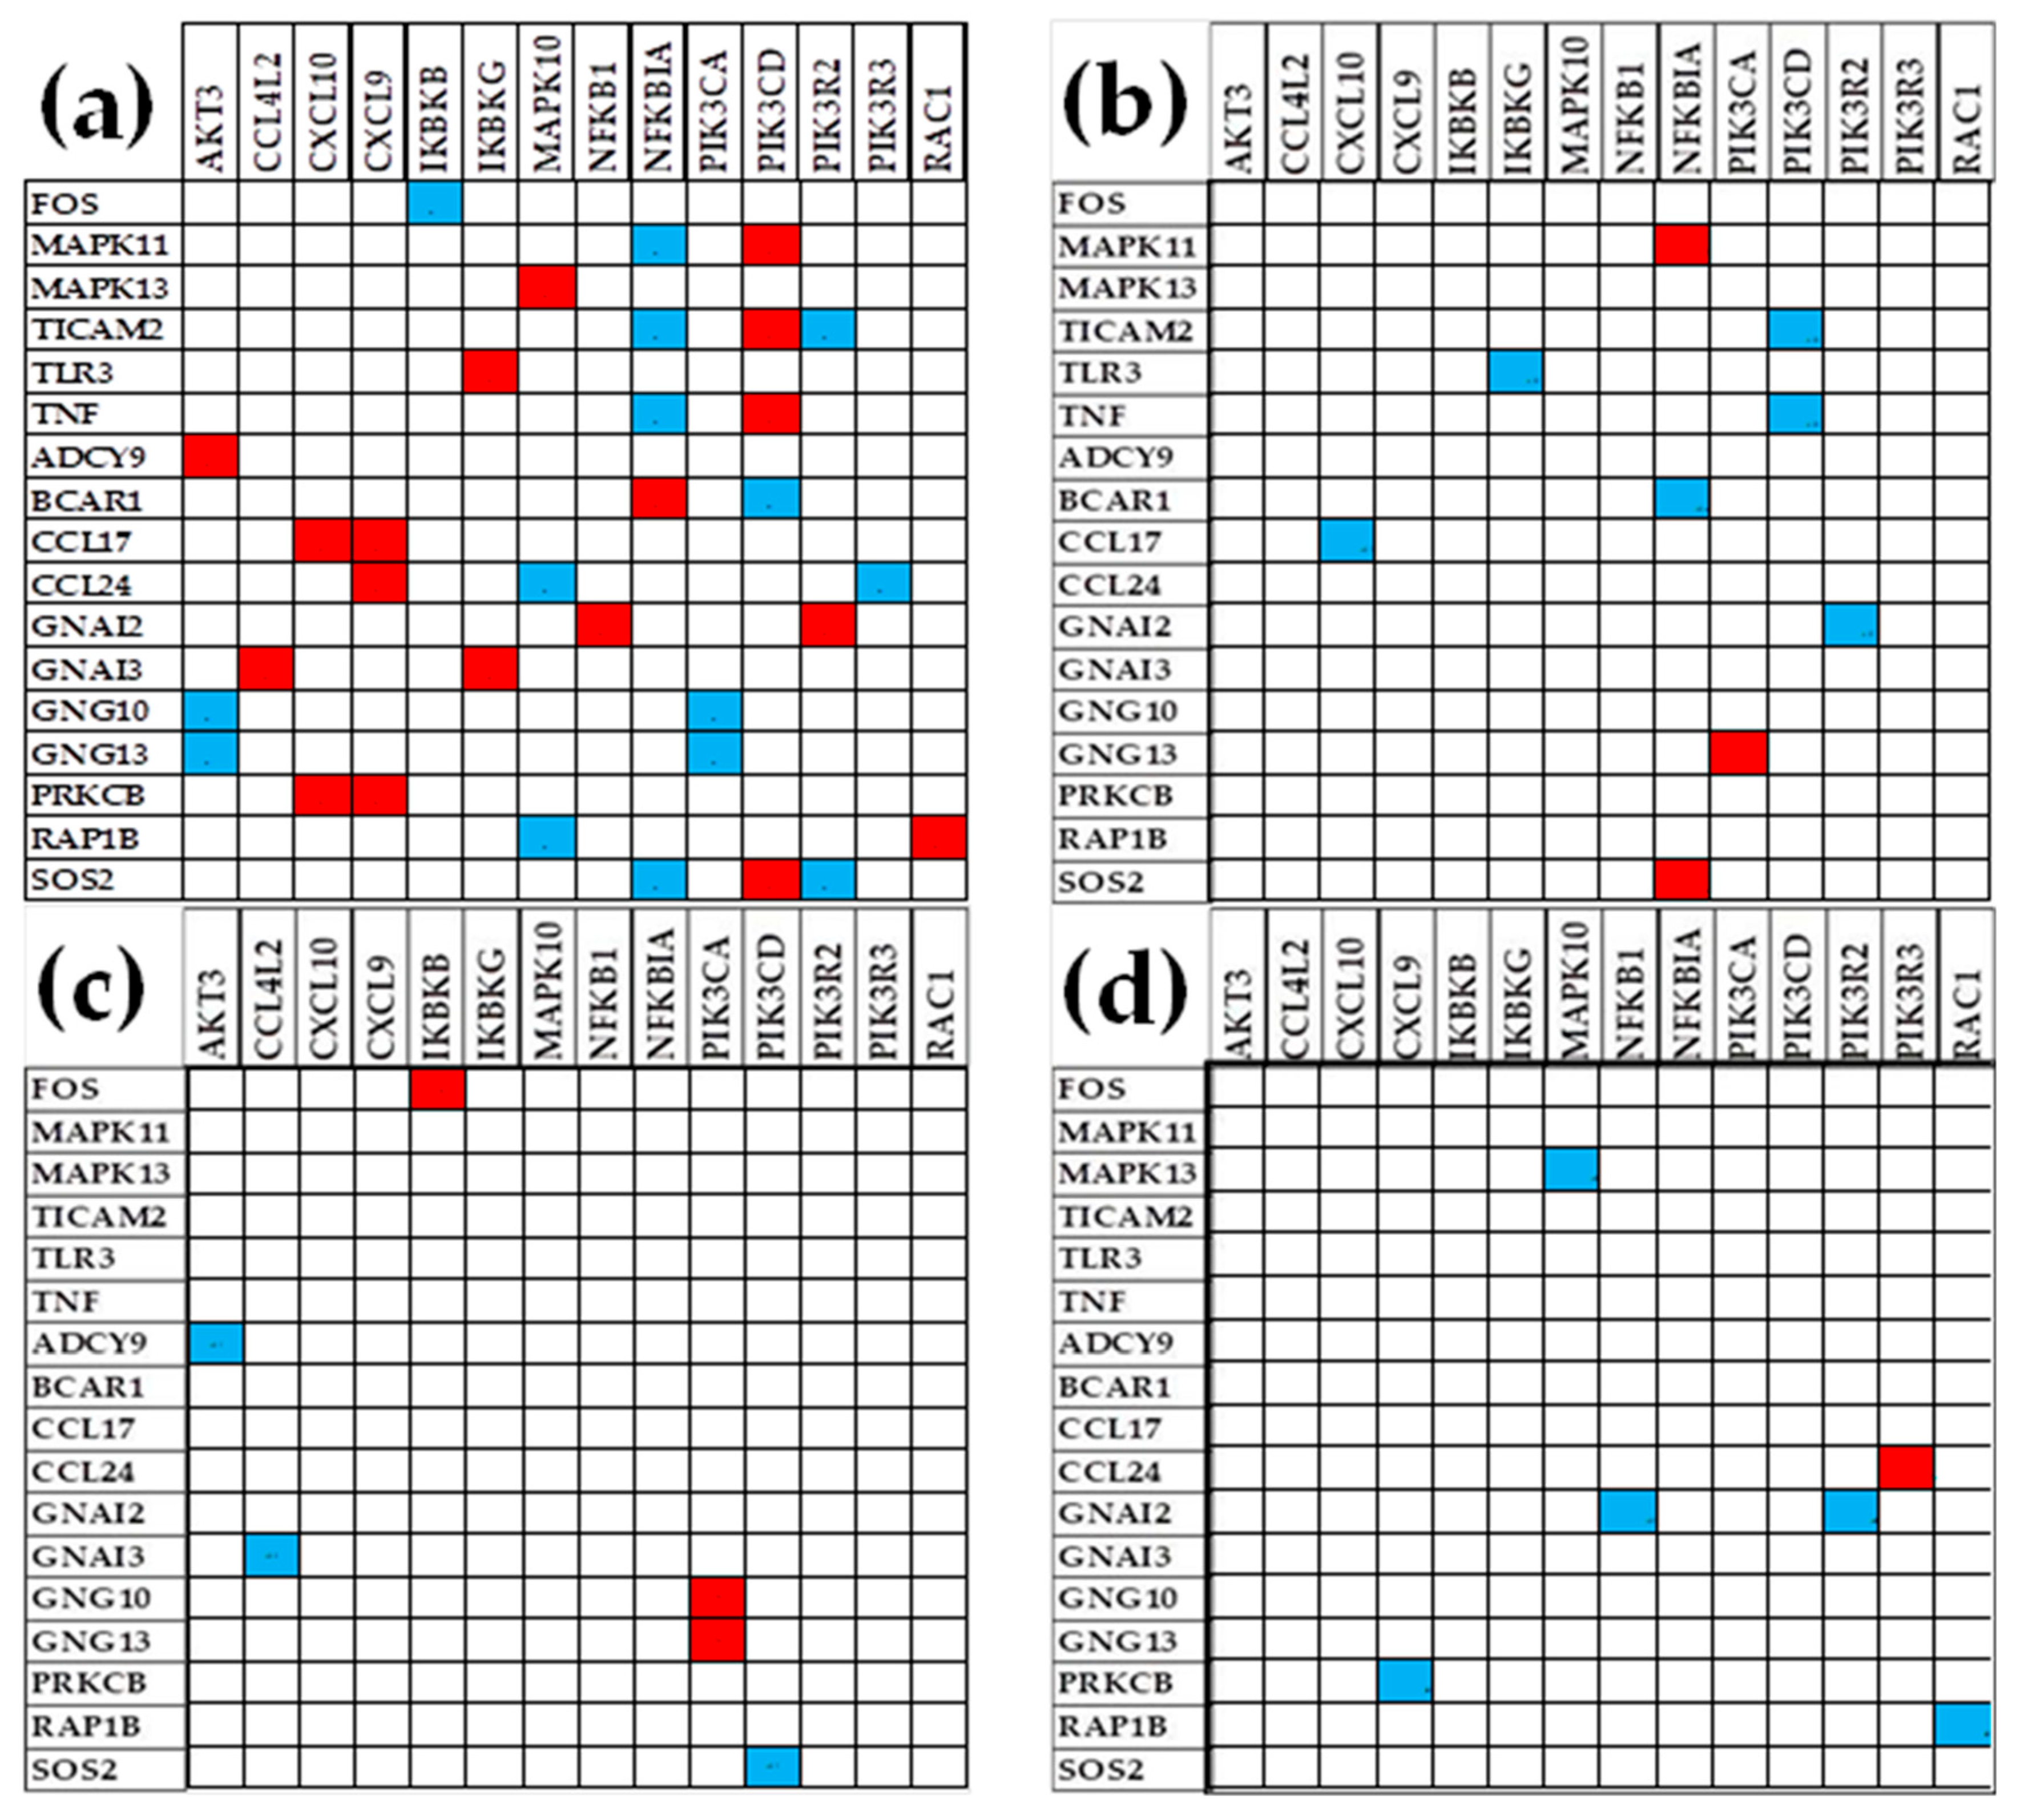

Table 1.
The three CHS and TLR genes with the largest expressions (AVE, grey background) in one region and the expression levels in the other regions. Numbers indicate how many times the expression of that gene is larger than the expression of the median gene in the profiled region.
Table 1.
The three CHS and TLR genes with the largest expressions (AVE, grey background) in one region and the expression levels in the other regions. Numbers indicate how many times the expression of that gene is larger than the expression of the median gene in the profiled region.
| CHEMOKINE SIGNALING | |||||
|---|---|---|---|---|---|
| Gene | Description | N | A | B | C |
| GNAI2 | guanine nucleotide-binding protein (G protein), alpha inhibiting activity polypeptide 2 | 58 | 69 | 96 | 68 |
| RAC3 | ras-related C3 botulinum toxin substrate 3 (rho family, small GTP binding protein | 23 | 11 | 15 | 17 |
| STAT2 | signal transducer and activator of transcription 2 | 18 | 16 | 22 | 24 |
| GNAI2 | guanine nucleotide-binding protein (G protein), alpha inhibiting activity polypeptide 2 | 58 | 69 | 96 | 68 |
| CXCL14 | chemokine (C-X-C motif) ligand 14 | 5 | 33 | 36 | 23 |
| NFKBIA | nuclear factor of kappa light polypeptide gene enhancer in B-cells inhibitor, alpha | 15 | 32 | 42 | 23 |
| GNAI2 | guanine nucleotide-binding protein (G protein), alpha inhibiting activity polypeptide 2 | 58 | 69 | 96 | 68 |
| NFKBIA | nuclear factor of kappa light polypeptide gene enhancer in B-cells inhibitor, alpha | 15 | 32 | 42 | 23 |
| CXCL14 | chemokine (C-X-C motif) ligand 14 | 5 | 33 | 36 | 23 |
| GNAI2 | guanine nucleotide binding protein (G protein), alpha inhibiting activity polypeptide 2 | 58 | 69 | 96 | 68 |
| STAT2 | signal transducer and activator of transcription 2 | 18 | 16 | 22 | 24 |
| NFKBIA | nuclear factor of kappa light polypeptide gene enhancer in B-cells inhibitor, alpha | 15 | 32 | 42 | 23 |
| TOLL-LIKE RECEPTOR SIGNALING | |||||
| STAT2 | signal transducer and activator of transcription 2 | 18 | 16 | 22 | 24 |
| MAP2K7 | mitogen-activated protein kinase kinase 7 | 17 | 12 | 16 | 14 |
| PIK3R2 | phosphoinositide-3-kinase, regulatory subunit 2 (beta) | 15 | 16 | 16 | 13 |
| NFKBIA | nuclear factor of kappa light polypeptide gene enhancer in B-cells inhibitor, alpha | 15 | 32 | 42 | 23 |
| IRF7 | interferon regulatory factor 7 | 10 | 31 | 42 | 21 |
| PIK3R2 | phosphoinositide-3-kinase, regulatory subunit 2 (beta) | 15 | 16 | 16 | 13 |
| NFKBIA | nuclear factor of kappa light polypeptide gene enhancer in B-cells inhibitor, alpha | 15 | 32 | 42 | 23 |
| IRF7 | interferon regulatory factor 7 | 10 | 31 | 42 | 21 |
| STAT2 | signal transducer and activator of transcription 2 | 18 | 16 | 22 | 24 |
| STAT2 | signal transducer and activator of transcription 2 | 18 | 16 | 22 | 24 |
| NFKBIA | nuclear factor of kappa light polypeptide gene enhancer in B-cells inhibitor, alpha | 15 | 32 | 42 | 23 |
| IRF7 | interferon regulatory factor 7 | 10 | 31 | 42 | 21 |
Table 2.
The three most controlled genes (top positive REC scores, grey background) in each region and their scores in the other regions for comparison. Note that the most controlled three genes are different not only between the normal tissue and the cancer nodules in general, but even between equally pathologically graded nodules.
| CHEMOKINE SIGNALING | Region | ||||
|---|---|---|---|---|---|
| Gene | Description | N | A | B | C |
| CCL15 | chemokine (C-C motif) ligand 15 | 2.75 | -1.91 | 0.37 | 0.10 |
| VAV2 | vav 2 guanine nucleotide exchange factor | 2.39 | -0.65 | -0.59 | 2.37 |
| KRAS | Kirsten rat sarcoma viral oncogene homolog | 1.73 | 0.01 | -1.00 | 0.35 |
| GNB1 | guanine nucleotide-binding protein (G protein), beta polypeptide 1 | -0.40 | 4.18 | 0.06 | 0.63 |
| CXCL16 | chemokine (C-X-C motif) ligand 16 | 0.18 | 2.06 | 0.06 | -1.01 |
| FOXO3 | forkhead box O3 | 0.49 | 2.02 | 0.76 | -0.51 |
| MAPK1 | mitogen-activated protein kinase 1 | -0.72 | 0.38 | 2.59 | 0.33 |
| GRK5 | G protein-coupled receptor kinase 5 | -1.24 | 0.26 | 1.55 | -1.07 |
| CCL16 | chemokine (C-C motif) ligand 16 | 0.40 | 0.25 | 1.46 | 3.65 |
| CCL16 | chemokine (C-C motif) ligand 16 | 0.40 | 0.25 | 1.46 | 3.65 |
| VAV2 | vav 2 guanine nucleotide exchange factor | 2.39 | -0.65 | -0.59 | 2.37 |
| PLCB1 | phospholipase C, beta 1 (phosphoinositide-specific) | -0.69 | -0.53 | 0.13 | 2.29 |
| TOLL-LIKE RECEPTOR SIGNALING | |||||
| PIK3R1 | phosphoinositide-3-kinase, regulatory subunit 1 (alpha) | 1.56 | -0.24 | 1.09 | 1.34 |
| TBK1 | TANK-binding kinase 1 | 1.34 | 1.46 | -0.30 | 0.05 |
| PIK3CA | phosphatidylinositol-4,5-bisphosphate 3-kinase, catalytic subunit alpha | 1.30 | 0.62 | 0.10 | -0.31 |
| TYK2 | tyrosine kinase 2 | -1.85 | 2.95 | 0.74 | -1.71 |
| RIPK1 | receptor (TNFRSF)-interacting serine-threonine kinase 1 | 1.05 | 2.79 | 0.96 | 0.94 |
| CD14 | CD14 molecule | -0.41 | 1.83 | 1.76 | 0.66 |
| TOLLIP | toll interacting protein | -1.05 | 1.29 | 2.67 | -1.19 |
| MAPK1 | mitogen-activated protein kinase 1 | -0.72 | 0.38 | 2.59 | 0.33 |
| IRF3 | interferon regulatory factor 3 | 0.87 | 0.74 | 2.20 | -0.36 |
| IRF5 | interferon regulatory factor 5 | -0.11 | 1.02 | 0.43 | 2.66 |
| MAP2K3 | mitogen-activated protein kinase kinase 3 | 0.75 | 1.34 | 0.54 | 1.83 |
| CCL5 | chemokine (C-C motif) ligand 5 | -1.87 | -0.52 | -0.76 | 1.66 |
Table 3.
The three least controlled (lowest RECs) genes in each profiled region and their scores in the other regions. Note that the least controlled three genes are different not only between the normal tissue and the cancer nodules, but even between equally pathologically graded nodules.
Table 3.
The three least controlled (lowest RECs) genes in each profiled region and their scores in the other regions. Note that the least controlled three genes are different not only between the normal tissue and the cancer nodules, but even between equally pathologically graded nodules.
| CHEMOKINE SIGNALING | Region | ||||
|---|---|---|---|---|---|
| Gene | Description | N | A | B | C |
| GNG13 | guanine nucleotide-binding protein (G protein), gamma 13 | -2.90 | -0.81 | -1.12 | -0.25 |
| FGR | FGR proto-oncogene, Src family tyrosine kinase | -2.82 | 0.11 | -0.02 | -0.23 |
| CXCL9 | chemokine (C-X-C motif) ligand 9 | -2.48 | -1.37 | 0.76 | -1.50 |
| CCL15 | chemokine (C-C motif) ligand 15 | 2.75 | -1.91 | 0.37 | 0.10 |
| CCL14 | chemokine (C-C motif) ligand 14 | -1.66 | -1.54 | -1.13 | -1.47 |
| CXCL11 | chemokine (C-X-C motif) ligand 11 | -2.18 | -1.44 | -1.62 | -0.88 |
| CCL19 | chemokine (C-C motif) ligand 19 | -1.99 | 0.90 | -1.91 | -2.41 |
| CCL17 | chemokine (C-C motif) ligand 17 | -0.38 | -0.15 | -1.75 | 0.54 |
| CXCL11 | chemokine (C-X-C motif) ligand 11 | -2.18 | -1.44 | -1.62 | -0.88 |
| CCL19 | chemokine (C-C motif) ligand 19 | -1.99 | 0.90 | -1.91 | -2.41 |
| NFKB1 | nuclear factor of kappa light polypeptide gene enhancer in B-cells 1 | 0.91 | -0.82 | 0.64 | -2.23 |
| CXCL9 | chemokine (C-X-C motif) ligand 9 | -2.48 | -1.37 | 0.76 | -1.50 |
| TOLL-LIKE RECEPTOR SIGNALING | |||||
| CD86 | CD86 molecule | -3.10 | -0.49 | -1.12 | -1.41 |
| FOS | FBJ murine osteosarcoma viral oncogene homolog | -2.70 | -1.56 | -0.83 | -1.92 |
| CXCL9 | chemokine (C-X-C motif) ligand 9 | -2.48 | -1.37 | 0.76 | -1.50 |
| TICAM2 | TICAM2 – TIR domain-containing adaptor molecule 2 | -0.83 | -2.27 | -0.63 | 0.17 |
| SPP1 | secreted phosphoprotein 1 | -1.22 | -1.61 | -0.28 | 0.28 |
| FOS | FBJ murine osteosarcoma viral oncogene homolog | -2.70 | -1.56 | -0.83 | -1.92 |
| CXCL11 | chemokine (C-X-C motif) ligand 11 | -2.18 | -1.44 | -1.62 | -0.88 |
| TNF | tumor necrosis factor | -0.89 | -0.39 | -1.60 | -0.49 |
| CD86 | CD86 molecule | -3.10 | -0.49 | -1.12 | -1.41 |
| NFKB1 | nuclear factor of kappa light polypeptide gene enhancer in B-cells 1 | 0.91 | -0.82 | 0.64 | -2.23 |
| FOS | FBJ murine osteosarcoma viral oncogene homolog | -2.70 | -1.56 | -0.83 | -1.92 |
| TLR4 | toll-like receptor 4 | 0.15 | 1.34 | 0.64 | -1.90 |
Table 4.
The top three CHS and TLR genes (highest GCH scores) in each profiled region and the corresponding scores in the other regions. Note the change in the gene hierarchy not only between normal and cancer tissues but also between equally graded cancer nodules in the same tumor.
Table 4.
The top three CHS and TLR genes (highest GCH scores) in each profiled region and the corresponding scores in the other regions. Note the change in the gene hierarchy not only between normal and cancer tissues but also between equally graded cancer nodules in the same tumor.
| CHEMOKINE SIGNALING | ||||||
|---|---|---|---|---|---|---|
| Gene | Description | N | A | B | C | |
| CCL15 | chemokine (C-C motif) ligand 15 | 16.84 | 0.14 | 1.36 | 1.58 | |
| PRKCD | protein kinase C, delta | 9.96 | 2.26 | 1.62 | 3.66 | |
| VAV2 | vav 2 guanine nucleotide exchange factor | 9.22 | 2.32 | 1.57 | 3.79 | |
| GNB1 | guanine nucleotide binding protein (G protein), beta polypeptide 1 | 1.94 | 34.15 | 1.51 | 4.54 | |
| JAK2 | Janus kinase 2 | 1.93 | 9.99 | 4.50 | 3.21 | |
| TYK2 | tyrosine kinase 2 | 0.79 | 8.75 | 3.13 | 1.07 | |
| CCR6 | chemokine (C-C motif) receptor 6 | 1.36 | 4.07 | 5.46 | 1.22 | |
| CCR1 | chemokine (C-C motif) receptor 1 | 1.98 | 4.40 | 4.88 | 3.32 | |
| BCAR1 | BCAR1 scaffold protein, Cas family member | 1.94 | 3.30 | 4.81 | 4.51 | |
| CCL16 | chemokine (C-C motif) ligand 16 | 4.03 | 4.20 | 2.63 | 14.72 | |
| PLCB1 | phospholipase C, beta 1 (phosphoinositide-specific) | 1.13 | 2.48 | 1.47 | 9.67 | |
| PREX1 | phosphatidylinositol-3,4,5-trisphosphate-dependent Rac exchange factor 1 | 2.14 | 1.87 | 2.03 | 8.07 | |
| TOLL-LIKE RECEPTOR SIGNALING | ||||||
| FADD | Fas (TNFRSF6)-associated via death domain | 7.28 | 5.03 | 2.24 | 0.42 | |
| IKBKB | inhibitor of kappa light polypeptide gene enhancer in B-cells, kinase beta | 5.86 | 1.04 | 0.91 | 1.21 | |
| MAP2K4 | mitogen-activated protein kinase kinase 4 | 5.80 | 2.35 | 2.23 | 3.08 | |
| RIPK1 | receptor (TNFRSF)-interacting serine-threonine kinase 1 | 2.60 | 11.86 | 3.01 | 5.31 | |
| CD14 | CD14 molecule | 1.20 | 9.79 | 2.58 | 5.27 | |
| TOLLIP | toll interacting protein | 1.08 | 9.03 | 7.21 | 1.45 | |
| TOLLIP | toll interacting protein | 1.08 | 9.03 | 7.21 | 1.45 | |
| MAPK1 | mitogen-activated protein kinase 1 | 1.50 | 2.69 | 6.40 | 3.53 | |
| MAP3K7 | mitogen-activated protein kinase kinase kinase 7 | 4.33 | 4.40 | 6.02 | 2.77 | |
| IRF5 | interferon regulatory factor 5 | 1.83 | 4.40 | 2.99 | 11.34 | |
| IL1B | interleukin 1, beta | 0.76 | 2.60 | 1.17 | 5.48 | |
| RIPK1 | receptor (TNFRSF)-interacting serine-threonine kinase 1 | 2.60 | 11.86 | 3.01 | 5.31 | |
Disclaimer/Publisher’s Note: The statements, opinions and data contained in all publications are solely those of the individual author(s) and contributor(s) and not of MDPI and/or the editor(s). MDPI and/or the editor(s) disclaim responsibility for any injury to people or property resulting from any ideas, methods, instructions or products referred to in the content. |
© 2025 by the authors. Licensee MDPI, Basel, Switzerland. This article is an open access article distributed under the terms and conditions of the Creative Commons Attribution (CC BY) license (https://creativecommons.org/licenses/by/4.0/).
Copyright: This open access article is published under a Creative Commons CC BY 4.0 license, which permit the free download, distribution, and reuse, provided that the author and preprint are cited in any reuse.


