
Submitted:
19 November 2024
Posted:
20 November 2024
You are already at the latest version
Abstract
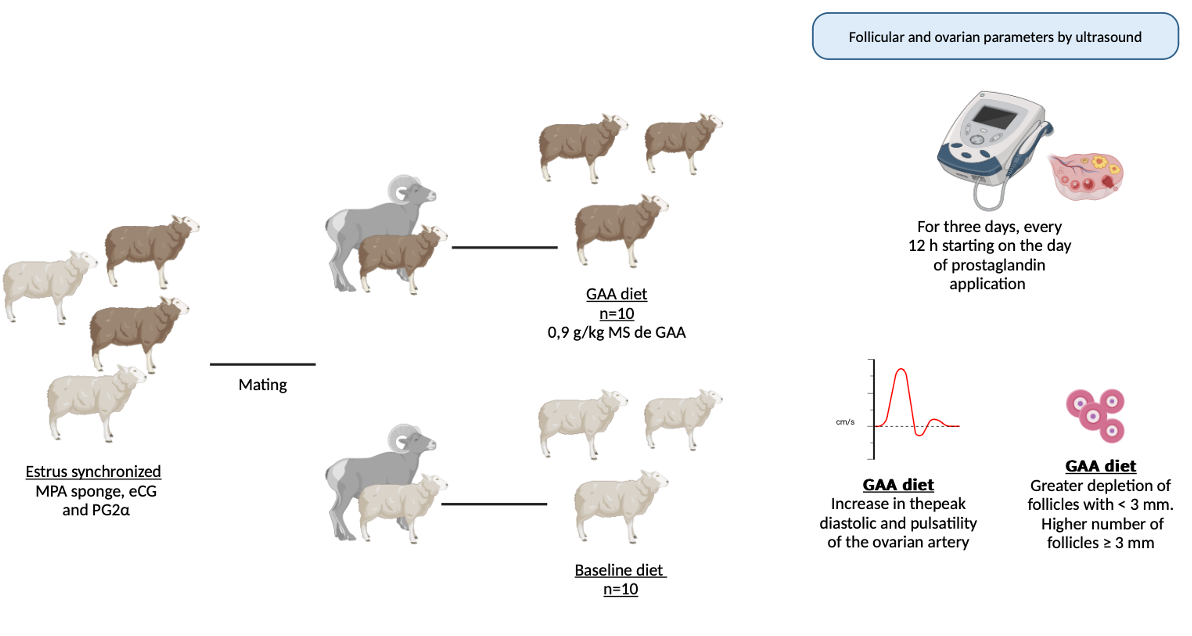
Little is known about the role of guanidine acetic acid (GAA), a precursor of creatine, in the reproductive function of ruminants. Therefore, this study aimed to contribute initially to this area by supplementing the diets of ewes with a high dose of GAA evaluating its effects on reproductive response. Twenty adult sheep had their estrus synchronized using an MPA sponge, eCG and PG2α. After estrus detection ewes were mated. For 10 days until mating, ewes were grouped in baseline diet (BSD; n = 10), and a GAA diet (GAAD; n = 10), which was the BSD with daily 0.9 g/kg DM of GAA. After the eCG+PG2α dose, the GAAD group exhibited an increase in the peak diastolic and pulsatility of the ovarian artery, a reduction in the systolic/diastolic peaks ratio and a larger intraovarian blood perfusion area. A greater depletion of follicles with < 3 mm was observed in the GAAD group, and a higher number of follicles ≥ 3 mm. No differences were observed between the diets respect to pregnancy, and twin rates. Thus, a high GAA supply before mating significantly alters ovarian vasculature and improves follicular growth in ewes but does not affect the pregnancy rate.
Keywords:
blood perfusion
; creatine
; follicle
; guanidine acetic acid
; ovary
; sheep
1. Introduction
In ruminants, precise estimates of amino acid (AA) requirements for supporting ovarian response or mating success remain unavailable. This uncertainty stems from the management of dietary protein degradation in the ruminal environment, where the amino acid chains are reorganized to synthesize the walls of ruminal microorganisms, and a portion of the dietary AAs that flows to the small intestine is metabolized and utilized by the individual [1]. Therefore, adopting strategies to increase the flow of AAs to the duodenum is essential. Recent studies have unveiled promising findings, showing that some dietary AAs exhibit relatively lower ruminal degradation compared to others and directly influence ovarian functionality. For example, glutamate, the primary excitatory neurotransmitter of the central nervous system [2], acts through Kiss1 neurons to stimulate the production of GnRH [3]. Intravenous administration of glutamate in goats has been shown to enhance ovarian vascular activity, follicular growth, and ovulation rate [4]. Similarly, dietary supplementation with glutamate in the same species has stimulated feed intake, increased follicular growth, and improved intraovarian blood flow during ovulation [5]. Part of the dietary glutamate that reaches the enterocytes is degraded to produce ATP and synthesize glutathione, an important antioxidant molecule [2], which positively influences GnRH and consequently, FSH and LH levels [6,7]. Moreover, glutamine, the primary precursor of glutamate, also plays a role in follicular activation through the positive regulation of phosphoinositide 3-kinase, mTOR, and IGF-1 [8,9].
In recent years, significant attention has been focused on the use of AAs in nutritional intervention strategies specifically aimed at optimizing reproductive processes. In this context, recent studies have explored the actions of AAs in humans [10] and animals [11]. These studies highlight the roles of AAs as neurotransmitters in the neuroendocrine system and as precursors to several hormones and neuropeptides, such as the protein kinase mammalian target of rapamycin (mTOR) [12] and estrogen [13]. These compounds are integral to various bodily functions, including energy homeostasis and reproductive activity [1]. Among these roles, dietary AAs regulate the synthesis of insulin-like growth factor 1 (IGF-1), which is involved in the transcriptional activity of the hepatic estrogen receptor via an mTOR mechanism. IGF-1 serves as an indicator of the animal’s nutritional status to the reproductive system, influencing uterine activity and the regulation of the estrous cycle [9,14]. The effectiveness of these interventions is evident, for instance, in the inoculation of taurine in mice, which stimulated estrogen synthesis in the ovaries by regulating microRNA-7a2 expression in granulosa cells [15].
Additionally, supplementing the diet of rats with methionine promoted several enhancements in reproductive activity, such as follicular growth through the regulation of genes, including growth differentiation factor 9 (GDF9) and bone morphogenetic protein 15 (BMP15). It also increased estrogen levels during the estrous cycle through mechanisms involving AA transporters, DNA methyltransferases, and cystathionine gamma-lyase, as well as the number of embryos implanted in early gestation [16].
Another strategy to circumvent the ruminal manipulation mechanism is to use precursors for AA synthesis in feed, such as creatine and its precursor, guanidine acetic acid (GAA). Creatine can be synthesized endogenously or acquired through the diet and is captured via the creatine transporter (SLC6A8) [17]. Its synthesis involves two enzymes: L-arginine:glycine amidinotransferase (AGAT), which catalyzes the production of GAA, and guanidine acetate N-methyltransferase (GAMT), which catalyzes the methylation of GAA to produce creatine and S-adenosyl homocysteine [18]. Intracellular creatine is stored as phosphocreatine, and when needed for cellular processes, the cytosolic isoforms of creatine kinase (CK), specifically brain-type (CKBB) and muscle-type (CKMM), hydrolyze the bond between creatine and the phosphate group, rapidly forming ATP and creatine [19]. This reaction plays a role in the metabolism of tissues with high energy demands, such as skeletal muscle [20], and the ovaries during oocyte maturation [18,21]. Guanidine acetic acid has a well-established bibliography as a feed additive for swine and poultry, aimed at improving feed intake, growth performance, feed efficiency, and meat quality, with minimal cost and environmental impact [20]. The GAA market is currently experiencing significant expansion. In 2022, its production value was US$ 37 million, and it is estimated to reach US$ 53.02 million by 2031, with an annual growth rate of 4.1% [22].
In ruminants, the potential for using GAA has been explored recently, as the ruminal supplementation with 0.5 g/kg or 1.0 g/kg of GAA in the diet for 100 days demonstrated positive effects on creatine degradation rate in cattle is approximately 50%, allowing half of this component to be metabolized at the intestinal level [23]. Consequently, GAA offers new perspectives on its use in ruminant feeding. In beef cattle, [24] reported improved performance and diet digestibility with GAA doses of 0.6 g and 0.9 g/kg of dry matter in the diet during 90-day trials. In lambs,metabolism and muscle activity and growth [25]. However, despite these promising results in terms of production and nutrition, the extent to which GAA, as a creatine precursor, can influence reproductive function remains unclear. Recently, [26], using 0.2% GAA in the diet of Brahman cows during the final 90 days of gestation, observed no effects on offspring performance, but an increase in placental vascularization was noted. The European Food Safety Authority [27], in a review on the use of GAA in animal feed, acknowledged the lack of available reference data on the role of GAA in reproduction in ruminants.
Against this backdrop, this study aimed to provide an initial assessment of the effects of dietary GAA supplementation on ovarian response in sheep. Our hypothesis posits that the ruminal escape of GAA is effective and, when administered in high doses for a short period, stimulates ovarian activity.
Therefore, the objective of this investigation was to administer GAA as a dietary supplement to sheep at high doses during a hormonal protocol in preparation for mating, and to evaluate its impact on the metabolic profile, follicular growth, ovarian and intraovarian blood perfusion, and the reproductive response post-mating.
2. Materials and Methods
2.1. Location, Animals, Pre-Experimental Conditions, and Experimental Design
The study was conducted at the farm of the School of Veterinary Medicine at Ceará State University, Brazil. Twenty adult, multiparous Santa Inês sheep from the school’s flock were selected for the trial. During the pre-experimental period, the animals were housed in a common pen where health and reproductive controls were performed according to [28]. The sheep were then grouped based on their body mass indexes (BMIs) in collective covered pens with concrete floors, and received water and mineral salt ad libitum to adapt to the experimental feeding regime. The diet consisted of a Total Mixed Ration (TMR) composed of fresh, chopped elephant grass (Pennisetum purpureum Schum) and concentrate feed (50% corn, 5% soybean meal, 40% wheat bran, and 5% vitamin-mineral supplement), provided in amounts to meet the nutritional requirements of breeding adult sheep [29]. The feed was provided in two daily meals at 08h00 and 15h00, and feed intake was monitored during the experimental period. The animals were weighed, and adipose and muscle masses were measured by ultrasonography to assess subcutaneous fat thickness of the loin, depth of loin muscle, and perirenal fat, according to [30]. The sheep’s BMIs were calculated as follows: BMI = ((Body weight [kg] / Height at withers [m] / Body length [m]) / 10). The overall means (± standard deviation) for age, body weight, height at withers, and body length were 2.7 ± 0.9 years, 43.0 ± 5.8 kg, 66.8 ± 3.6 cm, and 65.6 ± 4.0 cm, respectively.
All ewes were prepared for mating by synchronizing estrus and the follicular wave using a hormonal protocol (Figure 1). Seven days before mating, an intravaginal sponge impregnated with 60 mg of medroxyprogesterone acetate (Progespon®, Zoetis, São Paulo, Brazil) was inserted into the cranial portion of each ewe’s vagina. After six days, the sponge was manually removed, and 300 IU of equine chorionic gonadotropin (eCG) (Novormon®, Zoetis, São Paulo, Brazil) and 0.125 mg of prostaglandin (Sincrocio®, Ourofino, São Paulo, Brazil) were administered intramuscularly
Twenty-four hours after the prostaglandin application, estrus detection began and was conducted every 4 h for three days using a ram. Twelve hours after the onset of estrus, three matings were performed for each ewe at 12-h intervals, using a Dorper ram of proven fertility. Pregnancy diagnosis was performed by ultrasonography 25 days after mating.
At the onset of the hormonal protocol, the animals were divided into two nutritional treatment groups: the group fed the baseline diet (BSD; n = 10) and the GAA group (GAAD; n = 10), where animals received the baseline diet supplemented daily with 0.9 g/kg of dietary DM of guanidine acetic acid for 10 days, from the first day of the synchronization protocol until mating (Figure 1). Guanidine acetic acid in powder form (GuanAMINO®, Feed Grade 96.0%, Evonik Leading Beyond Chemistry, Hanau, Germany) was distributed in equal doses in each of the two daily meals.
Table 1 displays the sheep traits at the start of the experimental trial. The groups were homogeneous (P > 0.05) in terms of body mass index, thickness of lumbar and renal subcutaneous fat, and muscle mass as measured by loin depth.
2.2. Assessment of Ovarian Blood Flow and Intraovarian Blood Perfusion Area
Ovarian and intraovarian blood perfusion were measured 24 h and 48 h after prostaglandin administration (Figure 1), using an ultrasound device equipped with color Doppler functionality (model Z5 Vet; Mindray Bio-Medical Electronics Co., Shenzhen, China) and a transrectal linear transducer at a frequency of 5.0 MHz. The equipment settings pulsed repetition frequency (PRF) at 1.0 kHz, depth at 6.5 cm, and color gain at 60% were consistently maintained during the evaluations. Ovarian blood perfusion values were obtained using the pulsed Doppler function, and, following the methodology described by [31], each ovarian artery (right and left) was initially identified using the color Doppler function, which displayed the artery next to the ovarian vein as a pulsating-colored point on the ovarian pedicle. Once the artery was visualized, the pulsed Doppler function was activated with a 1.0 mm Doppler gate and a 30° insonation angle to obtain blood flow waveforms. The systolic peak (SP), diastolic peak (DP), and systole/diastole ratio (S/D) values were automatically calculated by the equipment from two spectral Doppler waveforms.
Intraovarian perfusion, reflecting the vascularization of growing follicles, was identified using ultrasound videos taken from the right and left ovaries with the color Doppler function activated. These videos were later used to calculate the color Doppler area of each ovary, following the methodology described by [32]. Using ImageJ® software (Version 1.54g, National Institutes of Health, Millersville, USA) calibrated for this evaluation, color Doppler images of the cross-section of each ovary were used to determine the total ovarian area (TA) and the color Doppler area (DA), which were delineated manually using the software’s freehand selections feature. From the TA and DA values, the percentage of the intraovarian Doppler area (DA/TA × 100) for each ovary on each day of evaluation was calculated.
2.3. Follicular Dynamics, Corpus Luteum Growth, and Blood Perfusion Area
For three days, every 12 h starting on the day of prostaglandin application (Figure 1), follicular dynamics were analyzed by ultrasonography (model Z5 Vet; Mindray Bio-Medical Electronics Co., Shenzhen, China) using a transrectal linear probe with a frequency of 5.0 MHz. Each ovary was evaluated, and videos were recorded for later measurement using ImageJ® software (Version 1.54g, National Institutes of Health, Millersville, USA).
Every four days, from day four to sixteen after mating (Figure 1), the diameter and Doppler area of the CL were measured to monitor the growth and vascularization of the luteal tissue [33]. Measurements were conducted using B-mode and color Doppler ultrasonography (model Z5 Vet; Mindray Bio-Medical Electronics Co., Shenzhen, China), equipped with a transrectal linear transducer with a frequency of 5.0 MHz. The settings (color gain = 60%, PRF = 1.0 kHz) were consistently maintained across all evaluations. Videos of both ovaries were recorded to identify the luteal structures. During the ultrasound evaluation, the CL was initially visualized using the B-mode function, followed by activation of the color Doppler function. Subsequently, with the previously calibrated ImageJ® software (Version 1.54g, National Institutes of Health, Millersville, USA), the mean diameter of the CL (average of the vertical and horizontal dimensions) was calculated. The color Doppler area was obtained by employing the software’s freehand selections function using images of the cross-section of the CL at its largest diameter. The CL and its colored areas were manually delineated to determine the total area of the CL and the luteal Doppler area, data which were used to calculate the percentage of the Doppler area.
2.4. Blood Sampling and Metabolite Assays
Blood samples were collected on days 0 (at prostaglandin application), at mating, and on days 4, 8, 12, and 16 post-mating (Figure 1). Collections were conducted in the morning while the animals were fasting, via jugular venipuncture into 4 mL vacuum tubes containing lithium heparin anticoagulant (FIRSTLAB®, Disera Tıbbi Malzeme Lojistik San. Tic. A.Ş, Izmir, Turkey). The blood was then centrifuged at 3000 rpm for 10 min to separate the plasma, which was stored at -20 °C for later analyses of glucose, cholesterol, triglycerides, total proteins, creatinine, and urea using an automated biochemical analyzer (Mindray® BS 120, Mindray Biomedical Electronics Co., Shenzhen, China). The analyses were conducted using commercial kits (Bioclin®, Quibasa, Minas Gerais, Brazil), with the sensitivities of the kits for glucose, cholesterol, triglycerides, total protein, creatinine, and urea being 1.31 mg/dL, 0.67 mg/dL, 2.58 mg/dL, 0.043 g/dL, 0.0395 mg/dL, and 1.514 mg/dL, respectively.
2.5. Statistical Analysis
Statistical analyses were conducted using Statistica Software version 13.4.0.14 (2018; TIBCO Software, Inc., Palo Alto, CA, USA). Data were initially verified for normality using the Shapiro-Wilk test. If this condition was not met, a log10 transformation was applied. Data were analyzed using the General Linear Model (GLM) procedures of ANOVA. The factors included in the model were diet (BSD, GAAD), the interval of the sample (time), and interactions. All pairwise comparisons were performed using the Newman–Keuls post-hoc test. For pregnancy rate, twin rate, and pregnancy failure rate, the effect of the diet was analyzed using the Mann-Whitney test.
3. Results
3.1. Feeding Response and Peripheral Metabolite Levels
Table 1 depicts the response of the experimental groups to the diets, expressed as dry matter (DM) intake relative to the animals’ live weight and in kilograms per animal. Neither of these parameters showed differences between the diets or any interaction between the diets and administration time (Table 1).
The metabolic markers glucose, cholesterol, and triglycerides also showed no differences between the nutritional treatments, nor was there any interaction between groups and measurement intervals (Table 1).
Figure 2A,B,C display the values of total protein, creatinine, and plasma urea. All three markers exhibited changes during the experimental interval. Total protein was higher in the GAA group compared to the control at the time of PG2α + eCG administration, six days after the start of GAA supplementation, and on days 8 and 16 post-mating (Figure 2A). A significant interaction was observed between the diet factor and the measurement interval for creatinine concentrations (Figure 2B), with higher values in the GAA group compared to the control on the day of PG2α + eCG administration and on days 4, 8, 12, and 16 post-mating (Figure 2B). An interaction between diet and time for plasma urea was also noted (Figure 2C), due to a significant increase in the metabolite in animals supplemented with GAA from day 12 post-mating.
3.2. Ovarian Artery Blood Flow and Intraovarian Blood Perfusion Area
Figure 3A,B document the Doppler parameters of blood flow in the ovarian artery 24 h and 48 h after PG2α + eCG administration. There was an increase (P < 0.05) in the diastolic peak (Figure 3A) and pulsatility (Figure 3B) in the GAA diet, while the systolic peak did not differ between the groups (Figure 3A). The ratio between the systolic and diastolic peaks (S/D index; Figure 3B) was lower (P < 0.05) in the GAA group compared to the control. Figure 3C depicts the area of intraovarian blood perfusion measured by Doppler 24 h and 48 h after PG2α + eCG administration. The animals supplemented with GAA exhibited a larger area (P < 0.05) of blood perfusion.
3.3. Follicle Turnover
Both groups recorded a significant increase in the number of follicles with a diameter ≥ 3 mm up to 24 h after PG2α + eCG administration (Figure 4A). The maximum value of this follicular class was reached 36 h after PG2α + eCG. During these intervals (24 h and 36 h), the GAA diet recorded a higher number of these follicles than the control (Figure 4A). Throughout the measurement interval, a significant reduction in follicles with a diameter < 3 mm was also noted in the GAA group (Figure 4B). At 48 h after PG2α + eCG, the two diets differed significantly (P < 0.05; Figure 4B).
Regarding the maximum follicular diameter, there was a significant increase (P < 0.05) up to 36 h after PG2α + eCG administration in the GAA diet (Figure 4C), while for the BSD, no differences were observed between intervals after 12 h of PG2α + eCG. Figure 4D illustrates the number of follicles with a diameter > 6 mm. In the GAA diet, there was an increase in this follicular class 36 h after PG2α + eCG, while for the BSD group, the peak of these follicles was recorded 12 h after PG2α + eCG.
3.4. Reproductive Outcome
Table 2 presents the results of the estrus induction treatment and the reproductive response after mating. All animals exhibited estrus. The onset and duration of estrus, the number of CL, the CL area, and its blood perfusion area showed no differences between the diets. In both groups, a significant increase in the area and the blood perfusion area of the CL was recorded until day 12 post-mating (Effect Time P < 0.001; Table 2). No differences were observed between the groups in terms of pregnancy rate, incidence of twin births, prolificacy, and early pregnancy failure rate (Table 2).
4. Discussion
The findings of this study support the initial hypothesis that supplementation with GAA stimulates ovarian function in sheep. The results demonstrate how the application of GAA at selected dosages and timing was targeted to optimize follicular growth and ovarian vascularization but did not enhance the animals’ ovulatory response or subsequent pregnancy rates, which remained similar to those of the control group.
The substantial increase in plasma proteins and urea, along with the rise in creatinine levels observed in this study, confirmed that the dosage of GAA used was effective in promoting greater protein availability in the form of creatine in the animals.
As we know, creatine can be synthesized endogenously or acquired through the diet. In endogenous synthesis, the enzyme L-arginine:glycine amidinotransferase (AGAT) catalyzes the formation of GAA and ornithine from arginine and glycine. The enzyme guanidinoacetate N-methyltransferase (GAMT) then methylates GAA, producing creatine and S-adenosyl homocysteine. In humans, the kidneys are the primary site of GAA formation, with GAA being released and methylated predominantly by GAMT in the liver, pancreas, and to a lesser extent, in the kidneys to produce creatine [34]. From the diet, plasma creatine is absorbed by intestinal and extraintestinal cells via the creatine transport protein (SLC6A8) [35], whose activity depends on several factors such as substrate concentration and Na+ transmembrane gradients [36]. At the mitochondrial level, in a reaction catalyzed by ubiquitous mitochondrial creatine kinase (uMt-CK) or creatine kinases (CK) associated with glycolytic enzymes, both creatine molecules synthesized by the body and absorbed from the diet are phosphorylated to form adenosine diphosphate (ADP) and phosphocreatine [37]. In ruminants, approximately 50% of dietary GAA undergoes ruminal degradation and is utilized by microorganisms [23]. In the small intestine, dietary creatine is absorbed through the apical membrane of enterocytes and enters the portal circulation, where it is freely transported in the blood and rapidly absorbed by various tissue cells [34].
The GAA dosage used (0.9 g/kg DM), as reported [24], is among the most effective in terms of digestibility and performance for Angus bulls. It increased plasma creatine levels, promoted greater DM intake, and enhanced average daily gain, in addition to improving the digestibility of DM, organic matter, NDF, and ADF. It also elevated the concentration of volatile fatty acids in the rumen, leading to the conclusion that adding GAA to the diet for 90 days not only improves growth performance but also nutrient digestion. The substantial increases in plasma protein and urea, along with the rise in creatinine observed in the current study, confirmed that the GAA dosage was effective in boosting protein availability in the form of creatine in the animals. Increased dietary creatine intake enhances its plasma and tissue concentrations, including in skeletal muscle, brain, and heart [38,39].
Creatine is converted to creatinine through the spontaneous loss of a water molecule [40]. However, according to [17], less than 2% of the creatine available in the body is irreversibly converted to creatinine, indicating that the majority of creatine used for ATP production is recycled and restored in the CK circuit as phosphocreatine [34]. Therefore, the increase in plasma creatinine indicates that the GAA diet enhanced the production and availability of creatine to meet bioenergetic demands. Additionally, it has been described that increased creatine availability spares arginine, glycine, and methionine for use in other vital metabolic pathways, such as protein, nitric oxide, and glutathione synthesis [40], which may explain the increase in plasma protein levels in the GAA-supplemented group.
After the administration of eCG, animals supplemented with GAA exhibited a pronounced depletion of small follicles (< 3 mm), coupled with a simultaneous increase in the number of growing follicles (> 3 mm). These events are anticipated as part of the follicular wave growth induced by gonadotropin administration. Blood flow is the main vehicle for delivering nutrients and functional signals to the ovary, and the processes of follicular activation, growth, and maturation depend on extensive intraovarian microvascularization to supply the follicles with nutrients, oxygen, and gonadotropic and steroid hormones [41].
Following the application of eCG, both local blood flow and plasma concentrations of LH and estradiol rise simultaneously [42], enhancing the production of steroids and vasoactive substances to support follicle growth. To increase blood flow, estradiol activates endothelial nitric oxide synthase (eNOS) through mechanisms involving the membrane-associated estrogen receptor (ER), heat shock protein 90 (HSP90), and AMP-activated protein kinase (AMPK) [43,44], which promotes dilation of the vascular endothelium [42,45]. Nitric oxide, a vasodilator and angiogenic factor formed from L-arginine, plays a key role in regulating blood flow [34,46]. Thus, the enhanced ovarian microvascularization at this stage ensures the delivery of gonadotropins necessary for follicular growth. The results indicated that in the GAA group, follicular growth was not only more efficient but was also accompanied by improved vascularization of the ovarian artery and the intraovarian microcapillary system. As previously noted, creatine supplementation can increase plasma concentrations of other AAs such as arginine [26], which are utilized in additional metabolic pathways, including the phosphorylation of endothelial NO proteins [40].
In the ovaries, the origin of creatine remains uncertain, although high expression of the creatine transporter gene (SLC6A8) has been observed in rat ovaries [47], suggesting that plasma creatine is transported into ovarian cells. Additionally, evidence indicates that the creatine metabolic pathway may also be present in the ovarian stroma, as gene expression of the GAMT and AGAT enzymes has been detected in these cells in female ovaries [48]. The gonadotropic effects of creatine are still not well understood. However, creatine has been identified in human follicular fluid (FF) [49], and studies in mice have shown an increase in creatine concentrations in FF around ovulation [50]. Follicular fluid is derived from blood plasma through intraovarian vasculature and from secretions synthesized in the follicle wall and granulosa cells [51]. The expression of CK pathway genes has been found to be elevated in cumulus cells [52]. [50] proposed that the rise in creatine levels in FF is due to an increased capacity for creatine synthesis within the follicular microenvironment itself, as granulosa cells which provide nutritional support for oocyte maturation showed expression of the AGAT and GAMT genes, especially with eCG stimulation close to ovulation. In cattle, the presence of GAA and an increase in creatine concentrations were observed in the maturation medium of cumulus-oocyte complexes (COCs) [53].
It is known that communication within COCs is bidirectional, as the structural organization of the cells allows for the transport of molecules in both directions, and signals originating from the oocyte can interact with receptors on cumulus cells, modulating their function [54]. In bovine oocytes, gene and protein expression of ubiquitous uMt-CK and CKBB activity increased, with higher gene expression of CK in immature oocytes [21], ensuring the storage of phosphocreatine to help maintain intracellular ATP levels. Depending on cellular need and the available levels of intracellular ADP/ATP, creatine phosphorylation is reversed according to the proportion of CK isoforms in the cytosol, which hydrolyze the bond between creatine and the stored phosphate group, regenerating ATP [39]. Among the CK isoforms, the most common is the brain type (CKBB), but the muscle type (CKMM) has also been identified in the mouse oocyte [50]. Therefore, when CK isoforms and components of creatine metabolism are present in the cell, this circuit produces ATP rapidly, meeting the high bioenergetic demands of the tissue [37], as is the case during ovulation. In mice, gene expression of CKMM and CKBB activity have been shown to increase during oocyte maturation and the early embryonic stages [47,50].
One of the main findings of this study was the observable effect of creatine on the ovaries in sheep after a brief period of GAA supplementation in the diet. As previously described, the dosage selected for this study was based on the best results available from trials on ruminants that measured productive and nutritional parameters. A primary challenge was thus to determine whether this model could be effective in short-term reproductive protocols. The existing literature on GAA use in ruminants and other species predominantly focuses on long-term trials (over 10 weeks) and primarily examines productive response parameters [27,55]. Recently, [26] tested a 0.2% GAA supplementation in cattle over a 12-week trial during gestation, finding no differences between groups in serum and uric creatine concentrations or offspring performance. However, they observed increases in serum NO, placental vascularization, and plasma concentrations of arginine, ornithine, citrulline, and tyrosine, as well as AGAT activity in the liver, while noting a decrease in skeletal muscle mobilization. [56] added 0.1% GAA to the TMR of growing steers for 60 days, resulting in decreased DM intake without affecting body weight or average daily gain, thereby suggesting an improvement in feed conversion.
The authors speculated that the decrease in DM intake might be linked to the animals’ mechanisms for regulating their energy intake, as GAA also increases the energy concentration of the TMR. Another recent study by [57], testing various concentrations (0.2%, 0.4%, 0.6%, and 0.8%) of GAA in the diet of fistulated female cattle over 48 h of in vitro fermentation, demonstrated a significant increase in microbial protein and propionate in the rumen. This study also noted a reduction in isovalerate and an increase in the bacterial communities Bacteroidota, Prevotella, and Prevotellaceae_UCG-001 with 0.8% GAA. Additionally, metabolic pathways related to bile secretion, digestion, and protein absorption were enhanced, leading to the conclusion that GAA improves ruminal fermentation parameters and increases the relative abundance of bacteria associated with the degradation of non-fibrous substances, thus providing more energy to the animal.
Our results showed that GAA exerted its effects on the follicular environment within a short timeframe, in this instance after only 10 days of supplementation. Nonetheless, the chosen protocol did not effectively alter the ovulatory rate or the quality of the corpus luteum. These outcomes were partially anticipated, as it is well recognized that follicular growth, oocyte competence, and embryonic development are processes that have distinct nutritional requirements.
Amino acid metabolism varies with embryonic stage; for example, glutamine, which is prevalent in proliferating somatic cells, is abundant in two- and four-cell bovine embryos before decreasing inversely with glucose uptake and then increasing again during blastocyst expansion due to heightened protein synthesis [58]. Additionally, selenocysteine, a component of glutathione peroxidase, is found in oocytes and early embryos and, although it enhances blastocyst rates, its specific role in mammalian oocytes or embryos has yet to be fully understood [58]. Maternal nutrition is known to influence the physiological mechanisms required for the acquisition of oocyte competence and embryonic development. The oocyte requires substantial energy during its development in preparation for the bioenergetic demands of maturation and fertilization. Therefore, the periconceptional period is critical, as nutrition can induce various effects, primarily through epigenetic modifications and mitochondrial deficiencies [59]. During oocyte maturation, components such as RNA and proteins accumulate to support the future development of the embryo until the activation of the embryonic genome. Consequently, during these processes, various molecules, including amino acids, pyruvate, fatty acids, cytokines, and growth factors, are modulated by nutritional intake [60].
Oocytes metabolize glucose via glycolysis, pentose phosphate pathways, and the tricarboxylic acid cycle, contributing to ATP production and NADPH supply [61]. However, amino acids can also be metabolized by the tricarboxylic acid cycle to produce ATP. These nutrients are utilized by the cumulus oocyte complex and enhance developmental competence for the blastocyst stage [62]. Therefore, limitations in amino acids and proteins can impair the energy metabolism of reproductive cells.
According to [60], protein restriction can affect the ultrastructure of oocyte mitochondria. A low-protein diet influences the expression of genes that mediate mitochondrial fusion, which can lead to defective mitochondrial biogenesis and dysregulation of apoptosis in oocytes [60]. Additionally, the metabolism of protein components varies with the oocyte stage, as immature bovine oocytes exhibit higher expression of creatine kinase compared to mature oocytes. This suggests that creatine kinase activity is integral to maintaining intracellular ATP levels, ensuring successful maturation [18].
Moreover, nutrient utilization changes after fertilization and the onset of embryonic development. In embryos, ATP production occurs to provide energy for cell growth and development, with glucose as the primary energy source, although other nutrients such as amino acids are also important [61]. Regarding carnitine metabolism, it occurs differently in oocytes and embryos. [63] noted that cumulus cells do not express transcripts for enzymes involved in carnitine synthesis, indicating that oocytes rely on carnitine uptake from follicular fluid. In embryonic metabolism, however, transcripts of carnitine palmitoyltransferase 1B were temporarily detected at the zygote stage in mice and reappeared at the morula and blastocyst stages [64]. Another observation from the same study shows that carnitine palmitoyltransferase 2 transcripts decreased post-fertilization to undetectable levels but were present again during the morula stage, concurrent with increased oxygen uptake and fatty acid oxidation [64].
5. Conclusion
The inclusion of guanidine acetic acid in the diet of ewes at a dose of 0.9 g/kg of dry matter for 10 days before mating significantly altered the ovarian blood supply and improved follicular growth, but it did not affect the pregnancy rate or prolificacy. Therefore, we intend to conduct further prospective studies on the effects of guanidine acetic acid in sheep, exploring new doses and application times to establish effective supplementation protocols that support its adoption within the proper period for the breeding of this species.
Author Contributions
M.C.S.: Investigation, Writing-original draft; C.M.C.: Investigation, Methodology, Writing-original draft; A.J.H.C.: Investigation, Methodology; B.V.F.A.: Investigation; L.F.B.C.: Investigation; J.N.S.: Investigation; Y.H.M: Investigation; C.C.L.F.: Supervision, Investigation, Methodology; JPMA: Supervision, Investigation, Methodology, Writing-original draft; DIAT: Funding acquisition, Resources; DR: Conceptualization, Funding acquisition, Formal Analysis, Supervision, Writing-original draft.
Funding
This research received funding from Fundação Cearense de Apoio ao Desenvolvimento Científico e Tecnológico, FUNCAP (Grant No. 09564039\2022 and grant No. FPD-0213-00067.01.00/23).
Institutional Review Board Statement
The study followed the ARRIVE 2.0 guidelines (du Sert et al., 2020). All procedures used in this study were approved by the Ethics Committee on Animal Experimentation of Ceara State University (NUP 31032.003776/2023-32).
Informed Consent Statement
Not applicable.
Data Availability Statement
The data produced during the current study are available from the corresponding author on reasonable request.
Acknowledgments
We thank Evonik Brazil (EVONIK BRASIL LTDA. São Paulo – SP – Brasil) to thank for donating the product GuanAMINO ®.
Conflicts of Interest
The authors declare no conflict of interest.
References
- Cao, Y.; Yao, J.; Sun, X.; Liu, S.; Martin, G.B. (2021). Amino acids in the nutrition and production of sheep and goats. Amino Acids in Nutrition and Health: Amino Acids in the Nutrition of Companion, Zoo and Farm Animals, 63-79.
- Wu, G.; Bazer, F.W.; Johnson, G.A.; Satterfield, M.C.; Washburn, S.E. Metabolism and Nutrition of L-Glutamate and L-Glutamine in Ruminants. Animals 2024, 14, 1788. [Google Scholar] [CrossRef] [PubMed]
- Lass, G.; Li, X.F.; Voliotis, M.; Wall, E.; de Burgh, R.A.; Ivanova, D.; O’Byrne, K.T. GnRH pulse generator frequency is modulated by kisspeptin and GABA-glutamate interactions in the posterodorsal medial amygdala in female mice. Journal of Neuroendocrinology 2022, 34, e13207. [Google Scholar] [CrossRef] [PubMed]
- Conde, A.J.H.; Alves, J.P.M.; Fernandes, C.C.L.; Silva, M.R.L.; Cavalcanti, C.M.; Bezerra, A.F.; Rondina, D. Effect of one or two fixed glutamate doses on follicular development, ovarian-intraovarian blood flow, ovulatory rate, and corpus luteum quality in goats with a low body condition score. Animal Reproduction 2023, 20, e20220117. [Google Scholar] [CrossRef] [PubMed]
- Soares, A.C.S.; Alves, J.P.M.; Fernandes, C.C.L.; Silva, M.R.L.; Conde, A.J.H.; Teixeira, D.Í. A.; Rondina, D. Use of monosodium-glutamate as a novel dietary supplement strategy for ovarian stimulation in goats. Animal Reproduction 2023, 20, e20230094. [Google Scholar] [CrossRef] [PubMed]
- Luna-García LA, Meza-Herrera CA, Pérez-Marín CC, Corona R, Luna-Orozco JR, Véliz-Deras FG, DelgadoGonzalez R, Rodriguez-Venegas R, Rosales-Nieto CA, Bustamante-Andrade JA, Gutierrez-Guzman UN. Goats as valuable animal model to test the targeted glutamate supplementation upon antral follicle number, ovulation rate, and LH-Pulsatility. Biology 2022, 11, 1015. [Google Scholar] [CrossRef] [PubMed]
- Porter, D.T.; Goodman, R.L.; Hileman, S.M.; Lehman, M.N. Evidence that synaptic plasticity of glutamatergic inputs onto KNDy neurones during the ovine follicular phase is dependent on increasing levels of oestradiol. Journal of neuroendocrinology 2021, 33, e12945. [Google Scholar] [CrossRef]
- Alborzi, P.; Atrabi, M.J.; Akbarinejad, V.; Khanbabaei, R.; Fathi, R. Incorporation of arginine, glutamine or leucine in culture medium accelerates in vitro activation of primordial follicles in 1-day-old mouse ovary. Zygote 2020, 28, 409–416. [Google Scholar] [CrossRef]
- Monte, A.P.O.; Barros, V.R.P.; Santos, J.M.; Menezes, V.G.; Cavalcante, A.Y.P.; Gouveia, B.B.; Matos, M.H.T. Immunohistochemical localization of insulin-like growth factor-1 (IGF-1) in the sheep ovary and the synergistic effect of IGF-1 and FSH on follicular development in vitro and LH receptor immunostaining. Theriogenology 2019, 129, 61–69. [Google Scholar] [CrossRef]
- Berdenis van Berlekom, A.; Kübler, R.; Hoogeboom, J.W.; Vonk, D.; Sluijs, J.A.; Pasterkamp, R.J.; Boks, M.P. Exposure to the amino acids histidine, lysine, and threonine reduces mTOR activity and affects neurodevelopment in a human cerebral organoid model. Nutrients 2022, 14, 2175. [Google Scholar] [CrossRef]
- Guo, X.; Zhu, Y.; Guo, L.; Qi, Y.; Liu, X.; Wang, J.; Li, J. BCAA insufficiency leads to premature ovarian insufficiency via ceramide-induced elevation of ROS. EMBO molecular medicine 2023, 15, e17450. [Google Scholar] [CrossRef]
- Simcox, J.; Lamming, D.W. The central moTOR of metabolism. Developmental cell 2022, 57, 691–706. [Google Scholar] [CrossRef]
- Johnson, C.S.; Micevych, P.E.; Mermelstein, P.G. Membrane estrogen signaling in female reproduction and motivation. Frontiers in Endocrinology 2022, 13, 1009379. [Google Scholar] [CrossRef]
- Della Torre, S.; Rando, G.; Meda, C.; Stell, A.; Chambon, P.; Krust, A.; Maggi, A. Amino acid-dependent activation of liver estrogen receptor alpha integrates metabolic and reproductive functions via IGF-1. Cell metabolism 2011, 13, 205–214. [Google Scholar] [CrossRef]
- Li, L.; Lu, C.; Zhang, D.; Liu, H.; Cui, S. Taurine promotes estrogen synthesis by regulating microRNA-7a2 in mice ovarian granulosa cells. Biochemical and Biophysical Research Communications 2022, 626, 129–134. [Google Scholar] [CrossRef]
- Yang, G.; Li, S.; Cai, S.; Zhou, J.; Ye, Q.; Zhang, S.; Zeng, X. Dietary methionine supplementation during the estrous cycle improves follicular development and estrogen synthesis in rats. Food & Function 2024, 15, 704–715. [Google Scholar] [CrossRef]
- Brosnan, J.T.; Brosnan, M.E. Creatine: endogenous metabolite, dietary, and therapeutic supplement. Annu. Rev. Nutr. 2007, 27, 241–261. [Google Scholar] [CrossRef] [PubMed]
- Muccini, A.M.; Tran, N.T.; de Guingand, D.L.; Philip, M.; Della Gatta, P.A.; Galinsky, R.; Ellery, S.J. Creatine metabolism in female reproduction, pregnancy and newborn health. Nutrients 2021, 13, 490. [Google Scholar] [CrossRef] [PubMed]
- Schlattner, U.; Klaus, A.; Ramirez Rios, S.; Guzun, R.; Kay, L.; Tokarska-Schlattner, M. Cellular compartmentation of energy metabolism: creatine kinase microcompartments and recruitment of B-type creatine kinase to specific subcellular sites. Amino Acids 2016, 48, 1751–1774. [Google Scholar] [CrossRef]
- Asiriwardhana, M.; Bertolo, R.F. Guanidinoacetic acid supplementation: a narrative review of its metabolism and effects in swine and poultry. Frontiers in Animal Science 2022, 3, 972868. [Google Scholar] [CrossRef]
- Scantland, S.; Tessaro, I.; Macabelli, C.H.; Macaulay, A.D.; Cagnone, G.; Fournier, É.; Robert, C. The adenosine salvage pathway as an alternative to mitochondrial production of ATP in maturing mammalian oocytes. Biology of reproduction 2014, 91, 75. [Google Scholar] [CrossRef]
- Tamanho do mercado de ácido guanidinoacético – Relatório 2024 a 2032. Disponível em: <https://www.businessresearchinsights.com/pt/market-reports/guanidinoacetic-acid-market-100386>. Acesso em: 3 out. 2024.
- Speer, H.F. (2019). Efficacy of guanidinoacetic acid supplementation to growing cattle and relative bioavailability of guanidinoacetic acid delivered ruminally or abomasally (Doctoral dissertation, Kansas State University, Manhattan, KU, USA).
- Li, S.Y.; Wang, C.; Wu, Z.Z.; Liu, Q.; Guo, G.; Huo, W.J.; Zhang, S.L. Effects of guanidinoacetic acid supplementation on growth performance, nutrient digestion, rumen fermentation and blood metabolites in Angus bulls. Animal 2020, 14, 2535–2542. [Google Scholar] [CrossRef]
- Zhang, S.; Zang, C.; Pan, J.; Ma, C.; Wang, C.; Li, X.; Yang, K. Effects of dietary guanidinoacetic acid on growth performance, guanidinoacetic acid absorption and creatine metabolism of lambs. PLoS ONE 2022, 17, e0264864. [Google Scholar] [CrossRef]
- Sousa, L.C.O.; et al. Dietary guanidinoacetic acid as arginine spare molecule for beef cows at late gestation: Effects on cow’s performance and metabolism, and offspring growth and development. Animal Feed Science and Technology 2024, 315, 116047. [Google Scholar] [CrossRef]
- EFSA FEEDAP Panel (EFSA Panel on Additives and Products or Substances used in Animal Feed), Bampidis V, Azimonti G, Bastos ML, Christensen H, Dusemund B, Fasmon Durjava M, Kouba M, Lopez-Alonso M, Lopez Puente S, Marcon F, Mayo B, Pechova A, Petkova M, Ramos F, Sanz Y, Villa RE, Woutersen R, Gropp J, Anguita M, Galobart J, Ortu~ no Casanova J, Pizzo F and Tarres-Call J, 2022. Scientific Opinion on the safety and efficacy of a feed additive consisting of guanidinoacetic acid for all animal species (Alzchem Trostberg GmbH). EFSA Journal 2022;20:7269, 17pp. [CrossRef]
- Fernandes, C.C.L.; Aguiar, L.H.; Calder’on, C.E.M.; Silva, A.M.; Alves, J.P.M.; Rossetto, R.; Bertolini, L.R.; Bertolini, M.; Rondina, D. Nutritional impact on gene expression and competence of oocytes used to support embryo development and livebirth by cloning procedures in goats. Anim. Reprod. Sci. 2018, 188, 1–12. [Google Scholar] [CrossRef] [PubMed]
- National Research Council. (2007). Nutrient requirements of small ruminants: Sheep, goats, cervids, and new world camelids.
- Morales-Martinez, M.A.; et al. Developing equations for predicting internal body fat in Pelibuey sheep using ultrasound measurements. Small Ruminant Research 2020, 183, 106031. [Google Scholar] [CrossRef]
- Souza S.S, Alves B.G, Alves K.A, Santos J.D.R, Diogenes Y.P, Bhat M.H, Melo L.M, Freitas V.J.F, Teixeira D. I.A. Relationship of Doppler velocimetry parameters with antral follicular population and oocyte quality in Canindé goats. Small Rumin Res. 2016;141:39-44. [CrossRef]
- Oliveira, M.E.; Feliciano, M.A.; D’Amato, C.C.; Oliveira, L.G.; Bicudo, S.D.; Fonseca, J.F.; Bartlewski, P.M. Correlations between ovarian follicular blood flow and superovulatory responses in ewes. Animal Reproduction Science 2014, 144, 30–37. [Google Scholar] [CrossRef]
- Balaro, M.F.A.; Santos, A.S.; Moura, L.F.G.; Fonseca, J.F.; Brandão, F.Z. Luteal dynamic and functionality assessment in dairy goats by luteal blood flow, luteal biometry, and hormonal assay. Theriogenology 2017, 95, 118–126. [Google Scholar] [CrossRef]
- Wu, G. Important roles of dietary taurine, creatine, carnosine, anserine and 4-hydroxyproline in human nutrition and health. Amino Acids 2020, 52, 329–360. [Google Scholar] [CrossRef]
- Boehm, E.; Chan, S.; Monfared, M.; Wallimann, T.; Clarke, K.; Neubauer, S. Creatine transporter activity and content in the rat heart supplemented by and depleted of creatine. American Journal of Physiology-Endocrinology and Metabolism 2003, 284, E399–E406. [Google Scholar] [CrossRef]
- Snow, R.J.; Murphy, R.M. Creatine and the creatine transporter: a review. Molecular and cellular biochemistry 2001, 224, 169–181. [Google Scholar] [CrossRef]
- Schlattner, U.; Tokarska-Schlattner, M.; Wallimann, T. Mitochondrial creatine kinase in human health and disease. Biochimica et Biophysica Acta (BBA)-Molecular Basis of Disease 2006, 1762, 164–180. [Google Scholar] [CrossRef] [PubMed]
- Derave, W.; Marescau, B.; Eede, E.V.; Eijnde, B.O.; De Deyn, P.P.; Hespel, P. Plasma guanidino compounds are altered by oral creatine supplementation in healthy humans. Journal of Applied Physiology 2004, 97, 852–857. [Google Scholar] [CrossRef]
- Wyss, M.; Kaddurah-Daouk, R. Creatine and creatinine metabolism. Physiological reviews 2000, 80, 1107–1213. [Google Scholar] [CrossRef]
- Wu, G. (2021). Amino Acids: Biochemistry and Nutrition (2nd ed.). CRC Press. [CrossRef]
- Acosta, T.J.; Hayashi, K.G.; Ohtani, M.; Miyamoto, A. Local changes in blood flow within the preovulatory follicle wall and early corpus luteum in cows. Reproduction 2003, 125, 759–767. [Google Scholar] [CrossRef] [PubMed]
- Abdelnaby, E.A.; Alhaider, A.K.; El-Maaty, A.M.A.; Ragab, R.S.; Seida, A.A.; El-Badry, D.A. Ovarian and uterine arteries blood flow velocities waveform, hormones and nitric oxide in relation to ovulation in cows superstimulated with equine chorionic gonadotropin and luteolysis induction 10 and 17 days after ovulation. BMC Veterinary Research 2023, 19, 205. [Google Scholar] [CrossRef] [PubMed]
- Chambliss, K.L.; Shaul, P.W. Estrogen modulation of endothelial nitric oxide synthase. Endocrine Reviews 2002, 23, 665–686. [Google Scholar] [CrossRef]
- Schulz, E.; Anter, E.; Zou, M.H.; Keaney Jr, J.F. Estradiol-mediated endothelial nitric oxide synthase association with heat shock protein 90 requires adenosine monophosphate-dependent protein kinase. Circulation 2005, 111, 3473–3480. [Google Scholar] [CrossRef]
- LeBlanc, A.J.; Reyes, R.; Kang, L.S.; Dailey, R.A.; Stallone, J.N.; Moningka, N.C.; Muller-Delp, J.M. Estrogen replacement restores flow-induced vasodilation in coronary arterioles of aged and ovariectomized rats. American Journal of Physiology-Regulatory, Integrative and Comparative Physiology 2009, 297, R1713–R1723. [Google Scholar] [CrossRef]
- Oess, S.; et al. Subcellular targeting and trafficking of nitric oxide synthases. Biochemical Journal 2006, 396, 401–409. [Google Scholar] [CrossRef]
- Forsey, K.E.; Ellis, P.J.; Sargent, C.A.; Sturmey, R.G.; Leese, H.J. Expression and localization of creatine kinase in the preimplantation embryo. Molecular reproduction and development 2013, 80, 185–192. [Google Scholar] [CrossRef]
- Uhlén, M.; Fagerberg, L.; Hallström, B.M.; Lindskog, C.; Oksvold, P.; Mardinoglu, A.; Pontén, F. Tissue-based map of the human proteome. Science 2015, 347, 1260419. [Google Scholar] [CrossRef] [PubMed]
- Morelli, M.A.; Iuliano, A.; Schettini, S.C.A.; Petruzzi, D.; Ferri, A.; Colucci, P.; Ostuni, A. Metabolic changes in follicular fluids of patients treated with recombinant versus urinary human chorionic gonadotropin for triggering ovulation in assisted reproductive technologies: A metabolomics pilot study. Archives of Gynecology and Obstetrics 2020, 302, 741–751. [Google Scholar] [CrossRef] [PubMed]
- Umehara, T.; Kawai, T.; Goto, M.; Richards, J.S.; Shimada, M. Creatine enhances the duration of sperm capacitation: a novel factor for improving in vitro fertilization with small numbers of sperm. Human Reproduction 2018, 33, 1117–1129. [Google Scholar] [CrossRef]
- O’Gorman, A.; Wallace, M.; Cottell, E.; Gibney, M.J.; McAuliffe, F.M.; Wingfield, M.; Brennan, L. Metabolic profiling of human follicular fluid identifies potential biomarkers of oocyte developmental competence. Reproduction 2013, 146, 389–395. [Google Scholar] [CrossRef]
- Lee, M.S.; Liu, C.H.; Lee, T.H.; Wu, H.M.; Huang, C.C.; Huang, L.S.; Cheng, E.H. Association of creatin kinase B and peroxiredoxin 2 expression with age and embryo quality in cumulus cells. Journal of assisted reproduction and genetics 2010, 27, 629–639. [Google Scholar] [CrossRef]
- Uhde, K.; van Tol, H.T.; Stout, T.A.; Roelen, B.A. Metabolomic profiles of bovine cumulus cells and cumulus-oocyte-complex-conditioned medium during maturation in vitro. Scientific reports 2018, 8, 9477. [Google Scholar] [CrossRef]
- Freitas, C.; Neto, A.C.; Matos, L.; Silva, E.; Ribeiro, Â.; Silva-Carvalho, J.L.; Almeida, H. Follicular Fluid redox involvement for ovarian follicle growth. Journal of Ovarian Research 2017, 10, 1–10. [Google Scholar] [CrossRef]
- EFSA FEEDAP Panel (EFSA Panel on Additives and Products or Substances used in Animal Feed), 2016. Scientific opinion on the safety and efficacy of guanidinoacetic acid for chickens for fattening, breeder hens and roosters, and pigs. EFSA Journal 2016;14:4394, 39pp. [CrossRef]
- Sánchez-Villasana, J.; López-Aguirre, D.; Peña-Avelino, L.Y.; Zapata-Campos, C.C.; Alvarado-Ramírez, E.R.; González, D.N.T.; Salem, A.Z.M. Influence of dietary supplementation of guanidinoacetic acid on growth performance and blood chemistry profile of growing steers. Journal of Agriculture and Food Research 2024, 18, 101327. [Google Scholar] [CrossRef]
- Dong, C.; Wei, M.; Ju, J.; Du, L.; Zhang, R.; Xiao, M.; Bao, M. Effects of guanidinoacetic acid on in vitro rumen fermentation and microflora structure and predicted gene function. Frontiers in Microbiology 2024, 14, 1285466. [Google Scholar] [CrossRef]
- Leese, H.J.; McKeegan, P.J.; Sturmey, R.G. Amino acids and the early mammalian embryo: Origin, fate, function and life-long legacy. International Journal of Environmental Research and Public Health 2021, 18, 9874. [Google Scholar] [CrossRef]
- Rodríguez-Cano, A.M.; Calzada-Mendoza, C.C.; Estrada-Gutierrez, G.; Mendoza-Ortega, J.A.; Perichart-Perera, O. Nutrients, mitochondrial function, and perinatal health. Nutrients 2020, 12, 2166. [Google Scholar] [CrossRef] [PubMed]
- Fabozzi, G.; Iussig, B.; Cimadomo, D.; Vaiarelli, A.; Maggiulli, R.; Ubaldi, N.; Ubaldi, F.M.; Rienzi, L. The impact of unbalanced maternal nutritional intakes on oocyte mitochondrial activity: implications for reproductive function. Antioxidants 2021, 10, 91. [Google Scholar] [CrossRef] [PubMed]
- Krisher, R.L. Oocyte and embryo metabolomics. Biosci. Proc. 2019, 19. [Google Scholar] [CrossRef]
- Zhao, J.; Wang, W.; Zhang, L.; Zhang, J.; Sturmey, R.; Zhang, J. Dynamic metabolism during early mammalian embryogenesis. Development 2023, 150, dev202148. [Google Scholar] [CrossRef]
- Placidi, M.; Di Emidio, G.; Virmani, A.; D’Alfonso, A.; Artini, P.G.; D’Alessandro, A.M.; Tatone, C. Carnitines as mitochondrial modulators of oocyte and embryo bioenergetics. Antioxidants 2022, 11, 745. [Google Scholar] [CrossRef]
- Gentile, L.; Monti, M.; Sebastiano, V.; Merico, V.; Nicolai, R.; Calvani, M. Single-cell quantitative RT-PCR analysis of Cpt1b and Cpt2 gene expression in mouse antral oocytes and in preimplantation embryos. Cytogenetic and genome research 2004, 105, 215–221. [Google Scholar] [CrossRef]
Figure 1.
Timeline of experimental stages, including guanidine acetic acid (GAA) supply and hormonal protocol.
Figure 1.
Timeline of experimental stages, including guanidine acetic acid (GAA) supply and hormonal protocol.
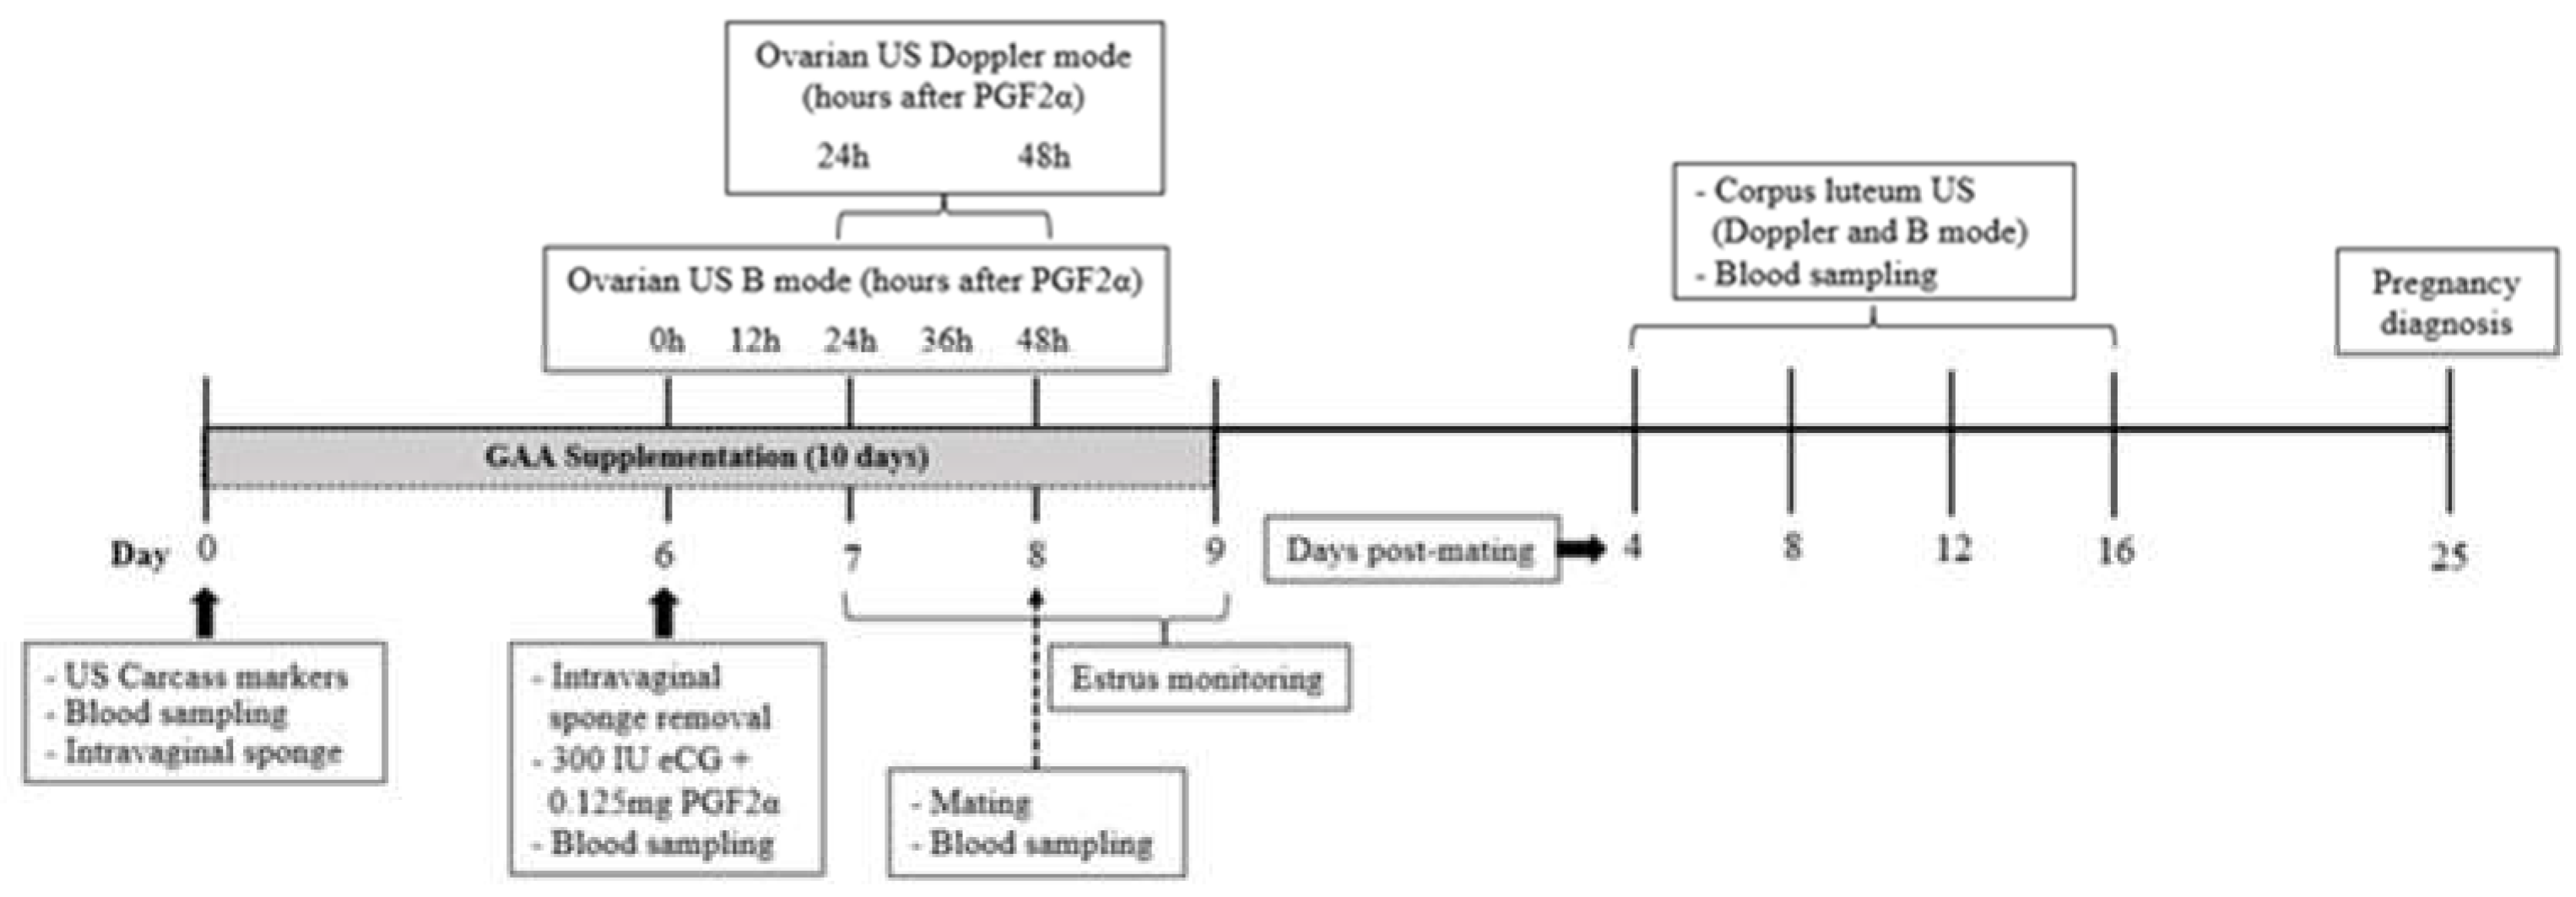
Figure 2.
Peripheral protein (Figure 2A), creatinine (Figure 2B), and urea (Figure 2C) levels measured during the experimental period in ewes fed a baseline diet (BSD) or a diet supplemented with guanidine acetic acid (GGAD). P-values of the ANOVA effects for diet, sampling interval (Time), and interaction, are given. Values are represented as means ± SEM. *P< 0.05 differences between diet groups. **P< 0.01 differences between diet groups. Bar represents the GAA supply period.
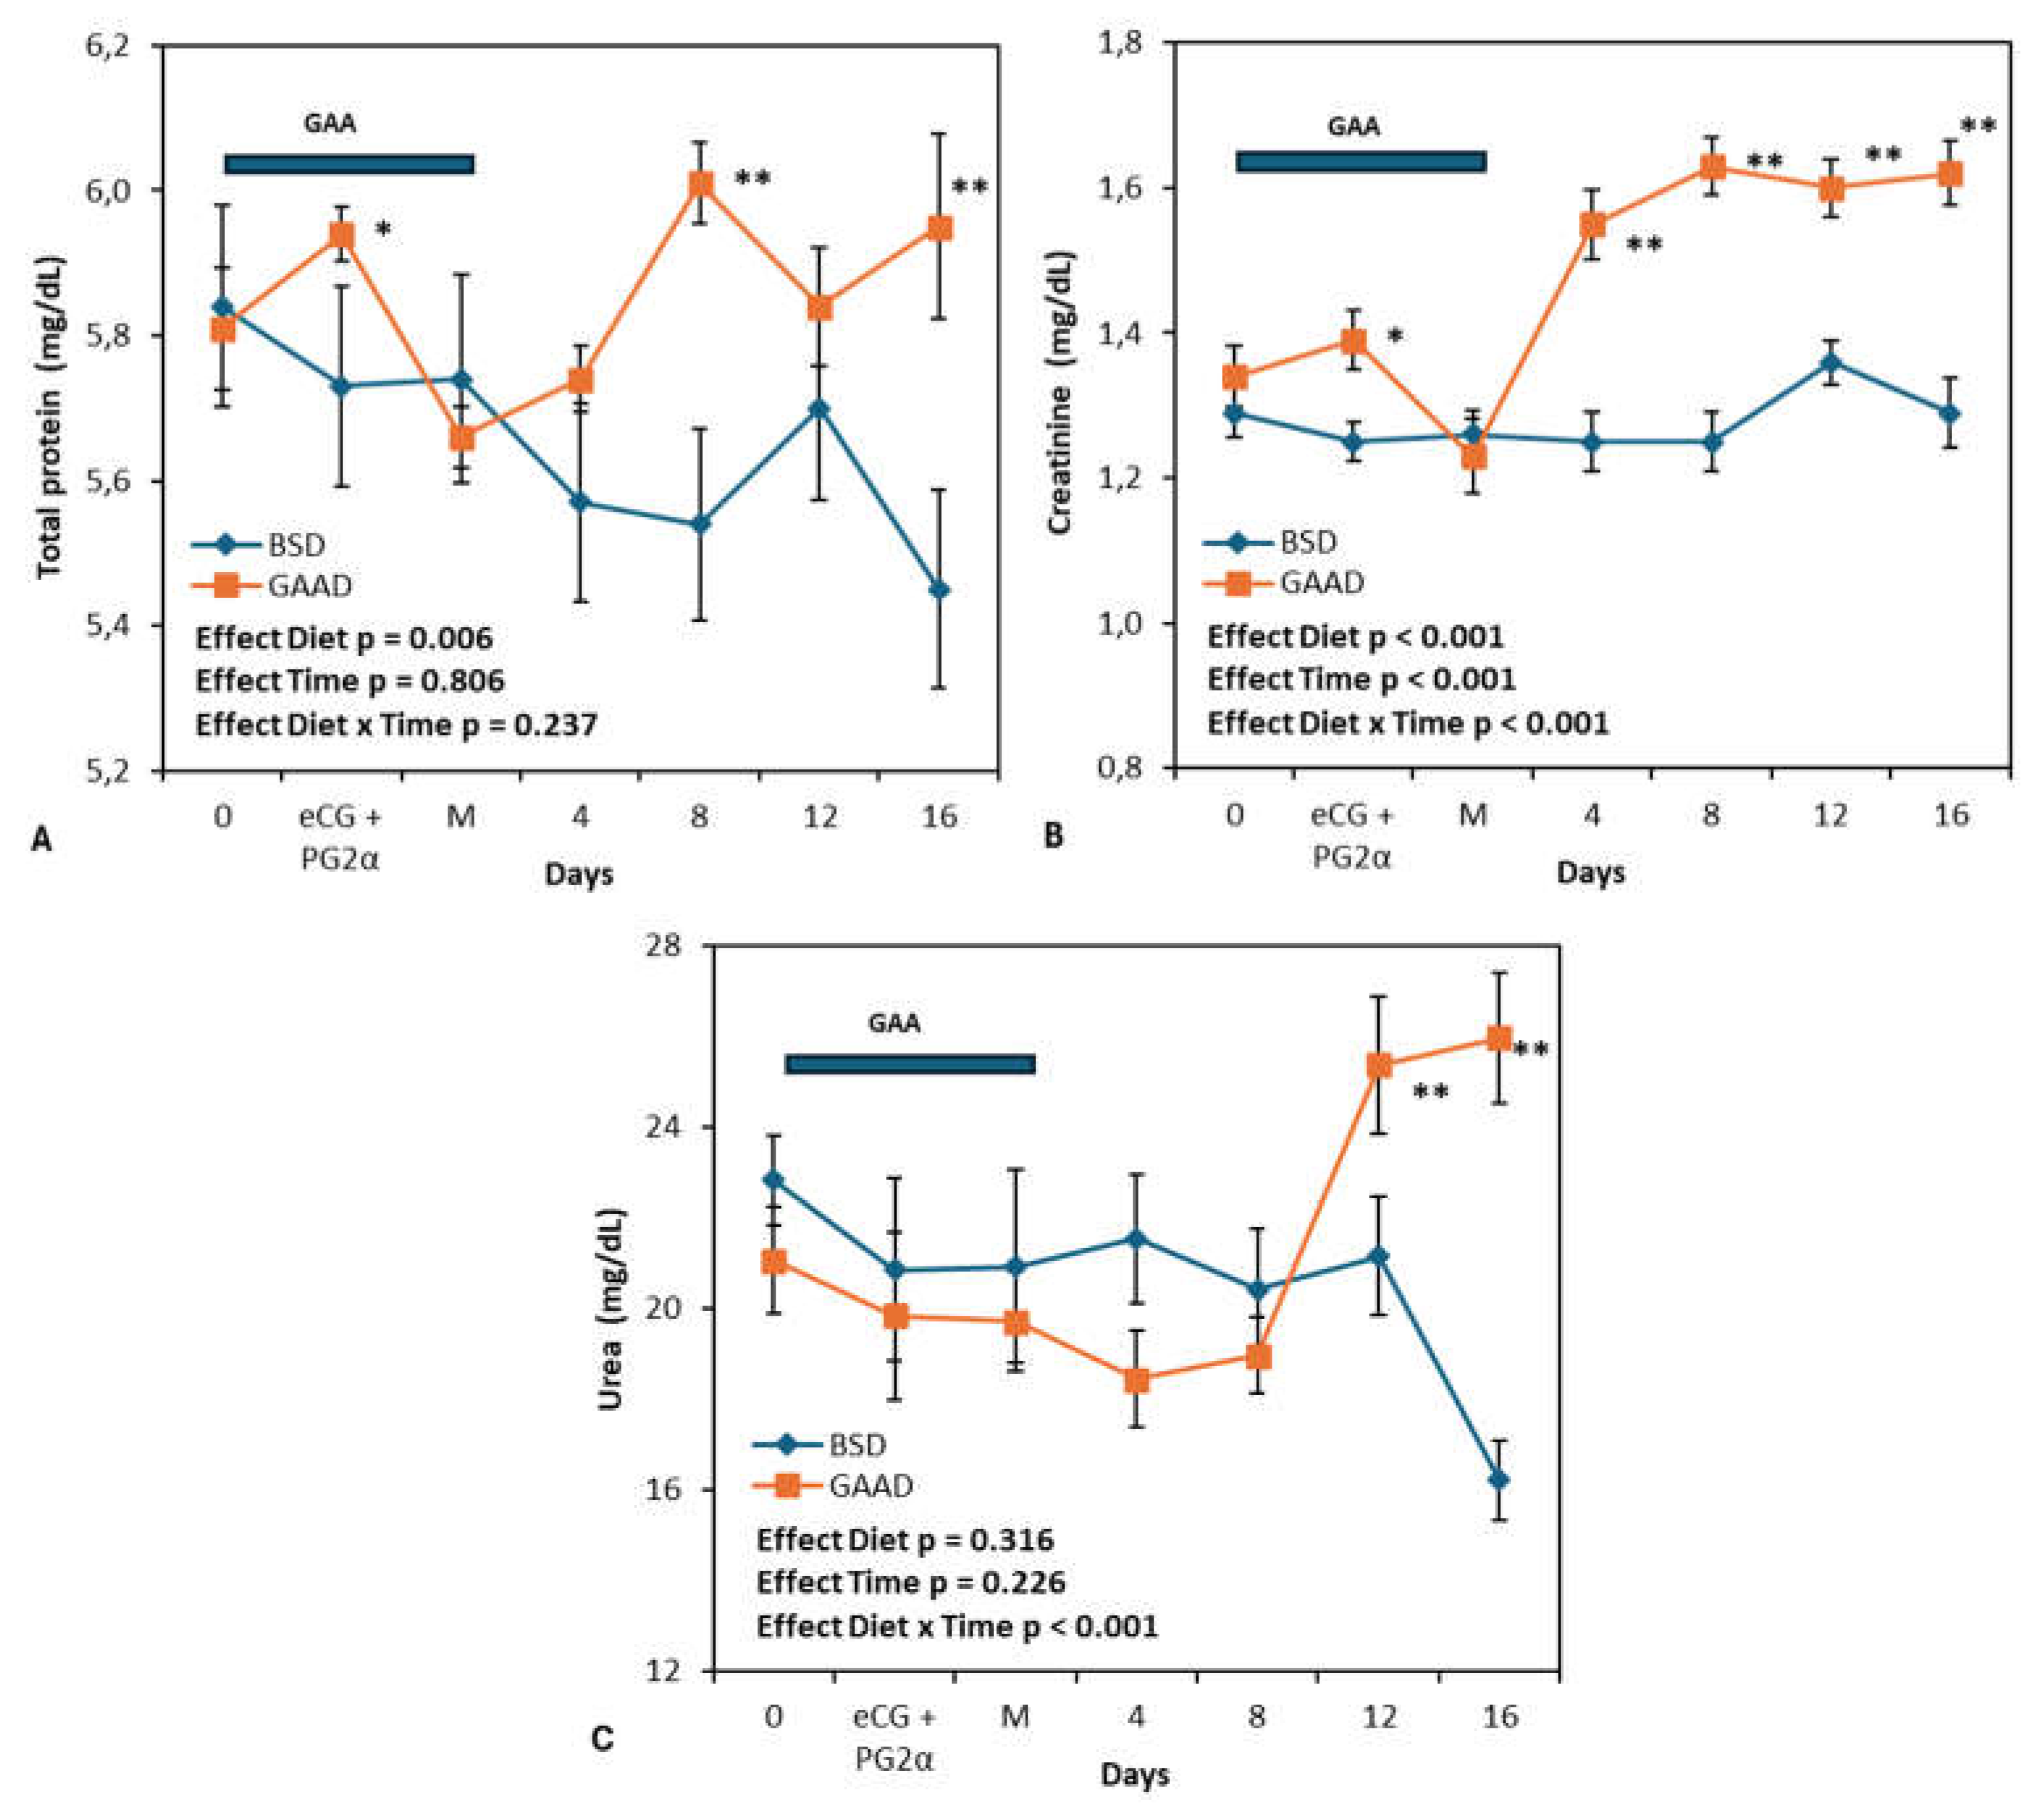
Figure 3.
Systolic peak (SP) and diastolic peak (DP) (Figure 3A); Systolic/diastolic index (S/D) and pulsatility index (Figure 3B) as measured in ovarian artery with doppler ultrasonography 24 h and 48 h after prostaglandin application in ewes fed a baseline diet (BSD) or a diet supplemented with guanidine acetic acid (GAAD); Intraovarian blood flow perfusion area as measured by doppler ultrasonography 24 h and 48 h after prostaglandin application in ewes fed BSD or GAAD (Figure 3C).Values are represented as means ± SEM. A,B P< 0.05 differences between diet groups.
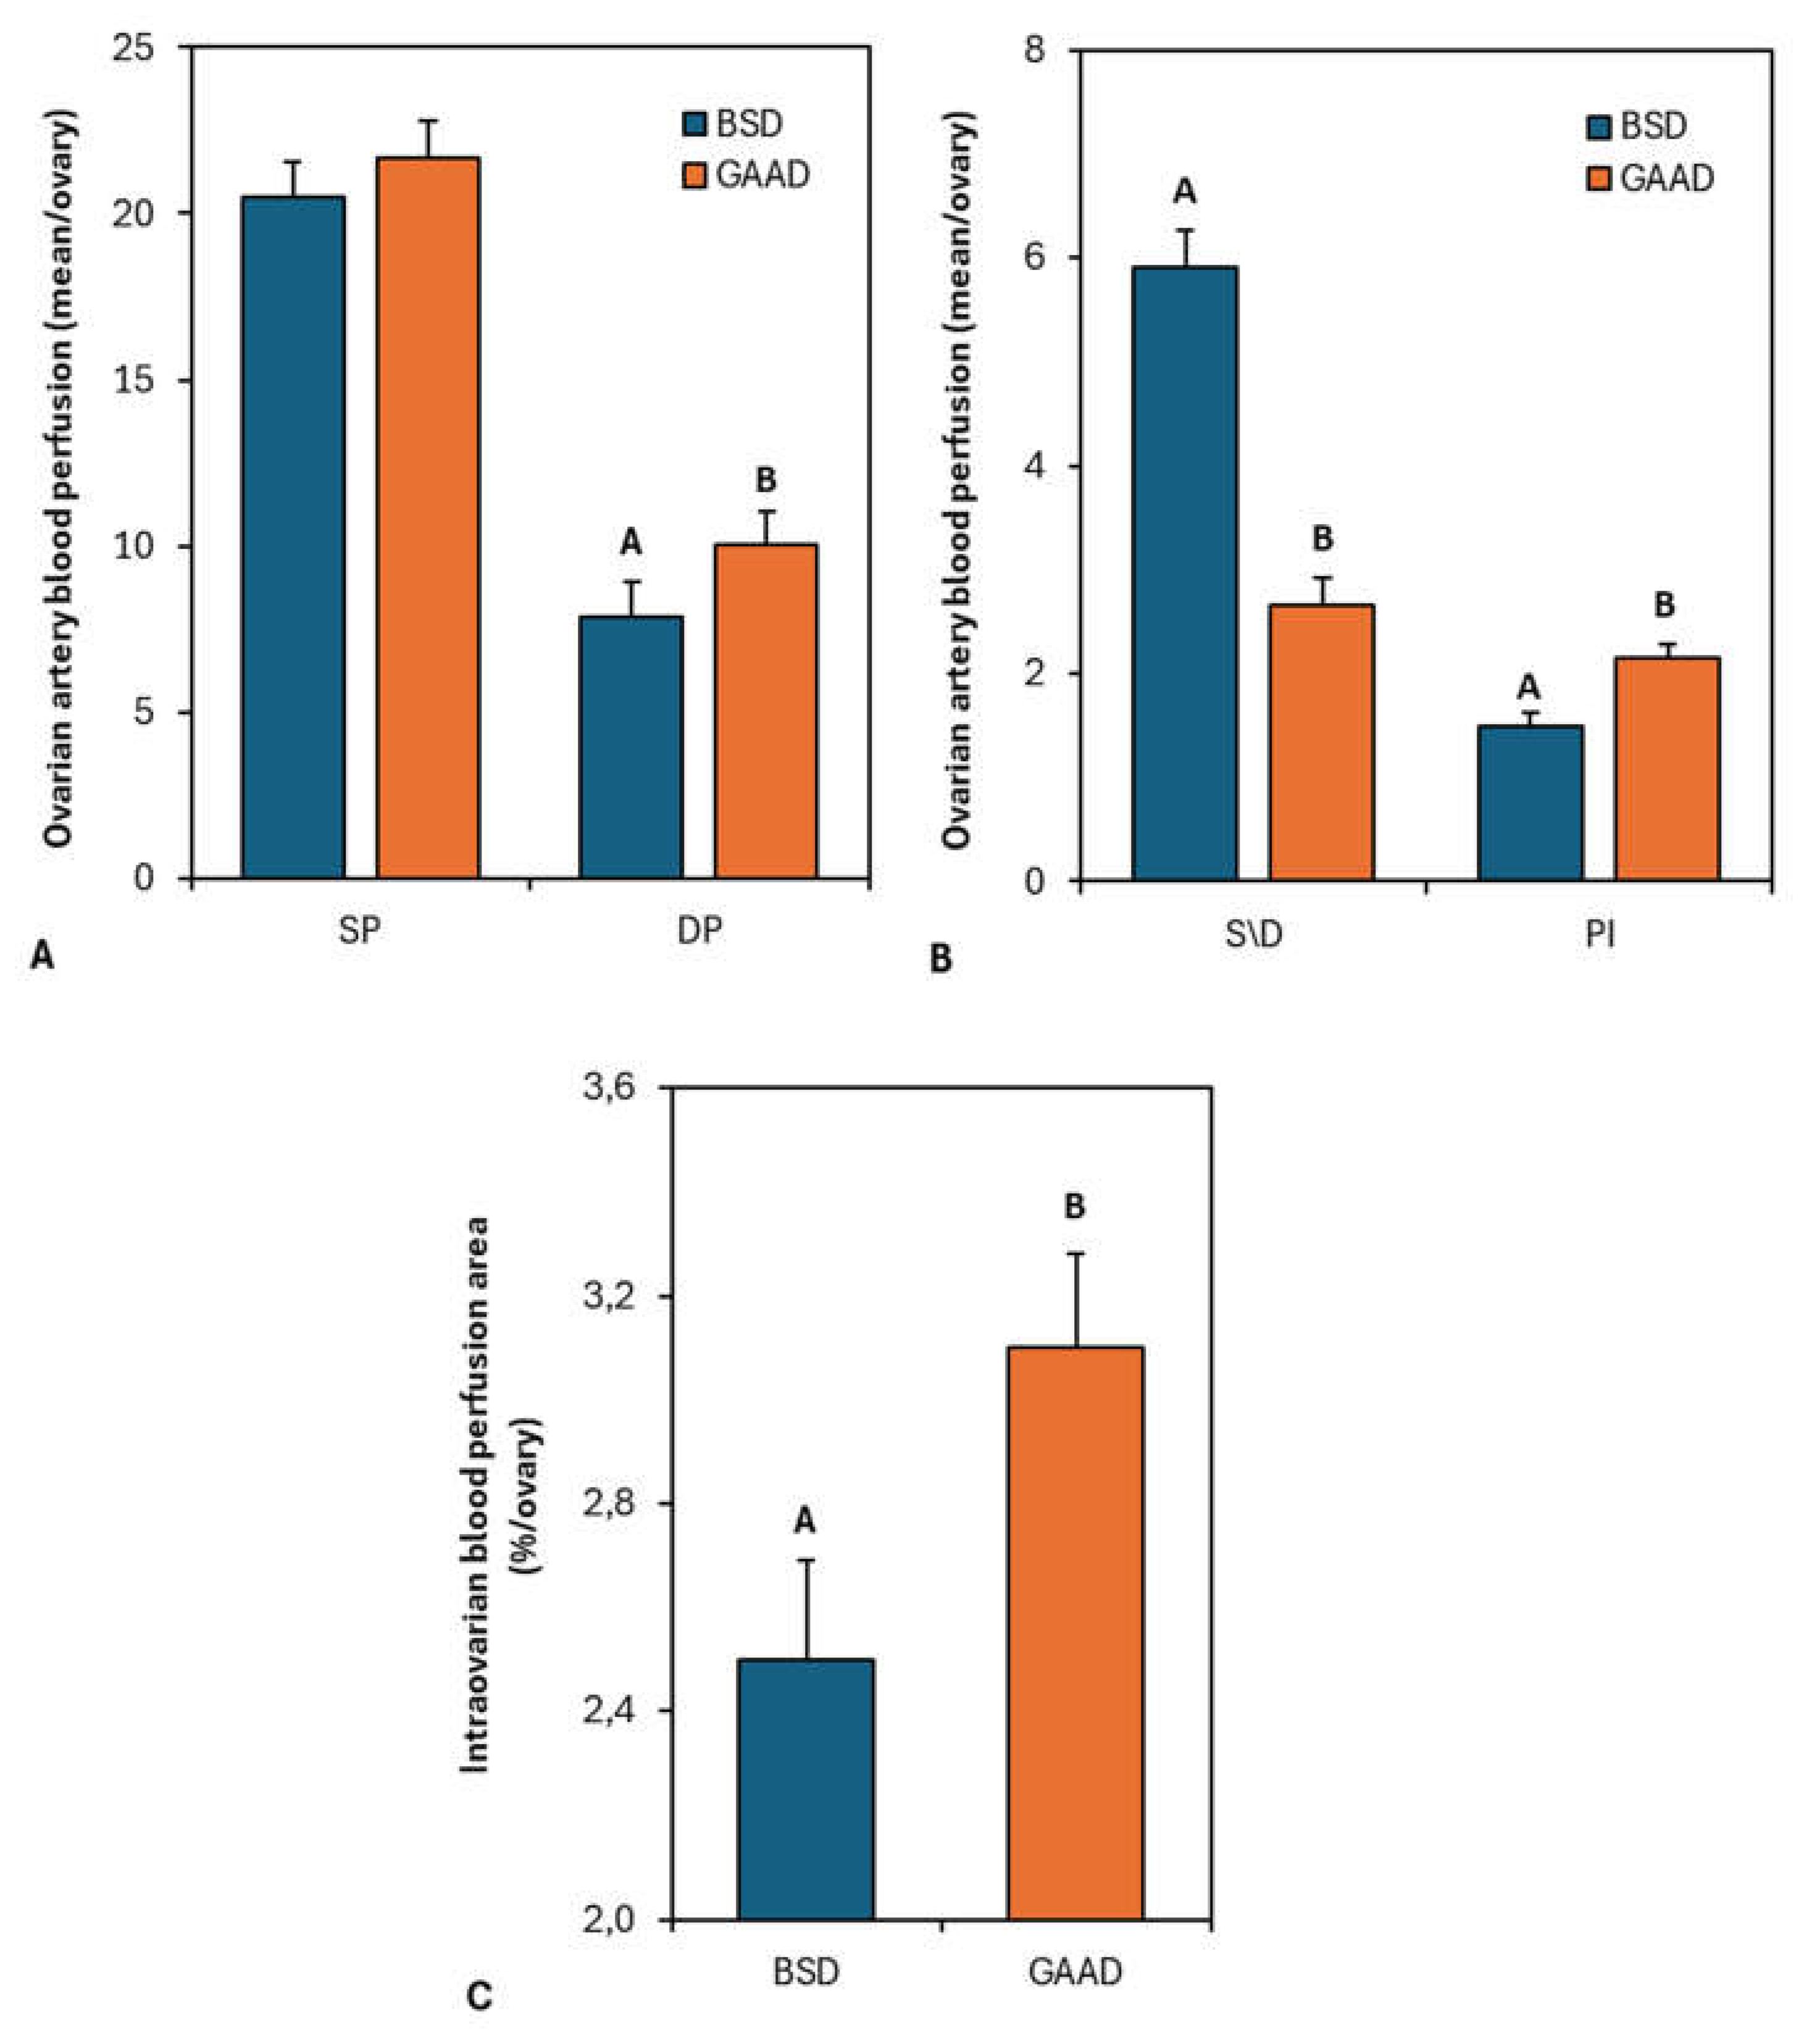
Figure 4.
Number of follicles ≥ 3 mm (Figure 4A) and < 3 mm (Figure 4B), maximum follicular diameter (Figure 4C), and number of follicles > 6 mm (Figure 4D) as measured by ultrasonography over 48 h from prostaglandin application in ewes fed a baseline diet (BSD) or a diet supplemented with guanidine acetic acid (GAAD). Values are represented as means ± SEM. a,b,c P< 0.05 differences between time intervals. A,B P< 0.01 differences between diet-groups for each interval.
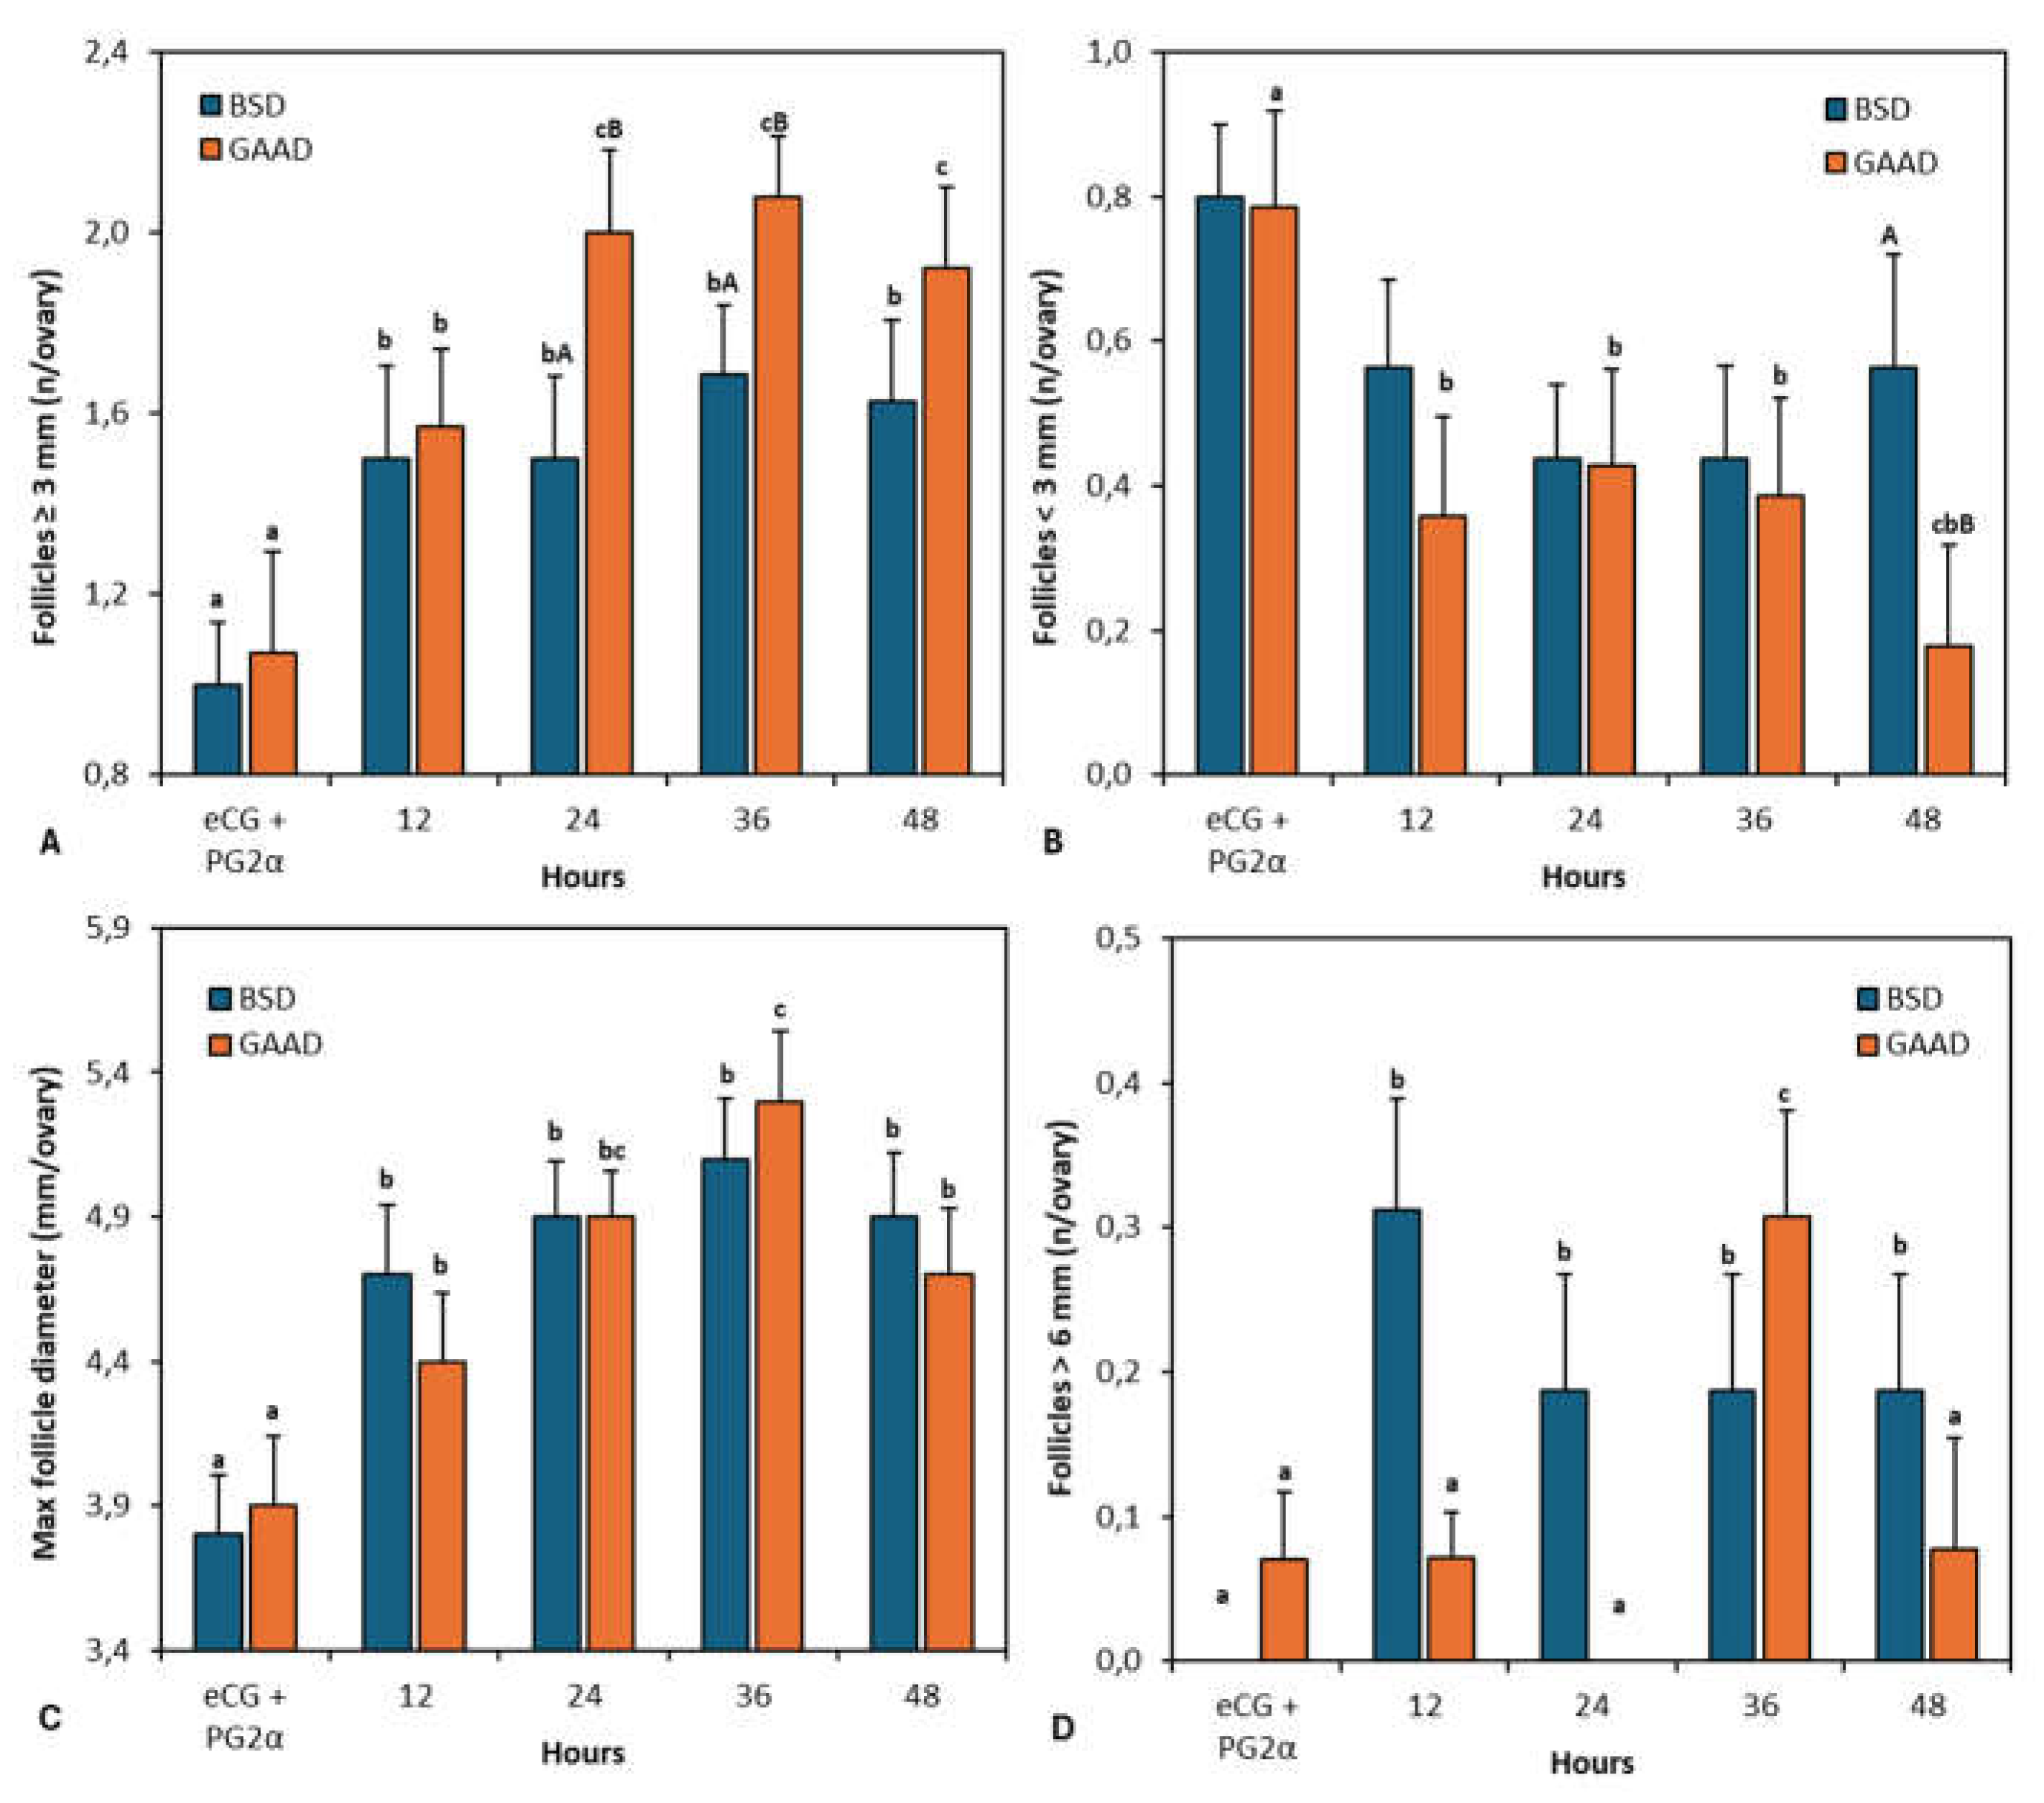

Table 1.
Body mass index, fat loin subcutaneous thickness, kidney fat thickness, loin depth, feed intake and peripheral metabolite levels in ewes fed with baseline diet (BSD) or supply with guanidinoacetic acid (GAAD).
Table 1.
Body mass index, fat loin subcutaneous thickness, kidney fat thickness, loin depth, feed intake and peripheral metabolite levels in ewes fed with baseline diet (BSD) or supply with guanidinoacetic acid (GAAD).
| Parameter | Diet | P-value | ||||
|---|---|---|---|---|---|---|
| BSD | GAAD | SEM | Diet | Time | D x T | |
| Body and carcass marker* | ||||||
| BMI | 10.5 | 9.1 | 0.486 | 0.142 | - | - |
| SLFT, mm | 3.2 | 2.9 | 0.106 | 0.310 | - | - |
| KFT, mm | 1.3 | 1.4 | 0.025 | 0.130 | - | - |
| LD, mm | 23.5 | 22.9 | 0.593 | 0.619 | - | - |
| Feed intake | ||||||
| DMI, kg/ewe | 1.0 | 1.0 | 0.012 | 0.567 | 0.800 | 0.965 |
| DMI, % BW | 2.4 | 2.3 | 0.028 | 0.569 | 0.782 | 0.984 |
| Peripheral metabolic marker | ||||||
| Glucose, mg/dL | 60.0 | 58.4 | 0.554 | 0.146 | 0.224 | 0.562 |
| Cholesterol, mg/dL | 55.2 | 53.1 | 0.909 | 0.321 | 0.904 | 0.312 |
| Triglycerides, mg/dL | 25.5 | 24.0 | 0.823 | 0.132 | 0.128 | 0.336 |
| *Performed at the beginning of the experiment; BW, body weight; BMI, body mass index, SLFT, subcutaneous loin fat thickness; KFT, kidney fat thickness; LD, loin depth; DMI, dry matter intake. Time: ANOVA effect for the assessment interval adopted. | ||||||
Table 2.
Estrus, corpus luteum characteristics, and pregnancy outcome in ewes fed a baseline diet (BSD) or a diet supplemented with guanidine acetic acid (GAAD).
Table 2.
Estrus, corpus luteum characteristics, and pregnancy outcome in ewes fed a baseline diet (BSD) or a diet supplemented with guanidine acetic acid (GAAD).
| Parameter | Diet | P-value | ||||
|---|---|---|---|---|---|---|
| BSD | GAAD | SEM | Diet | Time | D x T | |
| N of ewes in estrus, % (n\n) | 100.0 (10/10) | 100.0 (10/10) | - | - | ||
| Estrus onset *, h | 33.6 | 31.4 | 2.465 | 0.646 | - | - |
| Estrus length, h | 46.4 | 38.5 | 2.893 | 0.180 | - | - |
| CL, n\goat | 1.4 | 1.4 | 0.163 | 0.876 | - | - |
| CL area, mm2 | 8.1 | 7.3 | 0.339 | 0.079 | < 0.001 | 0.546 |
| CL doppler area, mm2/ovary | 1.4 | 1.2 | 0.076 | 0.095 | < 0.001 | 0.905 |
| Pregnancy rate, % (n/n) | 80.0 (8/10) | 70.0 (7/10) | - | 0.879 | - | - |
| Twinning rate, % (n/n) | 25.0 (2/8) | 28.5 (2/7) | - | 0.784 | - | - |
| Litter size, n (n/n) | 1.3 | 1.3 | 0.118 | 0.886 | - | - |
| Pregnancy failure**, % (n/n) | 20.0 (2/10) | 30.0 (3/10) | - | 0.823 | - | - |
| *Interval between progesterone sponge removal and estrus onset; **Gestation failures occurred from mating to pregnancy diagnosis; CL, corpus luteum; Time: ANOVA effect for the assessment interval adopted. | ||||||
Disclaimer/Publisher’s Note: The statements, opinions and data contained in all publications are solely those of the individual author(s) and contributor(s) and not of MDPI and/or the editor(s). MDPI and/or the editor(s) disclaim responsibility for any injury to people or property resulting from any ideas, methods, instructions or products referred to in the content. |
© 2024 by the authors. Licensee MDPI, Basel, Switzerland. This article is an open access article distributed under the terms and conditions of the Creative Commons Attribution (CC BY) license (http://creativecommons.org/licenses/by/4.0/).
Copyright: This open access article is published under a Creative Commons CC BY 4.0 license, which permit the free download, distribution, and reuse, provided that the author and preprint are cited in any reuse.


