
Submitted:
15 November 2024
Posted:
19 November 2024
You are already at the latest version
Abstract
This study addresses the pressing need for standardized methodologies to quantify microplastics within the fine fraction of municipal solid waste (MSW), often overlooked despite its potential en-vironmental impact. Five extraction protocols were evaluated to identify the most effective method for isolating microplastics in fine waste. These were specifically applied to samples from the Uni-versidad Autónoma Metropolitana and one transfer station in Mexico City. A potassium hydroxide digestion protocol with subsequent flotation and centrifugation steps achieved optimal results, ensuring complete organic matter degradation and high microplastic recovery. Subsequent analyses revealed notable concentrations of microplastics, primarily fragments and fibers, with higher abundance at the university site. Statistical tests confirmed significant differences between sample sites. These findings highlight the vulnerability of MSW fine fractions to microplastic contamination and underline the importance of targeted waste management strategies. This research contributes to understanding microplastic behavior in waste management systems and emphasizes the need for mitigation efforts to prevent environmental contamination.
Keywords:
collection center
; fragments
; dust
; plastics
; small waste
1. Introduction
Plastic pollution, a global crisis of the 21st century, is a staggering reality. With over 400 million tons of plastic produced annually, a substantial portion finds its way into the environment, impacting the equilibrium of terrestrial and aquatic ecosystems [1,2,3,4]. Among the various types of plastic pollution, microplastics, defined as plastic particles smaller than 5 mm, are a mounting concern due to their widespread presence and potential to infiltrate the food chain [5,6,7]. These tiny plastic particles are the result of the breakdown of larger plastic products and the direct release of microparticles, such as those found in cosmetics and cleaning products [8,9,10].
Municipal solid waste (MSW) management worldwide faces significant challenges in relation to plastic waste. Plastics are estimated to represent between 10 and 12% of the total composition of MSW, varying by region [11,12]. Among the most common types of plastic waste are low- and high-density polyethylene (used in bags and wrappers), polypropylene (in containers and caps), polyethylene terephthalate (common in bottles) and expanded polystyrene (in food packaging and containers). These materials, due to their low biodegradability, can persist for centuries in landfills and ecosystems, contributing to increased environmental pollution [13,14,15].
A critical fraction within MSW is the so-called fine fraction, a subset of waste that is defined primarily by the size of its particles, which are usually smaller than 20 mm, although some studies consider even smaller sizes, such as 10 mm or 5 mm. This fraction includes a mixture of organic, inorganic and contaminant materials that are not easily segregated in conventional separation processes. In some cases, it contains a high concentration of microplastics, metal fragments, artificial minerals and other fine waste that are difficult to recycle or manage [9,16,17,18]. Although traditionally considered harmless, this fraction can contain a high concentration of microplastics and other contaminants [17]. A notable aspect of the fine fraction is its potential contamination, as it can accumulate heavy metals, microplastics and other toxic elements [9]. Furthermore, it is often a problematic fraction in waste management systems, as its size means it cannot be easily processed in traditional facilities, resulting in its disposal in landfills [16]. However, some studies have proposed its possible reuse, for example, as filling material in construction sites, although this use is still in the experimental phase and requires further research to assess environmental risks [9,18].
Studies conducted in Mexico and other regions of the world have revealed that the fine fraction can account for up to 5% of total MSW and is often disposed of in landfills without proper treatment [19]. This practice poses a significant risk, as the accumulation of microplastics in landfills can lead to the contamination of nearby soils, and water bodies [16,18,20].
In countries like Mexico, where waste management is still facing significant challenges, the lack of specific management for fine waste underscores the urgent need for more in-depth research and the development of effective mitigation strategies [21]. This work, therefore, aimed to establish a methodology for analyzing microplastic contamination in fine fraction from urban solid waste, which was applied to waste produced in the Universidad Autónoma Metropolitana campus (UAM-A), and that received at the Transfer station and segregation plant, both located in Azcapotzalco, in Mexico City (TESPA).
2. Materials and Methods
This section describes the methodology of the five protocols tested for the extraction of microplastics and the selection of the best one for its application in samples from the UAM-A and the TESPA.
2.1. Contamination Prevention
Throughout the development of the methodology, various measures were implemented to avoid cross-contamination by plastic particles present in the air. These measures included wearing cotton clothing and a gown; using glass and metal materials and utensils; washing and drying the material in an oven before use; cleaning the work area, before use, with absorbent paper and alcohol; using blanks during sample processing; using lighters during the extraction process to burn MP found in the surrounding air; and performing part of the processing in a laminar flow hood [22,23].
2.2. Description of Five Protocols for Microplastics Extraction
Five protocols, selected from studies published in the ScienceDirect database, were tested to develop the methodology. These protocols addressed the analysis of microplastics in which the digestion of organic matter was implicit. Before testing the five protocols on waste samples, virgin microplastics were put in contact with the oxidizing reagents to evaluate whether they damaged the particles and, from there, decide which ones were worth continuing to work with. The added MP were five pieces of each of the following types: polyethylene terephthalate (PET) from beverage bottles, high-density polyethylene (HDPE) obtained from yogurt bottles, polyvinyl chloride (PVC) manufactured from medicine blisters, low-density polyethylene (LDPE) obtained from carrier bags, and expanded polystyrene balls (EPS) purchased at a stationery store.
Since virgin MP did not present alterations in any of the cases, the testing of all protocols was applied to a sample of urban solid waste obtained from the TESPA in October 2021. In addition, the same quantity and types of virgin MP were added as in the previous step. The objective of this stage was to evaluate the behavior of the different oxidizing reagents and the digestion conditions in the presence of the sample and the MP. Table 1 shows the conditions applied to each of the tested protocols.
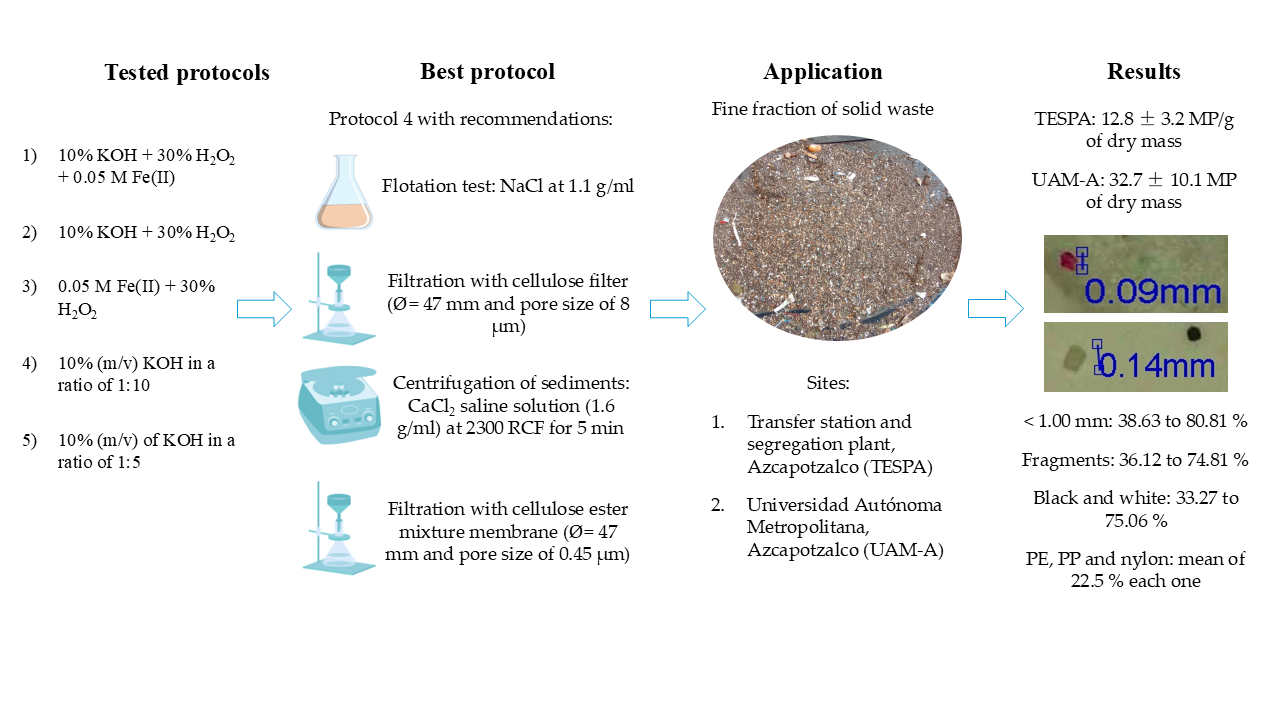
After all the protocols were tested, the best one was chosen. Assessment parameters were: a) the organic matter was completely or mostly digested; b) the sample was not thick and could be filtered without complications; c) the process to digest the samples was safe and did not cause accidents; d) the filters with MP were more accessible to observe under the microscope, that is, they did not have a high content of organic matter that would prevent the microplastics from being seen; e) the virgin microplastics had not suffered damage (color change or cracks); and f) their recovery percentage was greater than 90%. Of all the protocols, the best was protocol 4, which, after the results, was adjusted by the addition of flotation tests with NaCl saline solution (1.1 g/ml) and the centrifugation of the sediment, coming from flotation tests, with CaCl2 saline solution (1.6 g/ml) at a higher speed, that is, at 2300 RCF for 5 min to ensure correct sedimentation when the organic matter load is higher and finally after centrifugation, filtration with Millipore system with cellulose ester mixture membrane (Ø= 47 mm and pore size of 0.45 μm)
2.3. Application of the Best Protocol
This section describes the study sites from which samples of thin waste originating from urban solid waste were obtained to be analyzed using the best protocol.
2.3.1. Study Sites
The first site is the Universidad Autónoma Metropolitana, Azcapotzalco Unit (UAM-A), located in the northern area of Mexico City. Since October 31, 2003, it has implemented the Solid Waste Management Program, titled "Separacción por un mejor UAMbiente" [37]. Every year, at least three studies are conducted on the generation and composition of the solid waste produced by UAM A. The average waste generation between 2004 and 2007 was 1,430 kg/day. From 2008 to 2022, the generation decreased to 782.7 kg/day 2008 and fluctuated between 612.9 kg/day and 832.1 kg/day, except in 2014, when it increased to 961 kg/day. In 2022, it dropped to 505.4 kg/day. Of all the waste generated at the UAM, mixed plastics predominate, with 23%, then sanitary waste and paper, with 20%, and fine fraction, with 5%. On the other hand, recoverable waste such as aluminum cans accounted for 1.17%, glass 4% and textiles 2%; these represent the lowest proportion of waste generated [38].
The second site was the TESPA, which performs mechanical separation by waste type, organic and inorganic, as well as by size. Plastics, PET, aluminum, containers, among others are recovered in a system of conveyor belts by manual sorting [39]. The TESPA is equipped with technology, such as automatic sprayers that capture odor particles during operational hours, a misting system that applies bactericide and fragrance, and roofs designed to prevent waste dispersion and with soundproofing to reduce noise propagation [39,40]. TESPA has a reception capacity of 1,400 tons of solid waste daily and a daily processing capacity of 1,000 tons from the Azcapotzalco, Cuauhtémoc, Gustavo A. Madero, and Miguel Hidalgo boroughs [39,40].
2.3.2. Obtaining Samples of Thin Waste
On 10 August 2023, two pre-samples of USW were obtained from the TESPA as follows: waste from 10 collection trucks from different origins randomly selected was stored in 200 L containers, one for each truck. Each pre-sample was obtained later, mixing five containers' content. For UAM-A, USW samples were obtained from the generation study developed in April 2024, according to the national standard NMX-AA-61-1985 [41]. The mass of the pre-samples was 208.2 kg, 231.7 kg (TESPA), 576.900 kg and 633.700 kg (UAM-A). The quartering method was applied for each pre-sample, based on the NMX-AA-15-1985 standard [42]. On a flat surface of 4 m x 4 m, the USW from each pre-sample was poured and homogenized with shovels, and then the mound of USW was divided into four equal quadrants to eliminate opposing parts. This process was repeated with the quadrants not removed until representative samples of 30 kg were obtained.
Each representative sample obtained from the quartering method was placed on a table, and the USW was separated and classified into different categories using an adaptation of the Mexican standard NMX-AA-22-1985 [43]. The waste classification comprised nine categories, including 21 secondary types of waste (Table 2).
Each by-product was placed in a pre-labeled polyethylene bag; the most considerable waste was stored first, and then the remaining fragmented waste was passed through a sieve with a 5 mm mesh opening to obtain the fine fraction of USW. Each by-product was weighed, and the percentage in terms of mass was obtained by dividing its mass by the total mass of the sample using the following Equation (1):
where:
Pp = Mass proportion of the specific waste.
M1 = Mass of the type of waste, in kg, minus the weight of the used bag.
M = Total mass of the sample, in kg.
Finally, the fine fraction of the USW was transported to the laboratory and stored in a refrigerator at 3 °C until its analysis.
2.3.3. Extraction of Microplastics
The extraction of MP from the fine fraction samples obtained in the classification of by-products was carried out in the laboratory using protocol 4 which allows to extract and observe microplastics from 0.03 to 5.00 mm. Five replicates of 10 g on a wet basis were analyzed for each of the four fine residue samples. All replicates, contained in aluminum trays, were oven-dried at 100°C for 24 h to remove the moisture and obtain the dry mass.
Subsequently, 100 ml of 10% potassium hydroxide (KOH) solution was added to each replicate of fine residues to degrade organic matter; this mixture was stirred with a clean, dry glass rod. The samples were covered with aluminum foil and incubated at 40 °C to 50 °C for 72 h. After this time, 300 ml of sodium chloride (NaCl) solution with a density of 1.1 g/ml was added to each sample, stirred for 5 minutes and allowed to stand for 24 h to 96 h. The supernatant was vacuum filtered on 8 µm pore size filter paper, and the filters with sample were stored in glass Petri dishes at room temperature. To the sediment remaining after filtration, 40 ml to 70 ml of calcium chloride solution (CaCl2) with a density of 1.6 g/ml was added and centrifuged at 2,300 revolutions per minute (rpm) for 5 minutes; the supernatant obtained was vacuum filtered on cellulose ester blend membranes with a pore size of 0.45 µm. The membranes were stored in glass Petri dishes at room temperature.
2.3.4. Microplastics Classification and Statistical Analysis
Subsequently, all filter paper samples and cellulose ester blend membranes were observed under a digital microscope at 1,200 magnifications; the number of microplastics present in each sample was counted and classified by shape (fragments, films, foams and fibers), size and color. The type of polymer was analyzed with FTIR (Agilent, Cary 630).
A statistical analysis of the concentrations of microplastics found in the fine residues of each of the four samples for dry mass was carried out using Statgraphics Centurion XV, Version 15.2.06. First, a normality test was run using the Shapiro-Wilk method to see how the data behaved, that is, whether the data had a normal distribution. Since the data had a non-normal distribution, the non-parametric Kruskal-Wallis test was chosen to analyze whether there were statistically significant differences in the concentrations of microplastics in the fine residues of the different samples analyzed.
3. Results
This section shows the relevant results of this research.
3.1. Evaluation of Five Protocols
After the five protocols were implemented, observations were made for each one, which allowed the best one to be selected for application in samples of thin waste from the TESPA and the UAM-A. The relevant findings of each protocol are summarized in Table 3.
The results showed that the best protocol was number 4 since its recovery percentage of virgin MP was 100%, and there was good degradation of organic matter. This level of degradation, in turn, allowed that, after filtering the samples, the MP contained in the filters were clearly observed, and an easy count and classification of the MP present in the fine fraction sample could be made.
3.2. Classification of Urban Solid Waste
Figure 1 shows the composition of urban solid waste in the two study sites. It can be observed that the categories that, on average, presented the highest percentage were organic (48.82%), plastics (19.57%) and paper and cardboard (13.90%). Regarding the fine fraction, this, on average, had a percentage of 1.35% (TESPA 1, 1.76%; TESPA 2, 1.04%; UAM-A 1, 1.17%; UAM-A 2, 1.44%).
3.3. Abundance, Characteristics and Statistial Analysys of Microplastics in Fine Fraction
The abundances of microplastics were 10.4 – 36.9 #MP/dry mass, with the sample from UAM-A 2 having the highest value and the sample obtained from TESPA 2 having the lowest value (Table 4).
Figure 2 shows the box and whisker diagram for the abundance of microplastics in the four samples. This could be related to the percentage of macroplastics, as samples from UAM-A had a higher mass proportion of plastics (22.92 and 22.89 % for UAM-A 1 and UAM-A 2, respectively), compared to those obtained from TESPA (15.00 and 17.46%).
The UAM presented the highest concentrations of microplastics with a median value of 33.1, 2.7 times higher than the TESPA samples (Table 5).
Figure 3 shows the box and whisker diagram of the abundance of microplastics in the samples, showing that the highest concentration of MP was at UAM-A.
Regarding the characteristics of microplastics, Figure 4 shows the classifications by size, type, color and polymer. For size, the microplastics studied ranged from 0.03 to 5.00 mm; the most common were those smaller than 1.0 mm, with percentages ranging from 38.63 to 80.81 %. At the same time, the lowest values were in the range of 3.1 - 4.0 and 4.1 – 5.0 mm (Figure 4a). For shape, fragments were the most abundant microplastics, with percentages ranging from 36.12 to 74.81 % , followed by fibers with 10.81 to 40.75 % (Figure 4b). Regarding the color of microplastics, there is no trend toward a specific color; together, black and white represented high values between 33.27 and 75.06 % (Figure 4c). Finally, the three most common polymers were PE, PP and nylon, with mean of 22.5 % each one.
Figure 5 shows some examples of microplastics found in the fine fraction of urban solid waste from TESPA 1.
On the other hand, Figure 6 illustrates some microplastics found in TESPA 2, UAM-A 1 and UAM-A 2.
4. Discussion
The analysis of waste composition is crucial for developing effective waste management infrastructure and valorization strategies. However, the lack of standardized methods for sampling, analysis, and classification, particularly for the fine fraction of municipal solid waste (MSW), poses a significant challenge. This fraction, variably defined as particles < 10 mm or < 5 mm [44] and sometimes limited to specific components like sand, ash, dust, and street sweepings [45,46,47,48], hinders comparative analyses across studies. Table 6 illustrates this variability, with reported fine fraction proportions ranging from 0.2% to 15.27% by weight, depending on the region, waste category, and definition employed.
While research on the fine fraction has predominantly focused on legacy waste in landfills for mining purposes [19,49,50,51], or on specific inputs/outputs of treatment processes [52,53], there is limited information on its composition in collected MSW or at transfer stations. Understanding this fraction in the early stages of waste management is crucial for improving waste characterization, enabling a more accurate assessment of the overall waste stream composition. Furthermore, it facilitates predicting waste behavior in different scenarios, including landfilling, biological and thermal treatment. This understanding also aids in developing improved material separation techniques for enhanced resource recovery and identification of valuable resources.
Analyzing microplastics in the fine fraction presents challenges due to its heterogeneity, influenced by waste composition, management practices, and the presence of organic matter, requiring careful removal to avoid underestimation of microplastic content. Although standardized methods for microplastic analysis in MSW are lacking, this research employed a sequence of sieving, digestion, density separation, filtration, and visual and/or chemical analysis, similar to approaches used in other studies [54]. This methodology proved effective in extracting, measuring, and classifying microplastics within the 0.03 to 5.00 mm size range, providing clear evidence of this emerging pollutant in the fine fraction of MSW.
This study investigated the presence of microplastics within the fine fraction of MSW, an area of growing concern due to the potential for environmental contamination and human health risks. Fibers and rigid fragments constituted over 70% of the identified microplastics, highlighting their contribution to microplastic contamination in the waste stream. The detected microplastic quantities (10-37 items/g of dry mass), when extrapolated to the daily waste generation [48], could amount to an estimated 27 thousand to 100 thousand million microplastic items in the fine fraction generated in Mexico. The predominance of microplastics smaller than 1 mm (80%) indicates a high propensity for these particles to leak from waste management systems and become incorporated into environmental matrices, such as agricultural soil [55,56].
This study highlights the need for standardized methodologies to characterize the fine fraction, including microplastic analysis. It also emphasizes the importance of future research to investigate the fate and transport of microplastics in waste management systems and the environment. Finally, it points to the necessity of mitigation strategies to reduce microplastic contamination in the waste stream and prevent their release into the environment. By addressing these needs, waste management systems can move towards greater sustainability and minimize the environmental and health impacts of microplastic pollution.
5. Conclusions
The findings of this research identified an efficient methodology for extracting microplastics from the fine fraction of municipal solid waste, establishing a process that minimizes particle loss and ensures complete organic matter degradation. The selected protocol is not only replicable and safe but also provides a high recovery rate of microplastics, which is essential for research in waste management and emerging contaminant monitoring. This methodological advance could serve as a foundation for future standards and standardized procedures in microplastic analysis in residual fractions.
The significant presence of microplastics in the fine fraction of municipal solid waste suggests that current waste management systems should address these contaminants, which, though not visible to the naked eye, pose a latent threat to the environment. The high concentrations found at the university site, compared to the transfer stations, highlight the influence of local consumption patterns and waste handling types. Waste management programs must include specific mitigation strategies for this fraction, especially in urban contexts with high waste generation.
This study emphasizes the urgency of developing more stringent and specific control policies for microplastics in solid waste. The information obtained on the quantity, characteristics, and diversity of microplastics in the fine fraction opens new research possibilities on their behavior and persistence in waste management systems and their eventual impact on soil and water. Future studies should explore not only the mechanisms of microplastic release into the environment but also the implementation of technologies that facilitate their separation and treatment, promoting a transition to more sustainable and less polluting waste management practices.
Author Contributions
Conceptualization, J.C.A.-Z., A.A.C.-S. and A.V.-M.; methodology, R.M.E.-V., K.P.A.-E. and A.A.C.-S.; formal analysis, J.C.A.-Z. and K.P.A.-E.; investigation, P.X.S.-N. and A.V.-M.; resources, K.Y.-M.-P. and K.P.A.-E.; data curation, J.C.A.-Z., K.P.A.-E. and K.Y.M.-P.; writing—original draft preparation, P.X.S.-N, J.C.A.-Z., R.M.E.-V., K.P.A.-E., A.V.-M. and A.A.C.-S.; writing—review and editing, A.V.-M., P.X.S.-N. and A.A.C.-S.; project administration, A.V.-M. All authors have read and agreed to the published version of the manuscript.
Funding
This research received no external funding.
Institutional Review Board Statement
Not applicable.
Informed Consent Statement
Not applicable.
Data Availability Statement
Not applicable.
Acknowledgments
The authors thank to Transfer station and segregation plant Azcapotzalco and Collection Center of the Universidad Autónoma Metropolitana, Azcapotzalco Unit for the support provided to this research.
Conflicts of Interest
The authors declare no conflicts of interest.
References
- Y. Chae and Y. J. An, “Current research trends on plastic pollution and ecological impacts on the soil ecosystem: A review. Environ. Pollut. 2018, 240, 387–395. [Google Scholar] [CrossRef] [PubMed]
- S. B. Borrelle et al., “Predicted growth in plastic waste exceeds efforts to mitigate plastic pollution. Science 2020, 369, 1515–1518. [Google Scholar] [CrossRef] [PubMed]
- R. Geyer, J. R. Jambeck, and K. L. Law, “Production, use, and fate of all plastics ever made. Sci. Adv. 2017, 3, 1–5. [Google Scholar] [CrossRef]
- Binelli, *!!! REPLACE !!!*; et al. , “Hazard evaluation of plastic mixtures from four Italian subalpine great lakes on the basis of laboratory exposures of zebra mussels. Sci. Total Environ. 2020, 699, 134366. [Google Scholar] [CrossRef] [PubMed]
- G. Avio et al., “Distribution and characterization of microplastic particles and textile microfibers in Adriatic food webs: General insights for biomonitoring strategies. Environ. Pollut. 2020, 258, 113766. [Google Scholar] [CrossRef] [PubMed]
- L. Andrady, “Microplastics in the marine environment. Marine Pollution Bulletin 2011, 62, 1596–1605. [Google Scholar] [CrossRef]
- N. U. Benson, O. D. Agboola, O. H. Fred-Ahmadu, G. E. De-la-Torre, A. Oluwalana, and A. B. Williams, “Micro(nano)plastics Prevalence, Food Web Interactions, and Toxicity Assessment in Aquatic Organisms: A Review. Front. Mar. Sci. 2022, 9, 851281. [Google Scholar]
- S. M. Bashir, S. Kimiko, C. W. Mak, J. K. H. Fang, and D. Gonçalves, “Personal Care and Cosmetic Products as a Potential Source of Environmental Contamination by Microplastics in a Densely Populated Asian City. Front. Mar. Sci. 2021, 8, 683482. [Google Scholar]
- P. Rawat and S. Mohanty, “Potential Use of Fine Fraction of Municipal Solid Waste as Replacement of Soil in Embankment. in Soil Dynamics, Earthquake and Computational Geotechnical Engineering, vol. 300, K. Muthukkumaran, R. Ayothiraman, and S. Kolathayar, Eds. Singapore: Springer Nature Singapore, 2023, pp. 183–192.
- Amobonye, P. Bhagwat, S. Raveendran, S. Singh, and S. Pillai, “Environmental Impacts of Microplastics and Nanoplastics: A Current Overview. Front. Microbiol. 2021, 12, 768297. [Google Scholar] [CrossRef]
- S. Kaza, L. S. Kaza, L. Yao, P. Bhada-Tata, and F. Van Woerden, “What a Waste 2.0. A global snapshot of solid waste management to 2050. Washington, DC, 2018. Accessed: Oct. 09, 2019. [Online]. Available online: http://datatopics.worldbank.org/what-a-waste/tackling_increasing_plastic_waste.html.
- M. Yatoo et al., “Global perspective of municipal solid waste and landfill leachate: generation, composition, eco-toxicity, and sustainable management strategies. Environ. Sci. Pollut. Res. 2024, 31, 23363–23392. [Google Scholar] [CrossRef]
- N. Mohanan, Z. Montazer, P. K. Sharma, and D. B. Levin, “Microbial and Enzymatic Degradation of Synthetic Plastics. Front. Microbiol. 2020, 11, 580709. [Google Scholar]
- Peydaei, H. Bagheri, L. Gurevich, N. de Jonge, and J. L. Nielsen, “Impact of polyethylene on salivary glands proteome in Galleria melonella. Comp. Biochem. Physiol. Part D Genomics Proteomics 2020, 34, 100678. [Google Scholar] [CrossRef] [PubMed]
- J. Hopewell, R. Dvorak, and E. Kosior, “Plastics recycling: challenges and opportunities. Philos. Trans. R. Soc. Lond. B. Biol. Sci. 2009, 364, 2115–26. [Google Scholar] [CrossRef] [PubMed]
- P. Rawat and S. Mohanty, “Parametric Study on Dynamic Characterization of Municipal Solid Waste Fine Fractions for Geotechnical Purpose. J. Hazardous, Toxic, Radioact. Waste 2022, 26, 04021047. [Google Scholar] [CrossRef]
- J. Palovčík, J. Jadrný, V. Smejkalová, B. Šmírová, and R. Šomplák, “Evaluation of properties and composition of the mixed municipal waste fine fraction, the case study of Czech Republic. J. Mater. Cycles Waste Manag. 2023, 25, 550–564. [Google Scholar] [CrossRef]
- J. C. Hernández Parrodi, D. Höllen, and R. Pomberger, “Characterization of fine fractions from landfill mining: A review of previous investigations. Detritus 2018, 2, 46. [Google Scholar] [CrossRef]
- M. Somani, M. Datta, G. V. Ramana, and T. R. Sreekrishnan, “Investigations on fine fraction of aged municipal solid waste recovered through landfill mining: Case study of three dumpsites from India. Waste Manag. Res. 2018, 36, 744–755. [Google Scholar] [CrossRef]
- D. Gyabaah, E. Awuah, P. Antwi-Agyei, and R. A. Kuffour, “Physicochemical properties and heavy metals distribution of waste fine particles and soil around urban and peri-urban dumpsites. Environ. Challenges 2023, 13, 100785. [Google Scholar] [CrossRef]
- SEMARNAT – Secretaría de Medio Ambiente y Recursos Naturales, “Informe de la situación del medio ambiente en México. 2015. [Online]. Available online: https://apps1.semarnat.gob.mx:8443/dgeia/informe15/tema/pdf/Informe15_completo.pdf.
- Cruz-Salas, *!!! REPLACE !!!*; et al. , “Measures to prevent cross-contamination in the analysis of microplastics: A short literature review. Rev. Int. Contam. Ambient. 2023, 39, 241–256. [Google Scholar] [CrossRef]
- A. Cruz-Salas et al., “Presence of Microplastics in the Vaquita Marina Protection Zone in Baja California, Mexico. Microplastics 2023, 2, 422–436. [Google Scholar] [CrossRef]
- M. B. Alfonso, K. Takashima, S. Yamaguchi, M. Tanaka, and A. Isobe, “Microplastics on plankton samples: Multiple digestion techniques assessment based on weight, size, and FTIR spectroscopy analyses. Mar. Pollut. Bull. 2021, 173, 113027. [Google Scholar] [CrossRef] [PubMed]
- T. Wang et al., “Coastal zone use influences the spatial distribution of microplastics in Hangzhou Bay, China. Environ. Pollut. 2020, 266, 115137. [Google Scholar] [CrossRef] [PubMed]
- J. Teng et al., “A systems analysis of microplastic pollution in Laizhou Bay, China. Sci. Total Environ. 2020, 745, 140815. [Google Scholar] [CrossRef]
- S. M. A. Rahman, G. S. Robin, M. Momotaj, J. Uddin, and M. A. M. Siddique, “Occurrence and spatial distribution of microplastics in beach sediments of Cox’s Bazar, Bangladesh. Mar. Pollut. Bull. 2020, 160, 111587. [Google Scholar] [CrossRef] [PubMed]
- M. Ferreira, J. Thompson, A. Paris, D. Rohindra, and C. Rico, “Presence of microplastics in water, sediments and fish species in an urban coastal environment of Fiji, a Pacific small island developing state. Mar. Pollut. Bull. 2020, 153, 110991. [Google Scholar] [CrossRef] [PubMed]
- R. A. Littman et al., “Coastal urbanization influences human pathogens and microdebris contamination in seafood. Sci. Total Environ. 2020, 736, 139081. [Google Scholar] [CrossRef]
- Keisling, R. D. Harris, J. Blaze, J. Coffin, and J. E. Byers, “Low concentrations and low spatial variability of marine microplastics in oysters (Crassostrea virginica) in a rural Georgia estuary. Mar. Pollut. Bull. 2020, 150, 110672. [Google Scholar] [CrossRef]
- M. Narmatha Sathish, K. Immaculate Jeyasanta, and J. Patterson, “Monitoring of microplastics in the clam Donax cuneatus and its habitat in Tuticorin coast of Gulf of Mannar (GoM), India. Environ. Pollut. 2020, 266, 115219. [Google Scholar] [CrossRef]
- M. Kazour and R. Amara, “Is blue mussel caging an efficient method for monitoring environmental microplastics pollution? Sci. Total Environ. 2020, 710, 135649. [Google Scholar] [CrossRef]
- P. Goswami, N. V. Vinithkumar, and G. Dharani, “First evidence of microplastics bioaccumulation by marine organisms in the Port Blair Bay, Andaman Islands. Mar. Pollut. Bull. 2020, 155, 111163. [Google Scholar] [CrossRef]
- R. S. Robin et al., “Holistic assessment of microplastics in various coastal environmental matrices, southwest coast of India. Sci. Total Environ. 2020, 703, 134947. [Google Scholar] [CrossRef] [PubMed]
- S. Zheng et al., “Characteristics of microplastics ingested by zooplankton from the Bohai Sea, China. Sci. Total Environ. 2020, 713, 136357. [Google Scholar] [CrossRef] [PubMed]
- M. N. Sathish, I. Jeyasanta, and J. Patterson, “Occurrence of microplastics in epipelagic and mesopelagic fishes from Tuticorin, Southeast coast of India. Sci. Total Environ. 2020, 720, 137614. [Google Scholar] [CrossRef]
- R. M. Espinosa-Valdemar, B. A. García-García, R. C. Vázquez-Solís, A. de la L. Cisneros-Ramos, A. Vázquez-Morillas, and M. Velasco-Pérez, “Waste generation and composition in a mexican public university. Am. J. Environ. Eng. 2013, 3, 297–300. [Google Scholar]
- J. Navarrete-Contreras, “Análisis de la composición y eficiencia de separación de los residuos sólidos urbanos de la Universidad Autónoma Metropolitana Unidad Azcapotzalco. Universidad Autónoma Metropolitana, unidad Azcapotzalco, 2024.
- SOBSE - Secretaría de Obras y Servicios de la Ciudad de México, “Estación de transferencia y planta de selección Azcapotzalco.” [Online]. Available online: https://www.obras.cdmx.gob.mx/storage/app/media/00025 julio planta/250721estacion-de-transferencia-y-planta-de-seleccion-azcvf-4.pdf.
- Gobierno de la Ciudad de México, “Estación de Transferencia y Planta de Selección Azcapotzalco, la más moderna de América Latina: Sheinbaum Pardo. 2021. Available online: https://www.jefaturadegobierno.cdmx.gob.mx/comunicacion/nota/estacion-de-transferencia-y-planta-de-seleccion-azcapotzalco-la-mas-moderna-de-america-latina-sheinbaum-pardo (accessed on 13 October 2024).
- SECOFI - Secretaría de Comercio y Fomento Industrial, “Norma Mexicana NMX-AA-61-1985, Protección al Ambienten - Contaminación Del Suelo - Residuos Sólidos Municipales - Determinación de la Generación.” 1985.
- SECOFI - Secretaría de Comercio y Fomento Industrial, “Norma Mexicana NMX-AA-015-1985. Protección al Ambiente - Contaminación del Suelo - Residuos Sólidos Municipales - Muestreo -Método de Cuarteo.” 1985.
- SECOFI - Secretaría de Comercio y Fomento Industrial, “Norma Mexicana NMX-AA-022-1985 Protección al Ambiente - Contaminación del Suelo - Residuos Sólidos Municipales - Selección y Cuantificación de Subproductos.” 1985.
- WtERT - Waste to Energy Research Technology, “Nationwide study of municipal residual waste to determine the proportion of problematic substances and recyclable materials. 2024. Available online: https://www.wtert.net/bestpractice/525/Nationwide-study-of-municipal-residual-waste-to-determine-the-proportion-of-problematic-substances-and-recyclable-materials.html (accessed on 19 October 2024).
- Y. Ding et al., “A review of China’s municipal solid waste (MSW) and comparison with international regions: Management and technologies in treatment and resource utilization. J. Clean. Prod. 2021, 293, 126144. [Google Scholar] [CrossRef]
- T. V. Ramachandra, H. A. Bharath, G. Kulkarni, and S. S. Han, “Municipal solid waste: Generation, composition and GHG emissions in Bangalore, India. Renew. Sustain. Energy Rev. 2018, 82, 1122–1136. [Google Scholar] [CrossRef]
- M. E. Edjabou et al., “Municipal solid waste composition: Sampling methodology, statistical analyses, and case study evaluation. Waste Manag. 2015, 36, 12–23. [Google Scholar] [CrossRef]
- SEMARNAT - Secretaría de Medio Ambiente y Recursos Naturales, “Diagnóstico Básico para la Gestión Integral de los Residuos. Ciudad de México, 2020. Accessed: Sep. 30, 2020. [Online]. Available: www.gob.mx/inecc.
- V. Jahagirdar, A. K. V. Jahagirdar, A. K. Mishra, and A. S. Kalamdhad, “Exploring the Fine Fraction from Landfill Mining: A Comprehensive Case Study of the Boragaon Dump Site in Guwahati, India. 2024. [CrossRef]
- T. J. Mönkäre, M. R. T. Palmroth, and J. A. Rintala, “Characterization of fine fraction mined from two Finnish landfills. Waste Manag. 2016, 47, 34–39. [Google Scholar] [CrossRef] [PubMed]
- Singh and M., K. Chandel, “Physicochemical and FTIR spectroscopic analysis of fine fraction from a municipal solid waste dumpsite for potential reclamation of materials. https://doi.org/10.1177/0734242X20962844 2020, 39, 374–385.
- S. Keber, T. Schirmer, T. Elwert, and D. Goldmann, “Characterization of Fine Fractions from the Processing of Municipal Solid Waste Incinerator Bottom Ashes for the Potential Recovery of Valuable Metals. Miner. 2020, Vol. 10, Page 838, vol. 10, no. 10, p. 838, Sep. 2020. [CrossRef]
- P. Lakshmikanthan, L. G. P. Lakshmikanthan, L. G. Santhosh, and G. L. Sivakumar Babu, “Evaluation of Bioreactor Landfill as Sustainable Land Disposal Method. pp. 243–254, 2017. [CrossRef]
- Rafiq and J., L. Xu, “Microplastics in waste management systems: A review of analytical methods, challenges and prospects. Waste Manag. 2023, 171, 54–70. [Google Scholar] [CrossRef]
- F. Okori, J. Lederer, A. J. Komakech, T. Schwarzböck, and J. Fellner, “Plastics and other extraneous matter in municipal solid waste compost: A systematic review of sources, occurrence, implications, and fate in amended soils. Environ. Adv. 2024, 15, 100494. [Google Scholar] [CrossRef]
- Edo, F. Fernández-Piñas, and R. Rosal, “Microplastics identification and quantification in the composted Organic Fraction of Municipal Solid Waste. Sci. Total Environ. 2022, 813, 151902. [Google Scholar] [CrossRef] [PubMed]
Figure 1.
Proportion of different urban solid waste at the two study sites. 1SMW = special management waste.
Figure 1.
Proportion of different urban solid waste at the two study sites. 1SMW = special management waste.
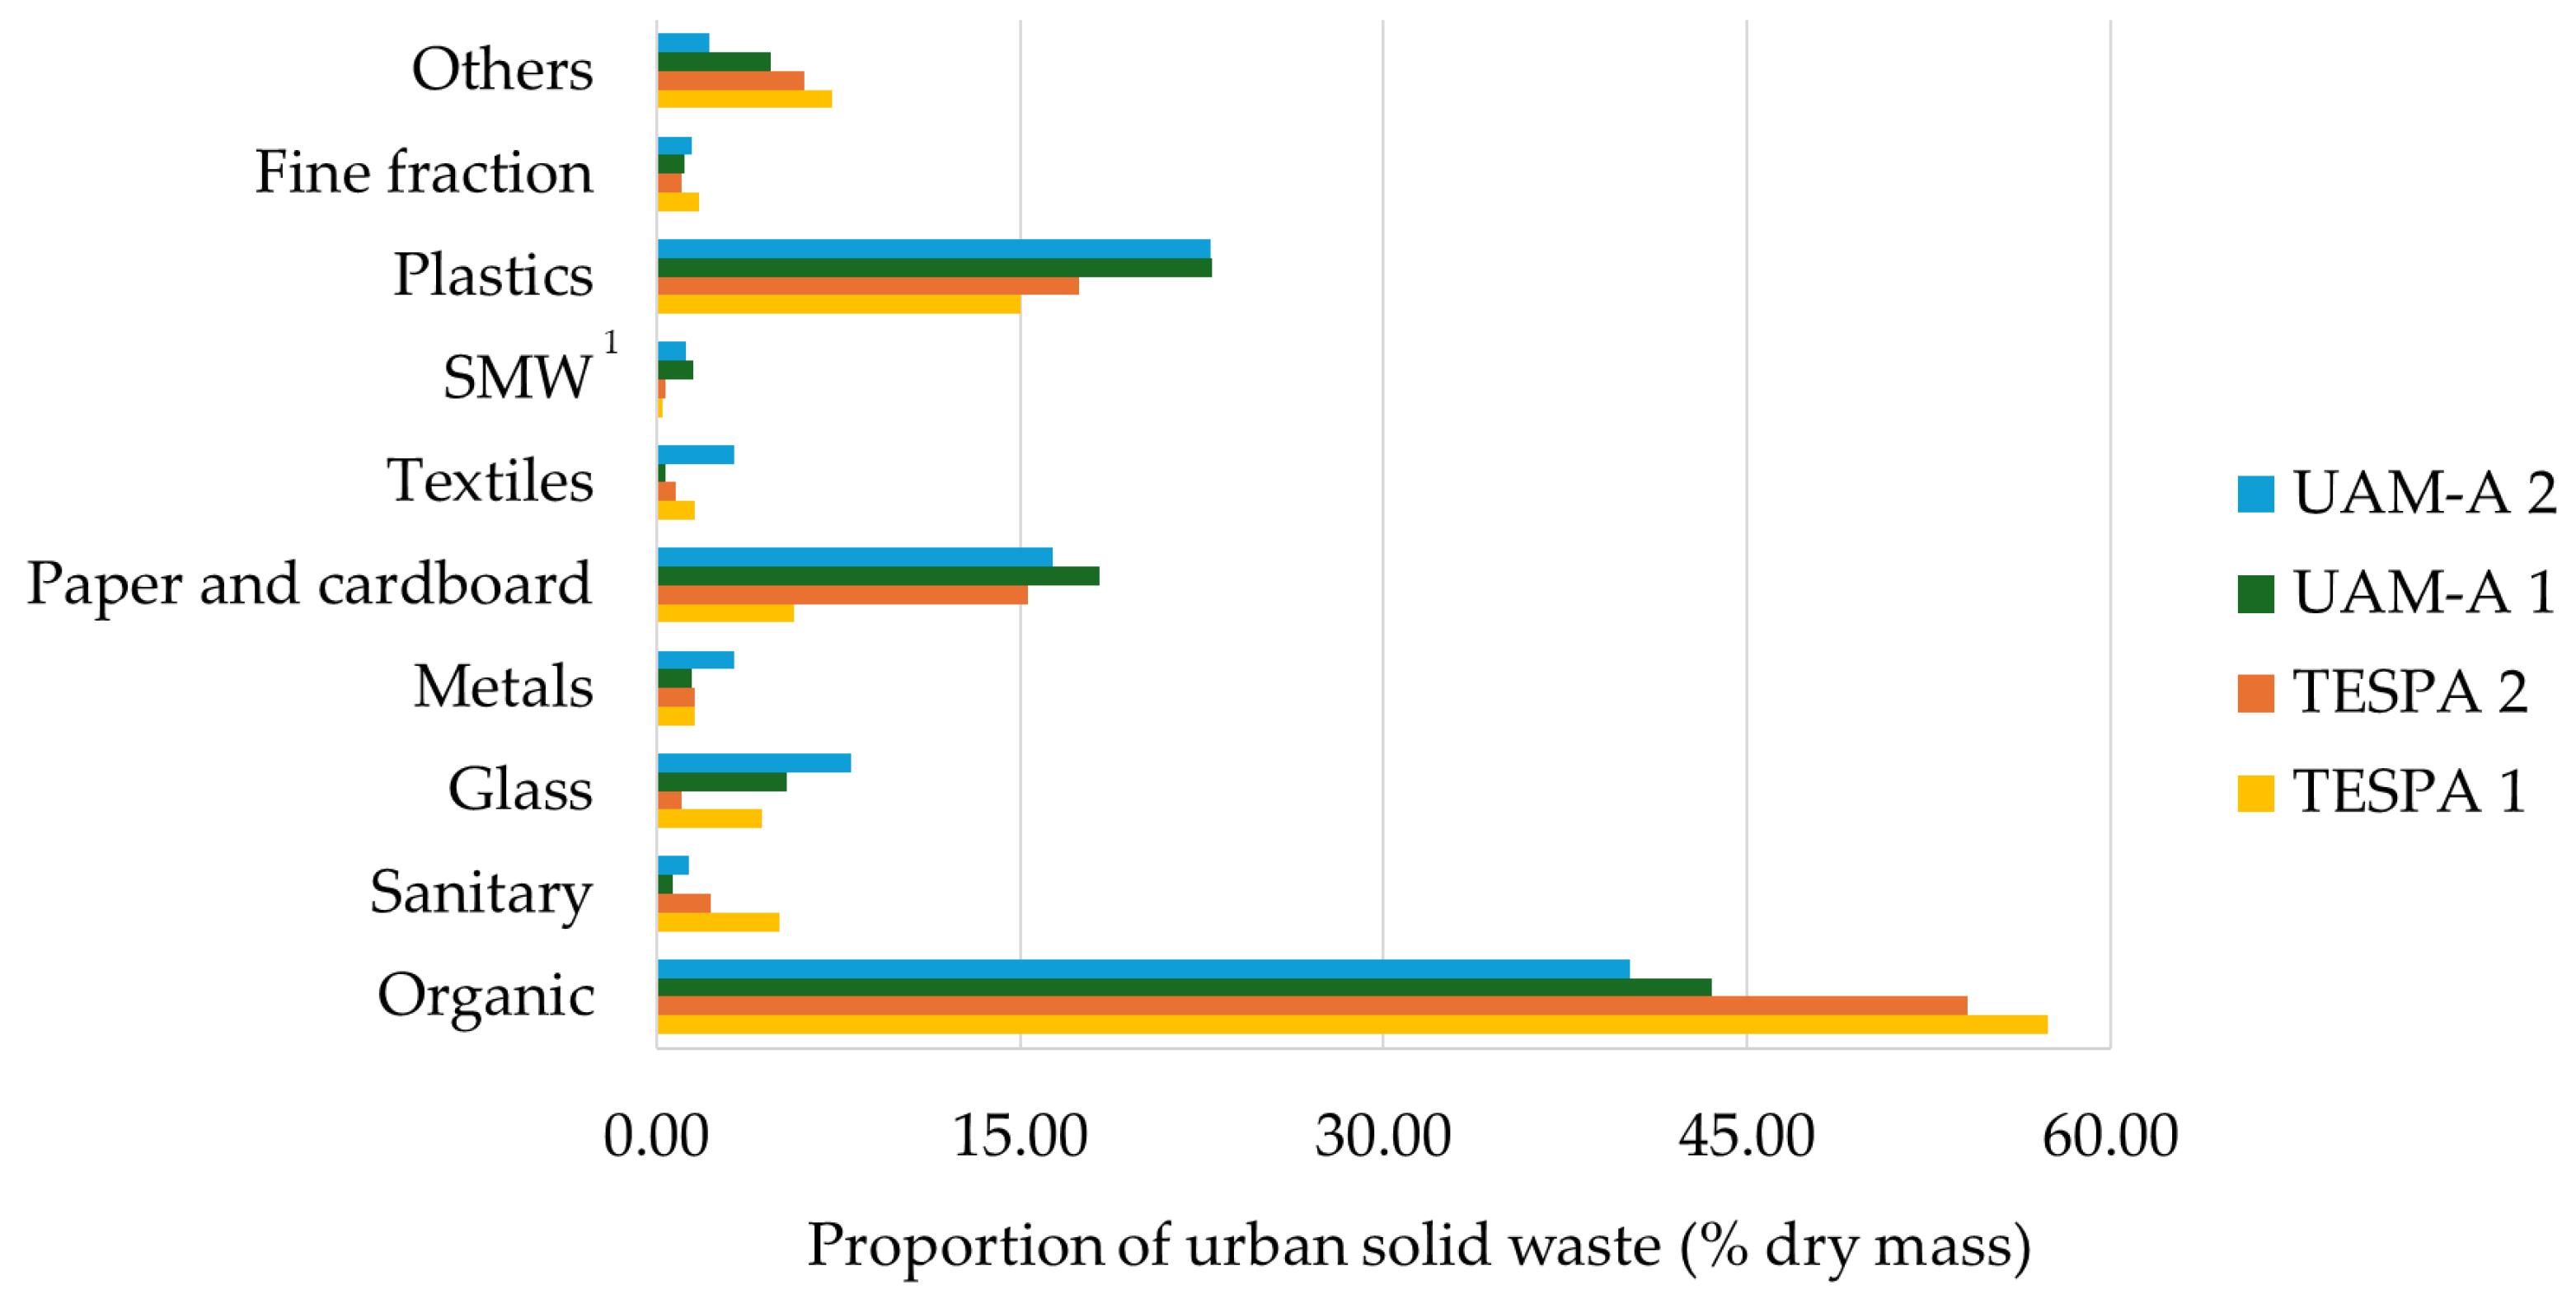
Figure 2.
Box and whisker diagram of the four sampled sites.
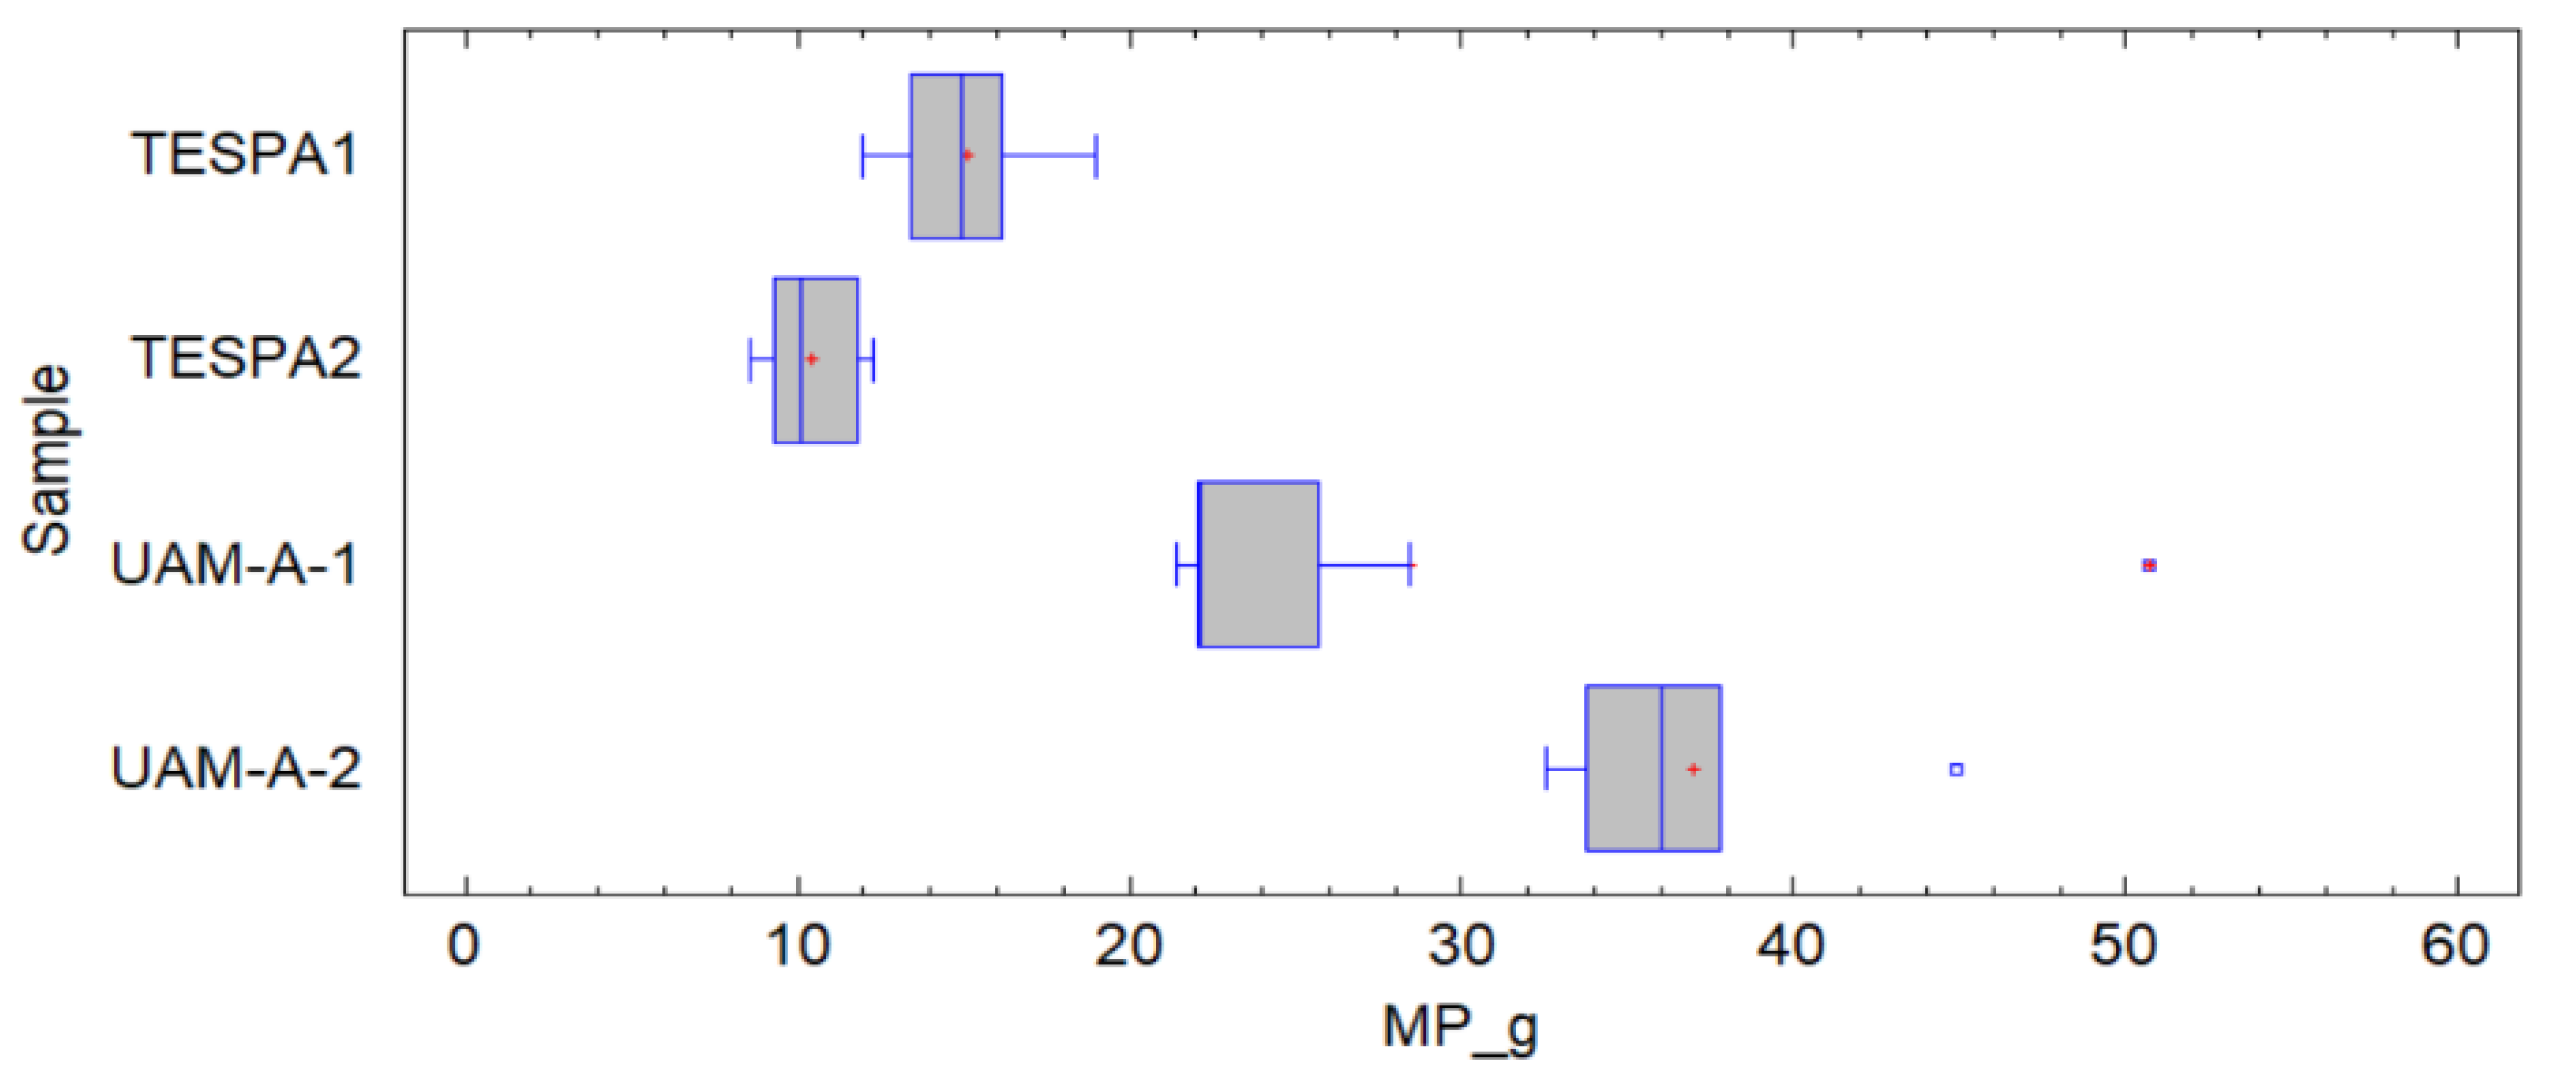
Figure 3.
Box and whisker diagram for the abundance of microplastics in the fine fraction of the two sampled sites.
Figure 3.
Box and whisker diagram for the abundance of microplastics in the fine fraction of the two sampled sites.
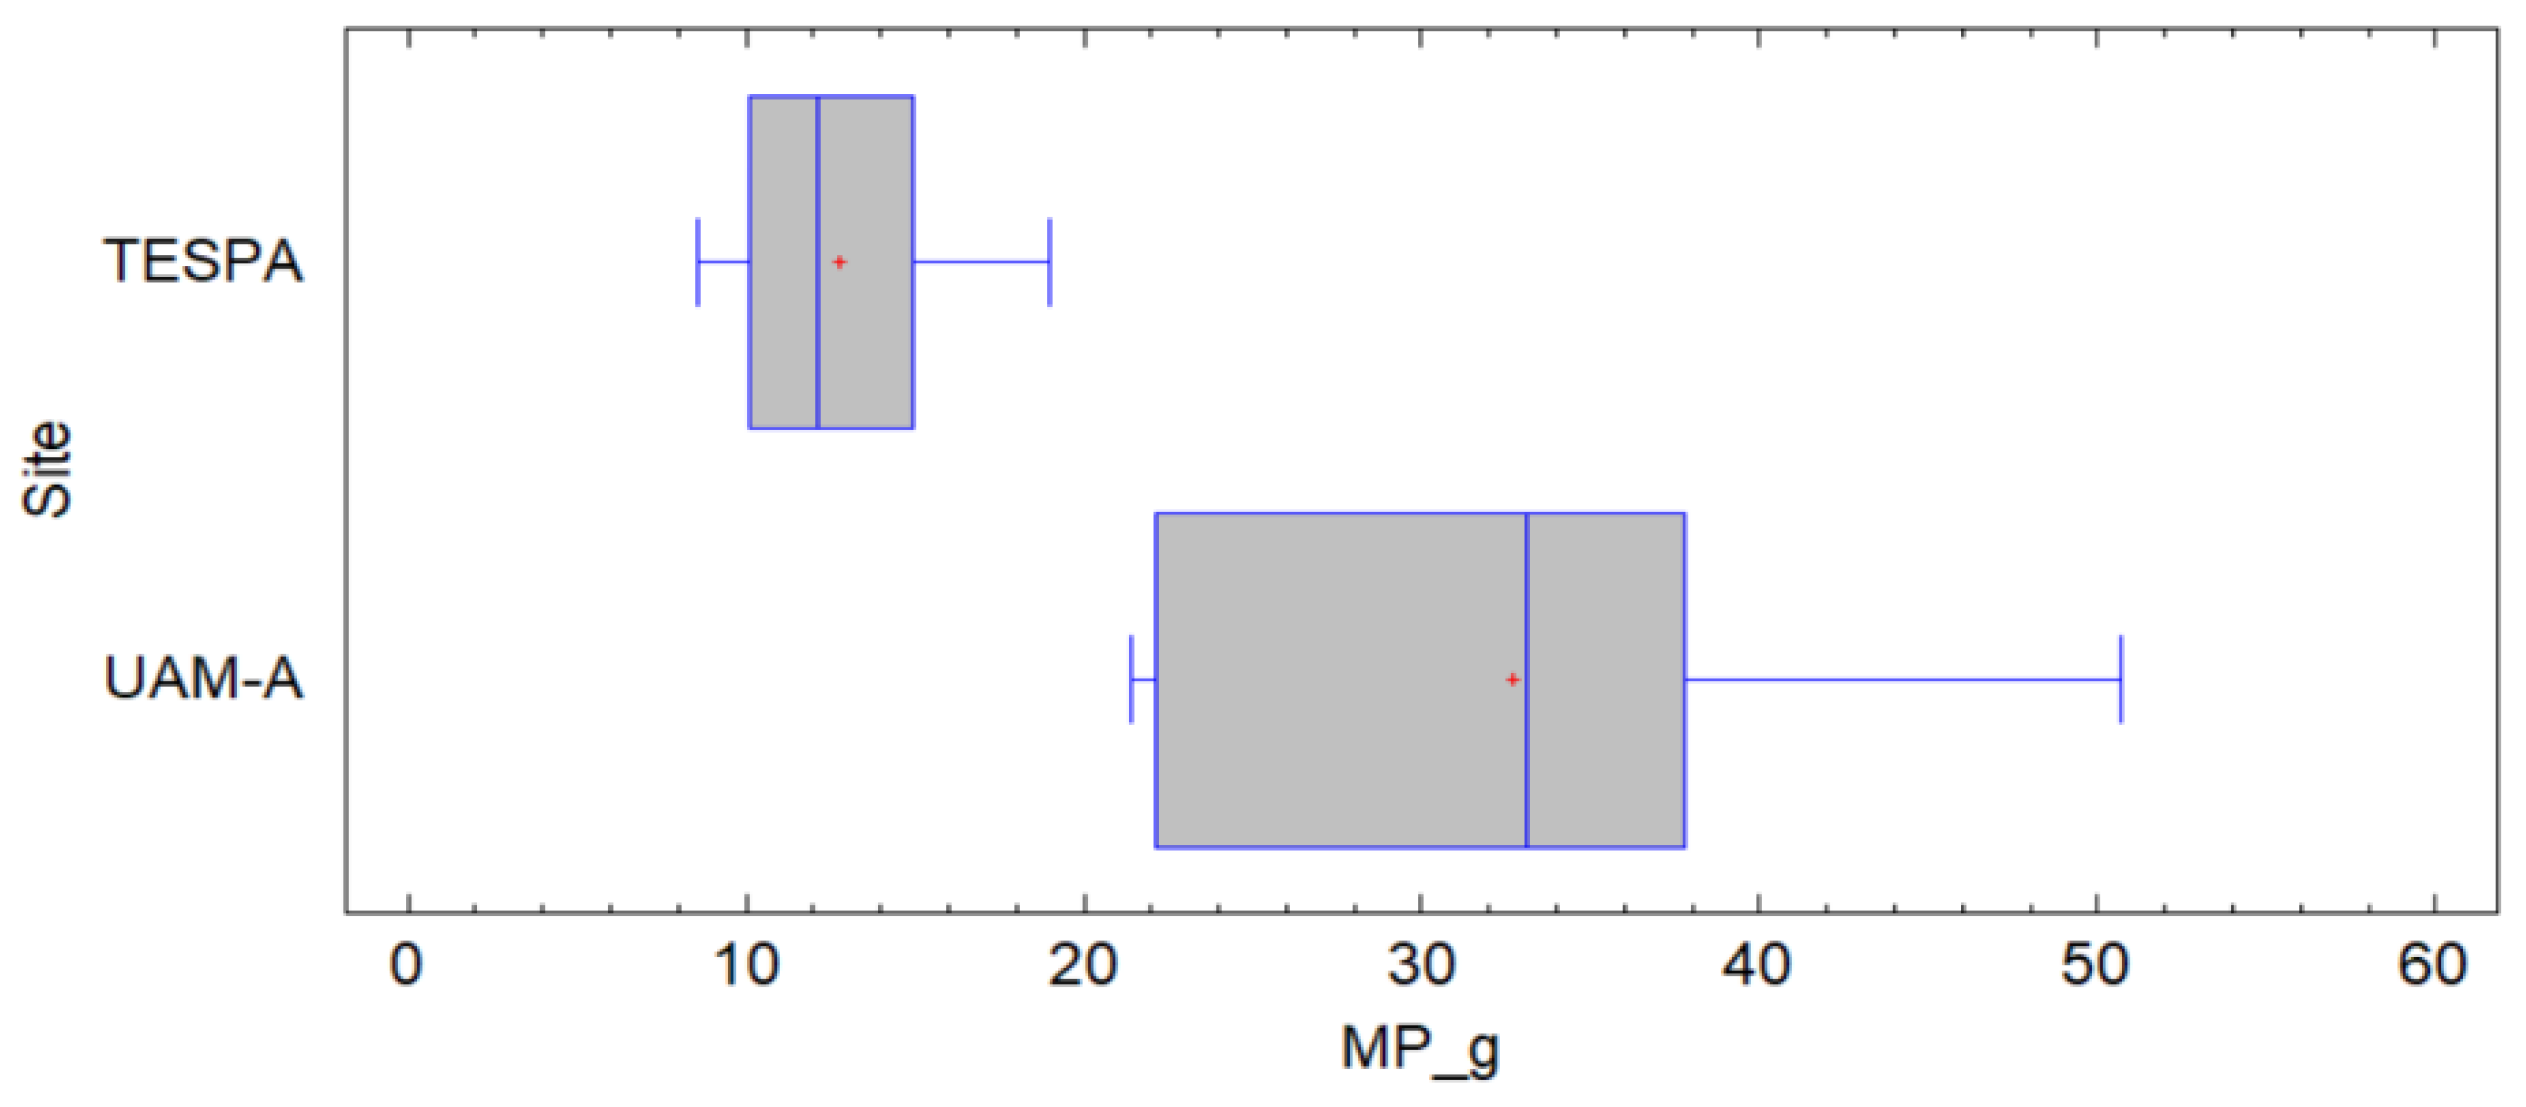
Figure 4.
Classification of microplastics: a) size, b) shape, c) color, and d) polymer.
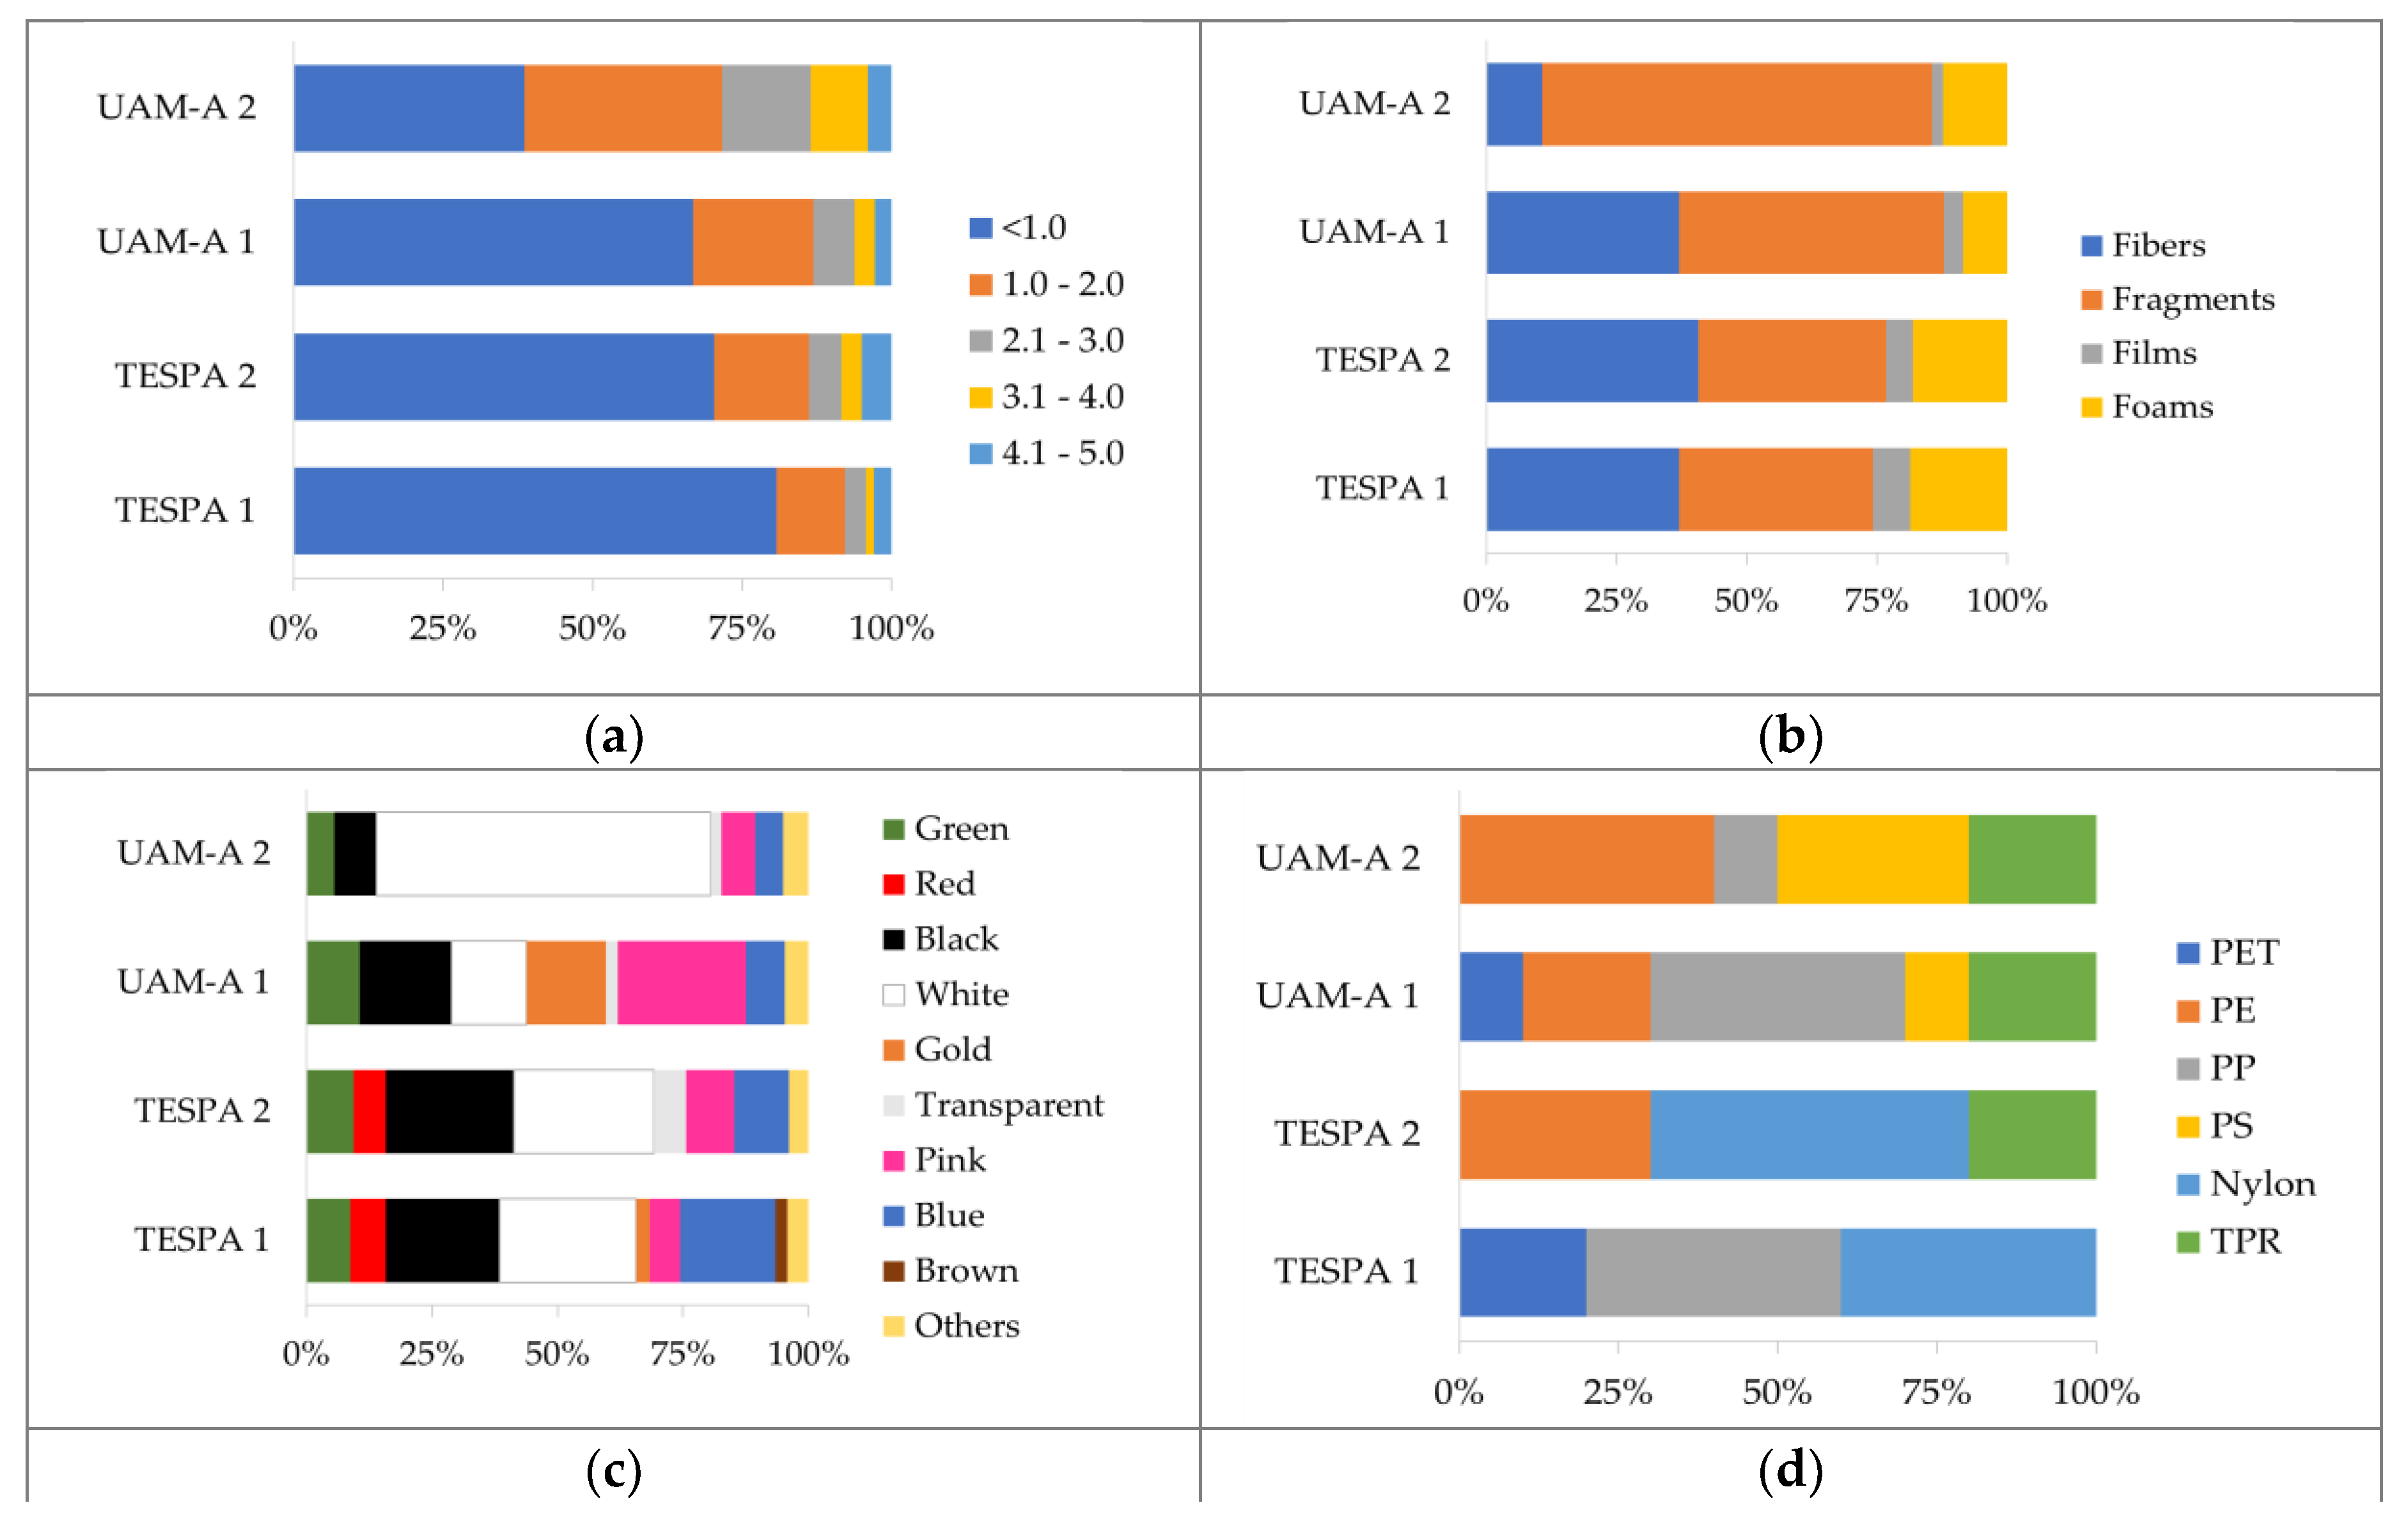
Figure 5.
Examples of microplastics from TESPA 1.
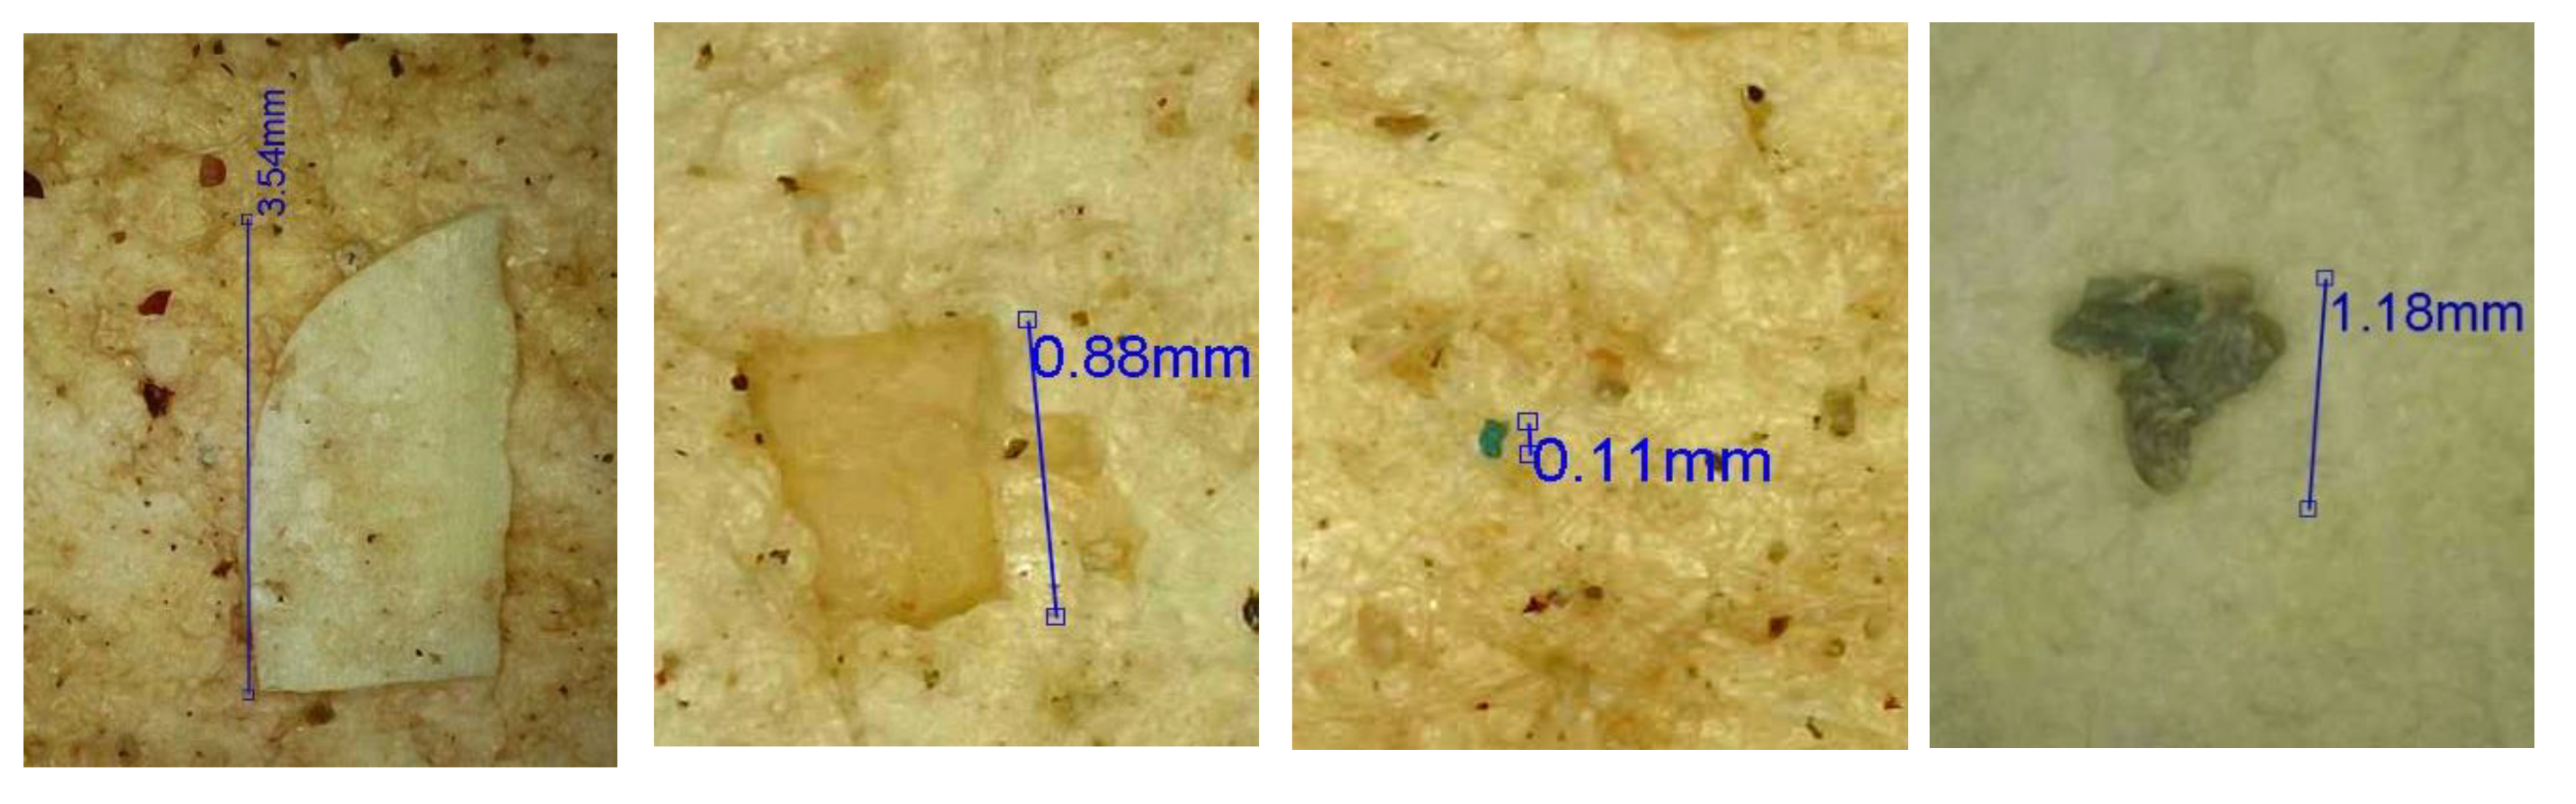
Figure 6.
Examples of microplastics from: a) TESPA 2, b) UAM-A 1, and c) UAM-A 2.
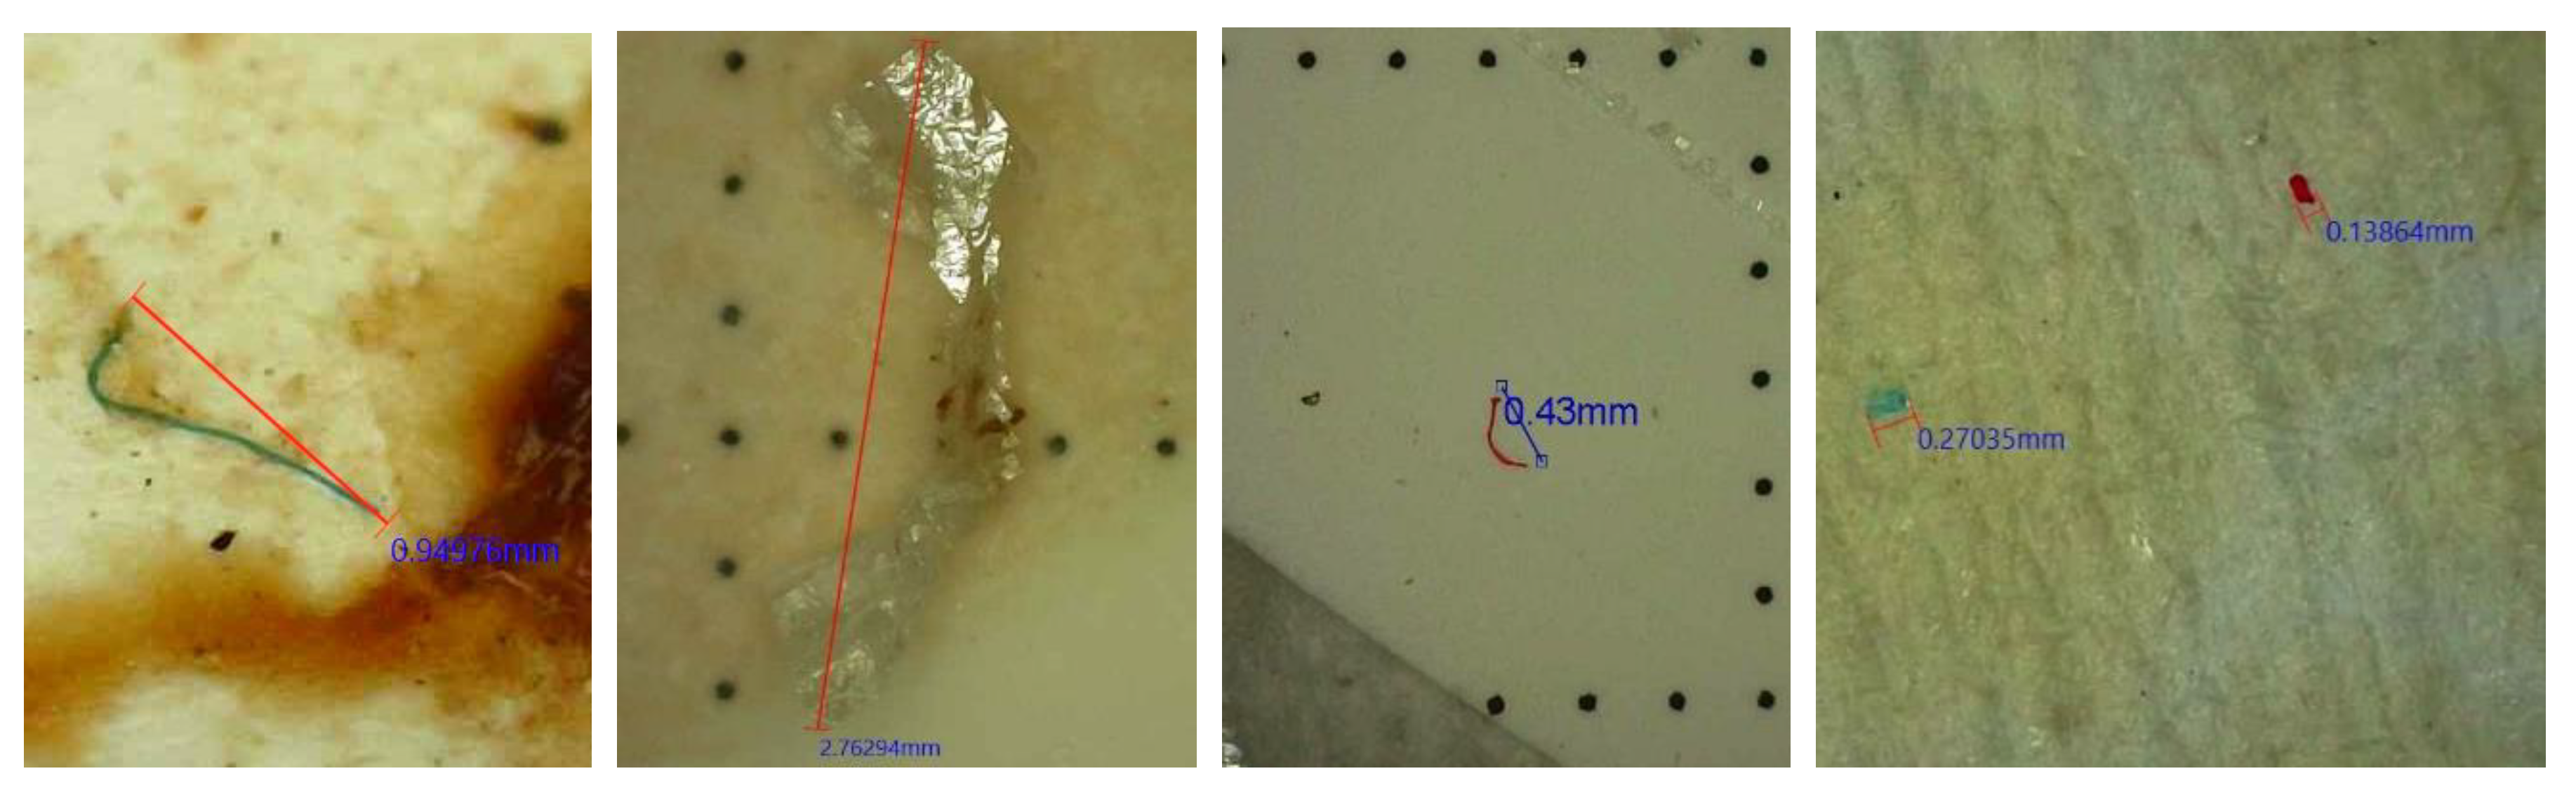
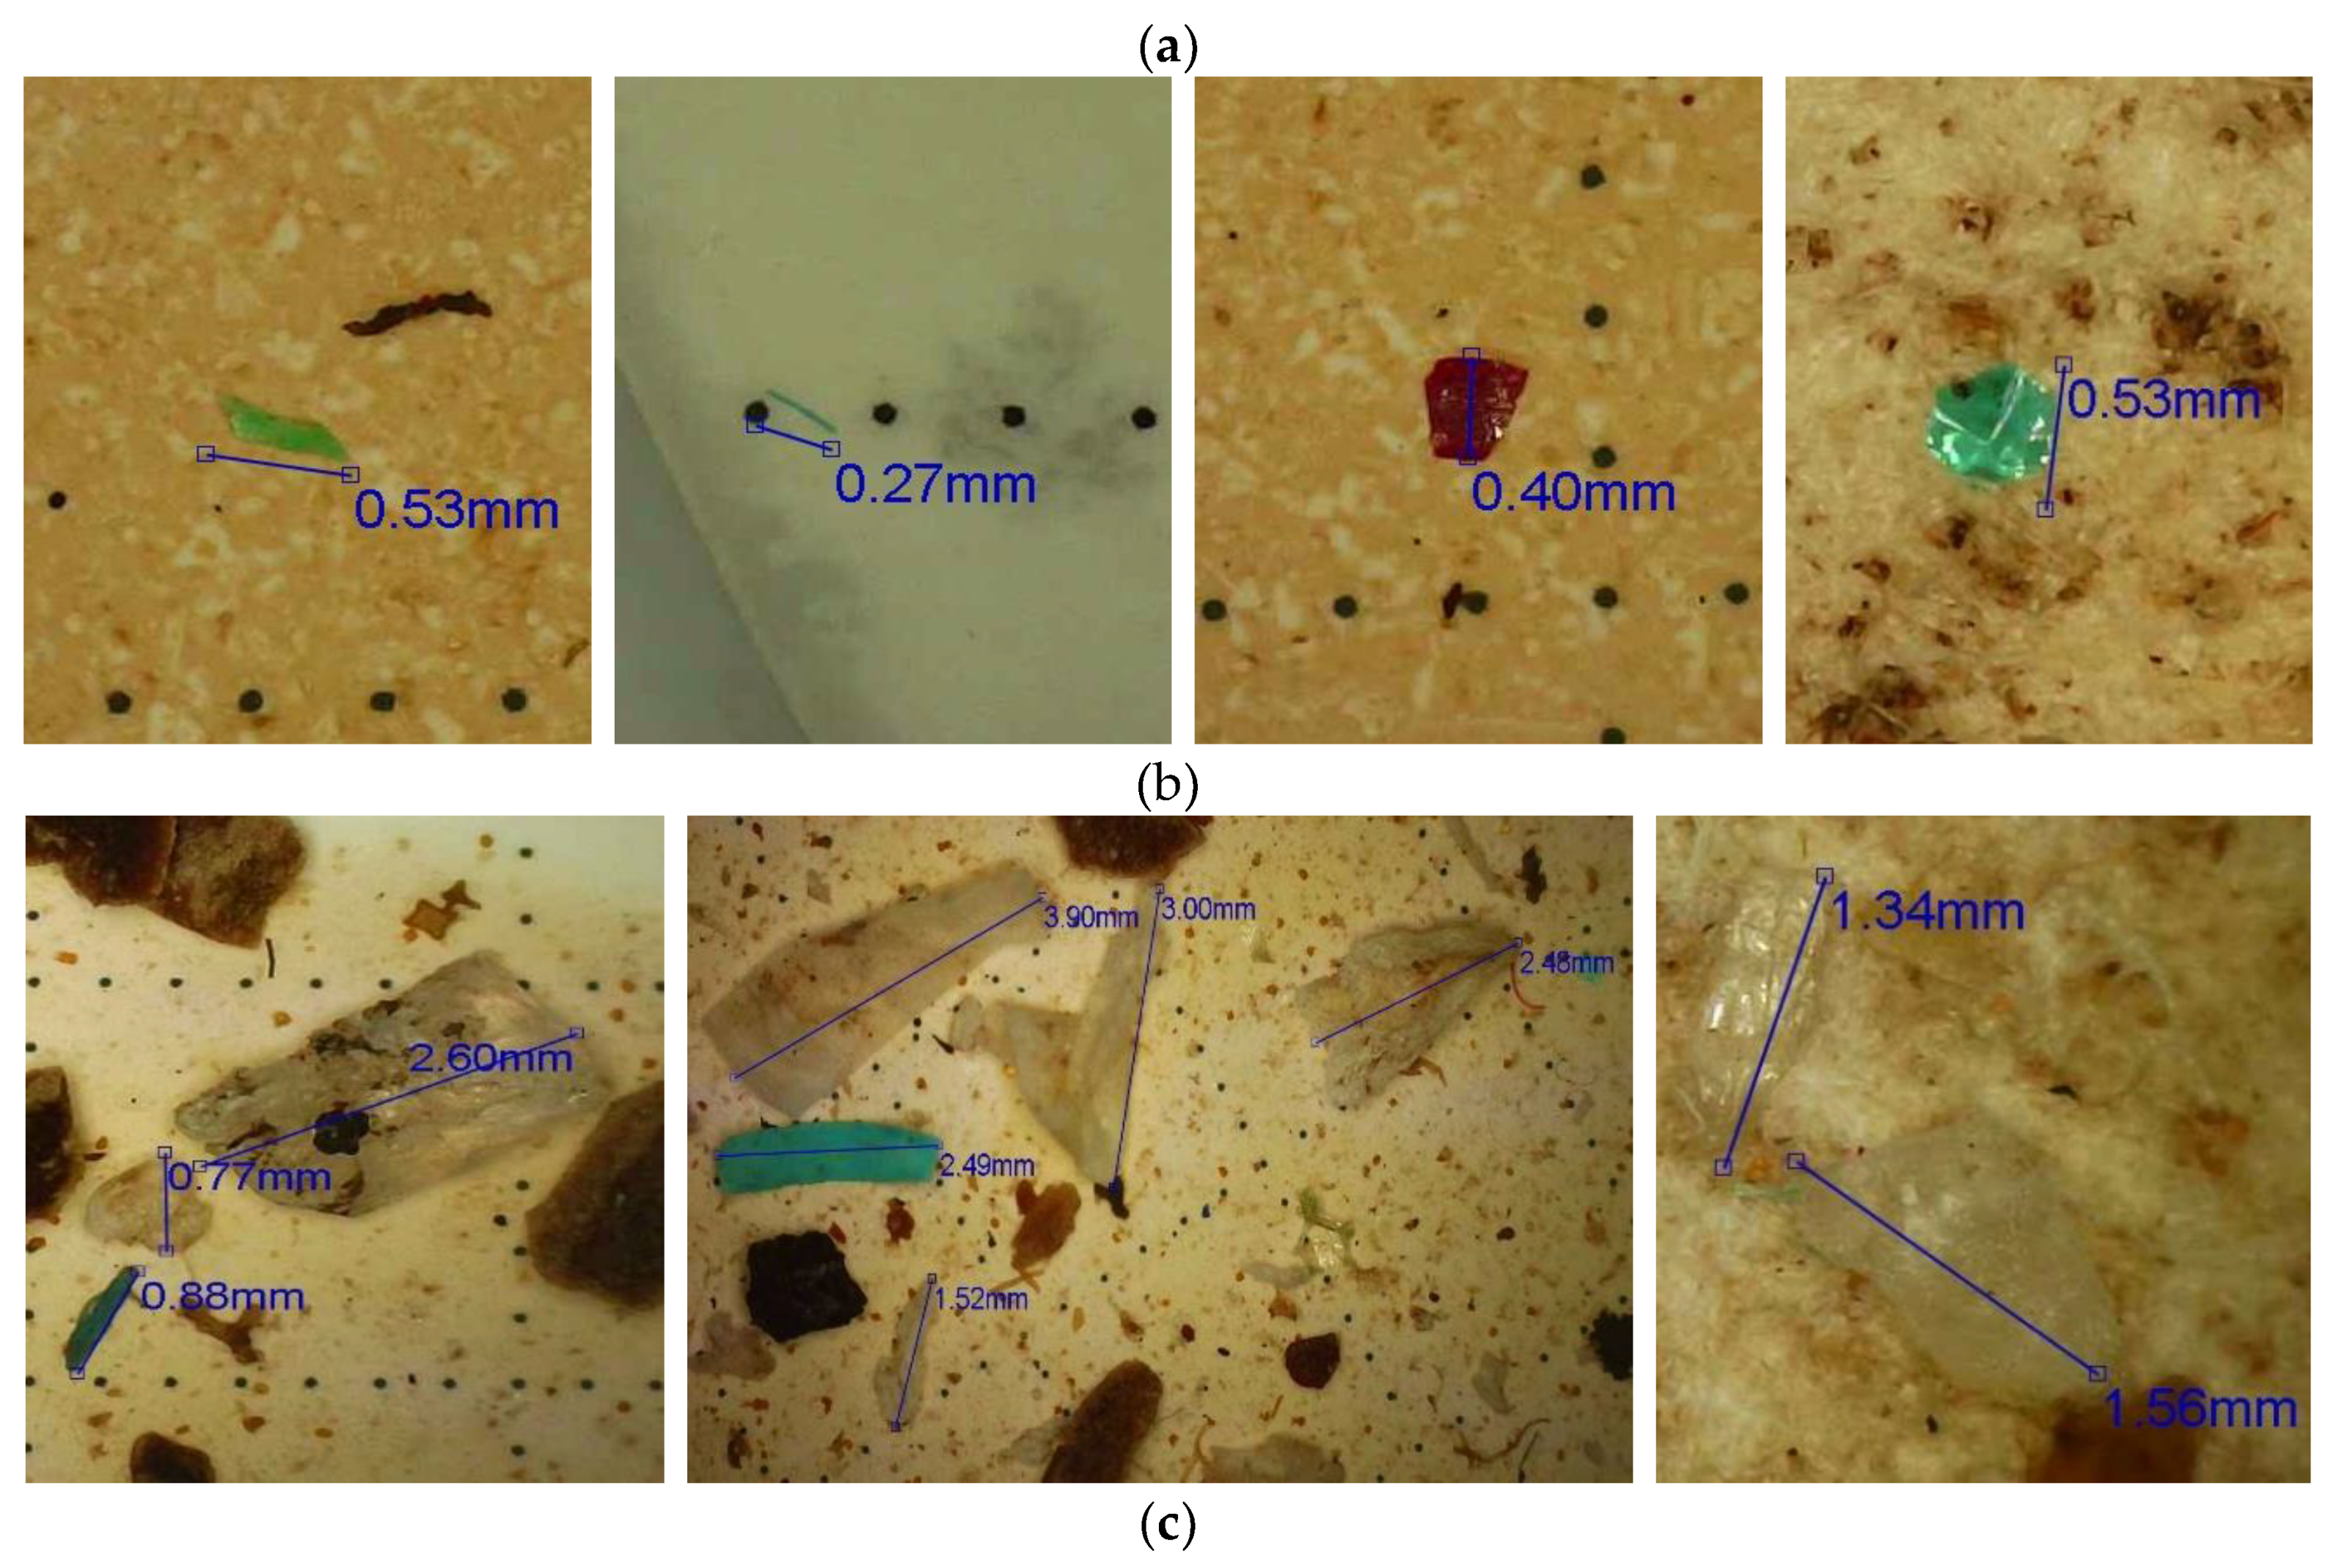

Table 1.
Relevant information about the five tested protocols.
| Protocol | Oxidant | Conditions | Filtration | Comments | References |
|---|---|---|---|---|---|
| Protocol 1 | Step 1: 10% KOH Step 2: 30% H2O2 Step 3: 0.05 M Fe(II) |
Mass of sample: 50 g. Step 1: 40 ° C 24 h Step 2: 40 mL 3 times every 20 min at 60 ° C Stage 3: 40 mL once |
Vacuum on cellulose filter (Ø= 47 mm and pore size of 8 μm) | Stirring for 10 seconds when adding each reagent | [24] |
| Protocol 2 | 180 mL of 10% KOH plus 20 mL of 30% H2O2 | Mass of sample: 50 g. 60 °C for 24 h with stirring every 6 or 8 h |
Vacuum on cellulose filter (Ø= 47 mm and pore size of 8 μm) | Covering the sample with aluminum foil and stirring with a glass rod | [25,26] |
| Protocol 3 | 20 mL of 0.05 M Fe(II) plus 20 mL of 30%H2O2 |
Mass of sample: 50 g. Room temperature for 5 min and then 75 °C for 30 min with stirring with magnetic bar |
After flotation: vacuum on cellulose filter (Ø= 47 mm and pore size of 8 μm) | The sample was sieved with 3 and 5 mm mesh. After digestion, the sample was subjected to flotation with saturated NaCl with stirring for 2 min with a glass rod and rest for 24 h | [27,28] |
| Protocol 4 | 10% (m/v) KOH in a ratio of 1:10 (sample mass: solution volume) | Mass of sample: 10 g. 40 °C for 72 h (until the presence of a clear solution, without traces of organic matter) |
After digestion: vacuum on a cellulose filter (Ø= 47 mm and pore size of 8 μm). | During digestion, the sample was stirred once a day with a glass rod, rinsed with deionized water before and after, and dried with adsorbent paper. After the first filtration, the filter paper with the sample was rinsed with deionized water |
[29,30,31] |
| Protocol 5 | 10% (m/v) of KOH in a ratio of 1:5 (sample mass: solution volume) | Mass of sample: 62 g. 60 °C for 24 h (with stirring) |
Vacuum on cellulose filter (Ø= 47 mm and pore size of 8 μm) | Heating on a grill and stirring with a magnetic bar | [32,33,34,35,36] |
Table 2.
Categories for urban solid waste classification.
| Category | Type of waste | Category | Type of waste |
|---|---|---|---|
| Organic | Food waste | Paper and cardboard | Paper |
| Pruning waste | Cardboard | ||
| Napkins and sanitary paper | Tetra Pak | ||
| Sanitary | Disposable nappies | Textiles | Textiles |
| Sanitary towels | Special management waste (SMW) | Potentially hazardous | |
| Other sanitary | Construction | ||
| Glass | All types of glass | Plastics | All plastics |
| Metals | Aluminum cans | Others | Wood |
| Other cans | Semi-fine fraction | ||
| Other metals | Fine fraction | ||
| Other |
Table 3.
Results of all tested protocols.
| Protocol | Degradation of organic matter | Virgin MP recovery percentage | Other comments | Conclusion |
|---|---|---|---|---|
| Protocol 1 | After 24 h, the sample was not completely digested. | It could not be calculated | When adding H2O2 there was a significant loss of sample due to the fact that it spilled. Filtration was not possible |
Protocol not suitable for digestion of organic matter |
| Protocol 2 | After 24 hours of treatment, organic matter was still observed, and the sample was too thick | It could not be calculated | Filtering to retrieve virgin MP could not be performed | Protocol not suitable for digestion of organic matter |
| Protocol 3 | After 20 min, the sample was not completely digested, but much of the matter was destroyed | It could not be calculated | When H2O2 was added, there was a large amount of foam. The treatment did not last 30 min, since after 20 min the reagents had already evaporated, and the entire sample adhered to the glass |
Protocol moderately suitable for the digestion of organic matter |
| Protocol 4 | After digestion the sample had a good degradation | 100%, no color changes or presence of cracks | The filters were clearly visible as there was very little presence of organic matter. However, flotation tests with NaCl (1.1 g/ml) and centrifugation with CaCl2 (1.6 g/ml) and at a higher speed are recommended | Proper protocol |
| Protocol 5 | The sample changed color, but did not degrade | It could not be calculated | Filtration was not possible because the organic matter had not degraded | Protocol not suitable for digestion of organic matter |
Table 4.
Central tendency and dispersion values of the abundance of microplastics in the the four samples analyzed, #MP/g of dry mass.
Table 4.
Central tendency and dispersion values of the abundance of microplastics in the the four samples analyzed, #MP/g of dry mass.
| Site | Mean ± standard deviation | % Variance | Median |
|---|---|---|---|
| TESPA 1 | 15.1 ± 2.7 | 17.8 | 14.9 |
| TESPA 2 | 10.4 ± 1.6 | 15.4 | 10.1 |
| UAM-A 1 | 28.4 ± 12.6 | 44.2 | 22.2 |
| UAM-A 2 | 36.9 ± 4.8 | 13.2 | 36.0 |
Table 5.
Central tendency and dispersion values of the two sites analyzed, #MP/g of dry mass.
| Site | Mean ± standard deviation | % Variance | Median |
|---|---|---|---|
| TESPA | 12.8 ± 3.2 | 25.4 | 12.1 |
| UAM-A | 32.7 ± 10.1 | 30.8 | 33.1 |
Table 6.
Studies around world about fine fraction in urban solid waste.
| Region or country | Category of waste | % in weight | Reference |
|---|---|---|---|
| Germany | Fine waste (0 – 10 mm) | 6.3 of household waste | [44] |
| China’s eastern coastal regions | Dust | 0.0 – 15.27 of municipal solid waste | [45] |
| Bangalore, India | Dust and sweeping | 6.53, average of domestic, markets, trade, slums and street sweeping | [46] |
| Three municipalities in Denmark | Gravel, stones and sand | 0.3 – 0.2 of residual waste | [47] |
| Mexico | Fine waste (< 2 mm) | 2.25 of urban solid waste | [48] |
Disclaimer/Publisher’s Note: The statements, opinions and data contained in all publications are solely those of the individual author(s) and contributor(s) and not of MDPI and/or the editor(s). MDPI and/or the editor(s) disclaim responsibility for any injury to people or property resulting from any ideas, methods, instructions or products referred to in the content. |
© 2024 by the authors. Licensee MDPI, Basel, Switzerland. This article is an open access article distributed under the terms and conditions of the Creative Commons Attribution (CC BY) license (http://creativecommons.org/licenses/by/4.0/).
Copyright: This open access article is published under a Creative Commons CC BY 4.0 license, which permit the free download, distribution, and reuse, provided that the author and preprint are cited in any reuse.


