
Submitted:
31 October 2025
Posted:
03 November 2025
You are already at the latest version
Abstract
Wastewater treatment systems retain a significant proportion of microplastics (MPs) derived from domestic and industrial discharges; however, these emerging pollutants are not completely removed and tend to accumulate in the biological sludge generated during the treatment process. In this study, three biological-type wastewater treatment plants (WWTPs) located in Acapulco, Mexico, were analyzed. The concentrations of MPs in the biological sludge ranged from 830 to 9,300 items per liter. Using differential scanning calorimetry (DSC), the predominant polymers identified were high-density polyethylene (HDPE), polyethylene terephthalate (PET), and polypropylene (PP). It was estimated that the monthly concentrations of MPs in the sludge could reach up to 5.36 × 10⁹ items/liter, while the annual concentrations could rise to 3.55 × 10¹⁰ items/liter. These findings highlight the urgent need to review and update the regulatory framework re-lated to the use of residual sludge for agricultural purposes since high loads of MPs and their transfer pose a potential risk to soil quality, ecosystem health, and long-term en-vironmental sustainability.
Keywords:
microplastics
; biological sludge
; wastewater treatment plants (WWTPs)
; differential scanning calorimetry (DSC)
; synthetic polymers
; sustainability
; public policy
1. Introduction
Microplastics (MPs) are multidimensional emerging pollutants (< 5 mm) present in large quantities in natural and anthropogenic systems, posing an alarming challenge to sustainability [1]. The increase in plastic production and consumption in developed countries, as well as emerging economies, has generated an overload in waste management systems handling plastic until their degradation into MPs [2,3,4,5]. Due to their distribution and abundance in various environments such as air [6], water [7,8,9,10], beaches [11], and soils [12,13,14,15,16], MPs represent a significant threat as they can adhere to toxic elements such as heavy metals and hydrophobic additives, making them potential vectors for such contaminants [7,17,18]. In this regard, research has shown that MPs have a high affinity for these metals and additives, which increases the risk of toxicity and makes them a growing danger to environmental and human health [7,19].
Within different ecosystems, studies have revealed that microplastics can accumulate in marine organisms, causing damage and biological alterations, along with other adverse effects [19,20]. MPs also affect terrestrial ecosystems by interfering with the behavior of organisms such as collembolans and other insects and disrupting soil functions and associated biota [13,21]. Furthermore, it has been demonstrated that introducing MPs into various levels of the food chain can generate short- and long-term effects, including toxic risks such as oxidative stress and neurotransmitter alterations in various species, including humans [17,22,23,24]. Therefore, these impacts not only compromise food security but can also alter ecological dynamics, affecting biodiversity and ecosystem stability [10].
Concerning anthropogenic systems, wastewater treatment plants (WWTPs) significantly contribute to the removal of various contaminants and the production of biological sludge that can later be used as soil conditioner, fertilizer, and compost for agricultural use [25,26,27,28,29]. However, such treatment systems are not originally designed to eliminate emerging contaminants such as MPs [27,30,31,32]. Primary and secondary MPs have been identified through various analytical techniques (FTIR spectroscopy, Raman spectroscopy, Pry-GC-MS, SEM, and DSC) at different treatment stages, detecting considerable presence and variability [33,34,35,36,37,38].
In WWTPs in the United Kingdom, persistent MPs within the size range of 60–2800 μm have been found at all sampling points, with an average inlet of 8.1 × 10⁸ particles per day, reduced by 96% during treatment stages; however, despite this removal, an average of approximately 2.2 × 10⁷ particles per day are discharged into the environment [39]. Other studies have observed MP retention efficiencies between 94.9% and 99.7% [40,41,42,43,44]. Meanwhile, a significant number of MPs accumulate in the sludge generated during biological wastewater treatment processes [45,46,47,48,49,50]. For example, in Vancouver, Canada, it was estimated that up to 99% of MPs entering wastewater treatment systems annually are retained in primary and secondary sludge, with 1.28 trillion particles stored in the primary sludge [41].
In China [26], concentrations of 240.3 ± 31.4 ng/g of MPs were reported in biological sludge, with an average size of 222.6 μm. The predominant types of MPs—confirmed by their chemical composition—include polyethylene terephthalate (PET), polystyrene (PS), polyethylene (PE), polypropylene (PP), and polyvinyl chloride (PVC). Morphologically, fibers and fragments are the most common, and colors such as red, black, green, and blue are the most prevalent [30,33,42,43,51,52]. This accumulation of MPs in sludge poses additional risks, as they can be introduced into agricultural soils, altering terrestrial environments [43]. Despite various treatments applied to sludge—such as thermal pre-treatment, anaerobic digestion, and composting—they do not effectively eliminate MPs [53,54,55], which continue to persist in the sludge and may re-enter the environment, significantly affecting sludge quality for sustainable use and management [36,47,51,56]. In Mexico, the current environmental regulation establishing the maximum permissible limits for pollutants in the management and final disposal of biological sludges is NOM-004-SEMARNAT-2002 [57], but this standard does not consider microplastics (MPs) within its framework. Therefore, the current situation regarding the extent of microplastic contamination in biological sludge remains unknown, despite its growing relevance as an emerging pollutant. Consequently, it is essential to evaluate the problem associated with the presence of MPs in biological sludge generated by WWTPs.
This study aimed to detect and quantify the presence of 300 µm MP particles in sludge from three biological WWTPs in Acapulco using density separation (ZnCl₂) and differential scanning calorimetry (DSC). Moreover, in this study, we aimed to estimate monthly and annual projections of MP concentrations.
The obtained results provide relevant information for the development of technical criteria that allow for the inclusion of MPs in Mexican environmental regulations, thereby contributing to the establishment of a broader regulatory framework that promotes the sustainable management and safe use of biological sludge.
2. Materials and Methods
2.1. Sampling
Sampling was conducted at specific points during June, July, September, and October 2023, at the outlet of the sedimentation tanks of the three WWTPs (Figure 1). Samples were collected in triplicate in 100 mL Teflon® bottles from the brand Nalgene®. Once collected, the samples were stored in the laboratory at 15 °C.
2.2. Sample Treatment
Extraction of MPs from the sludge was performed using density separation, with modifications based on methods reported in other studies [26,43,58,59,60,61,62,63,64]. Each 100 mL sludge sample was dissolved in 1000 mL of distilled water for homogenization. Subsequently, it was sieved using 710 and 300 µm mesh sieves to remove large solids. After sieving, the 300 µm sieve was carefully rinsed with distilled water, which was collected in a 250 mL beaker. The rinse water was then dried at a controlled temperature of 80 ± 1 °C for 8 to 10 hours. Next, digestion was carried out by adding 40 mL of 30% H₂O₂ at 60 ± 1 °C for two hours. The process was repeated with an additional 20 mL of H₂O₂ under the same conditions for another two hours. Once cooled to room temperature, MPs were separated based on density using 60 mL of ZnCl₂ solution with a density of 1.62 g/cm3 [58]. Finally, the supernatant was vacuum-filtered using glass fiber filters and stored in Petri dishes for identification [58]. Each sample was analyzed in triplicate. Throughout the process, an exhaustive cleaning protocol was followed to prevent cross-contamination. Blanks and filters were included to detect possible MPs from the atmosphere, with no MPs observed in the quality control samples, thus guaranteeing that the MPs detected originated exclusively from the analyzed samples.
2.3. Characterization of MPs
For MP identification, an adaptation of Flores-Munguía et al. [58] was used based on the classification criteria proposed by Hidalgo-Ruz et al. [65]. Quantification and physical characterization of MPs according to their color and morphology were performed using optical microscopy with 4× and 40× objectives. Identification of different MP types was carried out via differential scanning calorimetry (DSC), as performed in other studies [66,67,68,69,70,71], using TA Instruments DSC 250 model DSC. About 2.1 mg of each sample was weighed in an aluminum tray; an empty aluminum tray served as a reference. The sample was then subjected to a heating program in the temperature range of 25 to 290 °C with a heating rate of 10 °C/min in a differential scanning calorimeter. The melting temperature (Tf) and enthalpy (ΔHf) were obtained directly from TA Instruments Trios software version 4.
For the polymeric characterization of the MPs detected in sludge samples, fragments of commercially used plastics (PE, PP, PET, and PVC) were used as reference materials.
2.4. Daily and Monthly Projections
Projections were based on the report by Flores-Munguía et al. [58]. The daily MP concentration was determined by multiplying the MP concentration per 100 mL by the total volume of wastewater treated daily (m3/day). The monthly concentration was estimated by integrating daily MP values and the average mass flow rate of sludge generated monthly. Finally, the annual concentration was calculated considering MP concentration and average annual sludge production during the ten months of WWTP operation (January to October 2023).
2.5. Statistical Analysis
An evaluative analysis of the results obtained from the three WWTPs was conducted to understand differences in their operation and the influence of seasonality regarding the presence and concentration of MPs. This was performed using one-way ANOVA considering a significance level of p < 0.05.
3. Results and Discussion
3.1. MP Concentration
The amounts of 300 µm MPs identified in this study’s analyzed sludge samples ranged from 537 to 9,300 particles/L across the three WWTPs (Table 1). These figures show similarities and differences with previous studies [43,48,61,62,72,73]. The reported concentrations in other studies include ranges of 28–12,000 particles/L [72], 280 particles/gram [61], 22.7 × 10³ particles per kilogram of dry sludge [05], and between 4,196 and 15,385 particles/kg of dry sludge [73]. However, some studies have documented even higher concentrations, such as Liu et al. [43], who quantified an average of 240.3 particles/gram in dehydrated sludge.
The similarities and differences observed could be related to the specific treatment conditions at each WWTP. Additionally, the operational capacity of each treatment system might influence MP accumulation in biological sludges. Furthermore, the complexity of contaminant degradation processes, combined with the efficiency of biological reactors and primary and secondary sedimentation, can also affect the variability in ranges reported in different studies. Different sampling protocols, sample treatment methods, and detection techniques for MPs are also important factors [29,69].
The three WWTPs analyzed in this research all used the same secondary treatment process (biological sludge), and according to their operational systems, no significant differences in MP concentration variation trends were observed during the four sampling months, as confirmed by ANOVA analysis (F = 0.29, p > 0.05) (Table 2).
Furthermore, these same WWTPs were previously studied by Flores-Munguía et al. [58], who reported removal efficiencies between 82.5% and 98.7%. Based on our results, this indicates that most MPs tend to accumulate in the biological sludge. Similar removal efficiencies have been reported elsewhere, and these studies conclude that high removal rates are due to the accumulation of MPs in the biological sludge [44,48,54,59,63,74].
Although not originally designed to retain this type of contaminant, WWTPs demonstrate high MP removal efficiencies, preventing mass release of these pollutants into aquatic ecosystems [29,32,69]. The vast majority of MPs remained in the sludge generated during the treatment processes [34]. Thus, high MP concentrations in biological sludge pose challenges for sustainable management and utilization [44,47]. Kong et al. [50] indicates that MPs in sludge can inhibit microbiological processes in anaerobic treatments, potentially affecting contaminant removal efficiency in wastewater treatment.
On the other hand, high MP concentrations in sludge could affect crops if the sludge is used as soil conditioner or fertilizer, as MPs are often associated with other pollutants such as heavy metals [36,47,53]. Additionally, MPs can interfere with composting processes and increase the contaminant load in leachates from municipal landfills, potentially leading to soil infiltration and groundwater contamination [45].
The variability in the results from this study highlights seasonality as a key factor influencing MP concentrations in sludge. According to the one-way ANOVA (F = 15.55, p < 0.05) (Table 3), significant differences were found in MP presence over the four sampling months.
It was also observed that during rainy months (September and October), MP concentrations were considerably higher compared with during dry months (June and July). This may have been due to increased contaminant loads in influents linked to higher rainfall runoff. These findings align with reports by Li et al. [62] and Dronjak et al. [36], who documented seasonal variations in MP concentrations in biological sludge. Therefore, seasonality and weather events likely influence MP influxes into WWTPs, impacting primary physical treatment processes and increasing pollutant loads in biological systems [58].
3.2. Physical Characterization of MPs
Optical microscopy analysis revealed a diversity of MPs based on their color and shape (Figure 2). The MPs observed in the sludge match the classification proposed by Hidalgo-Ruz et al. [65]. Moreover, the types of MPs detected are consistent with those reported in other studies [26,42,59,61,62,73,74].
It should be noted that there were no observed differences in the physical characteristics of MPs compared with other investigations. The particle size reported in this study was 300 µm, which coincides with other studies identifying particles of the same size. Both studies, no significant morphological differences were found [63]. MPs originating from treatment systems with aerobic sludge show similarities in physical traits, with no apparent wear or color changes [45,46,48,50], despite differences in the physicochemical conditions during treatment and digestion. In contrast, studies on sludge from anaerobic processes have reported morphological and color alterations in MPs [29,49], suggesting that the type of biological treatment system may influence physical changes during wastewater treatment. The MPs detected in this study agree in physical appearance with those previously reported in influents and effluents of the same wastewater treatment plants (WWTPs) [58], demonstrating that larger and denser MPs tend to sediment during primary and secondary sedimentation processes. The diversity of shapes and forms of microplastics (MPs) suggests a complexity in their interactions once these biological sludges are disposed of for reuse or final disposal—whether for agricultural soils, landfills, or other environments. This complexity could influence their mobility, persistence, and potential release into the environment, as well as their effects on soil organisms and soil quality [29,49,50,51,54].
3.3. Color of MPs
In the three WWTPs, MPs of various colors were identified, with blue being the most prevalent, followed by black and red (Figure 3). These findings are consistent with those reported by Flores-Munguía et al. [58], who also observed this color distribution in the influents and effluents of these same plants. No significant differences (ANOVA F = 0.36; p < 0.05) were found in the variety of colors among the three WWTPs (Table 4), which could be attributed to the similarity in the characteristics of domestic discharges entering these treatment systems. The variety and frequency of the observed colors in this study differ from those reported in other studies; in several of them, the predominant colors were white, transparent, and black [11,26,29,34,48,52,59,62,75,76]. Additionally, other investigations in WWTPs from countries like China and England identified black, red, blue, and green as the most common colors [50,63]. Talvitie et al. [25] reported that yellow and transparent were the most prevalent in tertiary treatment systems of WWTPs in Finland. These differences may have been due to the specific discharge conditions in each city. Furthermore, the presence or absence of public policy regulations regarding the use of dyes and additives in plastic production (including primary MPs) could significantly influence the frequency and prevalence of certain colors.
On the other hand, it should be noted that not all studies on MPs in biological sludge from WWTPs include data on the coloration of these particles, limiting comparisons between studies [41,45,73,74]. Characterizing MPs by color is relevant because it allows us to estimate their degree of toxicity [58], and these microplastic particles act as vectors for the emission and exposure of additives and dyes, which often contain metallic elements [77].
Due to their ability to bioaccumulate, these compounds can pose risks to living organisms in any ecosystem, including those present in biological sludge used for composting and as soil conditioner in agriculture [5,18,78].
Therefore, the colors of MPs can be used as indicators of the presence of associated contaminants, such as antimony (Sb), used in various plastics; aluminum (Al), common in PET and PE; arsenic (As) and bromine (Br), detected in PE and PP; and mercury (Hg) and lead (Pb), with the latter commonly found in red pigments used in different types of plastic. Similarly, cobalt (Co) has been identified in blue pigments, especially in PET bottles [1,17,75,79].
Regarding black MPs, these are mainly associated with the black pigments 7 (carbon black) and 11 (iron oxide), which, although they do not pose a significant environmental threat, account for approximately 2% of commercial plastics [77].
In addition, the results from this study suggest that seasonality could influence the variation in microplastic (MPs) presence, as reflected in the diversity of observed colors (Table 5). The ANOVA results show significant differences in MP concentration over the four months of sampling and analysis (F = 3.96, p > 0.05). So far, there are no reports in the literature specifically addressing the relationship between seasonality and color distribution in MPs, which is a relevant contribution. This information could be useful for implementing preventive strategies based on predominant coloration, especially those potentially associated with greater negative impacts on the quality of biological sludge and its subsequent use in agriculture [1,17,75,79].
The coloration and pigments of MPs could represent a significant factor in the sustainability of wastewater treatment systems. The quality of biological sludge directly affects related processes, such as its use in agriculture as fertilizer or soil conditioner, as well as its disposal in landfills. However, high MP concentrations and the prevalence of certain dyes in MPs reveal the potential degree of contamination, as well as the vulnerability of the sustainable use of biological sludge. This highlights the need to evaluate and control the presence of these contaminants in domestic wastewater discharges to ensure responsible agricultural practices and the protection of ecosystems [17,75,79].
3.4. Morphology of MPs
In WWTPs A and C, fragments were the most common, followed by filaments and granules. Conversely, in WWTP B, filaments were the predominant MPs (Figure 4). Several studies on treatment systems with similar characteristics have documented a higher abundance of plastic fibers, followed by fragments, granules, and films, which aligns with the results of this study [26,29,32,34,36,61,62,63,69,73]. Conversely, another study found that films were the dominant form of microplastics, followed by fragments and fibers [45].
These similarities and differences could be attributed to the type of secondary process underway; for example, Schwinghammer et al. [45] reported that the detected microplastics came from anaerobic systems, which could explain differences compared with aerobic digestion processes. It is important to note that variations in the reported abundance of microplastic morphologies across studies might be influenced by the nature of influent discharges entering the WWTPs. Additionally, these differences can also stem from specific sampling and analysis methodologies employed to extract MPs, owing to the lack of standardized methods [32,69].
In this context, Flores-Munguía et al. [58] identified that in the same WWTPs, the predominant microplastics in influents and effluents were fragments, followed by fibers and granules. However, this study observed an increase in the presence of fibers in sludge samples compared with what was reported by the same authors [58] for influents and effluents.
This behavior could relate to the fact that filamentous particles are composed of polymers of higher density, such as polyethylene terephthalate (PET) [62], which favors their sedimentation and subsequent incorporation into biological sludge during sedimentation processes [32]. Furthermore, due to their particular morphology (characterized by a fine size and elongated structure), MPs can more easily evade conventional filtration systems in WWTPs, increasing their presence in sludge.
In this article, the detected particle size in the sludge was 300 µm, whereas Flores-Munguía et al. [58] reported sizes of 150 and 38 µm in influents and effluents, respectively. This difference could be due to the progressive fragmentation of microplastics throughout the treatment process, especially in the case of fragments.
In the three WWTPs analyzed, no significant differences were observed in the proportion of the different MP morphologies detected in the biological sludge. According to the one-way ANOVA (p > 0.05) (Table 6), these results suggest that regardless of the treatment system, MP morphologies tend to behave similarly regarding their accumulation in biological sludge. The high presence of fragments could be associated with tire degradation [63], the fragmentation of larger plastics, and the use of cosmetic products containing exfoliating particles [69]. Regarding plastic filaments, their presence is mainly associated with laundry residues [32,62,63].
The consistency observed in the morphological distribution of MPs detected in biological sludge over the four months of sampling suggests the existence of a continuous pattern reflecting the nature of the domestic wastewater treated in these WWTPs. This regularity was confirmed through a one-way ANOVA (p > 0.05), which indicated no significant differences in the morphological distribution of MPs throughout the study period (Table 7).
Consequently, it can be inferred that regardless of the season, fragments and fibers are predominantly constant components in the microplastic composition of the biological sludge produced by these secondary treatment systems. It is important to note that the analysis of temporal stability in the morphological distribution of MPs in sludge has not been widely addressed in previous studies [26,29,32,34,36,61,62,63,69,73], representing a relevant opportunity to strengthen the characterization of these emerging contaminants in residual matrices.
The high and constant presence of fragments and fibers in biological sludge constitutes a significant environmental concern, especially considering their potential for reuse in agricultural practices such as soil conditioning or composting [80].
These MPs, in their various morphologies, when present in the organic matrix of sludge, may undergo additional fragmentation during handling, storage, or waste transformation processes, leading to even smaller particles like nanoplastics with greater mobility and transport potential in soils [34,36,51]. Furthermore, exposure to environmental factors, leaching processes, and physicochemical reactions inherent in the treatment or disposal of the sludge can facilitate the release of toxic additives and adsorbed pollutants on MPs’ surfaces, such as heavy metals, polycyclic aromatic hydrocarbons, and persistent organic compounds [17,79].
This combination of factors not only threatens soil quality and biodiversity but also jeopardizes the principles of sustainability associated with the reuse of sludge as organic amendments [1]. Therefore, the presence of MPs in biological sludge poses a significant challenge for its safe valorization and should be considered in environmental risk assessments before its application in agricultural or urban soils [81,82,83]. This issue underscores the urgency of establishing regulatory limits and standardized protocols for the characterization of microplastics in residual matrices with potential use as soil conditioners or in agriculture [69].
3.5. Chemical Characterization of MPs
Figure 5 shows the variety of pure polymers that were used as references for the identification of MPs using differential scanning calorimetry (DSC) in biological sludges from the three WWTPs. Among the most common MPs identified in these WWTPs are HDPE, PP, and PET, as they are semicrystalline polymers. PVC, since it is an amorphous polymer, could not be identified due to detection difficulties in DSC. Several studies using DSC have also reported difficulties in identifying PVC, particularly due to the thermal interference of PET. Therefore, for this specific polymer, techniques such as FTIR, µFTIR, or gas chromatography coupled with mass spectrometry (GC/MS) can be used for confirmation [38,64,66,67,68,70,71,84,85].
For the pure or reference polymers, HDPE showed a melting temperature of 130 °C, while PP and PET showed melting temperatures of 166 and 250 °C, respectively. Majewsky et al. [67] reported similar values for the reference polymers, mainly for PP (164 °C) and PET (250 °C), but not for PE (101 °C). This difference is because the PE used as a reference in this study is of high density. Other studies have reported that HDPE exhibits a higher melting temperature [84].
Figure 6 shows the DSC thermograms of the sludge samples analyzed from the three wastewater treatment plants. The presence of PE, PP, and PET MPs can be observed, showing no significant differences in melting temperature among polymers of the same type. However, some MPs exhibit differences in the intensity of their melting peak; for example, sample WWTP-B-HDPE shows a less intense peak compared with WWTP-A-HDPE and WWTP-C-HDPE microplastics. These results indicate that the polymer chains of the MPs differ in size [67]. The same behavior is observed for PP and PET MPs.
Furthermore, thermal studies for MP identification determined the melting enthalpy of the reference polymers (HDPE, PP, and PET) and the MPs present in the wastewater treatment plants (Table 8 and Table 9). It can be observed that sample WWTP-C-HDPE showed a higher enthalpy (161.73 J/g) compared with WWTP-A-HDPE (145.20 J/g) and WWTP-B-HDPE (121.22 J/g) (Table 9). These results indicate that the crystalline regions of the MPs are degraded, consistent with the melting temperature of the PE samples. PET MPs showed similar behavior to HDPE. Bitter, Lackner, and collaborators [68,85] reported that PET microplastics in environmental samples can exhibit different degrees of crystallinity, which result in varying melting enthalpy values.
In this study, the identification of synthetic polymers in microplastics (MPs) accumulated in biological sludge through DSC coincides with the presence of these emerging contaminants in other matrices where MPs tend to accumulate, such as marine sand [71], seawater [38], WWTP influents and effluents [64,66], and natural waters such as lakes and rivers [70]. It is worth noting that no polystyrene (PS) was detected in this study, unlike in other similar works [64,66,70,71]. This difference may have been because PS commonly occurs in foam form, and in this study, the presence of foams in the three WWTPs was very low compared with other MP morphologies found in greater proportion. Moreover, considering its density range (1.04–1.10 g/cm3) [86], it is likely that PS entering the treatment plants concentrates in the treated effluents and is consequently released into receiving water bodies.
The presence of MPs in agricultural soils has been reported in recent studies, with the most abundant polymers being PE, PP, PET, PVC, and PS [87], suggesting that a possible source of these contaminants could be biological sludges applied as organic or inorganic substrates to improve or use as a soil conditioner.
In this study, the polymers identified coincide with those found in agricultural soils, reinforcing the need to establish control mechanisms and proper management of biological sludge to prevent their contribution to terrestrial ecosystem pollution. Likewise, the use of such sludge for agricultural purposes without adequate regulation could compromise soil quality, highlighting the importance of having updated standards and public policies that define technical criteria and permissible limits for their proper and sustainable management within the context of secondary wastewater treatment systems.
3.6. Monthly and Annual Projections of MPs
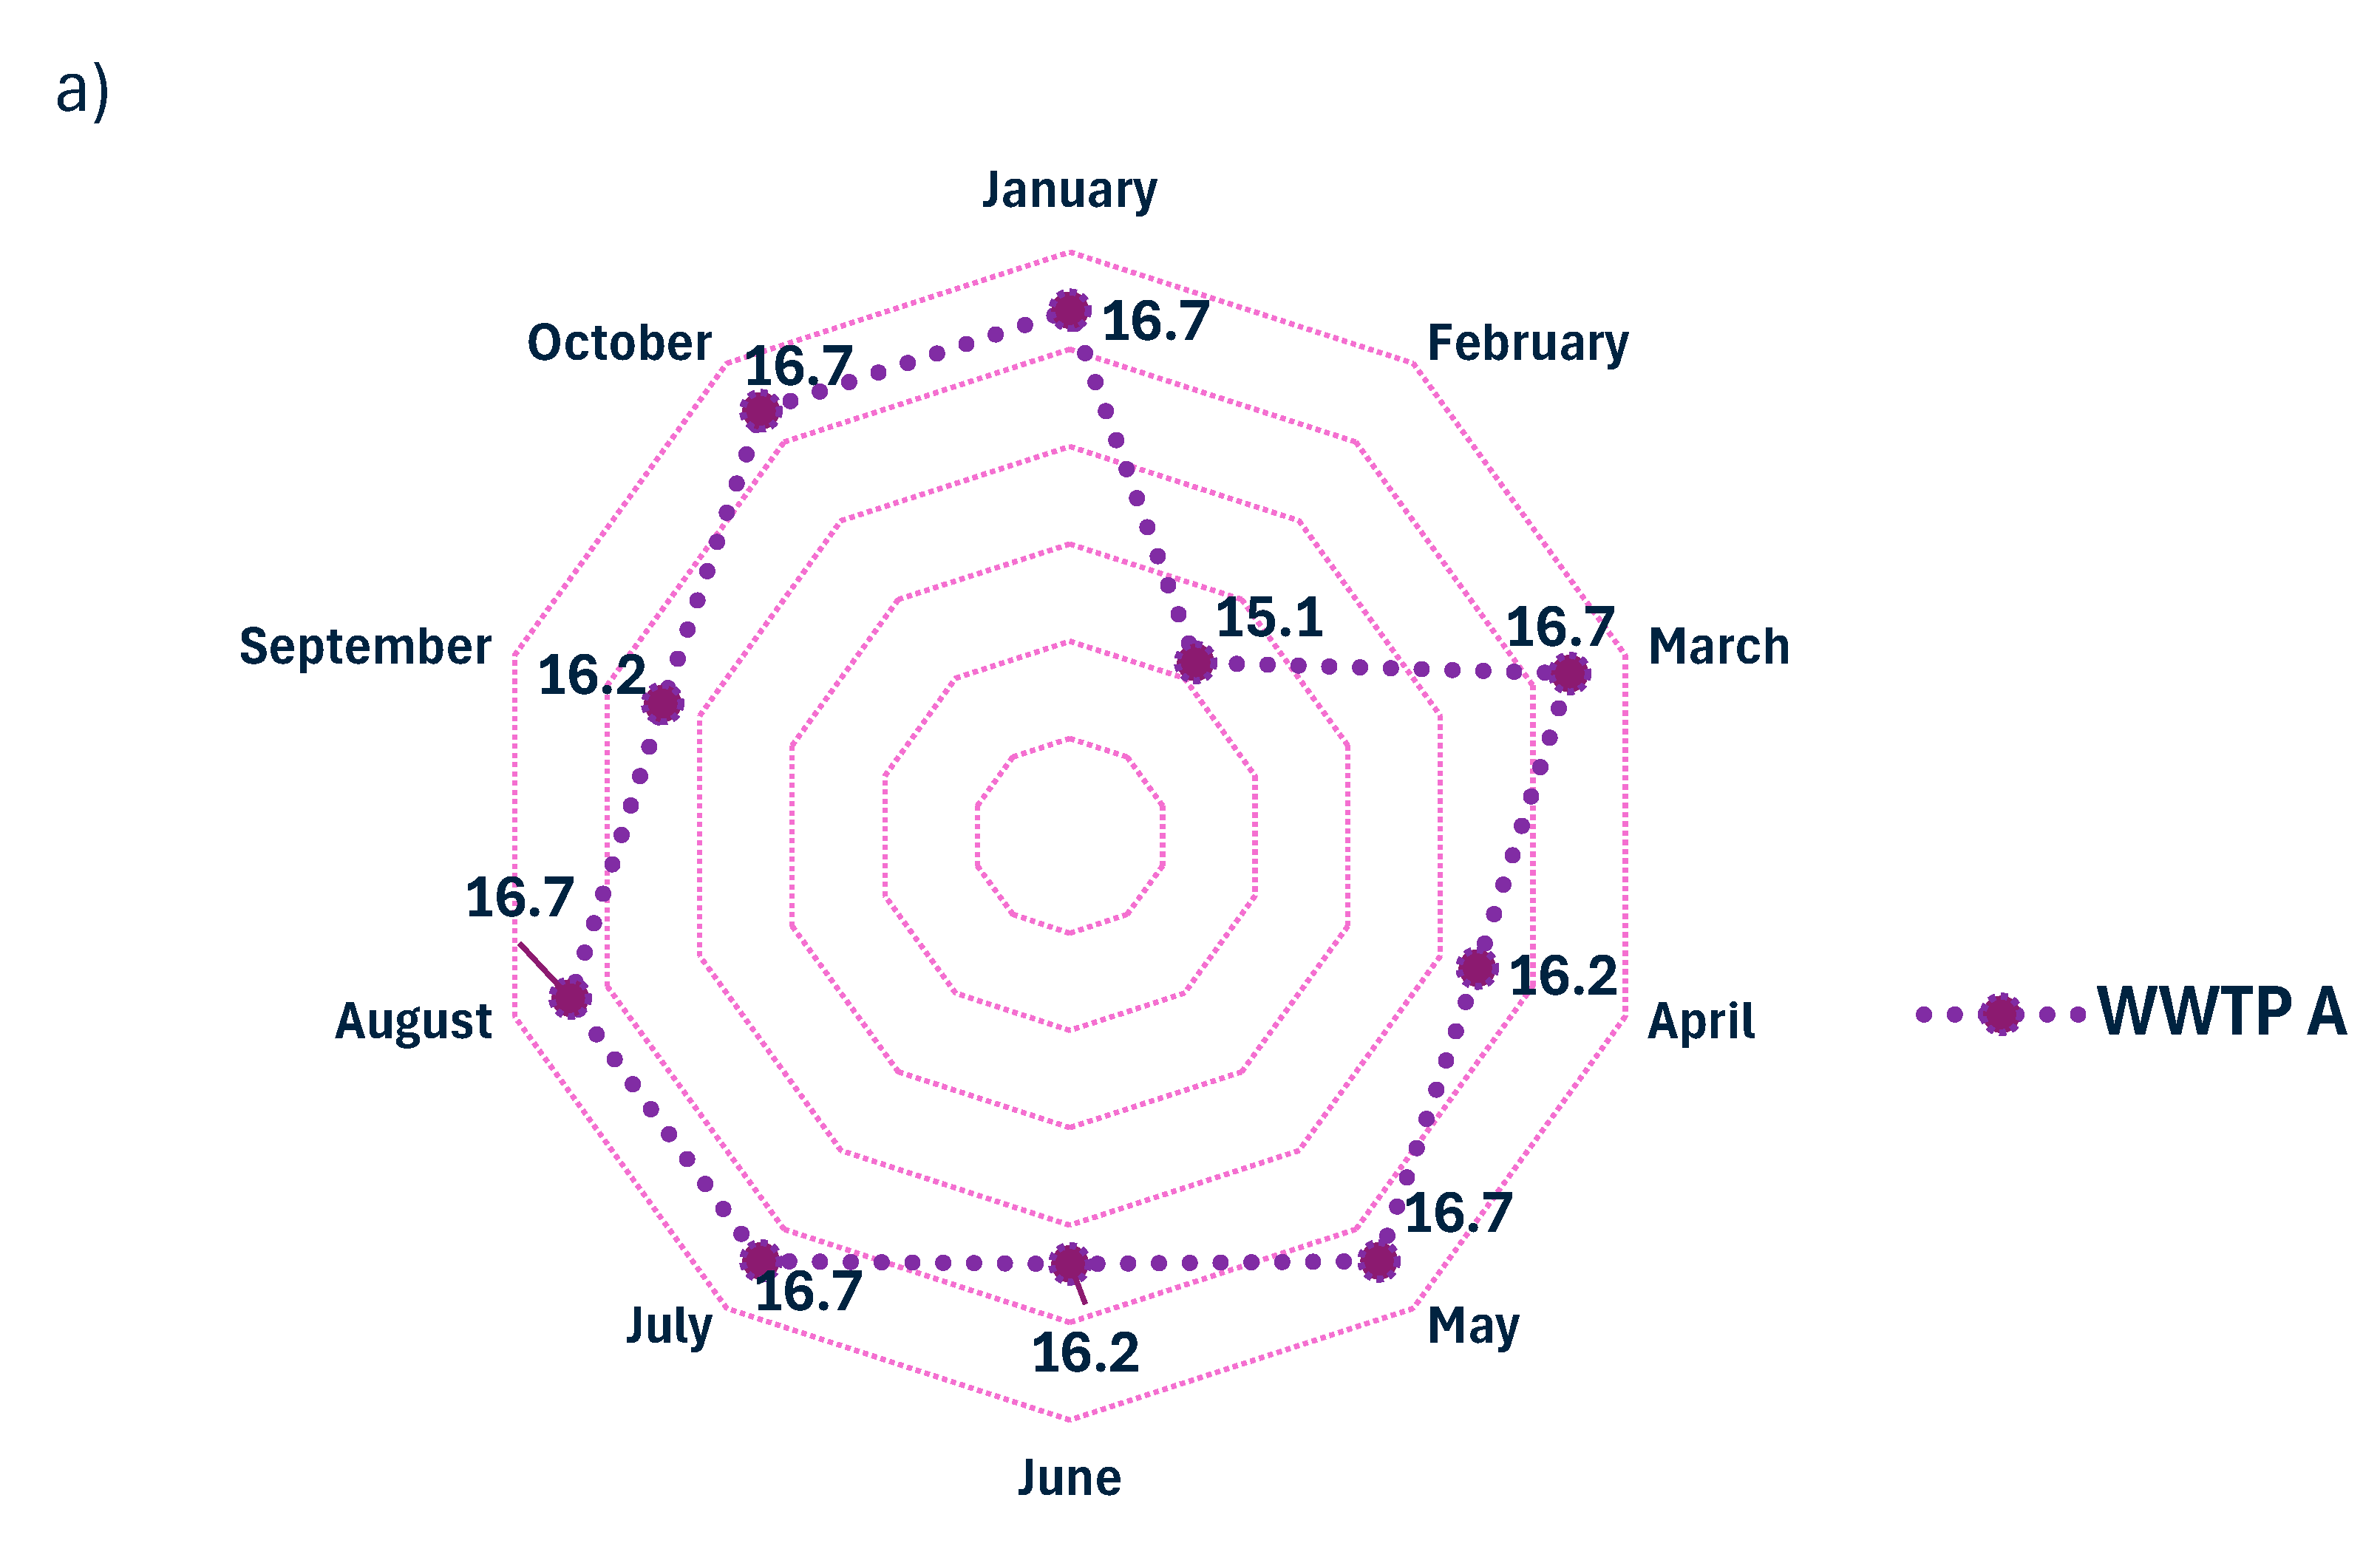
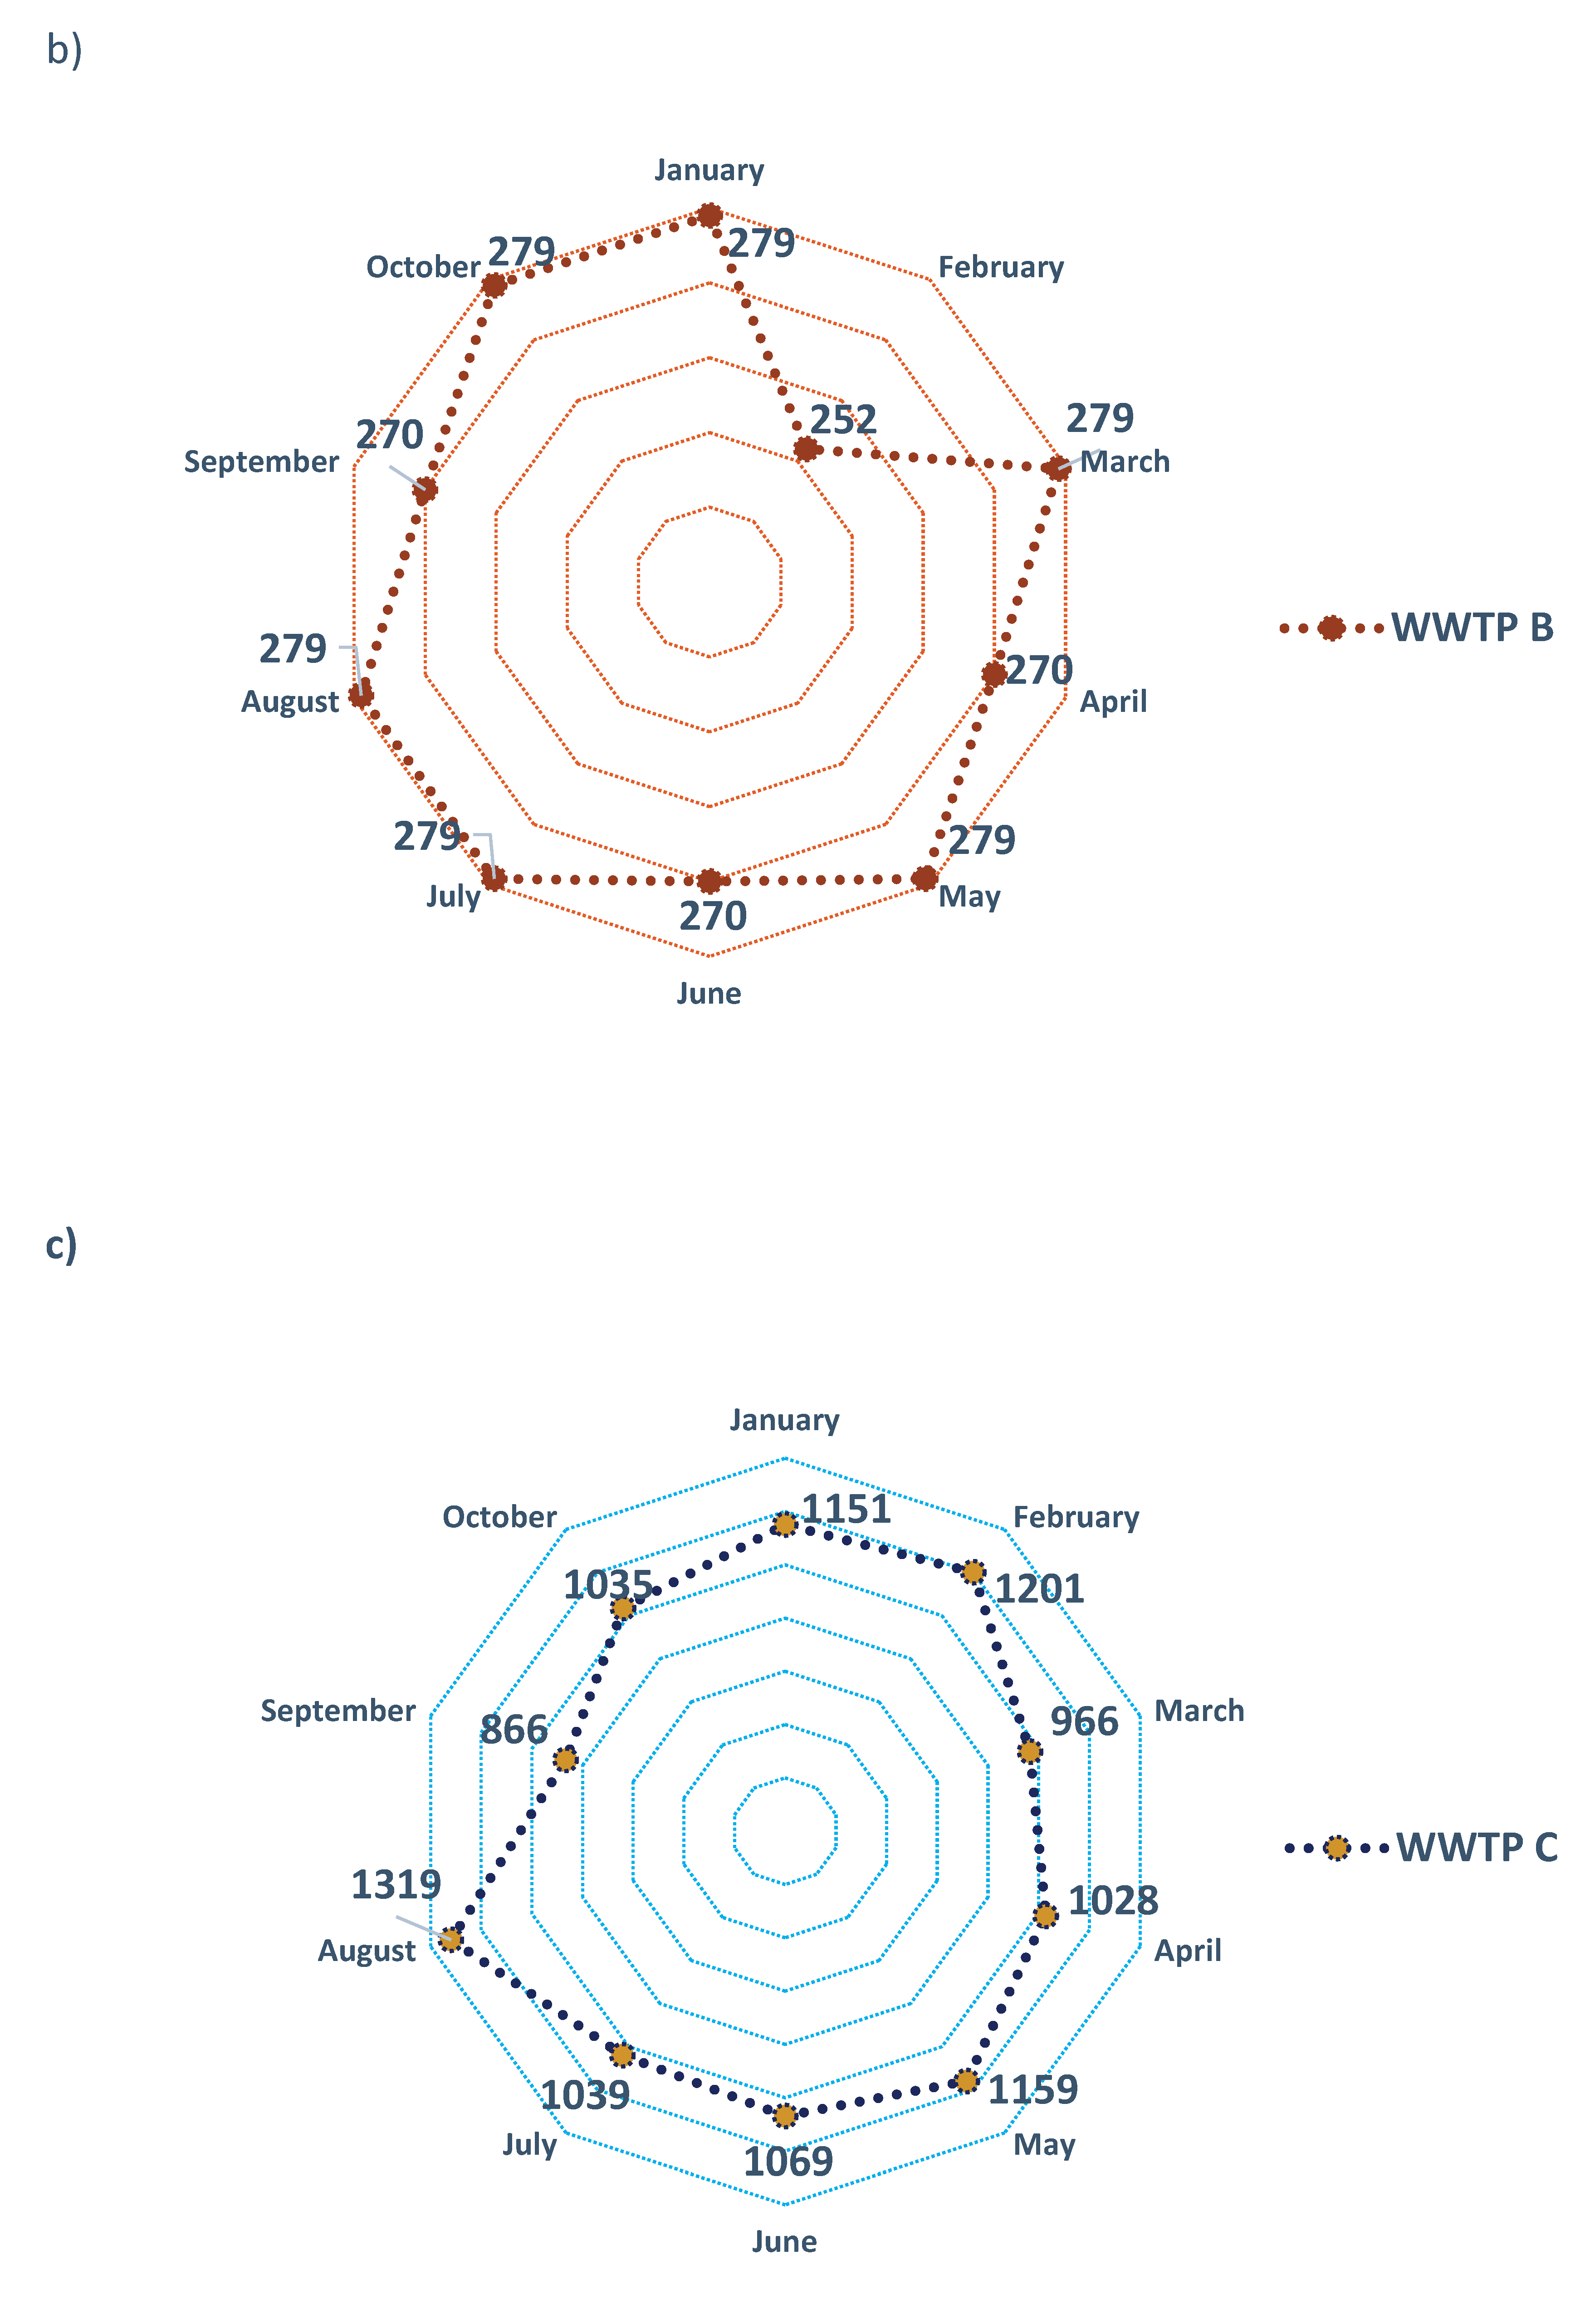
The amounts of sludge generated in the three WWTPs analyzed during the period from January to October 2023 varied according to their design operating capacities. In WWTP A, recorded volumes ranged from 15.1 to 16.7 m3/month; in WWTP B, volumes ranged from 252 to 279 m3/month, while in WWTP C, biological sludge production ranged from 866 to 1319 m3/month (Figure 7).
The size and capacity of these plants are consistent with those of other facilities reported in various countries operating with secondary treatment systems based on biological sludge [28,29,69,88,89,90]. During primary and secondary sedimentation stages, approximately 75% to 99% of MPs present in the influents are retained [44]. In this context, the concentrations of MPs detected in the biological sludge analyzed in this study are consistent with the removal efficiencies previously reported by Flores-Munguía et al. for the same WWTPs [58], suggesting a high degree of consistency between removal data and the accumulation of MPs in the generated by-products.
Figure 7.
Monthly production of biological sludge (m3) in (a) WWTP A, (b) WWTP B, and (c) WWTP C.
The monthly estimates of generated MPs were calculated based on the values obtained from point sampling and the average monthly sludge volumes produced by the WWTPs. The results indicate ranges from 13.4 × 10⁶ to 123 × 10⁶ particles for WWTP A, 325 × 10⁶ to 2511 × 10⁶ for WWTP B, and 1517 × 10⁶ to 5361 × 10⁶ for WWTP C (Figure 8).
These figures show a notable increase during September and October, which coincides with the rainy season during the study period. This suggests that stormwater runoff may significantly contribute to the MP load entering the WWTPs. Consequently, the increase in MP concentrations in biological sludge appears to be directly related to the higher inflow of these contaminants in the influents, as sedimentation processes act as the main retention pathway.
While these figures provide an approximation of the magnitude of MP accumulation in sludges, it is important to note that the accuracy of these values could be improved through the implementation of composite sampling at different time points of the plants’ daily operational cycles. Other studies have also reported monthly projections of MPs in biological sludge in the order of 1.38 × 10¹⁰ items [74], 1.37 × 10¹¹ items [41], and even 1.30 × 10¹3 items [59,62]. Conversely, some studies did not provide monthly projections for these contaminants [61,66,73].
The differences observed between the estimates in this study and those reported in the literature can be mainly attributed to the specific characteristics and operational scales of the WWTPs analyzed. Despite these variations, the present study is consistent with previous research in confirming that the concentration of MPs in biological sludge is considerably high. Furthermore, variability in sampling and analytical criteria across studies contributes to the dispersion of results, highlighting the need to establish standardized protocols to ensure the comparability and robustness of data generated in this field.
Annual projections (Figure 9) demonstrate that biological sludge accumulates high concentrations of MPs of various shapes and compositions. Like the findings of this study, other studies have reported annual estimates of MPs in biological sludge ranging from 3 × 10⁵ items [91], 5.67 × 10⁹ items [51], and 1.76 × 10¹2 items [41] up to 1.56 × 10¹⁴ items in WWTPs in China [59,62].
These projections indicate that biological sludge could represent an important source of MP pollution in agricultural soils [87]. The presence of MPs in these soils could seriously affect environmental sustainability, as synthetic polymers compromise soil integrity, biodiversity, and food security in the medium and long terms [84,87]. Therefore, given the current MP concentrations in biological sludger, they can hardly be considered suitable for agricultural reuse or for ensuring the sustainable management of wastewater treatment systems.
It is worth noting that this study considered MPs with sizes of around 300 µm, meaning that the presented projections correspond exclusively to this particle size range. Consequently, the total amount of MPs in biological sludge is likely to be significantly higher when particles of other sizes are included. Future research should therefore focus on providing a comprehensive and accurate assessment of the magnitude and implications of this emerging contaminant.
4. Conclusions
This study revealed significantly high concentrations of MPs in biological sludge from wastewater treatment plants, posing critical challenges for their use, sustainable agricultural reuse, and final disposal as solid waste. The high accumulation of MPs in sludge represents a serious risk to soil quality, crop safety, and terrestrial ecosystem conservation, thereby limiting their potential for sustainable reuse in agro-environmental contexts.
It is therefore essential to update regulatory protocols and technological criteria for implementing mitigation strategies aimed at reducing MP concentrations and their release into the environment. In the Mexican context, it is necessary to comprehensively revise NOM-004-SEMARNAT-2002, incorporating microplastics as emerging indicators of sludge and solid waste quality. Updating this regulation will ensure that sludge management and reuse align with sustainability principles and contribute to the conservation of terrestrial ecosystems.
Finally, it is crucial to continue strengthening research efforts to generate reliable scientific data, enabling the development of standardized protocols for MP measurement and projection in biological sludge. Such advancements will support sustainable practices, informed decision-making, and the formulation and implementation of public policies oriented toward environmental sustainability and the preservation of environmental quality.
Author Contributions
Conceptualization, J.S.-H., E.J.F.-M. and A.A.-S.; methodology, J.S.-H., E.J.F.-M., A.A.-S. and A.R.-H.; software, J.S.-H. and E.J.F.-M.; validation, J.S.-H., E.J.F.-M.,A.A.-S., A.R.-H., D.E.P.-C. and N.F.M.-A.; formal analysis, J.S.-H., E.J.F.-M.,A.A.-S., A.R.-H., D.E.P.-C. and N.F.M.-A.; investigation, J.S.-H., E.J.F.-M.,A.A.-S., A.R.-H., D.E.P.-C. and N.F.M.-A.; resources, J.S.-H., E.J.F.-M.,A.A.-S., and A.R.-H.; data curation, J.S.-H., E.J.F.-M. and A.A.-S.; writing—original draft preparation, J.S.-H., E.J.F.-M.,A.A.-S., A.R.-H., D.E.P.-C., N.F.M.-A. and R.M.B.-C.; writing—review and editing, J.S.-H., E.J.F.-M., A.A.-S., A.R.-H., D.E.P.-C., and R.M.B.-C; visualization, D.E.P.-C., N.F.M.-A. and R.M.B.-C.; supervision, J.S.-H., E.J.F.-M., A.A.-S. and A.R.-H. All authors have read and agreed to the published version of the manuscript.
Funding
This research received no external funding.
Data Availability Statement
All data presented in this research are contained in the article.
Acknowledgments
The authors thank the technical and administrative staff of the Comisión de Agua Potable y Alcantarillado del Municipio de Acapulco (C.A.P.A.M.A.) for their support and the facilities provided to access the wastewater treatment plants.
Conflicts of Interest
The authors declare no conflict of interest.
References
- G Ghosh, S.; Sinha, J.K.; Ghosh, S.; Vashisth, K.; Han, S.; Bhaskar, R. Microplastics as an Emerging Threat to the Global Environment and Human Health. Sustainability 2023, 15, 10821. [Google Scholar] [CrossRef]
- Isobe, A.; Iwasaki, S.; Uchida, K.; Tokai, T. Abundance of Non-Conservative Microplastics in the Upper Ocean from 1957 to 2066. Nat Commun 2019, 10, 417. [Google Scholar] [CrossRef] [PubMed]
- Bucci, K.; Tulio, M.; Rochman, C.M. What Is Known and Unknown about the Effects of Plastic Pollution: A Meta-Analysis and Systematic Review. Ecological Applications 2020, 30, e02044. [Google Scholar] [CrossRef] [PubMed]
- Deme, G.G.; Ewusi-Mensah, D.; Olagbaju, O.A.; Okeke, E.S.; Okoye, C.O.; Odii, E.C.; Ejeromedoghene, O.; Igun, E.; Onyekwere, J.O.; Oderinde, O.K.; et al. Macro Problems from Microplastics: Toward a Sustainable Policy Framework for Managing Microplastic Waste in Africa. Science of The Total Environment 2022, 804, 150170. [Google Scholar] [CrossRef] [PubMed]
- Hale, R.C.; Seeley, M.E.; La Guardia, M.J.; Mai, L.; Zeng, E.Y. A Global Perspective on Microplastics. Journal of Geophysical Research: Oceans 2020, 125, e2018JC014719. [Google Scholar] [CrossRef]
- Can-Güven, E. Microplastics as Emerging Atmospheric Pollutants: A Review and Bibliometric Analysis. Air Qual Atmos Health 2021, 14, 203–215. [Google Scholar] [CrossRef]
- Brennecke, D.; Duarte, B.; Paiva, F.; Caçador, I.; Canning-Clode, J. Microplastics as Vector for Heavy Metal Contamination from the Marine Environment. Estuarine, Coastal and Shelf Science 2016, 178, 189–195. [Google Scholar] [CrossRef]
- Li, J.; Gao, F.; Zhang, D.; Cao, W.; Zhao, C. Zonal Distribution Characteristics of Microplastics in the Southern Indian Ocean and the Influence of Ocean Current. Journal of Marine Science and Engineering 2022, 10, 290. [Google Scholar] [CrossRef]
- Halfar, J.; Brožová, K.; Čabanová, K.; Heviánková, S.; Kašpárková, A.; Olšovská, E. Disparities in Methods Used to Determine Microplastics in the Aquatic Environment: A Review of Legislation, Sampling Process and Instrumental Analysis. International Journal of Environmental Research and Public Health 2021, 18, 7608. [Google Scholar] [CrossRef]
- Kyriakopoulos, G.L.; Zamparas, M.G.; Kapsalis, V.C. Investigating the Human Impacts and the Environmental Consequences of Microplastics Disposal into Water Resources. Sustainability 2022, 14, 828. [Google Scholar] [CrossRef]
- Alvarez-Zeferino, J.C.; Ojeda-Benítez, S.; Cruz-Salas, A.A.; Martínez-Salvador, C.; Vázquez-Morillas, A. Microplastics in Mexican Beaches. Resources, Conservation and Recycling 2020, 155, 104633. [Google Scholar] [CrossRef]
- Thomas, D.; Schütze, B.; Heinze, W.M.; Steinmetz, Z. Sample Preparation Techniques for the Analysis of Microplastics in Soil—A Review. Sustainability 2020, 12, 9074. [Google Scholar] [CrossRef]
- Kim, S.W.; An, Y.-J. Soil Microplastics Inhibit the Movement of Springtail Species. Environment International 2019, 126, 699–706. [Google Scholar] [CrossRef] [PubMed]
- de Souza Machado, A.A.; Kloas, W.; Zarfl, C.; Hempel, S.; Rillig, M.C. Microplastics as an Emerging Threat to Terrestrial Ecosystems. Global Change Biology 2018, 24, 1405–1416. [Google Scholar] [CrossRef] [PubMed]
- He, D.; Luo, Y.; Lu, S.; Liu, M.; Song, Y.; Lei, L. Microplastics in Soils: Analytical Methods, Pollution Characteristics and Ecological Risks. TrAC Trends in Analytical Chemistry 2018, 109, 163–172. [Google Scholar] [CrossRef]
- Corti, A.; Vinciguerra, V.; Iannilli, V.; Pietrelli, L.; Manariti, A.; Bianchi, S.; Petri, A.; Cifelli, M.; Domenici, V.; Castelvetro, V. Thorough Multianalytical Characterization and Quantification of Micro- and Nanoplastics from Bracciano Lake’s Sediments. Sustainability 2020, 12, 878. [Google Scholar] [CrossRef]
- Campanale, C.; Massarelli, C.; Savino, I.; Locaputo, V.; Uricchio, V.F. A Detailed Review Study on Potential Effects of Microplastics and Additives of Concern on Human Health. International Journal of Environmental Research and Public Health 2020, 17, 1212. [Google Scholar] [CrossRef]
- Kwon, J.-H.; Chang, S.; Hong, S.H.; Shim, W.J. Microplastics as a Vector of Hydrophobic Contaminants: Importance of Hydrophobic Additives. Integr Environ Assess Manag 2017, 13, 494–499. [Google Scholar] [CrossRef]
- Barboza, L.G.A.; Lopes, C.; Oliveira, P.; Bessa, F.; Otero, V.; Henriques, B.; Raimundo, J.; Caetano, M.; Vale, C.; Guilhermino, L. Microplastics in Wild Fish from North East Atlantic Ocean and Its Potential for Causing Neurotoxic Effects, Lipid Oxidative Damage, and Human Health Risks Associated with Ingestion Exposure. Science of The Total Environment 2020, 717, 134625. [Google Scholar] [CrossRef]
- Pandey, B.; Pathak, J.; Singh, P.; Kumar, R.; Kumar, A.; Kaushik, S.; Thakur, T.K. Microplastics in the Ecosystem: An Overview on Detection, Removal, Toxicity Assessment, and Control Release. Water 2023, 15, 51. [Google Scholar] [CrossRef]
- Cuthbert, R.N.; Al-Jaibachi, R.; Dalu, T.; Dick, J.T.A.; Callaghan, A. The Influence of Microplastics on Trophic Interaction Strengths and Oviposition Preferences of Dipterans. Science of The Total Environment 2019, 651, 2420–2423. [Google Scholar] [CrossRef]
- Prüst, M.; Meijer, J.; Westerink, R.H.S. The Plastic Brain: Neurotoxicity of Micro- and Nanoplastics. Particle and Fibre Toxicology 2020, 17, 24. [Google Scholar] [CrossRef] [PubMed]
- Yan, J.; Yao, S.; Zhang, T.; Ye, Z.; Weng, J.; Hu, X.; Zhang, K. Microplastics and Their Impacts on Organisms and Trophic Chains. Water 2022, 14, 4069. [Google Scholar] [CrossRef]
- Cverenkárová, K.; Valachovičová, M.; Mackuľak, T.; Žemlička, L.; Bírošová, L. Microplastics in the Food Chain. Life 2021, 11, 1349. [Google Scholar] [CrossRef] [PubMed]
- Talvitie, J.; Mikola, A.; Setälä, O.; Heinonen, M.; Koistinen, A. How Well Is Microlitter Purified from Wastewater? – A Detailed Study on the Stepwise Removal of Microlitter in a Tertiary Level Wastewater Treatment Plant. Water Research 2017, 109, 164–172. [Google Scholar] [CrossRef]
- Liu, X.; Yuan, W.; Di, M.; Li, Z.; Wang, J. Transfer and Fate of Microplastics during the Conventional Activated Sludge Process in One Wastewater Treatment Plant of China. Chemical Engineering Journal 2019, 362, 176–182. [Google Scholar] [CrossRef]
- Zhang, X.; Chen, J.; Li, J. The Removal of Microplastics in the Wastewater Treatment Process and Their Potential Impact on Anaerobic Digestion Due to Pollutants Association. Chemosphere 2020, 251, 126360. [Google Scholar] [CrossRef]
- Sadia, M.; Mahmood, A.; Ibrahim, M.; Irshad, M.K.; Quddusi, A.H.A.; Bokhari, A.; Mubashir, M.; Chuah, L.F.; Show, P.L. Microplastics Pollution from Wastewater Treatment Plants: A Critical Review on Challenges, Detection, Sustainable Removal Techniques and Circular Economy. Environmental Technology & Innovation 2022, 28, 102946. [Google Scholar] [CrossRef]
- Zhang, Z.; Chen, Y. Effects of Microplastics on Wastewater and Sewage Sludge Treatment and Their Removal: A Review. Chemical Engineering Journal 2020, 382, 122955. [Google Scholar] [CrossRef]
- Enfrin, M.; Dumée, L.F.; Lee, J. Nano/Microplastics in Water and Wastewater Treatment Processes – Origin, Impact and Potential Solutions. Water Research 2019, 161, 621–638. [Google Scholar] [CrossRef]
- Carr, S.A.; Liu, J.; Tesoro, A.G. Transport and Fate of Microplastic Particles in Wastewater Treatment Plants. Water Research 2016, 91, 174–182. [Google Scholar] [CrossRef]
- U. Iyare, P.; K. Ouki, S.; Bond, T. Microplastics Removal in Wastewater Treatment Plants: A Critical Review. Environmental Science: Water Research & Technology 2020, 6, 2664–2675. [Google Scholar] [CrossRef]
- Park, H.; Park, B. Review of Microplastic Distribution, Toxicity, Analysis Methods, and Removal Technologies. Water 2021, 13, 2736. [Google Scholar] [CrossRef]
- Mabadahanye, K.; Dalu, M.T.B.; Dalu, T. Occurrence and Removal of Microplastics in Wastewater Treatment Plants: Perspectives on Shape, Type, and Density. Water 2024, 16, 1750. [Google Scholar] [CrossRef]
- Malematja, K.C.; Melato, F.A.; Mokgalaka-Fleischmann, N.S. The Occurrence and Fate of Microplastics in Wastewater Treatment Plants in South Africa and the Degradation of Microplastics in Aquatic Environments—A Critical Review. Sustainability 2023, 15, 16865. [Google Scholar] [CrossRef]
- Dronjak, L.; Exposito, N.; Sierra, J.; Schuhmacher, M.; Florencio, K.; Corzo, B.; Rovira, J. Tracing the Fate of Microplastic in Wastewater Treatment Plant: A Multi-Stage Analysis of Treatment Units and Sludge. Environmental Pollution 2023, 333, 122072. [Google Scholar] [CrossRef] [PubMed]
- Fältström, E.; Olesen, K.B.; Anderberg, S. Microplastic Types in the Wastewater System—A Comparison of Material Flow-Based Source Estimates and the Measurement-Based Load to a Wastewater Treatment Plant. Sustainability 2021, 13, 5404. [Google Scholar] [CrossRef]
- Rodríguez Chialanza, M.; Sierra, I.; Pérez Parada, A.; Fornaro, L. Identification and Quantitation of Semi-Crystalline Microplastics Using Image Analysis and Differential Scanning Calorimetry. Environ Sci Pollut Res 2018, 25, 16767–16775. [Google Scholar] [CrossRef]
- Blaira, R.M.; Waldrona, S.; Gauchotte-Lindsay, C. Average Daily Flow of Microplastics through a Tertiary Wastewater Treatment Plant over a Ten-Month Period. Water Research 2019, 163, 114909. [Google Scholar] [CrossRef]
- Galafassi, S.; Di Cesare, A.; Di Nardo, L.; Sabatino, R.; Valsesia, A.; Fumagalli, F.S.; Corno, G.; Volta, P. Microplastic Retention in Small and Medium Municipal Wastewater Treatment Plants and the Role of the Disinfection. Environ Sci Pollut Res 2022, 29, 10535–10546. [Google Scholar] [CrossRef]
- Gies, E.A.; LeNoble, J.L.; Noël, M.; Etemadifar, A.; Bishay, F.; Hall, E.R.; Ross, P.S. Retention of Microplastics in a Major Secondary Wastewater Treatment Plant in Vancouver, Canada. Marine Pollution Bulletin 2018, 133, 553–561. [Google Scholar] [CrossRef]
- Lv, X.; Dong, Q.; Zuo, Z.; Liu, Y.; Huang, X.; Wu, W.-M. Microplastics in a Municipal Wastewater Treatment Plant: Fate, Dynamic Distribution, Removal Efficiencies, and Control Strategies. Journal of Cleaner Production 2019, 225, 579–586. [Google Scholar] [CrossRef]
- Sun, J.; Dai, X.; Wang, Q.; Van Loosdrecht, M.C.M.; Ni, B.-J. Microplastics in Wastewater Treatment Plants: Detection, Occurrence and Removal. Water Research 2019, 152, 21–37. [Google Scholar] [CrossRef]
- Cristaldi, A.; Fiore, M.; Zuccarello, P.; Oliveri Conti, G.; Grasso, A.; Nicolosi, I.; Copat, C.; Ferrante, M. Efficiency of Wastewater Treatment Plants (WWTPs) for Microplastic Removal: A Systematic Review. International Journal of Environmental Research and Public Health 2020, 17, 8014. [Google Scholar] [CrossRef] [PubMed]
- Schwinghammer, L.; Krause, S.; Schaum, C. Determination of Large Microplastics: Wet-Sieving of Dewatered Digested Sludge, Co-Substrates, and Compost. Water Science and Technology 2020, 84, 384–392. [Google Scholar] [CrossRef] [PubMed]
- Koutnik, V.S.; Alkidim, S.; Leonard, J.; DePrima, F.; Cao, S.; Hoek, E.M.V.; Mohanty, S.K. Unaccounted Microplastics in Wastewater Sludge: Where Do They Go? ACS EST Water 2021, 1, 1086–1097. [Google Scholar] [CrossRef]
- Cydzik-Kwiatkowska, A.; Milojevic, N.; Jachimowicz, P. The Fate of Microplastic in Sludge Management Systems. Science of The Total Environment 2022, 848, 157466. [Google Scholar] [CrossRef]
- Hatinoğlu, M.D.; Sanin, F.D. Sewage Sludge as a Source of Microplastics in the Environment: A Review of Occurrence and Fate during Sludge Treatment. Journal of Environmental Management 2021, 295, 113028. [Google Scholar] [CrossRef]
- Wei, W.; Chen, X.; Ni, B.-J. Different Pathways of Microplastics Entering the Sludge Treatment System Distinctively Affect Anaerobic Sludge Fermentation Processes. Environ. Sci. Technol. 2021, 55, 11274–11283. [Google Scholar] [CrossRef]
- Kong, W.; Jalalah, M.; Alsareii, S.A.; Harraz, F.A.; Almadiy, A.A.; Zheng, Y.; Thakur, N.; Salama, E.-S. Microplastics (MPs) in Wastewater Treatment Plants Sludges: Substrates, Digestive Properties, Microbial Communities, Mechanisms, and Treatments. Journal of Environmental Chemical Engineering 2023, 11, 111408. [Google Scholar] [CrossRef]
- Contreras-Llin, A.; Carrera, J.; Diaz-Cruz, M.S. Navigating Microplastics in Wastewater Treatment: Understanding Analysis, Mitigation, Removal Strategies, Impact, and Current Knowledge Gaps. Journal of Environmental Chemical Engineering 2024, 12, 114792. [Google Scholar] [CrossRef]
- Uddin, S.; Behbehani, M.; Habibi, N.; Faizuddin, M.; Al-Murad, M.; Martinez-Guijarro, K.; Al-Sarawi, H.A.; Karam, Q. Microplastics in Kuwait’s Wastewater Streams. Sustainability 2022, 14, 15817. [Google Scholar] [CrossRef]
- Cesaro, A.; Pirozzi, F.; Zafırakou, A.; Alexandraki, A. Microplastics in Sewage Sludge Destined to Anaerobic Digestion: The Potential Role of Thermal Pretreatment. Chemosphere 2022, 309, 136669. [Google Scholar] [CrossRef]
- Lessa Belone, M.C.; Kokko, M.; Sarlin, E. Degradation of Common Polymers in Sewage Sludge Purification Process Developed for Microplastic Analysis. Environmental Pollution 2021, 269, 116235. [Google Scholar] [CrossRef]
- Zhang, B.; Huang, S.; Wu, L.; Guo, Y.; Shi, W.; Lens, P.N.L. Micro(Nano)Plastic Size and Concentration Co-Differentiate the Treatment Performance and Toxicity Mechanism in Aerobic Granular Sludge Systems. Chemical Engineering Journal 2023, 457, 141212. [Google Scholar] [CrossRef]
- Shin, S.-K.; Um, N.; Kim, Y.-J.; Cho, N.-H.; Jeon, T.-W. New Policy Framework with Plastic Waste Control Plan for Effective Plastic Waste Management. Sustainability 2020, 12, 6049. [Google Scholar] [CrossRef]
- Diario Oficial de la Federación. NORMA Oficial Mexicana NOM-004-SEMARNAT-2002, Protección Ambiental.- Lodos y Biosólidos.-Especificaciones y Límites Máximos Permisibles de Contaminantes Para Su Aprovechamiento y Disposición Final. Available online: https://dof.gob.mx/nota_detalle.php?codigo=691939&fecha=15/08/2003#gsc.tab=0 (accessed on 10 January 2025).
- Flores-Munguía, E.J.; Rosas-Acevedo, J.L.; Ramírez-Hernández, A.; Aparicio-Saguilan, A.; Brito-Carmona, R.M.; Violante-González, J. Release of Microplastics from Urban Wastewater Treatment Plants to Aquatic Ecosystems in Acapulco, Mexico. Water 2023, 15, 3643. [Google Scholar] [CrossRef]
- Yang, L.; Li, K.; Cui, S.; Kang, Y.; An, L.; Lei, K. Removal of Microplastics in Municipal Sewage from China’s Largest Water Reclamation Plant. Water Research 2019, 155, 175–181. [Google Scholar] [CrossRef]
- Masura, J.; Baker, J.; Foster, G.; Arthur, C. Laboratory Methods for the Analysis of Microplastics in the Marine Environment: Recommendations for Quantifying Synthetic Particles in Waters and Sediments.; NOAA Marine Debris Division, 2015.
- Bretas-Alvim, C.; Bes-Piá, M.A.; Mendoza-Roca, J.A. Separation and Identification of Microplastics from Primary and Secondary Effluents and Activated Sludge from Wastewater Treatment Plants. Chemical Engineering Journal 2020, 402, 126293. [Google Scholar] [CrossRef]
- Li, X.; Chen, L.; Mei, Q.; Dong, B.; Dai, X.; Ding, G.; Zeng, E.Y. Microplastics in Sewage Sludge from the Wastewater Treatment Plants in China. Water Research 2018, 142, 75–85. [Google Scholar] [CrossRef]
- Lee, H.; Kim, Y. Treatment Characteristics of Microplastics at Biological Sewage Treatment Facilities in Korea. Marine Pollution Bulletin 2018, 137, 1–8. [Google Scholar] [CrossRef]
- Lee, J.; Yoon, S.; Jang, T.; Choi, J.-H.; Kim, N.; Kim, H.-O.; Lim, K.S.; Ha, S.-J.; Park, J.-A. A Facile Approach to Microplastic Identification and Quantification Using Differential Scanning Calorimetry. Science of The Total Environment 2024, 957, 177456. [Google Scholar] [CrossRef]
- Hidalgo-Ruz, V.; Gutow, L.; Thompson, R.C.; Thiel, M. Microplastics in the Marine Environment: A Review of the Methods Used for Identification and Quantification. Environ. Sci. Technol. 2012, 46, 3060–3075. [Google Scholar] [CrossRef]
- Hernández-Fernández, J.; Cano, H.; Guerra, Y.; Puello Polo, E.; Ríos-Rojas, J.F.; Vivas-Reyes, R.; Oviedo, J. Identification and Quantification of Microplastics in Effluents of Wastewater Treatment Plant by Differential Scanning Calorimetry (DSC). Sustainability 2022, 14, 4920. [Google Scholar] [CrossRef]
- Majewsky, M.; Bitter, H.; Eiche, E.; Horn, H. Determination of Microplastic Polyethylene (PE) and Polypropylene (PP) in Environmental Samples Using Thermal Analysis (TGA-DSC). Science of The Total Environment 2016, 568, 507–511. [Google Scholar] [CrossRef] [PubMed]
- Bitter, H.; Lackner, S. Fast and Easy Quantification of Semi-Crystalline Microplastics in Exemplary Environmental Matrices by Differential Scanning Calorimetry (DSC). Chemical Engineering Journal 2021, 423, 129941. [Google Scholar] [CrossRef]
- Collivignarelli, M.C.; Carnevale Miino, M.; Caccamo, F.M.; Milanese, C. Microplastics in Sewage Sludge: A Known but Underrated Pathway in Wastewater Treatment Plants. Sustainability 2021, 13, 12591. [Google Scholar] [CrossRef]
- Abbasi, S.; Razeghi, N.; Yousefi, M.R.; Podkościelna, B.; Oleszczuk, P. Microplastics Identification in Water by TGA–DSC Method: Maharloo Lake, Iran. Environmental Science and Pollution Research 2023, 25, 67008–67018. [Google Scholar] [CrossRef]
- Schirrmeister, S.; Kurzweg, L.; Gjashta, X.; Socher, M.; Fery, A.; Harre, K. Regression Analysis for the Determination of Microplastics in Sediments Using Differential Scanning Calorimetry. Environ Sci Pollut Res 2024, 31, 31001–31014. [Google Scholar] [CrossRef]
- Singh, S.; Kalyanasundaram, M.; Diwan, V. Removal of Microplastics from Wastewater: Available Techniques and Way Forward. Water Science and Technology 2021, 84, 3689–3704. [Google Scholar] [CrossRef]
- Mahon, A.M.; O’Connell, B.; Healy, M.G.; O’Connor, I.; Officer, R.; Nash, R.; Morrison, L. Microplastics in Sewage Sludge: Effects of Treatment. Environ. Sci. Technol. 2017, 51, 810–818. [Google Scholar] [CrossRef]
- Lares, M.; Chaker Ncibi, M.; Sillanpa, M.; Sillanpa, M. Occurrence, Identification and Removal of Microplastic Particles and Fibers in Conventional Activated Sludge Process and Advanced MBR Technology. Water Research 2018, 133, 236–246. [Google Scholar] [CrossRef] [PubMed]
- Turner, A.; Filella, M. Hazardous Metal Additives in Plastics and Their Environmental Impacts. Environment International 2021, 156, 106622. [Google Scholar] [CrossRef] [PubMed]
- Martí, E.; Martin, C.; Galli, M.; Echevarría, F.; Duarte, C.M.; Cózar, A. The Colors of the Ocean Plastics. Environ. Sci. Technol. 2020, 54, 6594–6601. [Google Scholar] [CrossRef] [PubMed]
- Al-Malaika, S.; Axtell, F.; Rothon, R.; Gilbert, M. Chapter 7 - Additives for Plastics. In Brydson’s Plastics Materials (Eighth Edition); Butterworth-Heinemann, 2017; pp. 127–168 ISBN 978-0-323-35824-8.
- Tanaka, K.; Takada, H.; Ikenaka, Y.; Nakayama, S.M.M.; Ishizuka, M. Occurrence and Concentrations of Chemical Additives in Plastic Fragments on a Beach on the Island of Kauai, Hawaii. Marine Pollution Bulletin 2020, 150, 110732. [Google Scholar] [CrossRef]
- Catrouillet, C.; Davranche, M.; Khatib, I.; Fauny, C.; Wahl, A.; Gigault, J. Metals in Microplastics: Determining Which Are Additive, Adsorbed, and Bioavailable. Environ. Sci.: Processes Impacts 2021, 23, 553–558. [Google Scholar] [CrossRef]
- Napper, I.E.; Thompson, R.C. Release of Synthetic Microplastic Plastic Fibres from Domestic Washing Machines: Effects of Fabric Type and Washing Conditions. Marine Pollution Bulletin 2016, 112, 39–45. [Google Scholar] [CrossRef]
- Winton, D.J.; Anderson, L.G.; Rocliffe, S.; Loiselle, S. Macroplastic Pollution in Freshwater Environments: Focusing Public and Policy Action. Science of The Total Environment 2020, 704, 135242. [Google Scholar] [CrossRef]
- Horton, A.A.; Walton, A.; Spurgeon, D.J.; Lahive, E.; Svendsen, C. Microplastics in Freshwater and Terrestrial Environments: Evaluating the Current Understanding to Identify the Knowledge Gaps and Future Research Priorities. Science of The Total Environment 2017, 586, 127–141. [Google Scholar] [CrossRef]
- Bayo, J.; López-Castellanos, J.; Olmos, S.; Rojo, D. A Holistic Approach on the Impact of Microplastic Discharge from WWTPs to the Neighboring Environment in Southeast Spain. Water Research 2023, 244, 120516. [Google Scholar] [CrossRef]
- Camacho, W.; Karlsson, S. NIR, DSC, and FTIR as Quantitative Methods for Compositional Analysis of Blends of Polymers Obtained from Recycled Mixed Plastic Waste. Polymer Engineering & Science 2001, 41, 1626–1635. [Google Scholar] [CrossRef]
- Bitter, H.; Krause, L.; Kirchen, F.; Fundneider, T.; Lackner, S. Semi-Crystalline Microplastics in Wastewater Plant Effluents and Removal Efficiencies of Post-Treatment Filtration Systems. Water Research X 2022, 17, 100156. [Google Scholar] [CrossRef]
- Prata, J.C.; Da Costa, J.P.; Duarte, A.C.; Rocha-Santos, T. Methods for Sampling and Detection of Microplastics in Water and Sediment: A Critical Review. TrAC Trends in Analytical Chemistry 2019, 110, 150–159. [Google Scholar] [CrossRef]
- Yan, P.; Zhang, S.; Xing, H.; Yan, S.; Niu, X.; Wang, J.; Fu, Q.; Aurangzeib, M. Spatial Distribution of Microplastics in Mollisols of the Farmland in Northeast China: The Role of Field Management and Plastic Sources. Geoderma 2025, 459, 117367. [Google Scholar] [CrossRef]
- Liu, W.; Zhang, J.; Liu, H.; Guo, X.; Zhang, X.; Yao, X.; Cao, Z.; Zhang, T. A Review of the Removal of Microplastics in Global Wastewater Treatment Plants: Characteristics and Mechanisms. Environment International 2021, 146, 106277. [Google Scholar] [CrossRef] [PubMed]
- Prata, J.C. Microplastics in Wastewater: State of the Knowledge on Sources, Fate and Solutions. Marine Pollution Bulletin 2018, 129, 262–265. [Google Scholar] [CrossRef]
- Sturm, M.T.; Myers, E.; Korzin, A.; Schober, D.; Schuhen, K. Long-Term Monitoring of Microplastics in a German Municipal Wastewater Treatment Plant. Microplastics 2024, 3, 492–502. [Google Scholar] [CrossRef]
- Elkhatib, D.; Oyanedel-Craver, V. A Critical Review of Extraction and Identification Methods of Microplastics in Wastewater and Drinking Water. Environmental Science & Technology 2020, 54, 7037–7049. [Google Scholar] [CrossRef]
Figure 1.
Process stages in the three WWTPs monitored in this study. In WWTP A, the sludge is disposed of in drying beds. In WWTPs B and C, the sludge is preliminarily conditioned and dewatered using filter presses.
Figure 1.
Process stages in the three WWTPs monitored in this study. In WWTP A, the sludge is disposed of in drying beds. In WWTPs B and C, the sludge is preliminarily conditioned and dewatered using filter presses.
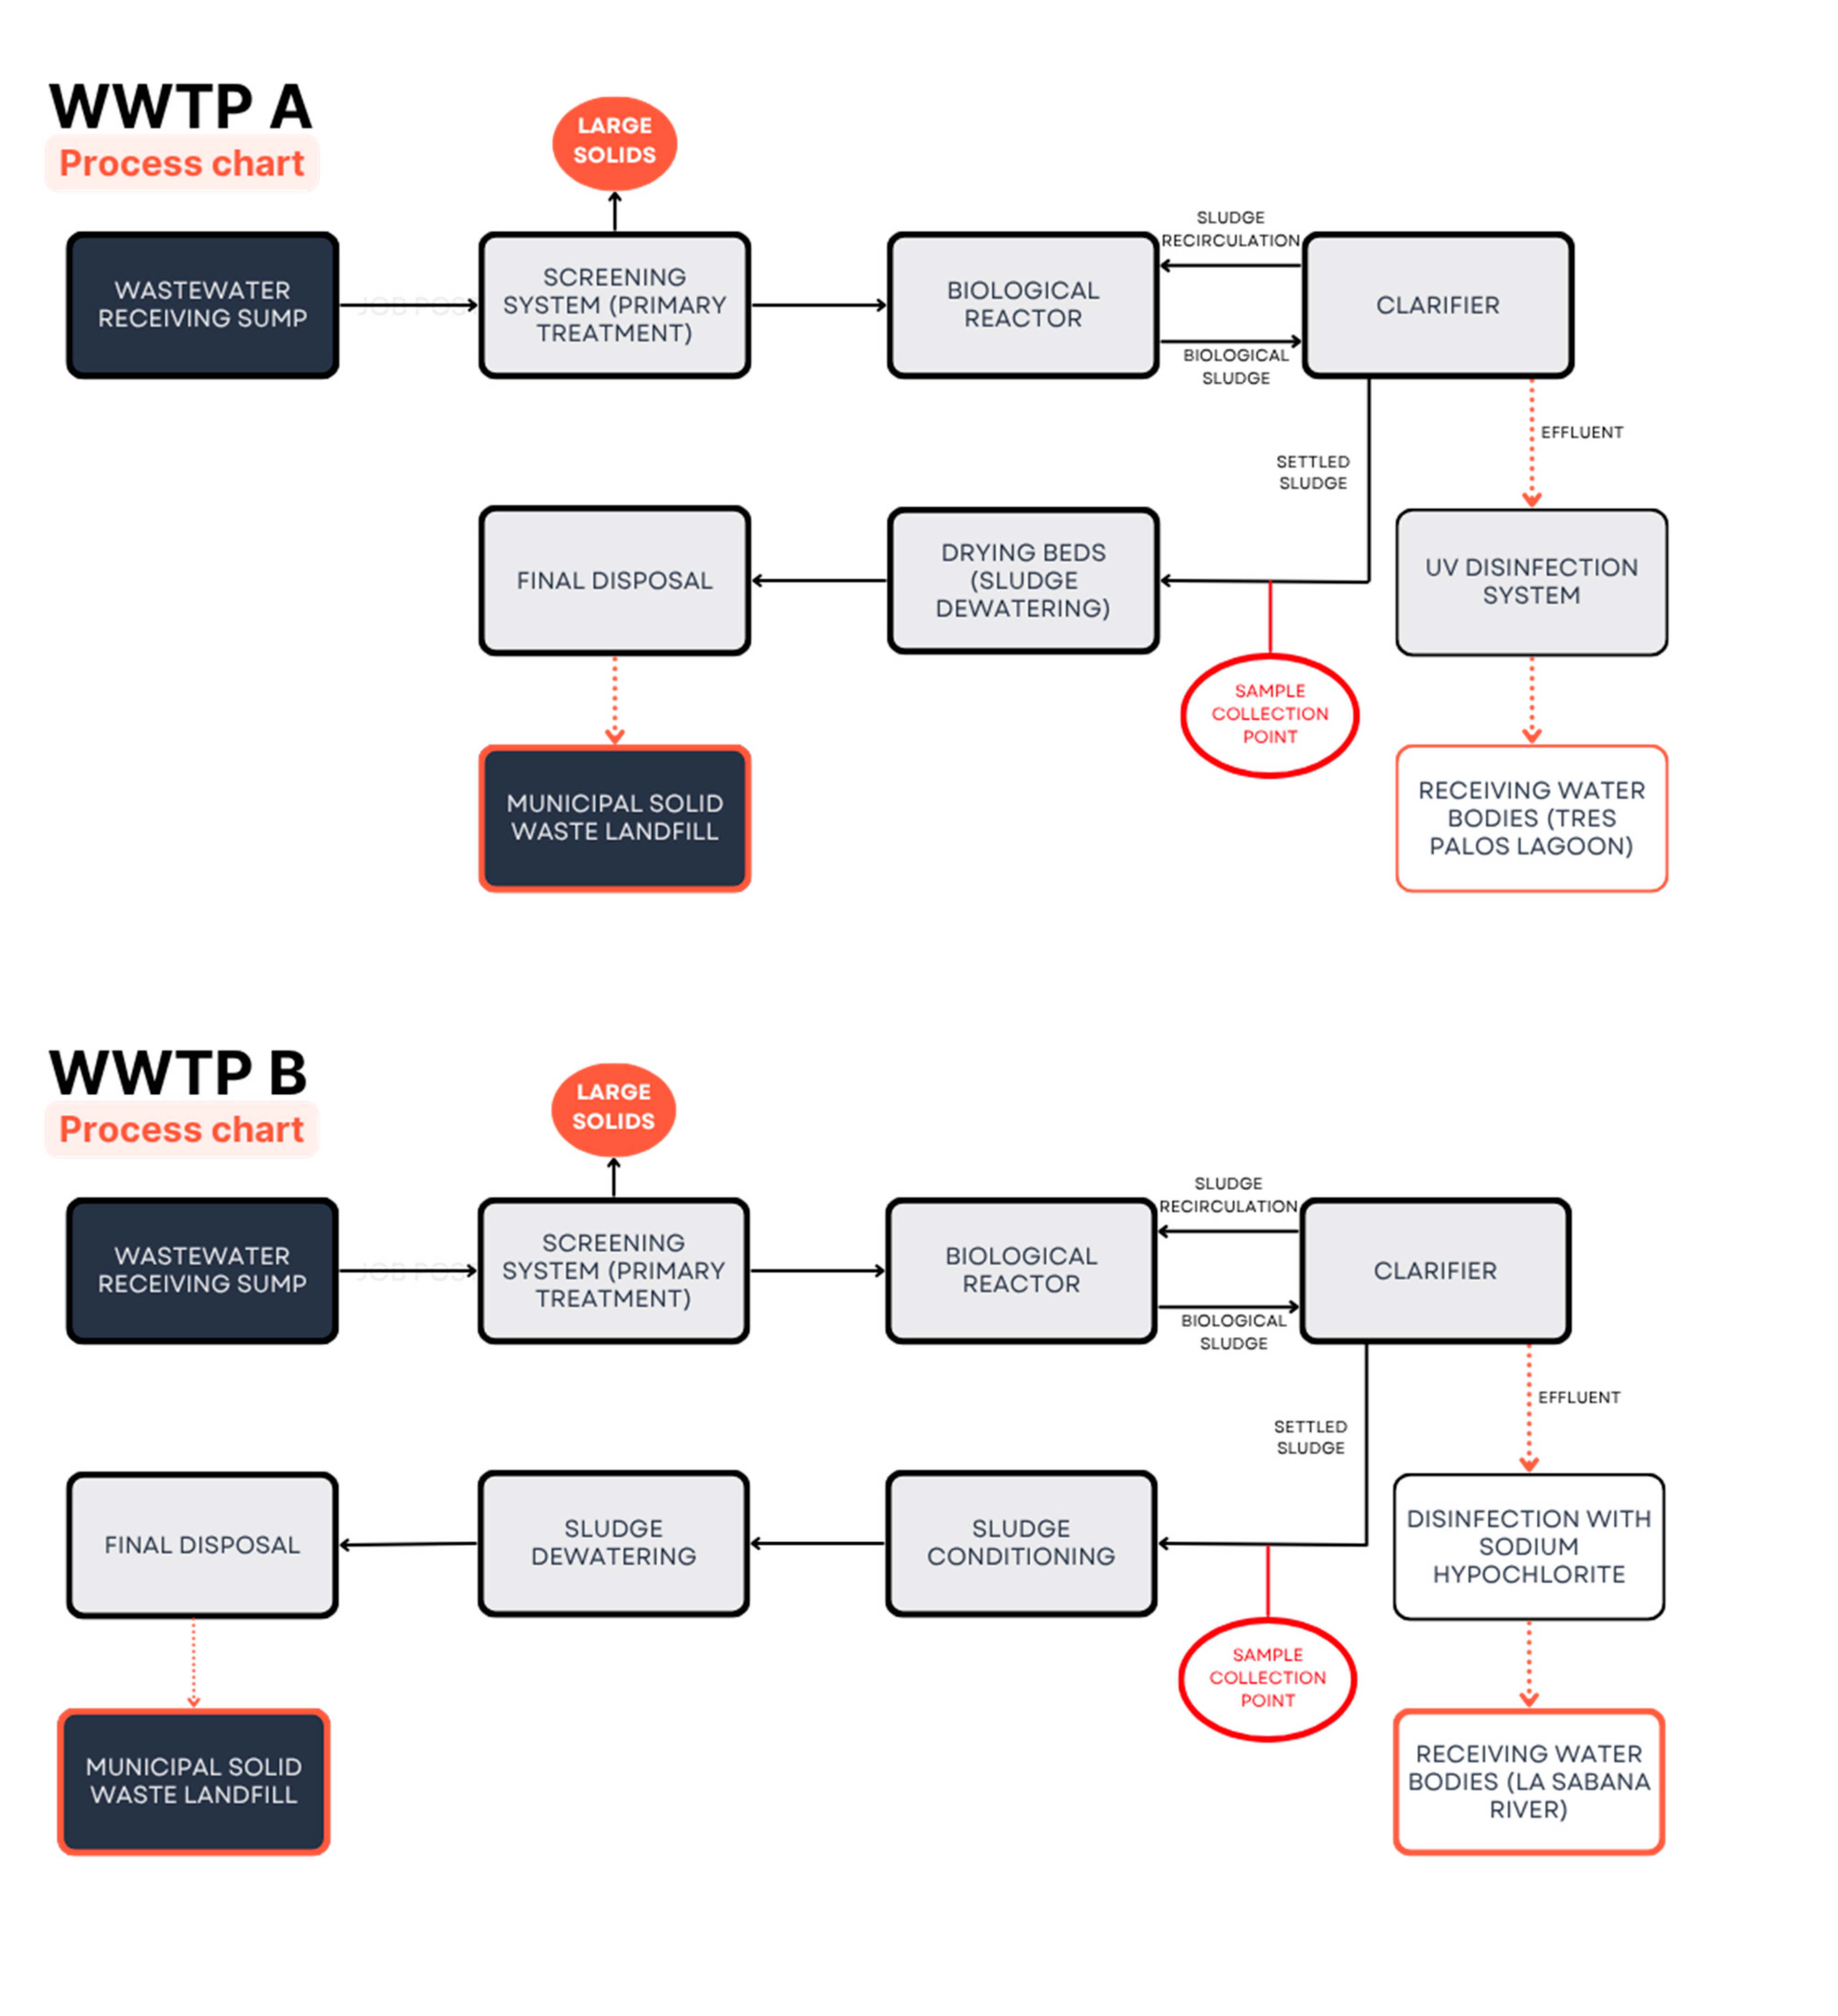
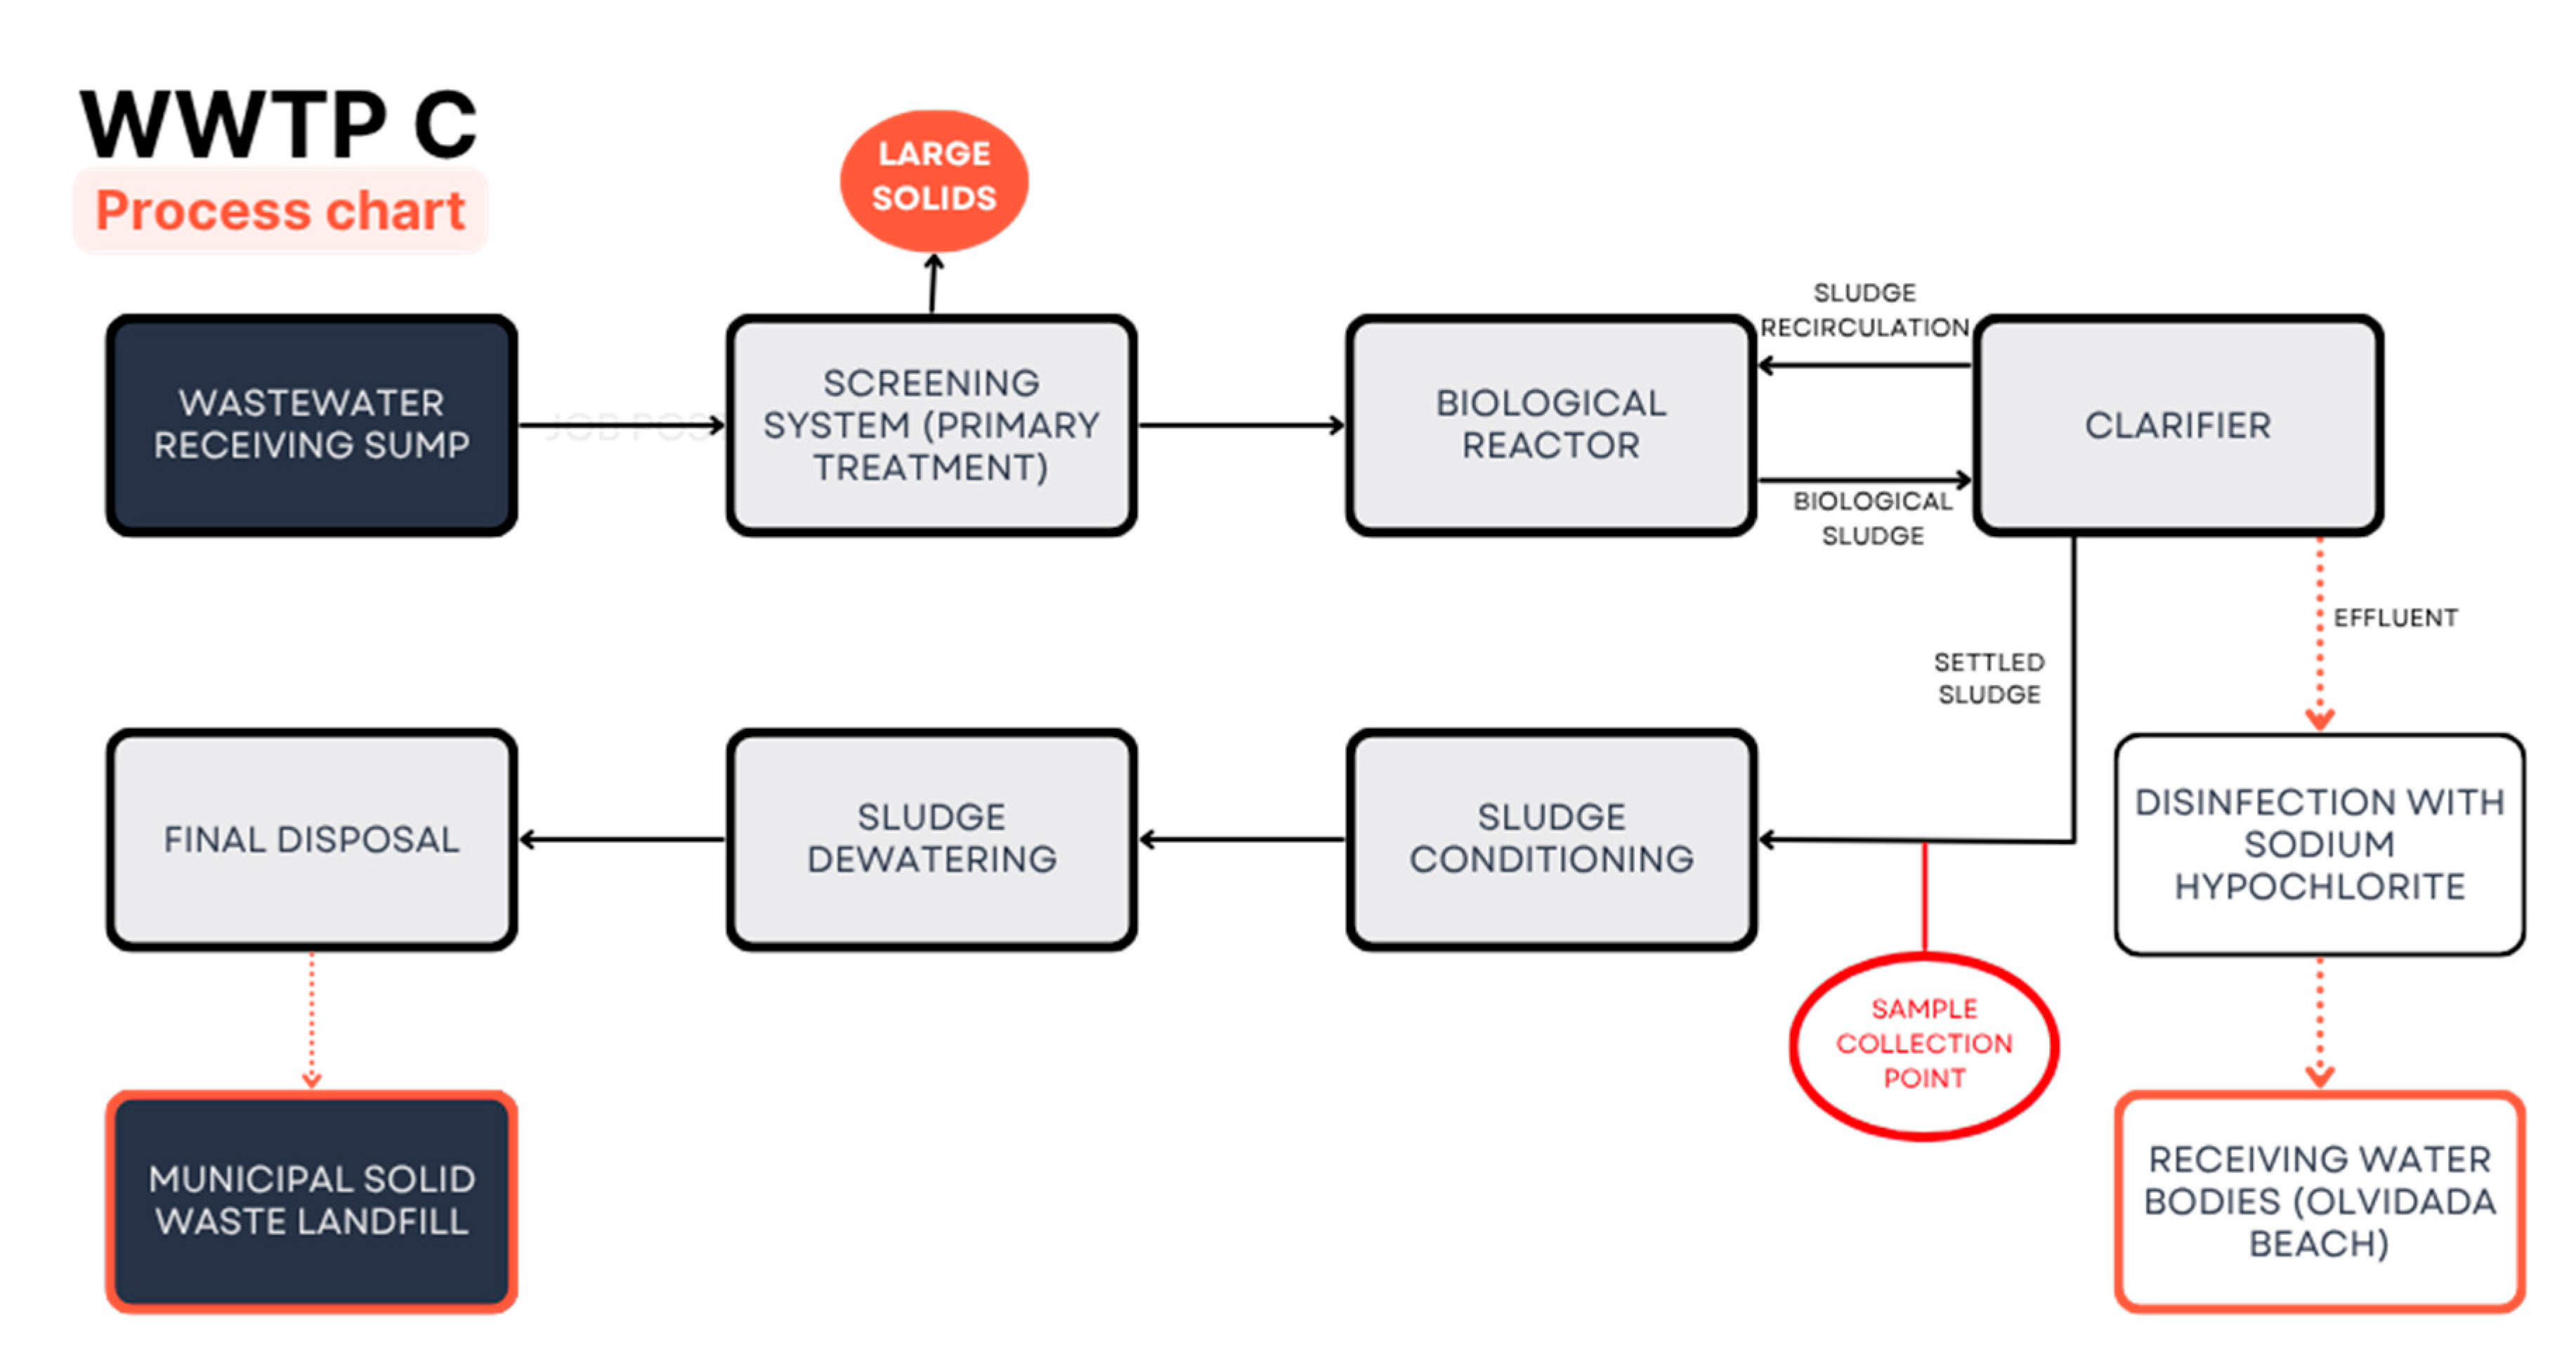
Figure 2.
Filaments, fragments, and films of microplastics (MPs) identified in the biological sludge of the WWTPs. Samples correspond to plant A (a, b, c), plant B (d, e, f), and plant C (g, h, I, j).
Figure 2.
Filaments, fragments, and films of microplastics (MPs) identified in the biological sludge of the WWTPs. Samples correspond to plant A (a, b, c), plant B (d, e, f), and plant C (g, h, I, j).
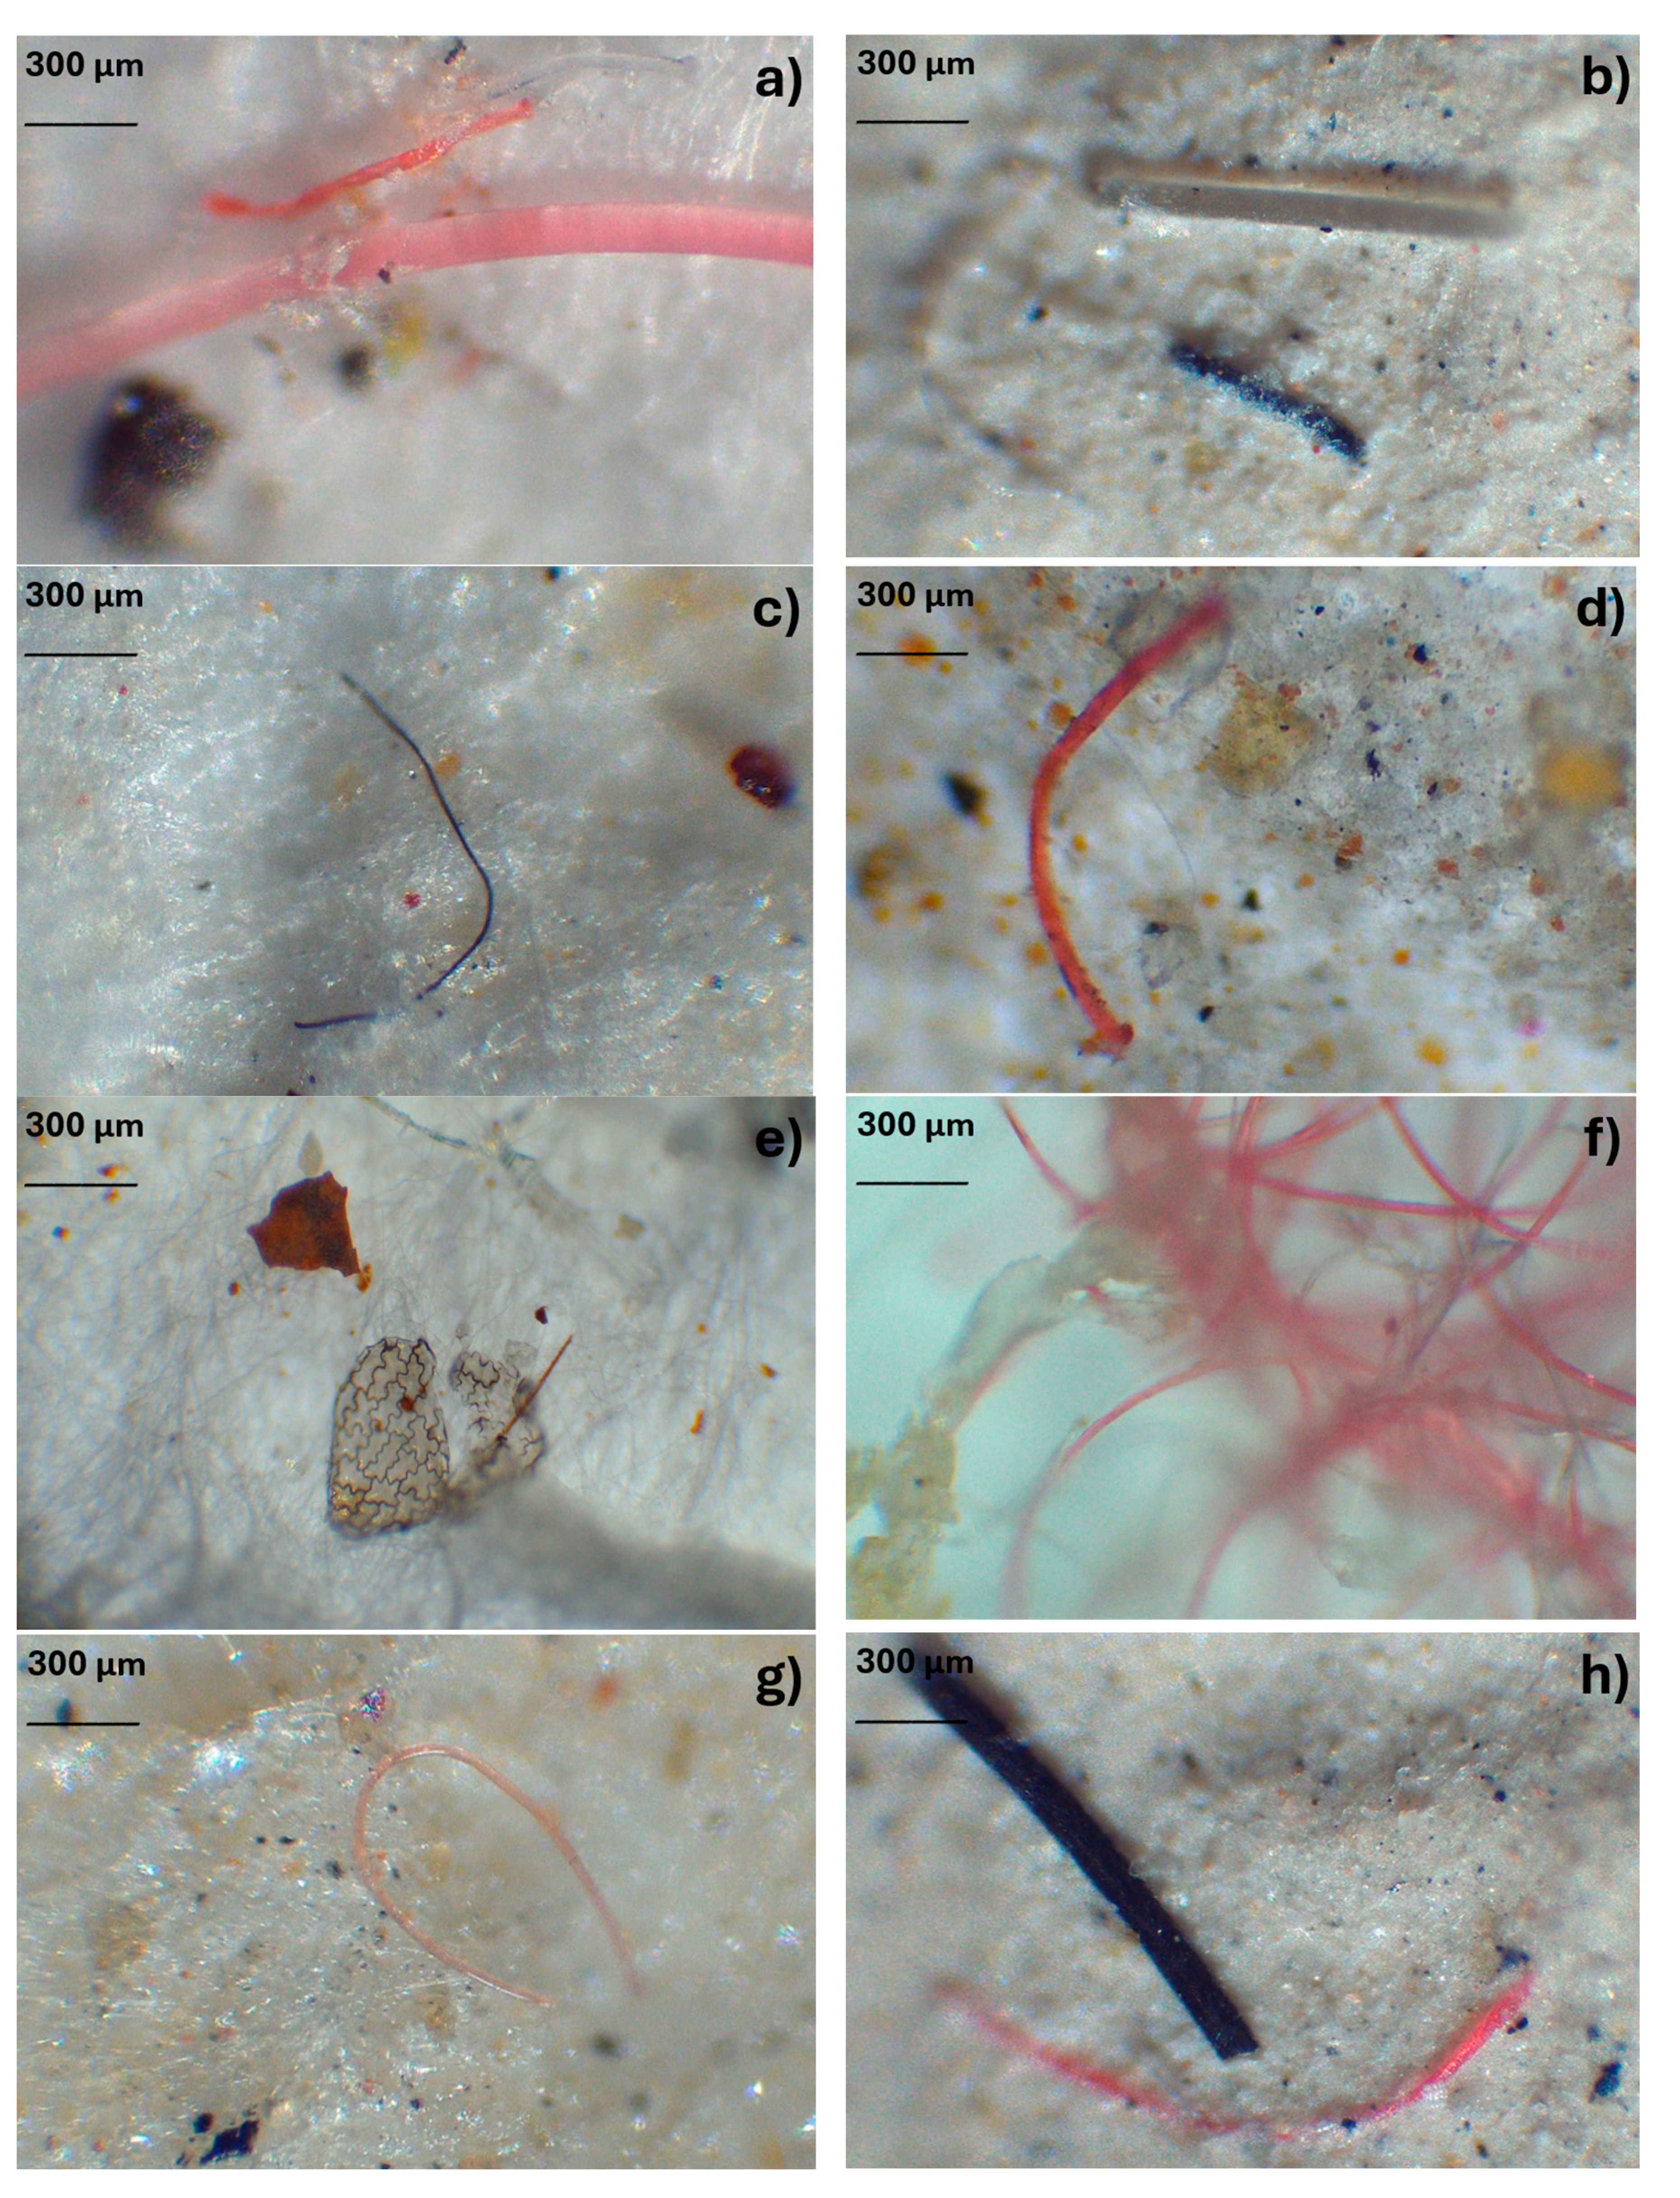
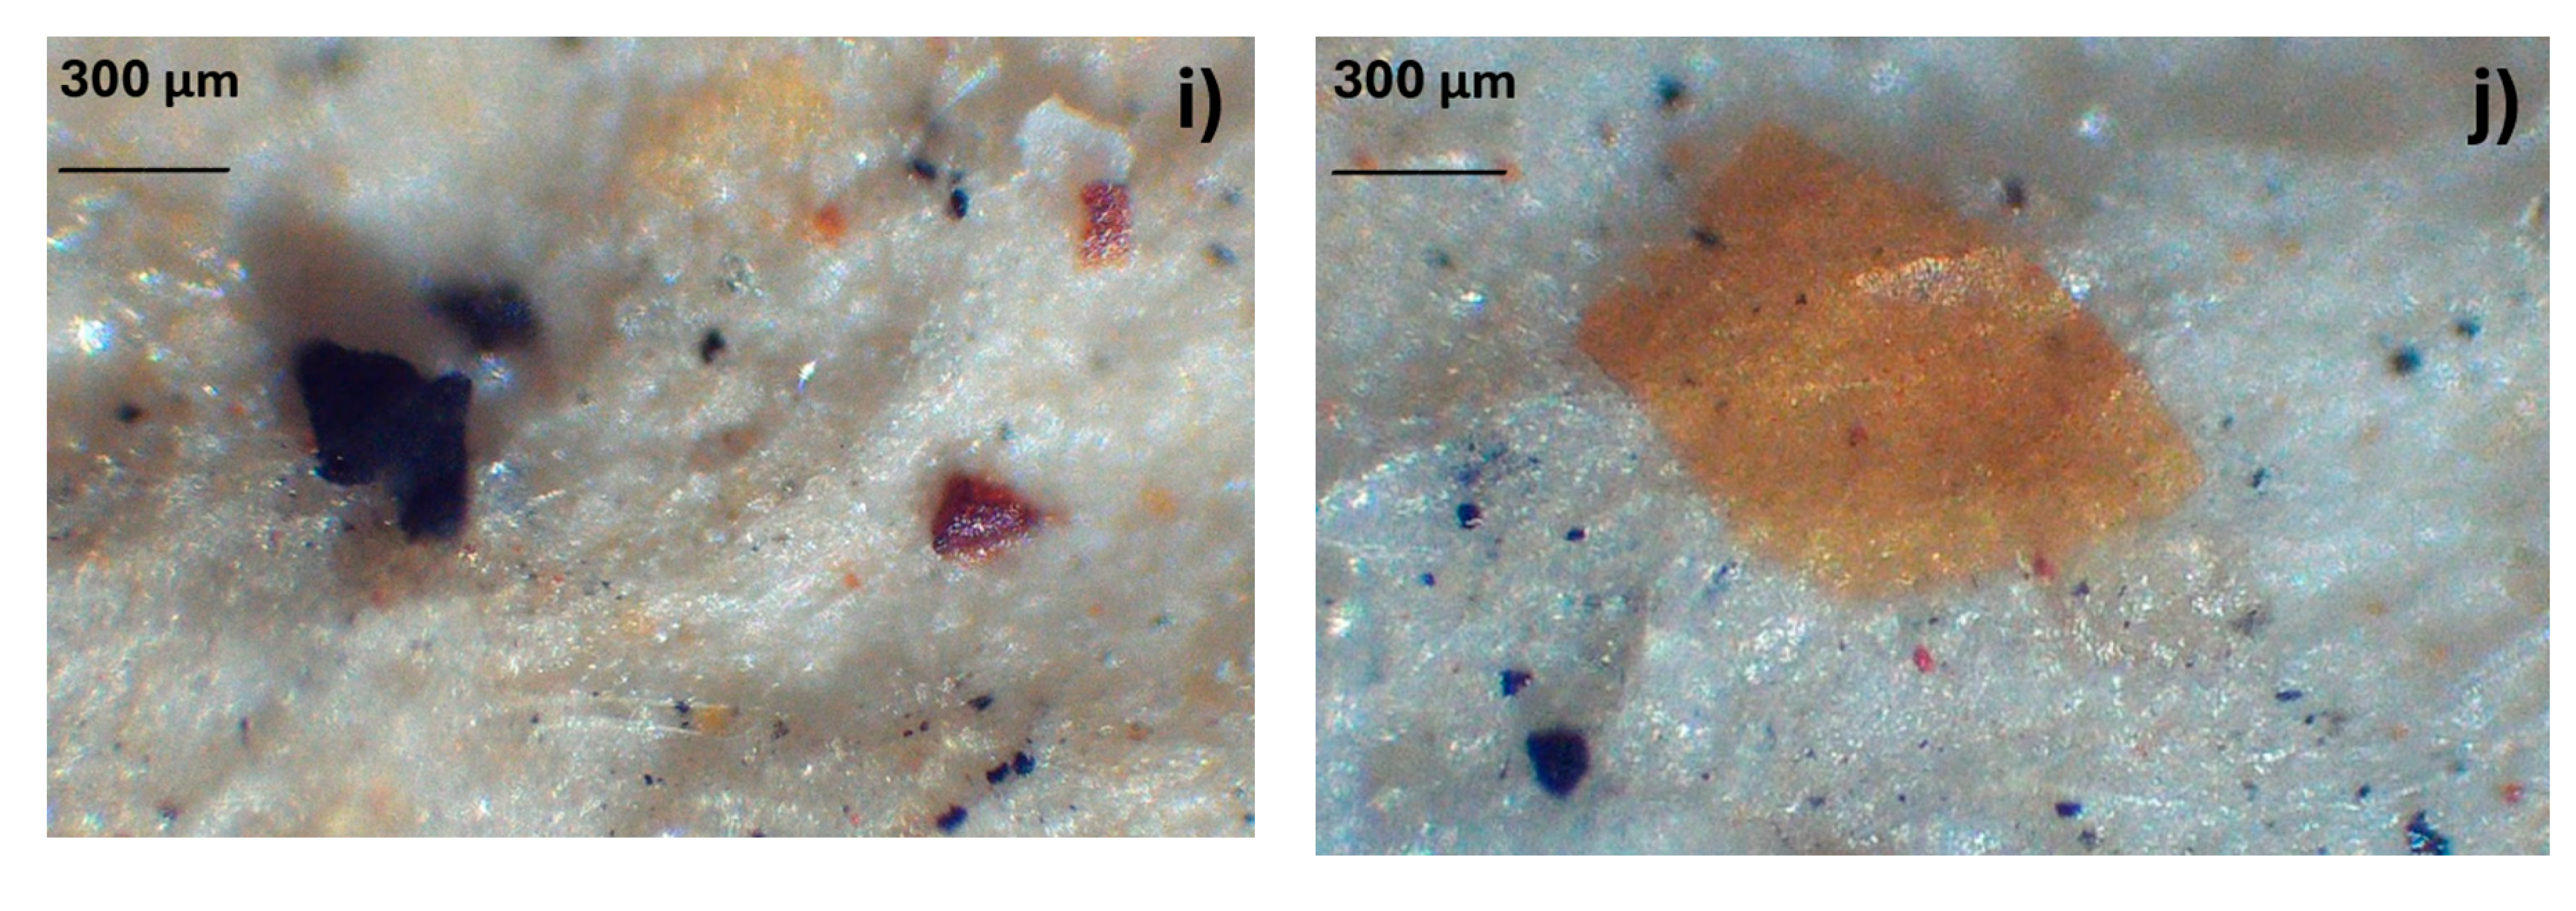
Figure 3.
Color of microplastics (MPs) present in (a) WWTP A, (b) WWTP B, and (c) WWTP C. In all three wastewater treatment plants (WWTPs), blue was the most prevalent color among the MP particles identified in biological sludge.
Figure 3.
Color of microplastics (MPs) present in (a) WWTP A, (b) WWTP B, and (c) WWTP C. In all three wastewater treatment plants (WWTPs), blue was the most prevalent color among the MP particles identified in biological sludge.
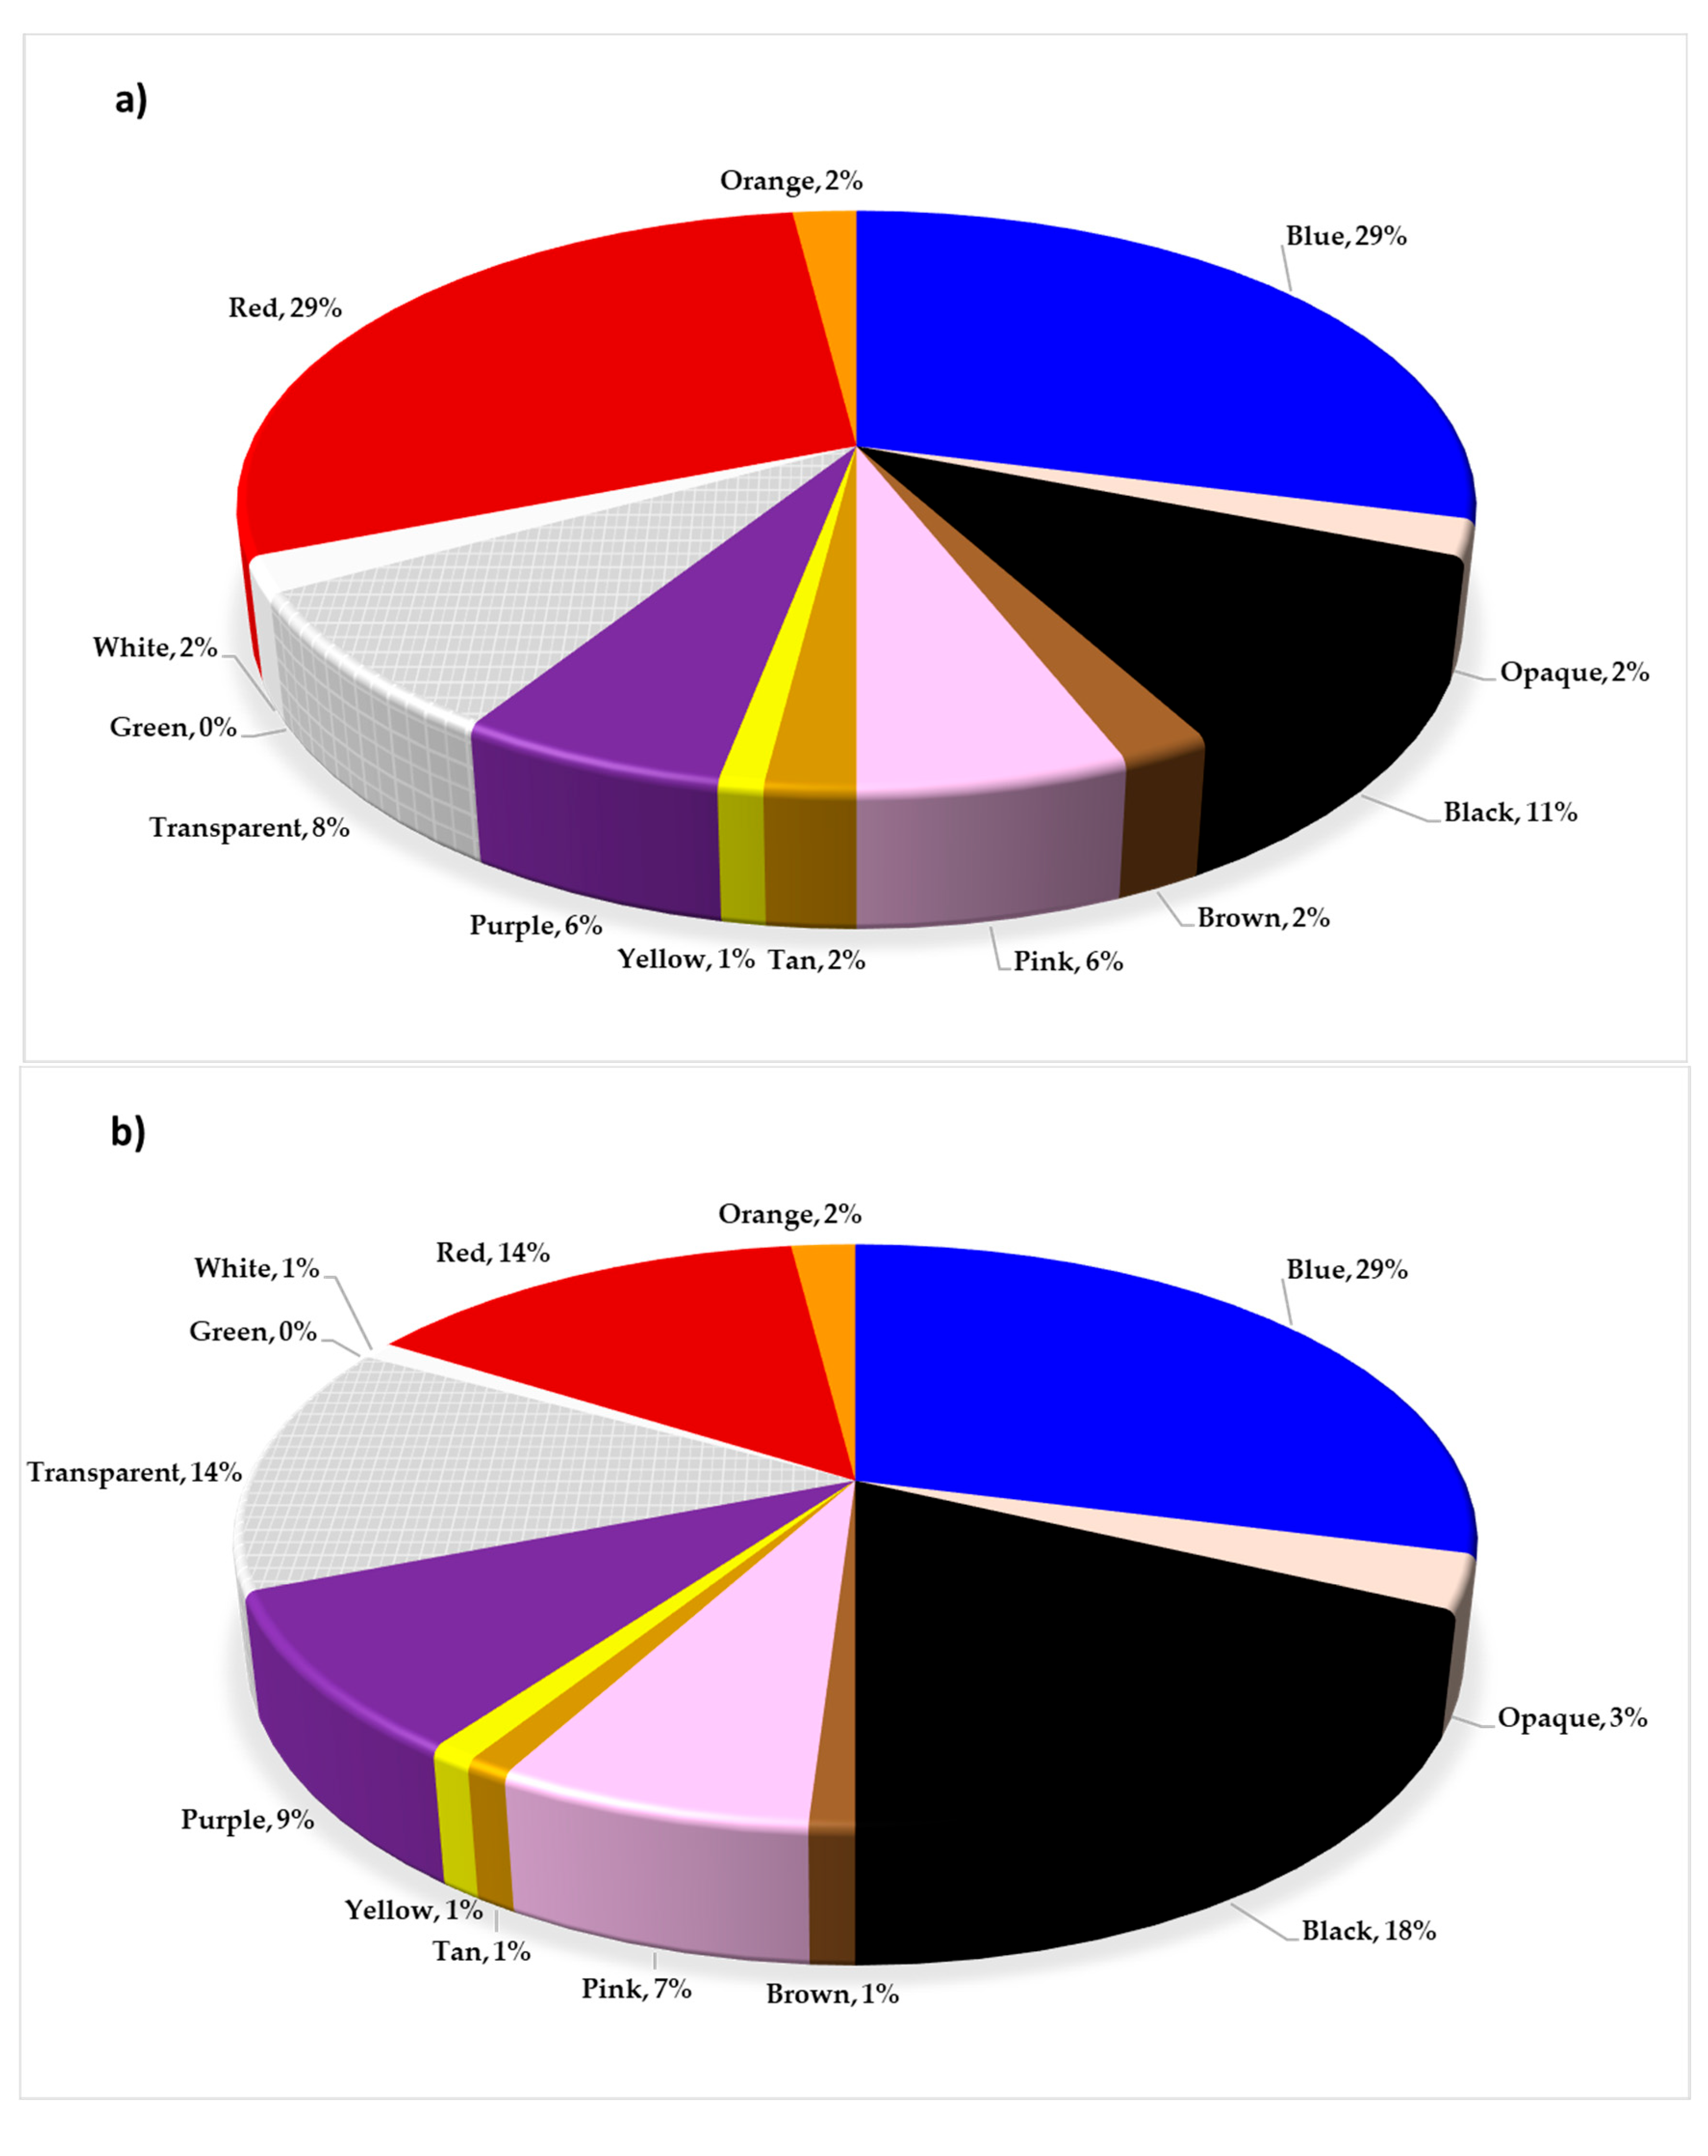

Figure 4.
The color of microplastics (MPs) present in (a) WWTP A, (b) WWTP B, and (c) WWTP C. In all three wastewater treatment plants (WWTPs), blue was the most prevalent color among the MP particles identified in biological sludges.
Figure 4.
The color of microplastics (MPs) present in (a) WWTP A, (b) WWTP B, and (c) WWTP C. In all three wastewater treatment plants (WWTPs), blue was the most prevalent color among the MP particles identified in biological sludges.
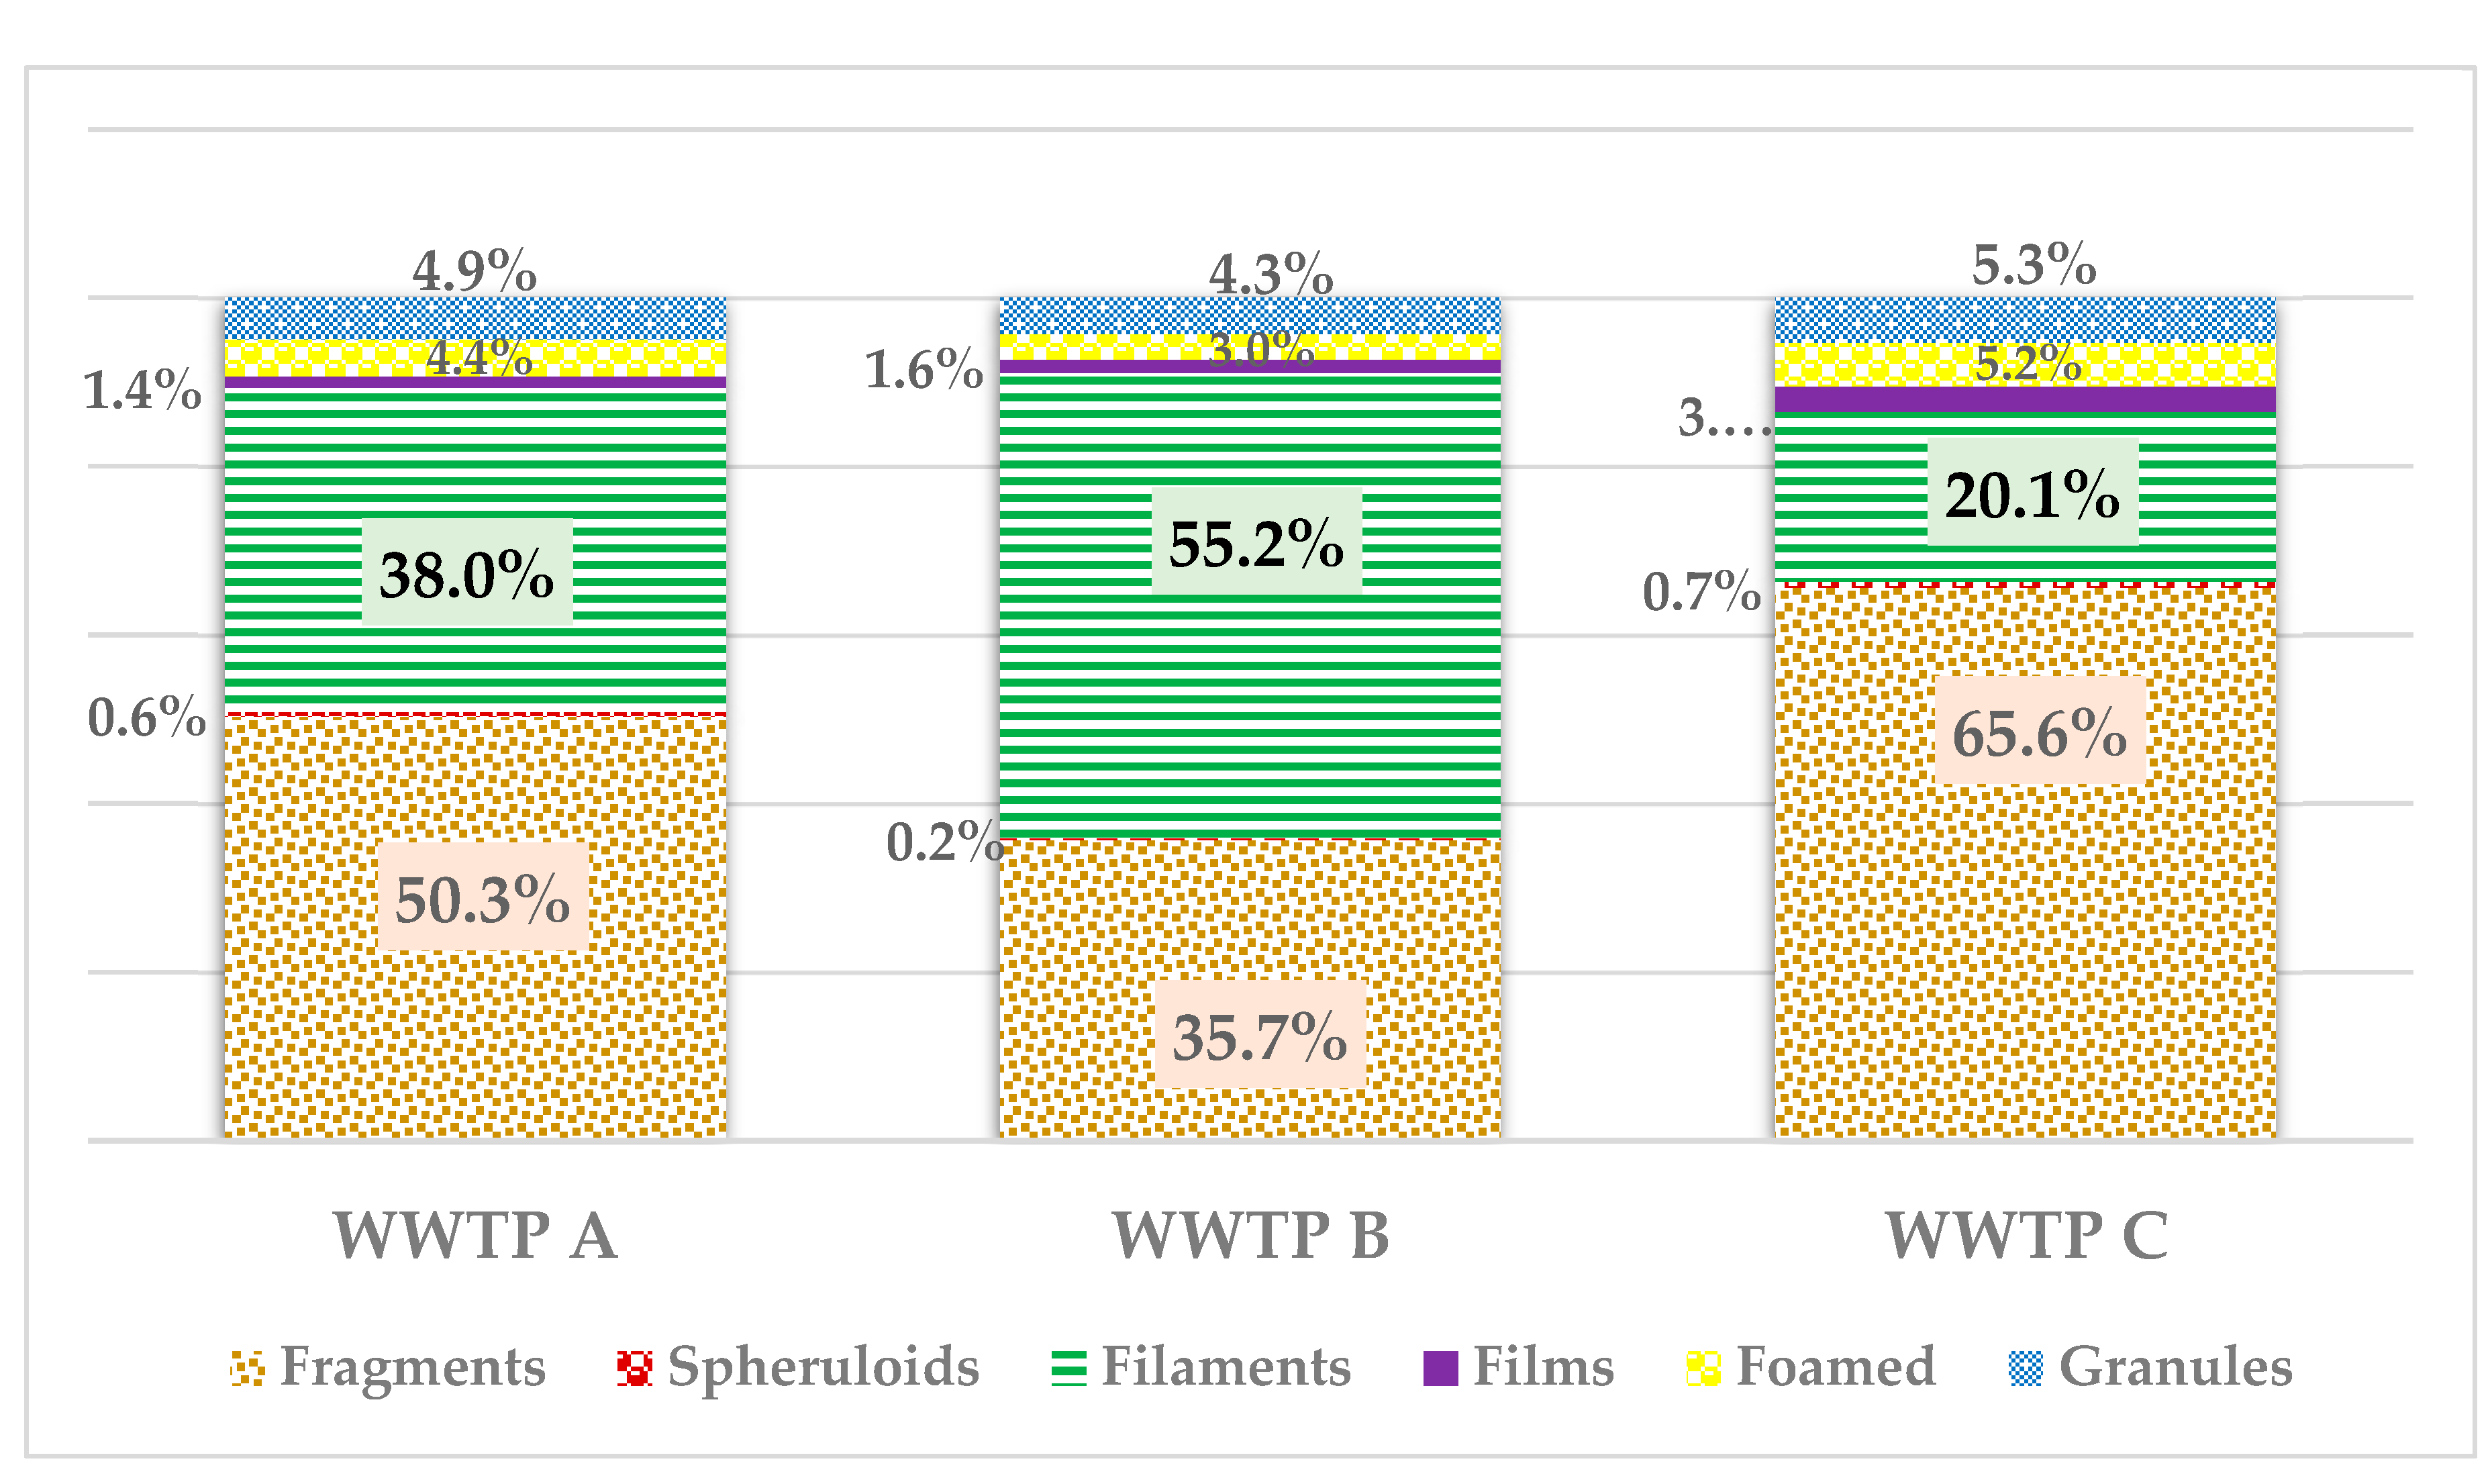
Figure 5.
Melting temperature of pure polymers PE, PP, and PET.
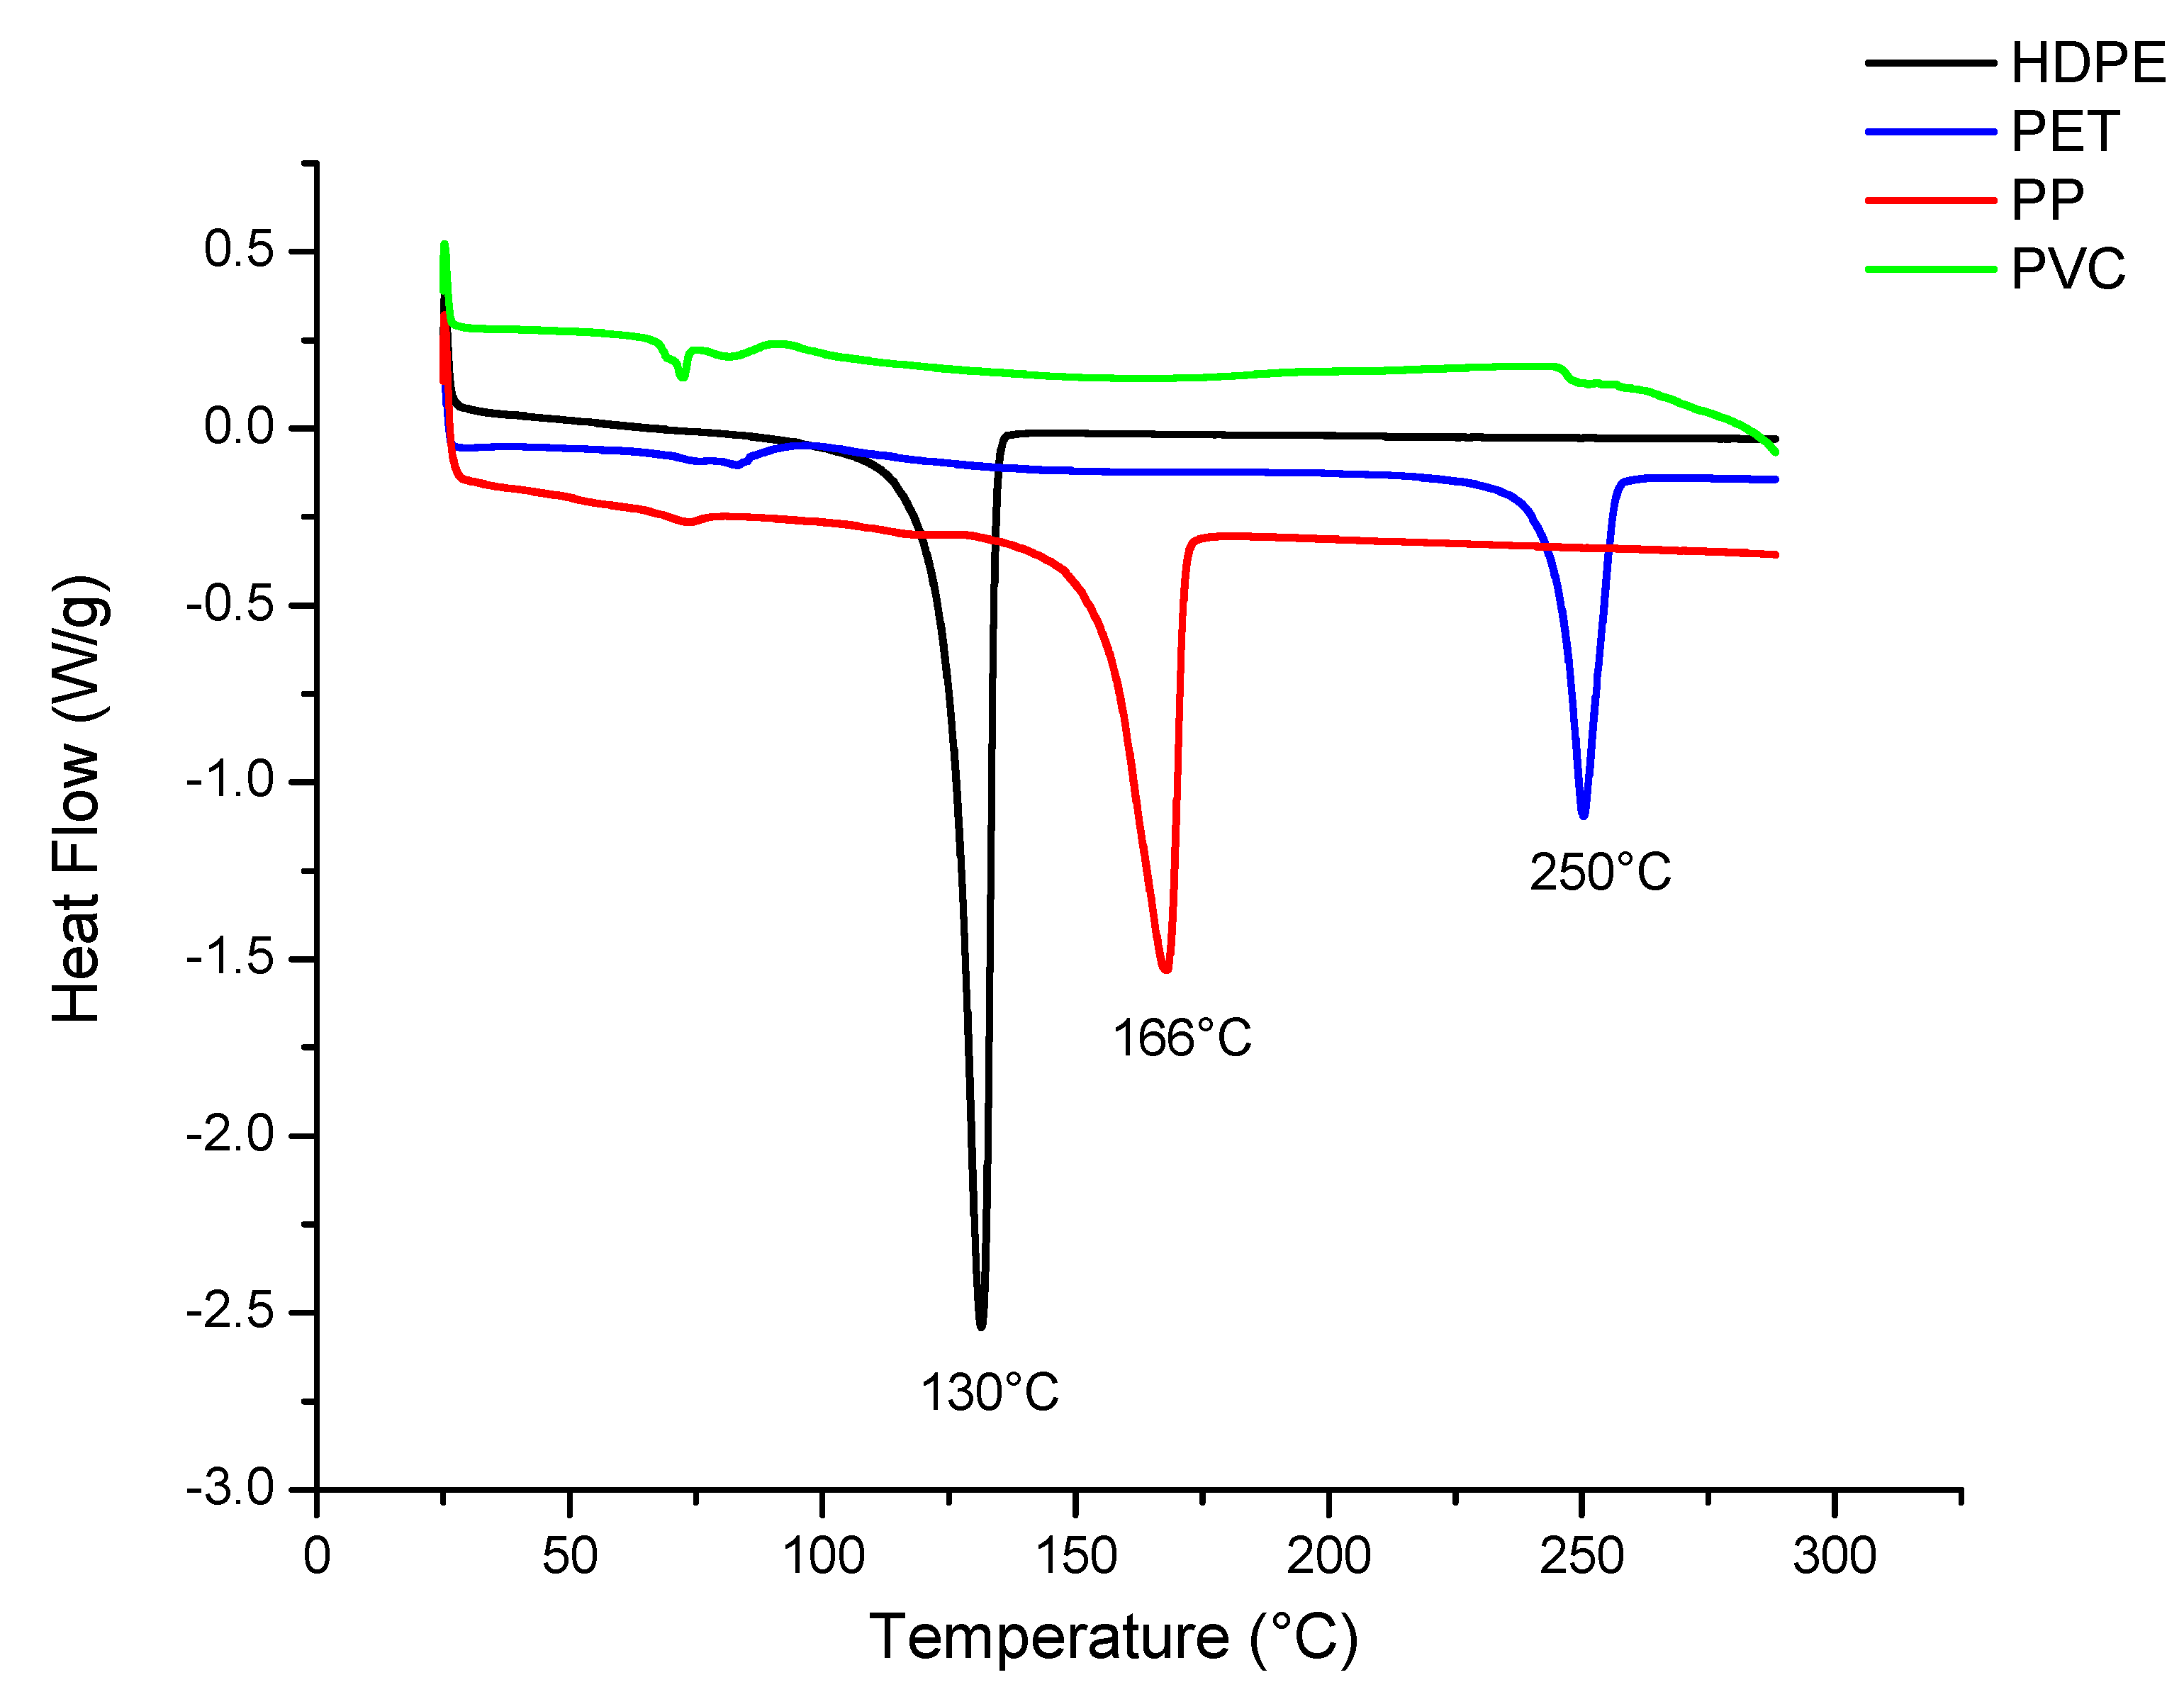
Figure 6.
Melting temperature of pure polymers PE, PP, and PET.
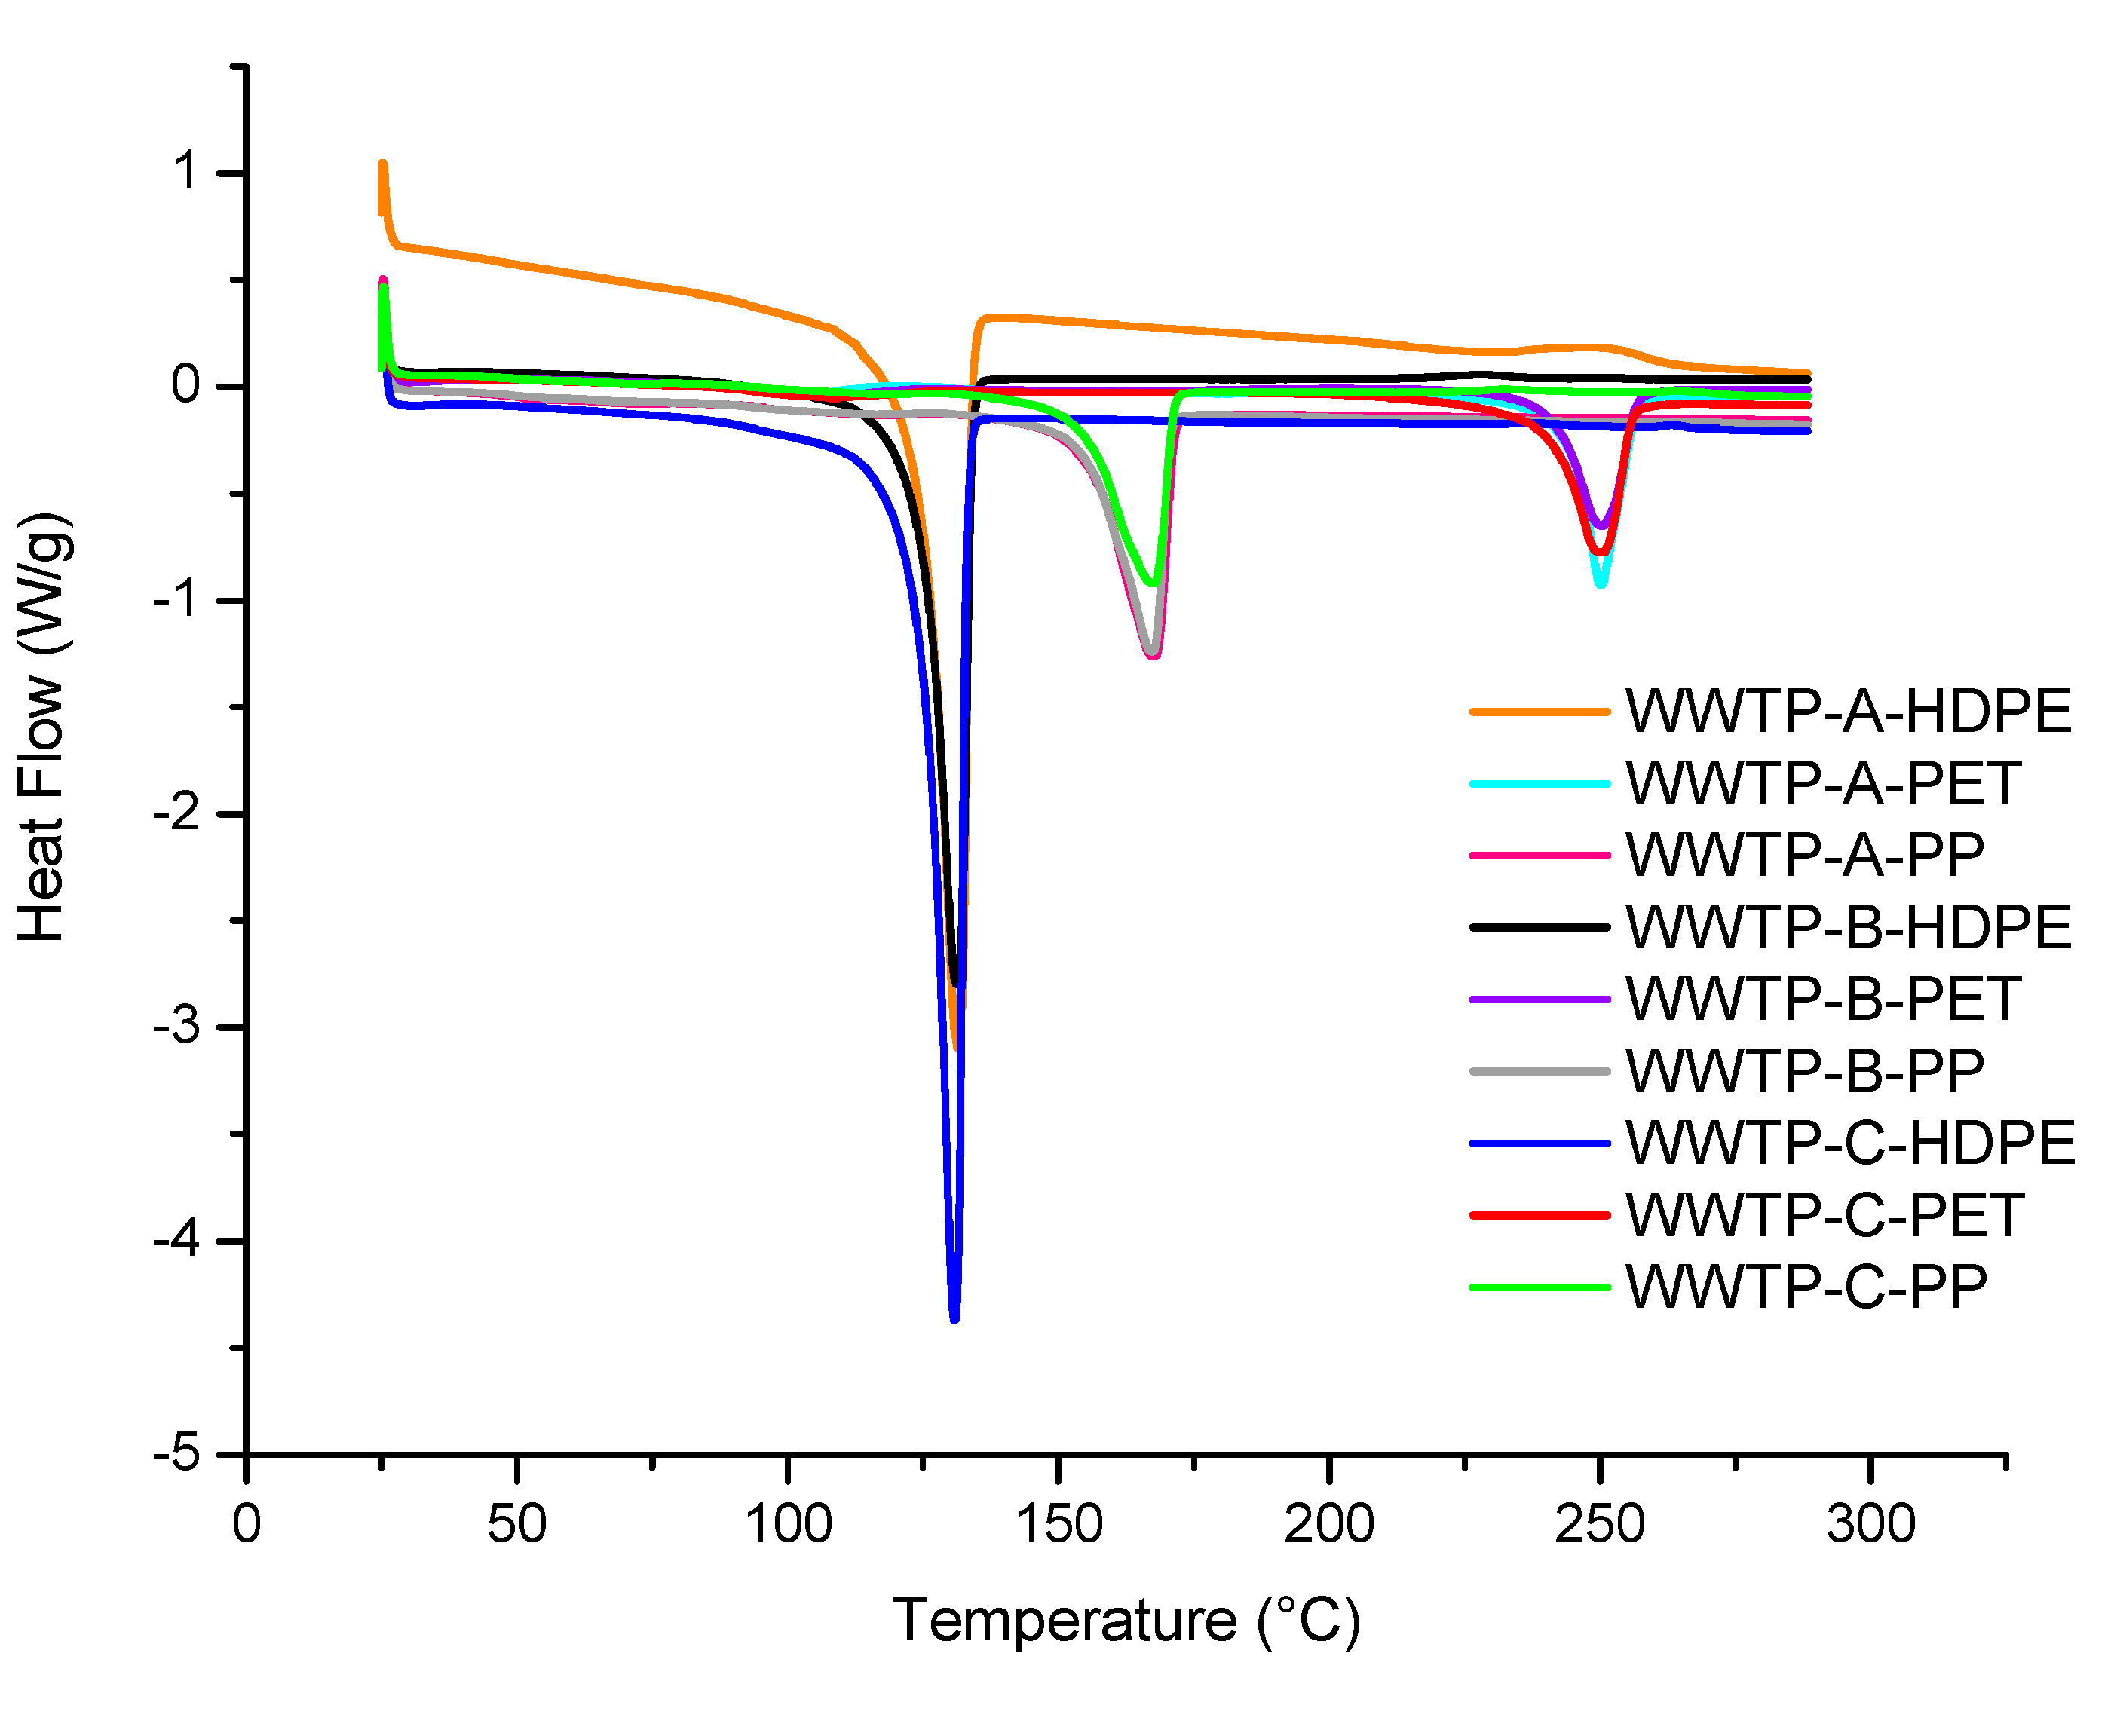
Figure 8.
Monthly projections of MPs in biological sludge from the three WWTPs during June and July (dry period) and September and October (rainy period).
Figure 8.
Monthly projections of MPs in biological sludge from the three WWTPs during June and July (dry period) and September and October (rainy period).
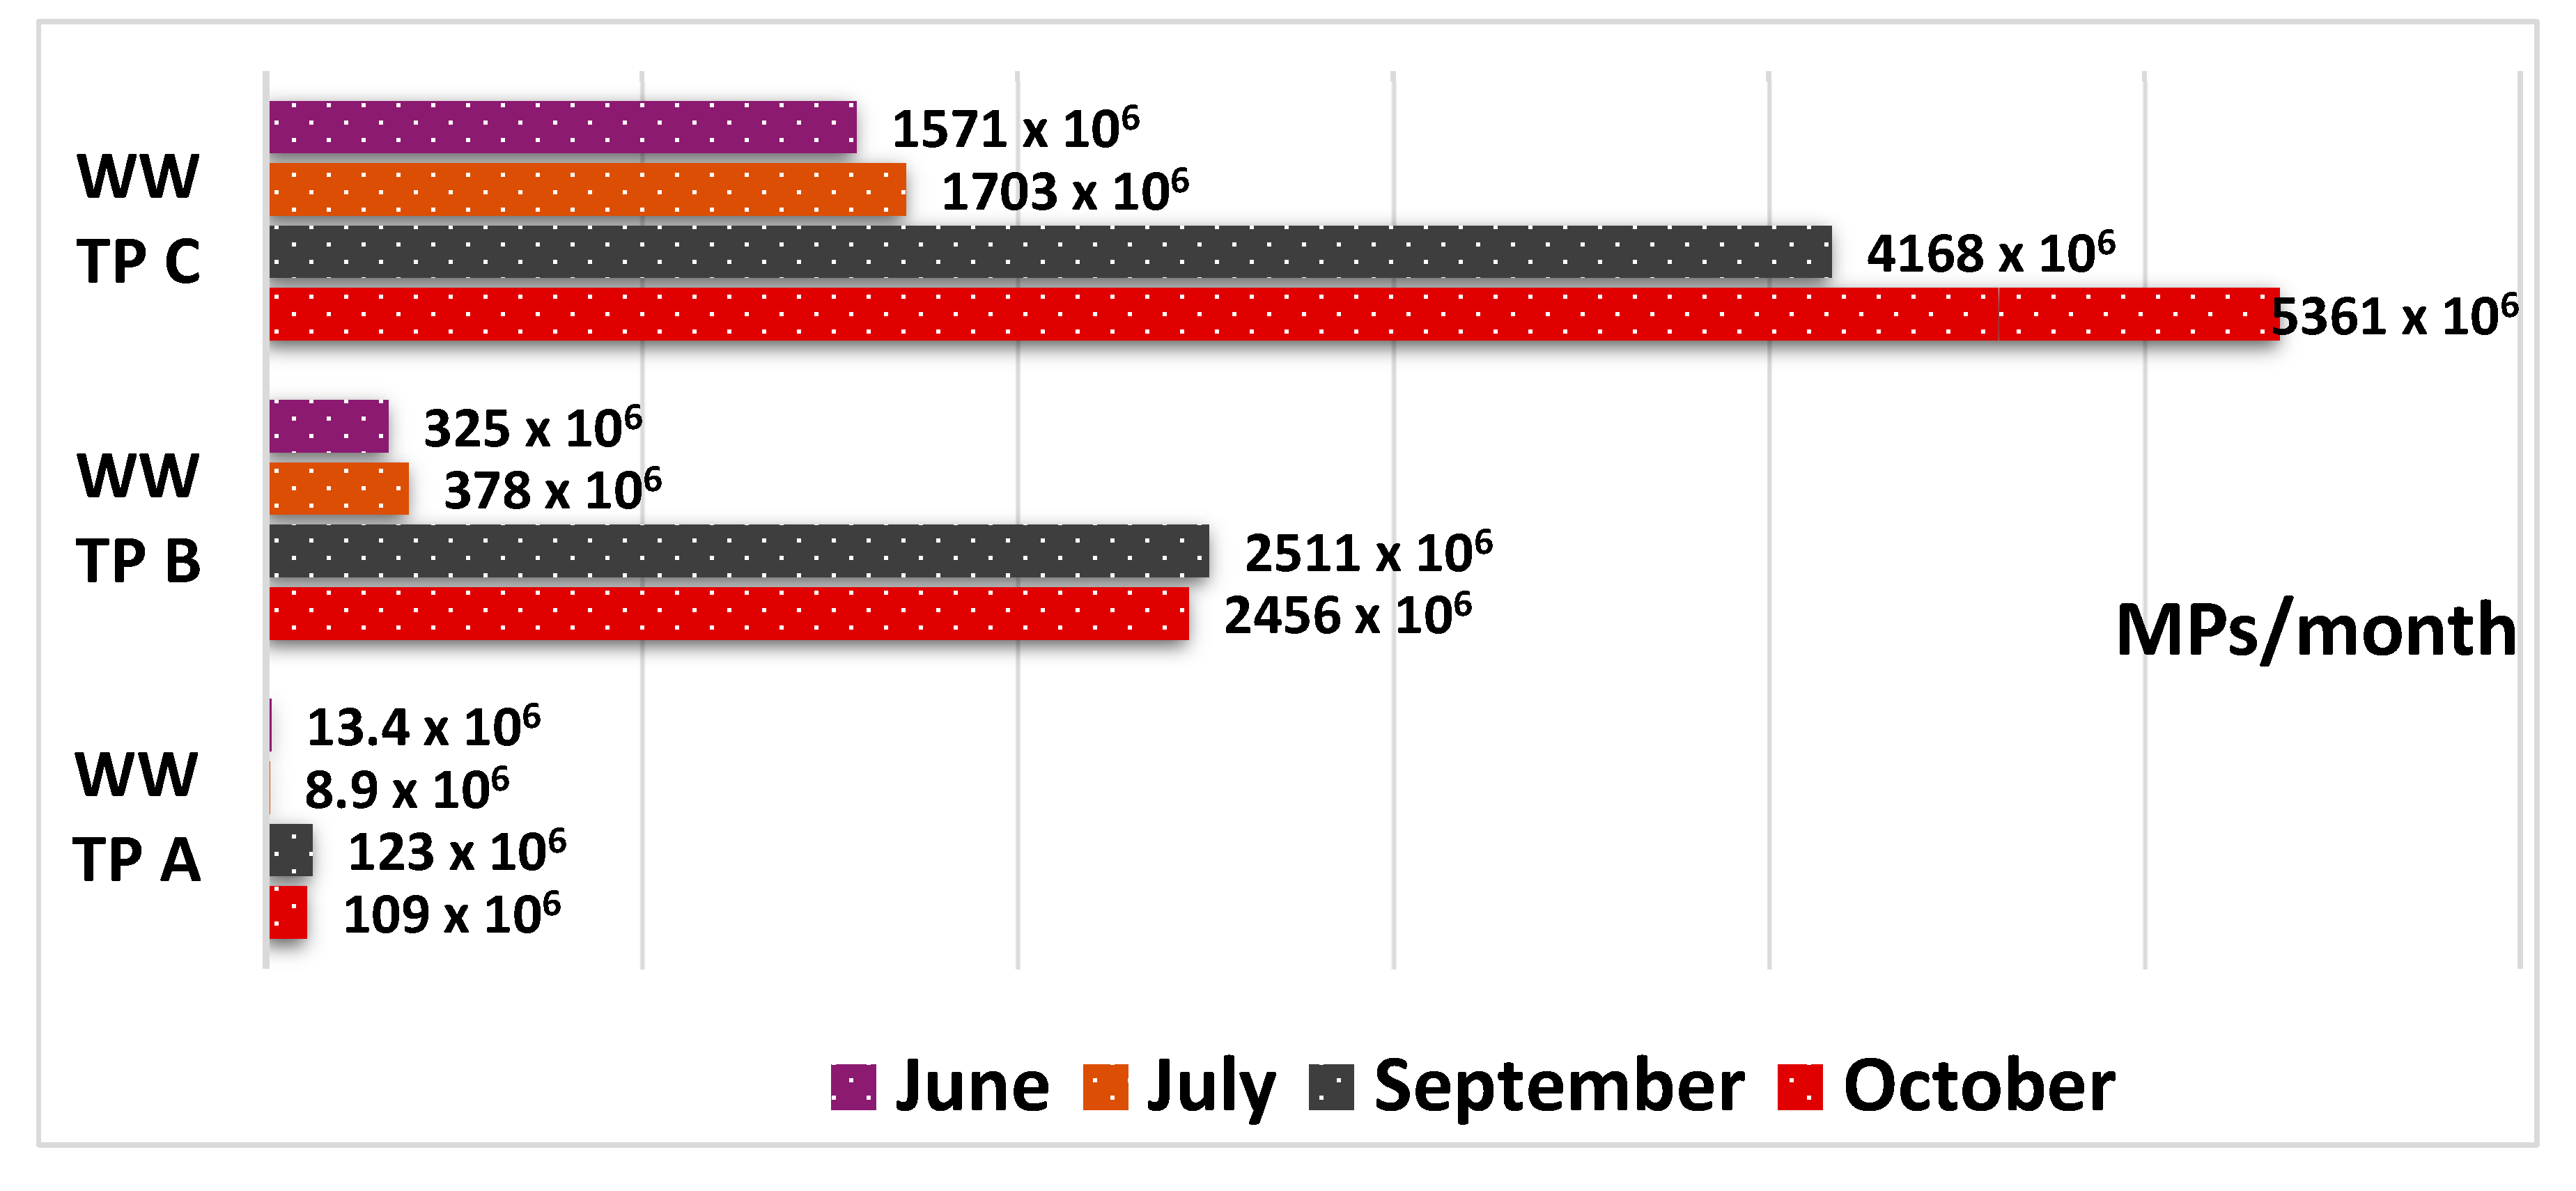
Figure 9.
Annual projections of MP concentrations in biological sludge generated in the three WWTPs in relation to their generation capacities.
Figure 9.
Annual projections of MP concentrations in biological sludge generated in the three WWTPs in relation to their generation capacities.
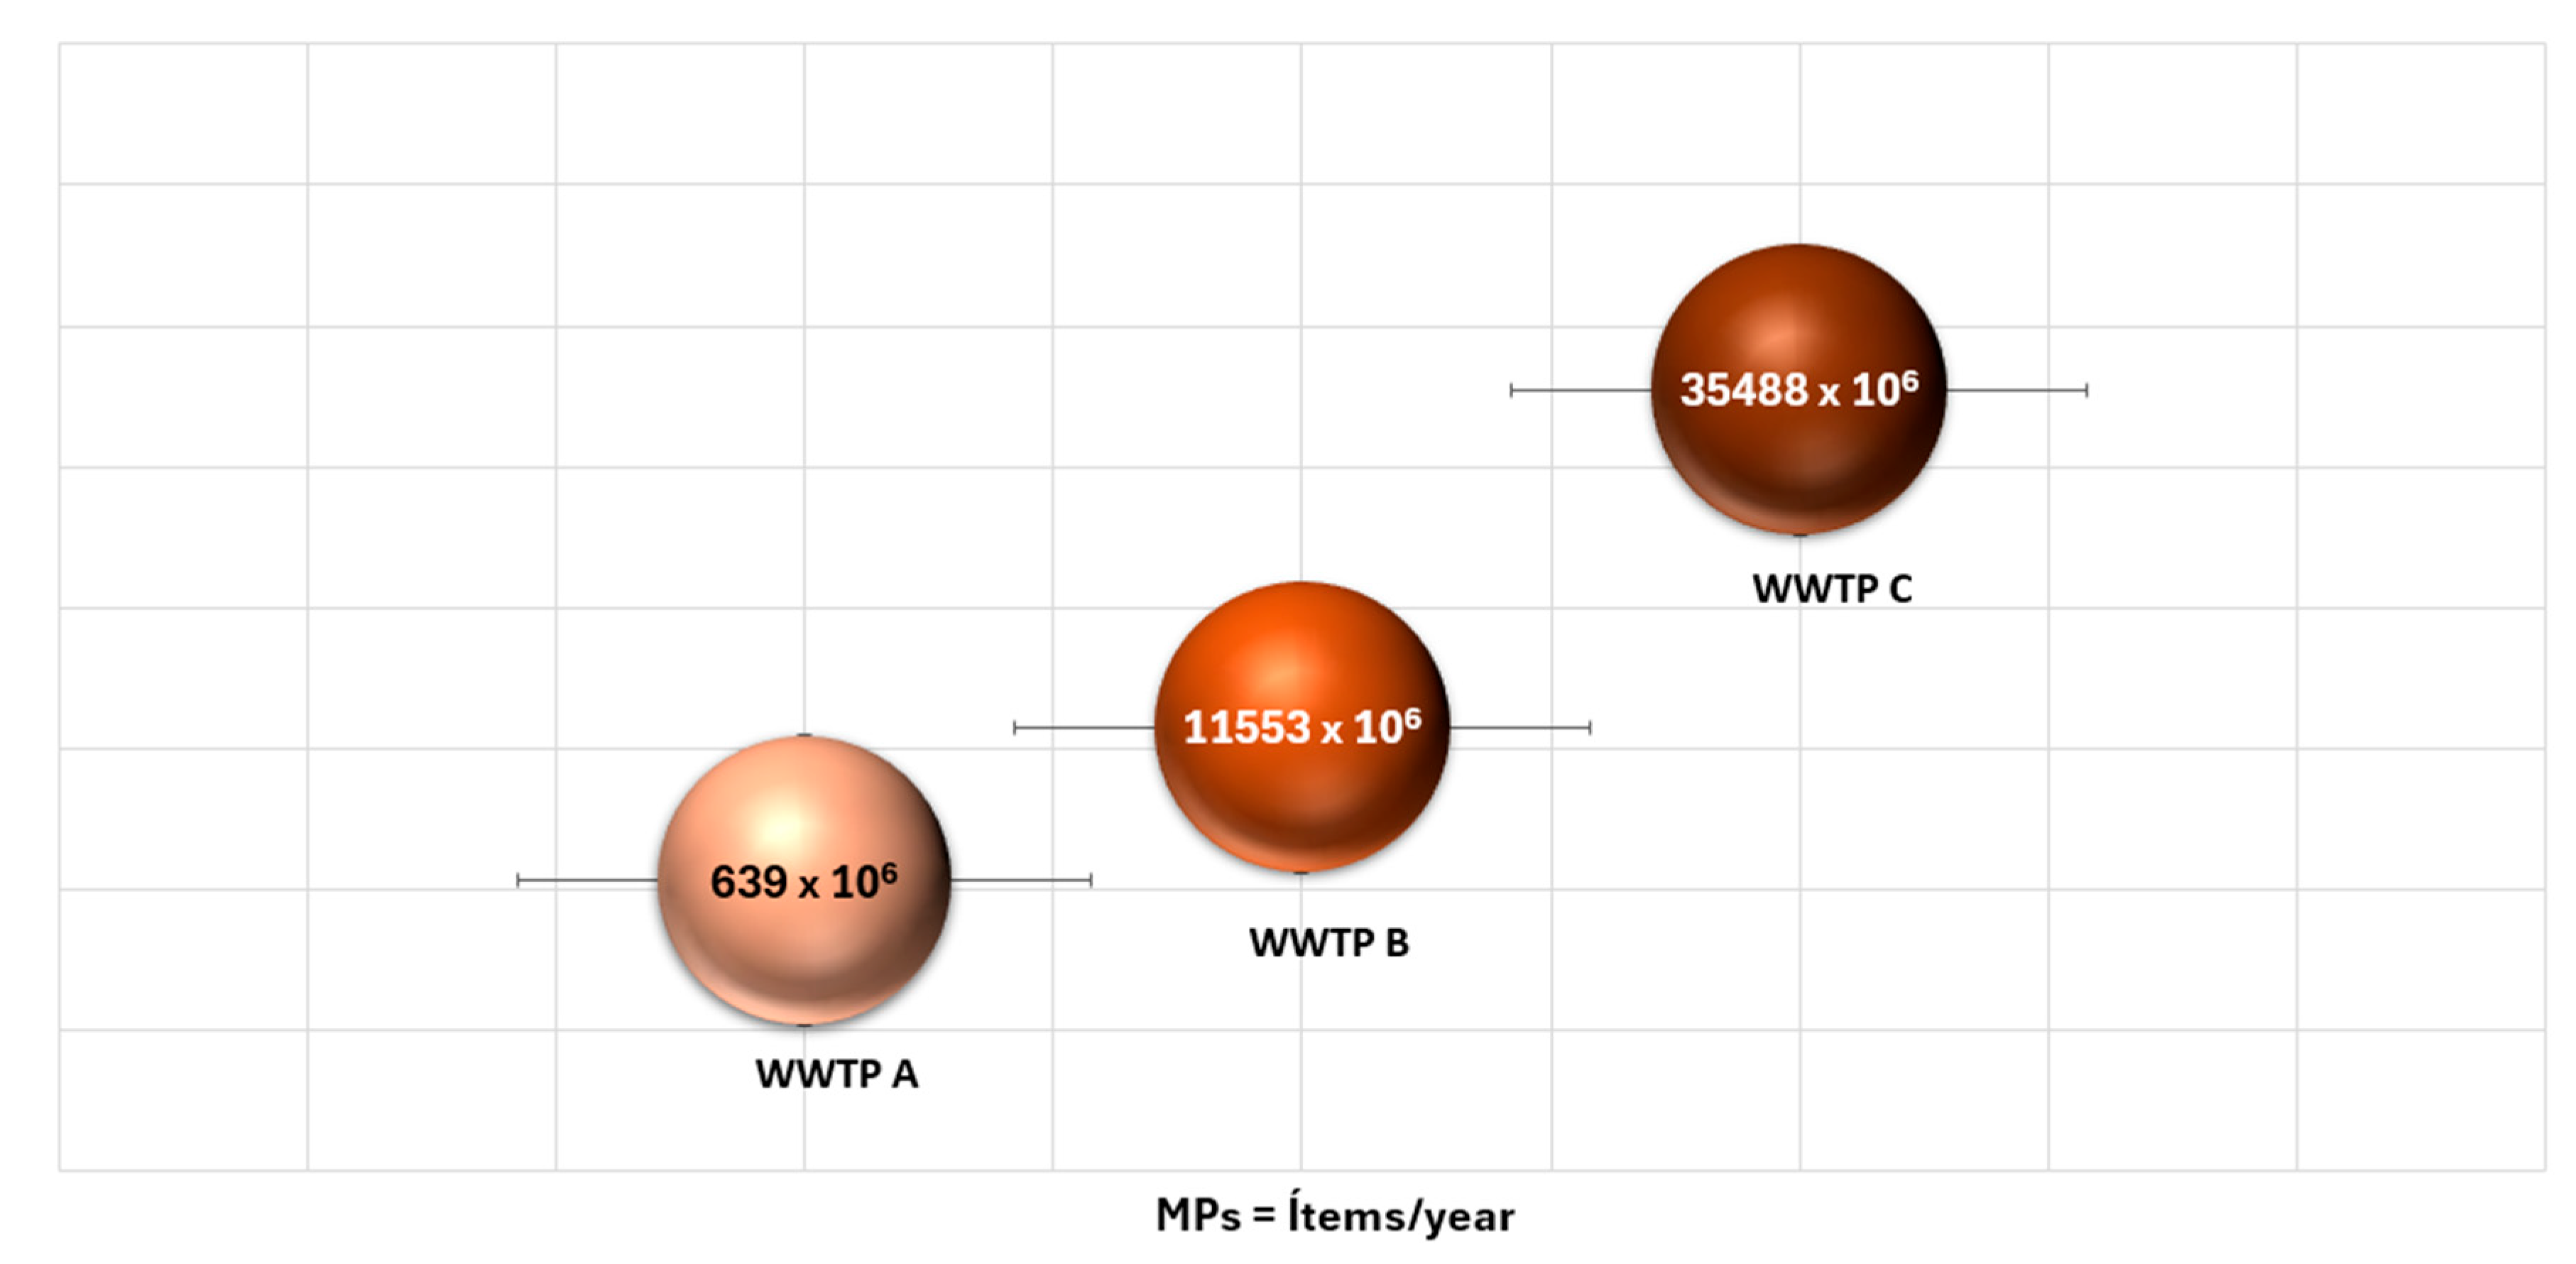

Table 1.
Concentration of MPs in three WWTPs in 2023.
| MP (Items/L) | ||||
|---|---|---|---|---|
| June | July | September | October | |
| WWTP A | 830 ± 33.60 | 537 ± 11.85 | 7650 ± 144.42 | 6583 ± 126.02 |
| WWTP B | 1207 ± 58.18 | 1357 ± 33.71 | 9300 ± 240.95 | 8803 ± 81.45 |
| WWTP C | 1470 ± 6.00 | 1640 ± 58.13 | 4813 ± 182.50 | 5180 ± 46.13 |
Note: Sampling conducted during dry periods (June and July) and rainy periods (September and October).
Table 2.
According to their treatment systems.
| Groups | Count | Sum | Average | Variance | |||
| WWTP A | 4 | 15600 | 3900 | 13998552.67 | |||
| WWTP B | 4 | 20667 | 5166.75 | 20166628.25 | |||
| WWTP C | 4 | 13103 | 3275.75 | 3975238.917 | |||
| ANOVA | |||||||
| Source of Variation | SS | df | MS | F | P-value | F crit | |
| Between Groups | 7426966.17 | 2 | 3713483.08 | 0.29 | 0.754 | 4.26 | |
| Within Groups | 114421260 | 9 | 12713473.3 | ||||
| Total | 121848226 | 11 | |||||
Table 3.
According to their sampling periods.
| Groups | Count | Sum | Average | Variance | ||
| June | 3 | 3507 | 1169 | 103483 | ||
| July | 3 | 3534 | 1178 | 328183 | ||
| September | 3 | 21763 | 7254.33 | 5150706.33 | ||
| October | 3 | 20566 | 6855.33 | 3337156.33 | ||
| ANOVA | ||||||
| Source of Variation | SS | df | MS | F | P-value | F crit |
| Between Groups | 104009168 | 3 | 34669722.8 | 15.55 | 0.001 | 4.07 |
| Within Groups | 17839057.3 | 8 | 2229882.17 | |||
| Total | 121848226 | 11 | ||||
Table 4.
ANOVA according to treatment systems.
| Groups | Count | Sum | Average | Variance | |||
| WWTP A | 13 | 795.00 | 61.15 | 5206.14 | |||
| WWTP B | 13 | 1135.33 | 87.33 | 9914.17 | |||
| WWTP C | 13 | 831.33 | 63.95 | 7213.11 | |||
| ANOVA | |||||||
| Source of Variation | SS | df | MS | F | P-value | F crit | |
| Between Groups | 5373.41 | 2 | 2686.70 | 0.36 | 0.70 | 3.26 | |
| Within Groups | 268000.99 | 36 | 7444.47 | ||||
| Total | 273374.40 | 38 | |||||
Table 5.
ANOVA according to sampling period and analysis time.
| Groups | Count | Sum | Average | Variance | |||
| June | 13 | 1055 | 81.15 | 7267.14 | |||
| July | 13 | 1060 | 81.54 | 14293.44 | |||
| September | 13 | 6529 | 502.23 | 377811.03 | |||
| October | 13 | 6170 | 474.62 | 327377.76 | |||
| ANOVA | |||||||
| Source of Variation | SS | df | MS | F | P-value | F crit | |
| Between Groups | 2159209 | 3 | 719736.33 | 3.96 | 0.01 | 2.80 | |
| Within Groups | 8720992.308 | 48 | 181687.34 | ||||
| Total | 10880201.31 | 51 | |||||
Table 6.
ANOVA of MP morphology according to three treatment systems.
| Groups | Count | Sum | Average | Variance | ||
| WWPT A | 6 | 4680 | 780 | 1045434.8 | ||
| WWPT B | 6 | 5823 | 970.5 | 1819489.5 | ||
| WWPT C | 6 | 3868 | 644.67 | 931028.7 | ||
| ANOVA | ||||||
| Source of Variation | SS | df | MS | F | P-value | F crit |
| Between Groups | 321545.4 | 2 | 160772.7 | 0.13 | 0.88 | 3.68 |
| Within Groups | 18979764.8 | 15 | 1265317.7 | |||
| Total | 19301310.3 | 17 |
Table 7.
ANOVA according to sampling period and analysis time.
| Groups | Count | Sum | Average | Variance | |||
| M1 (June) | 7 | 124.77 | 17.82 | 782.49 | |||
| M2 (July) | 7 | 126.34 | 18.05 | 926.39 | |||
| M3 (September) | 7 | 892.68 | 127.53 | 24913.71 | |||
| M4 (October) | 7 | 685.53 | 97.93 | 16115.36 | |||
| ANOVA | |||||||
| Source of Variation | SS | df | MS | F | P-value | F crit | |
| Between Groups | 65965.06 | 3 | 21988.35 | 2.06 | 0.13 | 3.01 | |
| Within Groups | 256427.65 | 24 | 10684.49 | ||||
| Total | 322392.71 | 27 | |||||
Table 8.
Enthalpy of fusion of different synthetic reference polymers.
| Polymers | Enthalpy (J/g) |
|---|---|
| HDPE | 107.91 |
| PET | 42.59 |
| PP | 79.40 |
| PVC | ND |
Table 9.
Enthalpy of fusion of synthetic polymers present in sludge from different wastewater treatment plants (WWTPs).
Table 9.
Enthalpy of fusion of synthetic polymers present in sludge from different wastewater treatment plants (WWTPs).
| Samples | Temperature (°C) | Enthalpy (J/g) | |
|---|---|---|---|
| WWTP A | HDPE | 131.39 | 145.20 |
| PET | 250.10 | 45.28 | |
| PP | 167.18 | 75.19 | |
| WWTP B | HDPE | 131.19 | 121.22 |
| PET | 250.32 | 42.06 | |
| PP | 167.30 | 65.98 | |
| WWTP C | HDPE | 130.87 | 161.73 |
| PET | 250.0 | 47.77 | |
| PP | 167.45 | 63.06 |
Disclaimer/Publisher’s Note: The statements, opinions and data contained in all publications are solely those of the individual author(s) and contributor(s) and not of MDPI and/or the editor(s). MDPI and/or the editor(s) disclaim responsibility for any injury to people or property resulting from any ideas, methods, instructions or products referred to in the content. |
© 2025 by the authors. Licensee MDPI, Basel, Switzerland. This article is an open access article distributed under the terms and conditions of the Creative Commons Attribution (CC BY) license (http://creativecommons.org/licenses/by/4.0/).
Copyright: This open access article is published under a Creative Commons CC BY 4.0 license, which permit the free download, distribution, and reuse, provided that the author and preprint are cited in any reuse.


