
Submitted:
22 August 2025
Posted:
25 August 2025
You are already at the latest version
Abstract
Characterizing and enumerating microplastics (MPs) have received considerable attention in recent years. Most attention has focused on major waterways and especially in the water column. However, less is known about MPs in smaller lakes and tributaries, as well as in sediments, under both base flow and storm flow conditions. This study examines the role of an unnamed tributary in transporting microplastics and 6PPD-quinone from a major state highway into a small, salt-impacted, lake in Grand Rapids, Michigan. Water and sediment samples were collected over a one-year period to characterize microplastic types, abundances, and seasonal variability, while environmental conditions were monitored to assess storm event impacts. Results confirmed widespread microplastic presence in both habitats, with abundances ranging from 61–16,390 MPs/L. Many microplastics were black fragments, often unidentifiable but suspected to be rubber-derived. Storm events significantly increased microplastic transport, particularly in the tributary, where concentrations peaked at 16,390 /L during fall stormflow. 6-PPD-quinone concentrations were very low overall (<1 ng/L) with spikes during storm events in the tributary (up to 201 ng/L). Sediment analysis revealed higher microplastic abundances in the tributary compared to the lake, with black fragments dominating in both habitats. These findings underscore the critical role of storm-driven runoff in microplastic and chemical transport, highlighting the need for improved road infrastructure design to mitigate environmental impacts on downstream water bodies.
Keywords:
microplastics
; 6-PPD-quinone
; stormwater runoff
; tributary-lake system
; runoff
; salinity
1. Introduction
Plastic pollution is a global environmental issue due to the overproduction and mismanagement of plastic waste [1]. Because plastics are highly durable, they can persist in the environment for decades or even centuries before they fully degrade [2]. During the life cycle of a plastic, environmental factors such as mechanical stress, thermal exposure, and biological activity can cause it to fragment into smaller particles. Microplastics (MPs), defined as plastic particles <5 mm, are particularly concerning because of their persistence and ability to impact food webs through either direct ingestion or indirect uptake of contaminants that adsorb to the plastisphere, leading to potential harm to aquatic organisms [3,4,5,6]. MPs exhibit diverse physical and chemical properties, including variations in size, shape, color, and composition, which influence their transport, environmental persistence, and interaction with aquatic life [7].
Climate-driven changes in precipitation have resulted in more episodic but intense storm events, resulting in higher and more erosive flows [8]. Runoff from these storms can collect MPs from road surfaces, brake pads, car tires, and road paint [9,10]. Once in waterways, the movement of MPs can be affected by water currents, wind patterns, and MP density. Buoyant MPs can travel large distances from where they were discarded and once colonized by microbes, form a plastisphere that increases MP density and results in their settling onto the sediment. The sinking velocity can be influenced by particle density, shape, biofouling, size, and fluid density of the water body [11]. Urban lakes are particularly vulnerable to MPs due to their proximity to impervious surfaces that expedite urban runoff [12], and serve as temporary or long-term sinks for MPs [9]. Fish and wildlife ingestion of MPs is well-documented, as zooplankton, benthic invertebrates, and fishes are known to consume MPs because of their similar size and appearance to food sources, which ultimately can result in transfers through the trophic food web [13,14,15,16].
The current study builds on prior studies and extends our understanding of MP transport and fate with the following objectives: (1) quantify MP concentrations, types, and abundances in a highly salt-impacted tributary and lake; and (2) assess the role of storm events in MP transport in this urban tributary-lake system. Although largely a qualitative study, we did hypothesize that MP densities would be (1) greater after storm events compared to base flow conditions and (2) more abundant in lake sediments than in the lake water column. Understanding MP transport dynamics in urban lakes is critical for developing strategies to reduce contamination and protect aquatic ecosystems.
2. Methods
2.1. Study Site
Church Lake, a 7.7-ha urban lake in Kent County, Grand Rapids, Michigan (Figure 1), is impacted by runoff from the East Beltline highway, which carries an annual average daily traffic (AADT) of 44,270 vehicles [17], an 18% increase since 2020. Runoff from this heavily trafficked highway flows into an unnamed tributary that feeds directly into Church Lake, contributing significant pollutants such as deicing salts and MPs. The lake’s deepest region (~16.5 m; Figure 1) exhibits a permanent halocline at ~9 m, formed by years of road salt runoff, inhibiting seasonal mixing and leading to excess chloride in the hypolimnion [18]. Efforts to mitigate runoff and erosion in the tributary are limited to vegetation buffers on private properties around the lake and steel-sheet check dams in the tributary designed to reduce water velocity and sediment transport; however, buoyant pollutants such as MPs can bypass the dams, posing ongoing environmental challenges.
2.2. Field Sampling
2.2.1. Microplastics – Lake
A total of 26 samples were taken between May 2022 and April 2023, which included 7 lake water samples, 2 sediment samples (one tributary, one lake), 5 storm event tributary water samples, and 12 water baseflow tributary water samples (one per month) (Figure 1). Lake samples were taken from June 2022- April 2023; two replicate samples at each station in each season (winter, fall, spring, summer) except for winter when only one sample was taken due to unsafe ice conditions, resulting in a total of 7 lake water samples. Water samples were collected in 1L glass containers. Before closing the lid to the container, aluminum foil was placed on top of the glass container to prevent MP contamination from the cap. A vertical Van Dorn sampler was used to retrieve lake MP samples from below the surface, at mid-depth, and 1m above the surface and then composited into a 1L glass container. Water samples were placed in a cooler until they were brought to the lab and placed in the refrigerator (4℃) until MP analysis. The lake sediment sample was collected with a petite ponor at ~9m depth in spring 2023.
2.2.2. Microplastics – Tributary
Water column samples were taken within the tributary once every month from May 2022-April 2023 for a total of 12 samples. Storm water sampling was conducted only if precipitation was preceded by 72 hr of dry weather and rain accumulation of > 0.25 cm. Five storm events were sampled from August 2022 - March 2023. The tributary is shallow, so sediment samples were obtained by pushing a 250 ml glass container into the sediment bed and capping the sample after retrieval.
All MP water and sediment samples were collected at randomly determined locations throughout the sampling time frame; this approach precluded measuring changes in the same location over time but provided a more robust estimate of MP distribution throughout the system.
2.3. Water Quality and Discharge Measurements
Water quality measurements were taken in the same area following the collection of water and sediment samples for MP analysis. Water quality parameters were measured using a Yellow Springs Instruments (YSI) EXO multi-sensor sonde, and included water temperature, pH, dissolved oxygen (DO), specific conductivity (Sp Cond), total dissolved solids (TDS), and turbidity (NTU).
Stream flow was measured at the time of MP collection using SonTek FlowTracker 2 at a permanently marked transect near the culvert closest to the highway. Water depth and velocity were measured at 6 equally spaced points at the transect using the velocity area method for discharge [19]. A HOBO logger device was placed near the unnamed tributary and recorded atmospheric pressure (kPa) and temperature (℃) every 10 minutes.
Precipitation data for storm events were obtained from the NOAA station website at the Gerald Ford International Airport (~13 km south of Church Lake) weather station.
2.4. MPs Quantification and 6-PPD-Quinone Analysis
MPs were quantified using a modified NOAA protocol by Illinois Sustainable Technology Center [20,21]. Aqueous samples underwent wet sieving (5 µm mesh), wet peroxide oxidation to remove organic material, and density separation using potassium iodide. Sediment samples were processed similarly to aqueous samples; however, density separation was performed first, and the light fraction underwent all subsequent stages used for water samples. The final stage of sample preparation involved isolation of the microplastics on aluminum oxide filters.
Filters with MPs were observed with a Zeiss Axioscope 5 fitted with an Axiocam 305 camera. The data acquired from microscopic analysis included particle counts, surface area, color, and shape. The surface area for the particles detected was then used to estimate the total mass of microplastics present [22]. The microplastic detected in this study ranged in size from 400 um2 to 25,000 mm2. Microplastic was defined as any solid material in the appropriate size range that was resistant to wet peroxide oxidation, exhibited flotation in a solution with a density of 1.7 g/mL, and passed positive visual inspection under a microscope.
A Thermo Scientific iN10 Infrared (IR) microscope was used for polymer analysis. The filter was first imaged in panoramic mode and then it was processed by the particle wizard application the OMNIC Picta software package. The wizard identified particles greater than 400 µm2 in size, adjusted the IR laser to the appropriate aperture for each particle, and performed 16 scans in reflectance mode for each detection. A background scan was also performed for each aperture size. The spectra obtained were then searched in the Hummel Polymer Infrared Spectral database. Only polymers with an 80% or greater match to those reported in the library were reported. Those that had matches less than 80% were reported as unidentified.
The tire antioxidant transformation product 6-PPD-quinone (6-PPD-Q) was isolated from aqueous samples using solid phase extraction (SPE). Prior to extraction, all samples were spiked with isotopically labeled 6-PPD-Q. SPE cartridges (200 mg, 6 mL Oasis HLB, Waters, MA), packed with glass wool, were preconditioned with 5 mL methanol followed by 25 mL of laboratory-grade water. One liter of each water sample was loaded onto the cartridges at a flow rate of 5–10 mL/min. After sample loading, cartridges were rinsed with 10 mL of laboratory water, dried for 10 minutes, and eluted with four 2.5 mL aliquots of methanol. Eluates were concentrated to 1 mL under a gentle stream of nitrogen and transferred to autosampler vials. Extracts were stored at −20 °C until LC-MS/MS analysis.
For LC-MS/MS analysis, separation was performed using an Acquity UPLC BEH Shield RP18 column (2.1 × 50 mm, 1.7 μm) with a corresponding guard column (2.1 × 5 mm), maintained at 45 °C. A 20 μL injection was made, and a binary gradient elution was applied at a flow rate of 0.4 mL/min. The mobile phases consisted of 0.1% formic acid in water (A) and methanol (B), with the following gradient: 5% B (0–1 min), 50% B (1–4 min), 100% B (4–11 min), and 5% B (11–13 min). Ionization was carried out in positive electrospray mode (ESI+), and data were acquired in multiple reaction monitoring (MRM) mode. The monitored transitions for 6-PPD-Q were m/z 269.3 > 184.2 (quantification) and 269.3 > 107.3 (confirmation). Additional operating parameters included: heating gas flow of 5 L/min, interface temperature of 300 °C, and drying gas flow of 10 L/min. These methods follow those described by [23].
2.5. Statistical Analysis
All statistics and data visualization were conducted with R version 4.3.1 [24] using R studio version 4.2.2 [25]. Correlations between MP abundance, discharge, and specific conductivity were computed as Pearson’s r; data were log-transformed when appropriate to meet the assumption of normality. Linear relationships between abundance and discharge were computed nonparametrically using Theil-Sen estimation via the RobustLinearReg package in R [26,27,28].
3. Results
3.1. Habitat: Lake
3.1.1. Environmental Conditions
Water samples taken from Church Lake began June 2022 and ended April 2023 (Table 1; Supplemental Table S1). Samples were taken from randomly determined sites to avoid sampling bias and obtain a comprehensive understanding of the lake. Lake water samples were taken in the summer (n=2), fall (n=2), winter (n=1), and spring (n=2). Summer water samples were the warmest (24.7 ℃); Dissolved oxygen (DO) was supersaturated in shallow regions and became hypoxic at ~10m, with relatively high conductivity in shallow areas (~2m: 841-864 µS/cm) and higher levels in deeper regions (~10m: 1230-1312 µS/cm) related to road salt runoff. pH was alkaline near the surface (8-9) and became circumneutral near the bottom. Turbidity was relatively low until ~10 m but an increase with depth may have been caused by disturbance of the sediment bed by the YSI sonde. Prior studies have shown that Church Lake thermally stratifies in summer months (Progressive AE, unpubl. data)[18]; in the current study, spring and summer thermal stratification was evident (Table 1; Supplemental Table S1).
The fall sampling was in shallow locations, where oxygen levels were all >5 mg/L, even at the deepest site sampled (6 m). Conductivity was again high in shallow areas (<6 m), ranging from 847-867 µS/cm (Supplemental Table S1). pH remained high (8) until ~6 m when it decreased very slightly.
Only one winter sample was taken because of the tenuous ice cover; this shallow sample had high DO and conductivity, with low temperature and alkaline pH (Table 1). During the spring months, temperatures were low (1 m: 5-11℃), and DO was supersaturated closer to the surface (15 mg/L) but decreased with depth. Conductivity was highest (866-941 µS/cm) in the shallower regions in the spring compared to the other seasons and increased with depth (979-1017 µS/cm) (Table 1; Supplemental Table S1).
3.1.2. MP Characteristics
MP density ranged from 61-880 counts/L in the lake water column with no clear seasonal trend (Table 3). Estimated MP mass ranged from 0.48-18 mg/L; for both counts and mass, larger values were measured in November and January than in other months (Table 3). 6-PPD-Q concentrations, an organic chemical frequently added to rubber, were all below detection (<1 ng/L).
Only two MP morphologies were identified in Church Lake samples: fragments, ranging in abundance from 59 to 783 counts/L, and fibers, ranging in density from 2 to 96 counts/L (Figure 2). A variety of MP colors were observed in Church Lake; however, black had the highest mean density, followed by grey and brown (Figure 3).
A variety of polymers and polymer additives were measured in Church Lake (Supplemental Table S4), although the unknown category was dominant (0.25 - 18.78 surface area mm2/L) on all sampling dates (Figure 4). Much smaller amounts were observed on just three sampling dates, and of those, the most abundant included polyamides and silicon-based materials (such as siloxanes) (Supplemental Table S4).
3.2. Habitat: Tributary
3.2.1. Baseflow Environmental Conditions
Samples taken in the tributary during (baseflow) occurred once every month (except July 2022) from May 2022 to April 2023 (Table 2). The July sample was lost during MP analysis and was not included in water quality analysis or figures. Sampling locations varied each month within the tributary to avoid unknown bias (Figure 1). Temperatures followed a typical temperate stream system, and DO levels were relatively high exceeding 7 mg/L throughout the year. Specific conductivity was high (848-1799 µS/cm) year-round with one exception (240 µS/cm) in October, which may be related to sonde error. The pH of ~8 was consistent year-round.
3.2.2. Baseflow MP Characteristics
MP abundance ranged over an order of magnitude in the tributary water column samples. MP abundances ranged from 127 - 1,293 counts/L and MP estimated masses ranged from 0.56 - 8.6 mg/L (Table 4). Concentrations of 6-PPD-Q, ranged from <1 - 24 ng/L. MP abundances peaked in October; however, the estimated masses were greatest in March (Table 4). October also had the greatest 6-PPD-Q concentration, with values from November through April below detection. Mean values of MP abundances in the water column of both the lake (416 counts/L) and the tributary during baseflow (413 counts/L) were almost identical.
The only MP shapes identified in the tributary water column were fragments (120 – 1,228/L) and fibers (8-293/L) (Figure 2). The respective mean counts of the shapes in the tributary were generally similar to those measured in the lake (fragments: 382 vs. 356; fibers: 34 vs. 57). There was no apparent seasonality to the MP shape distribution, although the peak number of fragments occurred in October whereas the peak number of fibers occurred in February (Supplemental Table S2).
MP colors that were measured in the tributary water column varied over time but as with the lake water column, black MPs were most abundant. The next most abundant colors were grey and green, whose appearance was sporadic (Supplemental Table S3). Most of the MPs in the Trib (baseflow) water samples were composed of polymers that were unidentifiable and classified as unknown (Figure 4). The remaining polymers and additives were measured in low concentrations, and included polyamide, cellulosic, ethylene vinyl alcohol, acrylic, polyester, and silicon based (Supplemental Table S4).
3.2.3. Stormflow Environmental Conditions
A total of 5 stormflow samples were taken in the tributary from August 2022 – March 2023. Storm sampling followed baseflow sampling as close as possible, allowing a comparison of storm flow to baseflow conditions. In general, there were few consistent differences in temperature, DO, and pH between baseflow and storm flow samples paired by date (Table 2). The one consistent difference was observed with specific conductivity, which was lower under storm flow than baseflow conditions (Table 2), presumably due to dilution.
3.2.4. Stormflow MP Characteristics
The range in MP counts during stormflow conditions was wider than during baseflow conditions, extending from 482 to 16,390 counts/L (estimated mass ranged from 0.60 - 13 mg/L). 6-PPD ranged from <1 - 201 ng/L. The highest MP counts occurred in October and the lowest occurred in August (Table 4); water column MP counts during stormflow were consistently higher (mean: 8,037/L) than during baseflow (mean: 413/L) for the paired dates, with the exceedance often greater than one order of magnitude (Table 4). 6-PPD concentration was greatest during October both stormflow and baseflow and with the former almost one order of magnitude greater than the latter (Table 4).
99% of MPs measured in stormflow were in the shape of fragments (472-15,734 counts/L) with the remaining 1% in the shape of fibers (non-detect-655 counts/L) (Figure 2; Supplemental Table S2). Fragments were slightly less dominant during baseflow (85%) than stormflow (99%). MP colors observed in stormwater samples were similar to baseflow with black dominating, followed by brown and grey (Figure 3; Supplemental Table S3).
MP polymer samples in stormflow were dominated by items labeled as unknown (Figure 4), with much smaller amounts of polyamide, cellulosic, and polyethylene (Figure 4). The polymers found in stormflow were less variable than the polymers that were found in baseflow.
Storm events can be hotspots for MP in runoff (e.g., [29]). Unfortunately, we were unable to obtain discharge data during storm events. However, during baseflow, when a relationship between MP abundance and flow would be less likely to be observed, we found moderate positive correlations between discharge and MP counts (Pearson’s r = 0.422) and mass (r = 0.356) despite the very small difference in discharge magnitude (Figure 5). Plotting the MP abundance data directly against discharge and using Theil-Sen estimation to fit a linear model reveals a significant relationship between discharge and counts (p = 0.046); a similar but not statistically significant trend is seen in the mass data (Figure 6). These data suggest that as baseflow increases, heavier MPs are mobilized into the water column resulting in the significant relationship with discharge. However, the MP counts remain similar over this constrained flow regime (0 to 0.007 m3/s).
3.3. Habitat: Sediment
3.3.1. Environmental Conditions
Sediment samples were taken once (Table 1 and Table 2). One sample was taken in the lake and a second from the tributary during baseflow. Water quality at both sites was very similar with cold temperatures, high conductivity (> 940 µS/cm), alkaline pH, and low turbidity. Water sampled in the lake before sediment samples were retrieved had a low temperature, relatively low DO, high conductivity (1017 µS/cm), slightly basic pH, and high surface DO.
3.3.2. Lake MP Characteristics
MP counts and mass were greater in lake sediment by orders of magnitude compared to any sampling date in the water column (Table 4). Fragments once again dominated the MP shapes, with only a small number of fibers within our detectable size range (Figure 2; Supplemental Table S2). Black MPs dominated the color category, with much smaller amounts of grey and brown (Figure 3; Supplemental Table S3). The majority of polymers in lake sediment MPs were classified as unknown, with far fewer cellulosic and silicon-based MPs (Figure 4; Supplemental Table S4).
3.3.3. Tributary MP Characteristics
Tributary sediment counts were more than twice the lake sediment counts, and like lake sediment, had orders of magnitude greater counts than measured in the tributary water column, even under stormflow conditions (Table 4). Only fragments were observed in the tributary sediment (Figure 2), and MP colors were dominated by black, followed by grey and brown (Figure 3; Supplemental Table S3). Similar to lake sediment samples, the majority of MPs polymers were classified as unknown, with smaller amounts of cellulosic and polyethylene MPS (Figure 4; Supplemental Table S4).
4. Discussion
The 20th century is now known as the “plasticene” or “age of plastic” due to the persistence and prevalence of plastic pollution caused by their durability and low cost of manufacturing [30]. Plastic pollution is a global phenomenon with a heavy historical emphasis on oceans [31] but it is a growing concern in the Laurentian Great Lakes [32,33]. Plastic debris has been seen to accumulate in open-water, coastal wetlands, shorelines, and benthic environments [34,35]. Many plastics have slow degradation rates and can introduce not only various polymers into the environment, but also a diversity of other chemicals used in the manufacturing process [36].
In addition to aesthetic concerns of plastics accumulating on land and beaches, MPs can potentially impact higher trophic levels through bioaccumulation in the food web. A review by Earn et al. [37] revealed plastic pollution had an effect on freshwater biota in 60% of the reported studies. They attributed MP shape and size as key determinants in whether or not an effect was noted. In addition to the polymer and its additives, impacts also can occur from contaminants that adhere to the biofilm (plastisphere) attaching to the MPs in the water column or in the sediment (cf. [4,5]).
4.1. Tributary Impacts
A number of studies have examined MP transport in lotic ecosystems, although mostly in large river systems. For example, Hoellein et al. [38] found that MP concentrations in the surface water of an urban river did not change over a 1900m reach although concentrations were greater in the benthic environment than in the water column. In a subsequent study, Hoellein et al. [39] found that MP shape had an effect on deposition in experimental streams, whereby depositional velocity was greatest among fragments, followed by fibers and pellets. Fragments dominated in our system, both in Church Lake and tributary. The tributary water column counts measured in the current study during baseflow ranged from 127 to 1293 particles/L, which are on the high range compared to other, larger systems where dilution may result in lower counts: 1 to 25 MP/L in San Francisco Bay watersheds [40]; 3-36 MP/L in Charleston Harbor Estuary [41]; and 1-17 MP/L in New South Wales [42].
Storm events result in non-point source runoff, which can include MPs [43]. If the storm events are sufficiently severe, they also can mobilize MPs that accumulated in sediments or benthic biofilm [44,45,46], translocating the MPs farther downstream. Few, if any, lotic studies have examined the behavior of MPs being transported directly from road runoff into a small tributary and then into an urban lake.
In the tributary, the juxtaposition of storm and baseflow sampling facilitated the comparison of stormflow MPs with baseflow MPs. MP abundance was considerably higher under stormflow than baseflow, as was also shown by Ross et al. [47]. This could be a function of road runoff collecting more MPs during storms or the erosive force of stormflow mobilizing MPs that had collected on or in the sediments or in biofilms [46]. It is also possible that different sampling locations within the tributary, selected randomly on each sampling event, may have resulted in differences that were related more to retention features, such as woody debris and vegetation [48,49], than to hydrology.
4.2. Lake
Not surprisingly, environmental conditions between the tributary and lake were quite different, as the lake was more susceptible to seasonal changes in water quality than the tributary. Both systems are salt-impacted from de-icing salt that is applied to the East Beltline Highway, which flows from the highway median into a culvert that feeds the tributary and the lake [18]. Indeed, parts of Church Lake are now meromictic (no longer mix), even when the water column is isothermal, due to the denser salt layer in the lake’s hypolimnion. As a consequence, MPs that sink to the sediment, either due to their own density or increased density from biofouling [50] have little opportunity to be resuspended into the epilimnion, and instead accumulate on the lake bottom. Biofouling of MPs is influenced by water quality; hence, the different water quality characteristics within Church Lake [18] likely influenced biofilm development on MPs [12], which in turn, influenced their distribution and abundance in the sediments [48]. This highlights the importance of understanding habitat-specific dynamics in assessing microplastic distribution. Salinization of freshwater bodies often involves “chemical cocktails” [51] but their interaction with microplastics is not well studied, other than MP presence in table salt (cf. [52]).
4.3. Sediment
The diversity of polymer types was slightly higher in the tributary sediment under baseflow conditions compared to lake sediment, suggesting the tributary may serve as a type of filter before the water reaches the lake. A more systematic spatial and temporal analysis is necessary to determine the variability of MPs in both systems. It has been reported that proximity to urban and stormwater runoff can influence the types of polymers present [29]. The most common polymers and additives found in stormwater runoff from highways are Polyethylene (PE), Polypropylene (PP), Polystyrene (PS), Polyethylene terephthalate (PET), acrylic, and polyamide [10,29]. In aquatic environments, studies have shown that less dense polymers (e.g., PE, PP, and PS) are more common in water while higher density polymers (polyamide, polyester, PVC, and acrylic) are dominant in sediments [29,34,53]. Overall, these comparisons highlight the complex dynamics of MP distribution and composition within aquatic ecosystems, influenced by factors such as water flow, sedimentation, and habitat characteristics.
4.4. MP Color
Studies that characterize MPs often include their color because visual aquatic consumers use color as a critical character when deciding on prey [29]. In our study, black MPs were consistently observed and dominated across all habitats; nonetheless, the proportion of black-colored samples varied, with tributary sediment samples showing higher counts of black MPs compared to lake water and lake sediment samples. Grey plastics also had abundant densities in both sediment habitats when compared to the water column samples, which may indicate that grey MPs entering the tributaries have higher densities than the rest of the polymers found. MP color also can influence biofilm growth, as MP color can affect light absorption and chemical composition [7]. A number of studies looking at MPs in tributaries near highways have observed black MPs from rubber eroded from car tires [40,41,54,55], which may have been the case in our study, as well. MP color likely had little influence on fish consumption in this small, very shallow tributary, but it may have had more significance in the lake, where shoreline residents claim there are a significant number of centrarchids.
4.5. 6-PPD-Q
Tire wear particles, of which 6-PPD-Q is a significant component [56], are produced by friction between the road surface and tire tread [57]. 6-PPD helps prevent tire degradation, but it can transform to 6-PPD quinone (6-PPD-Q), which after being connected to the mortality of coho salmon [58] has received increasing attention [56]. Despite the heavy road traffic on East Beltline Highway, 6-PPD-Q was measured at very low (or undetectable) levels on most occasions in our system. It is unknown if there may be interactions between 6-PPD-Q and road salt or microplastics that would increase its toxicity, but our measurements at least provide a baseline for future studies in the region.
4.6. Interaction with SALT
We were curious if there was a relationship between specific conductivity (as a proxy for road salt) and water column MPs in the tributary, based on the speculation that road salt runoff (and increased conductivity) would carry MPs that either are present on the road or perhaps in the salt itself. If so, then specific conductivity associated with de-icing salt runoff may serve as a surrogate for MPs. In fact, we did see a relationship between specific conductivity and MPs but it was negative, moderately so with MP counts and weak with MP mass (Figure 7). This negative relationship may be an artifact of limited observations (n = 10), different transit times for chloride vs. MPs, or another reason.
The characterization of MPs contributes to our understanding of plastic pollution in water bodies but this information alone does not equate to whether MPs are having an adverse impact on the biota. Specific studies are needed to examine if the densities, polymers, additives, and shapes of MPs in this Church Lake and tributary system are impacting the benthic and plankton communities directly or in concert with the salt pollution present in the system. Our findings highlight the complex dynamics of MPs pollution in freshwater ecosystems and underscore the need for continued monitoring and research to better understand the sources, fate, and impacts of MPs on aquatic biota and ecosystems.
5. Conclusions
MP abundance varied seasonally and between different habitats within the study area. The highest MP counts were measured in the lake during the winter months; the tributaries showed higher MP counts during the fall and winter. Storm events were identified as hotspots for MP runoff, contributing to elevated MP levels in the tributaries. The predominant MP shapes in both habitats were fragments; in other studies, fragments were prevalent more in sediment than in the water column [40,41,54,55].
Sampling location both within a waterbody as well as within the watershed may significantly affect the amount and characteristics of MPs present. For example, previous studies have seen that the proximity to highways or wastewater treatment plant runoff influences MP shape, polymer type, and abundance [40,41,55,59]. Our study contributes to the growing body of research on plastic pollution, particularly in the linkage of MP transport between lotic and lentic ecosystems [60], which can be significant and have potentially large implications on biotic integrity.
Supplementary Materials
The following supporting information can be downloaded at: Preprints.org.
Author Contributions
Conceptualization, Paris Velasquez and Alan Steinman; Methodology, Paris Velasquez, Lee Green, John Scott and Alan Steinman; Formal analysis, Paris Velasquez, Lee Green and John Scott; Investigation, Paris Velasquez; Resources, Alan Steinman; Writing – original draft, Paris Velasquez; Writing – review & editing, John Scott and Alan Steinman; Supervision, Alan Steinman; Project administration, Alan Steinman; Funding acquisition, Alan Steinman. All authors have read and agreed to the published version of the manuscript.”
Funding
Funding was provided by the Allen and Helen Hunting Research and Innovation Fund, Grand Valley State University Presidential Research Grant, and the Steinman Environmental Education Fund at the Community Foundation for Muskegon County.
Acknowledgments
We are grateful for field, laboratory, and administrative support provided by Jacqueline Molloseau, Allison Passejna, Mike Hassett, Brian Skull, Katie Tyrrell, Roxana Taylor, Heidi Feldpausch, Tonya Brown, and Travis Ellens at the Annis Water Resources Institute. In addition, Drs. Sarah Hamsher and Charlyn Partridge provided helpful comments. Thanks also to the Gardner family for permission to access the property where the field work was performed.
Conflicts of Interest
The authors declare that they have no personal relationships or competing financial interests that could have influenced the work reported in this paper.
References
- OECD Global Plastics Outlook: Economic Drivers, Environmental Impacts and Policy Options; OECD, 2022; ISBN 978-92-64-65494-5.
- Chamas, A.; Moon, H.; Zheng, J.; Qiu, Y.; Tabassum, T.; Jang, J.H.; Abu-Omar, M.; Scott, S.L.; Suh, S. Degradation Rates of Plastics in the Environment. ACS Sustain. Chem. Eng. 2020, 8, 3494–3511. [Google Scholar] [CrossRef]
- Amaneesh, C.; Anna Balan, S.; Silpa, P.S.; Kim, J.W.; Greeshma, K.; Aswathi Mohan, A.; Robert Antony, A.; Grossart, H.-P.; Kim, H.-S.; Ramanan, R. Gross Negligence: Impacts of Microplastics and Plastic Leachates on Phytoplankton Community and Ecosystem Dynamics. Environ. Sci. Technol. 2023, 57, 5–24. [Google Scholar] [CrossRef] [PubMed]
- Steinman, A.D.; Scott, J.; Green, L.; Partridge, C.; Oudsema, M.; Hassett, M.; Kindervater, E.; Rediske, R.R. Persistent Organic Pollutants, Metals, and the Bacterial Community Composition Associated with Microplastics in Muskegon Lake (MI). J. Gt. Lakes Res. 2020, 46, 1444–1458. [Google Scholar] [CrossRef]
- Scott, J.W.; Gunderson, K.G.; Green, L.A.; Rediske, R.R.; Steinman, A.D. Perfluoroalkylated Substances (PFAS) Associated with Microplastics in a Lake Environment. Toxics 2021, 9, 106. [Google Scholar] [CrossRef]
- Wright, S.L.; Thompson, R.C.; Galloway, T.S. The Physical Impacts of Microplastics on Marine Organisms: A Review. Environ. Pollut. 2013, 178, 483–492. [Google Scholar] [CrossRef] [PubMed]
- Badea, M.A.; Balas, M.; Dinischiotu, A. Microplastics in Freshwaters: Implications for Aquatic Autotrophic Organisms and Fauna Health. Microplastics 2023, 2, 39–59. [Google Scholar] [CrossRef]
- Wasko, C.; Nathan, R.; Stein, L.; O’Shea, D. Evidence of Shorter More Extreme Rainfalls and Increased Flood Variability under Climate Change. J. Hydrol. 2021, 603, 126994. [Google Scholar] [CrossRef]
- Alimi, O.S.; Farner Budarz, J.; Hernandez, L.M.; Tufenkji, N. Microplastics and Nanoplastics in Aquatic Environments: Aggregation, Deposition, and Enhanced Contaminant Transport. Environ. Sci. Technol. 2018, 52, 1704–1724. [Google Scholar] [CrossRef]
- Lutz, N.; Fogarty, J.; Rate, A. Accumulation and Potential for Transport of Microplastics in Stormwater Drains into Marine Environments, Perth Region, Western Australia. Mar. Pollut. Bull. 2021, 168, 112362. [Google Scholar] [CrossRef]
- Kowalski, N.; Reichardt, A.M.; Waniek, J.J. Sinking Rates of Microplastics and Potential Implications of Their Alteration by Physical, Biological, and Chemical Factors. Mar. Pollut. Bull. 2016, 109, 310–319. [Google Scholar] [CrossRef]
- He, S.; Jia, M.; Xiang, Y.; Song, B.; Xiong, W.; Cao, J.; Peng, H.; Yang, Y.; Wang, W.; Yang, Z.; et al. Biofilm on Microplastics in Aqueous Environment: Physicochemical Properties and Environmental Implications. J. Hazard. Mater. 2022, 424, 127286. [Google Scholar] [CrossRef]
- Bhatt, V.; Chauhan, J.S. Microplastic in Freshwater Ecosystem: Bioaccumulation, Trophic Transfer, and Biomagnification. Environ. Sci. Pollut. Res. 2023, 30, 9389–9400. [Google Scholar] [CrossRef] [PubMed]
- Nair, H.T.; Perumal, S. Trophic Transfer and Accumulation of Microplastics in Freshwater Ecosystem: Risk to Food Security and Human Health. Int. J. Ecol. 2022, 2022, 1–11. [Google Scholar] [CrossRef]
- Petersen, M.; Partridge, C. Impacts of Weathered Microplastic Ingestion on Gastrointestinal Microbial Communities and Health Endpoints in Fathead Minnows (Pimephales Promelas). J. Gt. Lakes Res. 2024, 50, 102374. [Google Scholar] [CrossRef]
- Setälä, O.; Fleming-Lehtinen, V.; Lehtiniemi, M. Ingestion and Transfer of Microplastics in the Planktonic Food Web. Environ. Pollut. 2014, 185, 77–83. [Google Scholar] [CrossRef]
- MDOT (Michigan Department of Transportation) 2022 Traffic Volumes 2024.
- Foley, E.; Steinman, A.D. Urban Lake Water Quality Responses to Elevated Road Salt Concentrations. Sci. Total Environ. 2023, 905, 167139. [Google Scholar] [CrossRef]
- Gore, J.A.; Banning, J. Discharge Measurements and Streamflow Analysis. In Methods in Stream Ecology, Volume 1; Elsevier, 2017; pp. 49–70 ISBN 978-0-12-416558-8.
- Masura, J.; Baker, J.; Foster, G.; Arthur, C. Laboratory Methods for the Analysis of Microplastics in the Marine Environment: Recommendations for Quantifying Synthetic Particles in Waters and Sediments. 2015.
- Scott, J.; Green, L. Development and Demonstration of a Superior Method for Microplastics Analysis: Improved Size Detection Limits, Greater Density Limits, and More Informative Reporting; Champaign, IL: Illinois Sustainable Technology Center, 2020. [Google Scholar]
- Prada, A.F.; Scott, J.W.; Green, L.; Hoellein, T.J. Microplastics and Per- and Polyfluoroalkyl Substances (PFAS) in Landfill-Wastewater Treatment Systems: A Field Study. Sci. Total Environ. 2024, 954, 176751. [Google Scholar] [CrossRef]
- Tian, Z.; Gonzalez, M.; Rideout, C.A.; Zhao, H.N.; Hu, X.; Wetzel, J.; Mudrock, E.; James, C.A.; McIntyre, J.K.; Kolodziej, E.P. 6PPD-Quinone: Revised Toxicity Assessment and Quantification with a Commercial Standard. Environ. Sci. Technol. Lett. 2022, 9, 140–146. [Google Scholar] [CrossRef]
- R Core Team. R: A Language and Environment for Statistical Computing. R Foundation for Statistical Computing, Vienna, Austria. 2023. https://www.R-project.org/.
- RStudio Team. RStudio: Integrated Development Environment for R. RStudio, Inc., Boston, MA. 2022. https://www.rstudio.com.
- Theil, H. A Rank-Invariant Method of Linear and Polynomial Regression Analysis. In Henri Theil’s Contributions to Economics and Econometrics; Raj, B., Koerts, J., Eds.; Advanced Studies in Theoretical and Applied Econometrics; Springer Netherlands: Dordrecht, 1992; ISBN 978-94-010-5124-8. [Google Scholar]
- Sen, P.K. Estimates of the Regression Coefficient Based on Kendall’s Tau. J. Am. Stat. Assoc. 1968, 63, 1379–1389. [Google Scholar] [CrossRef]
- Santiago, I. Hurtado. RobustLinearReg: Robust Linear Regressions 2020, 1.2.0,https://CRAN.R-project.org/package=RobustLinearReg.
- Shruti, V.C.; Pérez-Guevara, F.; Elizalde-Martínez, I.; Kutralam-Muniasamy, G. Current Trends and Analytical Methods for Evaluation of Microplastics in Stormwater. Trends Environ. Anal. Chem. 2021, 30, e00123. [Google Scholar] [CrossRef]
- Arpia, A.A.; Chen, W.-H.; Ubando, A.T.; Naqvi, S.R.; Culaba, A.B. Microplastic Degradation as a Sustainable Concurrent Approach for Producing Biofuel and Obliterating Hazardous Environmental Effects: A State-of-the-Art Review. J. Hazard. Mater. 2021, 418, 126381. [Google Scholar] [CrossRef]
- Zhao, S.; Kvale, K.F.; Zhu, L.; Zettler, E.R.; Egger, M.; Mincer, T.J.; Amaral-Zettler, L.A.; Lebreton, L.; Niemann, H.; Nakajima, R.; et al. The Distribution of Subsurface Microplastics in the Ocean. Nature 2025, 641, 51–61. [Google Scholar] [CrossRef]
- Lenaker, P.L.; Corsi, S.R.; Mason, S.A. Spatial Distribution of Microplastics in Surficial Benthic Sediment of Lake Michigan and Lake Erie. Environ. Sci. Technol. 2021, 55, 373–384. [Google Scholar] [CrossRef]
- Jefferson, A.J.; Kearns, K.; Snyder, K.; Mitchell, A.; Muratori, S.; Rowan, C.J. Anthropogenic Litter and Plastics across Size Classes on a Mechanically Groomed Great Lakes Urban Beach. J. Gt. Lakes Res. 2025, 51, 102505. [Google Scholar] [CrossRef]
- Driedger, A.G.J.; Dürr, H.H.; Mitchell, K.; Van Cappellen, P. Plastic Debris in the Laurentian Great Lakes: A Review. J. Gt. Lakes Res. 2015, 41, 9–19. [Google Scholar] [CrossRef]
- Gilbert, D.S.; Hayhurst, B.A.; Grubisich, S.; Schneider, N.; Martin, O.; DeNyse, C.; Chomiak, K.M.; Christina Tyler, A.; Eddingsaas, N.C. A Bellwether for Microplastic in Wetland Catchments in the Great Lakes Region. J. Gt. Lakes Res. 2024, 50, 102411. [Google Scholar] [CrossRef]
- Monclús, L.; Arp, H.P.H.; Groh, K.J.; Faltynkova, A.; Løseth, M.E.; Muncke, J.; Wang, Z.; Wolf, R.; Zimmermann, L.; Wagner, M. Mapping the Chemical Complexity of Plastics. Nature 2025, 643, 349–355. [Google Scholar] [CrossRef]
- Earn, A.; Bucci, K.; Rochman, C.M. A Systematic Review of the Literature on Plastic Pollution in the Laurentian Great Lakes and Its Effects on Freshwater Biota. J. Gt. Lakes Res. 2021, 47, 120–133. [Google Scholar] [CrossRef]
- Hoellein, T.J.; McCormick, A.R.; Hittie, J.; London, M.G.; Scott, J.W.; Kelly, J.J. Longitudinal Patterns of Microplastic Concentration and Bacterial Assemblages in Surface and Benthic Habitats of an Urban River. Freshw. Sci. 2017, 36, 491–507. [Google Scholar] [CrossRef]
- Hoellein, T.J.; Shogren, A.J.; Tank, J.L.; Risteca, P.; Kelly, J.J. Microplastic Deposition Velocity in Streams Follows Patterns for Naturally Occurring Allochthonous Particles. Sci. Rep. 2019, 9, 3740. [Google Scholar] [CrossRef]
- Werbowski, L.M.; Gilbreath, A.N.; Munno, K.; Zhu, X.; Grbic, J.; Wu, T.; Sutton, R.; Sedlak, M.D.; Deshpande, A.D.; Rochman, C.M. Urban Stormwater Runoff: A Major Pathway for Anthropogenic Particles, Black Rubbery Fragments, and Other Types of Microplastics to Urban Receiving Waters. ACS EST Water 2021, 1, 1420–1428. [Google Scholar] [CrossRef]
- Leads, R.R.; Weinstein, J.E. Occurrence of Tire Wear Particles and Other Microplastics within the Tributaries of the Charleston Harbor Estuary, South Carolina, USA. Mar. Pollut. Bull. 2019, 145, 569–582. [Google Scholar] [CrossRef] [PubMed]
- Hitchcock, J.N. Storm Events as Key Moments of Microplastic Contamination in Aquatic Ecosystems. Sci. Total Environ. 2020, 734, 139436. [Google Scholar] [CrossRef] [PubMed]
- Zhang, K.; Xu, S.; Zhang, Y.; Lo, Y.; Liu, M.; Ma, Y.; Chau, H.S.; Cao, Y.; Xu, X.; Wu, R.; et al. A Systematic Study of Microplastic Occurrence in Urban Water Networks of a Metropolis. Water Res. 2022, 223, 118992. [Google Scholar] [CrossRef]
- Hurley, R.; Woodward, J.; Rothwell, J.J. Microplastic Contamination of River Beds Significantly Reduced by Catchment-Wide Flooding. Nat. Geosci. 2018, 11, 251–257. [Google Scholar] [CrossRef]
- Guasch, H.; Bernal, S.; Bruno, D.; Almroth, B.C.; Cochero, J.; Corcoll, N.; Cornejo, D.; Gacia, E.; Kroll, A.; Lavoie, I.; et al. Interactions between Microplastics and Benthic Biofilms in Fluvial Ecosystems: Knowledge Gaps and Future Trends. Freshw. Sci. 2022, 41, 442–458. [Google Scholar] [CrossRef]
- Berg, E.M.; Speir, S.; Shogren, A.J.; Dee, M.M.; Vincent, A.E.S.; Tank, J.L.; Kelly, J.J.; Hoellein, T.J. Transport and Retention of Microplastic Fibers in Streams Are Impacted by Benthic Algae, Discharge, and Substrate. Limnol. Oceanogr. 2025, 70, 1093–1107. [Google Scholar] [CrossRef]
- Ross, M.S.; Loutan, A.; Groeneveld, T.; Molenaar, D.; Kroetch, K.; Bujaczek, T.; Kolter, S.; Moon, S.; Huynh, A.; Khayam, R.; et al. Estimated Discharge of Microplastics via Urban Stormwater during Individual Rain Events. Front. Environ. Sci. 2023, 11. [Google Scholar] [CrossRef]
- Semcesen, P.O.; Wells, M.G. Biofilm Growth on Buoyant Microplastics Leads to Changes in Settling Rates: Implications for Microplastic Retention in the Great Lakes. Mar. Pollut. Bull. 2021, 170, 112573. [Google Scholar] [CrossRef]
- Vincent, A.E.S.; Hoellein, T.J. Distribution and Transport of Microplastic and Fine Particulate Organic Matter in Urban Streams. Ecol. Appl. 2021, 31, e02429. [Google Scholar] [CrossRef]
- Gopalakrishnan, K.K.; Kashian, D.R. Complex Interactions among Temperature, Microplastics and Cyanobacteria May Facilitate Cyanobacteria Proliferation and Microplastic Deposition. Ecotoxicol. Environ. Saf. 2023, 263, 115259. [Google Scholar] [CrossRef] [PubMed]
- Kaushal, S.S.; Reimer, J.E.; Mayer, P.M.; Shatkay, R.R.; Maas, C.M.; Nguyen, W.D.; Boger, W.L.; Yaculak, A.M.; Doody, T.R.; Pennino, M.J.; et al. Freshwater Salinization Syndrome Alters Retention and Release of Chemical Cocktails along Flowpaths: From Stormwater Management to Urban Streams. Freshw. Sci. 2022, 41, 420–441. [Google Scholar] [CrossRef] [PubMed]
- Lee, H.-J.; Song, N.-S.; Kim, J.-S.; Kim, S.-K. Variation and Uncertainty of Microplastics in Commercial Table Salts: Critical Review and Validation. J. Hazard. Mater. 2021, 402, 123743. [Google Scholar] [CrossRef] [PubMed]
- Sang, W.; Chen, Z.; Mei, L.; Hao, S.; Zhan, C.; Zhang, W.B.; Li, M.; Liu, J. The Abundance and Characteristics of Microplastics in Rainwater Pipelines in Wuhan, China. Sci. Total Environ. 2021, 755, 142606. [Google Scholar] [CrossRef]
- Lange, K.; Österlund, H.; Viklander, M.; Blecken, G.-T. Occurrence and Concentration of 20–100 Μm Sized Microplastic in Highway Runoff and Its Removal in a Gross Pollutant Trap – Bioretention and Sand Filter Stormwater Treatment Train. Sci. Total Environ. 2022, 809, 151151. [Google Scholar] [CrossRef]
- Yano, K.A.; Geronimo, F.K.; Reyes, N.J.; Kim, L.H. Characterization and Comparison of Microplastic Occurrence in Point and Non-Point Pollution Sources. Sci. Total Environ. 2021, 797, 148939. [Google Scholar] [CrossRef]
- Zoroufchi Benis, K.; Behnami, A.; Minaei, S.; Brinkmann, M.; McPhedran, K.N.; Soltan, J. Environmental Occurrence and Toxicity of 6PPD Quinone, an Emerging Tire Rubber-Derived Chemical: A Review. Environ. Sci. Technol. Lett. 2023, 10, 815–823. [Google Scholar] [CrossRef]
- Wagner, S.; Hüffer, T.; Klöckner, P.; Wehrhahn, M.; Hofmann, T.; Reemtsma, T. Tire Wear Particles in the Aquatic Environment - A Review on Generation, Analysis, Occurrence, Fate and Effects. Water Res. 2018, 139, 83–100. [Google Scholar] [CrossRef]
- Tian, Z.; Zhao, H.; Peter, K.T.; Gonzalez, M.; Wetzel, J.; Wu, C.; Hu, X.; Prat, J.; Mudrock, E.; Hettinger, R.; et al. A Ubiquitous Tire Rubber–Derived Chemical Induces Acute Mortality in Coho Salmon. Science 2021, 371, 185–189. [Google Scholar] [CrossRef]
- Grbić, J.; Helm, P.; Athey, S.; Rochman, C.M. Microplastics Entering Northwestern Lake Ontario Are Diverse and Linked to Urban Sources. Water Res. 2020, 174, 115623. [Google Scholar] [CrossRef]
- Steinman, A.D.; Rosen, B.H. Lotic–Lentic Linkages Associated with Lake Okeechobee, Florida. J. North Am. Benthol. Soc. 2000, 19, 733–741. [Google Scholar] [CrossRef]
Figure 1.
Site location of Church Lake. (a) Location of lake in lower peninsula of Michigan. (b.) Pan view of Church Lake and the two other connecting lakes (Middleboro, Westboro). (c.) Close-up of Church Lake and the unnamed tributary that flows from the East Beltline to the urban Lake. Dots represent sampling locations: labels 1-7 correspond to a specific sampling date (month/year): 6/22 (1), 7/22 (2), 9/22 (3), 11/22 (4), 1/23 (5), 3/23 (6), 4/23 (7). (d.) Bathymetry of Church Lake retrieved from Progressive AE (unpubl. data); the Lake has residential housing on its south and west shorelines and is adjacent to the East Beltline state highway on its east side. Depth contours are in ft.
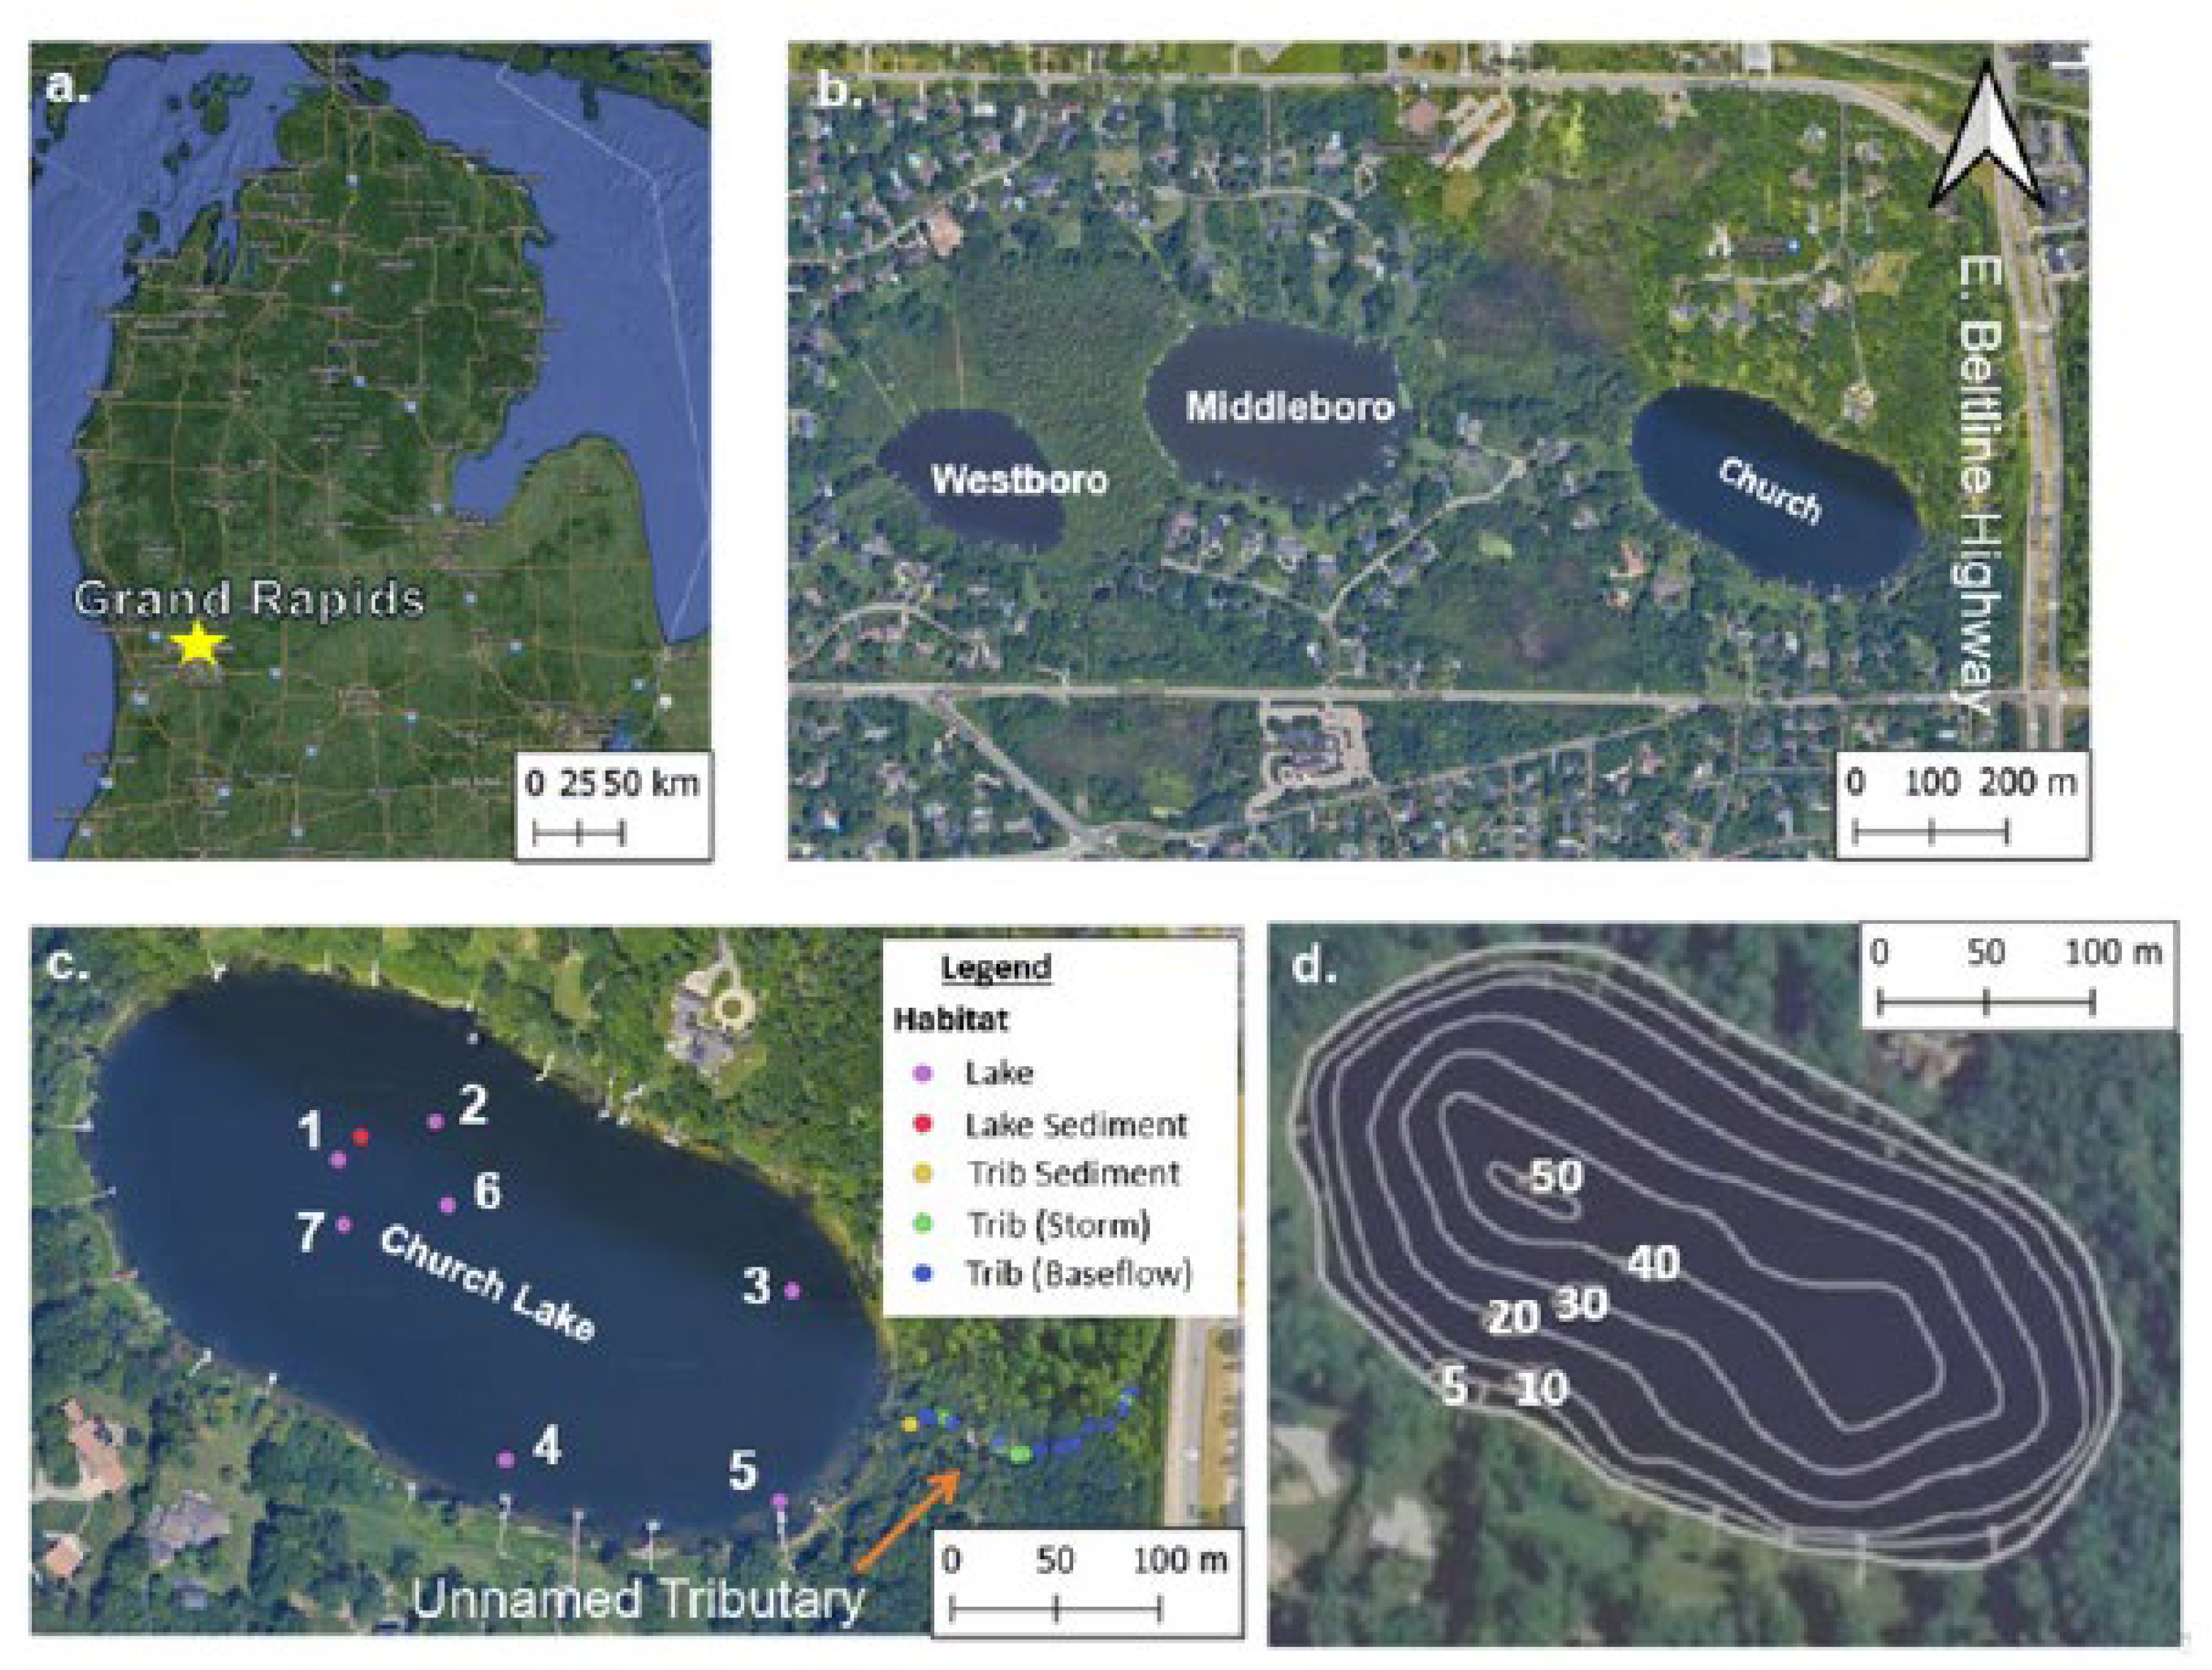
Figure 2.
MP counts in the water and sediment. Data from both habitats are directly comparable (1 L = 1 kg).
Figure 2.
MP counts in the water and sediment. Data from both habitats are directly comparable (1 L = 1 kg).
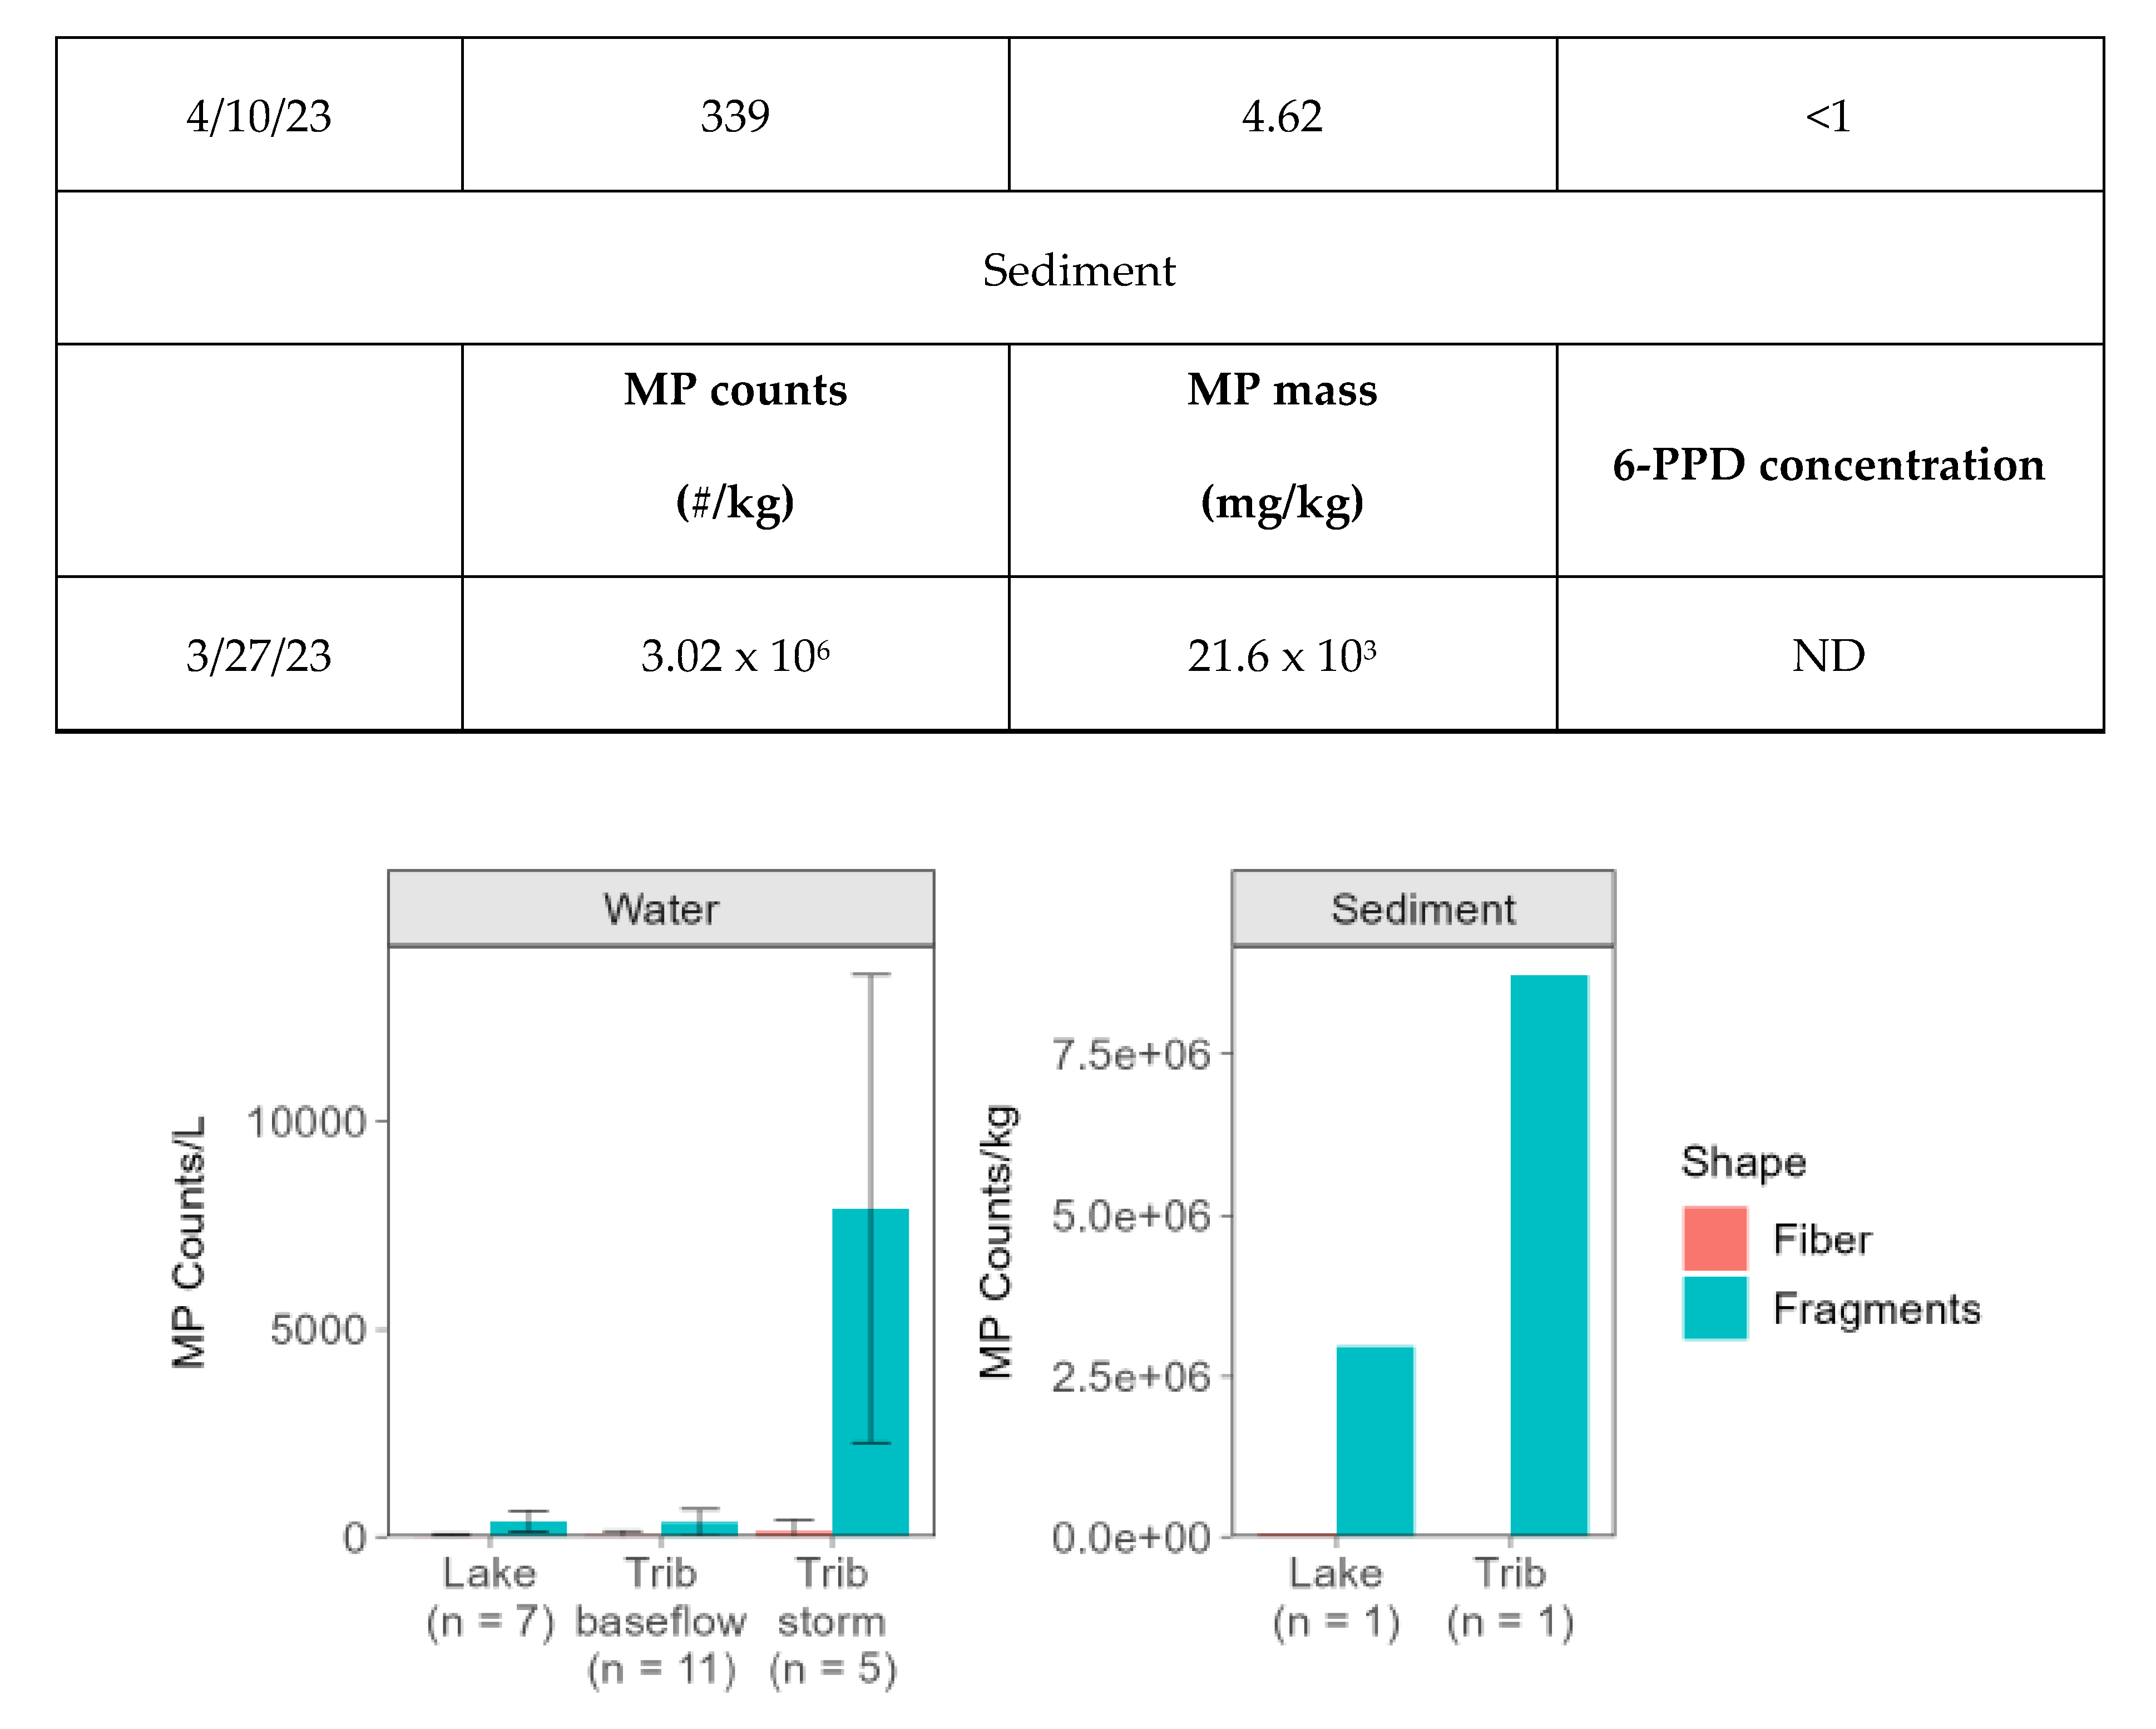
Figure 3.
Pie charts of MP colors based on MP counts from the water columns and sediments of the lake and tributary.
Figure 3.
Pie charts of MP colors based on MP counts from the water columns and sediments of the lake and tributary.
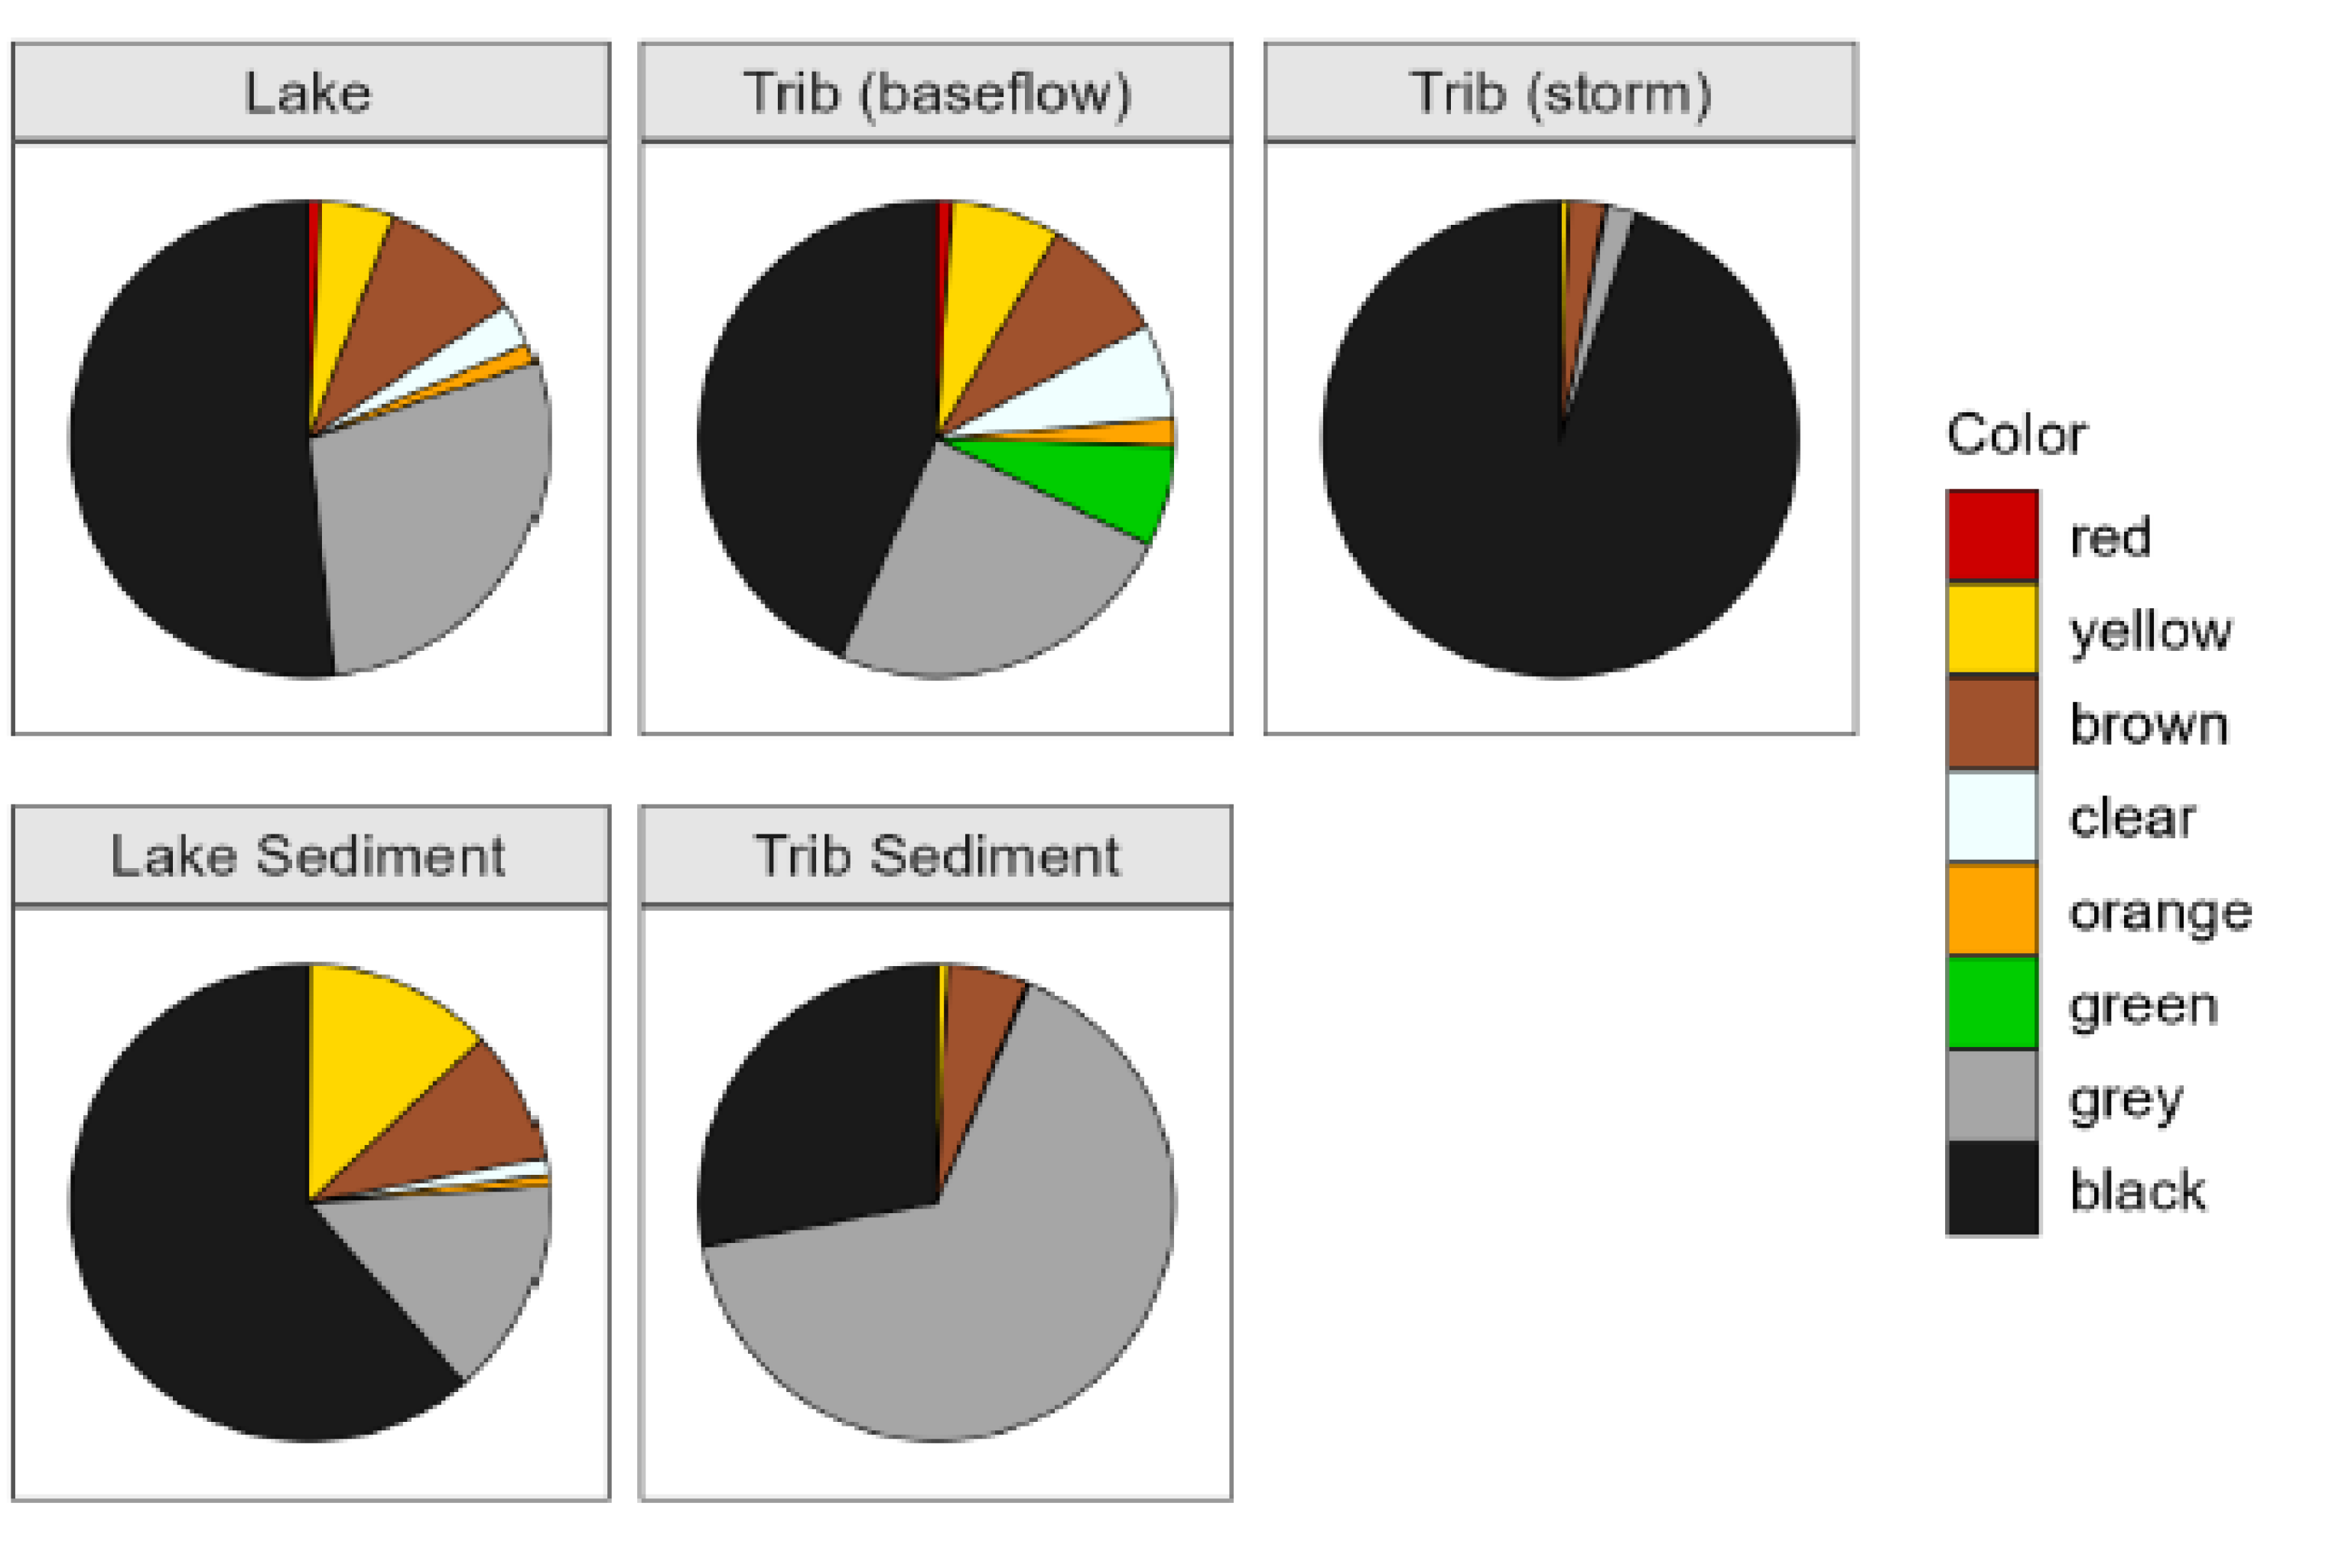
Figure 4.
Pie charts of MP polymers and additives. If polymer IDs could not be determined with greater than 80 % accuracy, the ID of the polymer is classified as unknown.
Figure 4.
Pie charts of MP polymers and additives. If polymer IDs could not be determined with greater than 80 % accuracy, the ID of the polymer is classified as unknown.
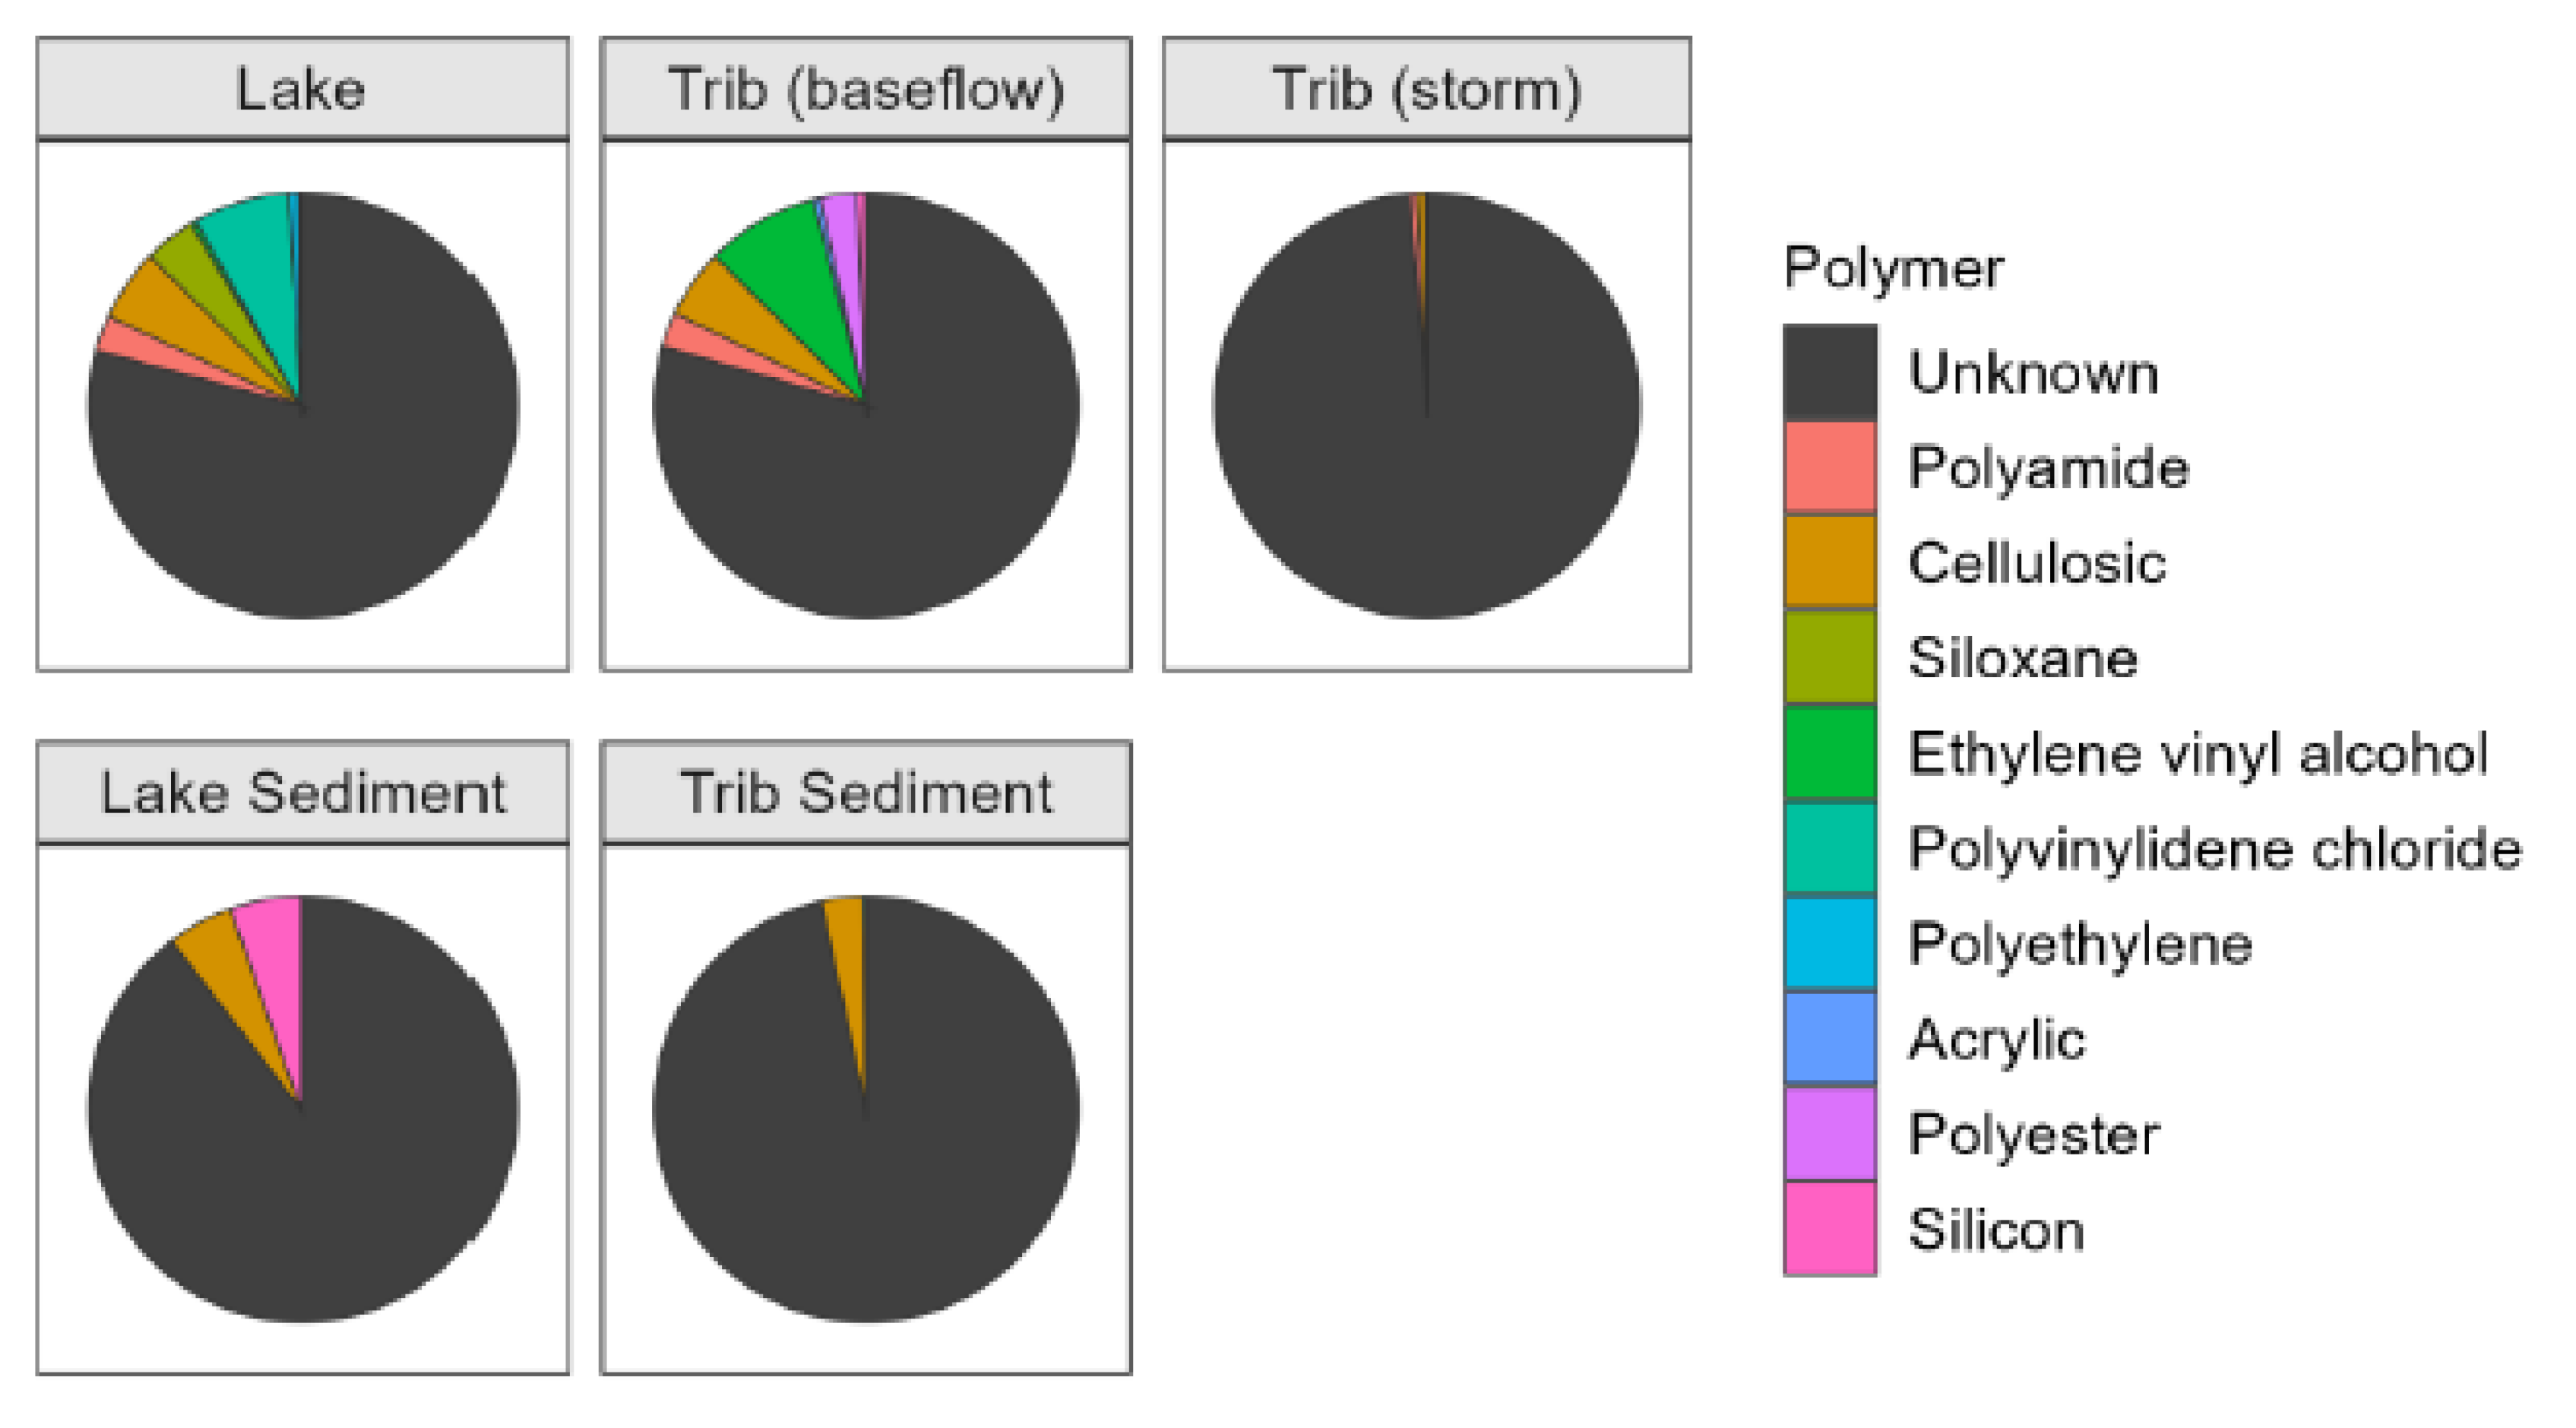
Figure 5.
MP counts (upper panel) and mass (lower panel) from water samples taken from the tributary at baseflow against discharge (n=10) over time. Pearson’s r values embedded in panels are based on ln-transformed data.
Figure 5.
MP counts (upper panel) and mass (lower panel) from water samples taken from the tributary at baseflow against discharge (n=10) over time. Pearson’s r values embedded in panels are based on ln-transformed data.
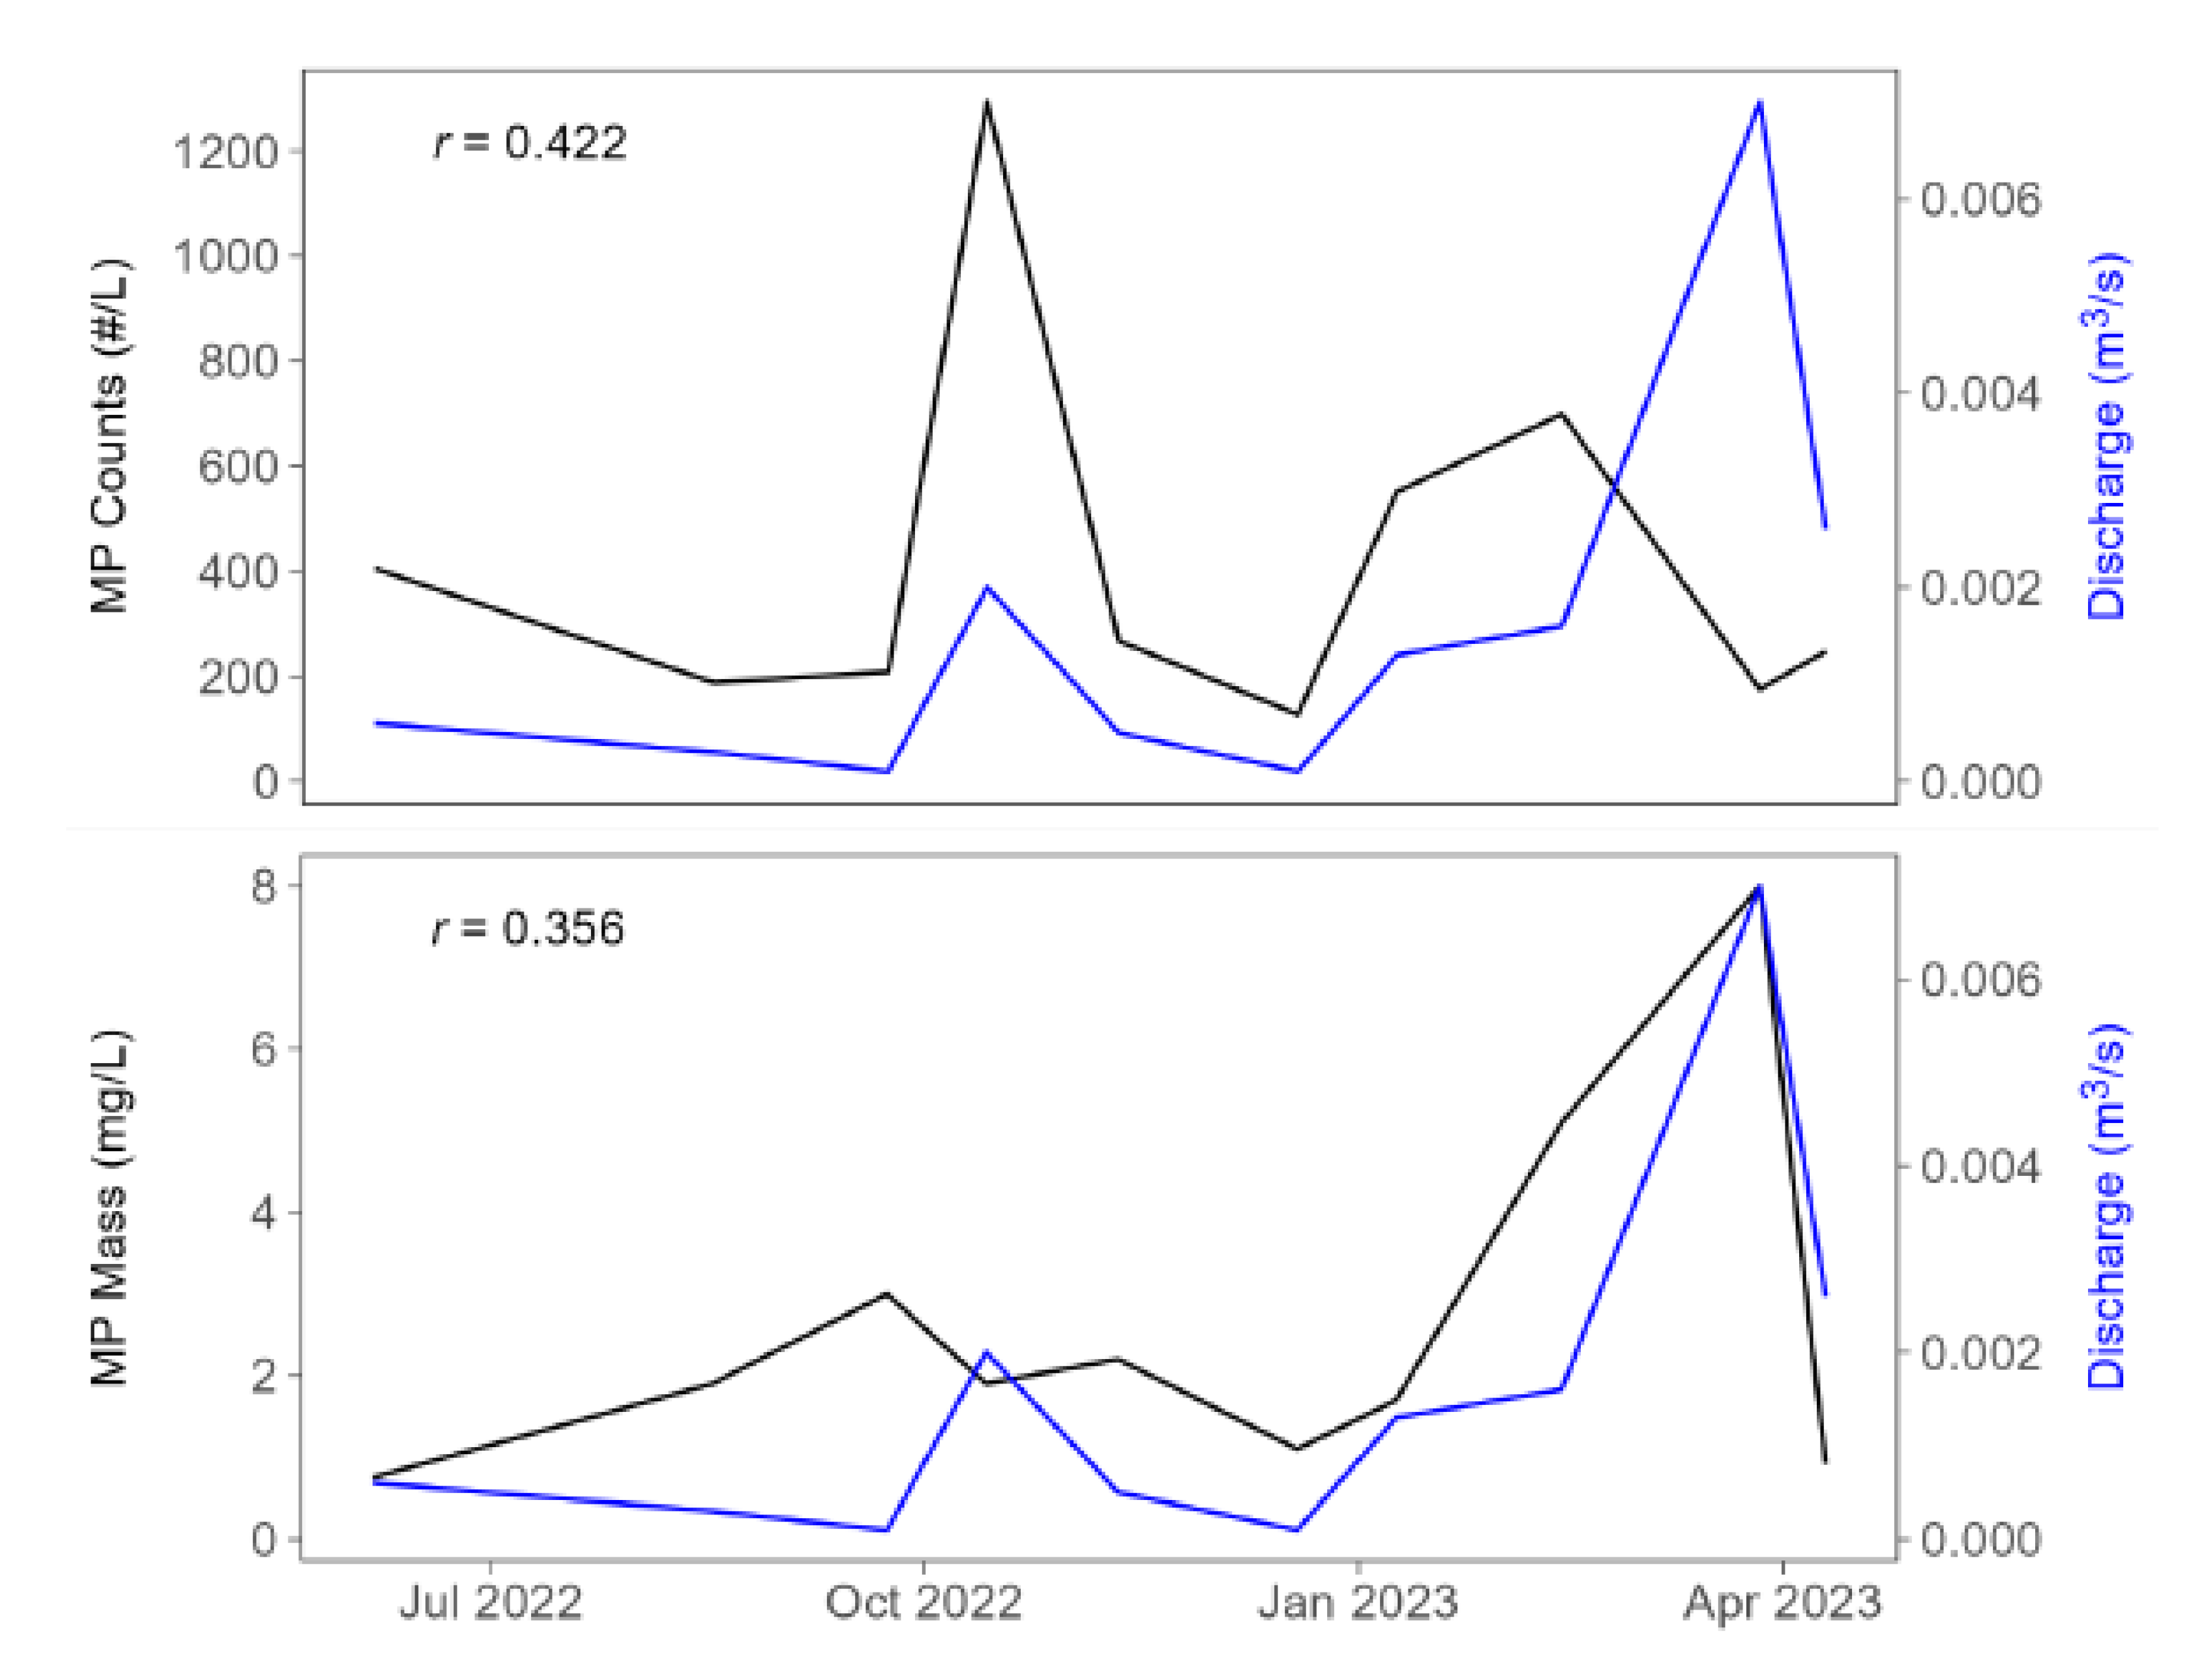
Figure 6.
Discharge (m3/s) vs. microplastics in the tributary (baseflow). Top: discharge vs. MP counts (#/L); bottom: discharge vs MP mass (mg/L). Trendline depicts linear model fit with Theil-Sen estimator. Shaded area represents the 95% confidence intervals for the regression line.
Figure 6.
Discharge (m3/s) vs. microplastics in the tributary (baseflow). Top: discharge vs. MP counts (#/L); bottom: discharge vs MP mass (mg/L). Trendline depicts linear model fit with Theil-Sen estimator. Shaded area represents the 95% confidence intervals for the regression line.
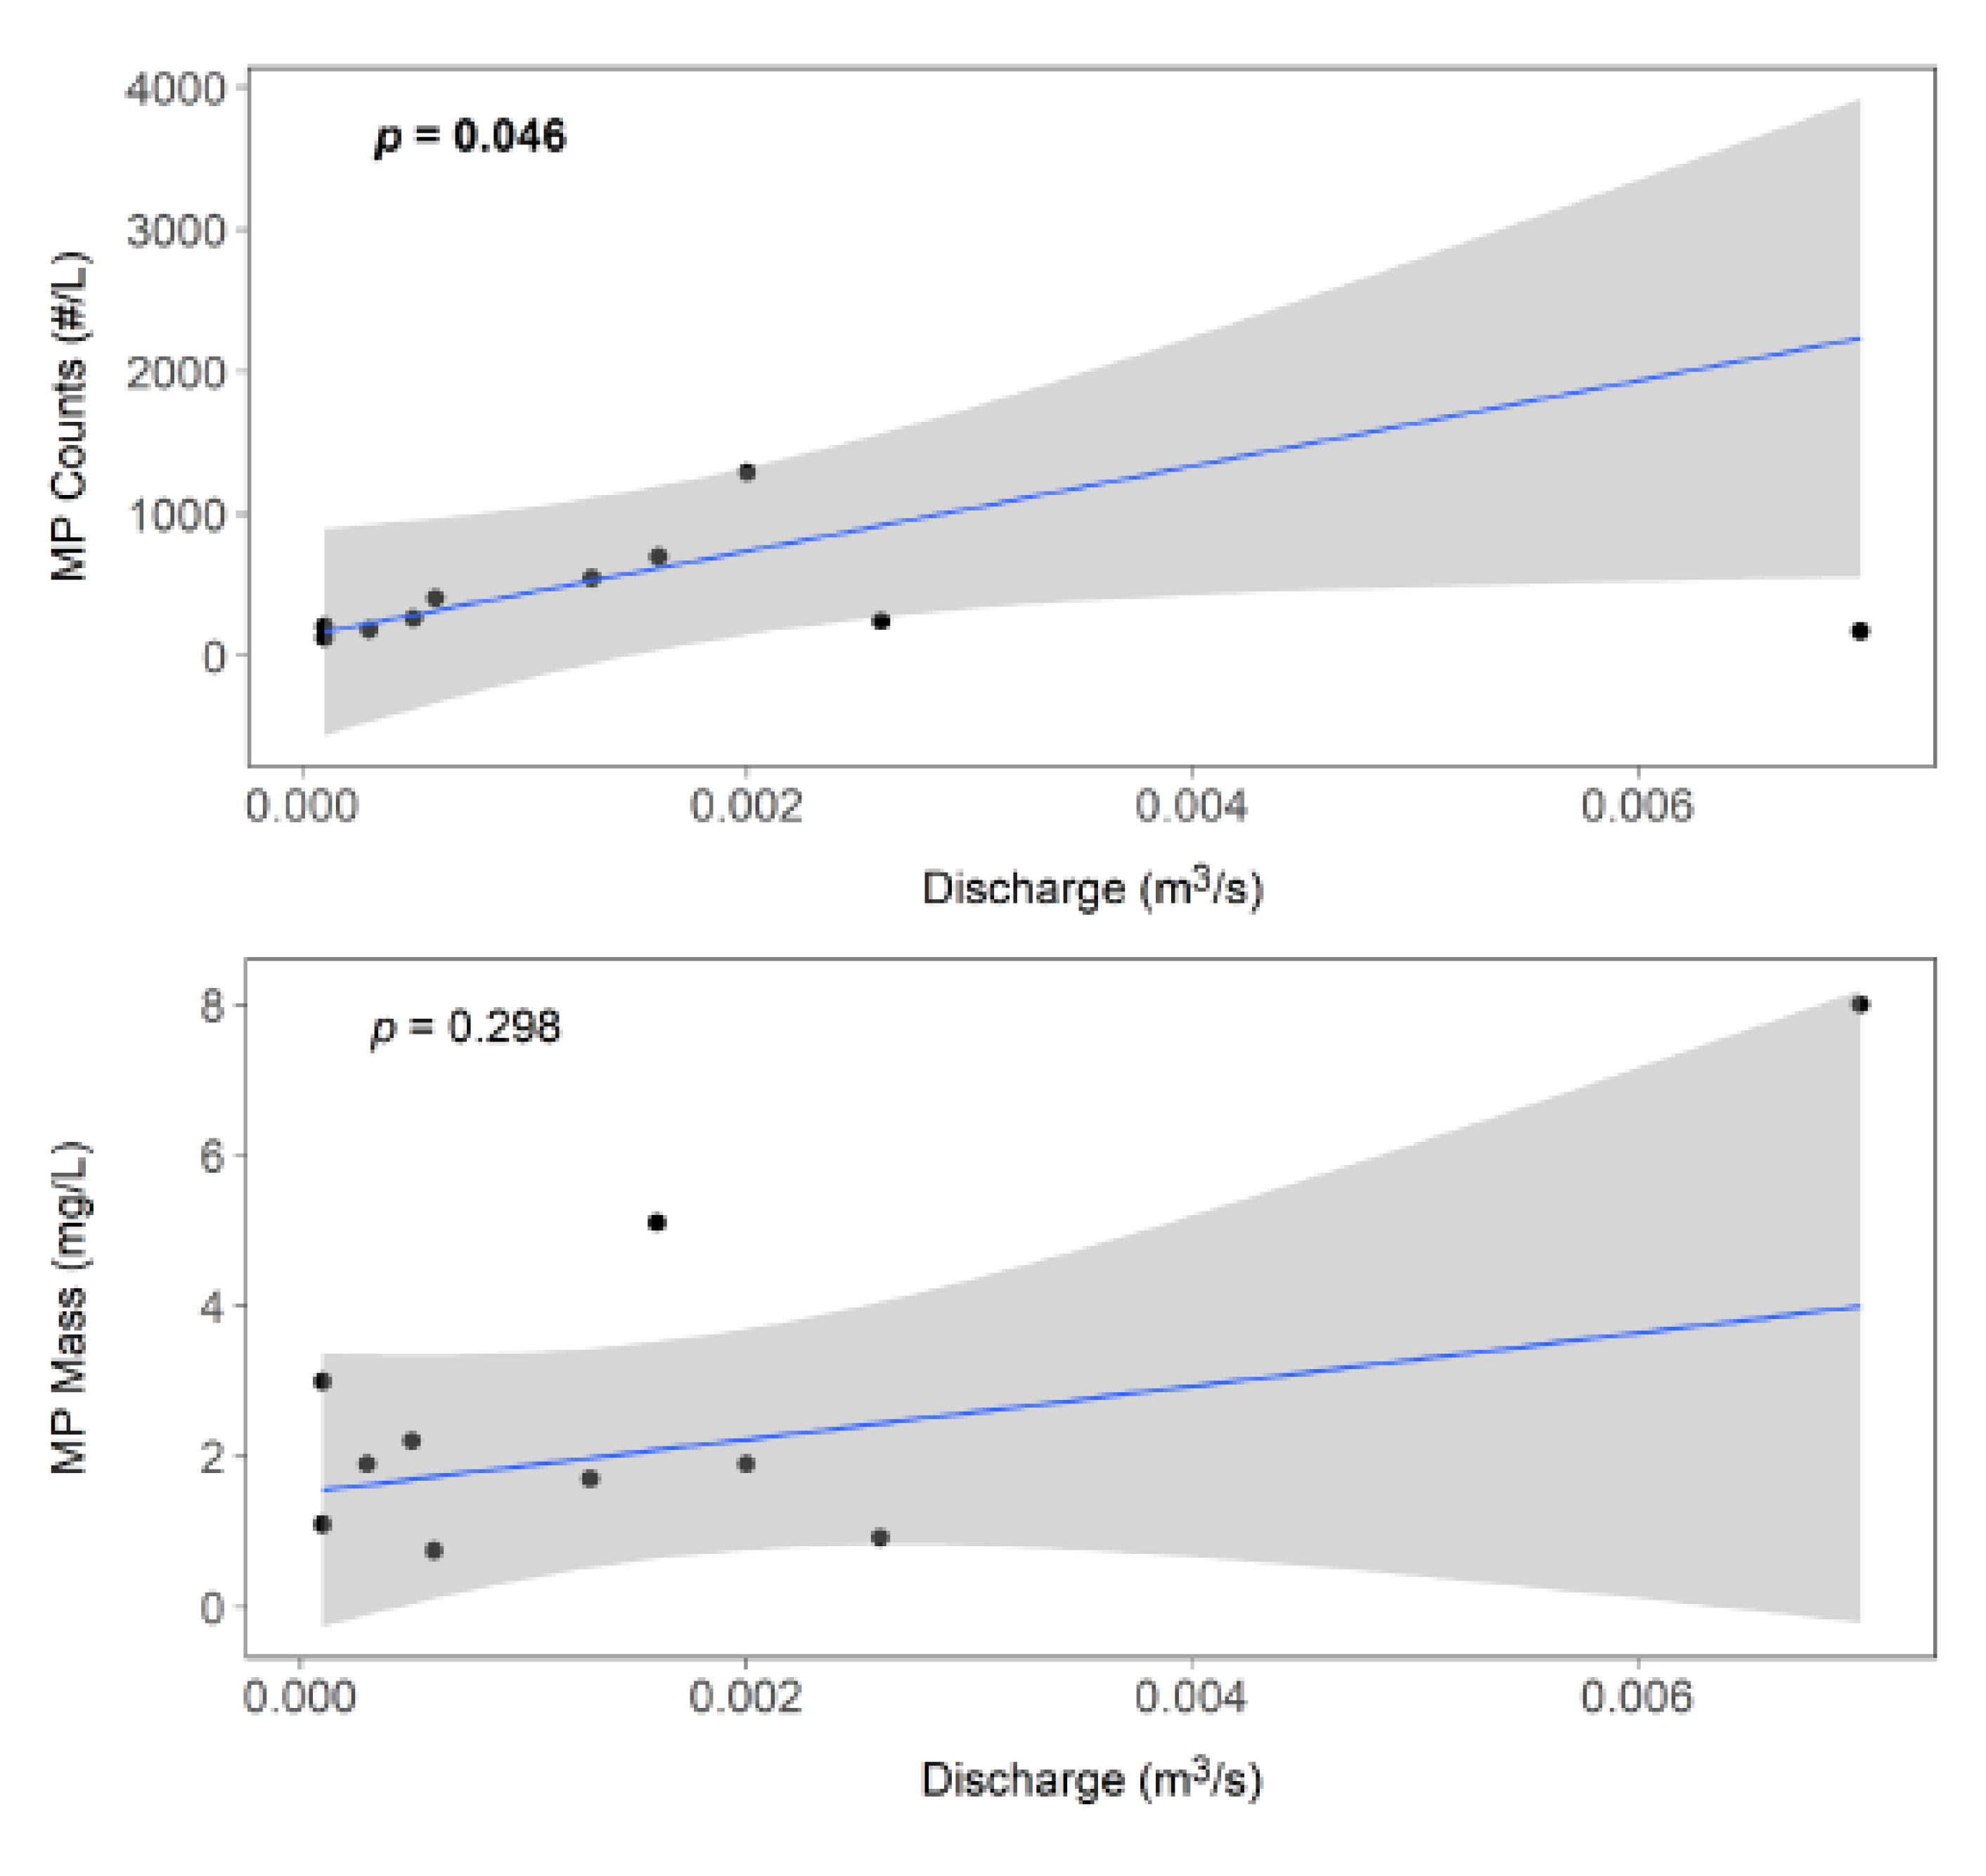
Figure 7.
Regression of microplastic counts (#/L; top panel) and MP mass (mg/L; bottom panel) (black lines) and specific conductivity (µS/cm) (red lines) over time. Pearson’s r values embedded in panels.
Figure 7.
Regression of microplastic counts (#/L; top panel) and MP mass (mg/L; bottom panel) (black lines) and specific conductivity (µS/cm) (red lines) over time. Pearson’s r values embedded in panels.
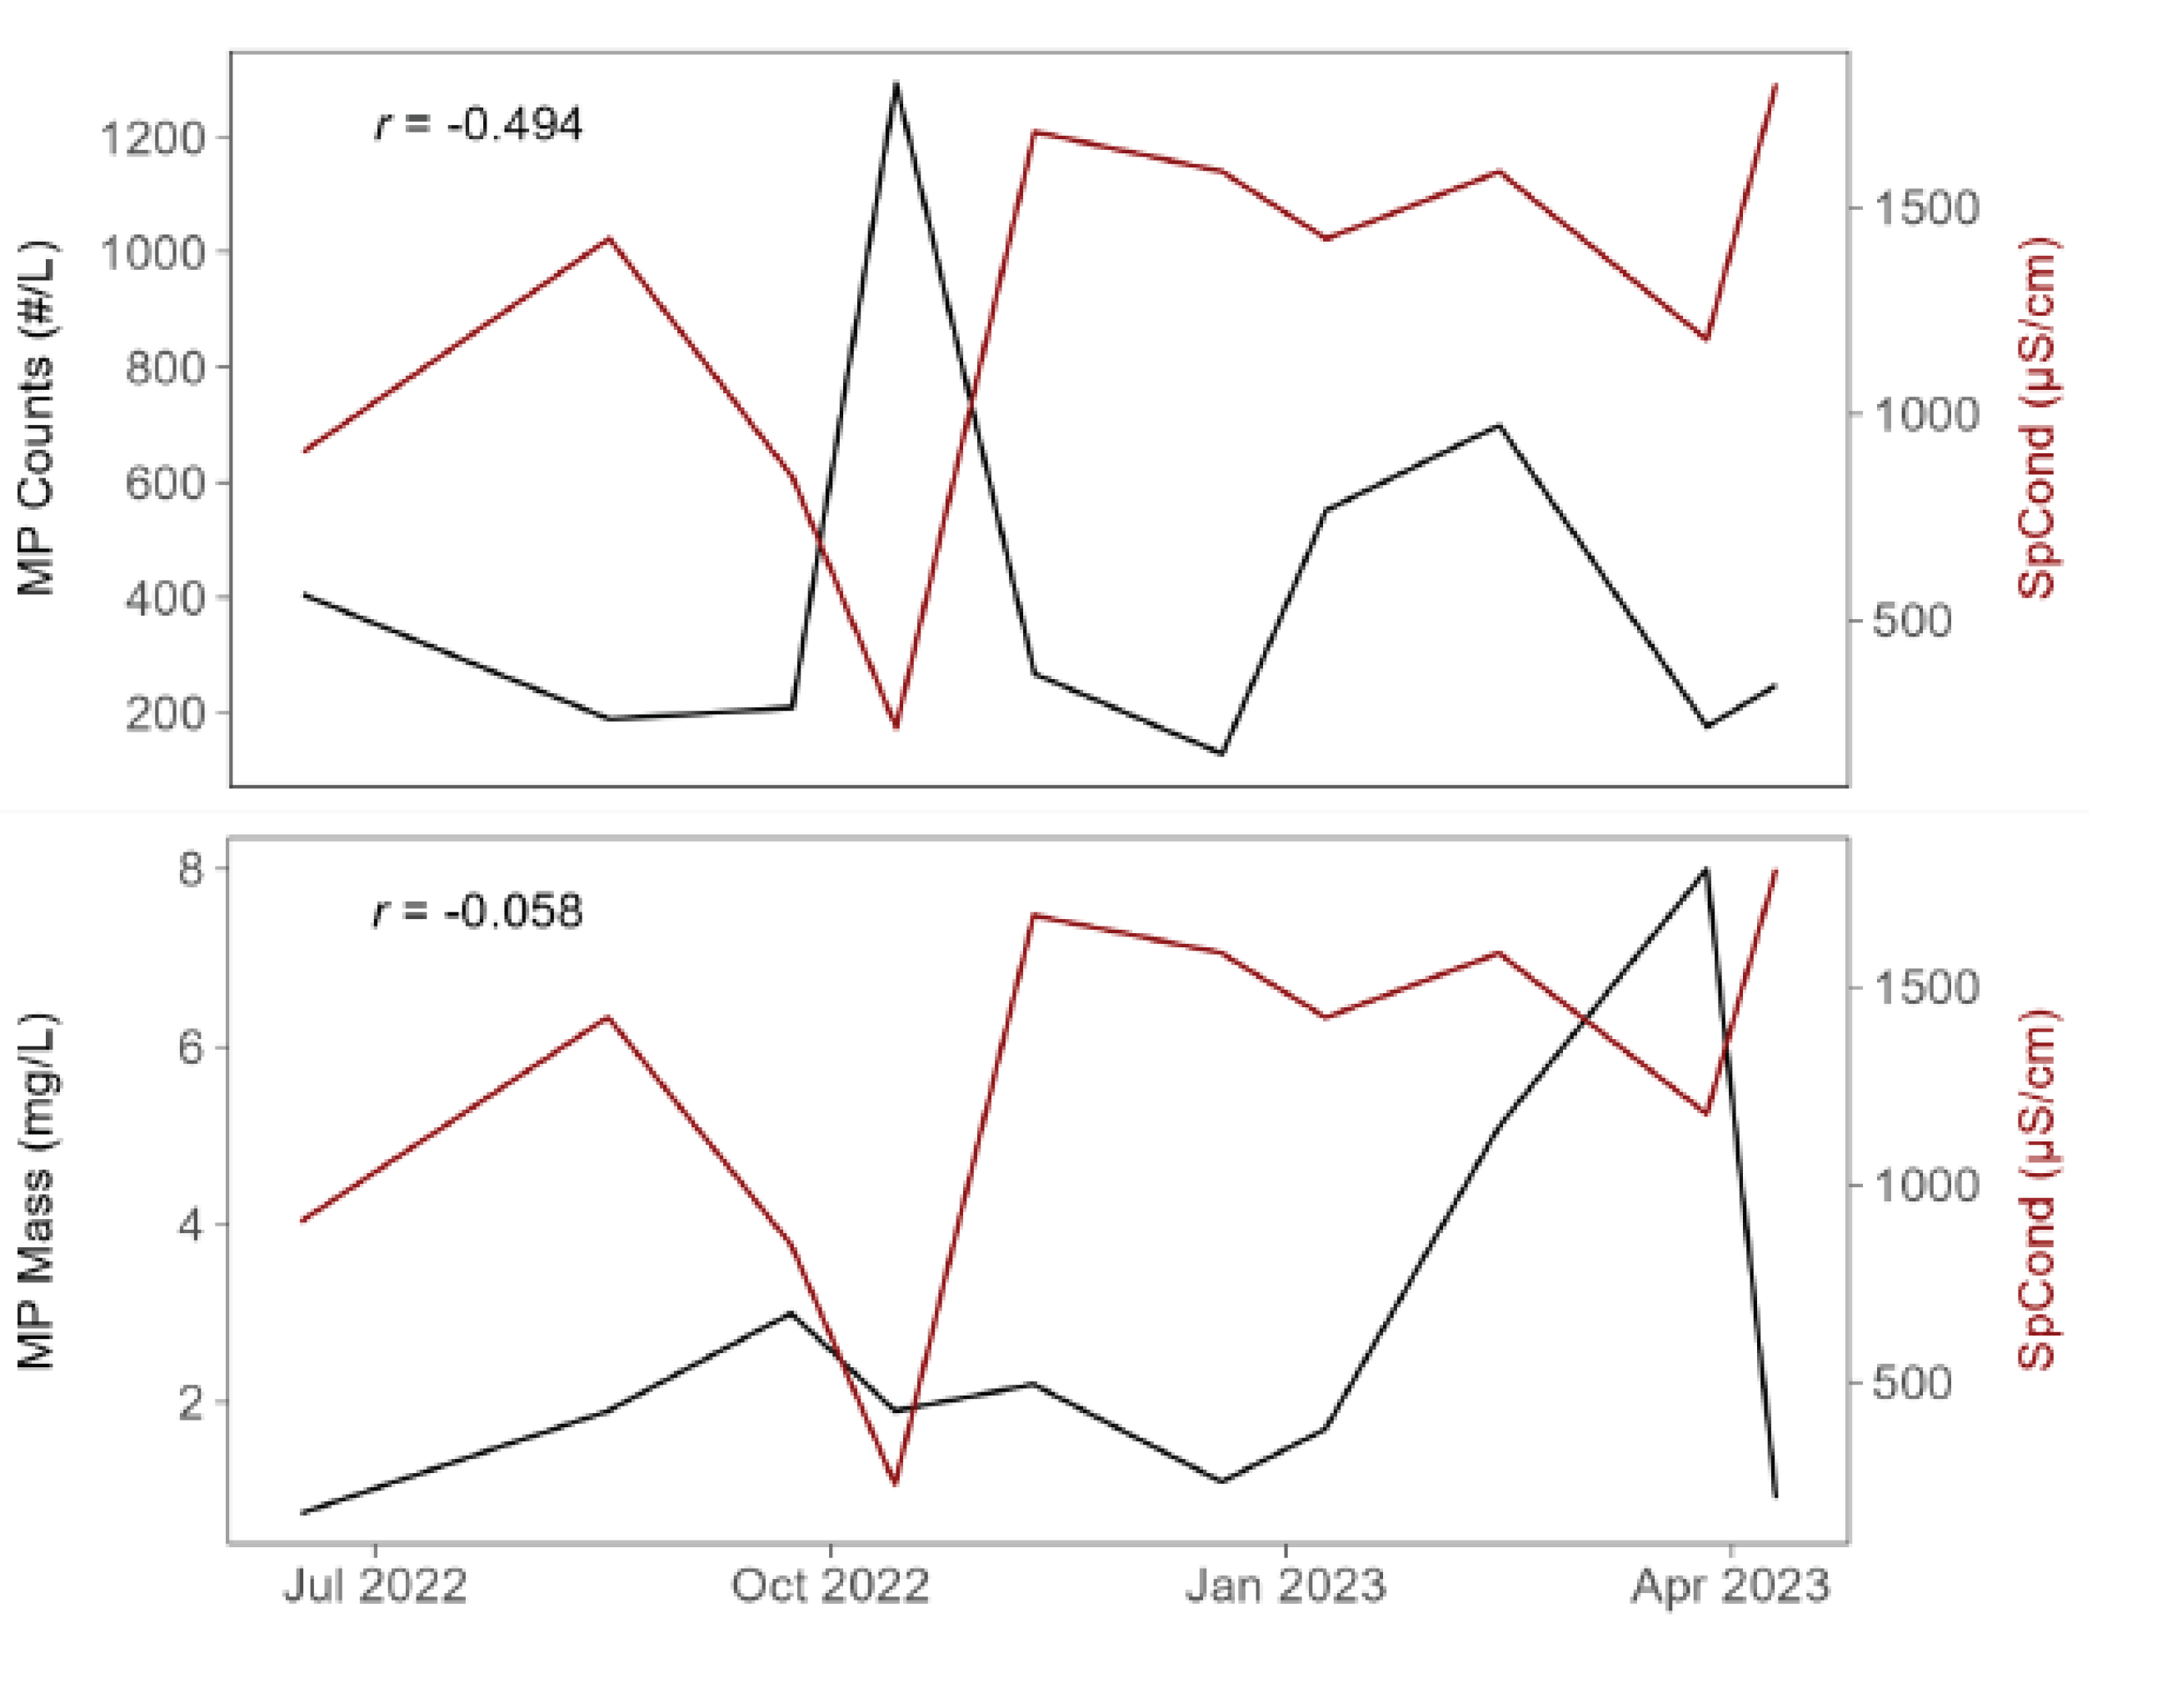

Table 1.
Summary of water quality data from near surface and near bottom of Church Lake taken before retrieving water/sediment samples for MP analysis. DO: dissolved oxygen, Spec Cond: specific conductivity. See Figure 1 for approximate site location for each sampling date. Full water quality data available in supplemental Table 1.
| Date | Depth | Temp (°C) |
DO (mg/L) |
Spec. Cond. (µS/cm) |
pH |
|---|---|---|---|---|---|
|
6/17/22 |
Near surface (2 m) |
23.4 | 10.4 | 864 | 8.7 |
| Near bottom (10 m) | 8.9 | 1.1 | 1312 | 7.0 | |
|
7/12/22 |
Near surface (2 m) |
24.7 | 8.8 | 841 | 8.6 |
| Near bottom (10 m) | 5.1 | 0.5 | 1230 | 7.1 | |
| 9/23/22 | Near surface (1 m) |
21.3 | 7.7 | 847 | 8.4 |
| Near bottom (3 m) |
21.3 | 7.6 | 849 | 8.4 | |
| 11/11/22 | Near surface (1 m) |
11.6 | 10.0 | 862 | 8.4 |
| Near bottom (6 m) |
10.8 | 6.4 | 867 | 7.9 | |
| 1/23/23 |
*Near surface (1 m) |
2.0 | 12.8 | 941 | 8.3 |
| 3/27/23 | Near surface (~1 to 2 m) | 5.8 | 14.9 | 941 | 8.7 |
| Near bottom (9 m) |
4.3 | 7.6 | 1017 | 7.9 | |
| 4/10/23 | Near surface (~1 to 2 m) | 11.8 | 15.7 | 866 | 9.0 |
| Near bottom (8 m) |
4.5 | 3.0 | 979 | 7.5 |
*Only one depth sampled due to shallow water at this site.
Table 2.
Summary of water quality data from the tributary entering Church Lake taken during baseflow and stormflow before retrieving water/sediment samples for MP analysis. DO: dissolved oxygen, Spec Cond: specific conductivity. See Figure 1 for approximate site location for each sampling date. Full water quality data available in supplemental Table 1.
| Date | Temp (°C) |
DO (mg/L) |
Spec. Cond. (µS/cm) |
pH |
|---|---|---|---|---|
| Baseflow | ||||
| 5/31/22 | 19.3 | 9.0 | 1504 | 8.0 |
| 6/16/22 | 18.9 | 7.2 | 907 | 7.9 |
| 8/17/22 | 18.7 | 8.4 | 1424 | 8.2 |
| 9/23/22 | 16.1 | 8.1 | 848 | 8.3 |
| 10/14/22 | 16.2 | 9.2 | 241 | 8.2 |
| 11/11/22 | 13.4 | 8.0 | 1682 | 7.8 |
| 12/9/22 | 8.2 | 11.0 | 1586 | 8.1 |
| 1/9/23 | 4.0 | 12.8 | 1423 | 8.3 |
| 2/13/23 | 3.9 | 11.9 | 1586 | 8.1 |
| 3/27/23 | 5.2 | 12.3 | 1179 | 8.1 |
| 4/10/23 | 7.8 | 11.8 | 1799 | 8.0 |
| Storm Flow | ||||
| 8/3/22 | 21.4 | 7.4 | 1225 | 8.2 |
| 10/11/22 | 10.9 | 9.6 | 441 | 8.1 |
| 1/16/23 | 7.0 | 11.1 | 880 | 8.2 |
| 2/9/23 | 3.8 | 12.2 | 932 | 7.9 |
| 3/25/23 | 1.7 | 13.3 | 261 | 8.2 |
Table 3.
MP and 6-PPD-Q concentrations in Church Lake. SA: surface area; ND: No Data. Note: conversion of L to kg is 1:1.
Table 3.
MP and 6-PPD-Q concentrations in Church Lake. SA: surface area; ND: No Data. Note: conversion of L to kg is 1:1.
| Date | MP counts (#/L) |
MP mass (mg/L) |
6-PPD-Q concentration (ng/L) |
|---|---|---|---|
| Water Column | |||
| 6/17/22 | 456 | 0.66 | <1 |
| 7/12/22 | 651 | 1.88 | <1 |
| 9/23/22 | 61 | 0.48 | <1 |
| 11/11/22 | 306 | 10.0 | <1 |
| 1/23/23 | 880 | 17.66 | <1 |
| 3/27/23 | 222 | 1.03 | <1 |
| 4/10/23 | 339 | 4.62 | <1 |
| Sediment | |||
|
MP counts (#/kg) |
MP mass (mg/kg) |
6-PPD concentration | |
| 3/27/23 | 3.02 x 10⁶ | 21.6 x 10³ | ND |
Table 4.
A summary of MP and 6-PPD concentrations in the Tributary during baseflow, storm flow events, and sediment. SA: surface area; ND: No Data. Note: conversion of L to kg is 1:1.
Table 4.
A summary of MP and 6-PPD concentrations in the Tributary during baseflow, storm flow events, and sediment. SA: surface area; ND: No Data. Note: conversion of L to kg is 1:1.
| Date | MP counts (#/L) |
MP mass (mg/L) |
6-PPD-Q concentration (ng/L) |
|---|---|---|---|
| Baseflow | |||
| 5/31/22 | 390 | 0.56 | 2.4 |
| 6/16/22 | 405 | 0.75 | 9.6 |
| 8/17/22 | 188 | 1.87 | 7.8 |
| 9/23/22 | 208 | 3.01 | 1.1 |
| 10/14/22 | 1293 | 1.91 | 24.0 |
| 11/11/22 | 267 | 2.23 | <1 |
| 12/9/22 | 127 | 1.12 | <1 |
| 1/9/23 | 551 | 1.66 | <1 |
| 2/13/23 | 699 | 5.15 | <1 |
| 3/27/23 | 175 | 8.04 | <1 |
| 4/10/23 | 247 | 0.92 | <1 |
| Storm Flow | |||
| 8/3/22 | 482 | 0.60 | 73.0 |
| 10/11/22 | 16,390 | 6.58 | 201.0 |
| 1/16/23 | 8209 | 11.34 | 28.0 |
| 2/9/23 | 9781 | 12.70 | 14.0 |
| 3/25/23 | 5322 | 7.87 | <1 |
| Sediment (tributary) | |||
|
MP counts (#/kg) |
MP mass (mg/kg) |
6-PPD concentration | |
| 3/27/23 | 8.74 x 10⁶ | 45.27 x 10³ | ND |
Disclaimer/Publisher’s Note: The statements, opinions and data contained in all publications are solely those of the individual author(s) and contributor(s) and not of MDPI and/or the editor(s). MDPI and/or the editor(s) disclaim responsibility for any injury to people or property resulting from any ideas, methods, instructions or products referred to in the content. |
© 2025 by the authors. Licensee MDPI, Basel, Switzerland. This article is an open access article distributed under the terms and conditions of the Creative Commons Attribution (CC BY) license (http://creativecommons.org/licenses/by/4.0/).
Copyright: This open access article is published under a Creative Commons CC BY 4.0 license, which permit the free download, distribution, and reuse, provided that the author and preprint are cited in any reuse.


