
Submitted:
13 October 2025
Posted:
14 October 2025
You are already at the latest version
Abstract
Microplastic pollution in freshwater systems represents a growing environmental concern, yet the dynamics of microplastic distributions in smaller tributaries like canals/creeks remain understudied. This case study presents an investigation of microplastic contamination in a canal-system in upstate New York, USA, examining land use and rainfall that influence microplastic abundance, distribution, and characteristics. Water and sediment samples were collected bi-weekly (June–October 2023) from sites representing runoff from diverse land-use types: agricultural areas, residential zones, academic buildings, and parking lots. The study reveals significant land-use dependent variations in contamination, with mean concentrations of 17 ± 7 items/L in the water column, while suspended sediment and bedload reached 540 ± 230 items/L and 370 ± 80 items/kg, respectively. Upstream water column exhibited the highest loads (27 ± 2 items/L), driven by cumulative agricultural and commercial inputs, while downstream declines highlighted vegetation-mediated sedimentation. Land-use patterns strongly influenced contamination profiles, with parking lots exhibiting tire-wear fragments, artificial turf contributing polyethylene particles, and residential areas contributing 43% textile fibers. Rainfall intensity and antecedent dry days differentially influenced transport mechanisms. Antecedent dry days strongly predicted parking lot runoff fluxes surpassing rainfall intensity effects and underscored impervious surfaces as transient microplastic reservoirs.
Keywords:
microplastics
; contamination
; land use
; canals/creeks
; rainfall
1. Introduction
Plastic pollution has emerged as one of the defining environmental crises of our era, with contamination now pervasive throughout marine ecosystems worldwide via riverine transport systems [1,2]. Plastic production has increased exponentially since the 1950s, with global annual production reaching 413.8 million metric tons in 2023 [3]. As these materials degrade, they can fragment into microplastics (particles <5mm), which are found in ecosystems worldwide from polar regions to deep ocean trenches [4].
The widespread presence of microplastics poses significant ecological and health risks. In aquatic ecosystems, these particles can cause physical harm to organisms through ingestion, disrupt feeding behaviors, and impair reproduction [5]. Moreover, microplastics can act as vectors for toxic pollutants, facilitating the bioaccumulation of persistent organic pollutants and heavy metals through food webs [6]. For humans, exposure to microplastics through food, water, and air has been linked to potential health impacts, including inflammatory responses, oxidative stress, and endocrine disruption [7].
Recent studies have identified multiple pathways through which these contaminants enter waterways, including wastewater treatment plants, stormwater runoff, agricultural activities, and industrial discharges [8,9]. The distribution of microplastics in rivers exhibits significant spatial variation, with higher concentrations typically observed in urban and industrial areas [10,11]. Temporal patterns have also been documented, with several researchers noting fluctuations corresponding to seasonal rainfall patterns and hydrological conditions [11,12]. Hydrological factors, including river flow, depth, and turbulence, substantially influence microplastic transport and deposition dynamics [8,12], while plastic morphology—size, shape, and density—affects their buoyancy and settling behavior [13]. Despite the growing body of research on microplastics in major river systems, standardization challenges in sampling and analysis methods persist [14,15], and significant knowledge gaps remain regarding microplastic pollution in smaller tributaries and canal systems that may serve as critical pathways for transport into larger waterways.
While the general pathways and distribution patterns of microplastics in major waterways have been well documented, recent studies demonstrated that both land use patterns and rainfall events significantly influence microplastic abundance and distribution in freshwater systems, particularly in smaller tributaries like canals [16,17,18,19]. Research has established that urban and industrial areas typically contribute higher microplastic loads compared to natural ecosystems like woodlands and grasslands [16]. Interestingly, areas classified as educational land use have demonstrated notably elevated microplastic concentrations in some instances, such as those reported from Daqing, China [20].
The relationship between rainfall and microplastic transport has been extensively documented [21,22,23,24,25,26], confirming significant increases in microplastic concentrations during precipitation events. Microplastic concentrations in urban rivers increase substantially during rainfall episodes [23] and can reach levels up to 50 times higher during heavy rain events in urban waterways [22]. The temporal dynamics of rainfall-driven microplastic transport are complex, with research indicating that antecedent dry days (ADDs) allow for microplastic accumulation on impervious surfaces, which are then rapidly mobilized during subsequent precipitation. This "first flush" phenomenon has been observed in multiple studies, with microplastic concentrations often peaking before maximum discharge during storm events [17,19,27].
Additionally, rainfall intensity, catchment size, percentage of impervious surface area, and maximum runoff flow rate have all been positively correlated with microplastic concentrations in stormwater discharge, highlighting the multifaceted relationship between precipitation patterns and microplastic mobilization across different land use types [19]. Despite these advances, the specific impacts of rainfall on microplastic dynamics in canal systems—which often feature different flow patterns and sediment characteristics compared to natural rivers—remain poorly understood, particularly when examining the combined influence of varying land use types along canal corridors. This knowledge gap is critical, as canal systems can serve as significant conduits for microplastic transport into larger riverine ecosystems, yet their unique dynamics remain largely uncharacterized.
To address these research gaps, we conducted a case study to investigate the microplastic pollution in a canal system that feeds into a major river in upstate New York. We analyzed the canal systems' water samples, suspended sediment, and bed load to characterize microplastic abundance, distribution, and properties. Our research combines examination of both land use influences (agricultural, residential, academic, and parking lot areas) and rainfall effects on microplastic dynamics within the same canal system. We hypothesize that (i) upstream urbanized land uses, particularly parking lots and artificial turf areas, contribute disproportionately to microplastic contamination compared to agricultural land, and (ii) rainfall events, especially following longer antecedent dry periods, enhance the mobilization of smaller microplastics and traffic-derived particles such as tire wear fragments into the canal. By characterizing the complete microplastic profile, including concentration, polymer composition, size distribution, and morphological types, this study provides critical insights into these understudied yet potentially significant pathways for microplastic transport into larger riverine systems.
2. Materials and Methodology
2.1. Study Site Description and Landscape Context:
The study was conducted in a canal system located in the northern New York region (44°39'39"N, 74°53'45"W), specifically traversing the SUNY Potsdam campus in Potsdam, St. Lawrence County (Figure 1). The canal traverses a rural-academic landscape with mixed land use, including campus infrastructure and parking facilities.
Four cross-sectional sampling sites were selected along the canal's profile to capture spatial microplastic distribution variations (Figure 1): an upstream (CS-US), downstream (CS-DS), and two intermediate sites (CS-1 and CS-2). Additionally, two stormwater drainage inlets (O-1 and O-10) connected to campus parking lots were incorporated into the sampling design (Figure 1). These inlets were selected based on their vehicular traffic volume and direct hydraulic connectivity to the canal system, allowing for a nuanced assessment of microplastic contamination from urban runoff sources. The monitored canal reach spans approximately 2.5 kilometers, with channel widths ranging from 2.1 to 8.5 m. Flow conditions were characteristically slow, with velocities between 0.0043 and 0.17 m/s and discharges from 0.0015 to 0.086 m³/s, varying by site and rainfall conditions. Depth measurements indicated maximum values between 0.14 m and 0.68 m. The study was conducted during the summer rainy season (June–August 2023) (Table 1), with rainfall intensities during sampling events ranging from 1 to 10 mm/hr. Site selection was informed by accessibility and representativeness, ensuring unobstructed sampling while minimizing vegetation interference. The canal, serving as a tributary to the Raquette River, supports local wildlife, with observed species including mallard duck (Anas platyrhynchos), great blue heron (Ardea herodias), and red-winged blackbird (Agelaius phoeniceus), highlighting its ecological significance within the landscape.
2.2. Sampling Methodology
Sample collection and processing were conducted following protocols for freshwater systems [28,29]. The study involved collecting different sample types: water column (WC), suspended sediment (SSL), bed load (BL), and outlet (O) samples. To prevent cross-contamination, each sampling vial was triple-rinsed with the sample water prior to collection. At every cross-section, three 500 mL water column samples were obtained in pre-cleaned glass containers. Where feasible, samples were collected from three depths (surface, mid-column, and near-bed) to ensure comprehensive vertical representation of the water column. In addition to water column samples, a 10 mL suspended sediment load (SSL) and a 10 mL bed load (BL) were collected at each cross-section. The SSL was obtained by agitating sediment deposits near vegetation or rocks using a turkey baster, then drawing the suspended material into the baster and transferring it into a 10 mL glass vial. Bed load (BL) samples were collected by scooping the uppermost 5 cm of sediment from the canal bottom into 10 mL glass vials. During rainfall events generating runoff, outlet samples (500 mL water) were collected following the same methods to assess microplastic transport associated with stormwater runoff. To prevent contamination, each vial was sealed with aluminum foil before securing the plastic cap. The preservation protocol used for all of the samples involved storing sealed vials at ambient temperature and processing them within 48 hours to minimize contamination.
2.3. Sample Pretreatment Protocol
Laboratory processing of microplastic samples followed a modified methodology recommended by the National Oceanic and Atmospheric Administration (NOAA) [28], involving three stages: digestion, density separation, and filtration. Water sample digestion utilized a hydrogen peroxide-based approach, employing 20 mL of 30% H2O2 combined with 20 mL of 0.05 M Fe (II) solution, heated to 65-70°C for an initial 30-minute period. An additional 20 mL of H2O2 was then introduced, and heating continued until complete oxidation of organic materials was observed. Sediment samples were weighed before and after preliminary desiccation at 70°C for 24 hours. The dried samples were transferred to clean glass beakers and processed using a digestion protocol identical to that of the water samples. Samples were cooled to room temperature following digestion.
Density separation employed a combination of sodium chloride (NaCl) and zinc chloride (ZnCl2) solutions to differentiate polymer densities. While NaCl is economical, its limited density range necessitated supplementation with ZnCl2 to effectively separate polymers. Concentrated saline solutions of 1.2 g/mL NaCl and 1.5 g/mL ZnCl2 were prepared to distinguish low-density (PP, PE, PS) and high-density (PET, PVC) polymers. The separation process involved careful manual stirring of the NaCl solution, followed by ZnCl2 addition. The supernatant was left to settle for 24 hours while being protected from contamination by aluminum foil. Floating microplastics were isolated through vacuum filtration using a glass fiber filter paper with a 0.45 µm pore size. Filter papers were then air-dried and stored under aluminum foil prior to microscopic examination.
2.4. Microplastic Identification and Characterization
Microplastic samples underwent comprehensive visual and spectroscopic analysis. Initial examination was conducted using a stereo microscope (Olympus SZX12) equipped with 10X eyepiece and 20X objectives and a high-resolution color camera. A systematic "grid-based" scanning methodology was employed, meticulously examining the entire filter paper surface to ensure thorough particle detection [29]. Particle identification relied on multiple diagnostic criteria to minimize misclassification [30]. Potential microplastics were evaluated against at least two of the following characteristic indicators: 1. Anomalous geometric morphologies (e.g., unusually perfect geometric shapes); 2. Distinctive chromatic properties inconsistent with biological materials 3. shiny/glassy appearance; 4. Absence of cellular or organic structural elements; 5. Absence of metallic reflectance; 6. Uniform dimensional properties with consistent three-dimensional curvature. Captured particles were photographically documented and subsequently analyzed using ImageJ for precise morphological characterization, including shape, dimensional measurements, and chromatic properties [31]. Following microscopic assessment, polymer composition was determined using Fourier Transform Infrared Spectroscopy (FTIR) with Attenuated Total Reflectance (ATR) accessory [32]. Spectral scanning was performed across a wavenumber range of 500-4000 cm−1 in transmittance mode. Polymer identification relied on comprehensive comparison with established spectral reference libraries [33].
2.5. Quality Control and Assurance
To avoid contamination, various measures were implemented during on-site sampling and laboratory analyses. To prevent artificial contamination and atmospheric deposition of microplastics, all laboratory analyses were conducted in a laminar-flow fume hood while personnel wore cotton aprons and nitrile gloves. Plastic equipment was replaced with glass alternatives, and filter papers were promptly covered with aluminum foil post-filtration to minimize airborne contamination [34]. The sample processing methodology was validated by testing the recovery of standardized white polyethylene microplastics (white polyethylene, WPMS = 1.10 g/cc, 150–180 µm, Cospheric) in MilliQ water, yielding a 98% recovery rate. Therefore, the contamination of field and laboratory environmental processes was negligible.
2.6. Data Analysis
Microplastic concentrations were calculated as items per liter (items/L) for water column and suspended sediment load samples, and as items per kilogram of dry sediment (items/kg) for bed load samples [33]. Differences in microplastic abundance, size distribution, and color composition across multiple rainfall categories (no rainfall, light rainfall, moderate rainfall) were assessed using one-way ANOVA, with statistical significance defined as p < 0.05. For spatial comparisons between sequential cross-sections along the canal (e.g., CS-1 vs. CS-2, CS-2 vs. CS-DS), paired t-tests were conducted to account for site dependency and repeated measurements across identical rainfall events. Data normality was visually assessed and supported by sample sizes. All statistical analyses were performed using Python (v3.11) within the Google Colab environment, utilizing SciPy and NumPy libraries.
3. Results and Discussion
3.1. Abundance of Microplastics
The average microplastic concentration in the water samples from the SUNY Potsdam Canal was 17 ± 7 items/L, which is slightly lower than levels reported for the adjacent Raquette River (20 ± 8 items/L) in a previous study [29]. The lowest recorded microplastic concentration was 8 items/L, exceeding the threshold for food dilution effects (5 microplastics/L) established through organismal and population-scale toxicity tests, as reported in the 2024 California Integrated Report on surface water quality assessments [35]. Event-wise analysis of microplastic abundance in the water column revealed consistent spatial trends across all sampling dates (Figure 2). The CS-US location, situated at the upstream end, consistently exhibited the highest microplastic concentrations, with mean values ranging from 25 ± 1 to 29 ± 1 items/L across the five events. In contrast, downstream locations recorded notably lower concentrations. At CS-1, microplastic levels ranged from 16 ± 2 to 21.0 ± 0.0 items/L, while CS-2 exhibited concentrations between 12 ± 3 and 20 ± 0 items/L. The most downstream location, CS-DS, consistently showed the lowest abundance, with values varying from 7 ± 1 to 9 ± 1 items/L. These results underscore a clear longitudinal decline in microplastic concentration, suggesting potential retention, dilution, or depositional mechanisms acting along the canal reach. The peak microplastic concentration in the canal (29 ± 1 items/L) exceeded reported levels in the adjacent Raquette River (20 ± 8 items/L) [29], but remained below the Raquette River-St. Lawrence confluence (34 items/L) [36]. Given that this canal serves as a tributary to the Raquette River, these comparisons provide useful context; however, differences in sampling timing, hydrological conditions, and land use patterns likely also influence the observed variations. Reported microplastic concentrations in freshwater systems vary widely, spanning from relatively low levels in major European rivers (0–30 particles/m³) to moderate abundances in an urban canal of Thailand (370 ± 140 particles/m³) and exceptionally high loads in anthropogenically impacted irrigation networks (6,691–12,907 particles/m³) [14,18,37].
On average across all five events, microplastic concentrations were 540 ± 230 items/kg in the suspended sediment load (SSL) and 370 ± 80 items/kg in the bed load (BL). Event-wise analysis revealed substantial spatial and temporal variability in both compartments. SSL concentrations ranged from a maximum of 2400 items/kg at CS-US on 6/14/2023 to a minimum of 133 items/kg at CS-DS on 8/16/2023. Similarly, BL concentrations varied from 1150 items/kg at CS-2 on 6/14/2023 to 100 items/kg at CS-2 on 8/4/2023. The upstream location (CS-US) consistently exhibited elevated microplastic levels in both SSL and BL during the earlier sampling events, which generally declined over time. It is important to note that standard deviations are not reported for individual event data, as only one suspended sediment and one bed load sample were collected per location per event, limiting the ability to quantify within-event variability.
The average bed load microplastic concentration (370 ± 80 items/kg) exceeds levels reported for the Raquette River in northern New York (mean: 195 ± 67 items/kg) [29], the Danube River (mean: 100 particles/kg [38] and urban Buriganga riverbeds near Dhaka City (mean: 165 ± 127 items/kg) [39], but remains below heavily industrialized systems like the Rhine River (mean: 861 particles/kg) [40]. This gradient aligns with catchment urbanization intensity, where higher anthropogenic pressures correlate with elevated sediment-bound microplastic retention.
The observed spatial heterogeneity in microplastic abundance was primarily evident in the water column, likely reflecting localized hydrodynamic and anthropogenic influences. In contrast, suspended sediment and bed load samples exhibited no significant spatial variation. The pronounced decrease in water column concentration between CS-US and CS-1 (−33.8%) likely reflects enhanced sedimentation facilitated by large roughness elements, particularly dense riparian vegetation observed along the canal banks, which promotes particle deposition through flow deceleration [41]. Field observations documented a mixture of herbaceous plants and emergent wetland species (e.g., cattails, Typha spp.), consistent with established findings that vegetated zones act as effective microplastic filters by trapping and settling particles [42]. This is supported by the elevated bed load concentration (467 ± 360 items/kg) at CS-US.
3.2. Land Use Impact
To quantitatively evaluate the influence of surrounding land uses on microplastic abundance between successive cross sections, percentage differences were calculated for each compartment (water column, suspended sediment load, and bed load). This calculation assumes uniform lateral distribution of microplastics across each cross section, which is reasonable given the canal's low flow velocities (ranging from 0.004 to 0.086 m³/s during the study period) and relatively stable channel geometry under baseflow conditions. Based on this assumption, percentage difference was calculated as:
Positive values indicate a net increase in microplastic abundance moving downstream, while negative values indicate a net decrease in microplastic abundance, suggesting retention or deposition processes were occurring.
To assess the influence of surrounding land uses on microplastic distribution, paired comparisons were conducted between successive cross-sections along the canal, with attention to percent differences in abundance across the water column, suspended sediment load, and bed load compartments (Figure 3). The most substantial changes occurred between CS-2 and CS-DS, where land use transitions from a relatively undeveloped corridor to areas directly adjacent to high-traffic parking lots and recreational fields.
In the water column, a statistically significant decrease in microplastic abundance was observed between CS-2 and CS-DS (p < 0.00001, paired t-test), consistent with density-driven settling processes or capture by vegetation. In contrast, suspended sediment load and bed load increased by 43.8% and 30.8%, respectively; however, neither change was statistically significant (p = 0.68 and p = 0.47, p > 0.05). While total abundance alone does not confirm deposition or input, the concurrent rise in sediment-associated microplastics downstream—particularly in compartments where heavier particles accumulate—suggests potential contributions from adjacent anthropogenic sources [43]. These spatial trends are further supported by color-specific observations (Section 3.6). Lighter tire-road wear particles (TRWPs) may remain suspended in the water column, while heavier fractions—those with densities greater than 1.0 g/cm³—are more likely to settle out of the flow. This helps explain why TRWPs persist in bed load samples even as overall microplastic concentrations decline in the downstream water column (−43.6%).
3.3. Rainfall Effect
To evaluate the influence of rainfall on microplastic dynamics, outlet samples were collected under varying precipitation conditions: no rainfall, light rainfall (1–5 mm/hr, n = 5), and moderate rainfall (5–10 mm/hr, n = 5) (Figure 4). This classification follows internationally recognized rainfall intensity standards provided by the Manual of Surface Weather Observations (MANOBS) [44], where light rainfall is defined as < 2.5 mm/hr, moderate rainfall as 2.6–7.5 mm/hr, and heavy rainfall as > 7.6 mm/hr. For this study, the moderate rainfall range was extended to 10 mm/hr to capture the specific precipitation characteristics of the study area. Based on hydrologic expectations, increasing rainfall intensity should enhance microplastic wash-off from impervious surfaces and promote sediment resuspension, potentially leading to elevated concentrations. However, these processes can be offset by increased flow volume and dilution, particularly in open-channel systems such as this canal.
In the water column, microplastic concentrations remained relatively stable across rainfall conditions (24 ± 4 items/L on average), and no statistically significant difference was observed (Figure 4a). Similarly, bed load concentrations averaged 210 ± 29 items/kg and also showed no significant variation with rainfall (Figure 4c). These results suggest that within the observed intensity range (1–10 mm/hr), rainfall was insufficient to trigger substantial remobilization of deposited particles or introduce new inputs at detectable levels. This supports the idea that a threshold intensity may be required to mobilize bed-bound or larger microplastic particles.
In contrast, the suspended sediment load exhibited a modest increase under higher rainfall conditions, averaging 193 ± 46 items/kg (Figure 4b), with three of the four cross-sections showing this upward trend—suggesting that light-to-moderate rainfall may be sufficient to resuspend finer particles such as tire wear and synthetic fragments, though the change was not statistically significant. These findings highlight the differential response of microplastic compartments to rainfall intensity: while water column and bed load remained largely unaffected, suspended sediments appear more sensitive to episodic runoff events, possibly due to their role as an intermediate reservoir for both resuspension and deposition.
A significant positive correlation was observed between microplastic abundance in outlet discharges and antecedent dry days (ADDs), highlighting the role of urban runoff in mobilizing accumulated particles (Figure 5a). Longer dry periods allow microplastics to accumulate on impervious surfaces such as roads and parking lots—primarily through atmospheric deposition, vehicular abrasion, and litter degradation—which are then flushed into receiving waters during subsequent rainfall. This mechanism is consistent with global observations, extended ADDs promote microplastic accumulation on surfaces such as atmospheric deposition zones (up to 50 microplastics m⁻² h⁻¹) [17], and impervious urban areas [27], increasing available loads for subsequent rainfall-driven transport. To evaluate this process locally, data were analyzed from two stormwater outlets adjacent to campus parking lots: O-10, draining a high-traffic area (“busiest”), and O-1, draining a low-traffic zone (“least busy”). Regression analysis revealed moderately strong linear relationships between microplastic abundance and ADD (O-10: y = 0.41x + 25.8, R² = 0.67; O-1: y = 0.67x + 19.7, R² = 0.64), supporting the conclusion that longer dry periods increase surface accumulation and subsequent mobilization. Importantly, the increased abundance at O-10 was accompanied by a greater proportion of black microplastics—a compositional signature consistent with tire wear particles, supported by color-based trends (Section 3.6). These trends mirror observations in stormwater systems, where ADDs amplify runoff-driven microplastic fluxes due to particle accumulation on impermeable surfaces [45].
Normalizing canal-wide water column microplastics to a baseline (ADD = 0, i.e., sampling conducted the next day after a rainfall event, before any dry period began) revealed minimal correlation (y = 0.014x + 1.1, R² = 0.14), indicating canal-wide trends are poorly linked to ADDs (Figure 5b). This divergence emphasizes distinct drivers: localized accumulation from land-use patterns (e.g., tire abrasion at high-traffic sites, litter degradation at low-traffic areas) against system-wide factors like flow patterns, vegetation capture, and remobilization of historical particles. Parking lot outlets act as localized hotspots where ADDs strongly govern microplastic fluxes, primarily due to direct vehicular inputs (e.g., tire wear). In adjacent recreational areas, artificial turf degradation contributes additional sources, such as synthetic grass fibers. These results emphasize ADDs and land use—rather than rainfall intensity—as primary drivers of microplastic fluxes in urban canals.
3.4. Size Distribution
The bar chart in Figure 6 illustrates microplastic size distribution across three environmental compartments—water column, suspended sediment load, and bed load—with data further stratified by cross-section (CS-US, CS-1, CS-2, CS-DS). Size classes are categorized as <100 µm, 100–500 µm, 500–1000 µm, and >1000 µm, each represented by distinct color gradients (Figure 6). In the water column, microplastic particles were predominantly found in the smaller size classes, with <100 µm and 100–500 µm fractions collectively comprising the majority of the total microplastic load across all sampling locations. For instance, at the CS-US site, these two classes accounted for over 80% of particles (33% ± 17% for <100 µm and 51% ± 24% for 100–500 µm). In the suspended sediment load, microplastic abundance was similarly dominated by the smaller size fractions. The <100 µm class alone accounted for a substantial portion of the total load, particularly at CS-US and CS-2, contributing 40% ± 8% and 64% ± 9%, respectively. The 100–500 µm fraction also showed significant presence across all sites. Combined, these two size classes consistently represented over 70% of total particles, highlighting the affinity of finer microplastics for suspension in the water column. In contrast to the water column and SSL, the bed load exhibited a more even distribution across size classes, though <100 µm and 100–500 µm particles remained dominant. At CS-US and CS-2, for instance, particles <100 µm accounted for 29% ± 22% and 23% ± 19%, respectively, while 100–500 µm contributed 29% ± 5% and 38% ± 21%. The presence of larger particles (>500 µm) was more pronounced in bed load compared to other compartments.
Water samples globally exhibit dominance of smaller microplastics, with reported peaks at 100–300 µm in Jordanian irrigation canals [18] and <500 µm in West River, China [46], while studies of tire wear particles in Denmark detect particles down to 10 µm [47]. In contrast, sediment samples show coarser distributions, with dominant sizes <3 mm in Brisbane River, Australia and 1–5 mm in Karnaphuli Estuary, Bangladesh, reflecting hydrodynamic sorting where larger particles settle preferentially [48,49]. However, comparable distributions between water and sediment were reported in the Raquette River system, with 50–100 µm particles being most abundant in both compartments and smaller size classes (<200 µm) collectively comprising over two-thirds of all sediment samples [29]—consistent with the predominance of fine particles observed across compartments in this study.
Spatial differences in land use appear to influence the size distribution of microplastics across the cross sections. At CS-US, influenced primarily by agricultural and commercial activities, the water column and suspended sediment load both exhibited substantial proportions of smaller microplastics (<500 µm), accounting for approximately 84% (±41%) and 68% (±19%), respectively. This dominance of finer particles likely reflects agricultural runoff and rapid mobilization from commercial areas. Conversely, the bed load at CS-US comprised about 58% (±27%) smaller microplastics, indicating relatively higher settling rates of coarser particles in these environments. At CS-1, located adjacent to residential areas, turf fields, and a parking lot, small-sized particles continued to predominate in the water column (85% ±19%). However, the bed load contained a slightly lower fraction (59% ±32%), which may suggest localized contributions of both fine and coarser microplastics from urban sources such as vehicle-related wear and domestic litter. At CS-2, adjacent to academic buildings and the most heavily utilized parking lot, the suspended sediment load had the highest proportion of smaller particles (89% ±8%), underscoring significant urban particle inputs and resuspension processes. The water column contained 73% (±28%) smaller microplastics, and bed load samples indicated a moderately high proportion (75% ±40%), pointing to extensive vertical mixing and subsequent deposition of finer particles in sediments. Finally, CS-DS, situated in a park area, showed a lower proportion of smaller microplastics in the water column (63% ±19%) and bed load (53% ±30%), despite a relatively higher proportion in suspended sediment (79% ±20%). This likely reflects reduced anthropogenic inputs and less immediate mobilization of finer particles into suspension. Collectively, these spatial variations underscore how diverse land-use practices—from agricultural and commercial to densely trafficked urban and recreational park environments—influence the mobilization, distribution, and eventual deposition patterns of microplastics of varying sizes.
To assess the impact of rainfall on microplastic size-class distribution, samples were gathered from outlets and cross sections and categorized under three rainfall conditions: no rainfall, light rainfall (1–5 mm/hr) (n=5), and moderate rainfall (5–10 mm/hr) (n=5). Our results demonstrate pronounced variability in the proportional contributions of smaller MPs (<500 µm) across environmental compartments (Figure 7). and align with global patterns in freshwater systems (e.g., Lake Donghu, China) and agricultural soils, where smaller microplastics (<1 mm) dominate mobile fractions, despite differing size classification thresholds [50,51].
However, suspended sediment's inverse trend—declining smaller MPs during rainfall—contrasts with these patterns, likely reflecting unique hydrodynamic sorting where antecedent dry periods pre-concentrate fines later displaced by resuspended larger particles. Suspended sediments exhibited a high proportion of smaller microplastics (90% during no rainfall), which declined under light rain (78%), indicating resuspension of larger particles (p = 0.0019, p < 0.05). In contrast to suspended sediment, both the water column and bed load exhibited a modest increase in the proportion of smaller microplastics, rising from 64% and 65% under no rainfall to 70% during moderate rainfall; however, these changes were not statistically significant (p > 0.05). Outlet samples adjacent to parking lot surfaces showed a progressive increase in the proportion of smaller microplastics, rising from 65% under light rainfall to 72% under moderate rainfall, suggesting rainfall-driven mobilization of accumulated tire wear particles (p = 0.0026, p < 0.05). Overall, these results indicate that while moderate rainfall tends to favor the mobilization of smaller microplastics (<500 µm) in the water column, bed load, and runoff, the suspended sediment load behaves differently, likely due to pre-existing fine particle accumulation during dry periods. These observations may suggest that antecedent dry days (ADDs), rather than rainfall intensity alone, exert a stronger control on microplastic accumulation in parking lot-derived runoff (Figure 5a), though further research is needed to disentangle these drivers.
3.5. Shape Distribution
Microplastics were categorized into three morphological classes: fibers, fragments, and beads (Figure 8). Fibers and fragments dominated the morphological composition across all compartments, with notable spatial and compartment-specific variation. In the water column, fiber abundance was highest at CS-US (45% ± 9%) and CS-2 (39% ± 7%), while fragments were dominant at CS-1 (56% ± 10%) and CS-DS (62% ± 11%), indicating localized variation likely driven by adjacent land use. Suspended sediment load samples showed a pronounced dominance of fragments at all sites, particularly at CS-2 (84% ± 11%) and CS-DS (88% ± 8%), both located near high-traffic parking lots and open spaces—environments commonly associated with terrestrial fragment sources such as tire wear and degraded plastic debris.
Bed load samples followed a similar pattern, with fragments comprising 71% ± 7% at CS-2 and 77% ± 9% at CS-DS. Notably, CS-1—situated in a residential area—exhibited elevated fiber contributions in both suspended sediment (36% ± 6%) and bed load (39% ± 7%), suggesting domestic sources like laundry discharge as a major contributor of microfibers. In contrast, beads consistently represented the lowest fraction of microplastics across all sites and compartments, often comprising less than 10% of the total load and in some cases entirely absent (e.g., 0% at CS-2 suspended sediment), reflecting their limited input or lower environmental persistence. These patterns collectively emphasize the strong influence of land use in shaping the morphological distribution of microplastics, with fibers linked to residential sources and fragments associated with urban and traffic-related activities.
Microplastic shape distributions in the water column, suspended sediment load, and bed load compartments remained relatively consistent across rainfall conditions, with no statistically significant differences detected (p > 0.05). In the water column, fragments accounted for 44–46% and beads 15–19% under all rainfall categories, indicating stable shape proportions regardless of precipitation (Figure 9). Suspended sediment load samples showed a slight decrease in fragment proportion with increasing rainfall, while bed load samples exhibited only minor variations, maintaining moderate contributions from fibers and beads. In contrast, outlet samples—representing runoff-dominated flows—showed a notable shift: the proportion of fragments increased from 57% under light rainfall to 67% under moderate rainfall. This difference was statistically significant (p = 0.029, p < 0.05), suggesting that higher rainfall intensities enhance the mobilization of fragment-type microplastics, likely driven by inputs such as tire wear and urban debris from impervious surfaces. These results highlight that rainfall-driven shape variation is most pronounced at urban runoff entry points, while instream compartments remain comparatively unaffected.
3.6. Color Distribution
The color classification of microplastics in this study included five visually distinct types: blue, black, green, transparent, and orange (Figure 10). No single color overwhelmingly dominated the water column across all sites, indicating a wide diversity of sources. However, transparent microplastics were consistently prominent, particularly at CS-US (29% ± 4%) and CS-1 (20% ± 5%), suggesting inputs from consumer packaging, plastic bags, and weathered fragments. Black particles were also abundant in the water column at CS-DS (62% ± 11%), likely reflecting the influence of road-adjacent runoff and tire wear particles. Interestingly, green microplastics, which are commonly associated with synthetic turf fibers, were elevated at CS-1 (43% ± 11%), directly adjacent to an artificial turf field.
Suspended sediment samples revealed a different pattern, with black microplastics dominating across all sites, accounting for 44% ± 11% at CS-US and rising to 57% ± 12% at CS-DS. This strong presence suggests persistent accumulation of rubber-based and dark-colored fragments in depositional zones. Transparent particles were also substantial in this compartment, ranging from 15% ± 8% at CS-US to 23% ± 8% at CS-DS, likely representing aged and weathered plastics from single-use items.
In bed load samples, transparent particles were the most abundant color class at all four sites, accounting for 44% ± 4% at CS-US and 43% ± 7% at CS-DS. The lighter density and weathered nature of these particles may contribute to their preferential deposition in sediments. Meanwhile, blue and orange particles were consistently less prevalent in all compartments, with fractions generally below 20%, though blue microplastics reached up to 28% ± 4% at CS-2 bed load, suggesting localized variation.
Rainfall-driven variability in microplastic composition was evaluated across the water column, suspended sediment load, bed load, and outlet samples (Figure 11). In the water column (Figure 11a), black microplastics increased from 22% under light rainfall to 28% under moderate rainfall (p = 0.0491, p < 0.05). Numerous studies have identified black microplastics as characteristic indicators of tire and road wear particles (TRWPs), relying on color and morphology for initial identification, particularly in urban runoff contexts [52,53,54]. The observed increase in green microplastics, rising significantly from 7% under light rainfall to 12% during moderate rainfall (p < 0.05), likely reflects the mobilization of synthetic turf fragments from adjacent recreational areas. This interpretation is supported by polymer analysis, which confirmed the presence of polyethylene (PE)—a predominant material in artificial turf fibers—among collected particles. Similar findings have been reported in European studies, where green, polyethylene-based turf fragments were identified as widespread aquatic pollutants in urban waters [55]. In contrast, white microplastics—commonly associated with synthetic fibers shed during household laundry [56,57] —declined from 26% under dry conditions to 10% during moderate rainfall (p = 0.00035, p < 0.05), suggesting reduced mobilization under higher-intensity runoff. In the suspended sediment load (Figure 11b) and bed load compartments (Figure 11c), no noticeable changes in microplastic color were observed across rainfall categories, suggesting minimal rainfall-driven variability in these sediment-associated fractions. While statistical tests yielded non-significant results (p > 0.05 for both compartments), the lack of replication—only one sample per event—limits the strength of this conclusion. Outlet samples adjacent to parking lots (Figure 11d) showed a statistically significant increase in the proportion of black microplastics, from 42% under light rainfall to 48% under moderate rainfall (p = 0.00395, p < 0.05), likely reflecting the enhanced mobilization of tire wear particles and other traffic-derived debris during episodic runoff events. These trends further support the observation that rainfall preferentially mobilizes smaller microplastics (<500 µm) from urban sources, while depositional processes in the bed load and suspended sediments remain unaffected by rainfall intensity.
3.7. Composition of Microplastics
Microplastics were classified into five polymer types: polyethylene terephthalate (PET), polystyrene (PS), polypropylene (PP), polyethylene (PE), and polyvinyl chloride (PVC) (Figure 12). Across varying rainfall conditions, our findings align with global density-driven segregation trends, as bed load samples (Figure 12c) consistently showed a predominance of high-density polymers (>1 g/cc)—PET (32–36%) and PVC (17–22%)—in sediments.
Additionally, owing to its lower density (<1 g/cc), PP was present at moderate levels (20%–29%) in both water column and sediment samples, exhibiting an incremental trend from no rain to moderate rain conditions. PE exhibited minimal rainfall-driven variability across compartments (water: 18–24%; suspended sediment: 16–21%; bed load: 20–22%), reflecting its ubiquity as a persistent aquatic pollutant [29,58]. Outlet samples yielded particularly noteworthy results. Under no rainfall conditions, no flow was observed at the outlet, suggesting that runoff was minimal. However, during rainfall events—capturing direct runoff from an adjacent parking lot—the proportion of polystyrene (PS) increased significantly, rising from 42% under light rain to 48% under moderate rain (p = 0.0010, p < 0.05). This elevated PS content may be linked to tire wear, as tire treads comprise styrene butadiene rubber (SBR), a material derived from styrene—a precursor to polystyrene—combined with natural rubber and various additives [59]. These patterns confirm urban canals as unique convergence zones where polymer-specific transport behaviors and anthropogenic inputs—particularly tire-derived PS—create distinct contamination signatures not observed in natural water bodies.
A substantial share of household textiles, including clothing, bedding, and curtains, are composed of PET and are likely sources of microplastic pollution in residential areas due to routine laundering [60]. Polyethylene (PE) and polyethylene terephthalate (PET) are key components in everyday packaging—such as juice bottles, personal care containers, and food packaging—while high-density polyethylene (HDPE) is used in items like trash bags, pipes, and ropes. These materials, common in urban and commercial settings, are likely significant sources of microplastic pollution in these areas.
4. Conclusions
This case study elucidates the complex interplay between land use and rainfall in governing the distribution and mobilization of microplastics in the SUNY Potsdam Canal. Key findings reveal that microplastics abundance and characteristics are strongly modulated by localized land use, with spatial heterogeneity driven by proximal pollution sources. The highest water column concentrations (27 ± 2 items/L at CS-US) and comparatively higher sediment-bound microplastic levels were observed upstream, reflecting cumulative inputs from agricultural and commercial activities, while downstream declines (−43.6% in water column microplastics at CS-DS) highlight sedimentation and vegetation-mediated trapping. Notably, parking lot-adjacent cross-sections exhibited elevated tire-wear fragments (black MPs: ≤48% during rainfall) and polyethylene particles linked to artificial turf degradation, underscoring urban infrastructure as critical microplastics sources. Rainfall intensity and antecedent dry days (ADDs) emerged as pivotal drivers of microplastics transport. While moderate rainfall preferentially mobilized smaller MPs (<500 µm) in the water column and outlet samples, suspended sediment displayed inverse trends, with larger particles resuspended during rainfall events. This compartment-specific behavior underscores hydrodynamic sorting mechanisms, where high-density polymers (PET, PVC) dominated bed loads (32%–36% PET), whereas low-density PP (20%–29%) persisted in the water column. Critically, antecedent dry days (ADDs) exhibited a stronger correlation with microplastics fluxes in parking lot outlets than canal-wide trends, emphasizing localized accumulation on impervious surfaces prior to runoff-driven transport. These findings advocate for targeted mitigation strategies, including improved stormwater filtration near high-traffic zones and public education on synthetic textile emissions. By bridging land use, hydrology, rainfall contribution, this work advances predictive frameworks for microplastics fate in anthropogenically impacted waterways.
5. Limitations and Future Work
While this study offers new insights into how land use and rainfall influence microplastic transport in canal systems, several limitations should be acknowledged. First, while polymer characterization was conducted on every sample using FTIR spectroscopy, not all individual microplastic particles were analyzed. Due to heterogeneous mixtures and practical constraints, representative subsampling was performed, allowing identification of dominant polymer types within each sample but not the precise distribution across all particles. Second, although rainfall intensity and antecedent dry days were linked to microplastic mobilization, the study was limited to light and moderate rainfall events. More extreme precipitation scenarios could yield different patterns of transport and remobilization. Third, flow measurements were constrained by accessibility and channel conditions; flow normalization across all compartments relied on the assumption of uniform cross-sectional distribution, which may not fully capture dynamic hydraulic variability. Finally, the interpretation of microplastic sources—such as linking color or morphology to probable origins—was supported by literature and field context but was not confirmed by source-specific fingerprinting techniques.
Future research should prioritize full-particle polymer identification, extended hydrological data collection across seasons, and incorporation of advanced source-tracking techniques (e.g., pyrolysis-GC/MS) to improve attribution accuracy. Further exploration of sediment–water exchange processes and storm-driven fluxes in urban canals would also enhance understanding of microplastic fate in similar freshwater systems.
Author Contributions
Conceptualization, A.H.; methodology, A.H.; investigation, A.H.; data curation, A.H.; formal analysis, M.N.K.S.; visualization, M.N.K.S.; writing—original draft preparation, M.N.K.S.; writing—review and editing, M.N.K.S., T.M.H. and A.B.M.B.; supervision, T.M.H. and A.B.M.B.; project administration, A.B.M.B. All authors have read and agreed to the published version of the manuscript.
Funding
This research was funded by the Center of Excellence in Healthy Water Solutions.
Data Availability Statement
The datasets generated during and/or analyzed during the current study are available from the corresponding author on reasonable request.
Acknowledgments
The authors would like to thank Allyson Treichel and Usama Ijaz for their invaluable support and help during field data collections and data processing. Also, the authors would like to thank Dr. Daniel Andreescu and Dr. Siwen Wang for helping us with Fourier-transform infrared spectroscopy and stereo microscope, respectively.
Conflicts of Interest
The authors declare no conflict of interest. The funders had no role in the design of the study; in the collection, analyses, or interpretation of data; in the writing of the manuscript; or in the decision to publish the results.
Abbreviations
The following abbreviations are used in this manuscript:
| ADDs | Antecedent dry days |
| FTIR | Fourier-transform infrared spectroscopy |
| PET | Polyethylene terephthalate |
| PS | Polystyrene |
| PP | Polypropylene |
| PE | Polyethylene |
| PVC | Polyvinyl chloride |
| TRWPs | Tire-road wear particles |
References
- Lebreton, L.; Egger, M.; Slat, B. A Global Mass Budget for Positively Buoyant Macroplastic Debris in the Ocean. Sci. Rep. 2019, 9, 12922. [CrossRef]
- Routti, H.; Atwood, T.C.; Bechshoft, T.; Boltunov, A.; Ciesielski, T.M.; Desforges, J.-P.; Dietz, R.; Gabrielsen, G.W.; Jenssen, B.M.; Letcher, R.J.; et al. State of Knowledge on Current Exposure, Fate and Potential Health Effects of Contaminants in Polar Bears from the Circumpolar Arctic. Sci. Total Environ. 2019, 664, 1063–1083. [CrossRef]
- Global Plastic Production Available online: https://www.statista.com/statistics/282732/global-production-of-plastics-since-1950/ (accessed on 31 May 2024).
- Sridharan, S.; Kumar, M.; Singh, L.; Bolan, N.S.; Saha, M. Microplastics as an Emerging Source of Particulate Air Pollution: A Critical Review. J. Hazard. Mater. 2021, 418, 126245. [CrossRef]
- Salimkumar, A.V.; Cleetus, M.C.K.; Ehigie, J.O.; Onogbosele, C.O.; Essel, D.A.; Parry, R.; Kumar, B.S.; Prabhakaran, M.P.; Kumar, V.J.R. Ecotoxicological Impact of Microplastics in the Environment. In Microplastic Pollution; CRC Press, 2025 ISBN 978-1-032-70657-3.
- Rafa, N.; Ahmed, B.; Zohora, F.; Bakya, J.; Ahmed, S.; Ahmed, S.F.; Mofijur, M.; Chowdhury, A.A.; Almomani, F. Microplastics as Carriers of Toxic Pollutants: Source, Transport, and Toxicological Effects. Environ. Pollut. 2024, 343, 123190. [CrossRef]
- Cherian, E.; Mohan, L.; Manoj, S.E. Microplastics and Nanoplastics and Related Chemicals. In Toxic Effects of Micro- and Nanoplastics; John Wiley & Sons, Ltd, 2024; pp. 73–86 ISBN 978-1-394-23816-3.
- Chanda, M.; Bathi, J.R.; Khan, E.; Katyal, D.; Danquah, M. Microplastics in Ecosystems: Critical Review of Occurrence, Distribution, Toxicity, Fate, Transport, and Advances in Experimental and Computational Studies in Surface and Subsurface Water. J. Environ. Manage. 2024, 370, 122492. [CrossRef]
- Debnath, R.; Prasad, G.S.; Amin, A.; Malik, M.M.; Ahmad, I.; Abubakr, A.; Borah, S.; Rather, M.A.; Impellitteri, F.; Tabassum, I.; et al. Understanding and Addressing Microplastic Pollution: Impacts, Mitigation, and Future Perspectives. J. Contam. Hydrol. 2024, 266, 104399. [CrossRef]
- Li, Y.; Deng, Y.; Hu, C.; Li, D.; Zhang, J.; Zhou, N. Microplastic Pollution in Urban Rivers within China’s Danxia Landforms: Spatial Distribution Characteristics, Migration, and Risk Assessment. Sci. Total Environ. 2024, 910, 168610. [CrossRef]
- Tan, Y.; Dai, J.; Xiao, S.; Tang, Z.; Zhang, J.; Wu, S.; Wu, X.; Deng, Y. Occurrence of Microplastic Pollution in Rivers Globally: Driving Factors of Distribution and Ecological Risk Assessment. Sci. Total Environ. 2023, 904, 165979. [CrossRef]
- Mendrik, F.; Hackney, C.R.; Cumming, V.M.; Waller, C.; Hak, D.; Dorrell, R.; Hung, N.N.; Parsons, D.R. The Transport and Vertical Distribution of Microplastics in the Mekong River, SE Asia. J. Hazard. Mater. 2025, 484, 136762. [CrossRef]
- Mahanty, B.; Zafar, M.; Behera, S.K.; Atri, T.R.; Rene, E.R. Sources, Effects, and Fate of Microplastics in Aquatic Environment. In Microplastic Pollution; CRC Press, 2025 ISBN 978-1-032-70657-3.
- Gao, S.; Orlowski, N.; Bopf, F.K.; Breuer, L. A Review on Microplastics in Major European Rivers. WIREs Water 2024, 11, e1713. [CrossRef]
- Neelavannan, K.; Sen, I.S. Microplastics in Freshwater Ecosystems of India: Current Trends and Future Perspectives. ACS Omega 2023, 8, 34235–34248. [CrossRef]
- Li, J.; Zhu, B.; Huang, B.; Ma, J.; Lu, C.; Chi, G.; Guo, W.; Chen, X. Vertical Distribution and Characteristics of Soil Microplastics under Different Land Use Patterns: A Case Study of Shouguang City, China. Sci. Total Environ. 2023, 903, 166154. [CrossRef]
- Abbasi, S.; Ahmadi, F.; Khodabakhshloo, N.; Pourmahmood, H.; Esfandiari, A.; Mokhtarzadeh, Z.; Rahnama, S.; Dehbandi, R.; Vazirzadeh, A.; Turner, A. Atmospheric Deposition of Microplastics in Shiraz, Iran. Atmospheric Pollut. Res. 2024, 15, 101977. [CrossRef]
- Jiries, A.; Al-Omari, A.; Fraihat, S.; Hamra, M.A. Abundance and Distribution of Microplastics in Irrigation Canal Water in Jordan. Desalination Water Treat. 2024, 318, 100409. [CrossRef]
- Ross, M.S.; Loutan, A.; Groeneveld, T.; Molenaar, D.; Kroetch, K.; Bujaczek, T.; Kolter, S.; Moon, S.; Huynh, A.; Khayam, R.; et al. Estimated Discharge of Microplastics via Urban Stormwater during Individual Rain Events. Front. Environ. Sci. 2023, 11. [CrossRef]
- Guo, Y.; Wu, R.; Guo, C.; Wu, L.; Xu, J. Risks of Microplastics in Different Land-Use Types of Soil in a Typical Petrochemical City in China 2024.
- Cheung, C.K.H.; Not, C. Impacts of Extreme Weather Events on Microplastic Distribution in Coastal Environments. Sci. Total Environ. 2023, 904, 166723. [CrossRef]
- Forrest, S.A.; McMahon, D.; Adams, W.A.; Vermaire, J.C. Change in Microplastic Concentration during Various Temporal Events Downstream of a Combined Sewage Overflow and in an Urban Stormwater Creek. Front. Water 2022, 4. [CrossRef]
- Imbulana, S.; Tanaka, S.; Moriya, A.; Oluwoye, I. Inter-Event and Intra-Event Dynamics of Microplastic Emissions in an Urban River during Rainfall Episodes. Environ. Res. 2024, 243, 117882. [CrossRef]
- Norling, M.; Hurley, R.; Schell, T.; Futter, M.N.; Rico, A.; Vighi, M.; Blanco, A.; Ledesma, J.L.J.; Nizzetto, L. Retention Efficiency for Microplastic in a Landscape Estimated from Empirically Validated Dynamic Model Predictions. J. Hazard. Mater. 2024, 464, 132993. [CrossRef]
- Sawan, R.; Doyen, P.; Viudes, F.; Amara, R.; Mahfouz, C. Microplastic Inputs to the Mediterranean Sea during Wet and Dry Seasons: The Case of Two Lebanese Coastal Outlets. Mar. Pollut. Bull. 2024, 198, 115781. [CrossRef]
- Soltani Tehrani, R.; Yang, X.; van Dam, J. Rainfall-Induced Microplastic Fate and Transport in Unsaturated Dutch Soils. J. Contam. Hydrol. 2025, 268, 104456. [CrossRef]
- Haverson, L.; Mignanelli, L.; Schneidewind, U.; Krause, S. High Frequency Sampling during a Storm Hydrograph Offers Insights into the Possible Transport and Source Activation Dynamics of Microplastics within a Peri Urban Stream. 2024, 8895. [CrossRef]
- Masura, J.; Baker, J.; Foster, G.; Arthur, C. Laboratory Methods for the Analysis of Microplastics in the Marine Environment: Recommendations for Quantifying Synthetic Particles in Waters and Sediments.; NOAA Marine Debris Division, 2015;
- Haque, A.; Holsen, T.M.; Baki, A.B.M. Distribution and Risk Assessment of Microplastic Pollution in a Rural River System near a Wastewater Treatment Plant, Hydro-Dam, and River Confluence. Sci. Rep. 2024, 14, 6006. [CrossRef]
- Han, M.; Niu, X.; Tang, M.; Zhang, B.-T.; Wang, G.; Yue, W.; Kong, X.; Zhu, J. Distribution of Microplastics in Surface Water of the Lower Yellow River near Estuary. Sci. Total Environ. 2020, 707, 135601. [CrossRef]
- Schneider, C.A.; Rasband, W.S.; Eliceiri, K.W. NIH Image to ImageJ: 25 Years of Image Analysis. Nat. Methods 2012, 9, 671–675. [CrossRef]
- He, D.; Chen, X.; Zhao, W.; Zhu, Z.; Qi, X.; Zhou, L.; Chen, W.; Wan, C.; Li, D.; Zou, X.; et al. Microplastics Contamination in the Surface Water of the Yangtze River from Upstream to Estuary Based on Different Sampling Methods. Environ. Res. 2021, 196, 110908. [CrossRef]
- da Costa, I.D.; Costa, L.L.; Zalmon, I.R. Microplastics in Water from the Confluence of Tropical Rivers: Overall Review and a Case Study in Paraiba Do Sul River Basin. Chemosphere 2023, 338, 139493. [CrossRef]
- Prarat, P.; Hongsawat, P. Microplastic Pollution in Surface Seawater and Beach Sand from the Shore of Rayong Province, Thailand: Distribution, Characterization, and Ecological Risk Assessment. Mar. Pollut. Bull. 2022, 174, 113200. [CrossRef]
- State Water Resources Control Board 2024 California Integrated Report: Surface Water Quality Assessments to Comply with Clean Water Act Sections 303(d) and 305(b)—Final Staff Report; California Environmental Protection Agency, 2024;
- Crew, A.; Gregory-Eaves, I.; Ricciardi, A. Distribution, Abundance, and Diversity of Microplastics in the Upper St. Lawrence River. Environ. Pollut. 2020, 260, 113994. [CrossRef]
- Eamrat, R.; Taweesan, A.; Pussayanavin, T. Assessment of Microplastics Distribution and Related Water Quality in an Urban Canal Thailand. Pollution 2022, 8. [CrossRef]
- Pojar, I.; Stănică, A.; Stock, F.; Kochleus, C.; Schultz, M.; Bradley, C. Sedimentary Microplastic Concentrations from the Romanian Danube River to the Black Sea. Sci. Rep. 2021, 11, 2000. [CrossRef]
- Islam, Md.S.; Karim, Md.R.; Islam, M.T.; Oishi, H.T.; Tasnim, Z.; Das, H.; Kabir, A.H.M.E.; Sekine, M. Abundance, Characteristics, and Ecological Risks of Microplastics in the Riverbed Sediments around Dhaka City. Sci. Total Environ. 2023, 877, 162866. [CrossRef]
- Klein, S.; Worch, E.; Knepper, T.P. Occurrence and Spatial Distribution of Microplastics in River Shore Sediments of the Rhine-Main Area in Germany. Environ. Sci. Technol. 2015, 49, 6070–6076. [CrossRef]
- Ijaz, U.; Baki, A.B.M.; Abdul-Aziz, O.I.; Zhang, W.; Christian, A.D. The Effects of Large Roughness Elements on the In-Stream Transport and Retention of Polystyrene Microplastics. Sci. Rep. 2023, 13, 6522. [CrossRef]
- Helcoski, R.; Yonkos, L.T.; Sanchez, A.; Baldwin, A.H. Wetland Soil Microplastics Are Negatively Related to Vegetation Cover and Stem Density. Environ. Pollut. Barking Essex 1987 2020, 256, 113391. [CrossRef]
- Miera-Domínguez, H.; Lastra-González ,Pedro; Indacoechea-Vega ,Irune; and Castro-Fresno, D. What Is Known and Unknown Concerning Microplastics from Tyre Wear? Road Mater. Pavement Des. 2024, 25, 1658–1679. [CrossRef]
- Barani, J. Rain Rate Intensity Classification Available online: https://www.baranidesign.com/faq-articles/2020/1/19/rain-rate-intensity-classification (accessed on 3 July 2025).
- Woodward, J.; Li, J.; Rothwell, J.; Hurley, R. Acute Riverine Microplastic Contamination Due to Avoidable Releases of Untreated Wastewater. Nat. Sustain. 2021, 4, 793–802. [CrossRef]
- Huang, D.; Li, X.; Ouyang, Z.; Zhao, X.; Wu, R.; Zhang, C.; Lin, C.; Li, Y.; Guo, X. The Occurrence and Abundance of Microplastics in Surface Water and Sediment of the West River Downstream, in the South of China. Sci. Total Environ. 2021, 756, 143857. [CrossRef]
- Rasmussen, L.A.; Lykkemark, J.; Andersen, T.R.; Vollertsen, J. Permeable Pavements: A Possible Sink for Tyre Wear Particles and Other Microplastics? Sci. Total Environ. 2023, 869, 161770. [CrossRef]
- Mishra, S.; Rath, C.C.; Das, A.P. Marine Microfiber Pollution: A Review on Present Status and Future Challenges. Mar. Pollut. Bull. 2019, 140, 188–197. [CrossRef]
- Rakib, M.R.J.; Hossain, M.B.; Kumar, R.; Ullah, M.A.; Al Nahian, S.; Rima, N.N.; Choudhury, T.R.; Liba, S.I.; Yu, J.; Khandaker, M.U.; et al. Spatial Distribution and Risk Assessments Due to the Microplastics Pollution in Sediments of Karnaphuli River Estuary, Bangladesh. Sci. Rep. 2022, 12, 8581. [CrossRef]
- Xia, W.; Rao, Q.; Deng, X.; Chen, J.; Xie, P. Rainfall Is a Significant Environmental Factor of Microplastic Pollution in Inland Waters. Sci. Total Environ. 2020, 732, 139065. [CrossRef]
- Zhang, X.; Chen, Y.; Li, X.; Zhang, Y.; Gao, W.; Jiang, J.; Mo, A.; He, D. Size/Shape-Dependent Migration of Microplastics in Agricultural Soil under Simulative and Natural Rainfall. Sci. Total Environ. 2022, 815, 152507. [CrossRef]
- Baensch-Baltruschat, B.; Kocher, B.; Stock, F.; Reifferscheid, G. Tyre and Road Wear Particles (TRWP) - A Review of Generation, Properties, Emissions, Human Health Risk, Ecotoxicity, and Fate in the Environment. Sci. Total Environ. 2020, 733, 137823. [CrossRef]
- Kole, P.J.; Löhr, A.J.; Van Belleghem, F.G.A.J.; Ragas, A.M.J. Wear and Tear of Tyres: A Stealthy Source of Microplastics in the Environment. Int. J. Environ. Res. Public. Health 2017, 14, 1265. [CrossRef]
- Unice, K.M.; Weeber, M.P.; Abramson, M.M.; Reid, R.C.D.; van Gils, J.A.G.; Markus, A.A.; Vethaak, A.D.; Panko, J.M. Characterizing Export of Land-Based Microplastics to the Estuary - Part I: Application of Integrated Geospatial Microplastic Transport Models to Assess Tire and Road Wear Particles in the Seine Watershed. Sci. Total Environ. 2019, 646, 1639–1649. [CrossRef]
- de Haan, W.P.; Quintana, R.; Vilas, C.; Cózar, A.; Canals, M.; Uviedo, O.; Sanchez-Vidal, A. The Dark Side of Artificial Greening: Plastic Turfs as Widespread Pollutants of Aquatic Environments. Environ. Pollut. 2023, 334, 122094. [CrossRef]
- Browne, M.A.; Crump, P.; Niven, S.J.; Teuten, E.; Tonkin, A.; Galloway, T.; Thompson, R. Accumulation of Microplastic on Shorelines Woldwide: Sources and Sinks. Environ. Sci. Technol. 2011, 45, 9175–9179. [CrossRef]
- De Falco, F.; Cocca, M.; Avella, M.; Thompson, R.C. Microfiber Release to Water, Via Laundering, and to Air, via Everyday Use: A Comparison between Polyester Clothing with Differing Textile Parameters. Environ. Sci. Technol. 2020, 54, 3288–3296. [CrossRef]
- Rossatto, A.; Arlindo, M.Z.F.; De Morais, M.S.; De Souza, T.D.; Ogrodowski, C.S. Microplastics in Aquatic Systems: A Review of Occurrence, Monitoring and Potential Environmental Risks. Environ. Adv. 2023, 13, 100396. [CrossRef]
- Sommer, F.; Dietze, V.; Baum, A.; Sauer, J.; Gilge, S.; Maschowski, C.; Gieré, R. Tire Abrasion as a Major Source of Microplastics in the Environment. Aerosol Air Qual. Res. 2018, 18, 2014–2028. [CrossRef]
- Min, R.; Ma, K.; Zhang, H.; Zhang, J.; Yang, S.; Zhou, T.; Zhang, G. Distribution and Risk Assessment of Microplastics in Liujiaxia Reservoir on the Upper Yellow River. Chemosphere 2023, 320, 138031. [CrossRef]
Figure 1.
Land use map and sampling locations along the SUNY Potsdam Canal in Potsdam, New York. Red diamonds denote cross-section sites where water and sediment samples were collected. White circles indicate stormwater outlet sampling locations. The blue line represents the main canal flow path, and yellow arrows indicate the direction of canal flow. Land use types adjacent to the canal are color-coded to represent residential, commercial, institutional, agricultural, and artificial turf areas. The map was created using ArcGIS Pro Desktop (version 3.4.2), and the New York State boundary shapefile was obtained from the NYS Civil Boundaries GIS portal (https://gis.ny.gov/civil-boundaries).
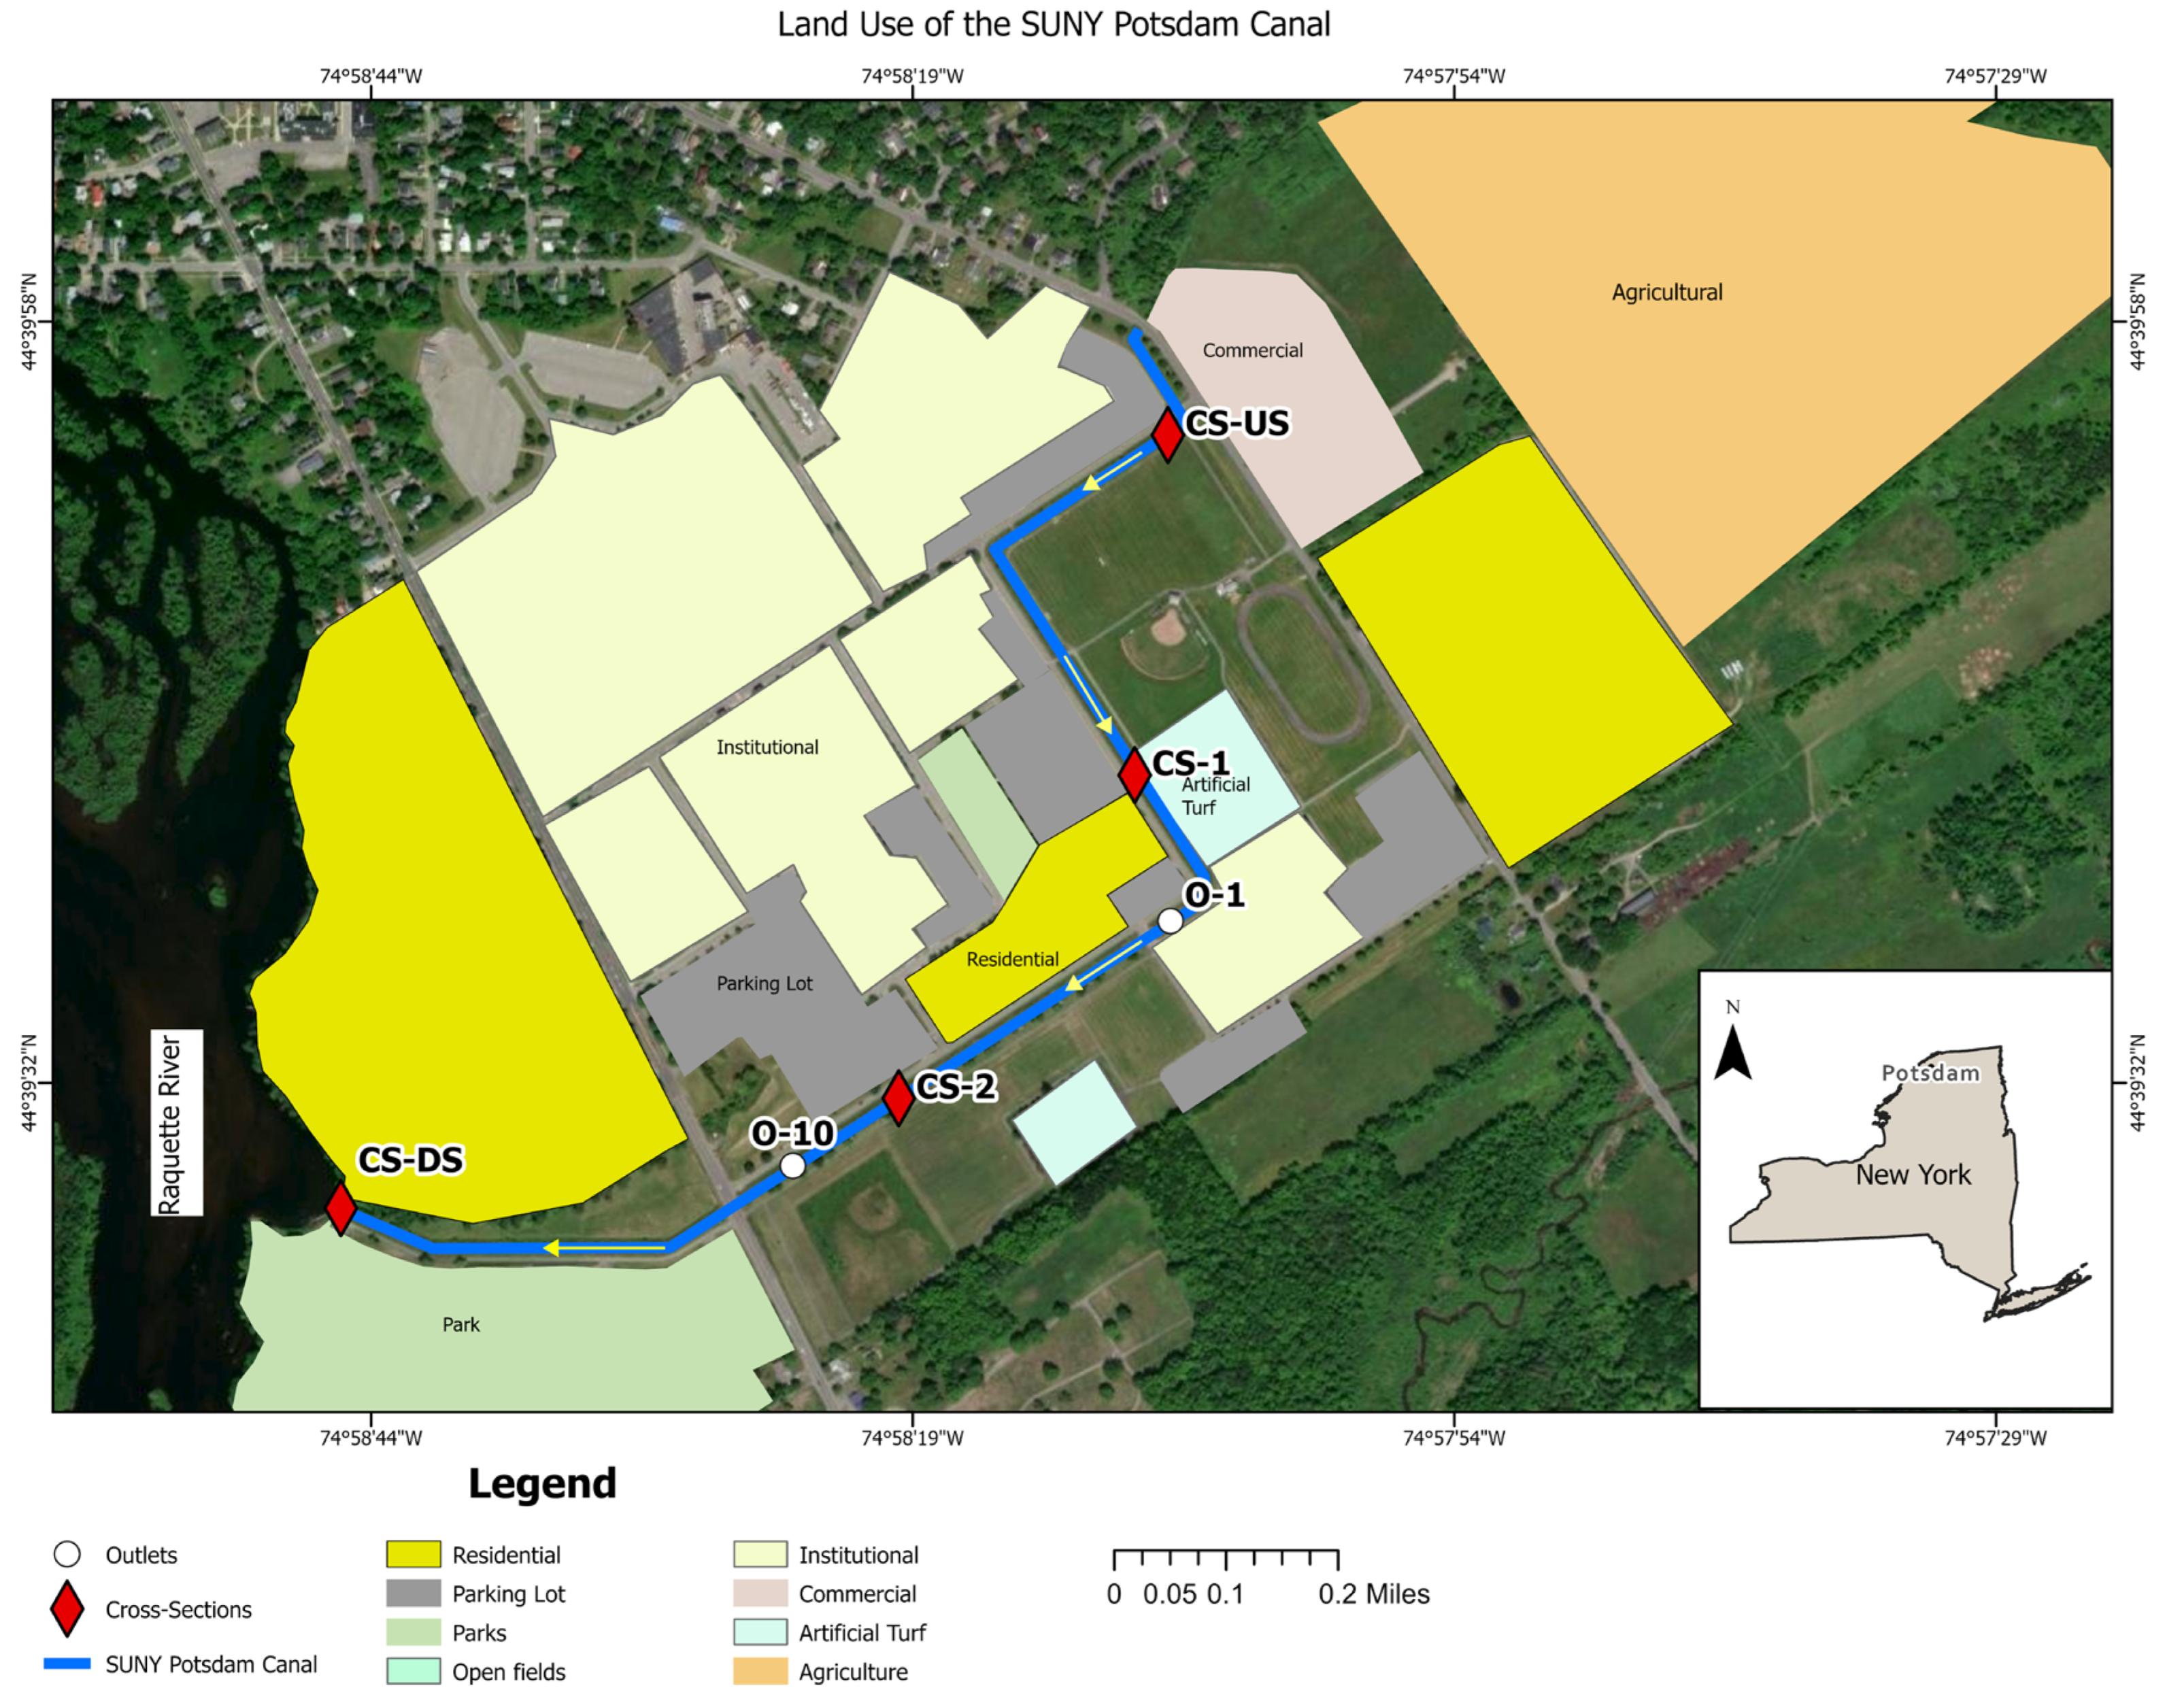
Figure 2.
Event-wise microplastic abundance in (a) water column (WC), (b) suspended sediment load (SSL), and (c) bed load (BL) samples across four cross sections along the canal: CS-US = Upstream Cross-Section, CS-1 = Cross-Section 1, CS-2 = Cross-Section 2, and CS-DS = Downstream Cross-Section. Flow direction is from CS-US to CS-DS. Each bar represents the microplastic concentration recorded during five distinct sampling events conducted between June and August 2023. Variability is not shown for figure 2 (b) and 2 (c) due to the collection of only one sample per location per event in these compartments.
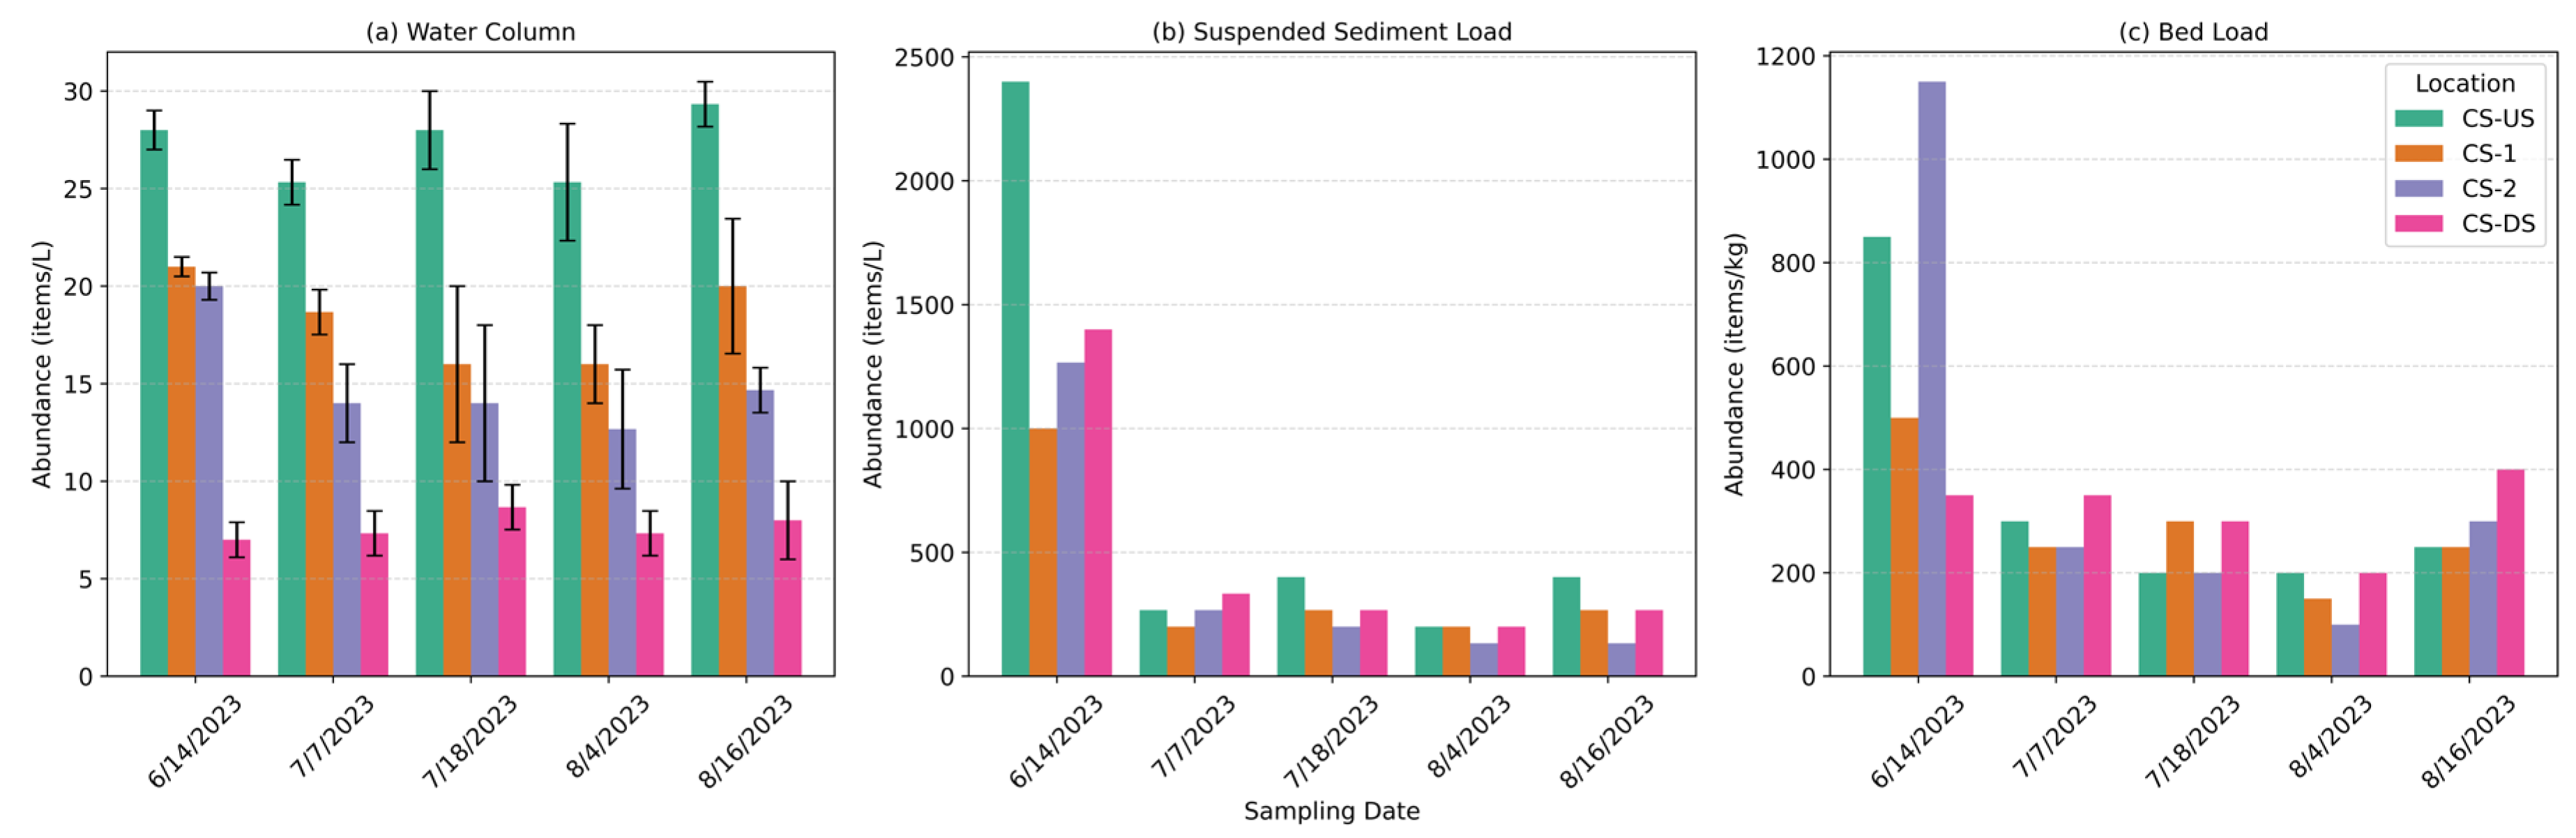
Figure 3.
Percentage difference in microplastic abundance between adjacent cross-sections along the study reach. Flow direction is from CS-US to CS-DS. Positive values indicate a net gain in microplastic abundance downstream, while negative values indicate a net loss. (CS-US = Upstream Cross-Section, CS-1 = Cross-Section 1, CS-2 = Cross-Section 2, and CS-DS = Downstream Cross-Section).
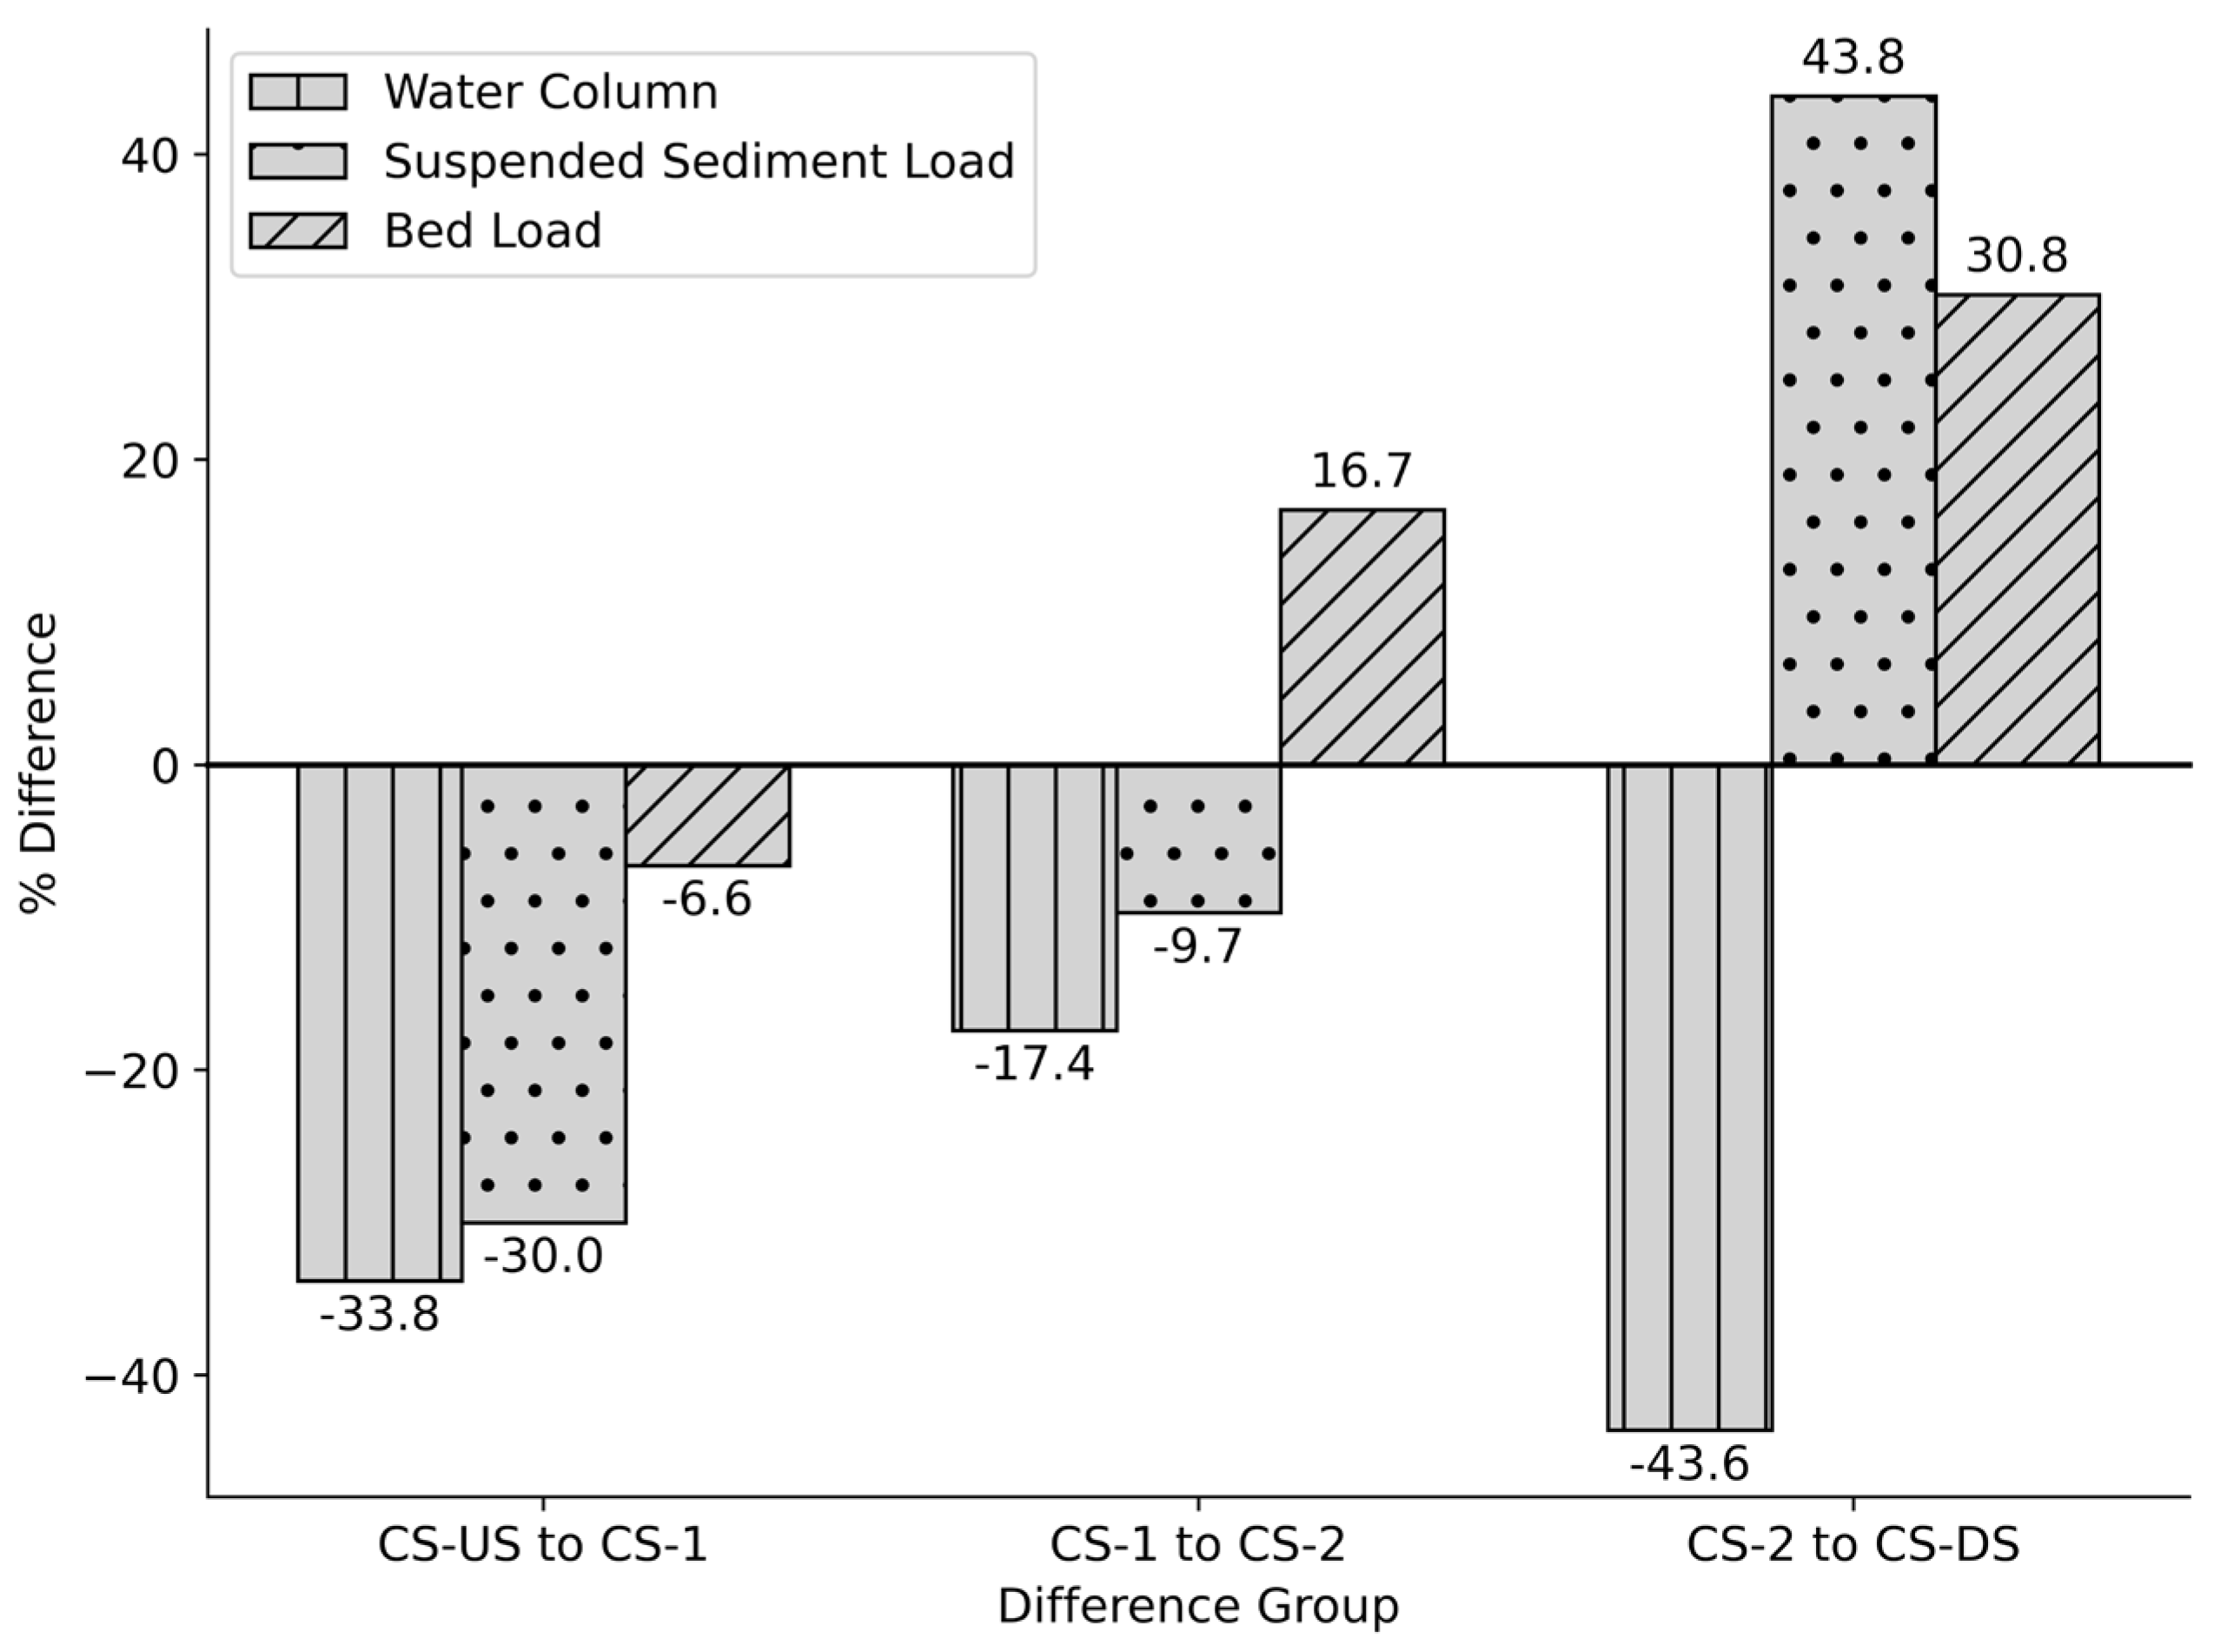
Figure 4.
Microplastics abundance in (a) water column, (b) suspended sediment load, and (c) bed load samples with respect to rainfall condition. Flow is from CS-US to CS-DS. (CS-US = Upstream Cross-Section, CS-1 = Cross-Section 1, CS-2 = Cross-Section 2, CS-DS = Downstream Cross-Section, O-1 = Outlet 1, O-10 = Outlet 10).
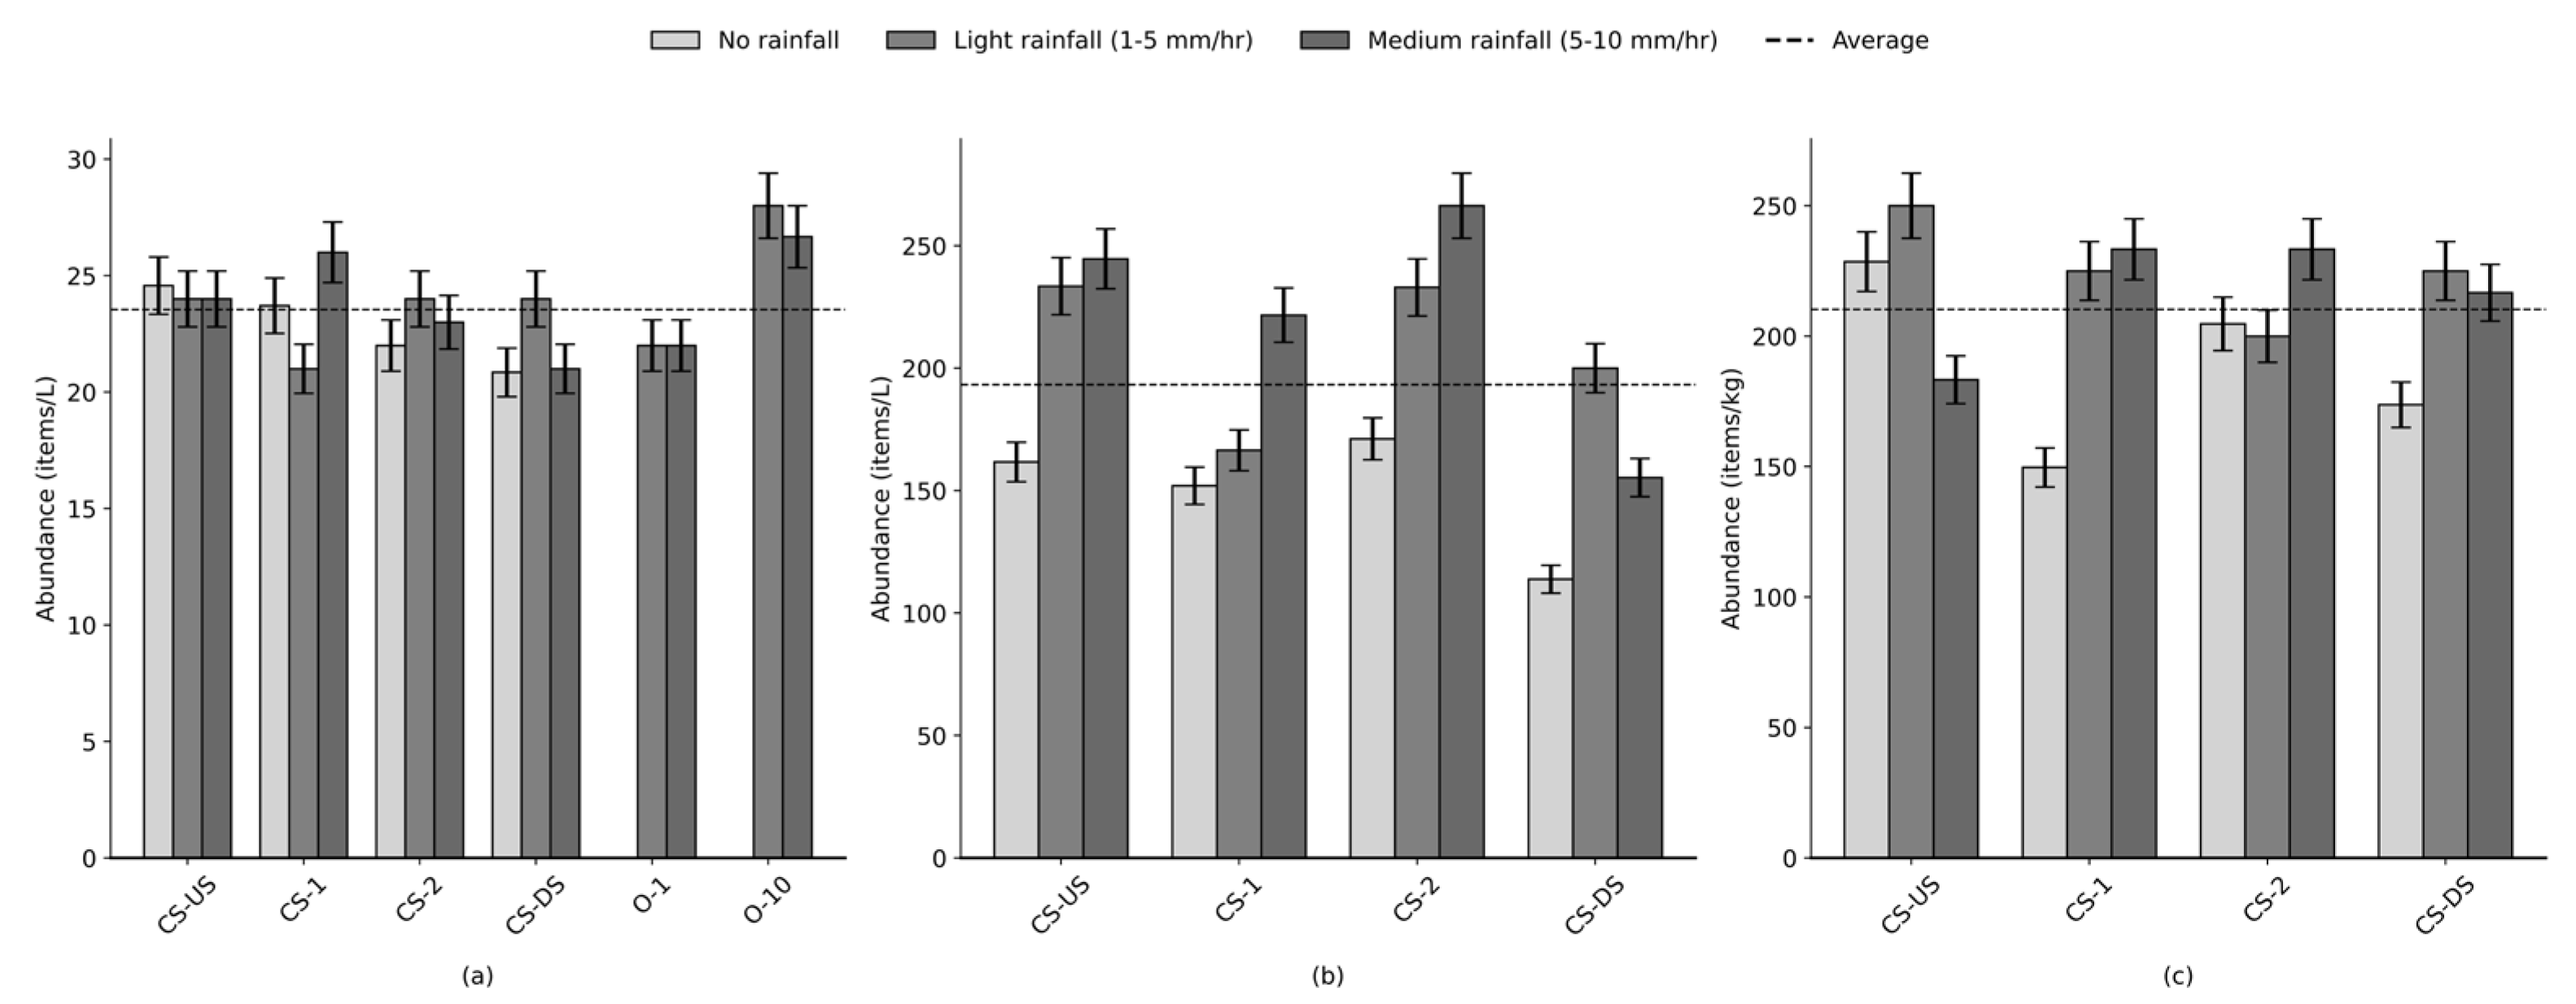
Figure 5.
Microplastic abundance as a function of antecedent dry days (ADDs): (a) Outlet discharge samples; (b) Water column samples from the canal, normalized to the baseline abundance observed at ADD = 0 (i.e., the day following a rainfall event). Normalization was performed by dividing each sample's abundance by the corresponding site's abundance at ADD = 0, to allow comparison of relative increases across sites.
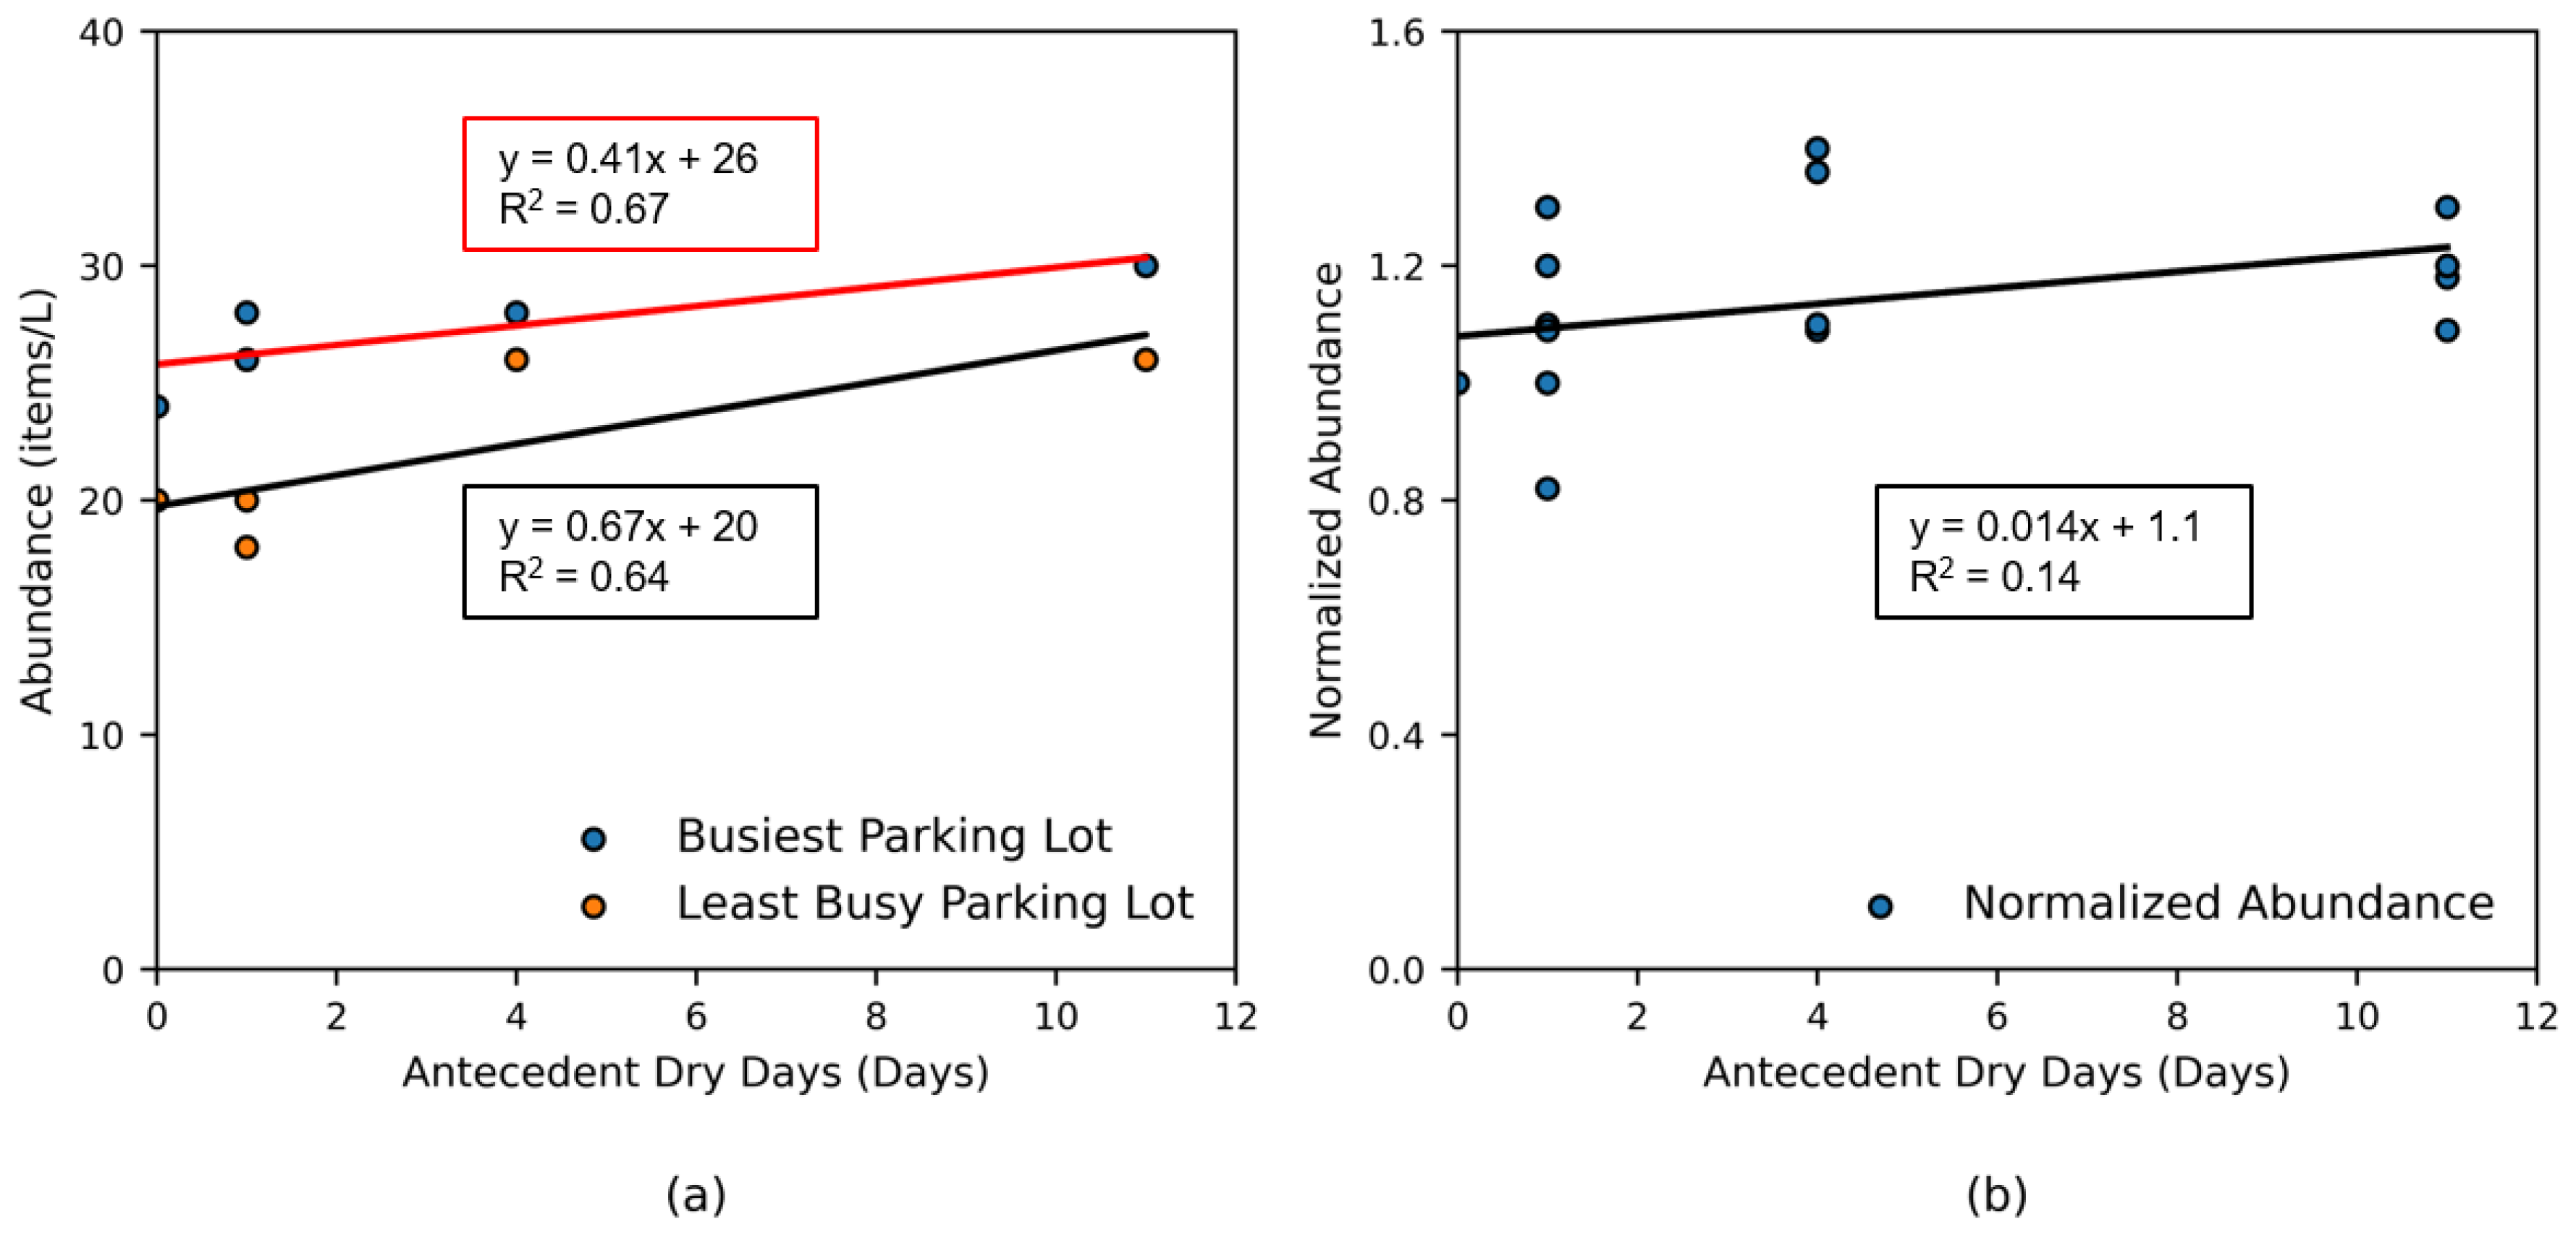
Figure 6.
Size distribution of microplastics observed at different cross-sections. Microplastics were categorized into four size classes: <100 µm, 100–500 µm, 500–1000 µm, and >1000 µm. Flow direction is from CS-US to CS-DS. (CS-US = Upstream Cross-Section; CS-1 = Cross-Section 1; CS-2 = Cross-Section 2; CS-DS = Downstream Cross-Section).
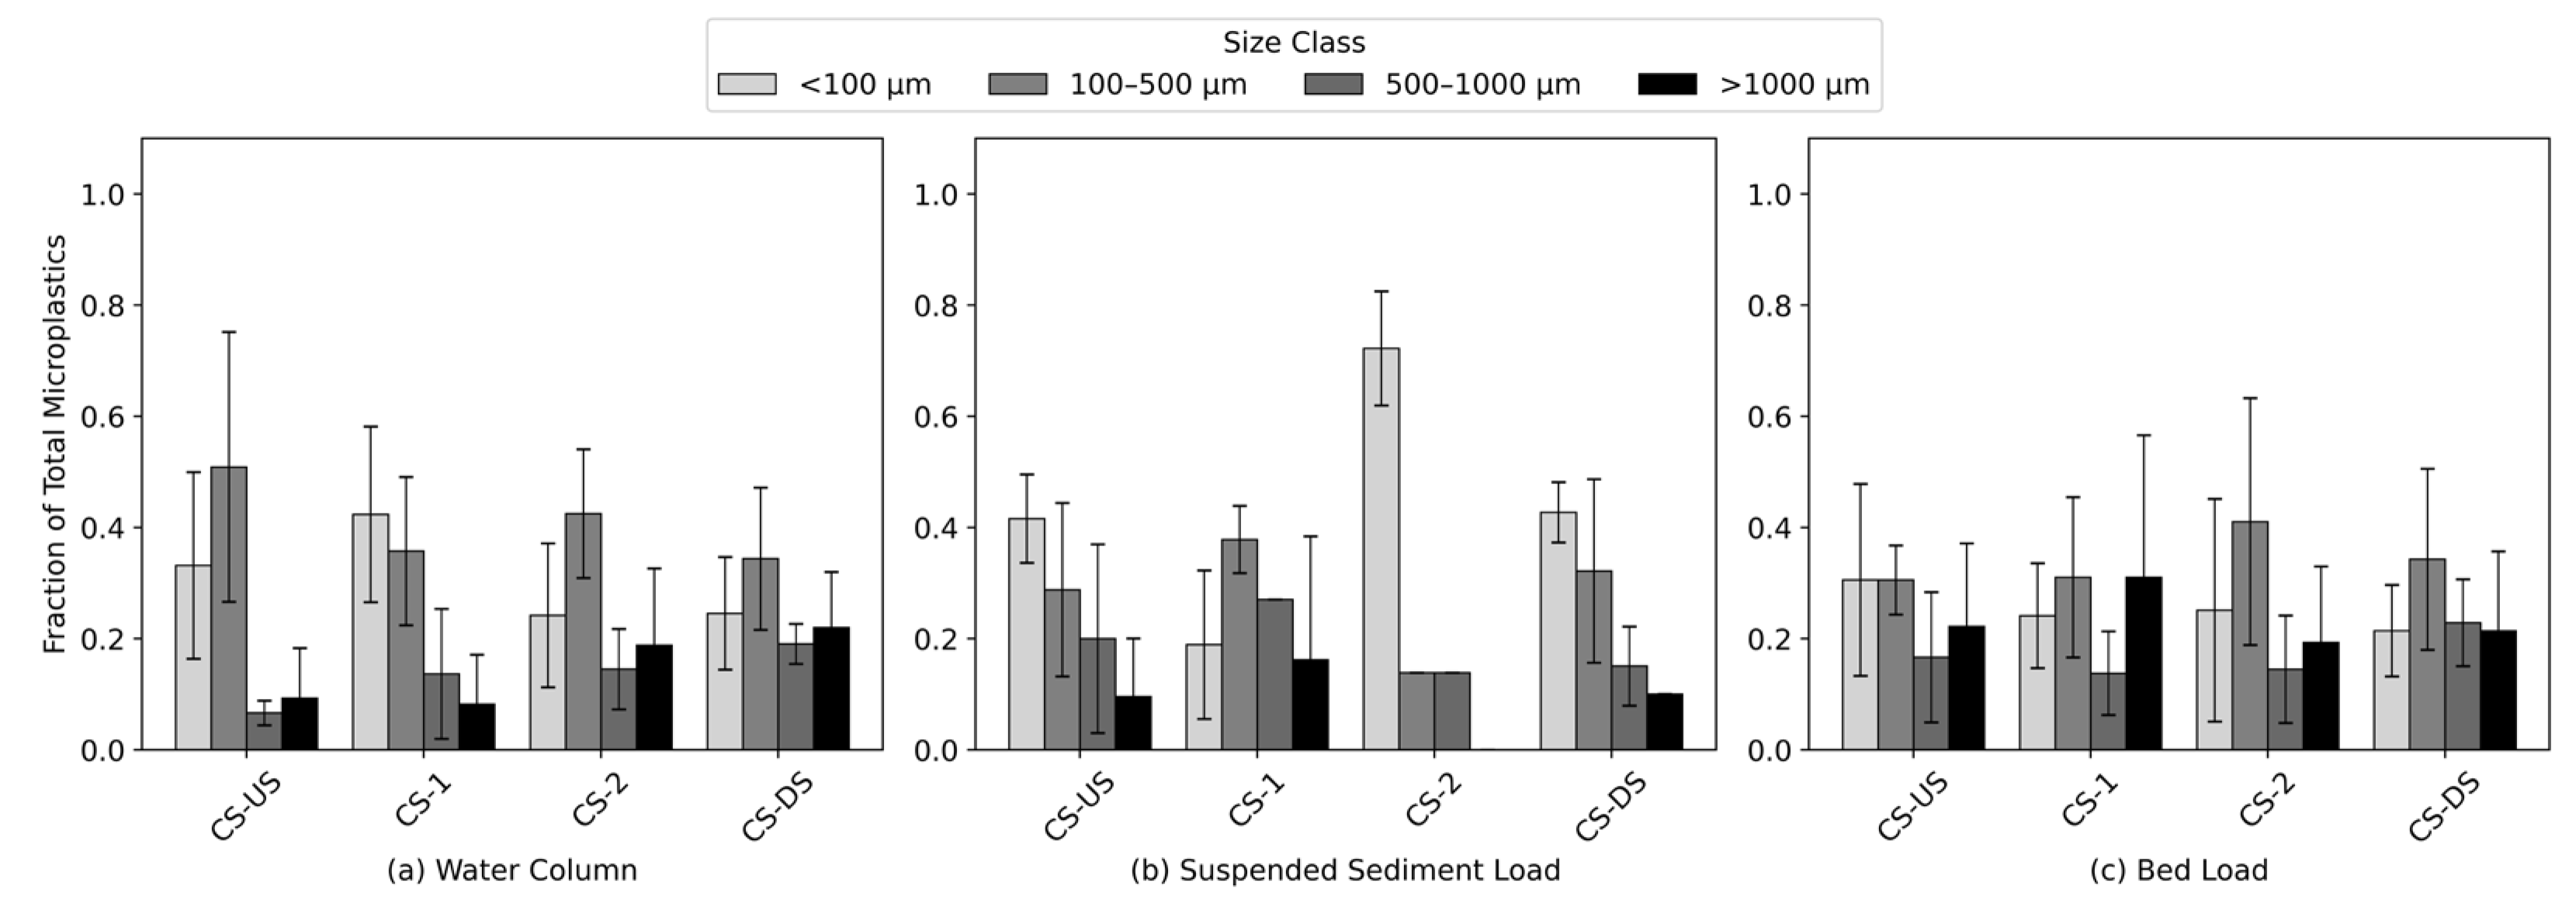
Figure 7.
Microplastics size distribution. The inner, middle, and outer circle represents no rainfall, light rainfall, and moderate rainfall, respectively. Microplastics were categorized into four size classes: <100 µm, 100–500 µm, 500–1000 µm, and >1000 µm. No ring is shown for no rainfall at the outlet (d) due to the absence of flow under dry conditions.
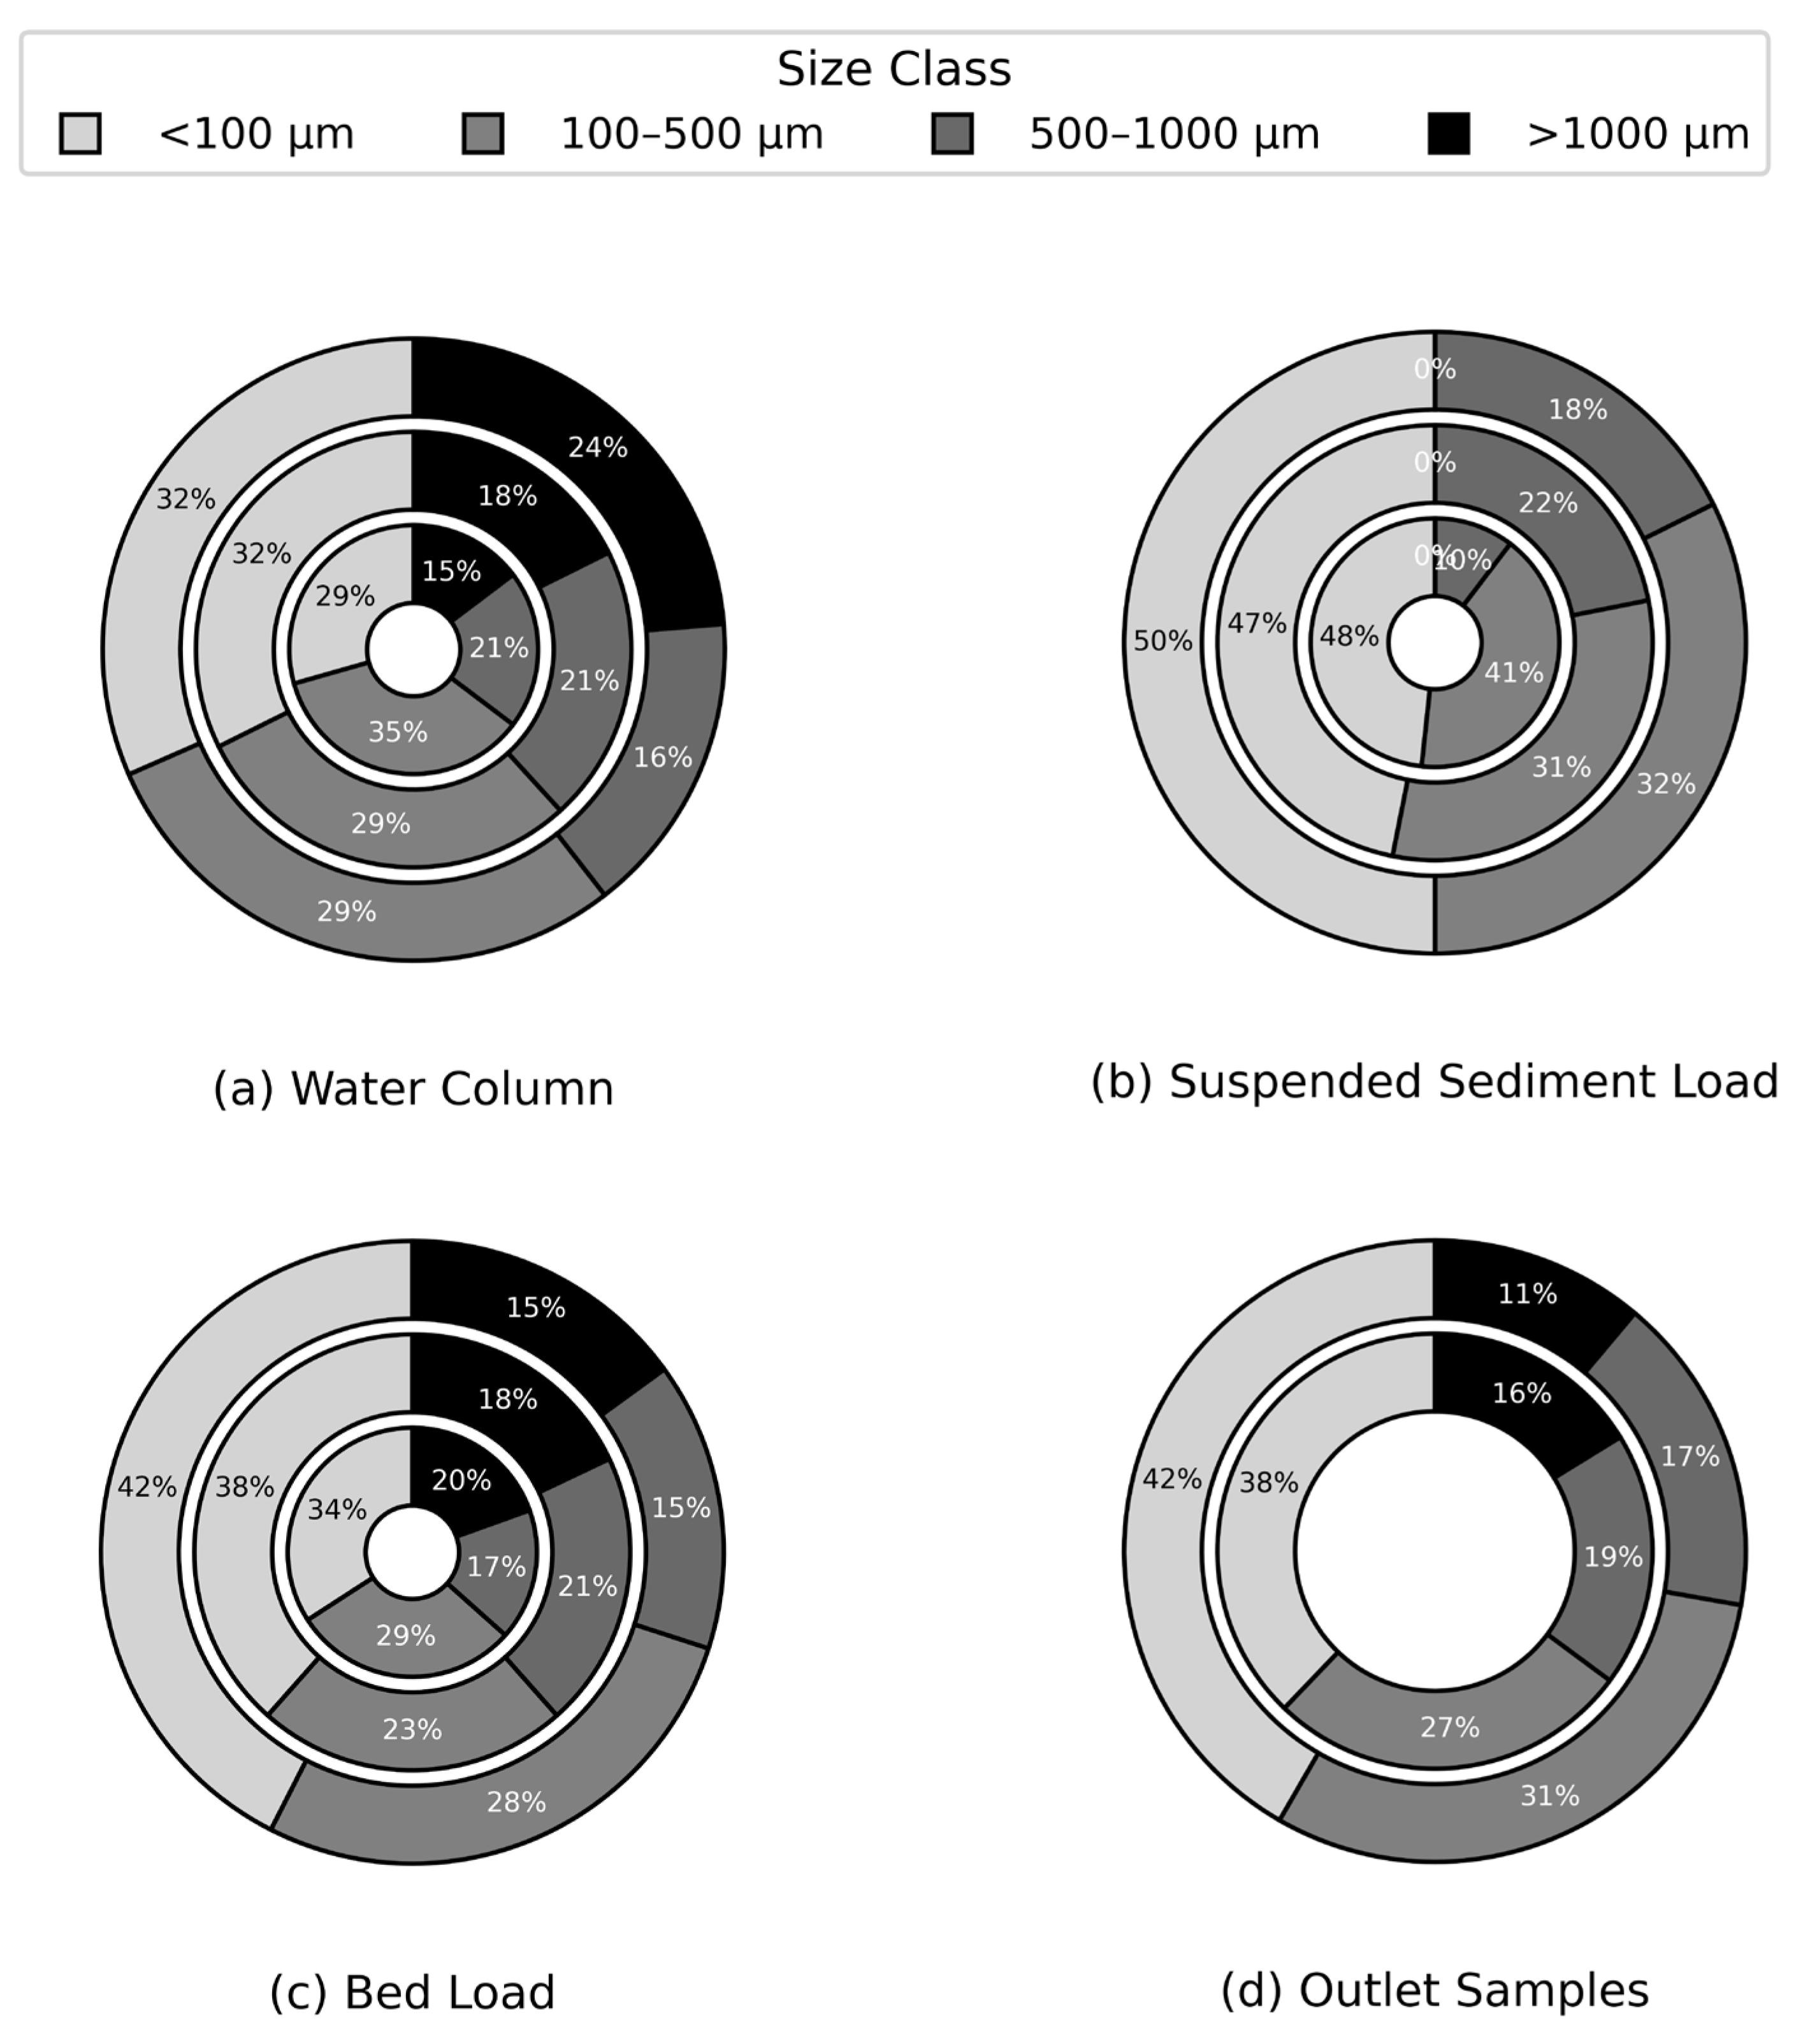
Figure 8.
Fraction of Microplastics shapes observed at different cross sections of this study. Microplastic shapes identified include fibers, fragments, and beads. Flow direction is from CS-US to CS-DS. (CS-US = Upstream Cross-Section; CS-1 = Cross-Section 1; CS-2 = Cross-Section 2; CS-DS = Downstream Cross-Section).
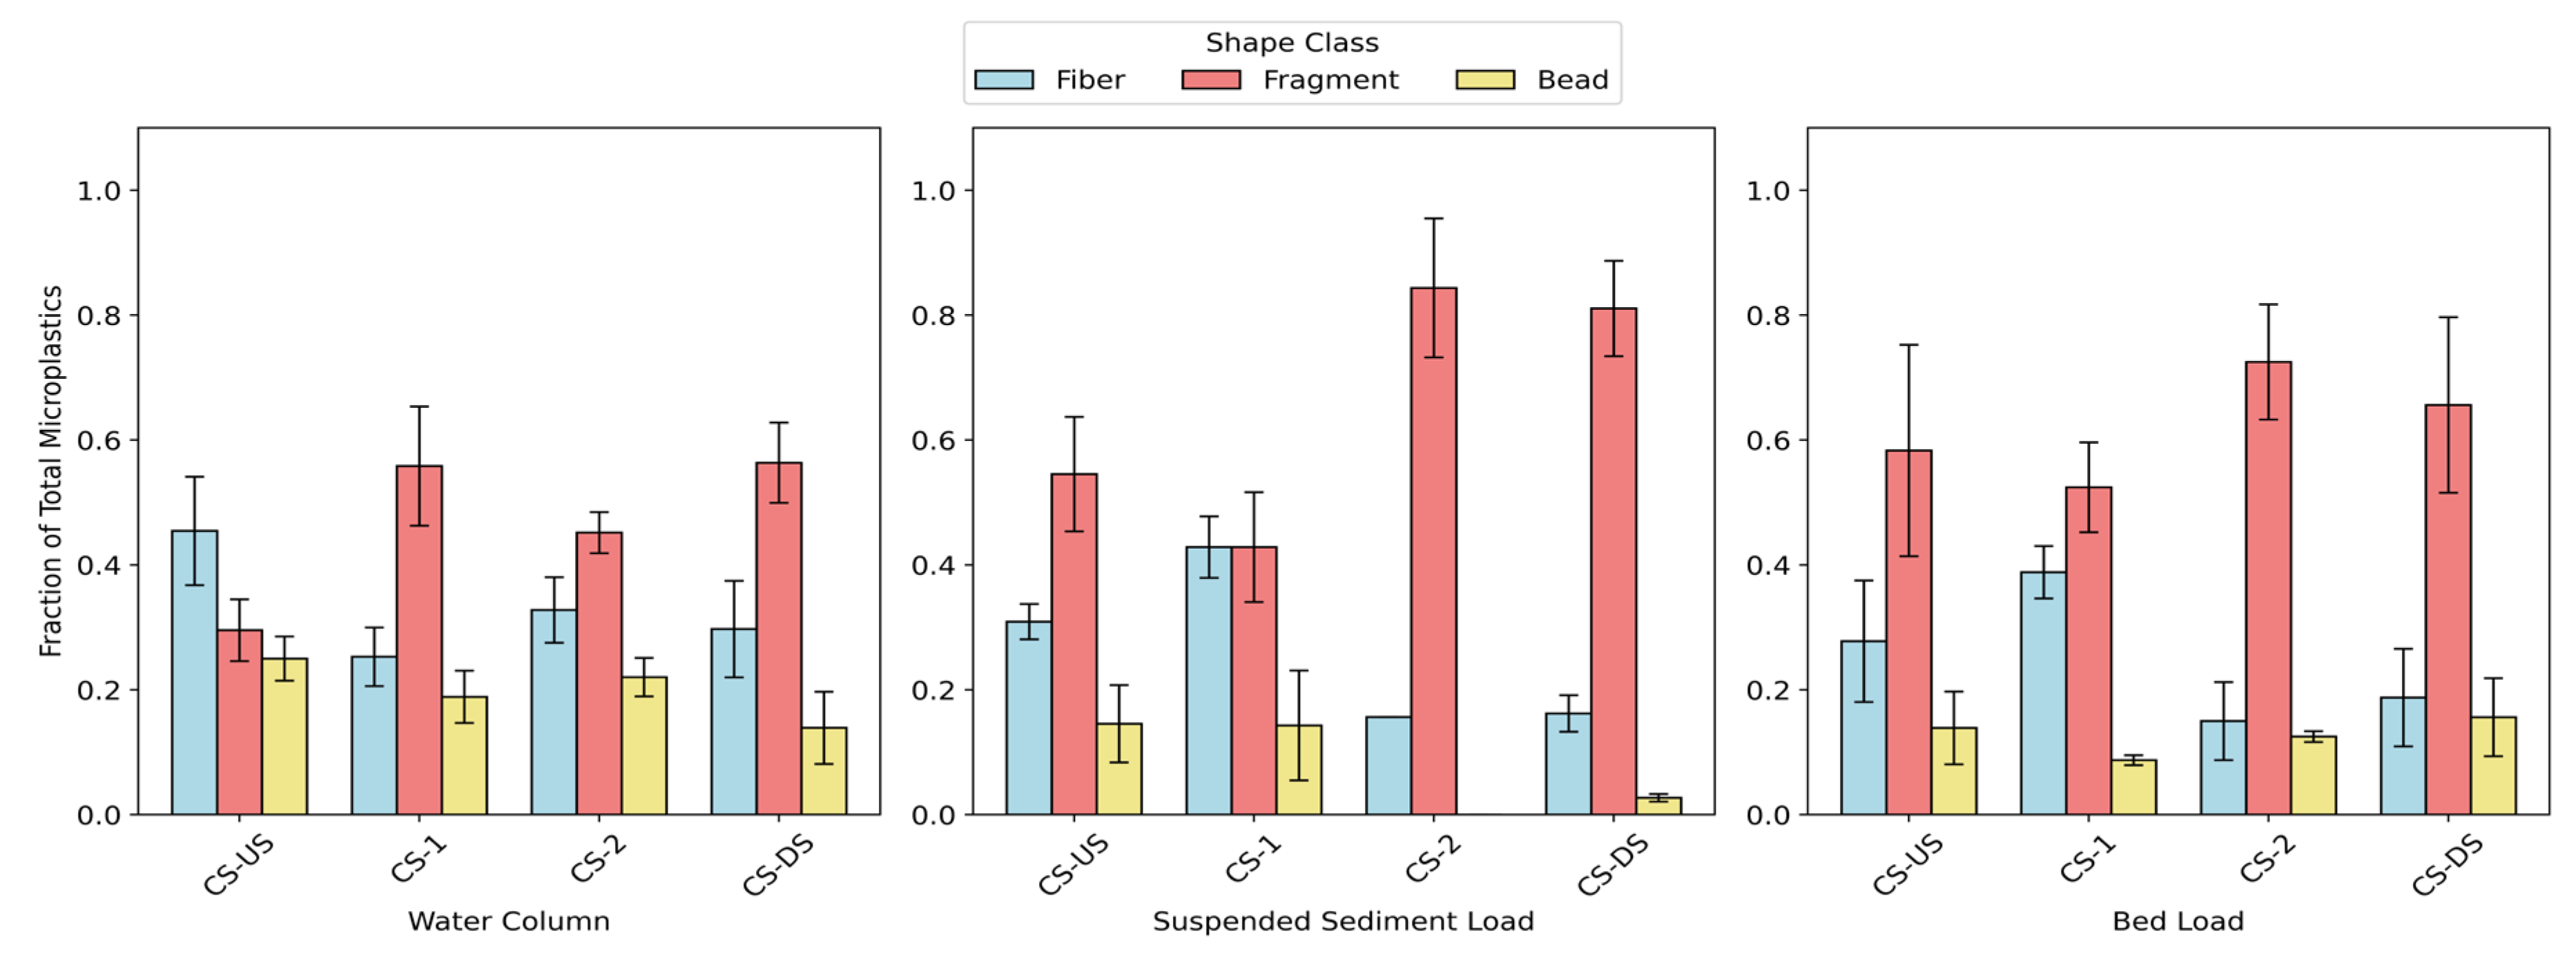
Figure 9.
Microplastic shape distribution across sample types: (a) Water Column, (b) Suspended Sediment Load, (c) Bed Load, and (d) Outlet Samples. Identified shapes include fibers, fragments, and beads. The inner, middle, and outer circles represent no rainfall, light rainfall, and moderate rainfall conditions, respectively. No ring is shown for no rainfall at the outlet (d) due to the absence of flow under dry conditions.
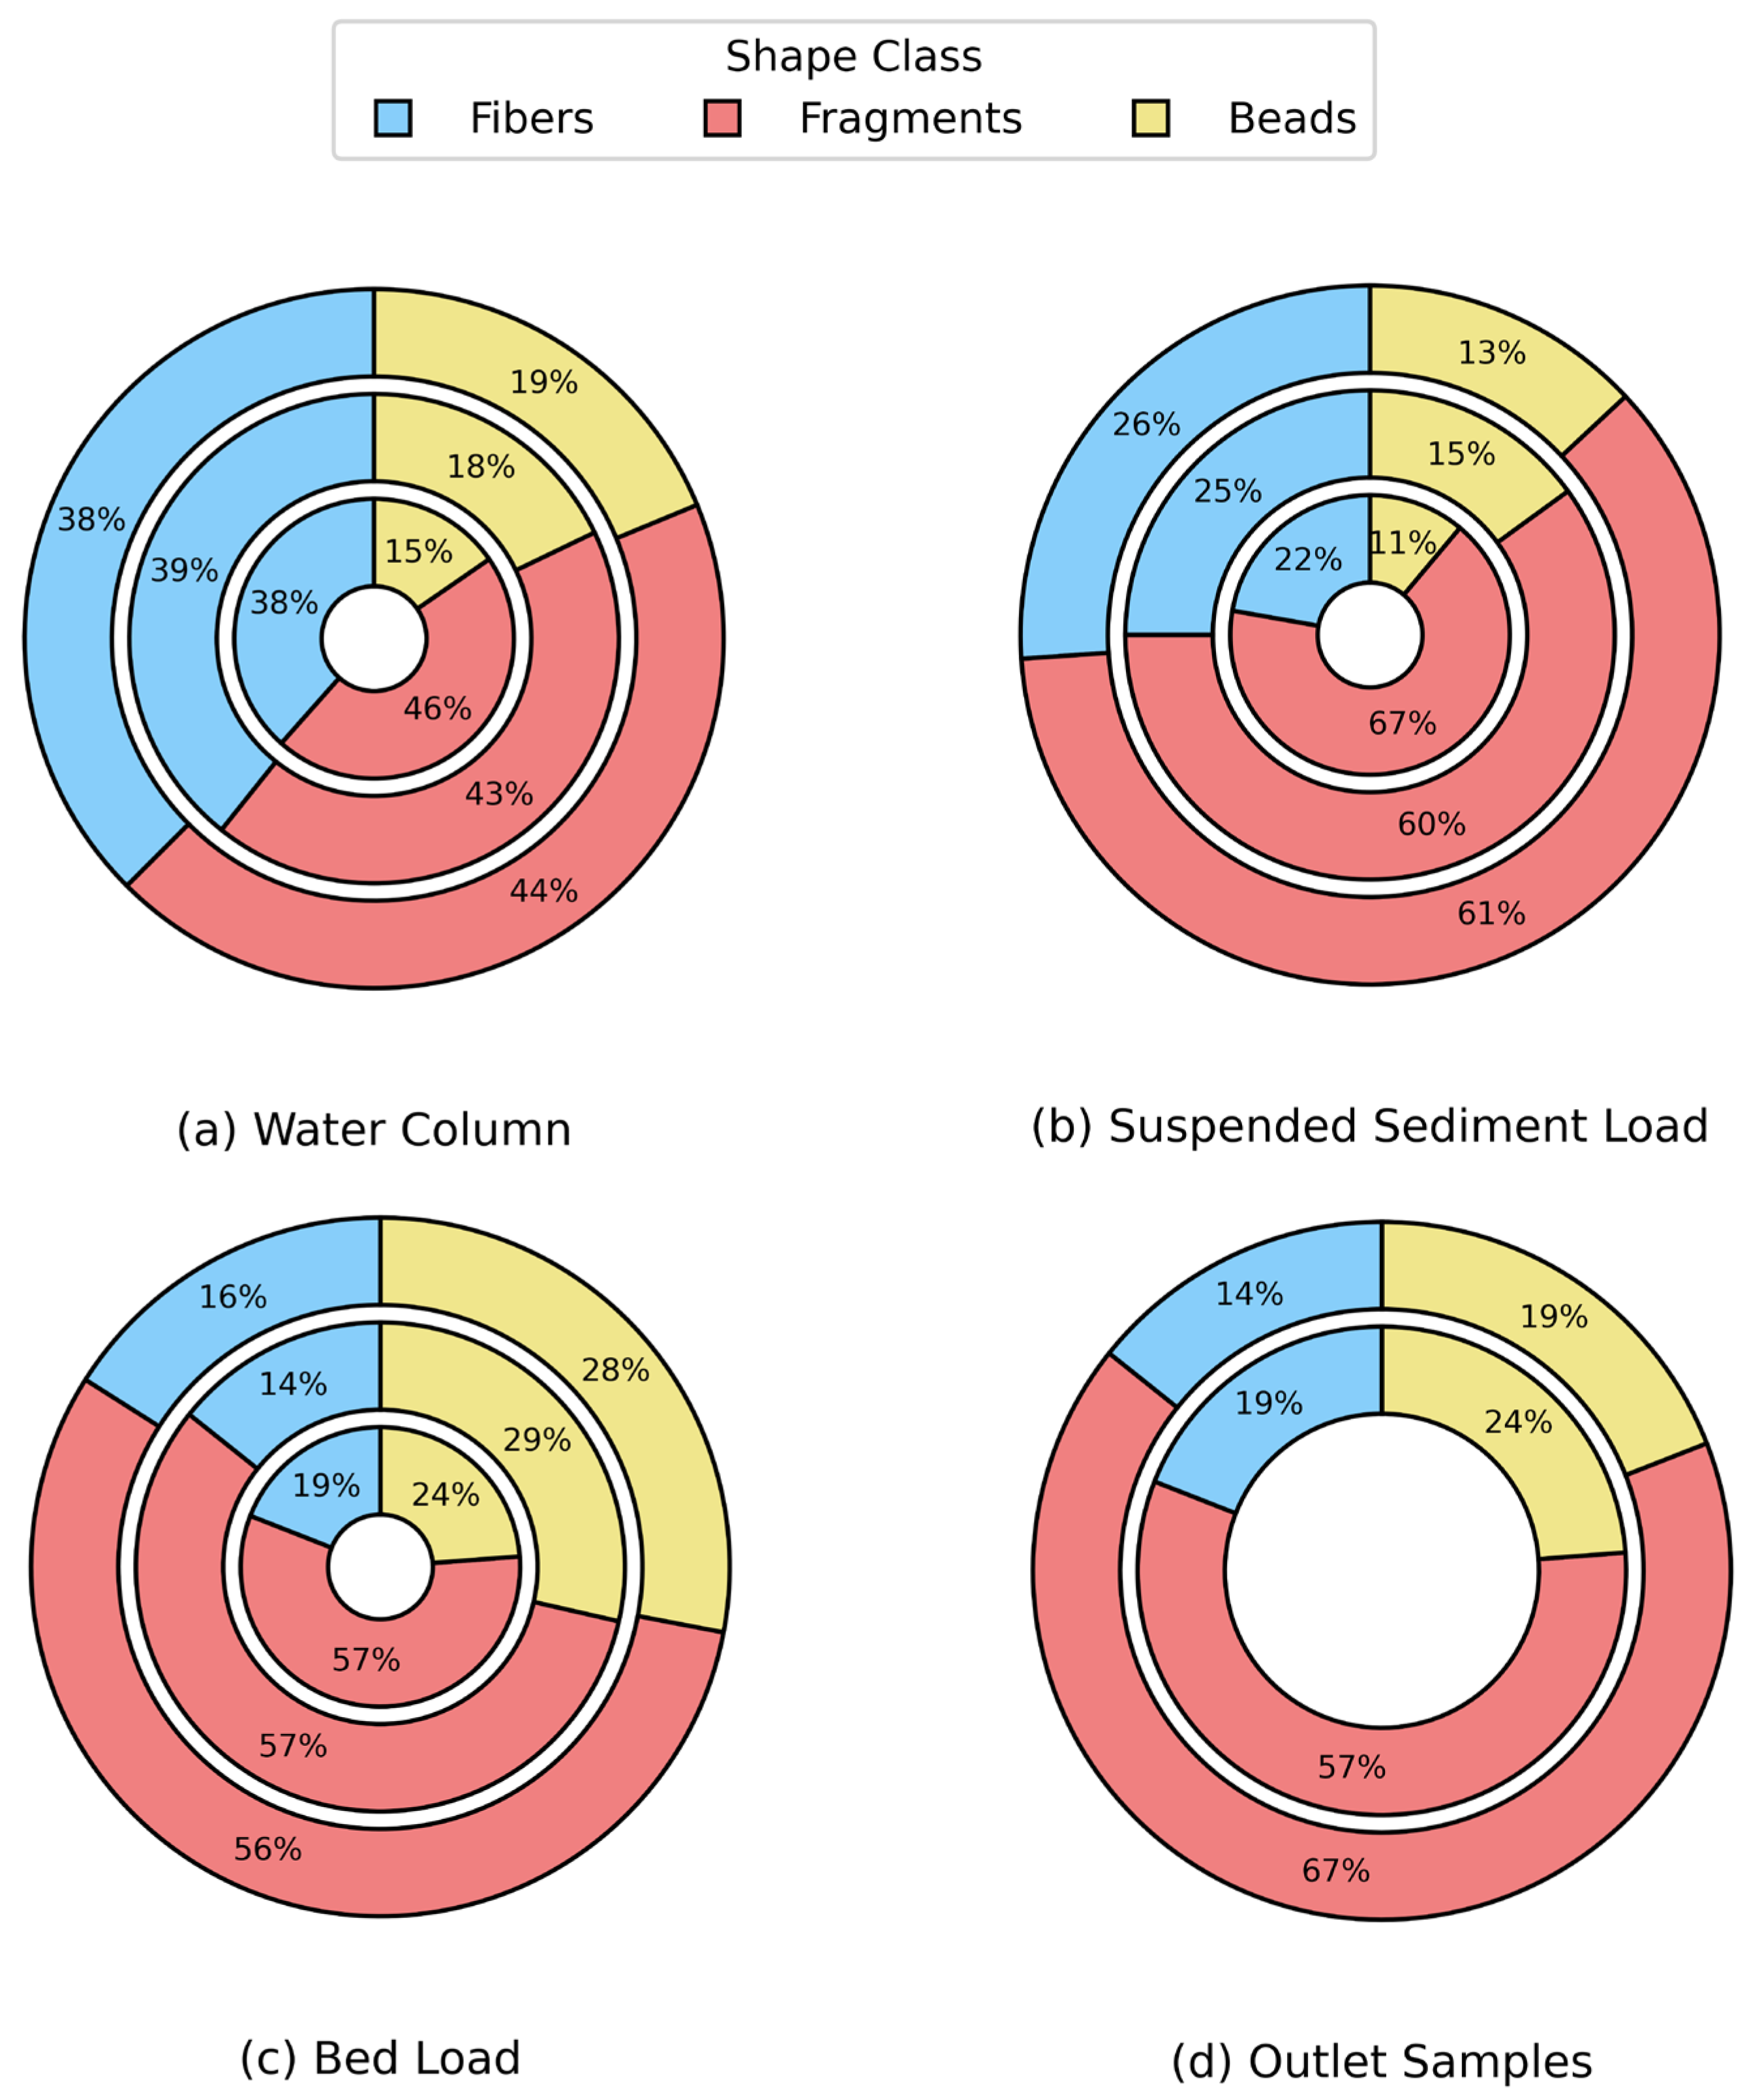
Figure 10.
Microplastic color distribution in the samples. Colors identified include blue, black, green, transparent, and orange. Panels represent (a) Water Column, (b) Suspended Sediment Load, and (c) Bed Load. Flow direction is from CS-US to CS-DS. (CS-US = Upstream Cross-Section; CS-1 = Cross-Section 1; CS-2 = Cross-Section 2; CS-DS = Downstream Cross-Section).
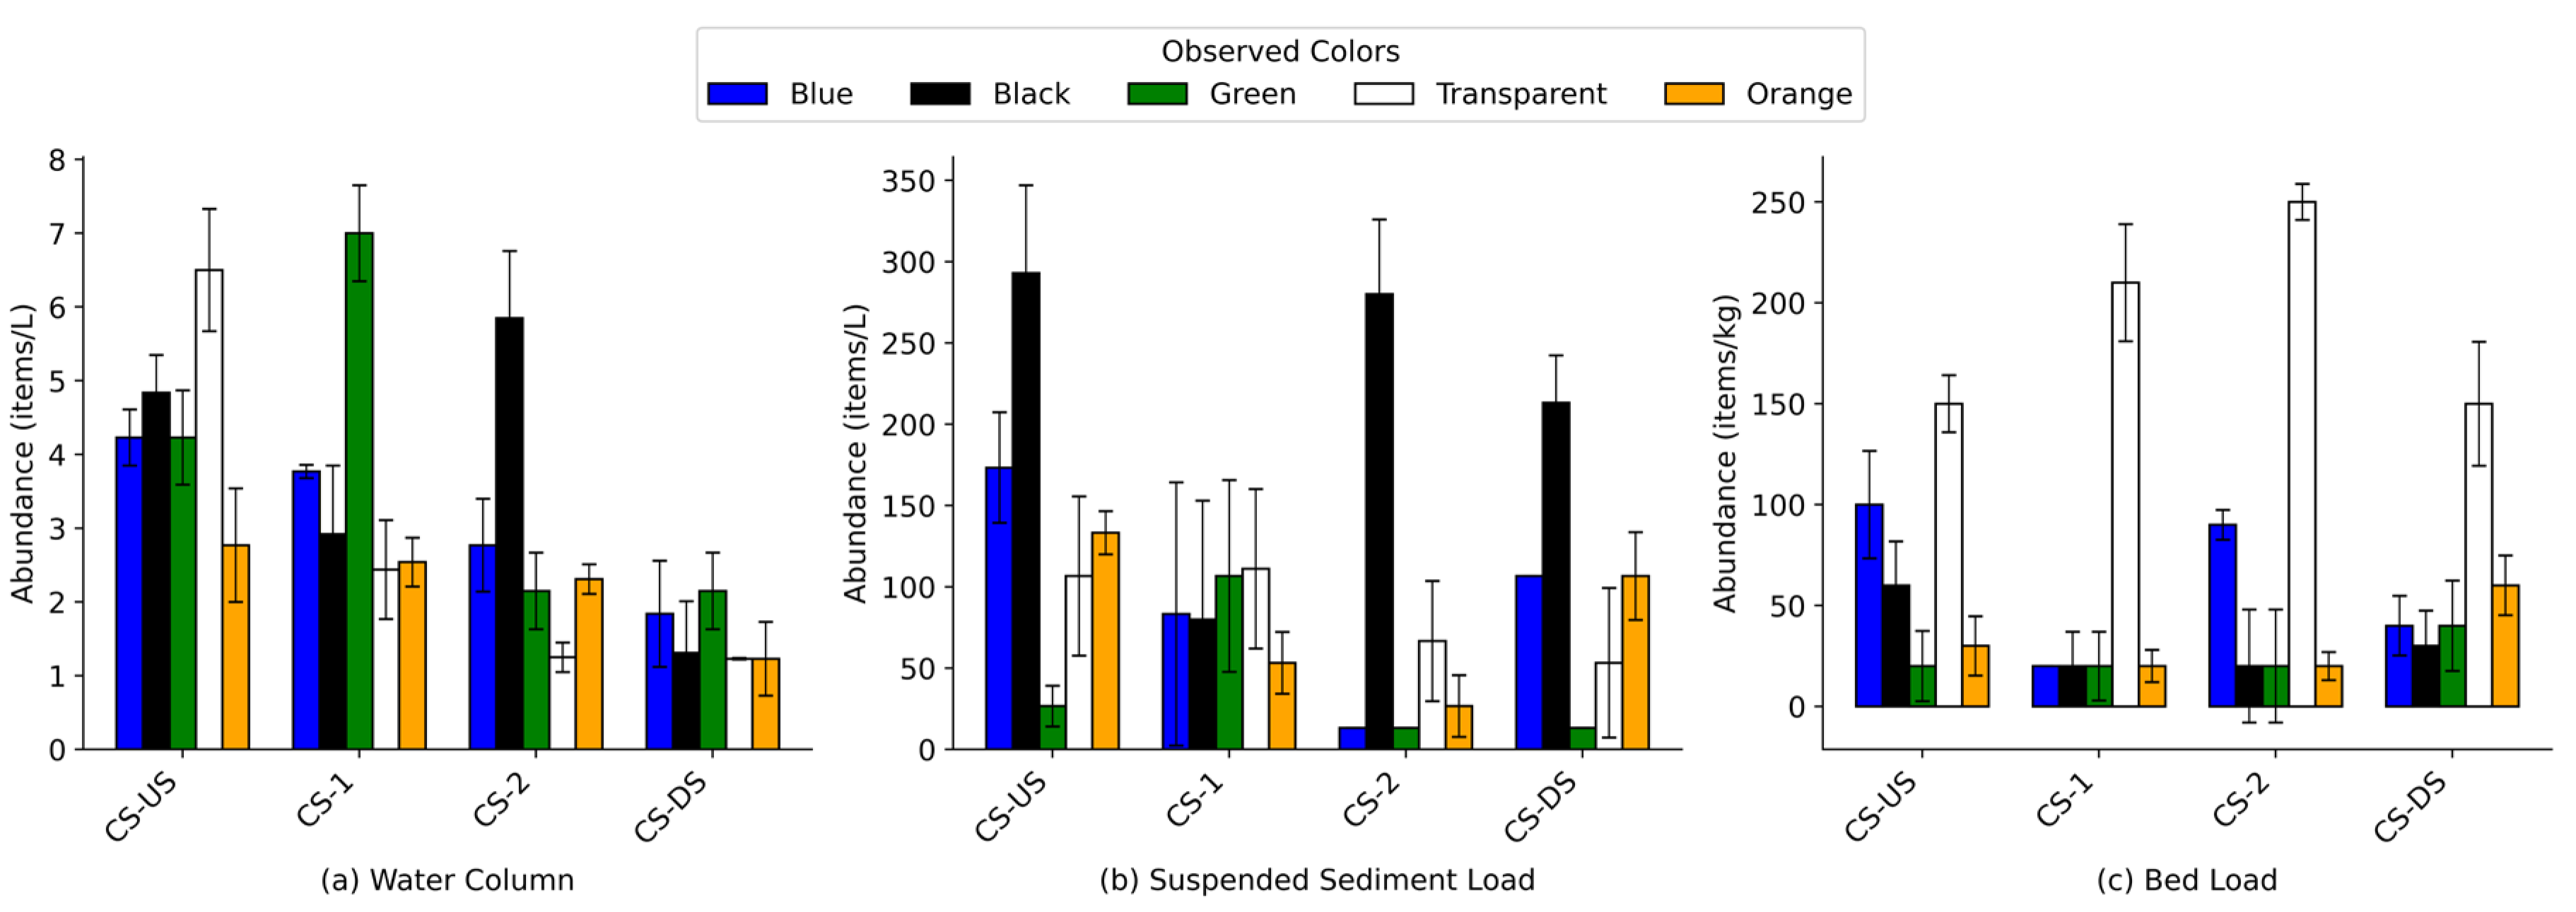
Figure 11.
Microplastic color distribution observed in this study. Identified colors include blue, black, green, transparent, and orange. Panels show the percentage of each color in (a) Water Column, (b) Suspended Sediment Load, (c) Bed Load, and (d) Outlet Samples. The inner, middle, and outer circles represent no rainfall, light rainfall, and moderate rainfall conditions, respectively. No ring is shown for the outlet (d) under no rainfall due to dry conditions.
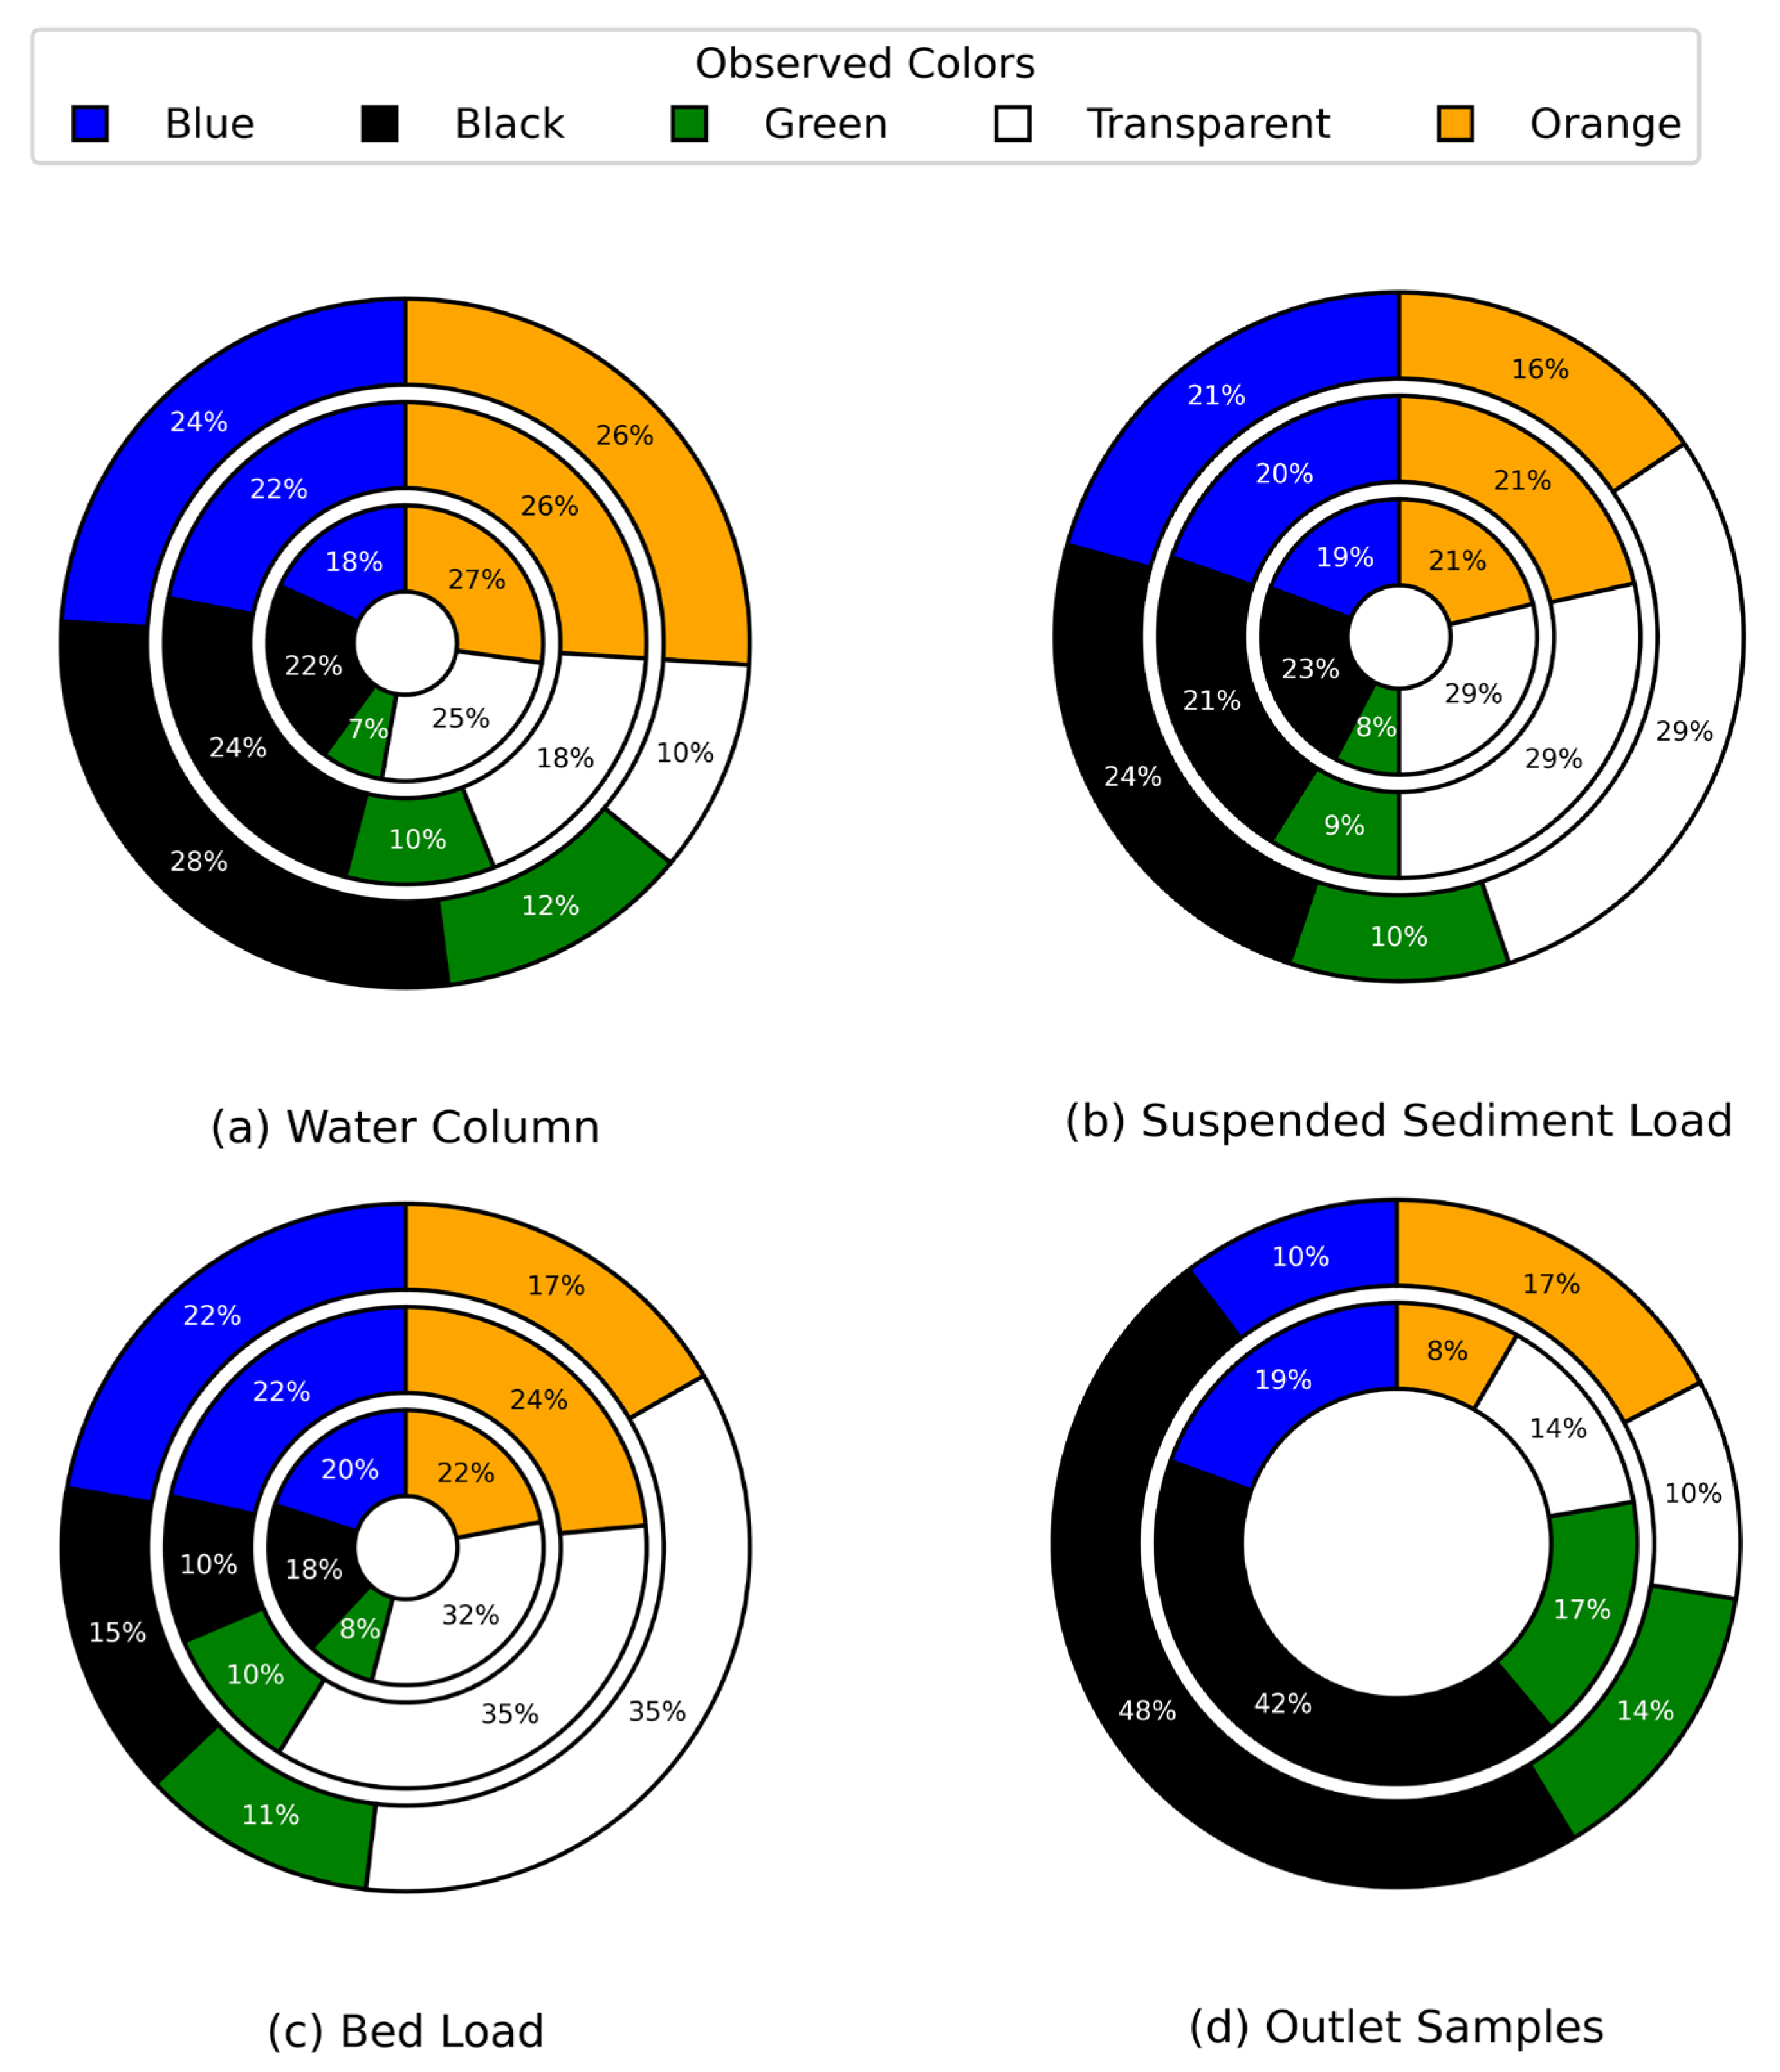
Figure 12.
Microplastics common polymer type. Polymer percentage in (a) water column, (b) suspended sediment load, (c) bed load and (d) outlet samples. The inner, middle, and outer circle represents no rainfall, light rainfall, and moderate rainfall respectively. No ring is shown for the (d) outlet samples under no rainfall due to dry conditions.
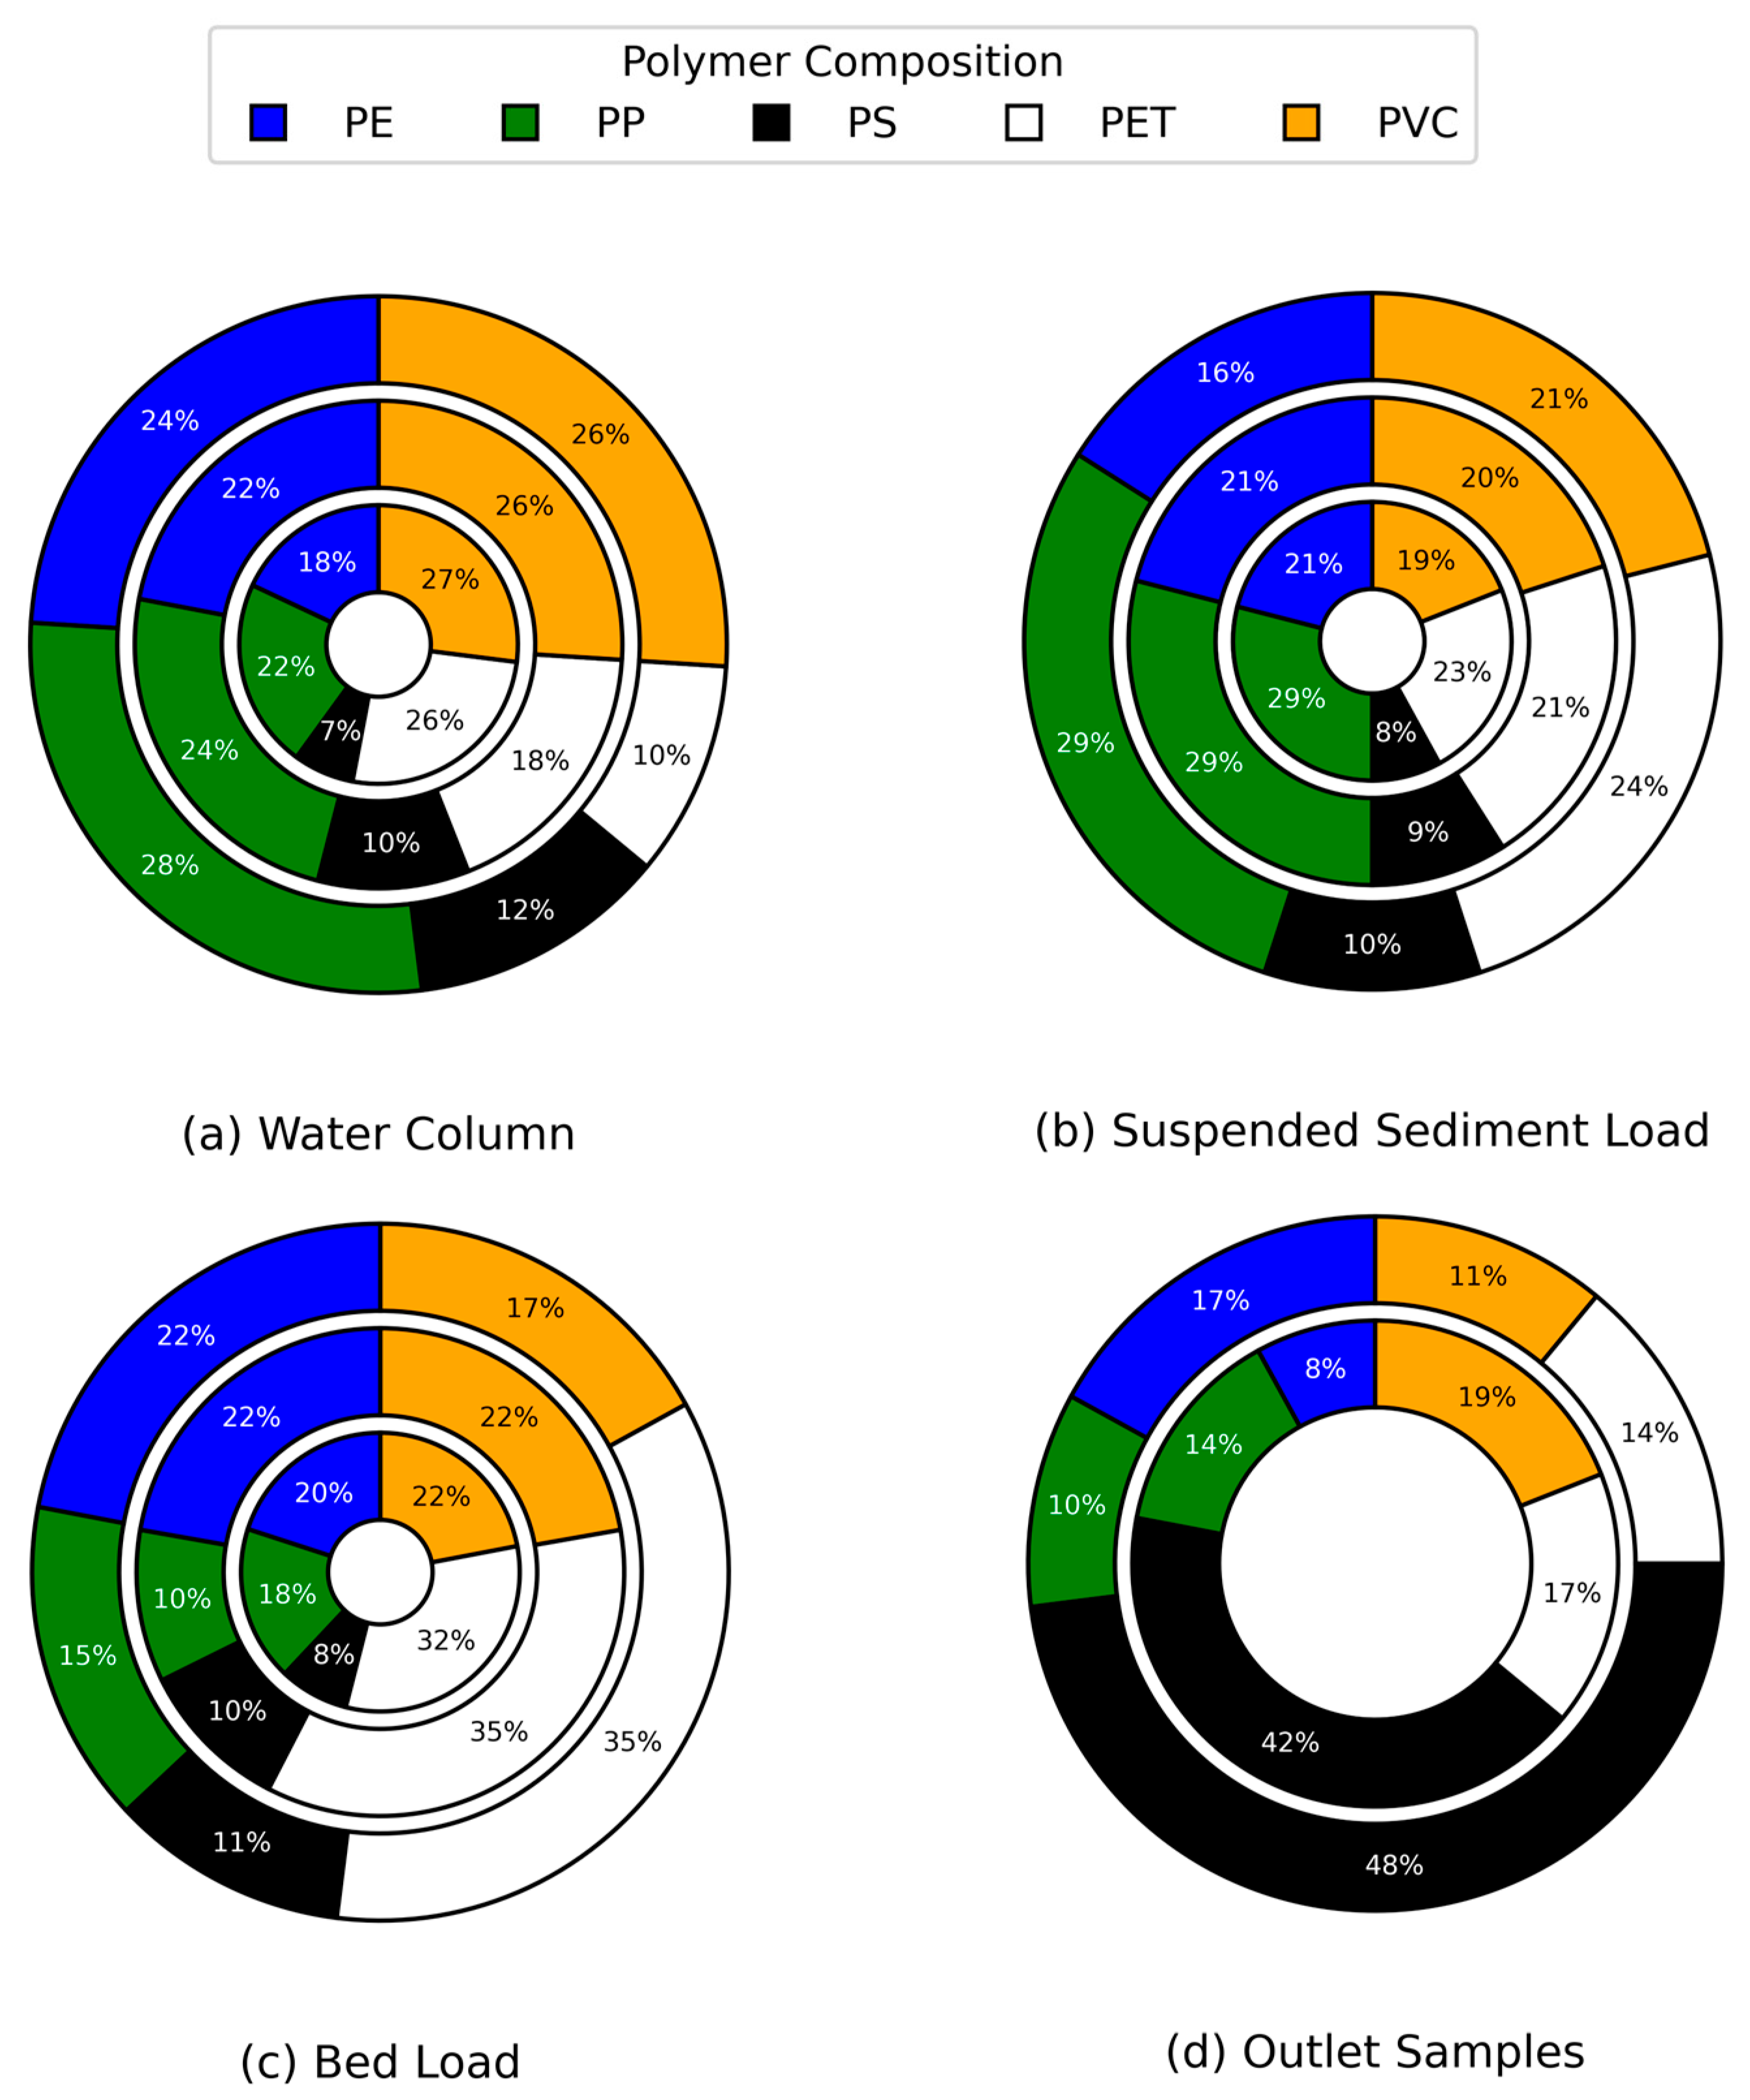

Table 1.
Sampling locations with land use classifications and sampling duration; field sampling was conducted from June to August 2023.
Table 1.
Sampling locations with land use classifications and sampling duration; field sampling was conducted from June to August 2023.
| Site1: | CS-US | CS-1 | CS-2 | CS-DS | O-1 | O-10 |
| Surrounding Land Use: |
Agriculture & work area | Turf & residential area | Field & academic buildings | Park area | Small parking lot | Large parking lot |
| Total Samples2: | 5 Samples | 5 Samples | 5 Samples | 5 Samples | 5 Samples | 5 Samples |
1 US, DS, O stand for upstream, downstream, and effluent sites of the sampling locations, respectively. 2 Sampling duration between June 6th to August 16th, 2024.
Disclaimer/Publisher’s Note: The statements, opinions and data contained in all publications are solely those of the individual author(s) and contributor(s) and not of MDPI and/or the editor(s). MDPI and/or the editor(s) disclaim responsibility for any injury to people or property resulting from any ideas, methods, instructions or products referred to in the content. |
© 2025 by the authors. Licensee MDPI, Basel, Switzerland. This article is an open access article distributed under the terms and conditions of the Creative Commons Attribution (CC BY) license (http://creativecommons.org/licenses/by/4.0/).
Copyright: This open access article is published under a Creative Commons CC BY 4.0 license, which permit the free download, distribution, and reuse, provided that the author and preprint are cited in any reuse.


