
Submitted:
17 November 2024
Posted:
18 November 2024
You are already at the latest version
Abstract
The film superposition prediction model is a crucial tool in the preliminary design of hot-end components, enabling rapid prediction of film adiabatic wall temperatures and reducing computational costs. This paper establishes the relationship between the mainstream temperature correction coefficient and the air bleed ratio based on energy conservation principles at the boundary layer during film injection, developing a superposition model grounded in mainstream temperature corrections. The proposed model uses cooling effectiveness characteristics based on an equivalent blowing ratio to accurately predict the cooling effectiveness of multi-row hole layouts with different hole spacings. Experiments on adiabatic film cooling effectiveness were conducted with four different hole arrangements under various blowing ratios. The shortcomings of the traditional Sellers superposition method in predicting cooling effectiveness distribution are discussed by comparing it with the experimental results. Comparison results show that The Sellers method accumulates prediction errors as the number of hole rows increases, leading to an overestimation of cooling effectiveness compared to experimental results. Introducing a mainstream temperature correction factor could effectively solve the above problems. The prediction accuracy tends to be higher at lower blowing ratios and with a larger number of hole rows.Compared to the existing models in the literature, the proposed model has higher prediction accuracy under most conditions.
Keywords:
Turbine Outer Ring
; Film Superposition
; Mainstream Temperature Correction
; Energy Conservation in Film Injection
; Equivalent Blowing Ratio
1. Introduction
Film cooling is a crucial cooling design technique extensively used in structures such as turbine blades [1,2,3,4,5], combustion chambers [6,7,8,9], and endwalls [10,11,12,13]. It creates a low-temperature film between the hot gas and the wall, effectively reducing the heat transfer, and thereby controlling the wall temperature [14,15].
In high-pressure turbine outer rings, the flow angle of the guide vanes significantly affects the trajectory of the mainstream gas, resulting in a flow path that is much longer than the axial length of the outer ring. It substantially increases the number of rows of film cooling holes As cooling demands rise, laminate cooling technology has increasingly been integrated into the design of turbine outer rings. Variations in cooling effectiveness at different Lamilloy locations cause changes in the temperature levels of the cooling air along the mainstream flow. Additionally, the rotation of the blades contributes to a gradual decrease in the total temperature of the gas on the mainstream side of the turbine outer ring.
During the initial design phase of turbine outer ring components, relying solely on high-dimensional numerical simulations leads to challenges such as high computational costs, prolonged design cycles, and difficulties in implementing modifications. These issues become more significant when Lamilloy structures are complex and feature numerous film cooling holes, leading to a rapid increase in mesh count, which significantly extends the design process and wastes valuable early-stage resources.
Therefore, it is crucial to develop low-dimensional iterative design models from the outset. Prediction methods for cooling effectiveness in multi-row film coolings represent a key area of research focus.
Sellers' superposition formula is currently the most widely used predictive model for film cooling. Researchers have extensively evaluated its applicability in various scenarios involving porous arrays. Muska et al. [16] validated its feasibility for turbine blades. While Ethridge et al. [17,18] examined its performance on the suction and pressure sides. On the suction side, the model overestimates cooling effectiveness at low turbulence but performs well at high turbulence. On the pressure side, increased coolant diffusion results in prediction inaccuracies. Mhetras et al. [19,20] studied film cooling on blades, finding that the Sellers formula effectively predicts cooling effectiveness at different hole positions. Zhang et al. [21] reported an underestimation of cooling effectiveness for atypical holes on the pressure side. Yang et al. [22] found reduced accuracy due to film and secondary flow interactions in high blowing ratios. Chen et al. [23] extended the Sellers formula to two-dimensional distributions, enhancing accuracy for localized cooling within two rows of holes. Wang et al. [24] employs Sellers’ method to superimpose the effects of slot cooling and array hole cooling, demonstrating the potential of Sellers' superposition method across different cooling methods.
The above studies indicate that the Sellers superposition model demonstrates good applicability under certain conditions, yet it also exhibits some variability. Consequently, researchers have explored the influencing factors in the superposition of flat hole arrays. Sasaki et al. [25] conducted experiments on film cooling hole arrays with 5-hole and 10-hole spacings. Results showed that the Sellers formula effectively predicts cooling effectiveness at lower blowing ratios, but underestimates it at smaller spacings and slightly higher ratios. Similar results were obtained by Anderson et al. [26], Meng et al. [27] and Murray et al. [28]. Harrington et al. [29] found that for small aspect ratio holes, high-density coolants, and high turbulence, the Sellers model overpredicted cooling effectiveness due to interactions between holes, and then-current superposition models fail to account for these interactions. Li et al. [12] also noted that the Sellers model is unreliable for predicting film cooling in multi-row configurations, especially for fully covered structures, due to increased mixing and turbulence.
As a result, the local mainstream temperature of the downstream film row is influenced by more than just the adiabatic wall temperature from the upstream row's coverage. This limitation impairs the accuracy of the Sellers superposition model in providing reliable predictive results.
To describe the interactions between hole rows during the film cooling superposition process, researchers have developed modification methods for the superposition model. The existing correction models primarily fall into two categories:
The first viewpoint suggests that during the film cooling superposition process, the interactions between hole rows result in changes to the local cooling effectiveness of the downstream film holes. To tackle this issue, correction factors are introduced to adjust the cooling effectiveness of downstream holes, either diminishing or amplifying the overall cooling effect during superposition. Xu et al. [30] established a correlation between correction factors and blowing ratio, as well as dimensionless distance, by incorporating correction factors into the calculation of cooling effectiveness for the downstream rows. Zhang et al. [31] adopted the same correction approach, proposing that the correction factors are associated with the number of hole rows and the Reynolds number. To address the increasing errors in film cooling superposition under multi-row conditions, Zhang et al. [32] analyzed the cooling effectiveness distribution along a single row of holes at different spanwise spacings using numerical simulations and concluded that the correction factors are influenced by the spanwise non-uniformity coefficient and streamwise dissipation rate. Huo et al. [33] conducted numerical simulations of film cooling with double rows of holes and found that the Sellers model performs well at low blowing ratios and large hole spacings. However, at high blowing ratios and small hole spacings, the maximum error reached 65%. By adding correction factors to the nonlinear terms and fitting the relationship of these factors based on different blowing ratios and spacings, they improved the Sellers superposition model, reducing the maximum error to below 15%.
The essence of film cooling is the impact of the mixing ratio between cooling air and mainstream on wall temperature. The film stacking process essentially adjusts the mixing ratio continuously, thereby changing the adiabatic wall temperature distribution. In the aforementioned correction methods, the direct correction of the rear film cooling effectiveness neglects the fluid mixing during the film superposition process. Thus, a second model correction method was developed.
Using an energy conservation analysis method, film cooling can be viewed as multiple film holes injecting cooling air that gradually mixes with the mainstream, effectively describing the energy exchange between the cooling air and the mainstream. Kirollos et al. [34] provided a comprehensive summary of the Sellers method, noting that it is applicable only under conditions of low blowing ratios, large hole spacings, and zero pressure gradients. He proposed an energy conservation-based superposition method for multi-row cooling holes. An et al. [35] found that the influence of upstream flow on downstream cooling is reflected in changes in turbulence intensity. The increase in turbulence negatively affects the cooling effectiveness of the downstream film, particularly in distant regions. He introduced a correction factor, β, to evaluate the impact of coolant jetting on the mainstream entrainment from the upstream row.
The model based on energy conservation breaks the adiabatic behavior between fluid layers formed by different film cooling holes, allowing energy transfer between adjacent layers through mass exchange, while current research is limited to two rows. As the number of hole rows increases, larger temperature gradients are confined to several film superposition processes near the wall, where the fluid injected from the further upstream film holes has already mixed sufficiently with the fluid in the boundary layer, resulting in a generally consistent temperature level. The existing layered methods may lead to insufficient predictive accuracy of the current model for scenarios with a high number of hole rows.
This study proposes a new superposition prediction model by correcting the mainstream temperature in the process of film cooling superposition based on energy conservation, significantly improving prediction accuracy. The model also considers the variations of mainstream and coolant temperatures along the flow direction, further expanding its applicability. The method was validated using experimental results of different film cooling superposition structures. By introducing an equivalent blowing ratio, the method can quickly and accurately predict the cooling effectiveness of multi-row hole layouts with different hole spacings based on the cooling effectiveness variation along a single row with fixed hole spacing, thereby significantly improving design efficiency and reducing computation time.
2. Film Superposition Method
2.1. Single-Row Hole Film Cooling Characteristics
The distribution pattern of cooling effectiveness along a single-row hole serves as the foundation for cooling performance evaluation. This study employs the experimental results from Eckert et al. [36] on the adiabatic cooling effectiveness of single film holes in cylindrical geometry. By averaging the spanwise data, we obtained the along-stream distribution of adiabatic cooling effectiveness (2) for single holes at blowing ratios (1) ranging from 0.1 to 1.0, as shown in Figure 1.
Where , represent the mass fluxes of the coolant and the mainstream, respectively; is the mainstream temperature, is the coolant temperature, and is the adiabatic wall temperature.
The basic principle of the Sellers superposition model is that when cold air is injected through the film holes, The gases ejected from each row of holes form independent film layers, and the downstream rows experience the combined effect of the adiabatic wall temperature created by all the upstream films. As the number of film hole rows increases, the adiabatic cooling effectiveness at the wall can be expressed as Equation (3).
Where , are local adiabatic film cooling efficiencies created by different rows of holes, which can be represented as Equation (4).
From Figure 2, it can be seen that as the film continues to be injected, the adiabatic wall temperature generated by the upstream row of film holes remains constant. When there are few hole rows, this assumption has little effect. However, as the number of rows increases, the coverage area of the film expands, and the influence of the mainstream flow becomes more significant. Continuing to maintain the adiabatic wall temperature environment created by the upstream row of film holes may lead to a significant overestimation of the overall cooling effectiveness. Therefore, when predicting the superposition effects of film cooling, it is essential to consider the interaction and entrainment effects between the film injection and the mainstream flow to mitigate the predictive bias introduced by the Sellers assumption.
2.2. Energy-Conservation-Based Prediction Method for Multi-Row Film Cooling of the Turbine Outer Ring
To address the issue of cooling effectiveness overestimation due to the inadequate consideration of mainstream entrainment effects in the Sellers superposition assumption, the model proposed in this study is as follows:
For single-row film cooling, the cooling effect of the discharged coolant diminishes rapidly within a short distance [36]. As a result, when there are multiple rows of holes, significant temperature gradients are primarily found in the few rows of film holes. Therefore, the process of film superposition can be simply described as follows:
The injection from downstream film holes causes a sudden change in boundary layer thickness, allowing a certain proportion of the mainstream flow to mix into the boundary layer. This impacts the mainstream temperature during film injection, resulting in variations in cooling effectiveness.
As shown in Figure 3, When the coolant flow is injected, the boundary layer thickness experiences a sudden increase. If the coolant mass flow rate is , an excess thin layer with a flow rate of is generated in front of the boundary layer. At this point, the flow rate of the fluid entering the boundary layer is . Based on energy conservation principles, the mainstream temperature at the downstream row of holes can be determined, as shown in Equation (5).
C1mc+C2mgTaw′=CgmgTg+CgmgTg
Where represents the temperature after mixing. As cold air is injected, the superposition effect of the front film decreases, leading to a slight increase in the heat transfer temperature. After nondimensionalization, we obtain Equation (6).
The Equation (6) indicates that when the coolant injection rate is low, the mixing effect of the main flow is slightly enhanced, resulting in a higher wall temperature.
This paper defines the main flow temperature correction factor to represent the degree of mixing of the main flow temperature under different coolant injection rates, as Equation (7).
Where a and b are empirical coefficients. The presence of b is to ensure that the single-row hole film cooling effectiveness in the empirical correlation meets the requirements of multi-row hole film superposition under benchmark test conditions.
For the next film hole, the mainstream temperature is obtained as Equation (8).
Where represents the local mainstream temperature.
After considering the correction for mainstream temperature, the film cooling superposition model becomes Equation (9).
During the iterative design process of the turbine outer ring, limitations on minimum hole diameter and variations in flow rates among different hole rows result in discrepancies in hole spacing and diameter. When the baseline cooling effectiveness relies on a fixed hole spacing distribution, using the design blowing ratio for predictions can significantly deviate from actual conditions.
Bogard et al. [37] conducted an analysis of the spanwise-averaged film cooling effectiveness along the flow direction as a function of for various hole spacings, as Equation (10). The results indicated that, within the tested range, the cooling effectiveness trends were largely consistent across different spacings. This insight suggests an effective approach: structures with varying hole spacings can be equivalently represented by a baseline configuration, enabling the cooling effectiveness for any specific spacing to be derived from the baseline distribution.
Where an equivalent slot width s is defined as Equation (11).
Therefore, an equivalent blowing ratio is used to normalize the number of holes and their spacing to the baseline single-row hole cooling configuration. The assumptions for the equivalent blowing ratio are shown in Equation (12).
During the design process of the turbine outer ring, the mainstream temperature and cooling air temperature experienced by the film holes vary at different locations. Using a fixed temperature can lead to significant discrepancies in the predicted cooling effectiveness. When the mainstream and cooling air temperatures change, and are used to represent the dimensionless results at different positions. Therefore, the adiabatic cooling effectiveness for n rows of film holes should be expressed as Equation (13).
Where, , . denotes the air bleed temperature, which is lower than the local cooling air temperature at each row of film holes. represents the mainstream temperature, which is higher than the mainstream temperature at each film hole location.
3. Experimental Method
3.1. Experimental System
The experimental system, as illustrated in Figure 4, comprises two main flow paths: the mainstream for simulating high-temperature airflow and the coolant for film cooling. Before entering the test chamber, both flows pass through a honeycomb structure and damping mesh to ensure uniformity. Additionally, a pressure stabilizing chamber is installed at the coolant intake to further reduce non-uniformity. The height of the mainstream channel is 120 mm, and its width is 110 mm, with the first row of film cooling holes located 660 mm from the mainstream inlet.
During the experiment, the mainstream rate, temperature, and coolant rate are precisely controlled by adjusting throttling valves, vent valves, and heater power, allowing for accurate regulation of various test conditions.
The surface temperature distribution of the test plate is measured using an infrared thermal imaging camera and thermocouples.
3.2. Experimental Method
The experiment measures the airflow velocity at the mainstream inlet and outlet using total and static pressure and temperature sensors. Static pressure sensors are arranged along the test plate to monitor changes in mainstream static pressure. Multiple pressure and temperature sensors are installed in the cooling air stabilization chamber to confirm the uniformity of the inlet boundary. The flow rates of both the cooling air and mainstream gas are controlled using mass flow meters.
The wall temperature of the test piece is obtained using two methods:
1. Multiple thermocouples are installed along the center of the mainstream side wall of the test plate to monitor changes in cooling effectiveness at the wall center.
2. The temperature distribution on the surface of the film cooling hole plate was obtained using the Filr SC 620 infrared thermal imaging system, which operates within a wavelength range of 7.5 to 13 μm and has a resolution of 640 × 480 pixels with an accuracy of ±1 K. Five circular ZnS infrared windows were installed at corresponding positions on the test plate, providing excellent image transmission performance in the 8 to 12 μm range. The infrared camera was positioned directly opposite the test plate. Due to the difficulty of capturing a wide field of view under high-definition conditions, an electric sliding rail was installed beneath the infrared camera, parallel to the mainstream cavity, allowing the camera to move along the direction of hot air flow. This setup ensured that each window could be photographed under the same operating conditions, as illustrated in Figure 5.
3.3. Design of Test Plates
The experimental setup includes four test plates: one for correcting empirical coefficients in the mainstream temperature correction model and three for model validation. Figure 6 illustrates the structure of the test plates, with streamwise hole spacing defined as , spanwise hole spacing as , and cooling hole diameter as . Table 1 provides the structural parameters for the different test plates.
The test plates are produced using a photosensitive resin with extremely low thermal conductivity, utilizing 3D printing technology, with a thermal conductivity of approximately 0.1 , which provides nearly adiabatic conditions, as shown in Figure 7. To minimize the impact of flow unevenness within the cooling air cavity on the exit airflow from the film holes, the thickness of the test plates is set at 17 mm, ensuring an aspect ratio of approximately 5 between the length and diameter of the cooling holes.
In the experiments with different test plates, the same mainstream conditions are maintained. The mainstream inlet temperature is fixed at 360 K, and the inlet flow rate is set at 940 g/s to ensure that the mainstream Reynolds number matches that of the engine conditions. The mainstream exits to the atmosphere through an 80 mm duct. The cooling air inlet temperature is approximately 300 K, and the cooling airflow rate is adjusted to achieve consistent cooling levels across the test plates. Both the mainstream and secondary flow working fluids are air.
3.4. Uncertainty in Experiments
The uncertainty level of the film cooling efficiency was estimated using the partial derivative method proposed by Moffat et al. [38] as Equation (14).
The deviation of the adiabatic film cooling efficiency varies with the cooling efficiencies, as illustrated in Figure 8. When the cooling efficiency is 0.6, the relative deviation is approximately 1.33%, while the absolute deviation is less than 0.01.
3.5. Calibration of Infrared Results
The infrared temperature distribution results for different test plates were calibrated according to thermocouple temperatures, as illustrated in Figure 9. Across various temperature levels, a largely linear relationship was observed between the infrared and thermocouple data, affirming the reliability of the results.
4. Results and Discussion
4.1. Analysis of Sellers Model Predictions for Centerline Adiabatic Cooling Effectiveness
Figure 10 illustrates the experimental cooling effectiveness results of various test plates and the corresponding cooling effectiveness prediction results based on the Sellers superposition model without equivalent blowing ratio.
For Case 1 and Case 3, the dimensionless hole spacings in spanwise and streamwise are the same, while only hole diameters are different. Thus, the comparison between the predicted and experimental results is fundamentally similar. It is clear that the cooling effectiveness predicted by the Sellers model is higher than the experimental results, and the prediction error shows a decreasing trend with the increase of the blowing ratio. In Figure 1, for the cooling effectiveness distribution of the single-hole model, film detachment and reattachment occur when the blowing ratio exceeds 0.7, resulting in lower cooling effectiveness. In the experiment, the superposition of multi-row film cooling helps reduce film detachment downstream, resulting in better cooling performance downstream than upstream. In contrast, the Sellers model assumes that all film cooling has the same effectiveness. This assumption helps reduce the deviation between the model’s predictions and experimental results when the Sellers model tends to overestimate, leading to improved prediction accuracy at higher blowing ratios.
Under fixed conditions of S and P, Cases 2, 3, and 4 modify the dimensionless hole spacing by adjusting the film hole diameter. Case 2 has the largest dimensionless hole spacing, while Case 3 has the smallest dimensionless hole spacing. The general relative deviation between the cooling effectiveness predicted by the Sellers model and the experimental results gradually decreases with the decline of the dimensionless hole spacing. In Case 2, the predicted cooling effectiveness is consistently higher than the experimental results at various blowing ratios. Compared with Case 2, the predicted results closely match the experimental results at a blowing ratio of 1 in Case 3. In Case 4, the predicted cooling effectiveness is lower than the experimental results at high blowing ratios.
This phenomenon is mainly due to the use of a single-hole cooling effectiveness distribution pattern under fixed spanwise hole spacing in the prediction model. For a single-hole film, the spanwise cooling effectiveness decreases with the increase of distance from the centerline. The presence of multiple film holes within the row inhibits the lateral spreading of each film, resulting in a gradual decrease in average cooling effectiveness as the spanwise hole spacing increases at a fixed blowing ratio.
Excluding the errors introduced by the Sellers superposition prediction model, the prediction for Case 2, which has a larger spanwise hole spacing, consistently tends to be overestimated. As the spanwise hole spacing decreases, the cooling effectiveness along the flow direction tends to be underestimated. When combined with the overestimation introduced by the Sellers superposition model, this results in the phenomenon observed in Figure 10.
To verify the application effects of the cooling performance characteristics of a single-row hole with fixed hole spacing under the assumption of an equivalent blowing ratio, the cooling effectiveness is predicted based on the equivalent blowing ratio assumption for Case 2 and Case 4. The comparison results are shown in Figure 11.
Compared to the cooling effectiveness distribution without the equivalent blowing ratio, Case 2 shows significant improvement, with the predicted cooling effectiveness decreasing and aligning more closely with experimental results. With the increase in the number of hole rows, the rate of cooling effectiveness development decreases, resulting in smaller prediction errors compared to cases without the equivalent blowing ratio.
Under the condition of using an equivalent blowing ratio, the distribution and effectiveness of single-row film holes are predicted more accurately. therefore more realistically reflects the actual conditions of film cooling, thus improving the prediction accuracy.
4.2. Analysis of Mainstream Temperature Correction Model Predictions
This section provides a comprehensive discussion of the predictive model using different film cooling effectiveness indicators. First, the empirical coefficients of the model were calibrated based on the centerline cooling effectiveness distribution, and a comparison was made with various hole spacings to better understand the characteristics of mixing, penetration, and wall adhesion between the cooling airflow and the hot mainstream. Next, the spanwise-averaged cooling effectiveness, which reflects the film's spreading capability and overall uniformity of coverage, was analyzed to assess its predictive accuracy in characterizing the cooling effect on the wall surface. Finally, the area-averaged cooling effectiveness, representing the overall cooling performance of the film on the wall surface, was compared across different locations to evaluate the predictive deviations of the model at various positions and assess its overall cooling performance.
4.2.1. Centerline Cooling Effectiveness Prediction
Using the cooling effectiveness distributions from Case 1 at blowing ratios of 0.3 and 1.0, the empirical coefficients in the correction model were calibrated. The values of "a" and "b" can be found in Table 2.
Figure 12 (a) shows a comparison of the predicted cooling effectiveness based on the mainstream temperature correction model and the experimental cooling effectiveness for Case 1. It is clear from Figure 12 (a) that the mainstream temperature correction model effectively reduces the overestimation of cooling effectiveness at higher hole row counts under different blowing ratios. Compared to the predictions from the Sellers superposition model, the accuracy of the cooling effectiveness predictions has significantly improved.
At the lower hole rows, predictions from both models are roughly equivalent, primarily due to the limited adjustments introduced by the mainstream temperature correction model. With the increase of hole rows, the effects of the mainstream temperature correction become more pronounced, reducing the trend of the Sellers model to overestimate cooling effectiveness, thereby improving the accuracy of flow-direction cooling effectiveness predictions.
Additionally, the correction coefficients in the mainstream temperature correction model gradually increase as the blowing ratio decreases, leading to a better agreement with the experimental results.
Figure 12 (b) (c) (d) illustrates the predictions for the cooling effectiveness of Cases 2 to 4 using the mainstream temperature correction model with the equivalent blowing ratio. The comparison shows that both Case 2 and Case 3 show good agreement with the experimental results at higher hole row. In Case 4, the prediction accuracy improves at lower blowing ratios, while when the blowing ratio is greater than 0.64, the prediction accuracy decreases compared to the traditional Sellers model.
Compared to the Sellers prediction model, the mainstream temperature correction model does not improve the prediction accuracy of cooling effectiveness significantly at a small number of hole rows. With the increasing number of holes, the improvement of the mainstream temperature correction model in cooling effectiveness prediction is gradually significant, and the deviation from the experimental results is significantly reduced.
The reasons for this phenomenon are primarily as follows:
(a) Mainstream temperature has a relatively small effect on cooling effectiveness when hole rows are small, due to the fact that the lateral and streamwise spreading of film cooling is limited with a small hole row. Thus, it leads to only minor differences in the cooling effectiveness predictions of the two models, and both tend to overestimate compared to the experimental values.
(b) The influence of the mainstream temperature correction starts to accumulate as the number of hole rows increases. The mainstream temperature correction model takes into account the interactions between multiple film cooling rows and their complex flow characteristics when the hole rows increases. This makes the predicted results more consistent with the experimental results.
(c) The mainstream temperature correction coefficients gradually increase as the blowing ratio decreases, which means that the mainstream temperature correction model can better capture the interactions between the film and the mainstream at lower blowing ratios, making the predictions closer to the experimental results.
4.2.2. Spanwise Average Cooling Effectiveness Prediction
Figure 13 presents a comparison between the predicted cooling effectiveness and the spanwise average cooling effectiveness under experimental conditions, as defined by equation (15). The square markers represent the spanwise average results of cooling effectiveness for each infrared window. Although the results from different windows are not continuous, they illustrate the distribution of spanwise average cooling effectiveness along the flow direction effectively.
Overall, the predicted cooling effectiveness based on mainstream temperature correction models demonstrates good agreement with the spanwise average cooling effectiveness experimental results. For Case 1 and Case 4, the prediction performance for the spanwise average cooling effectiveness is almost equal to the experiment results at the central position. In Case 2, when the blowing ratio is 1.44, the cooling effectiveness along the flow direction shows a slight decrease under large hole counts. For Case 3, when the blowing ratio is 1.0, there is also a slight decrease in cooling effectiveness, similarly leading to an overestimation in the prediction model.
The reason for this phenomenon is that the accumulation of cooling film leads to the formation of separation bubbles, which intensifies the mixing between the mainstream flow and the cooling film at this location. This causes the cooling effectiveness to decrease compared to the ideal scenario, altering the original development trend of the film. However, the prediction model has limitations in accounting for flow separation and reattachment characteristics, which leads to an overestimation of the cooling effectiveness.
The cooling effectiveness obtained from infrared testing was averaged across the surface, as defined by Equation (16), and the comparison between the prediction model and experimental results is shown in Figure 14. Figure 15 presents the relative prediction deviations, with absolute values taken for easier comparison.
For Case 1, the prediction deviations remain within 10% at M=0.3 and M=0.51. However, as the blowing ratio increases to 0.8–1.0, the prediction deviation at the first window rises to 15%–20%, while for the second window, it increases to between 10% and 15%. For other windows, the deviation remains within 10%.
In Case 2, the prediction deviations are generally within 10% for all windows except the first window. At this position, the deviations exceed 15% when the blowing ratio is between 0.51 and 1.0, increasing further to over 30% at a blowing ratio of 1.0.
In Case 3, the prediction deviations remain within 10% at a blowing ratio of 0.3. However, as the ratio increases, deviations for small hole row counts gradually rise. At a blowing ratio of 0.6, the prediction deviation for the first window increases to 10%–15%, and at M=1.0, it rises to 15%–20%. Conversely, the prediction deviations decrease with an increasing number of hole row counts, remaining below 10% for the fourth and fifth windows under various blowing ratios.
In Case 4, the prediction accuracy for small hole rows shows significant deviations. At a blowing ratio of 0.3, the deviation reaches approximately 55%. This is mainly due to the stronger influence of mainstream flow on the film at very low blowing ratios, where the equivalent blowing ratio tends to overestimate the cooling effectiveness distribution along a single row of holes. As the film layers continue to accumulate, their ability to counteract mainstream interference improves, resulting in gradually reduced prediction deviations. Across different blowing ratios, the prediction deviations for the fourth and fifth windows remain within 10%.
Overall, for a large number of hole rows, the prediction model based on mainstream temperature correction effectively predicts the cooling effectiveness of the film, with deviations remaining within 10%.
At lower hole row counts, the limitations of single-row hole characteristics hinder accurate matching with experimental results, resulting in slightly higher prediction deviations compared to those for larger hole row counts. However, the prediction model performs well at low blowing ratios, but as the blowing ratio increases, the prediction deviations gradually rise, reaching about 20% when the blowing ratio is 1.
When the dimensional spacing of holes is changed by increasing the hole diameter, significant reductions in cooling effectiveness are observed in experiments when the blowing ratio is lowered to a certain threshold. However, the prediction model fails to capture this pronounced mixing phenomenon, leading to a rapid increase in prediction deviations.
4.3. Comparison with Other Predictive Models
To further validate the model's effectiveness, a comparison was conducted with the model from Zhang et al. [32], as shown in Equation (17). Case 1 from this study and Case 14 from the reference are discussed.
Figure 16 presents the predictions of the film cooling effectiveness along the flow direction for Case 1 using various models. Overall, the literature models overestimate the cooling effectiveness at the centerline position along the flow direction. The variation in predicted cooling effectiveness under different blowing ratios is relatively small. Compared to our model, the predictions for the cooling effectiveness at the experiment's centerline position are less accurate.
Figure 17 presents a comparison of the spanwise-averaged cooling effectiveness predictions for Case 14 in the reference using different models. At a blowing ratio of 0.3, the model proposed in this study overpredicts the cooling effectiveness at lower hole row counts, but the prediction accuracy improves as the number of hole rows increases. When the blowing ratio increases, the reference model significantly overestimates the film coverage on the wall, resulting in higher predicted cooling effectiveness, whereas the model proposed in this study shows better agreement with the experimental results.
Table 3 compares the prediction deviations of two film cooling superposition models under different blowing ratios.
For Case 1 in this study, the model proposed in this study and the existing literature model exhibit similar deviation trends across different blowing ratio, but significant differences exist in the specific deviation values. As the blowing ratio increases, the prediction deviation of this study's model remains between -2.1% and 7.3%, while the literature model shows deviations ranging from 0.5% to 22.8%. This difference in deviation ranges indicates that the model from this study has higher accuracy and stability under a broader set of conditions, whereas the literature model may show considerable uncertainty under certain conditions, which significantly impacts its reliability in practical applications.
For Case 14 in Zhang's study, the prediction deviation of the model in this study similarly decreases with an increasing blowing ratio, whereas the literature model shows an opposite trend. At M = 0.3, the deviation of the literature model is lower, but as the blowing ratio increases, the deviation significantly rises, reaching 12.7% at M = 0.9, which is notably higher than that of this study's model. This further proves the accuracy of the model in this study under most conditions, particularly under high blowing ratios and high M, where its performance is notably superior.
5. Conclusions
In designing hot-end components with film cooling, accurately predicting the cooling effectiveness of multiple rows of film holes along the flow direction can significantly reduce design iteration time. Thus, developing a reliable superposition prediction method is crucial. However, most existing methods are limited to a small number of rows, assume constant flow temperatures, and rely on pre-determined single-row characteristics. There is limited research on superposition models for cases involving many rows, varying flow temperatures, or insufficient single-row data. Further research is needed to develop an effective superposition prediction method for turbine outer ring surfaces.
This paper develops a superposition prediction model based on the main flow temperature corrected from an energy conservation perspective, using a single fixed hole row spacing. Under the assumption of equivalent blowing ratio, this model achieves film cooling effectiveness prediction with minimal cooling effectiveness data requirements. A dimensionless temperature parameter was used to account for the mainstream and secondary flow variations at different positions.
Additionally, four different structural configurations of film cooling effectiveness experiments were established to validate the prediction model. It was also compared with an existing film superposition correction model. Results indicate that the corrected prediction model shows good agreement with experimental results. The following conclusions were obtained from the study.
1. The existing Sellers method accumulates prediction errors as the number of hole rows increases, leading to an overestimation of cooling effectiveness compared to experimental results. Using an equivalent blowing ratio in the Sellers method helps match the experimental distribution range more closely, but it still tends to underestimate the variation in cooling effectiveness under different blowing ratios.
2. Introducing a mainstream temperature correction factor effectively addresses the overestimation of cooling effectiveness in the prediction model. This correction improves the difference across various blowing ratios, resulting in predictions that are more closely to experimental data. In most cases, the prediction accuracy tends to be higher at lower blowing ratios and with a larger number of hole rows.
3. Compared to the existing models in the literature, the proposed model demonstrates higher prediction accuracy under most conditions. It provides a simplified modified model for easy application in the design of turbine outer rings and other similar structures with air film cooling.
Overall, the model in this study performs better in most cases, but there is still room for optimization under specific conditions to ensure accuracy and consistency across various experimental scenarios.
Author Contributions
All authors have contributed to this research. Conceptualization, methodology, Z.G., T.Q. , P.L. and S.D.; software, Z.G., Z.L.; validation, formal analysis, investigation, data curation, Z.G., Z.L., Q.Y. and R.C.; writing—original draft, Z.G., T.Q., P.L., S.D., Z.L.,Q.Y., R.C. All authors have read and agreed to the published version of the manuscript.
Funding
Please add: the National Science and Technology Major Project of China (Grant No. J2019-III-0003-0046)
Data Availability Statement
Not applicable.
Acknowledgments
This research did not receive any specific grant from funding agencies in the public, commercial, or not-for-profit sectors.
Conflicts of Interest
The authors declare no conflicts of interest.
References
- Cheng, X.; Ding, Y.-Z.; Ji, W.-T.; Chen, L.; Tao, W.-Q. Experimental investigation on the combined cooling methods of jet impingement and film cooling for the pressure surface of the turbine vane leading cavity. Int. J. Heat Mass Transf. 2024, 223. [Google Scholar] [CrossRef]
- Ravelli, S.; Barigozzi, G. Numerical evaluation of heat/mass transfer analogy for leading edge showerhead film cooling on a first-stage vane. Int. J. Heat Mass Transf. 2018, 129, 842–854. [Google Scholar] [CrossRef]
- Collopy, H.; Ligrani, P.M.; Xu, H.; Fox, M. Effects of pressure side film cooling hole placement and condition on adiabatic film cooling effectiveness characteristics of a transonic turbine blade tip. Int. J. Heat Mass Transf. 2022, 199. [Google Scholar] [CrossRef]
- Wang, H.; Tao, Z.; Zhou, Z.; Han, F.; Li, H. Experimental and numerical study of the film cooling performance of the suction side of a turbine blade under the rotating condition. Int. J. Heat Mass Transf. 2019, 136, 436–448. [Google Scholar] [CrossRef]
- Cui, H.; Wang, L.; Li, X.; Ren, J. Data-Driven Conjugate Heat Transfer Analysis of a Gas Turbine Vane. Processes 2022, 10, 2335. [Google Scholar] [CrossRef]
- Yang, T.; Zhang, X.; Chang, Z.; Xu, L.; Xi, L.; Gao, J. Research on flow and heat transfer characteristics of a novel long-channel lamilloy cooling structure. Int. J. Heat Mass Transf. 2024, 235. [Google Scholar] [CrossRef]
- Revulagadda, A.P.; Rana, R.; Suresh, B.; Balaji, C.; Pattamatta, A. A multiobjective optimization of 3D - slot jet configuration for enhancement of film cooling in an annular combustor liner. Int. J. Heat Mass Transf. 2023, 218. [Google Scholar] [CrossRef]
- Revulagadda, A.P.; Adapa, B.R.; Balaji, C.; Pattamatta, A. Fluid flow and heat transfer characteristics of three-dimensional slot film cooling in an annular combustor. Int. J. Heat Mass Transf. 2023, 211. [Google Scholar] [CrossRef]
- Li, Z.; Xie, P.; Zeng, Q.; Chen, X. Study of Tangential Effusion Cooling of a Combustor Liner. Processes 2023, 11, 2433. [Google Scholar] [CrossRef]
- Zhang, B.-L.; Zhu, H.-R.; Yao, C.-Y.; Liu, C.-L.; Zhang, L. Experimental study on film cooling and heat transfer characteristics of a twisted vane with staggered counter-inclined film-hole and laid-back-shaped-hole. Int. J. Heat Mass Transf. 2021, 176, 121377. [Google Scholar] [CrossRef]
- Wang, N.; Shiau, C.-C.; Han, J.-C.; Xu, H.; Fox, M. Turbine vane endwall film cooling from mid-chord or downstream rows and upstream coolant injection. Int. J. Heat Mass Transf. 2018, 133, 247–255. [Google Scholar] [CrossRef]
- Li, X.; Ren, J.; Jiang, H. Multi-row film cooling characteristics on a vane endwall. Int. J. Heat Mass Transf. 2016, 92, 23–33. [Google Scholar] [CrossRef]
- Li, X.; Ren, J.; Jiang, H. Influence of different film cooling arrangements on endwall cooling. Int. J. Heat Mass Transf. 2016, 102, 348–359. [Google Scholar] [CrossRef]
- Baek, S.I.; Ahn, J. Large Eddy Simulation of Film Cooling with Triple Holes: Injectant Behavior and Adiabatic Film-Cooling Effectiveness. Processes 2020, 8, 1443. [Google Scholar] [CrossRef]
- Baek, S.I.; Ahn, J. Large Eddy Simulation of Film Cooling Involving Compound Angle Holes: Comparative Study of LES and RANS. Processes 2021, 9, 198. [Google Scholar] [CrossRef]
- Muska, J.F.; Fish, R.W.; Suo, M. The Additive Nature of Film Cooling From Rows of Holes. J. Eng. Power 1976, 98, 457–463. [Google Scholar] [CrossRef]
- Ethridge, M.I.; Cutbirth, J.M.; Bogard, D.G. Effects of Showerhead Cooling on Turbine Vane Suction Side Film Cooling Effectiveness. In 2000; pp 69-78.
- Polanka, M.D.; Ethridge, M.I.; Cutbirth, J.M.; Bogard, D.G. Effects of Showerhead Injection on Film Cooling Effectiveness for a Downstream Row of Holes. In 2000.
- Mhetras, S.; Han, J.-C. Effect of Superposition on Spanwise Film-Cooling Effectiveness Distribution on a Gas Turbine Blade. In 2006; pp 477-487.
- Mhetras, S.; Han, J.-C.; Rudolph, R. Film-Cooling Effectiveness From Shaped Film Cooling Holes for a Gas Turbine Blade. In 2008; pp 837-848.
- Zhang, L.; Moon, H.-K. Turbine Blade Film Cooling Study: The Effects of Film Hole Location on the Pressure Side. In 2007; pp 497-506.
- Yang, X.; Liu, Z.; Liu, Z.; Feng, Z.; Simon, T. Turbine platform phantom cooling from airfoil film coolant, with purge flow. Int. J. Heat Mass Transf. 2019, 140, 25–40. [Google Scholar] [CrossRef]
- Chen, Z.; Mao, Y.; Hu, K.; Su, X.; Yuan, X. 2-D prediction method for multi-row film cooling effectiveness. Appl. Therm. Eng. 2021, 199, 117607. [Google Scholar] [CrossRef]
- Wang, P.; Xu, Q.; Liu, J.; Wang, P.; Du, Q.; Wang, Z. Experimental and unsteady numerical investigations on cooling characteristics of trailing-edge cutback with effect of upstream film holes. Int. J. Therm. Sci. 2023, 193. [Google Scholar] [CrossRef]
- Sasaki, M.; Takahara, K.; Kumagai, T.; Hamano, M. Film Cooling Effectiveness for Injection from Multirow Holes. J. Eng. Power 1979, 101, 101–108. [Google Scholar] [CrossRef]
- Anderson, J.B.; Winka, J.R.; Bogard, D.G.; Crawford, M.E. Evaluation of Superposition Predictions for Showerhead Film Cooling on a Vane. J. Turbomach. 2015, 137, 041010. [Google Scholar] [CrossRef]
- Meng, T.; Zhu, H.-R.; Liu, C.-L.; Wei, J.-S. Investigation on the Accuracy of Superposition Predictions of Film Cooling Effectiveness. Int. J. Turbo Jet-Engines 2018, 35, 181–192. [Google Scholar] [CrossRef]
- Murray, A.V.; Ireland, P.T.; Wong, T.H.; Tang, S.W.; Rawlinson, A.J. High resolution experimental and computational methods for modelling multiple row effusion cooling performance. Int. J. Turbomach. Propuls. Power 2018, 3, 4. [Google Scholar] [CrossRef]
- Harrington, M.K.; McWaters, M.A.; Bogard, D.G.; Lemmon, C.A.; Thole, K.A. Full-Coverage Film Cooling With Short Normal Injection Holes. J. Turbomach. 2001, 123, 798–805. [Google Scholar] [CrossRef]
- Xu, Z.; Zhu, H.; Liu, C.; Ye, L.; Zhou, D. Film Cooling Effectiveness Superposition Calculation of Double-Row Injection Holes on Turbine Vane. J. Therm. Sci. 2022, 31, 2424–2437. [Google Scholar] [CrossRef]
- Zhang, F.; Liu, C.; Wang, W.; Ye, L.; Li, B.; Liu, F. Film superposition prediction method for film cooling layouts with same opening ratio on the turbine blade. Appl. Therm. Eng. 2023, 233, 121105. [Google Scholar] [CrossRef]
- Zhang, F.; Liu, C.; Ye, L.; Ran, Y.; Zhou, T.; Yan, H. Study on the film superposition method for dense multirow film Hole layouts. Energy 2024, 293, 130607. [Google Scholar] [CrossRef]
- Huo, T.; Xing, J.; Han, S.; Guo, T.; Li, L.; Du, X.; Zhang, R.; Zhou, L.; Zhang, H. Accurate predictions of mist assisted film cooling characteristics and effectiveness on a flat plate with double-row holes. Int. J. Heat Mass Transf. 2024, 227. [Google Scholar] [CrossRef]
- Kirollos, B.; Povey, T. An Energy-Based Method for Predicting the Additive Effect of Multiple Film Cooling Rows. J. Eng. Gas Turbines Power 2015, 137, 122607. [Google Scholar] [CrossRef]
- Li, C.; An, B.; Liu, J. Study on Additive Effect of Film Cooling Effectiveness in Two Rows of Fan-Shaped Holes. J. Turbomach. 2023, 146, 1–28. [Google Scholar] [CrossRef]
- Eckert, E.; Goldstein, R.; Ramsey, J. Film cooling with injection through a circular hole Summary report; 1968.
- Bogard, D.G.; Thole, K.A. Gas Turbine Film Cooling. J. Propuls. Power 2006, 22, 249–270. [Google Scholar] [CrossRef]
- Moffat, R.J. Describing the uncertainties in experimental results. Exp. Therm. Fluid Sci. 1988, 1, 3–17. [Google Scholar] [CrossRef]
Figure 1.
Single-row hole film cooling effectiveness.
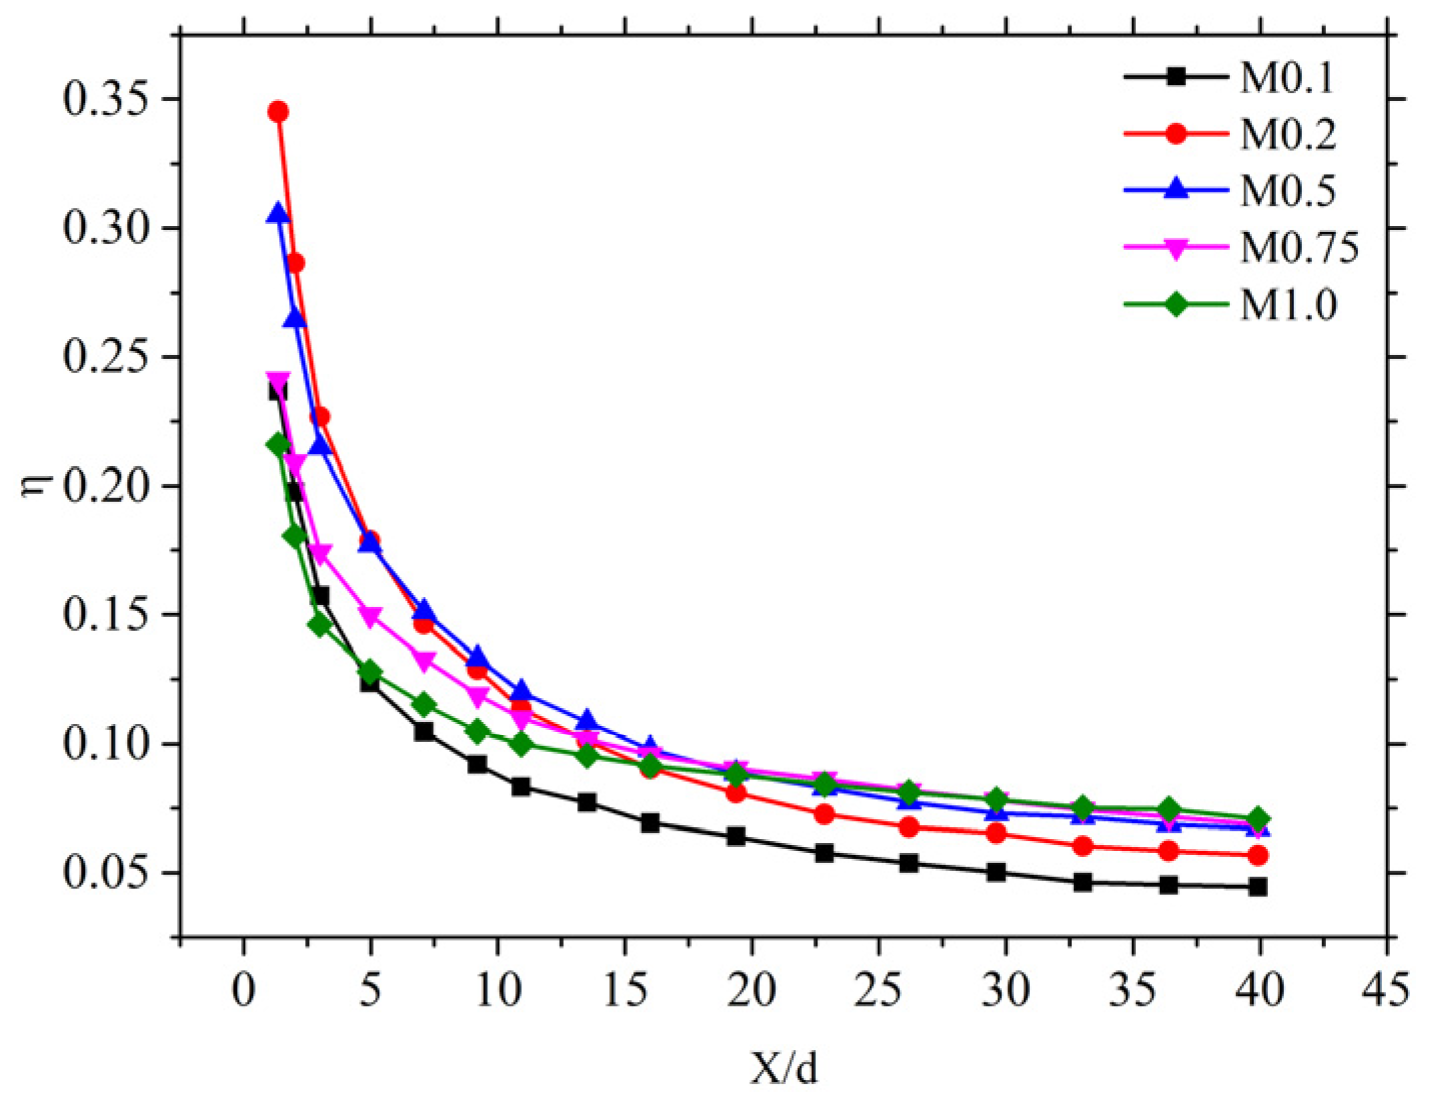
Figure 2.
Schematic of Sellers superposition model.
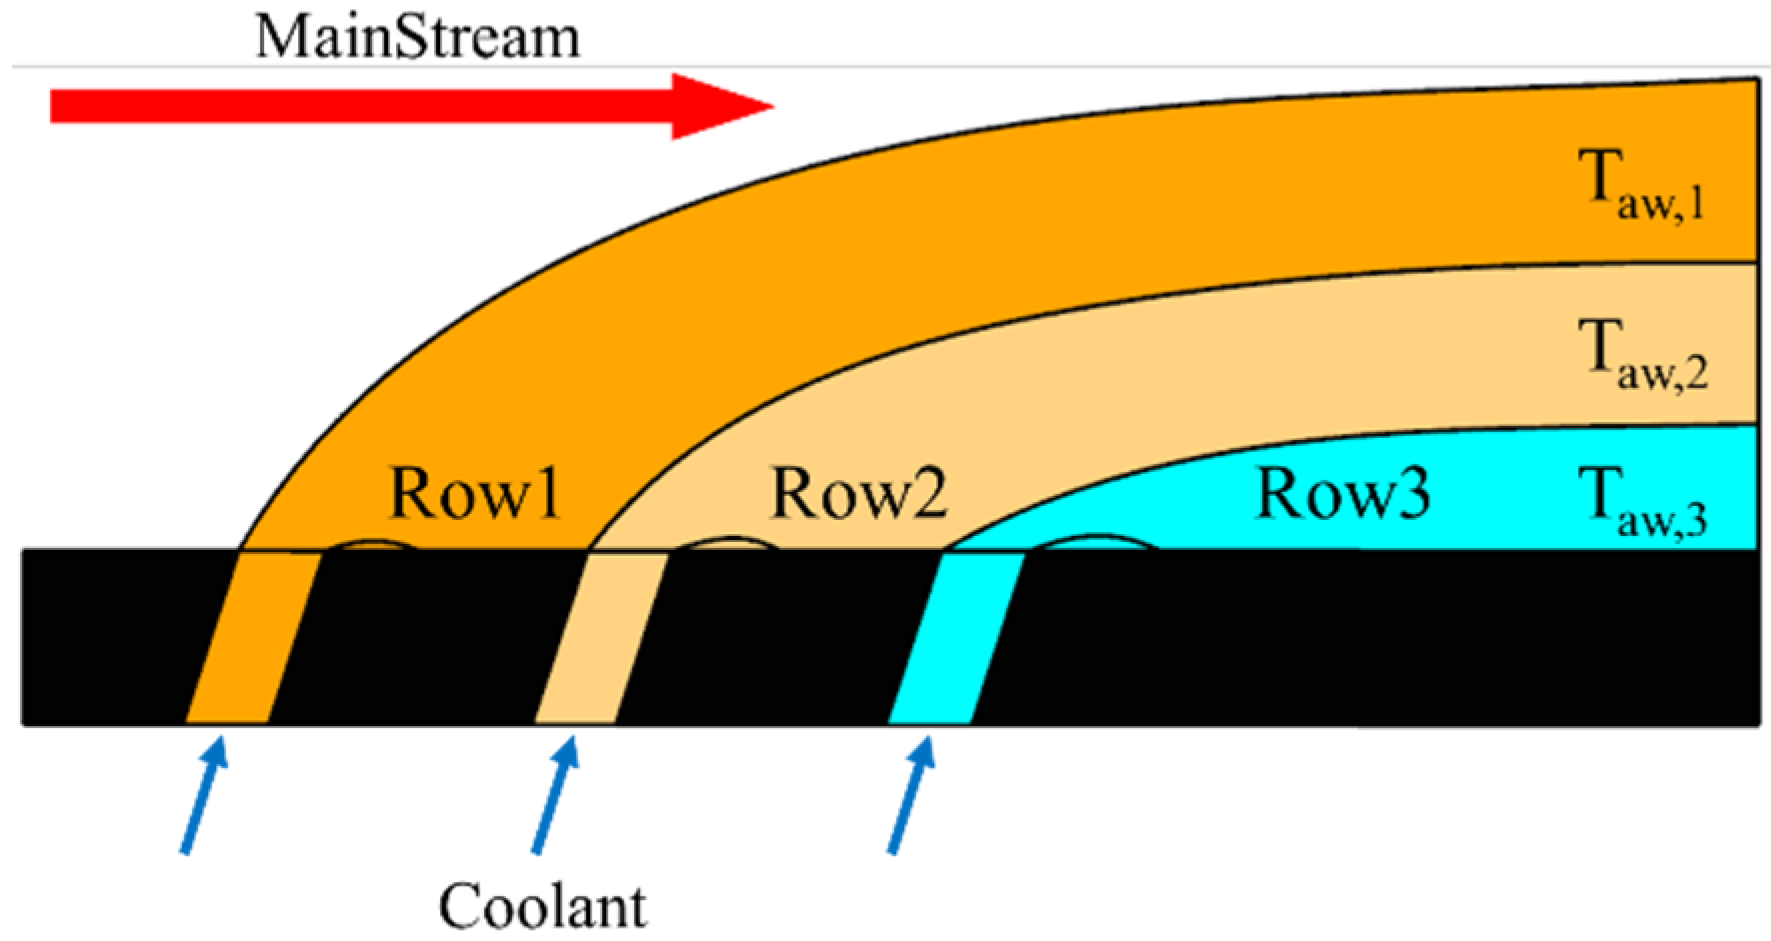
Figure 3.
Effect of cooling air injection on mainstream temperature.
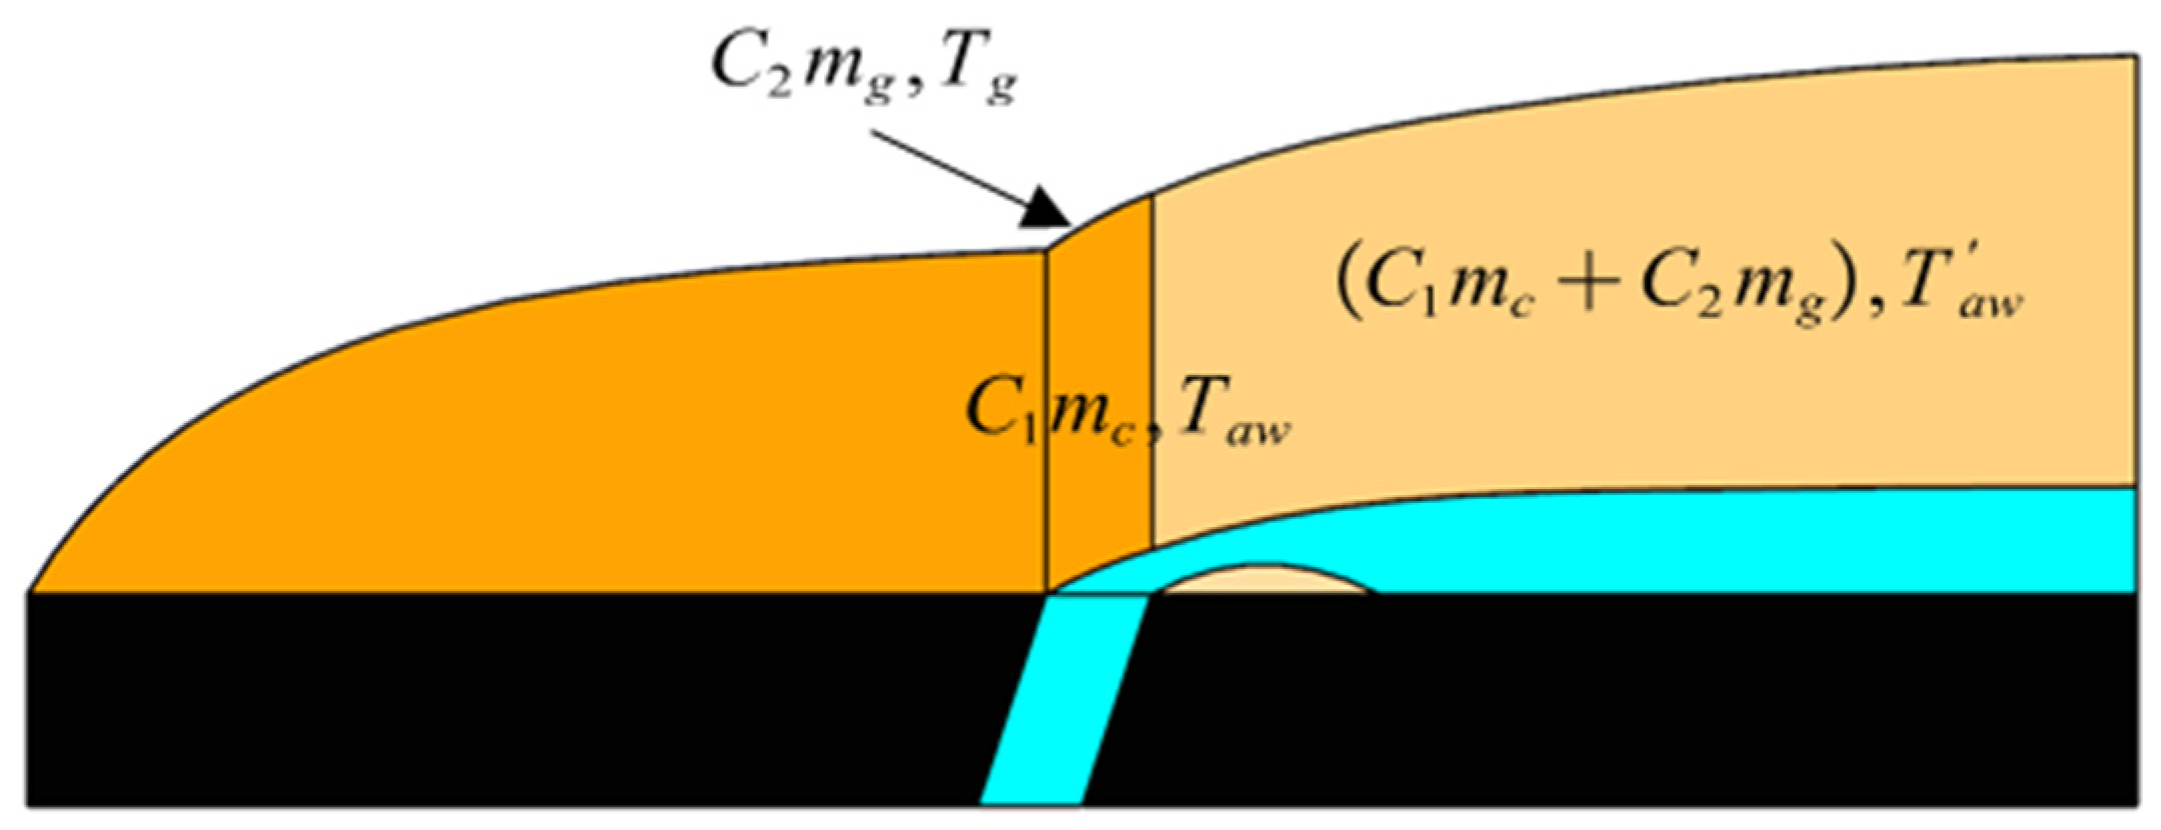
Figure 4.
Experimental system schematic.
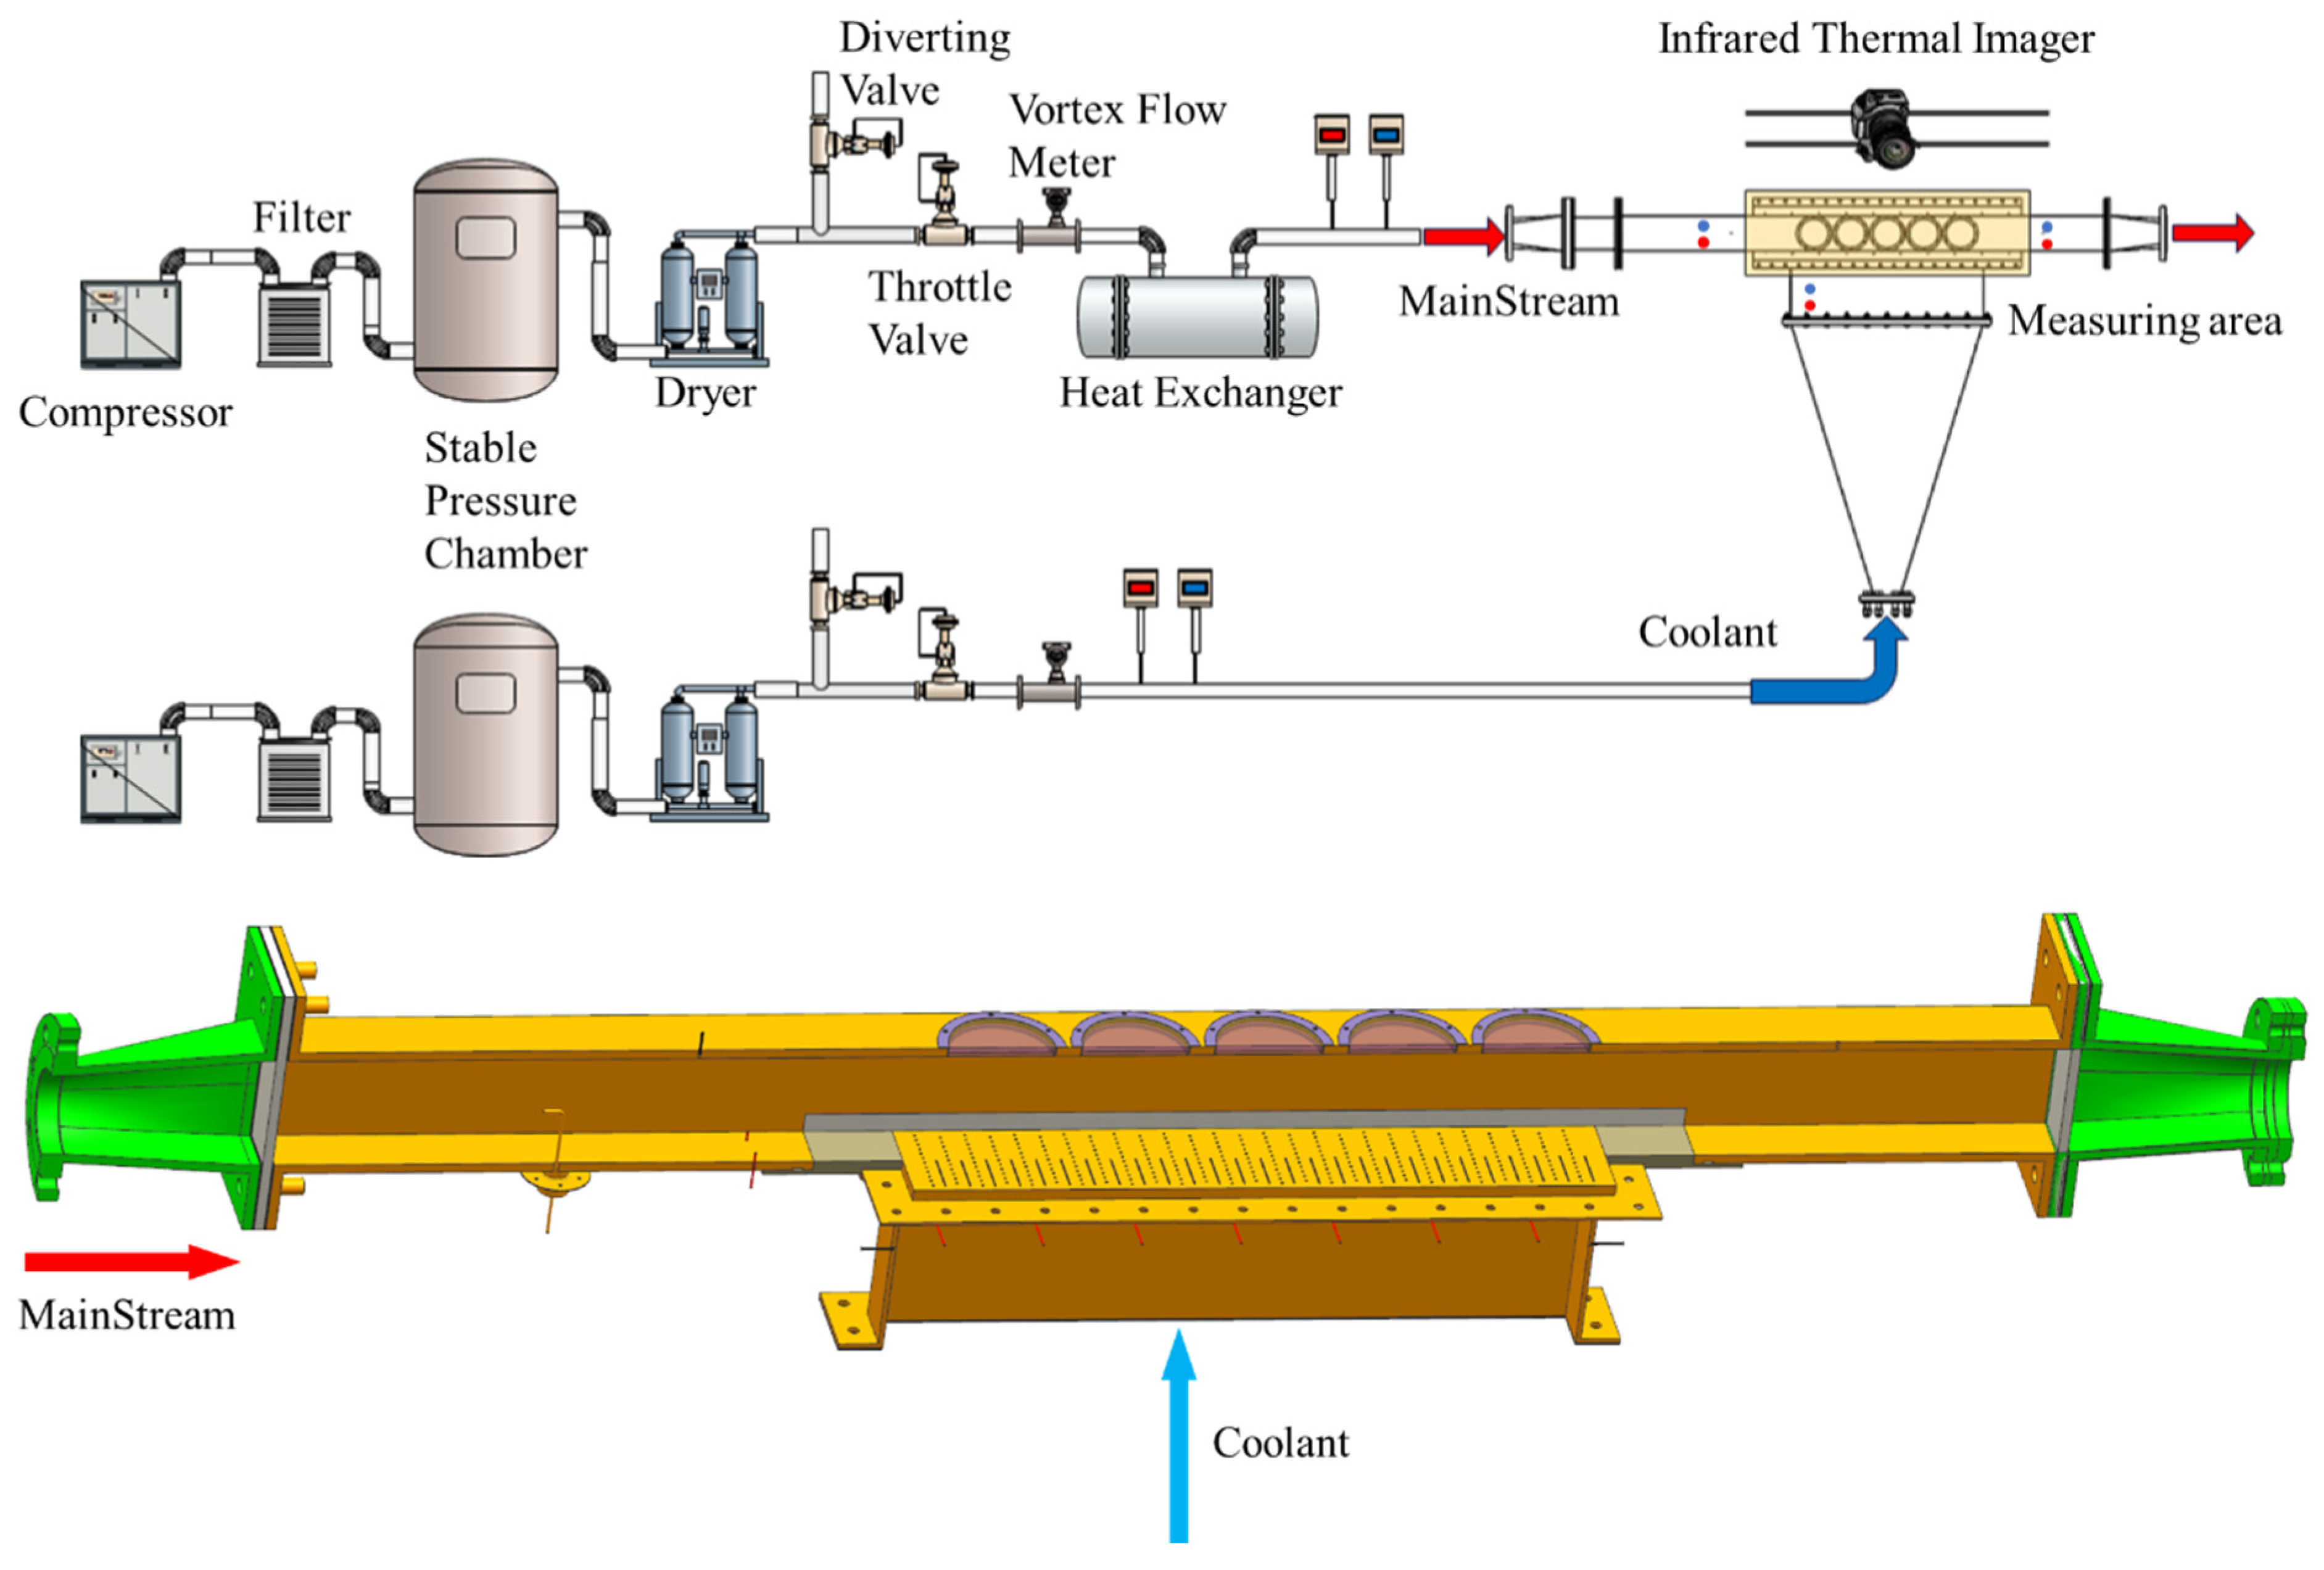
Figure 5.
Infrared camera capturing on a rail.
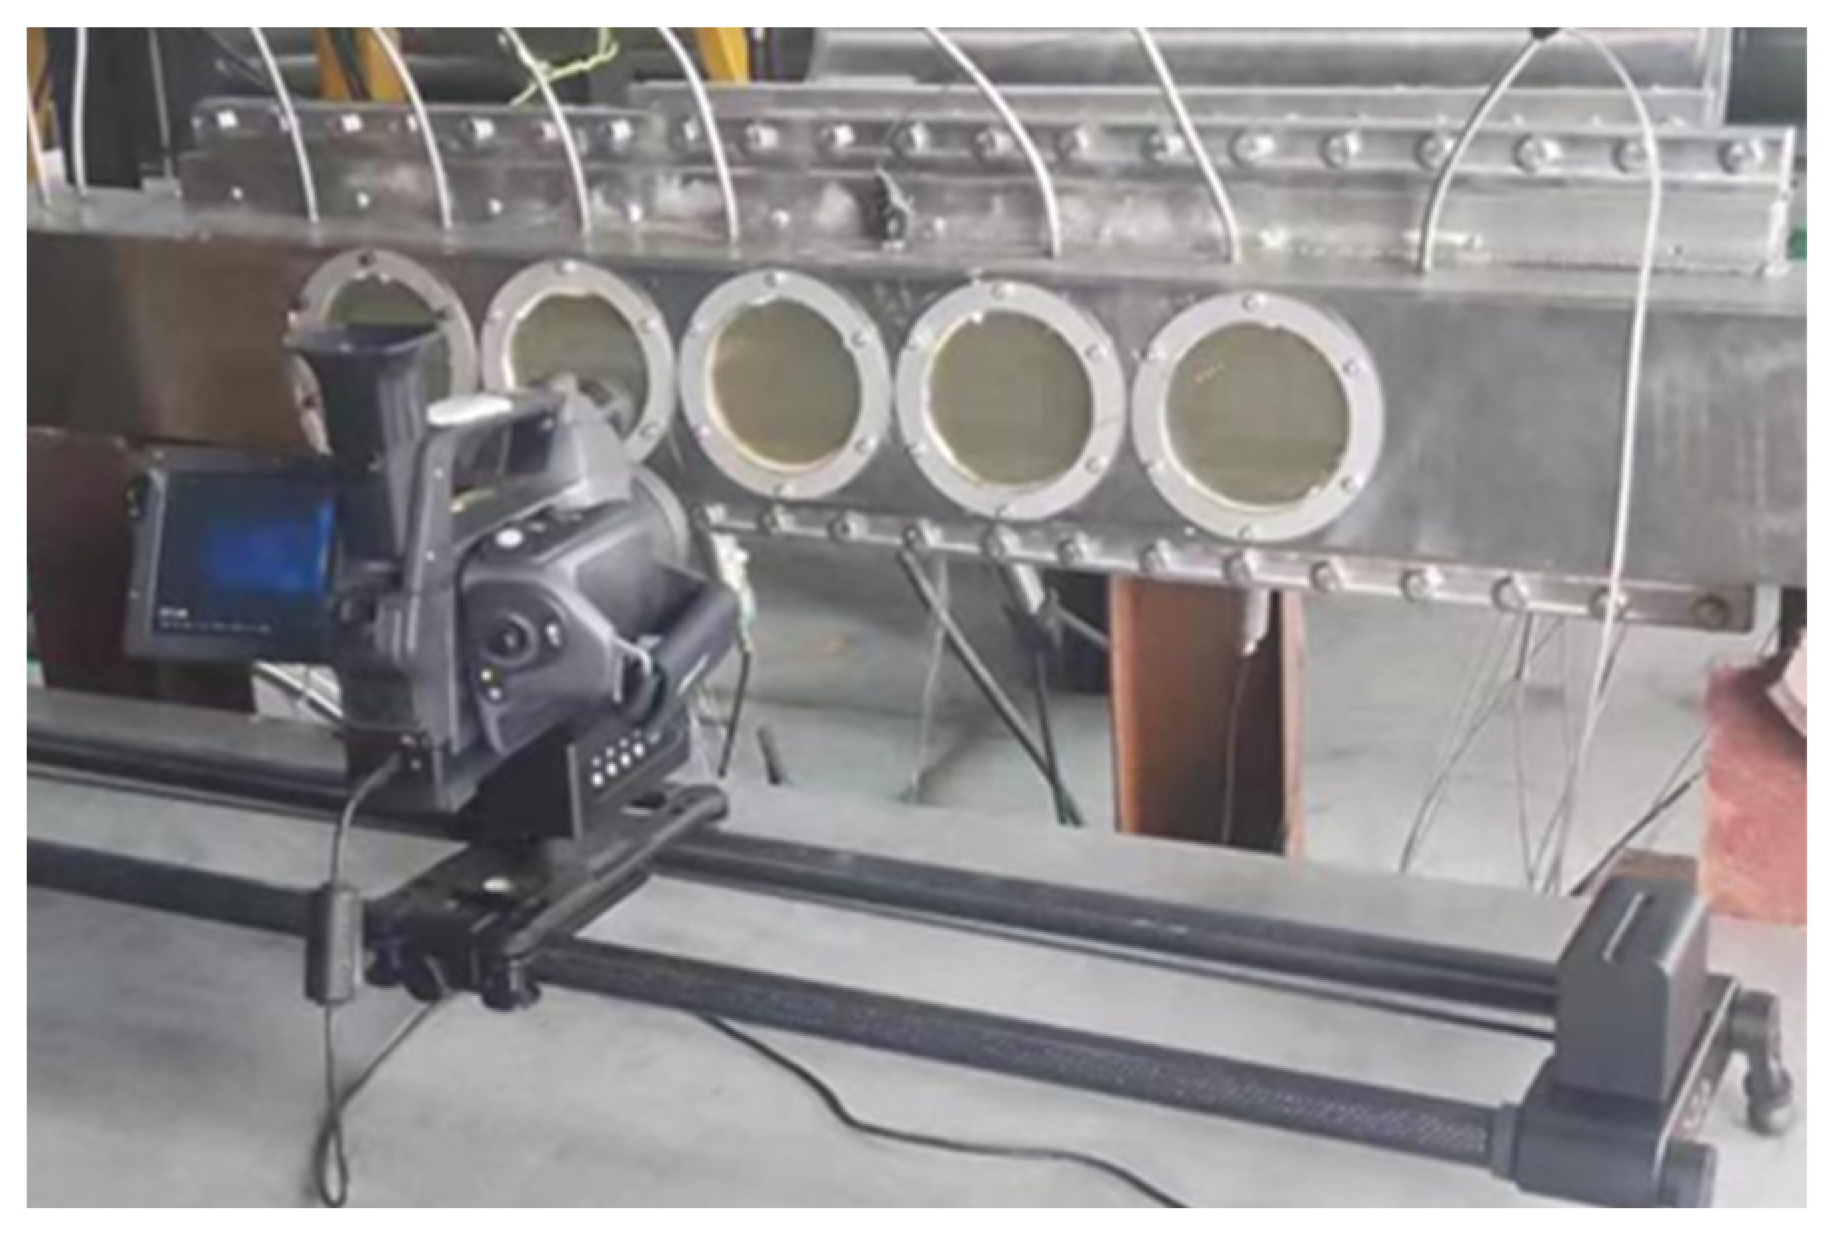
Figure 6.
Structure of test plates.
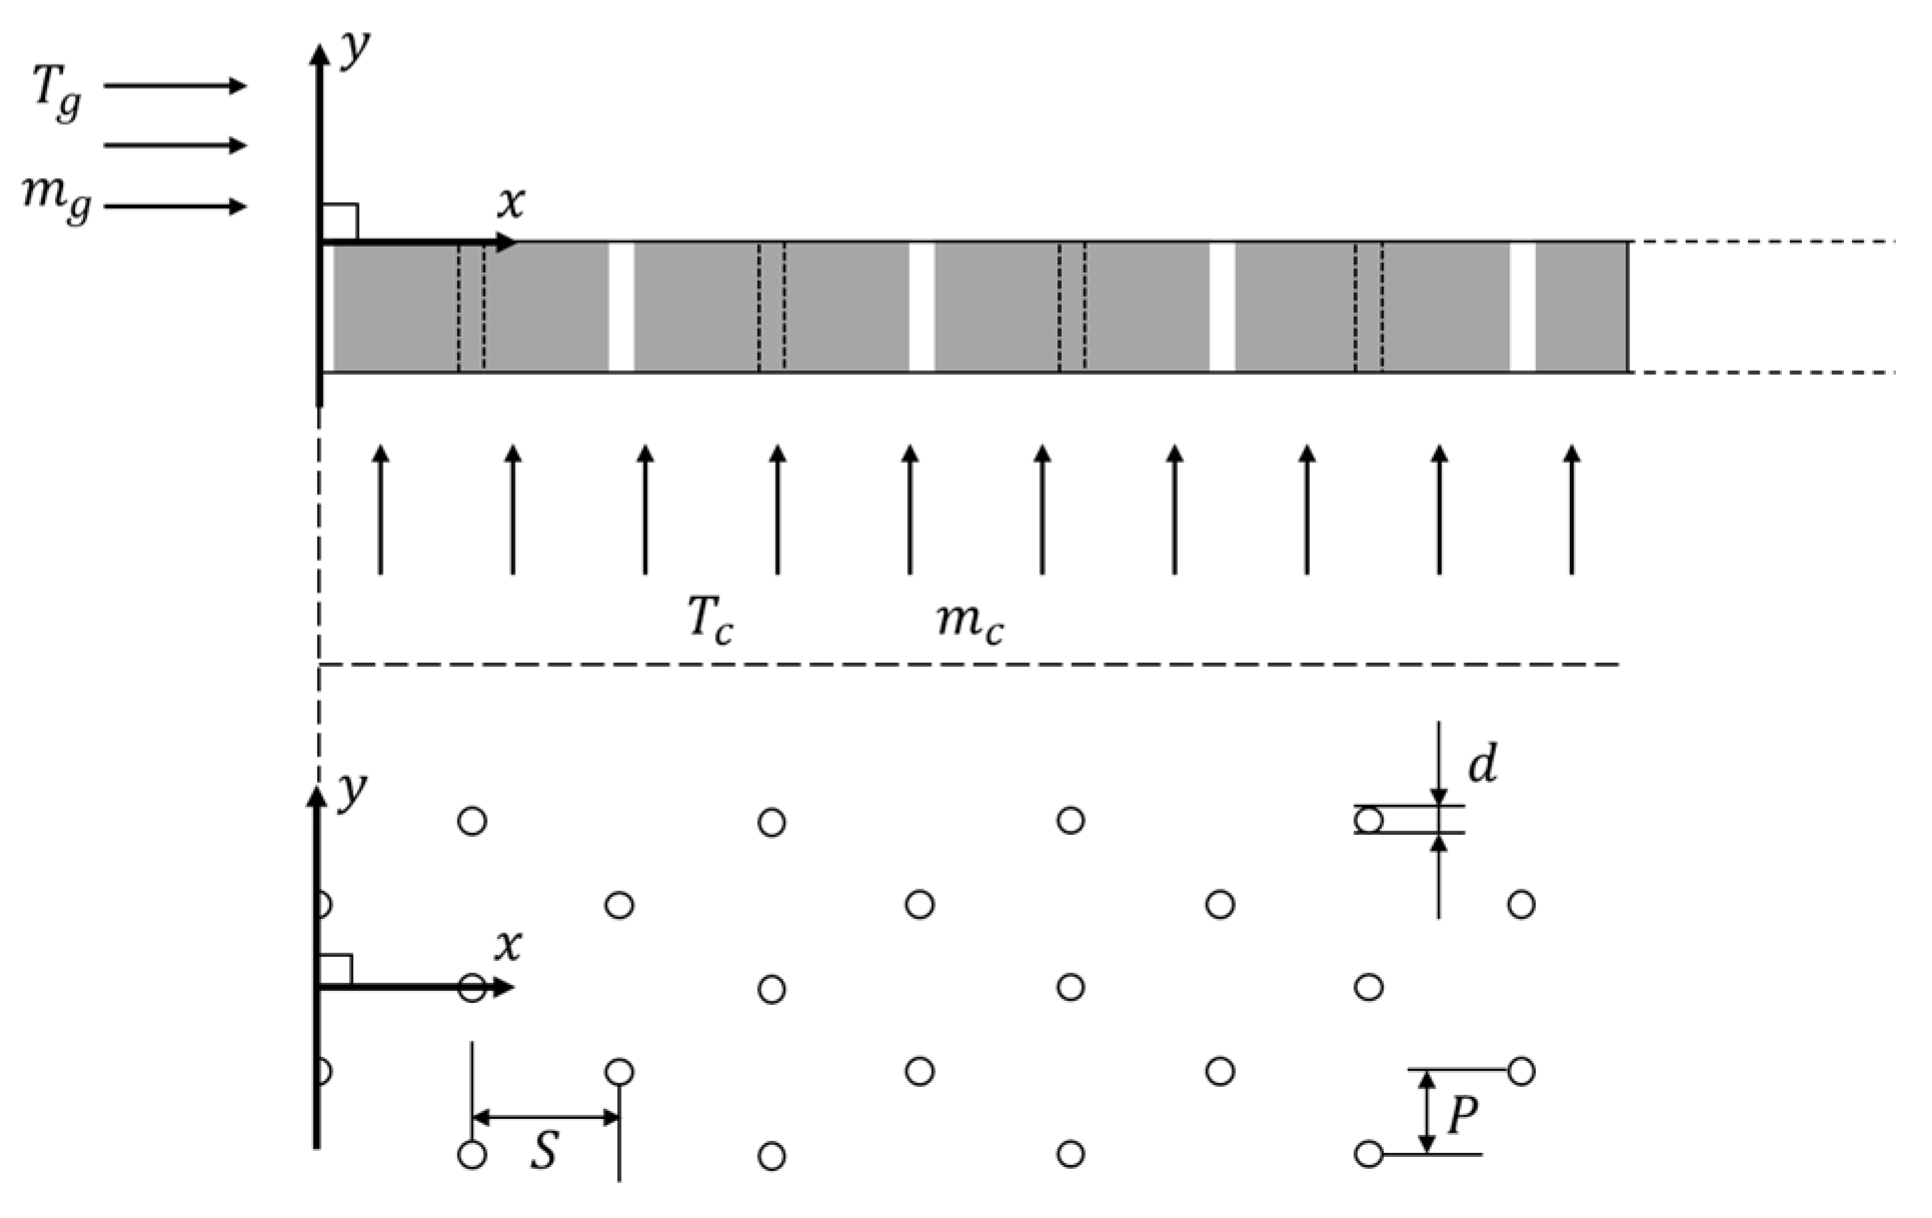
Figure 7.
Film hole plate structure with a diameter of 1.8 mm.
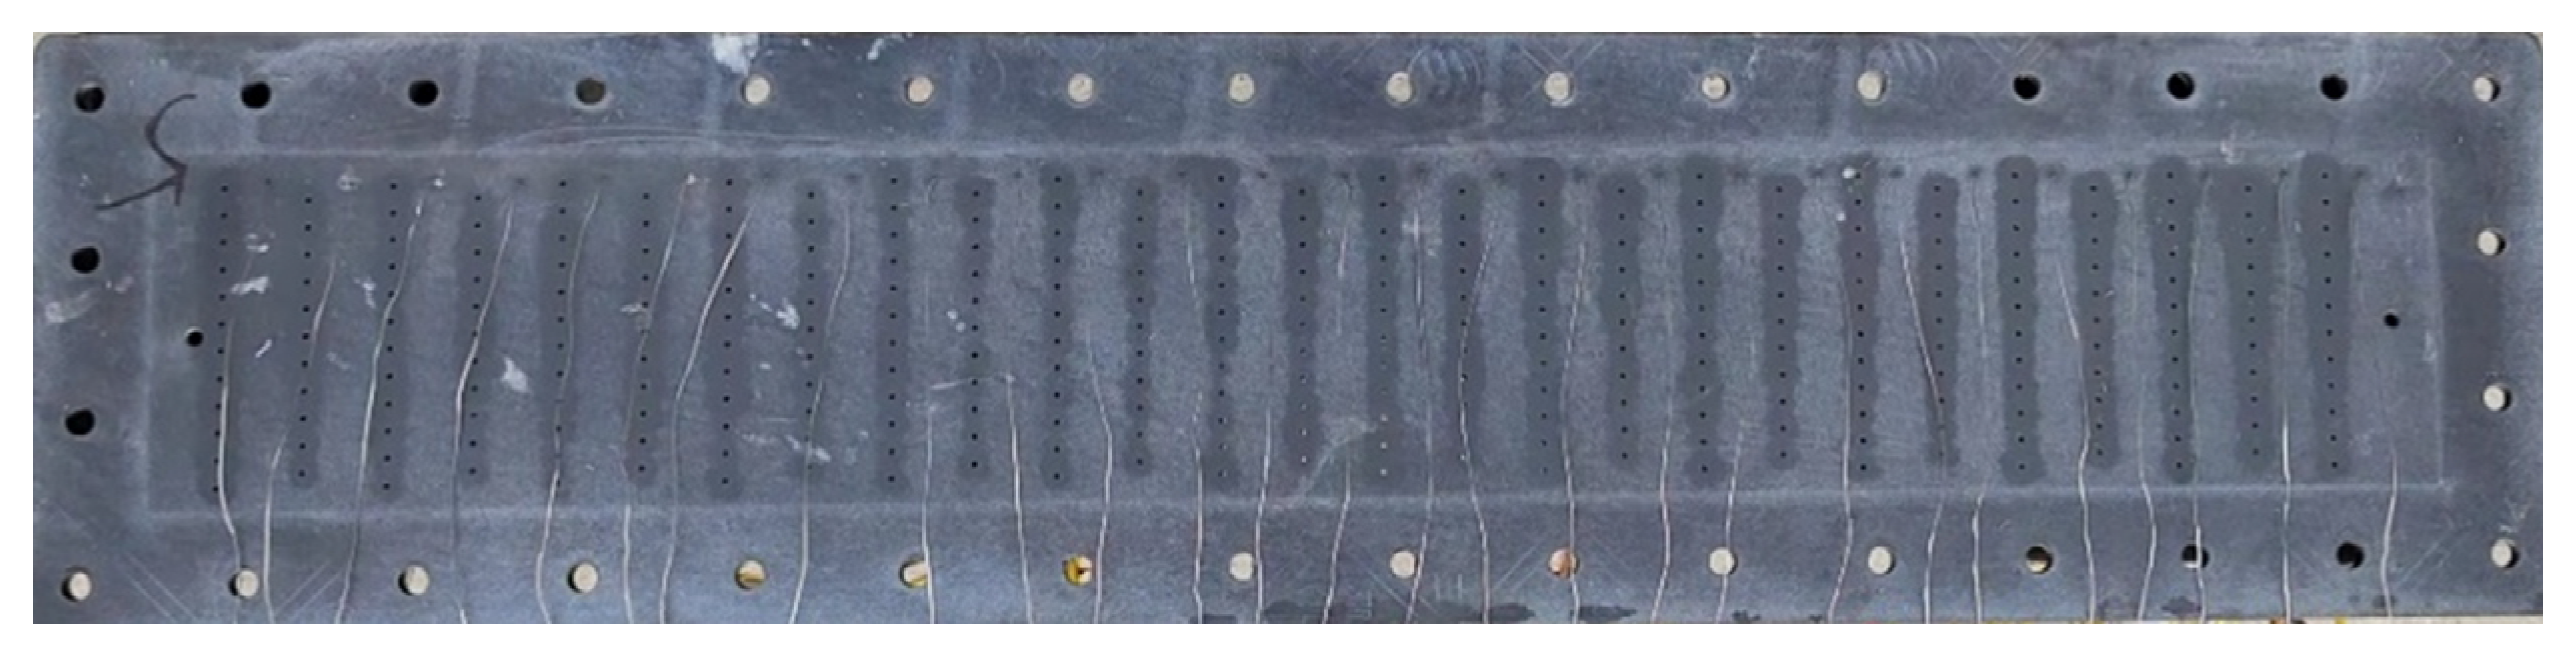
Figure 8.
Deviations in experimental cooling efficiencies. (a) Absolute deviation. (b) Relative deviation.
Figure 8.
Deviations in experimental cooling efficiencies. (a) Absolute deviation. (b) Relative deviation.
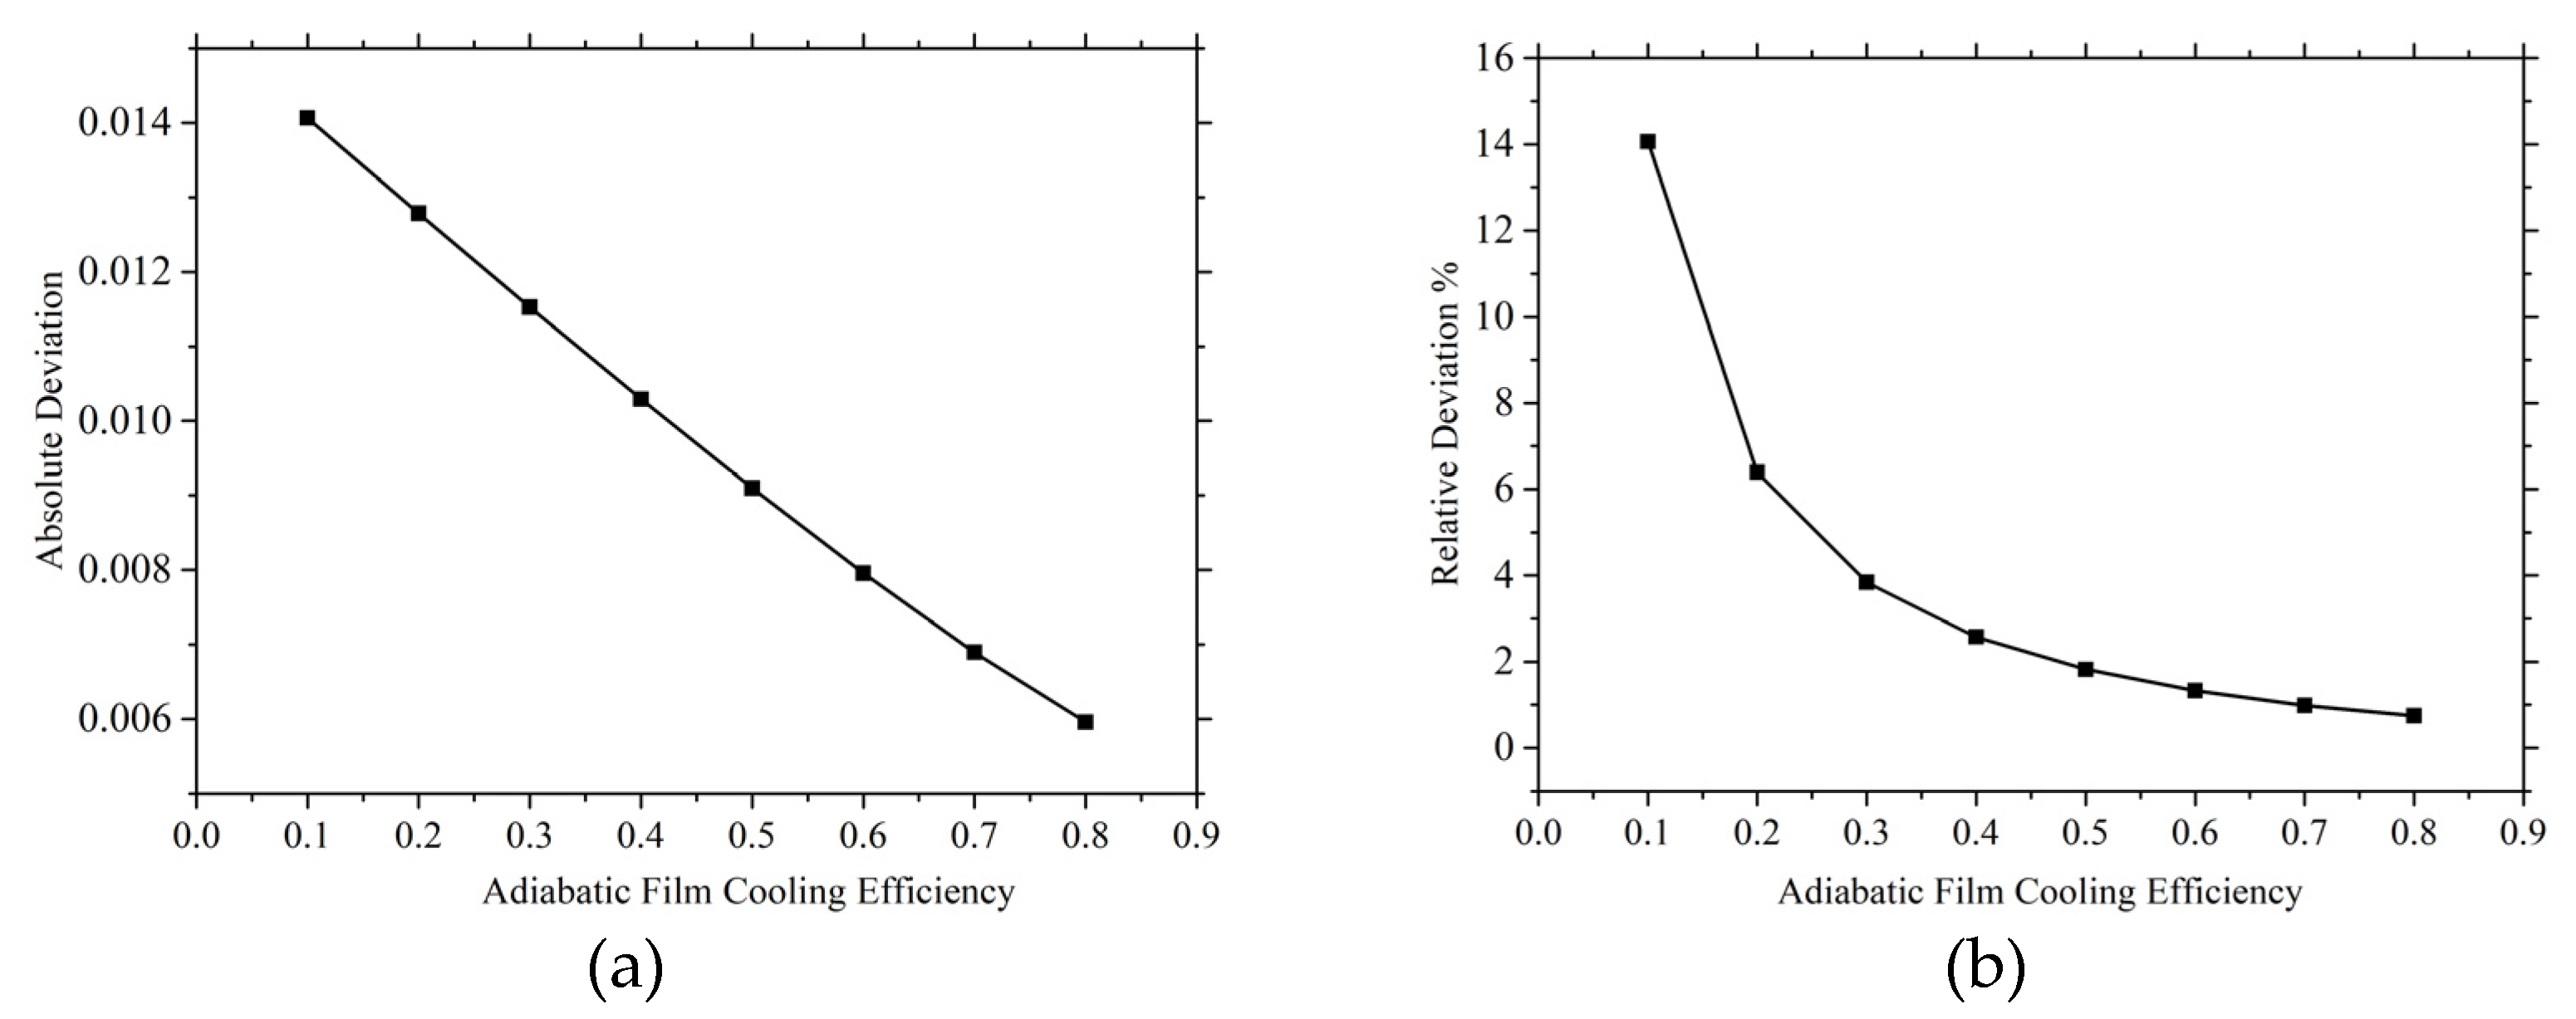
Figure 9.
Calibration of infrared results for different test plates. (a) Case 1. (b) Case 2. (c) Case 3. (d) Case 4.
Figure 9.
Calibration of infrared results for different test plates. (a) Case 1. (b) Case 2. (c) Case 3. (d) Case 4.
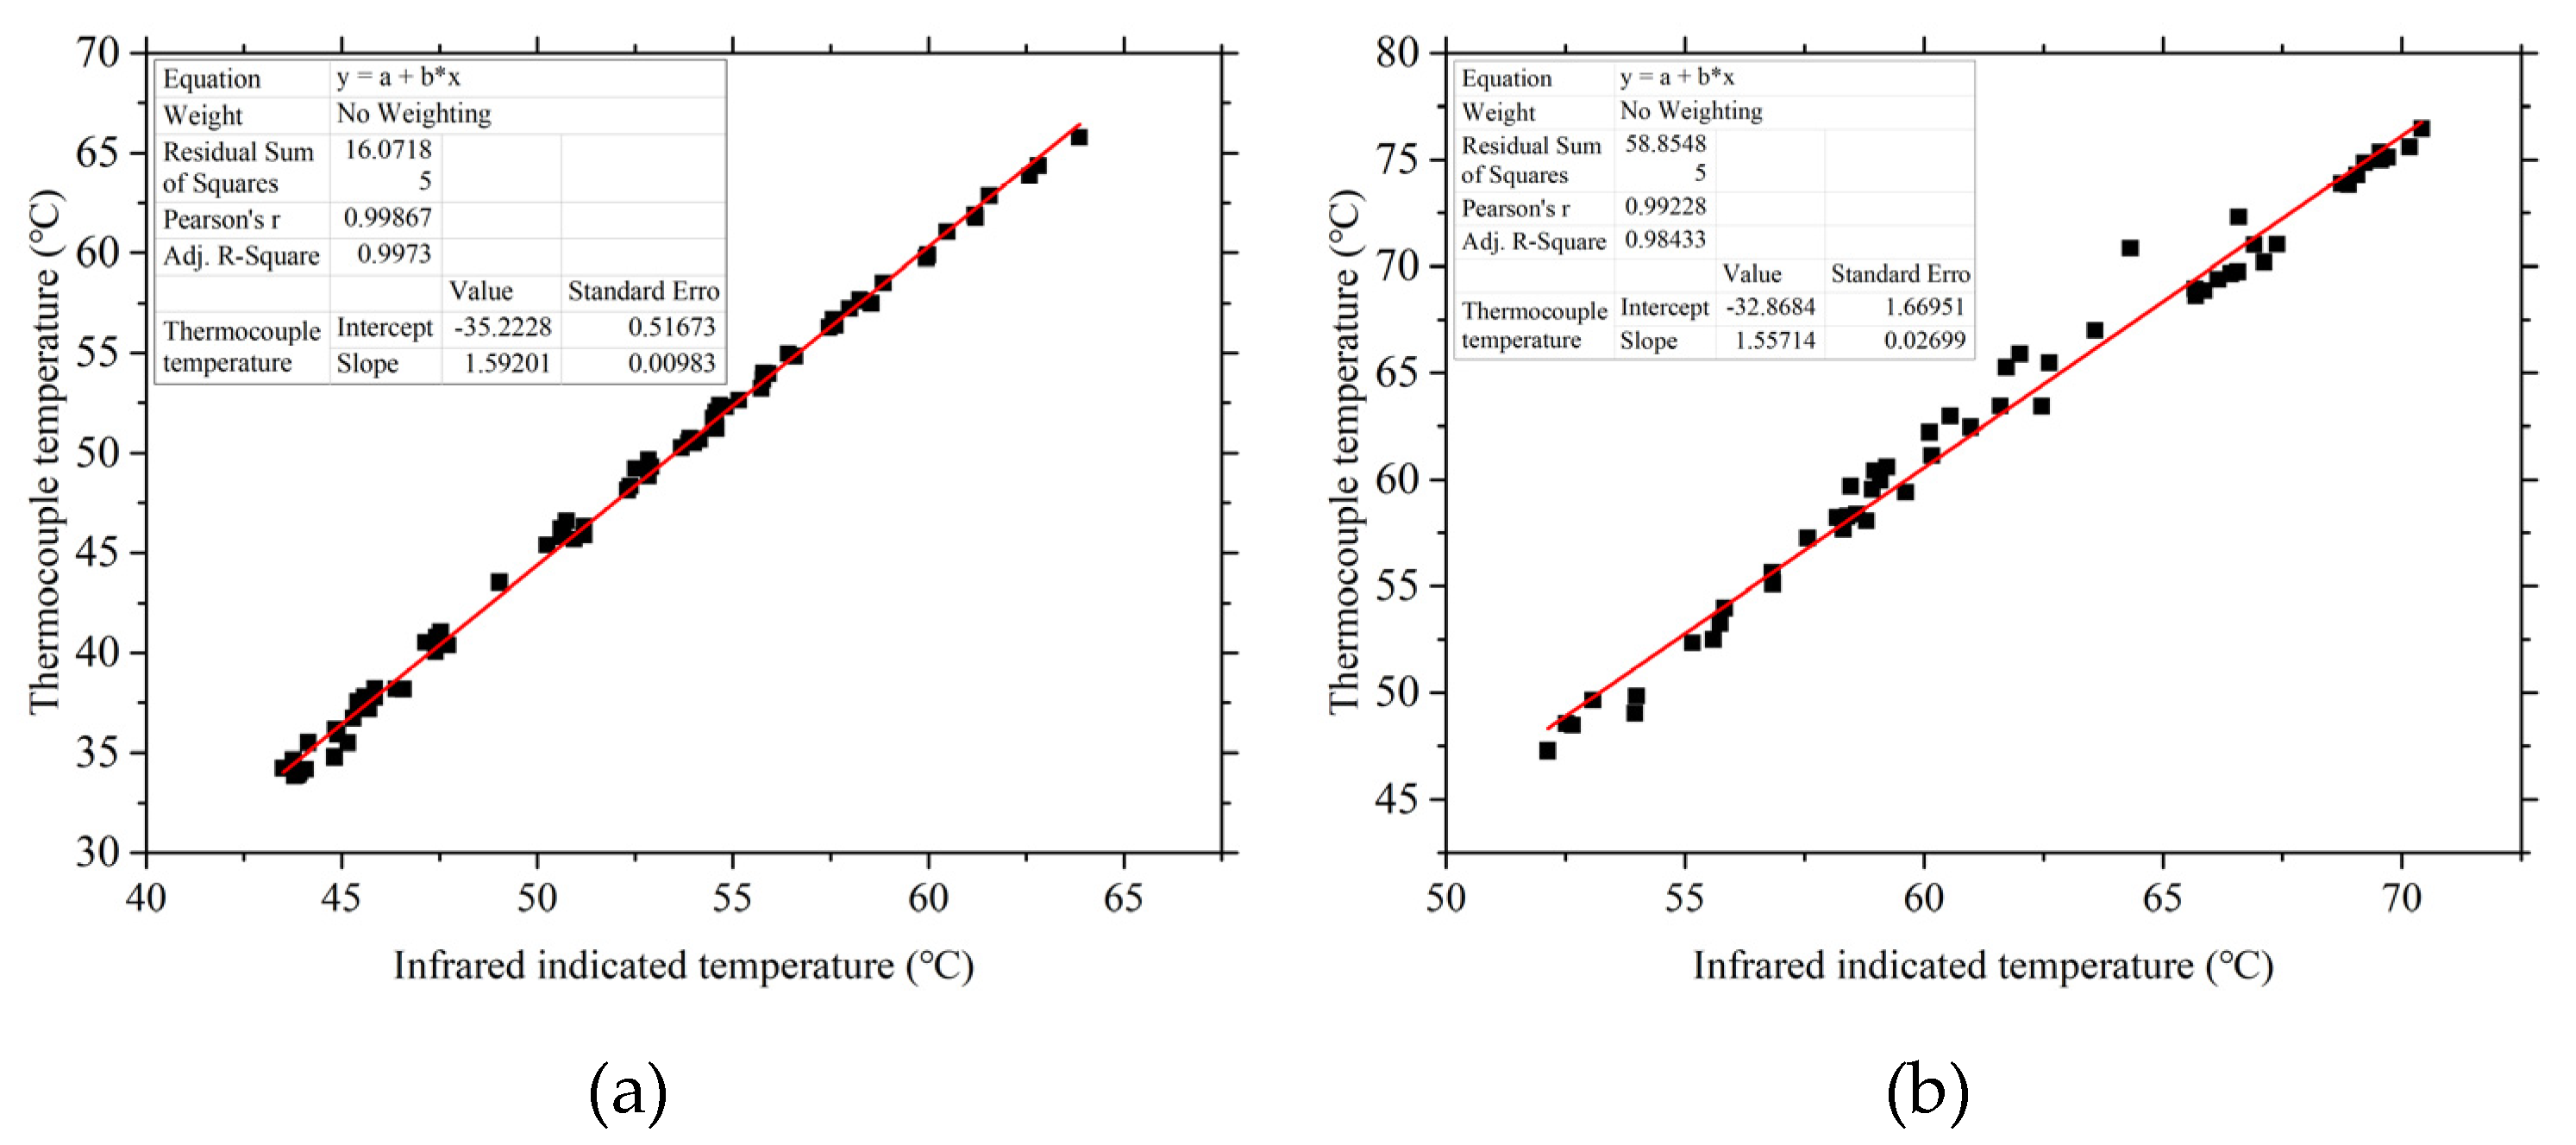
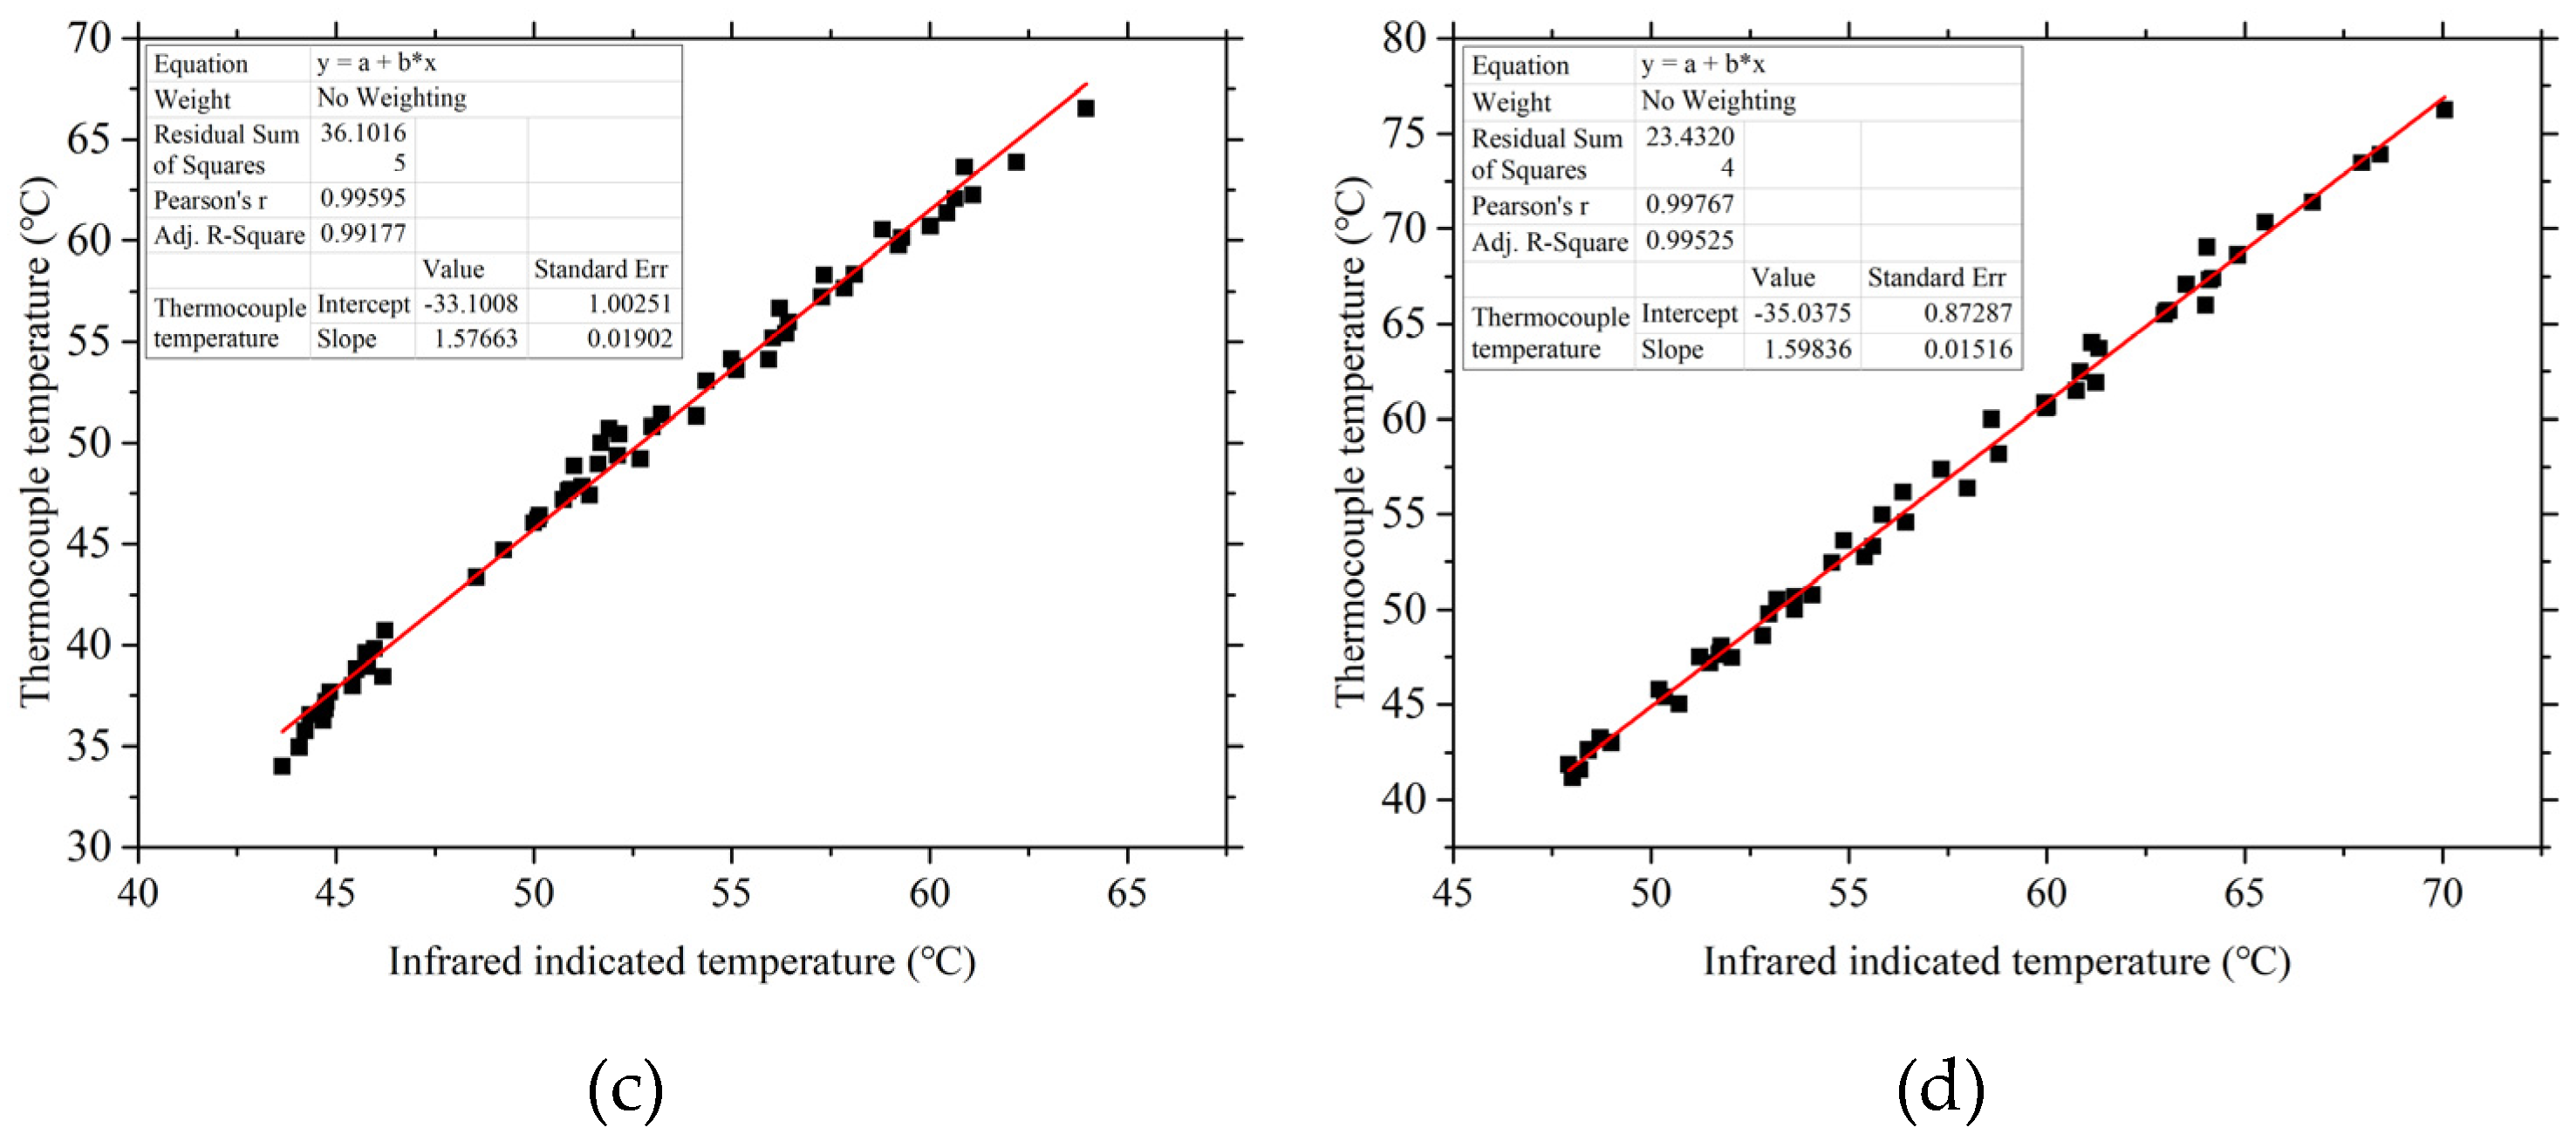
Figure 10.
Comparison of the sellers model predicted cooling efficiency without equivalent blowing ratio and experimental results along the centerline for different test plates. (a) Case 1. (b) Case 2. (c) Case 3. (d) Case 4.
Figure 10.
Comparison of the sellers model predicted cooling efficiency without equivalent blowing ratio and experimental results along the centerline for different test plates. (a) Case 1. (b) Case 2. (c) Case 3. (d) Case 4.
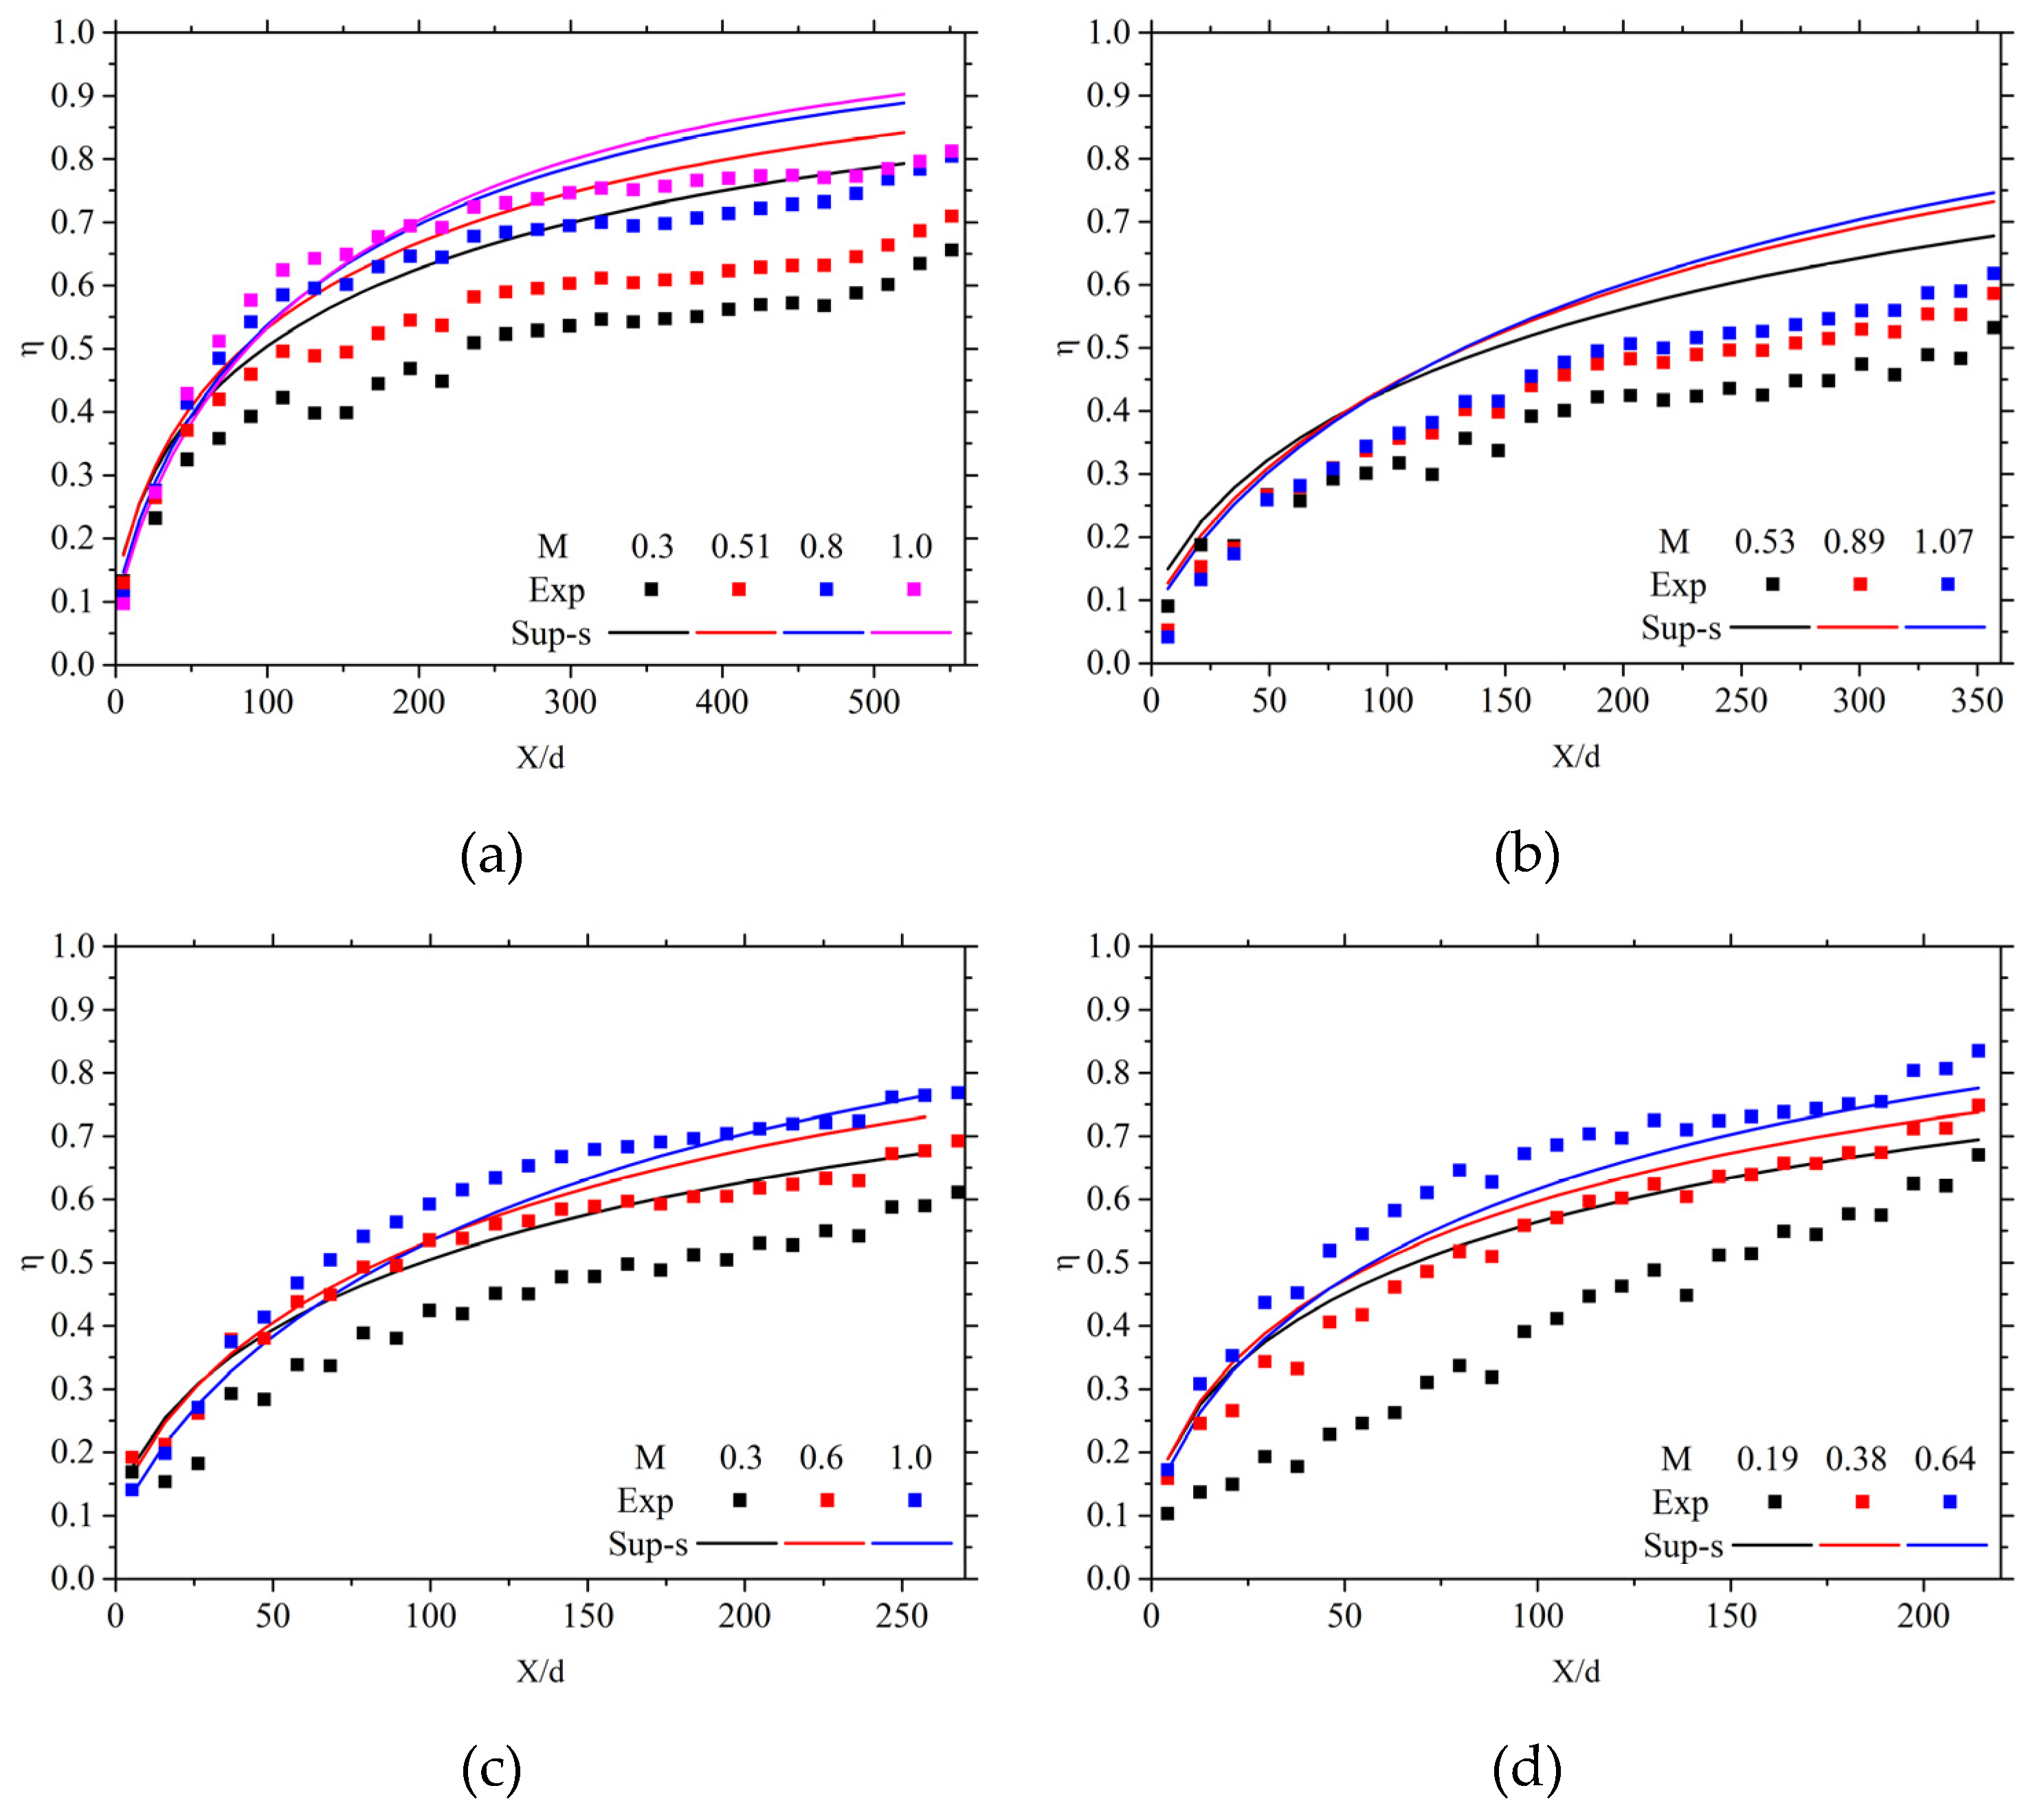
Figure 11.
Comparison of the sellers model predicted cooling efficiency with equivalent blowing ratio and experimental results along the centerline for different test plates. (a) Case 2. (b) Case 4.
Figure 11.
Comparison of the sellers model predicted cooling efficiency with equivalent blowing ratio and experimental results along the centerline for different test plates. (a) Case 2. (b) Case 4.
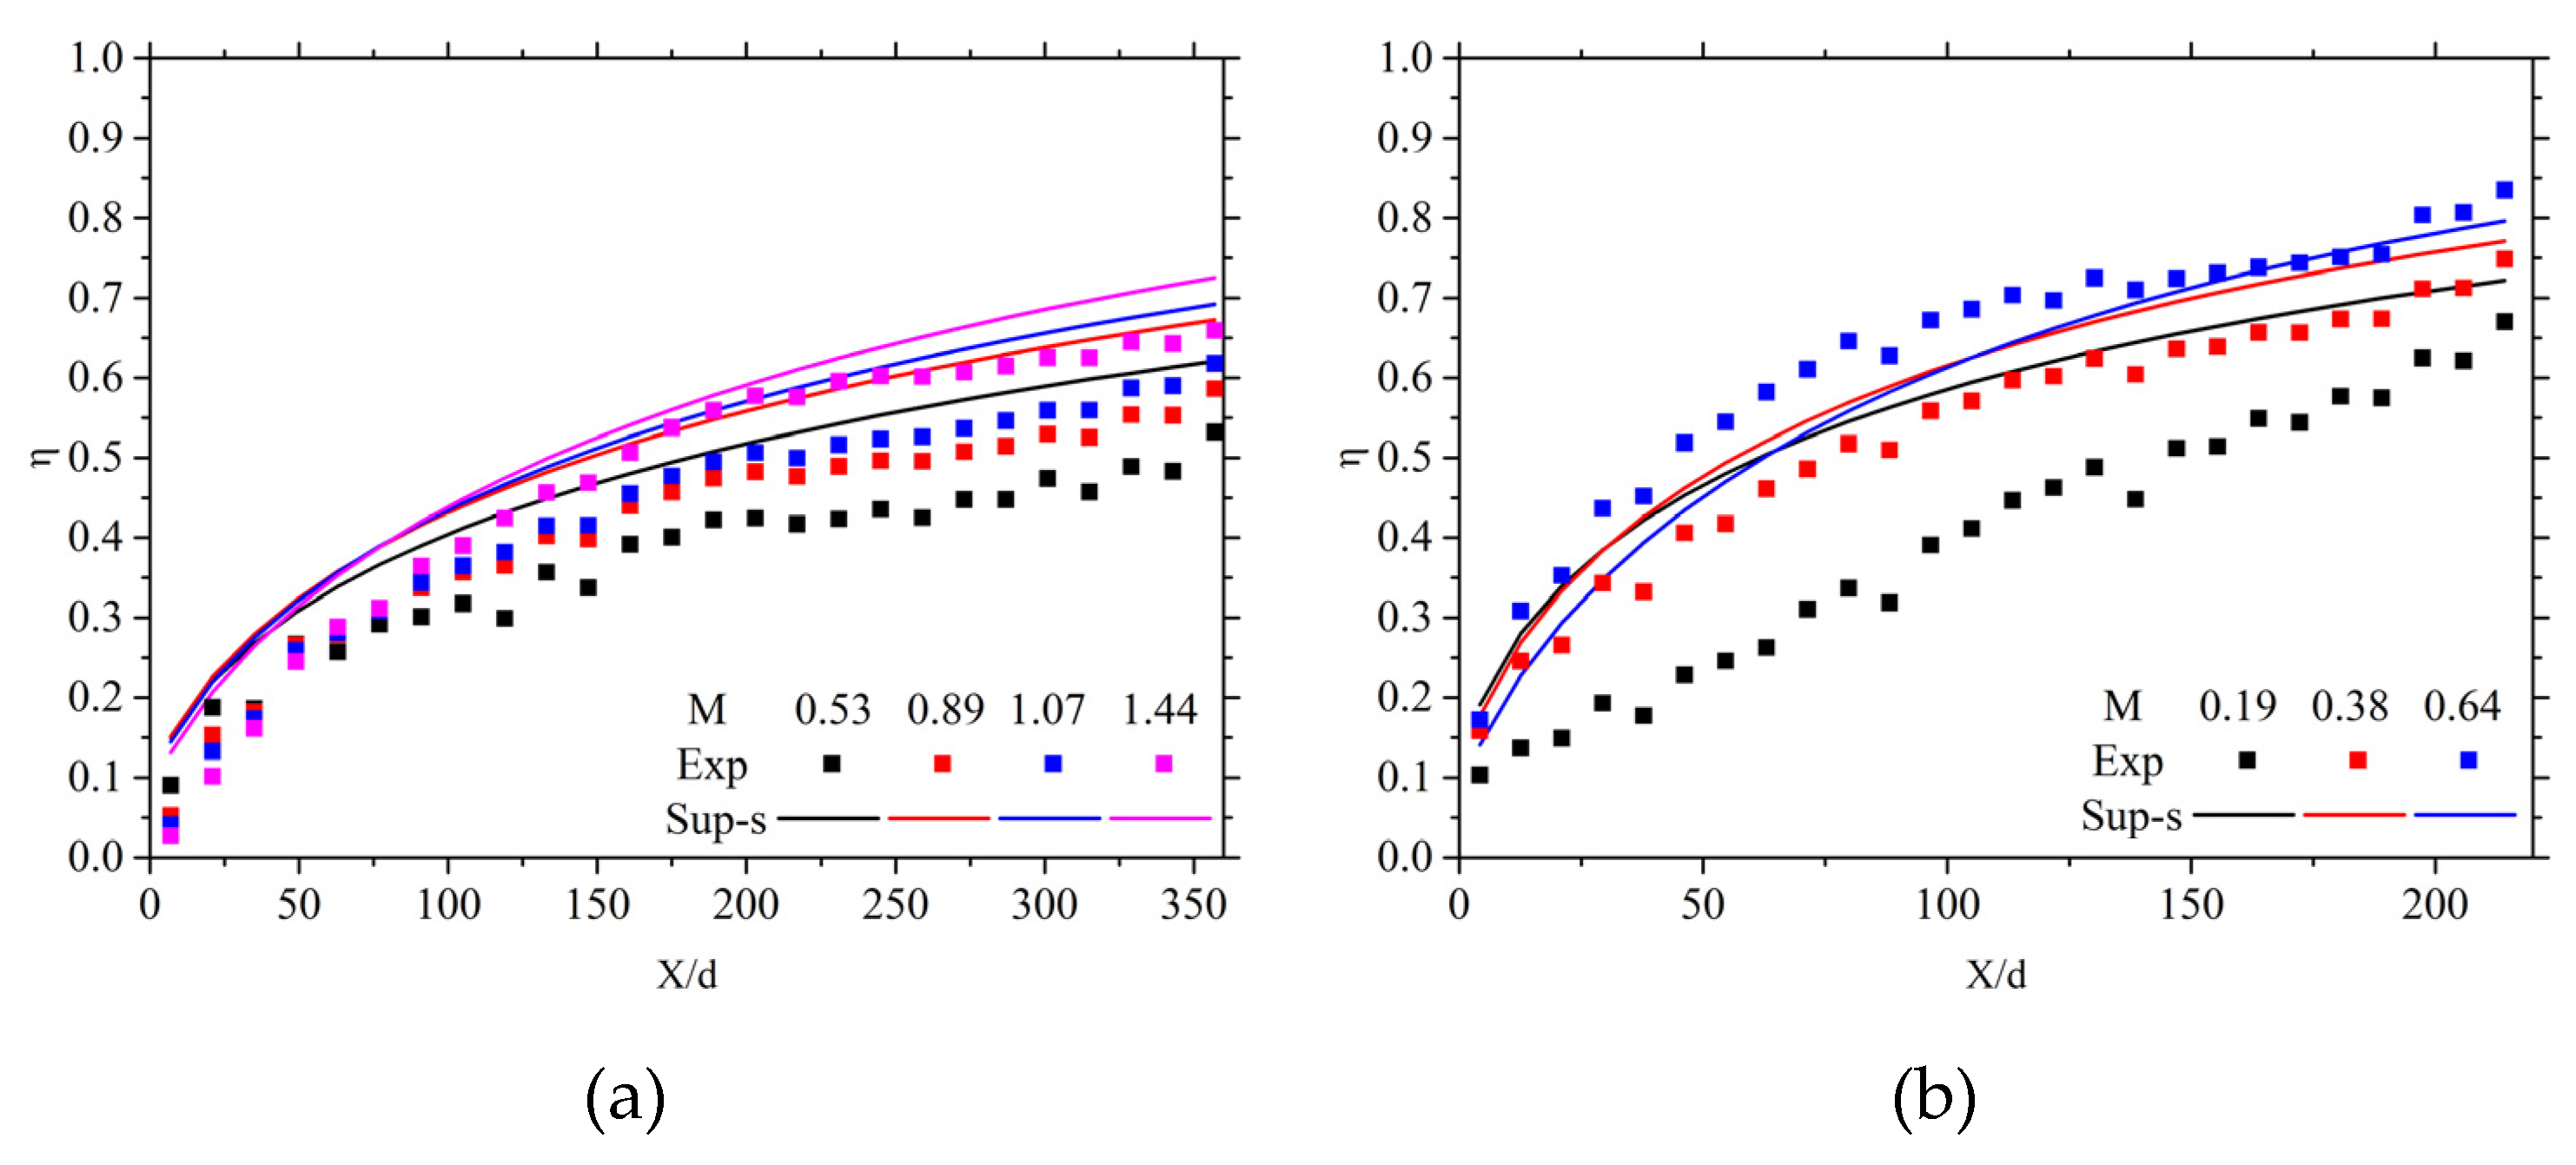
Figure 12.
Comparison of the mainstream temperature correction model predicted cooling efficiency and experimental results along the centerline for different test plates. (a) Case 1. (b) Case 2. (c) Case 3. (d) Case 4.
Figure 12.
Comparison of the mainstream temperature correction model predicted cooling efficiency and experimental results along the centerline for different test plates. (a) Case 1. (b) Case 2. (c) Case 3. (d) Case 4.
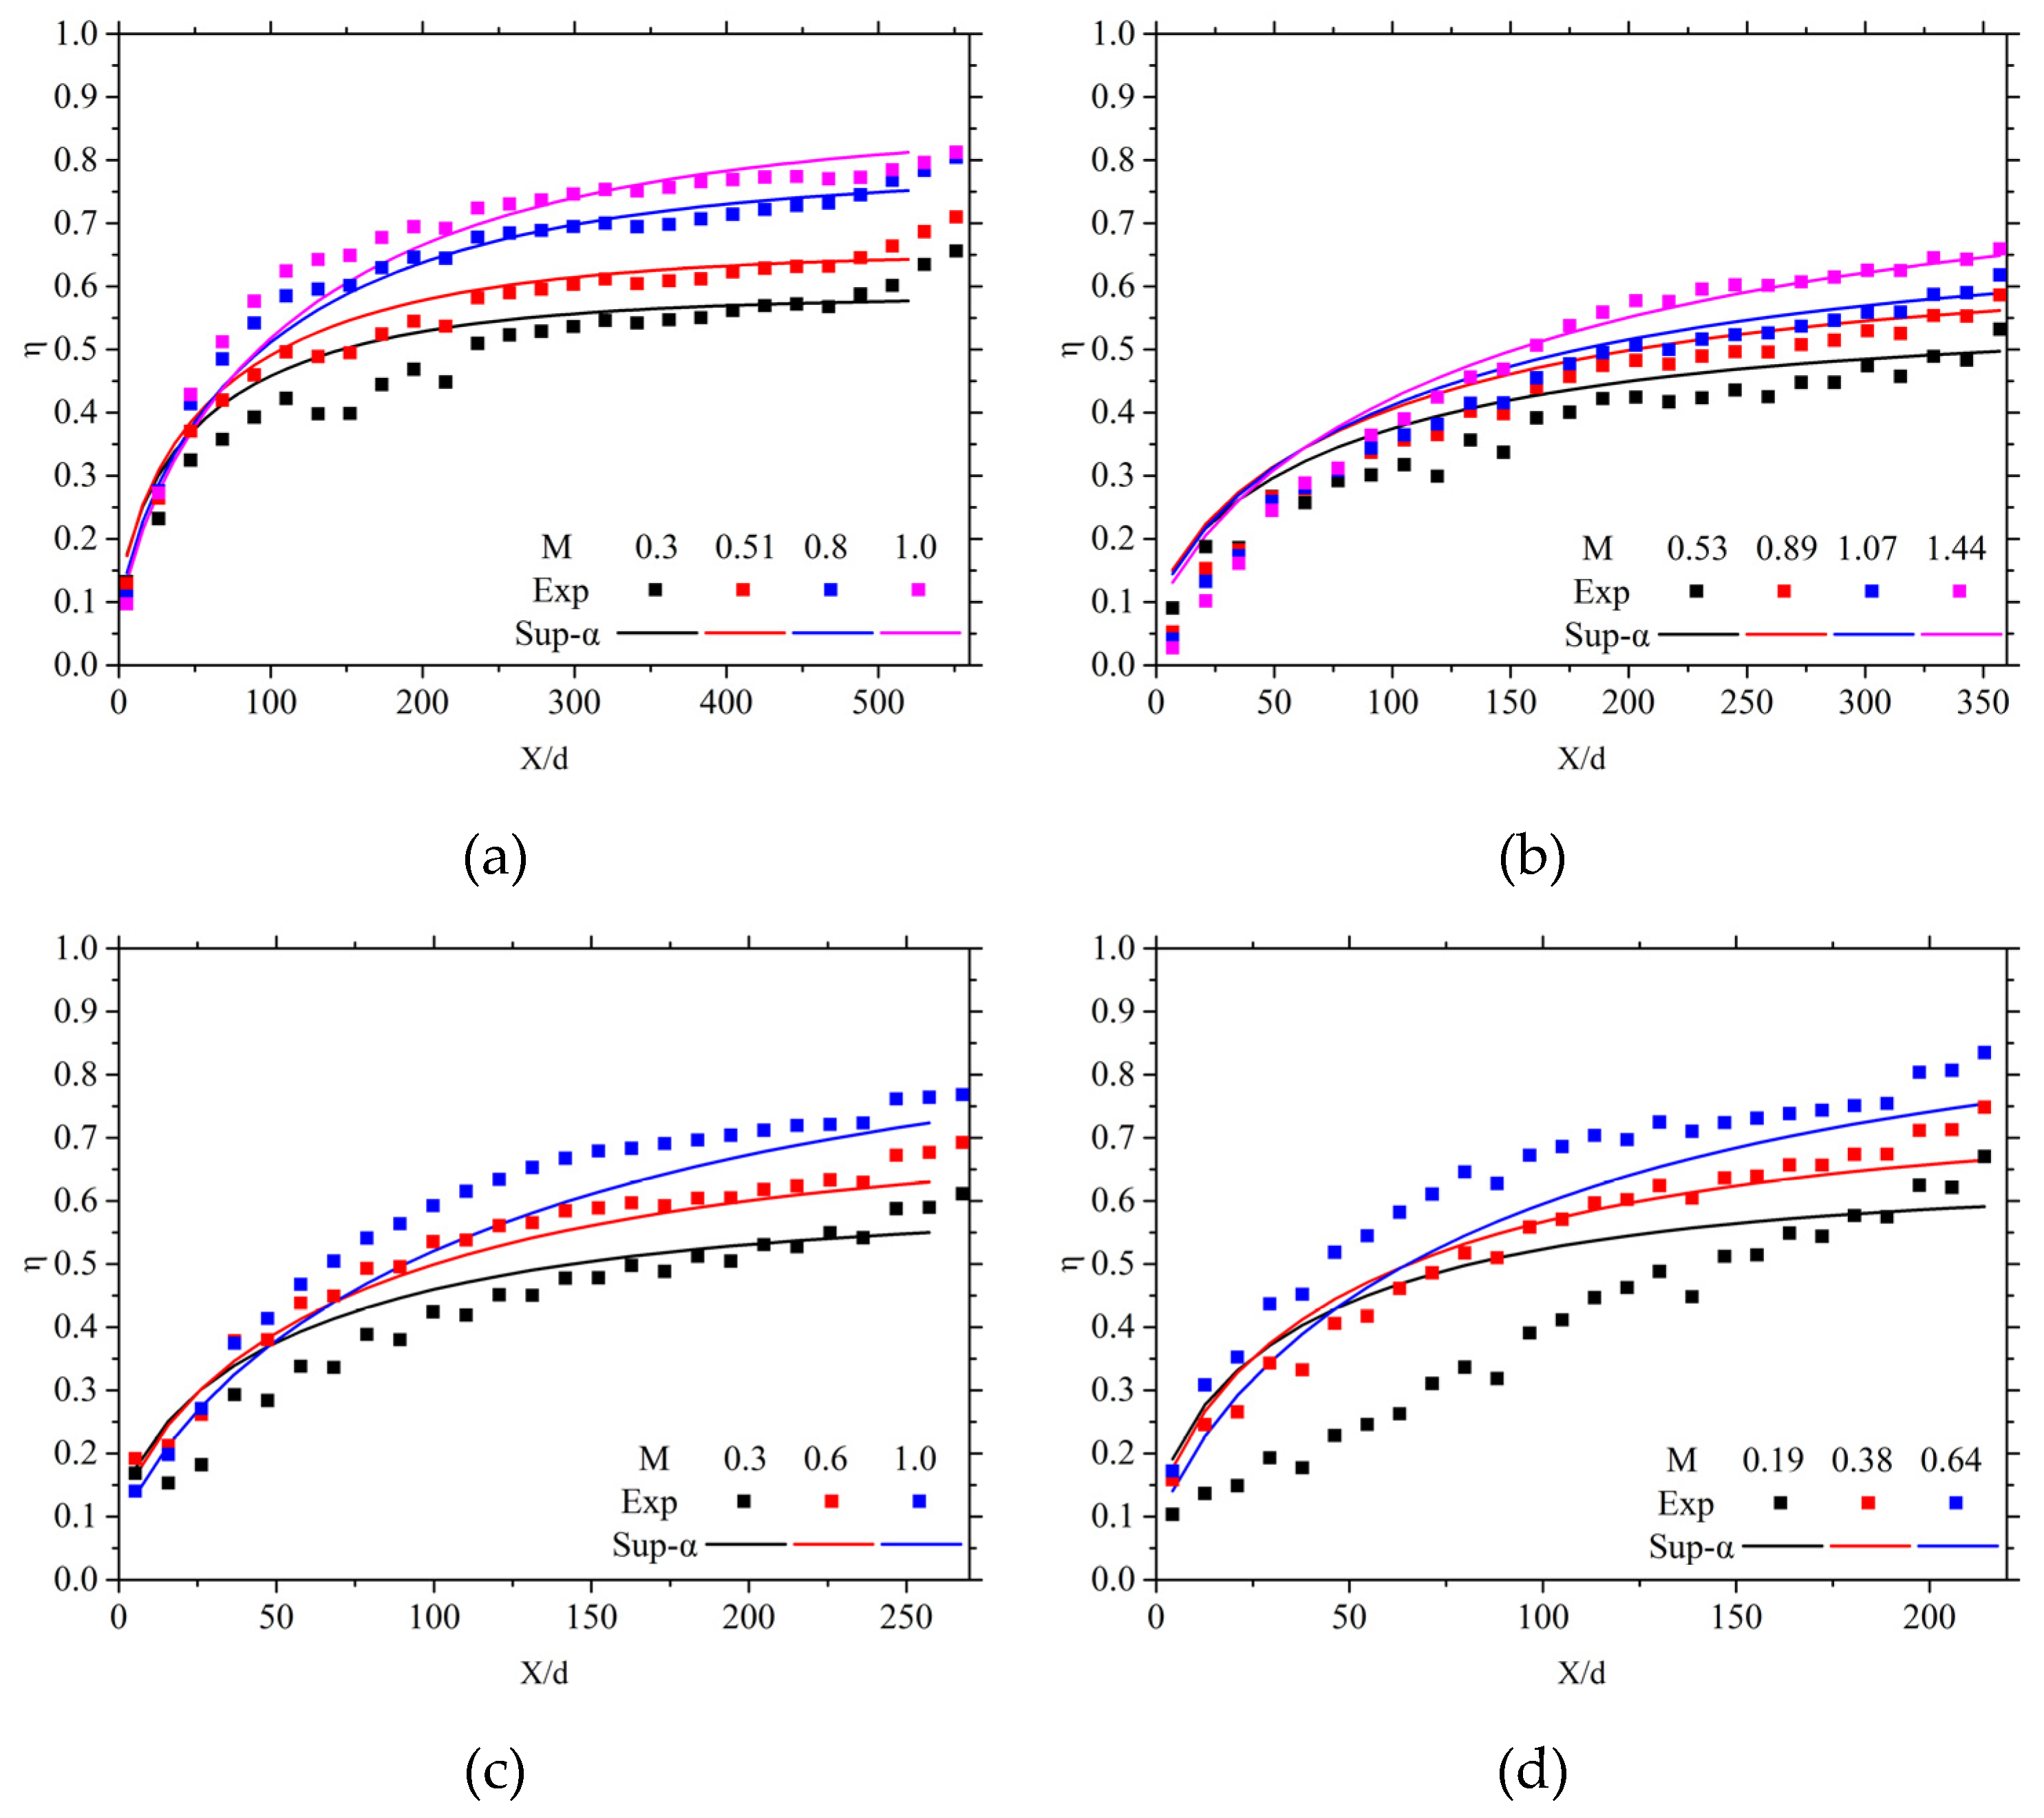
Figure 13.
Comparison of the mainstream temperature correction model predicted cooling efficiency and experimental spanwise-average cooling effectiveness for different test plates. (a) Case 1. (b) Case 2. (c) Case 3. (d) Case 4.
Figure 13.
Comparison of the mainstream temperature correction model predicted cooling efficiency and experimental spanwise-average cooling effectiveness for different test plates. (a) Case 1. (b) Case 2. (c) Case 3. (d) Case 4.
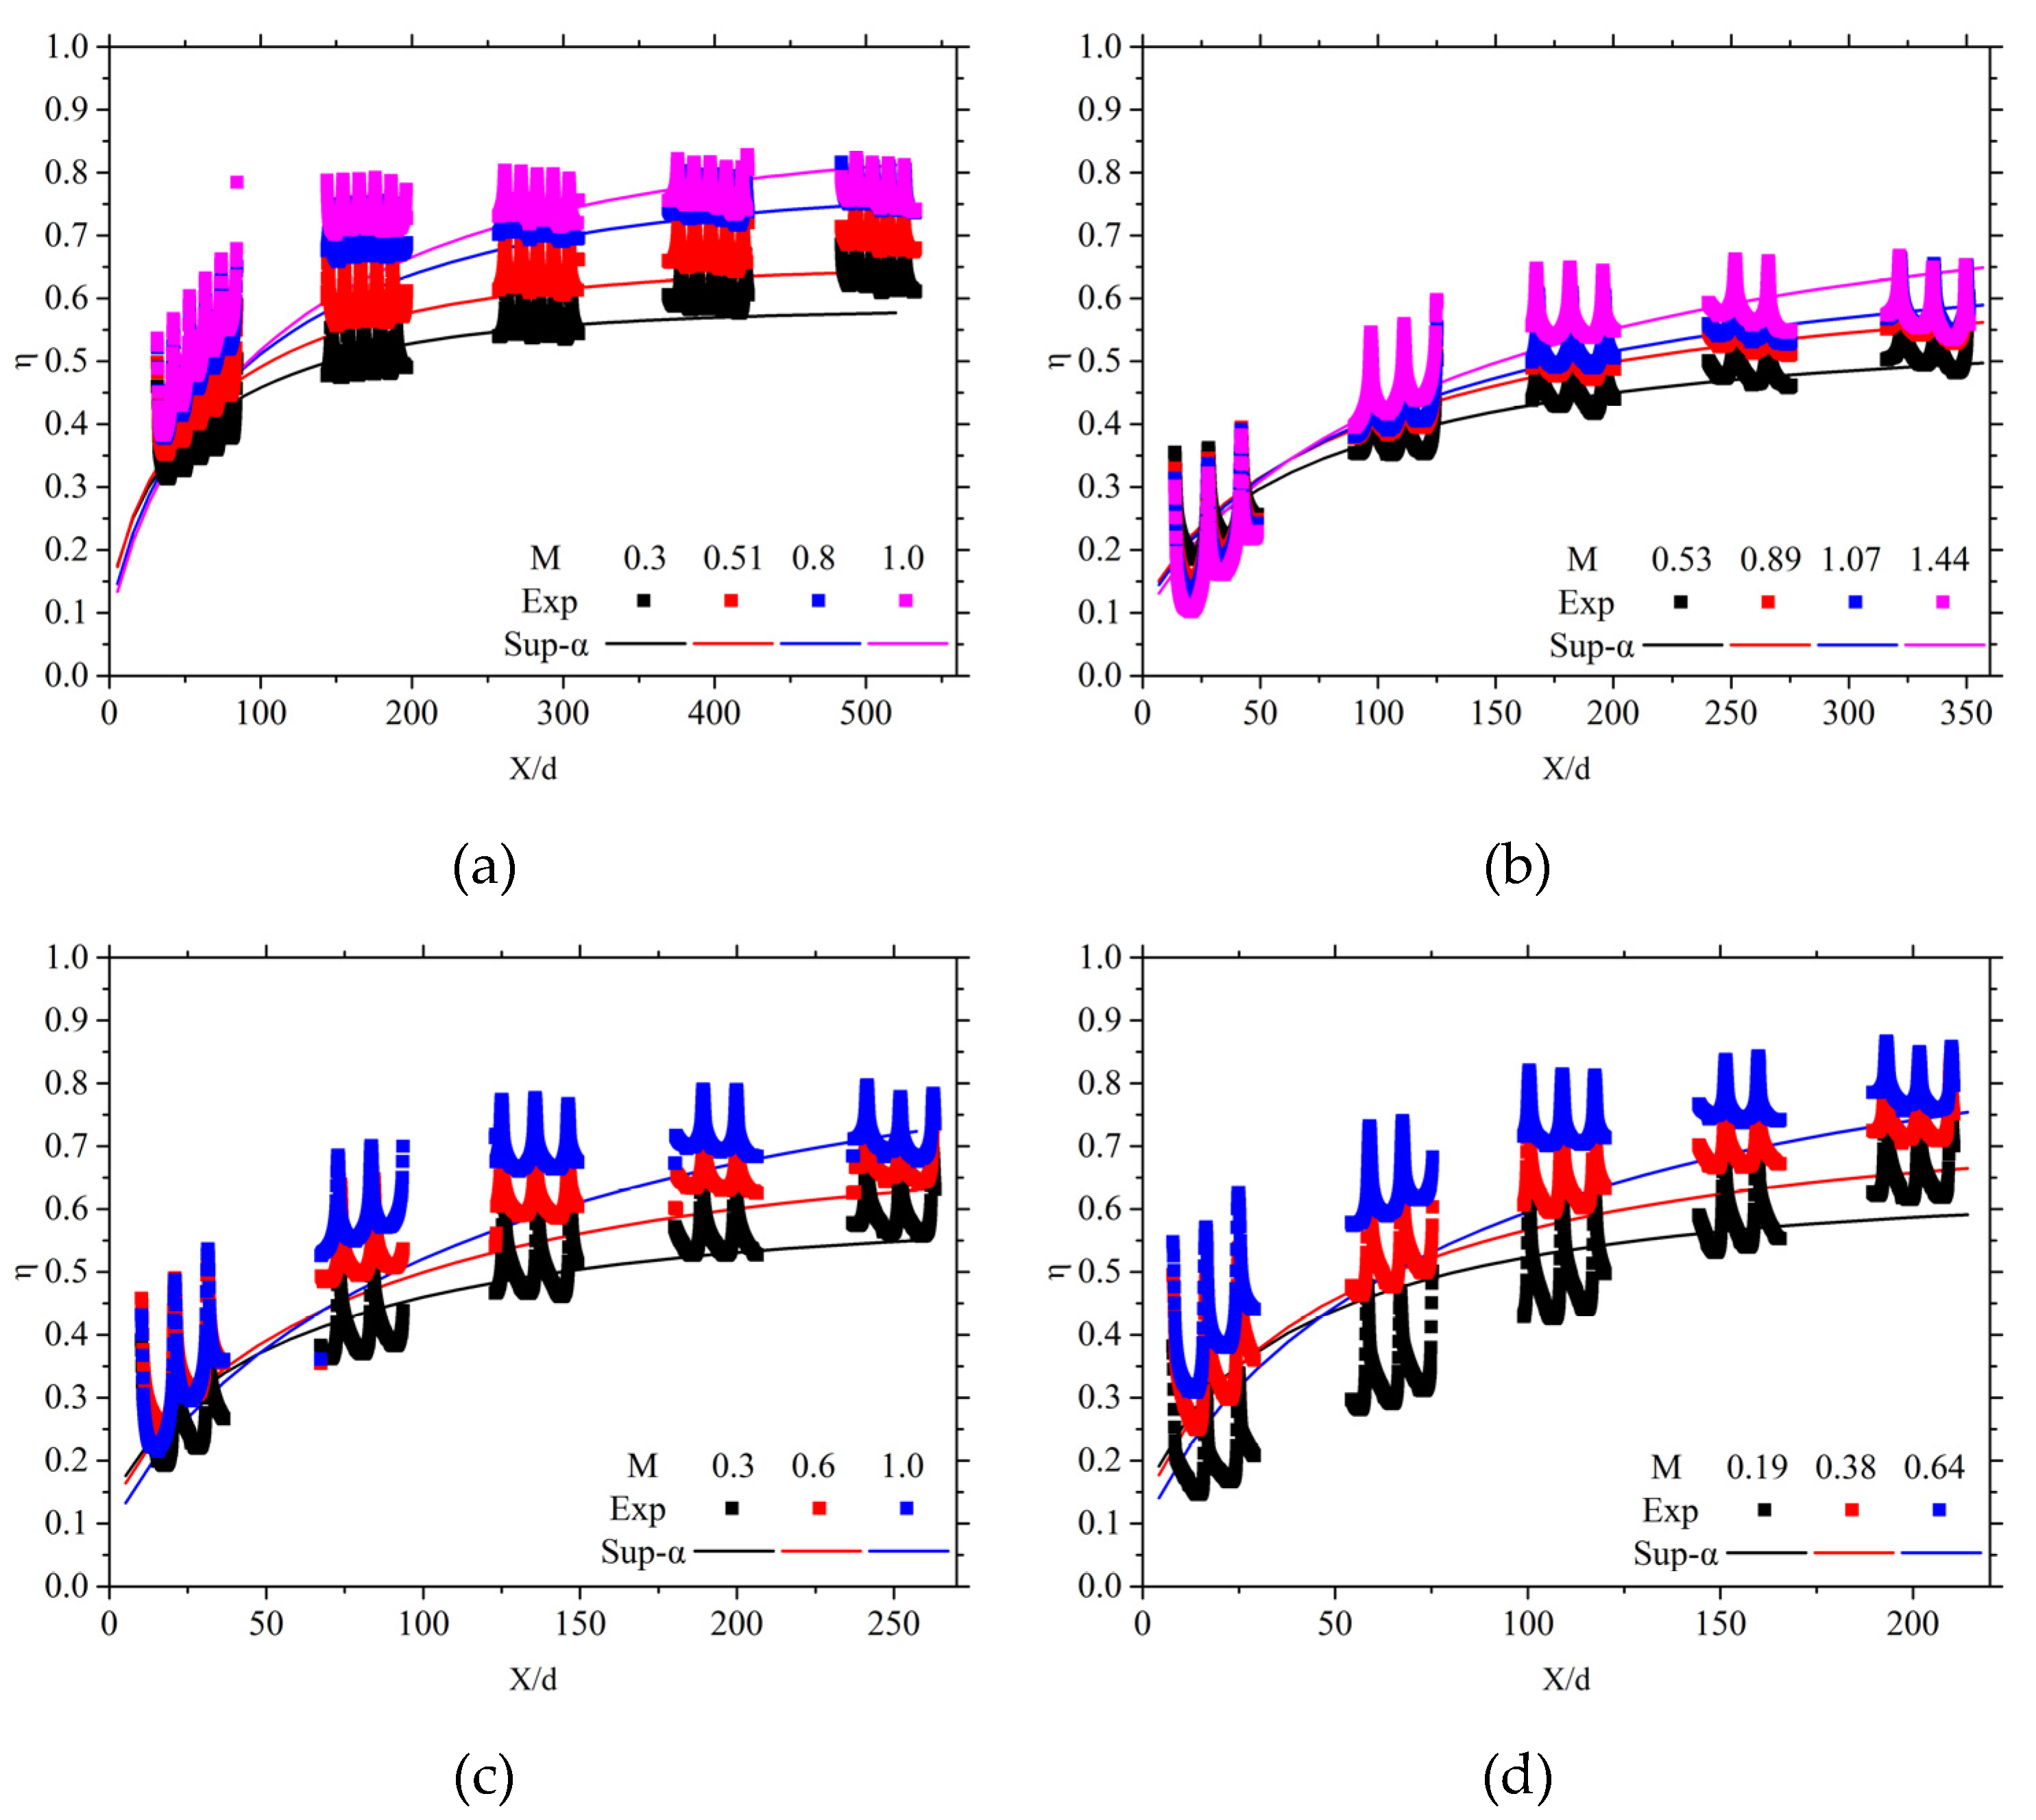
Figure 14.
Comparison of the mainstream temperature correction model predicted cooling efficiency and experimental area-average cooling effectiveness for different test plates. (a) Case 1. (b) Case 2. (c) Case 3. (d) Case 4.
Figure 14.
Comparison of the mainstream temperature correction model predicted cooling efficiency and experimental area-average cooling effectiveness for different test plates. (a) Case 1. (b) Case 2. (c) Case 3. (d) Case 4.
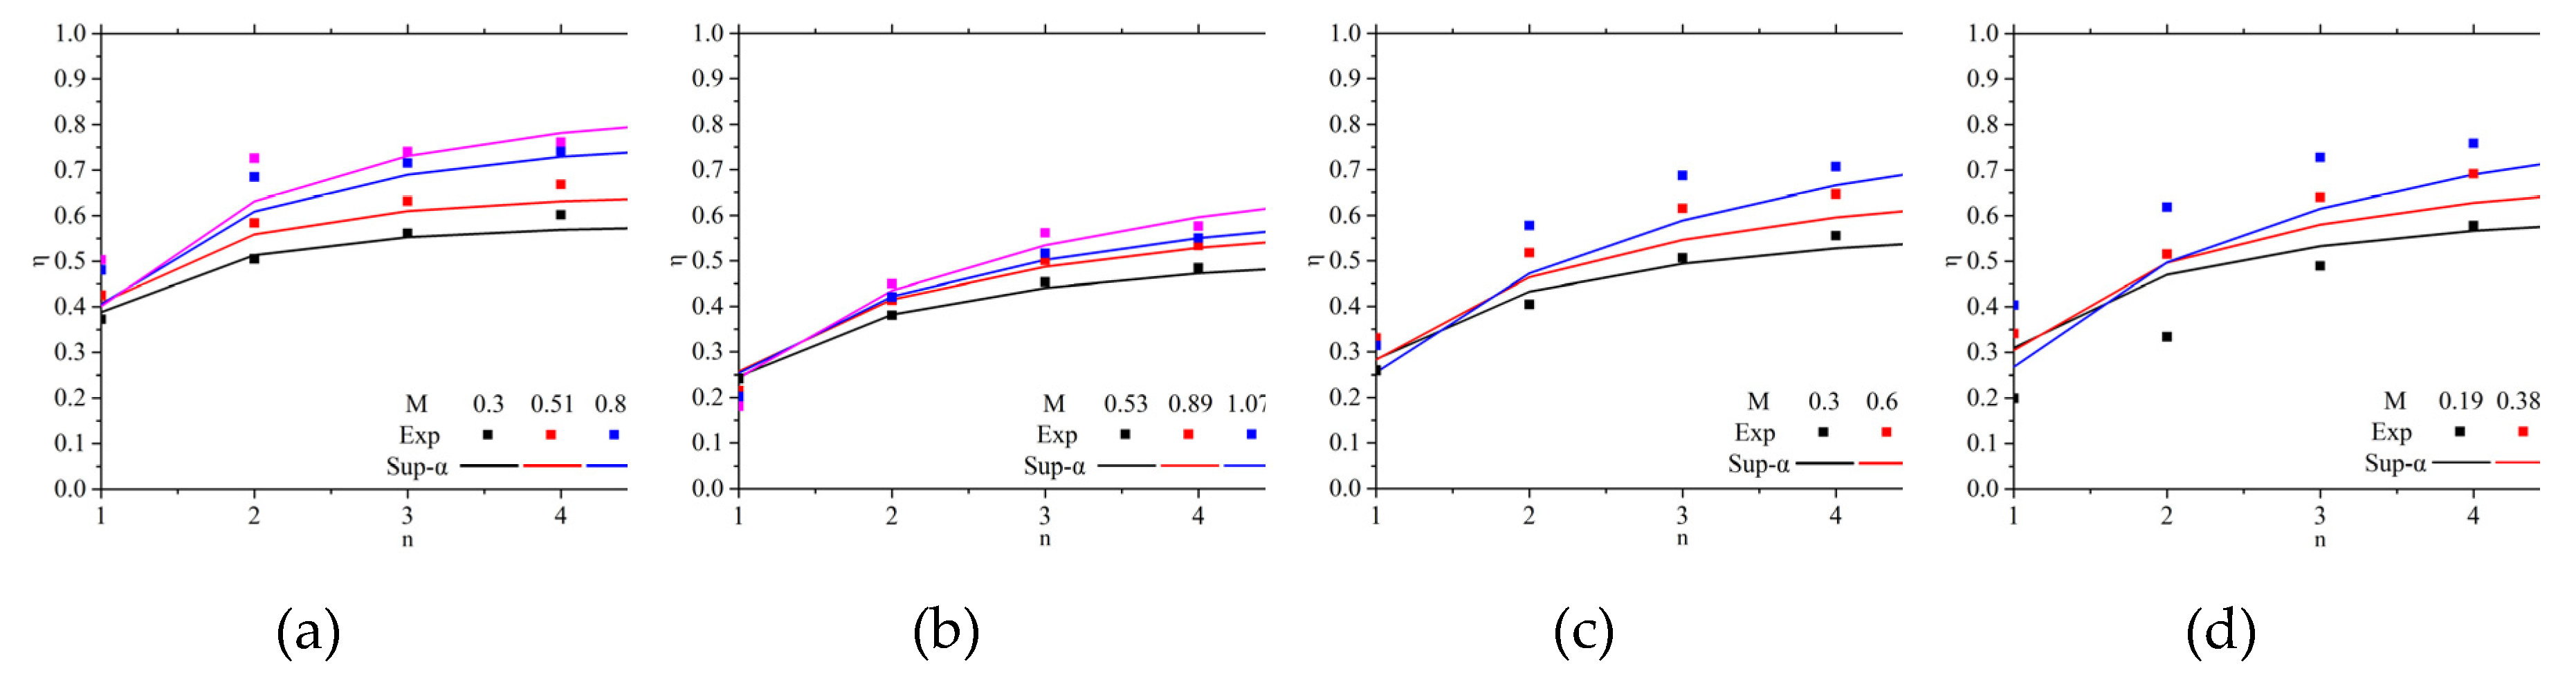
Figure 15.
Prediction deviations of area-averaged cooling effectiveness for different test plates. (a) Case 1. (b) Case 2. (c) Case 3. (d) Case 4.
Figure 15.
Prediction deviations of area-averaged cooling effectiveness for different test plates. (a) Case 1. (b) Case 2. (c) Case 3. (d) Case 4.
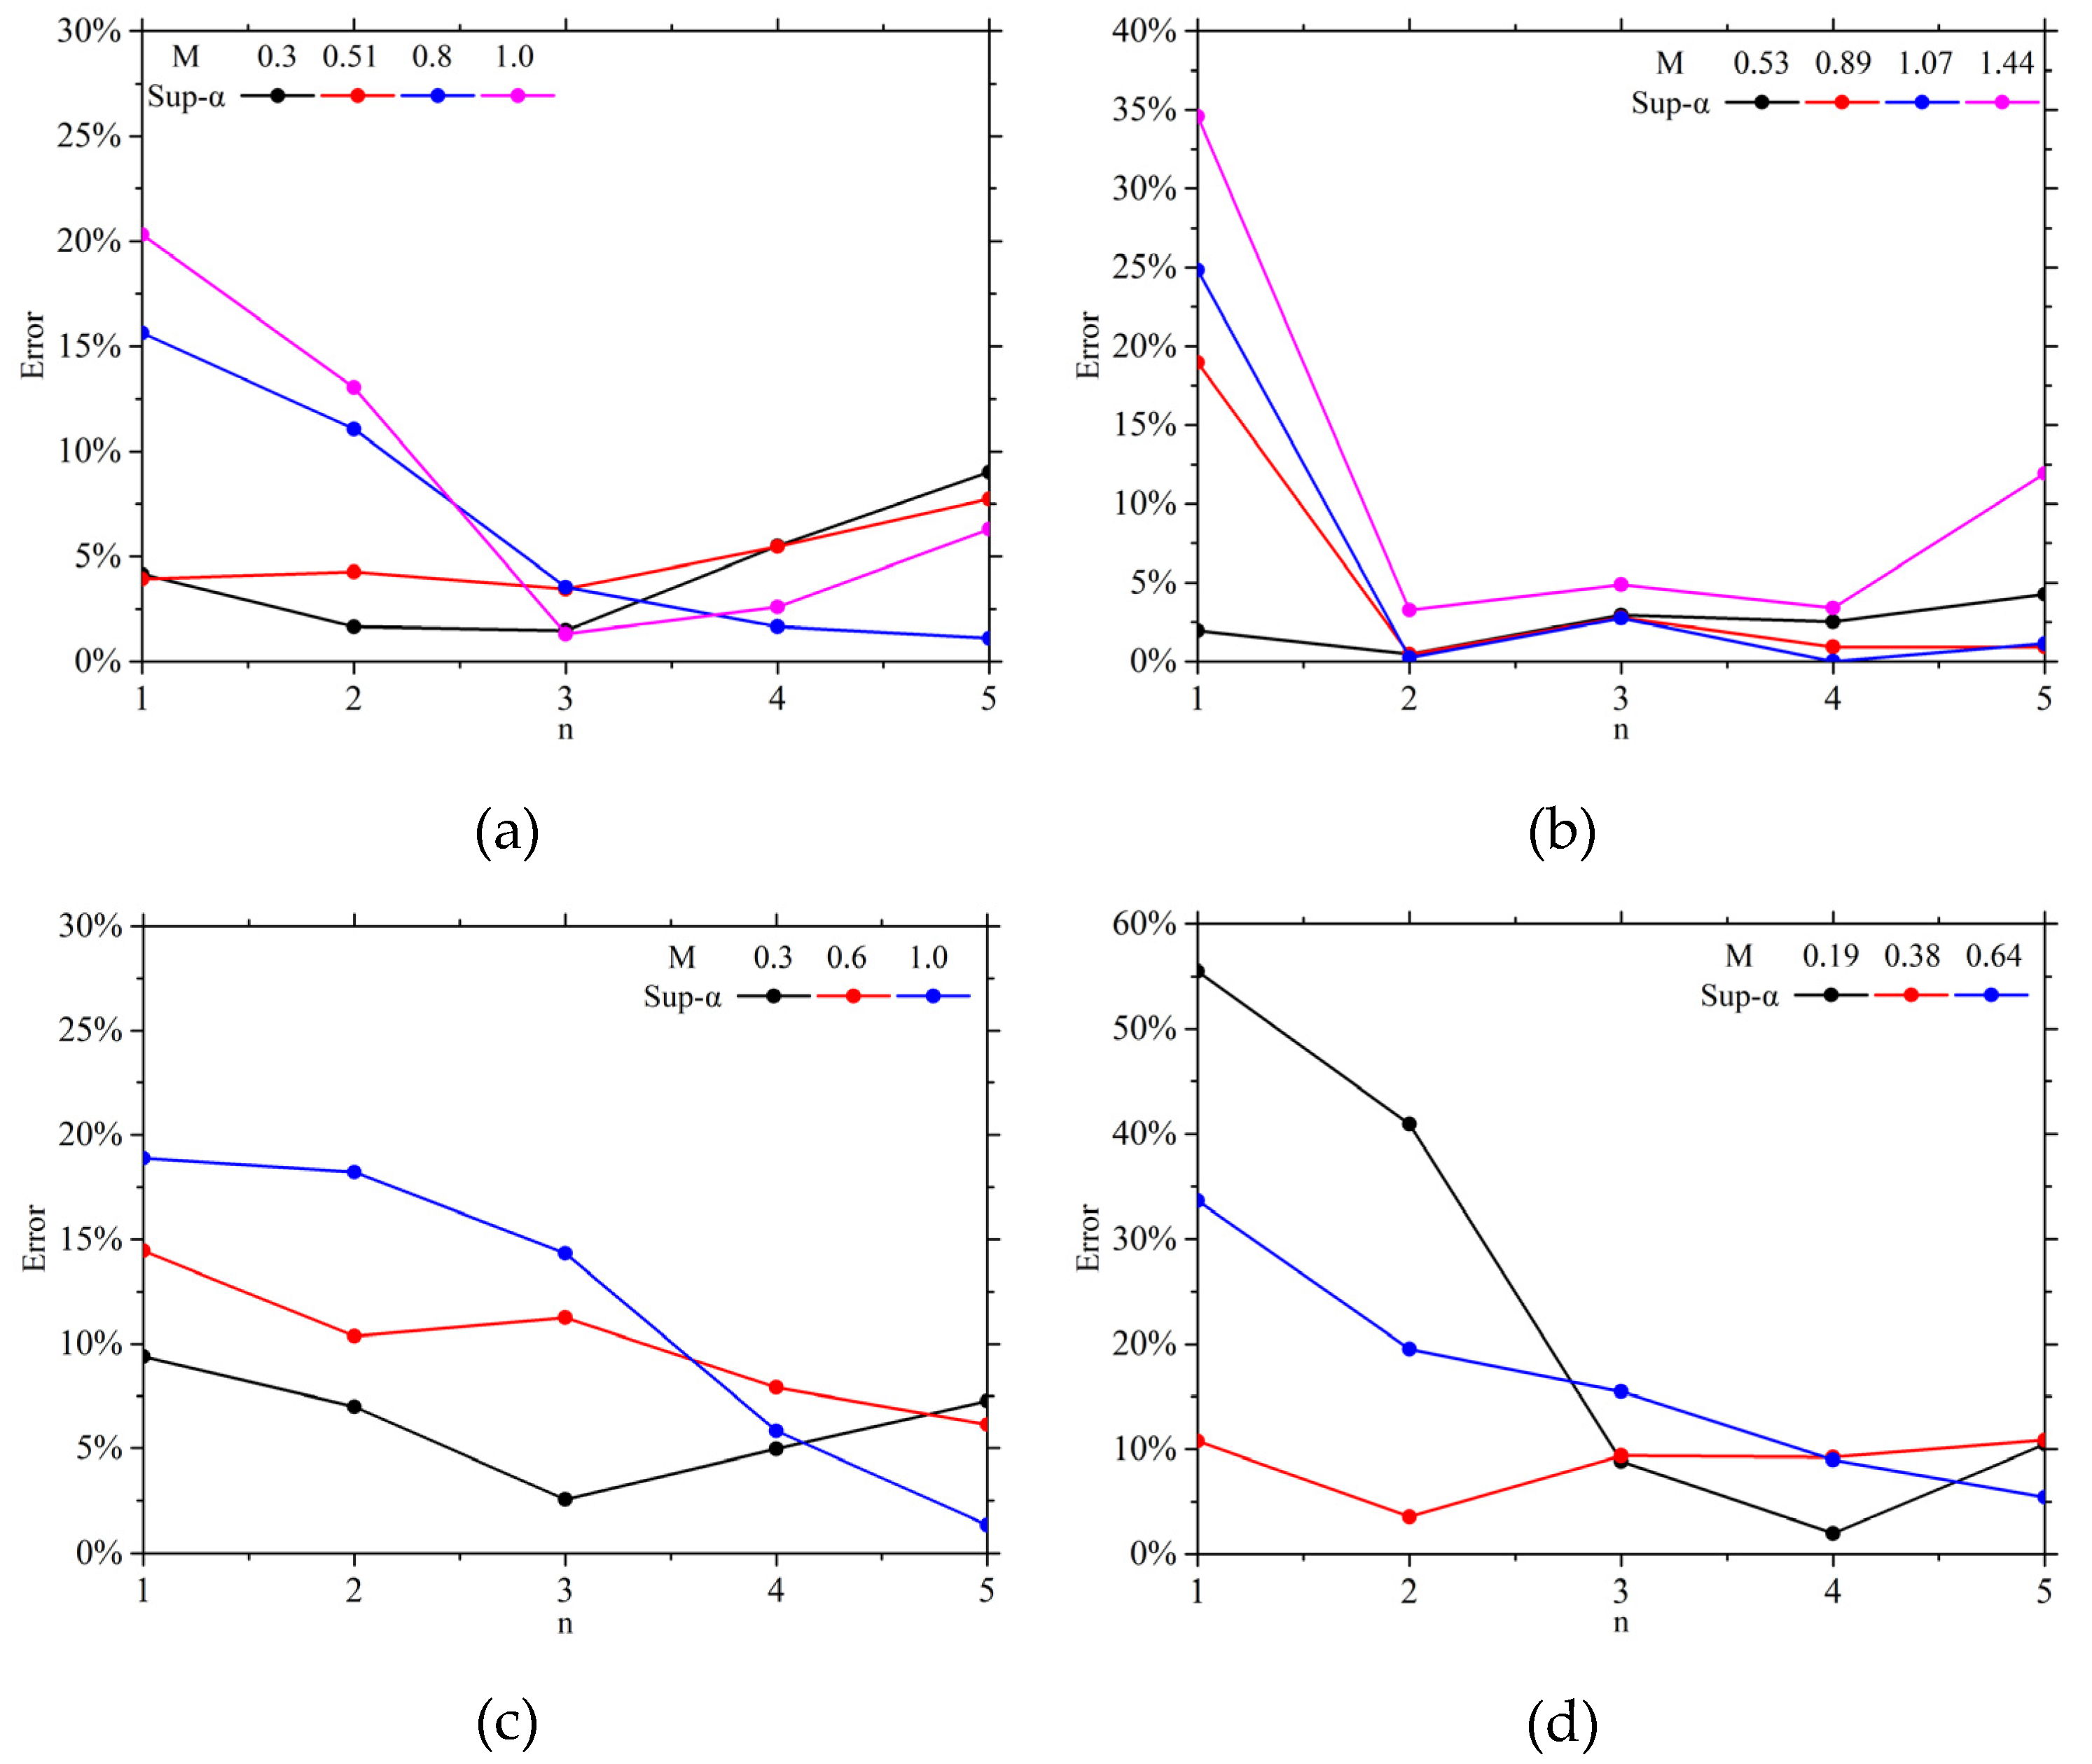
Figure 16.
Comparison of different models' predictions of cooling efficiency along the centerline for Case 1. (a) This study's predictive model. (b) Predictive models from the literature.
Figure 16.
Comparison of different models' predictions of cooling efficiency along the centerline for Case 1. (a) This study's predictive model. (b) Predictive models from the literature.
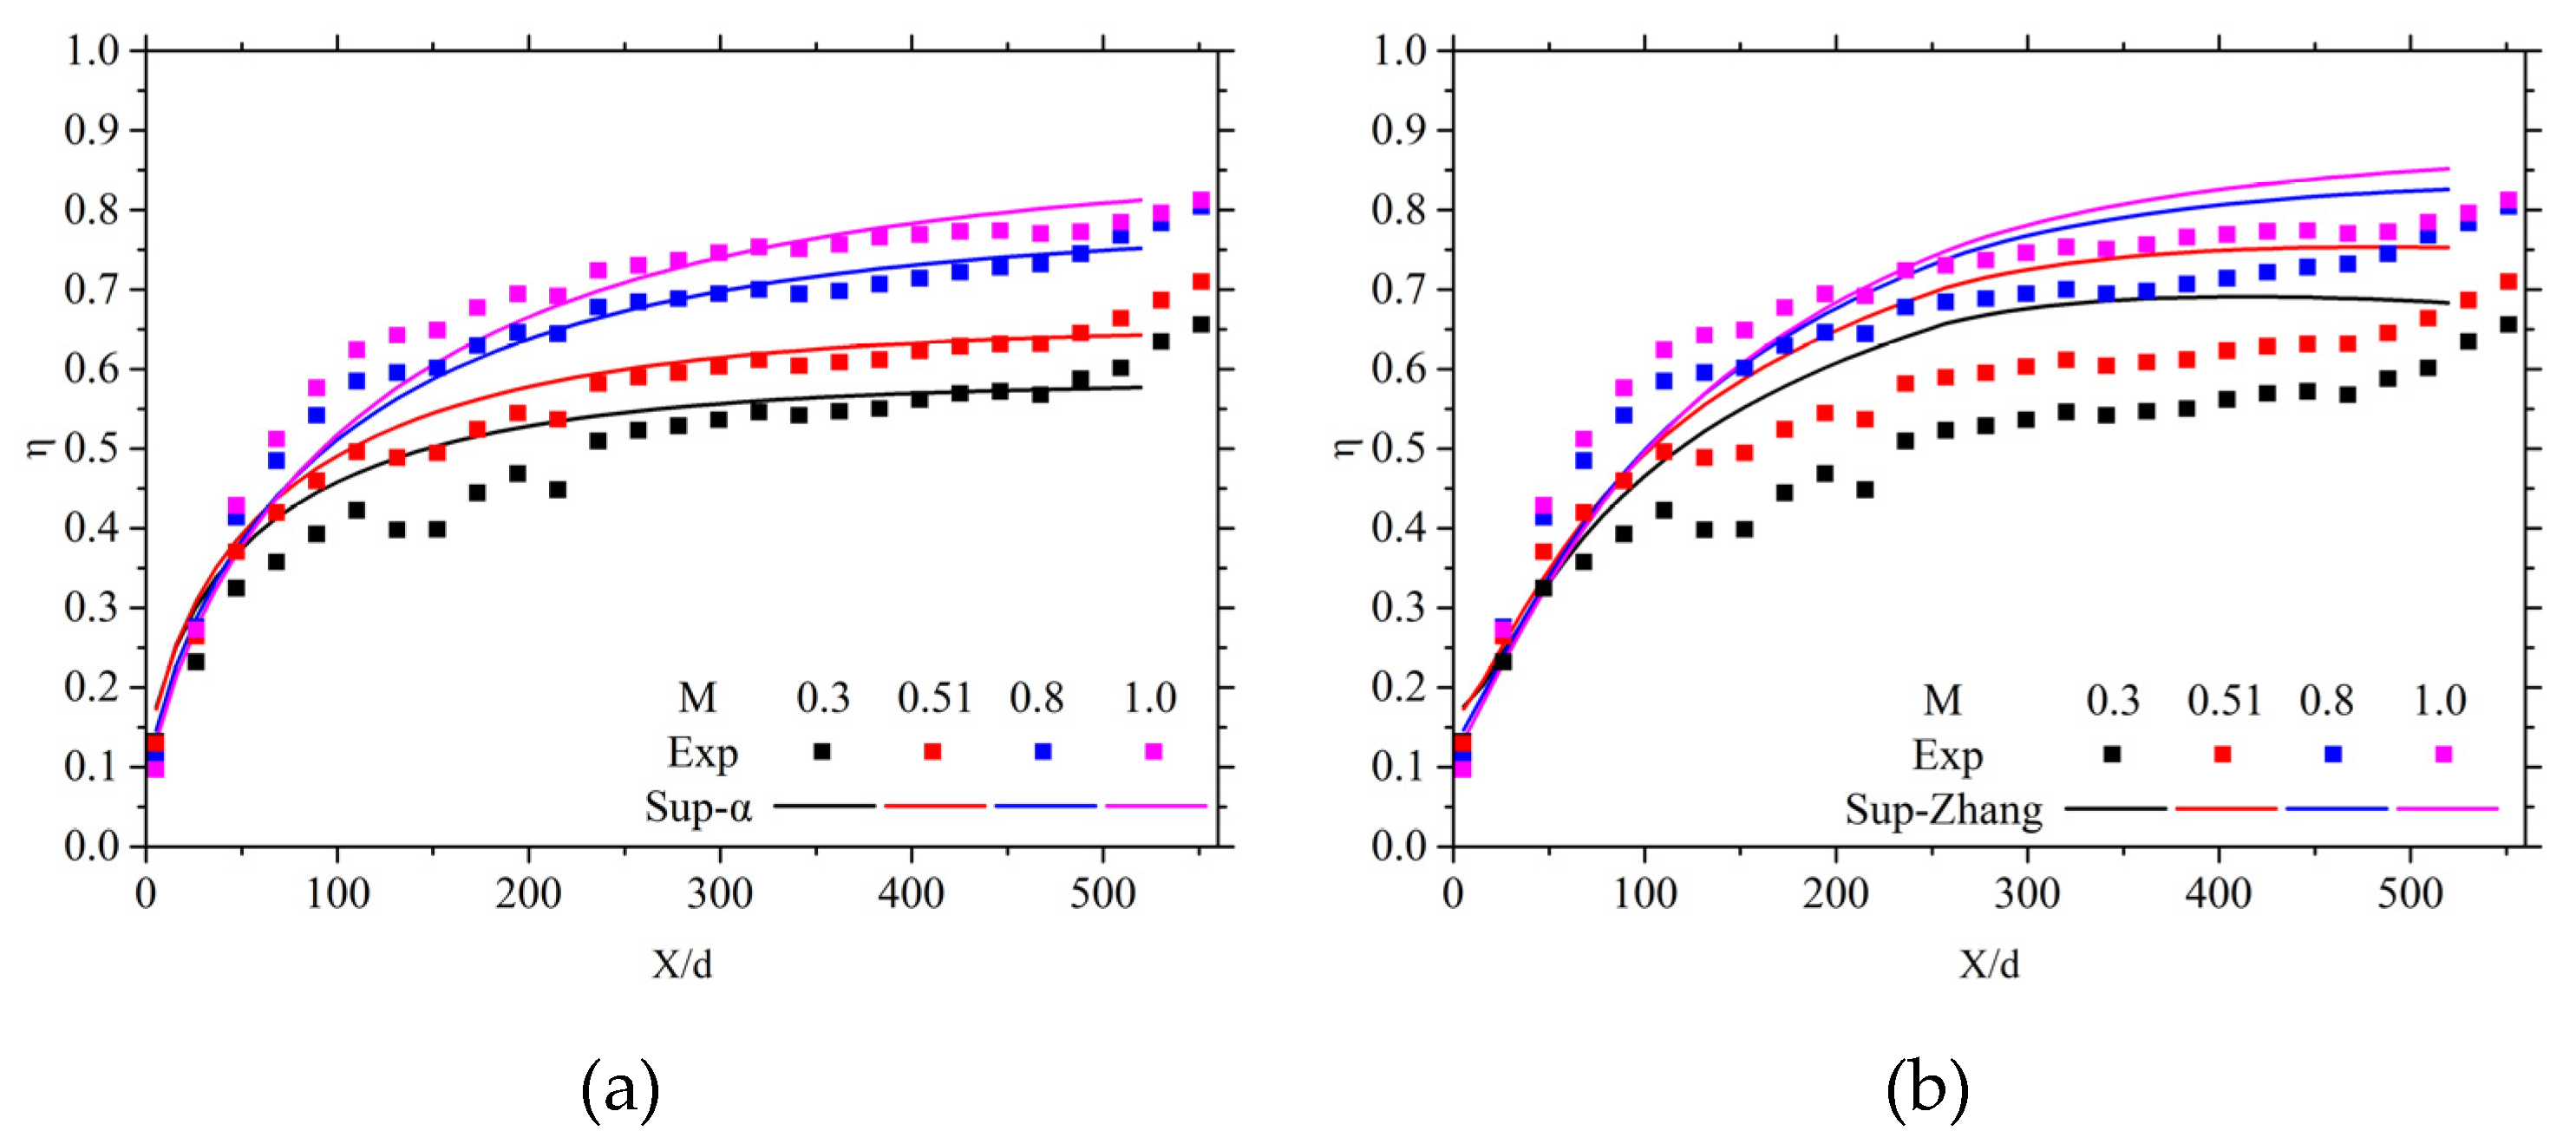
Figure 17.
Comparison of different models' predictions of cooling efficiency along the centerline for case 14 in the literature. (a) This study's predictive model. (b) Predictive models in the literature.
Figure 17.
Comparison of different models' predictions of cooling efficiency along the centerline for case 14 in the literature. (a) This study's predictive model. (b) Predictive models in the literature.
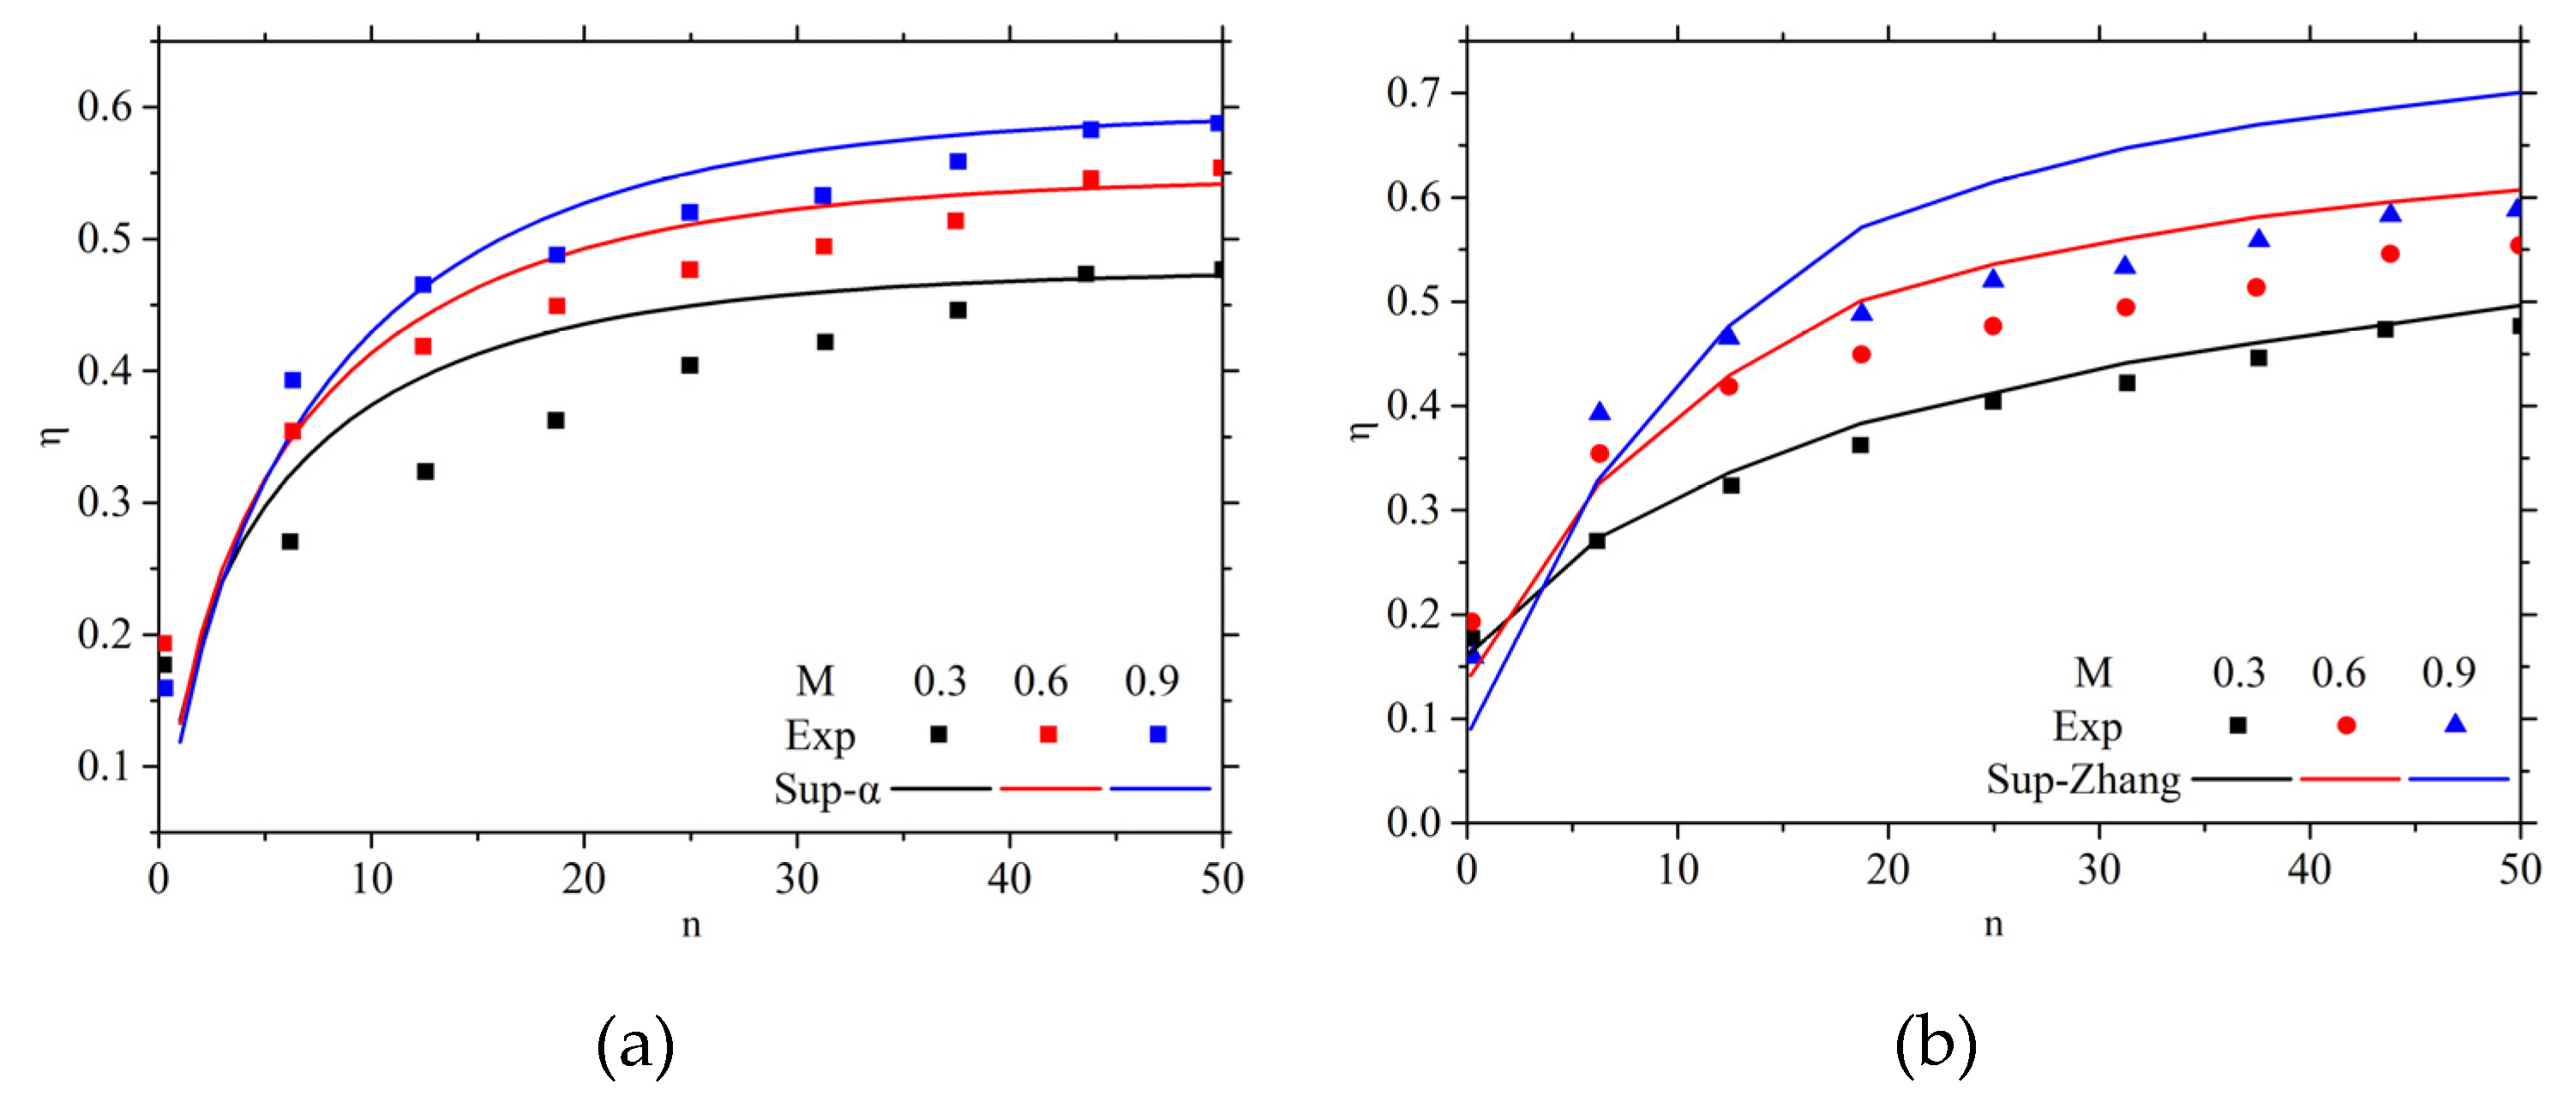

Table 1.
Structural parameters of test plates.
| d(mm) | L*W*H(mm) | |||
| Case1 | 1.2 | 710*110*17 | 3.5 | 10.5 |
| Case2 | 1.8 | 4.7 | 14 | |
| Case3 | 2.4 | 3.5 | 10.5 | |
| Case4 | 3.0 | 2.8 | 8.4 |
Table 2.
Empirical coefficient a and b.
| a | b |
| 12 | 0.9465 |
Table 3.
Comparison of area-averaged cooling efficiency forecast deviations.
| Predictive Model | Case1 in this study | Case14 in Zhang’s study | |||||
| M=0.3 | M=0.5 | M=0.8 | M=1.0 | M=0.3 | M=0.6 | M=0.9 | |
| This Study | 7.3% | 3.4% | -0.8% | -2.1% | 9.7% | 3.4% | 2.2% |
| Zhang et al. [32] | 22.8% | 16.1% | 5.4% | 0.5% | 3.0% | 8.0% | 12.7% |
Disclaimer/Publisher’s Note: The statements, opinions and data contained in all publications are solely those of the individual author(s) and contributor(s) and not of MDPI and/or the editor(s). MDPI and/or the editor(s) disclaim responsibility for any injury to people or property resulting from any ideas, methods, instructions or products referred to in the content. |
© 2024 by the authors. Licensee MDPI, Basel, Switzerland. This article is an open access article distributed under the terms and conditions of the Creative Commons Attribution (CC BY) license (http://creativecommons.org/licenses/by/4.0/).
Copyright: This open access article is published under a Creative Commons CC BY 4.0 license, which permit the free download, distribution, and reuse, provided that the author and preprint are cited in any reuse.


