
Submitted:
15 November 2024
Posted:
15 November 2024
You are already at the latest version
Abstract
This study aimed to determine the extent to which explosive and reactive strength of the lower limbs, as well as acceleration in running and skating speed, predict figure skating competition results in youth skaters. Talented figure skaters aged 8 to 16 years (n=211) were divided into two groups: Group 1 (Basic novice; age: 10.38 ± 1.10 yrs., height: 138.89 ± 7.26 cm, weight: 32.75 ± 4.63 kg) and Group 2 (Advanced novice and Junior; age: 13.02 ± 1.06 yrs., height: 152.7 ± 8.18 cm, weight: 42.73 ± 7.62 kg). Fifteen physical fitness variables were measured using tests such as the Repeated Vertical Jump, Standing Long Jump, Triple Jump (right/left leg), 15-m running sprint, and 15-m skating sprint. Competition results were recorded according to the International Skating Union Code of Points. The Principal Component Analysis reduced the 15 variables to four principal components, explaining 84-87% of the variance. Linear regression models showed that these components significantly explained the variability in the competition scores for both groups. For Group 1, R² ranged from 0.298 to 0.425, while for Group 2, it ranged from 0.086 to 0.237. Pearson’s R was higher for mean of season best score than for the National Championship score. The relative importance of these factors varied across age groups. These findings highlight the need for tailored on- and off-ice training focusing on locomotion and acceleration for younger skaters and dynamic jump training for older skaters.
Keywords:
sport performance
; sport training
; physical fitness
; lower limbs
; explosive strength
1. Introduction
Figure skating is an elegant and captivating sport that seamlessly blends artistic expression, athleticism, and grace on the ice. At the professional and performance levels, figure skating requires intensive training and long-term specialized preparation [1]. To excel, figure skaters need a combination of anthropometric and physical characteristics, including flexibility, strength, power, cardiovascular endurance, agility, speed, coordination, balance, and spatial awareness [2,3]. The ideal combination of these characteristics can vary between skaters, often leading coaches to tailor training programs based on athletes’ individual strengths and weaknesses. However, skaters who have a well-rounded combination of these attributes are better positioned for success in figure skating competitions [4]. Additionally, specific physical demands can differ across disciplines such as men’s singles, women’s singles, pairs, and ice dance [5].
Since 2004, the single men’s and women’s disciplines of figure skating, pair skating, ice dancing, and synchronized skating have been judged using the International Skating Union (ISU) judging system, also known as the International Judging System (IJS). The introduction of the IJS made the scoring system less vulnerable to manipulation and more objective. Furthermore, significant improvements in skating technique have been observed in competitions following the implementation of the IJS. In particular, jumps and spins have become more daring, intricate, and dynamic in competitions [6,7] Jumps play a critical role in competitive figure skating as skaters who perform more complicated and complex elements earn higher scores [8]. These visually captivating maneuvers require explosive strength, precision, and grace for successful execution [3]. Lower limb explosive strength directly impacts jump quality, contributing to overall performance and scoring [9]. Strong lower limbs allow figure skaters to achieve good jump height and length, control rotations, and stabilize landings. Good balance during landing prevents falls, facilitates smooth transitions to the next element, and maximizes points in competitions [10,11].
It has also been documented in elite figure skaters that the age at which women reach peak performance (20.4 ± 3.4 years) has decreased and that the number of double jumps has decreased significantly in favor of triple or quadruple jumps [7]. These highlights increase pressure on early specialization, particularly among female skaters, and increase demands on the difficulty of individual elements of figure skating performance, especially the number of jump rotations. Therefore, efficient training with greater overall intensity is required to elevate physical fitness and technical proficiency of figure skaters [7,12].
Although coaches regularly assess the technique of figure skaters in almost every training session, the level and changes in physical prerequisites for figure skaters’ performance remain somewhat hidden. To address this issue, coaches need to focus on other key areas, such as uncovering hidden physical factors related to sports performance during long-term athlete development. A few cross-sectional and longitudinal studies on figure skaters focus on changes in physical qualities during growth and development and their potential in talent identification. Mostaert et al. [13] identified specific anthropometric, physical, coordination and ice-skating characteristics that discriminate young elite from nonelite figure skaters aged 9 to 12 years. They found no difference between the elite and nonelite groups regarding maturity status and anthropometric or physical parameters. However, elite skaters scored better than nonelites in coordination tests for jumping sideways and tended to do so on the moving sideways test. Importantly, the finding suggests that none sport-specific motor coordination tests allow discrimination between elite and nonelite skaters and can aid in talent detection and identification among young ice skaters. In a recent study [4], the authors compared the anthropometric and physical fitness parameters of elite 11 to 16-year-old female and male figure skaters. They concluded that an evaluation of the relationship between morphological characteristics and motor skills with specific field tests and standardized tests performed at regular intervals in young figure skating athletes can contribute to better selection of athletes, as well as to the effectiveness of their individual training preparation. In another study [5], off-ice physical qualities in 10 to 33-year-old athletes based on skating disciplines and levels were compared. The authors stated that the observed physical qualities varied significantly depending on the skating discipline and level and that senior and junior skaters tended to exhibit greater speed and strength than novice skaters. These results emphasized the need for strength and conditioning programs that reflect the specific demands of the discipline and the level of skaters. Furthermore, data obtained from off-ice testing can establish normative values for figure skaters. Cruz et al. [2] analyzed longitudinal changes in strength and agility in 9 to 25-year-old competitive single figure skaters, considering their competition levels. Skaters either remained at the same competitive on-ice level or progressed by one level in the consecutive seasons. Surprisingly, the most significant changes occurred in lower-level female skaters who remained at the same level. This finding underlines the importance of early participation in strength and conditioning programs to maximize athleticism before reaching the senior level, where off-ice performance improvements tend to plateau.
The studies mentioned above focused on various fitness parameters and anthropometric characteristics that describe young elite or non-elite figure skaters. However, studies analyzing the association between fitness parameters and success in competitions in figure skaters are missing. As far as we know, only one study [11] investigated the effects of lower limb strength and endurance on the quality of execution of single jumps (Axel jumps). The findings indicate that muscular strength and endurance have an effect on the training progress and performance of figure skating elements such as jumps. However, none of these studies specifically addresses the question of whether and to what extent fitness parameters influence a figure skater’s performance in competition. Therefore, our study aims to determine the extent to which explosive strength, reactive strength of the lower limbs, and acceleration in running and skating speed may predict the results of figure skating competitions, as evaluated according to the international rules of the ISU. The hypothesis of the study is that the results of physical fitness field tests may predict success in competitions in elite youth female and male figure skaters.
2. Materials and Methods
Participants
Elite female and male figure skaters aged 8 to 16 years (n=211) who took part in the Talented Youth Training Project of the Czech Figure Skating Association (CFSA) during the years 2011 to 2024 participated in this study. Figure skaters were divided into two groups by age. Group 1 Basic Novice (age 8 to 11 years), Group 2 Advanced Novice and Junior (age 12 to16 years). The exclusion criteria for the motor tests were absence of training in the last two weeks, health problems within six weeks before the measurements, and acute health problems at the time of measurement. The study adhered to the Declaration of Helsinki on the use of human subjects. The methods and procedures applied were carried out in accordance with the stated declaration. The legal guardians of all participants gave their informed written consent for participation in the CFSA Talented Youth Project. Participants and their legal guardians were fully informed about the testing procedures. Written informed consent was obtained from all parents and/or responsible adults.

Table 1.
Basic characteristics of Group 1 - Basic Novice and Group 2 - Advance Novice and Junior.
| Group 1 | Group 2 | |||||
| Age | BH (cm) | BM (kg) | Age | BH (cm) | BM (kg) | |
| Number of participants | 85 | 95 | ||||
| Average | 10.38 | 138.8932.75 | 13.02 | 152.75 | 42.73 | |
| Standard deviation | 1.10 | 7.26 | 4.63 | 1.06 | 8.18 | 7.62 |
Note: BH – body height, BM – body mass
Procedures
Participants were tested at the start of the competition period for one day. The day before the test session, participants were not subjected to high-intensity exercises. The off-ice tests were conducted in the indoor sports hall and took approximately 40 minutes; the indoor ice rink test included an initial ice training of 15 minutes. Following the basic anthropometric measurement, participants underwent a standardized set of motor tests. The testing was preceded by an individual 10-minute warm-up performed under the supervision of researchers focused on jumping and running readiness with maximum effort. At the end of the warm-up, participants were accustomed to the physical test protocol.
Anthropometric Measures
The body height was measured in a standing position without shoes using a wall-mounted measuring band with an accuracy of 1 cm. Body mass was measured using a TANITA BC 545 scale (Tanita, Japan) with an accuracy of 0.5 kg.
Tests of Lower Limb Explosive Strength of the Lower Extremity
Participants underwent standardized lower extremity explosive strength tests in the order listed below. The tests included jumping characterized by a predominant horizontal or vertical component of the forces, and maximal short distance running and skating. A 5-minute rest preceded each test.
Repeated Vertical Jump (RVJ) Test
The RVJ test consisted of repeated vertical jumps for 10 s on the FITRO Jumper (FiTRONiC, s.r.o. Bratislava). Each participant, wearing trainers, stood on a jump ergometer with their arms fixed on their sides and held a rubber Thera-Band. The rubber band looped around their waist and arms prevented any accompanying arm movement during the jump. The task was to maximise jump height and minimise ground contact time. Participants performed three 10-second trials of repeated vertical jumps with a 30-second rest between the trials. Before the measured trials, each participant performed one practice trial of approximately 5 seconds. The height of each jump (h, cm) was derived from ft (s) using the formula: h = (g x tf2) / 8. The power in the concentric phase of take-off (Pact, W/kg) was calculated using the formula Pact = (g2 x Tf) * (Tc+Tf)/4Tc, where g is the gravitational constant 9.81m/s2. The RSI was calculated using the equation: RSI = h/Tc [14]. In each trial, the highest Pact achieved in three jumps was averaged. From the trial with the highest average Pact, the average of Tc, h, and RSI of the three jumps were used for the subsequent analysis. The FITRO jumper measures Tc and ft with an accuracy of 1 ms [15], and RSI with reliability ICC = 0.924 [16]. This approach to measuring SSC capability using field-based rebound tests has been shown to be reliable in youth populations [17].
Standing Long Jump (SLJ) test
SLJ was performed according to the EUROFIT ® standardized physical fitness test battery manual [18]. From a slight crouch position, with feet approximately shoulder-width apart and parallel, each participant squats, leans forward, bumps, and bounces down with a simultaneous swing of their arms forward and jumps as far as possible. The distance of the longest jump of the two trials was used, with an accuracy of 1 cm. The rest interval between the two trials was 2 min. Before the test trials, each participant performed one practice trial. The SLJ is a test used to assess explosive leg power or the ability to apply force in a horizontal direction [19]. The SLJ used in 6 to 12-year-old children was reported to be highly reliable, with a 95% CI for the ICC 0.93 – 0.95 test-retest [20].
Triple Jump Test with Right/Left Leg (TJR/TJL Test)
This test evaluates an individual’s ability to decelerate in contact with the ground for optimal landing and to rapidly transition from eccentric to concentric muscle contractions, i.e., reactive strength [21]. From a standing position on one leg behind the start line, each participant performed three maximal consecutive jumps for distance without pausing between attempts and landing from the last jump on two feet. Each participant performed three trials for each leg, with a two-minute rest interval between the trials. Before the test trials, one practice trial was executed for each leg. The distance from the rebound line to the nearest mark of impact of the foot sole after the third rebound was measured with an accuracy of 1 cm. The longest of the three attempts was recorded for each leg. The triple jump test showed excellent test-retest reliability with an ICC of 0.94 – 0.95 [22].
15 Metre Running Sprint Test
A band was placed around the waist of each participant, with a guide wire connected to the FiTRO speed check device (FiTRONiC, Bratislava, Slovakia). Participants were asked to run from their standing position at their own discretion, with a maximum effort, for a distance of 20 m. They were instructed to start slowing down the run until the wire was detached. Before the measured trial, each participant performed one practice trial. In the case of technical, organizational or task execution problems, the sprint trial was repeated The total time on the 15 m run (R_t15m, s) and the average velocity at an interval of 0,00-1,00; 1,01-2,00; 2,01- to reach the 15m distance or 3,00 s of running (R_v_1.s, R_v_2.s, R_v_3.s) were measured The 20m sprint test showed excellent test–retest reliability of r = 0.90 in children aged 7–11 years [23].
15 Metre Skating Sprint Test
Participants were in a standing starting position with the back-leg skate on the inner edge and the front leg on the skate tooth. A band around the waist of each participant, with a guide wire connected to the FiTRO speed check device (FiTRONiC, Bratislava, Slovakia). Subsequently, participants were asked to drive in a straight line with a maximum effort of 20 meters. Each participant conducted one trial. Before the measured trial, each participant performed one practice trial. In the case of technical, organizational or task execution problems, the sprint trial was repeated. We recorded the total time achieved over 15 m (S_t15m) and the average velocity at an interval of 0,00-1,00; 1,01-2,00; 2,01- to the reach 15 m distance or 3.00 s (S_v_1.s, S_v_2.s, S_v_3.s). The test-retest reliability for the total 20-m skating time and the mean speed at the first second of skating was found to be 0.989 and 0.968, respectively [24]
Results of Figure Skating Competitions
From the database of the Czech Figure Skating Association (www.skating-results.live), the results of those skaters who passed in the respective season without limitations and who underwent our standardized tests of explosive strength of the lower limb were selected. For each figure skater, the best three results of Czech figure skating cup competitions that led to a nomination for the national championships in the given season and the result of the national championship itself were then selected. The results of the three competitions with the highest ranking on Czech Figure Skating Cup (SB3) were subsequently averaged. The result of the figure skating competitions according to the ISU Code of Points consists of the sum of points for the short program (SP) and free skate (FS). The total score is the sum of the technical score (Tes) and program component score (Pcs). In the Official Races and National Championships for young skaters, only the free skating is evaluated. Starting from the category of pupils, the short program and free skate are evaluated separately. In multi-segmented competitions (short program and free skate), the score from each segment is added to determine the skater’s total score.
Data Analysis
Data were analyzed using the IBM SPSS software package (version 28.0.1.0). In the first step, outliers of test scores in the two groups were identified as any observation outside the range (Tukey´s fences): [Q1 – 1.5(Q3 – Q1), Q3 + 1.5(Q3 – Q1)] [25] , where Q1 and Q3 are lower and upper quartiles. After excluding cases with one or more test scores being outliers, the data for Group 1 (n = 85) and Group 2 (n = 95) were not significantly different from the normal distribution when tested with the Shapiro-Wilk and Kolmogorov-Smirnov tests.
The set of 15 observed variables underwent the Principal Component Analysis (PCA) to reveal significant latent factors. Regarding the fact that we observed strong internal Pearson correlations between variables, we used Oblimin rotation with Kaiser normalization to improve information on factor loadings [26]. The number of significant principal components in the factor pattern matrix extracted by the PCA was determined by the Kaiser-Guttman criterion [27], which retains principal components with eigenvalues >1. The PCA with Oblimin rotation and Kaiser normalization procedure was performed on data from both groups.
The data obtained from the PCA for each group was then used in the linear Multi Regression Analysis (MRA). The MRA was used to determine the relationship between IJS scores (dependent variables) and individual PCA factors as representatives of individual items from the lower extremity explosive strength tests. To evaluate the sampling adequacy for each variable in the multi-regression model, we used the Kaiser-Meyer-Olkin (KMO) and Bartlett test. The results of the Republic Championship figure skating competitions (RCH) and the best three results during the season (SB3) were used as dependent variables for the MRA. The MRA linear models were constructed separately for each Group 1 and Group 2 and the IJS score includes seven partial scores: the total score, free skating results (FS_score, FS_Pcs, FS_Tes), and short program results (SP_score, SP_Pcs, SP_Tes). The coefficient of determination (R²) was used as a measure of the size of the effect, with thresholds following Cohen (1988) for small (0.01), medium (0.09), and large (0.25) effects.
3. Results
The KMO values of 0.807 and 0.84 for the two groups indicate that the data set is suitable for the PCA. The Bartlett test showed a significant level α ≤0.001, confirming that the variables were correlated in the population (Tables 2A, B).
Table 2A.
Kaiser–Meyer–Olkin (KMO) and Bartlett’s test Group 1
| Kaiser-Meyer-Olkin Measure of Sampling Adequacy. | 0.84 | |
| Bartlett’s Test of Sphericity | Approx. Chi-Square | 1652.04 |
| Degree of freedom | 105 | |
| Significance | ≤0.001 | |
Table 2B.
Kaiser–Meyer–Olkin (KMO) and Bartlett’s test Group 2
| Kaiser-Meyer-Olkin Measure of Sampling Adequacy. | 0.807 | |
| Bartlett’s Test of Sphericity | Approx. Chi-Square | 1501.018 |
| Degree of freedom | 105 | |
| Significance | ≤0.001 | |
The PCA reduced 15 observed variables to four principal components, which explained 84 - 87% of the variance for both groups.
The PCA model for Group 1 (Table 3) shows that the variables in the sprint run test had the highest loading (correlations) with the first principal component (C1). The second principal component (C2) was highly correlated with the variables of the repeated vertical jump test. The third principal component (C3) was highly correlated with the results of the skating sprint variables and C4 was highly correlated with the results of the standing long jump and triple jump (right / left leg) tests.
In the PCA model for Group 2 (Table 4), the same components were recognized, but the order of the components differed. C1 was highly correlated with the skating sprint test variables, C2 maintained the same order and was highly correlated with the variables from the repeated vertical jump test, C3 was highly correlated with the results of the Standing Long Jump and Triple Hop Jump (right/left leg) tests. The high-factor loadings on the fourth principal component (C4) were demonstrated by the results of the running sprint test.
The results of the MRA for Group 1 and Group 2 and each partial competition IJS score are presented in Table 5 and Table 6.
In the MRA models for Basic Novice, Group 1 (Table 5), Pearson’s R ranges from 0.546 to 0.652. The R² coefficient of determination ranges from R² for RCH_FS_Tes = 0.298 (medium effect) for the technical score of free skating, to R² RCH_FS_Tes = 0.425 (large effect).
The data in Table 6 shows that the MRA models of our components (C1 – C4) significantly explain the variability in the IJS score of Group 2 in all cases. The statistical significance for all MRA models for SB3 and RCH IJS scores is f <0.001, except for the models for short program (SP), program component score (RCH_SP_Pcs and SB3_SP_Pcs), where f <0.05. In the MRA models of Advance Novice and Junior (Group 2), the Pearson’s R ranges from 0.294 to 0.487. The coefficient of determination (R²) ranges from R² for RCH_SP_Pcs = 0.086 (small effect) to R² for SB3_SP_score = 0.237 (medium effect). Pearson’s R is slightly higher in the regression models for SB3 scores than for RCH scores.
For both groups Basic Novice, Advance Novice and Junior Pearson’s R is slightly higher in the regression models for SB3 scores than for RCH scores. The coefficients of determination for the IJS scores are slightly higher for the Basic Novice Group 1 than for the Advance Novice and Junior Group 2.
The MRA models that analyze individual variables of the IJS score demonstrate that the principal components, representing the strength and speed predispositions of young skaters, as determined by field tests, have varying impacts on the overall score and its individual elements. The results of the regression analysis for Group 1 shows that individual components C1–C4 affect the IJS scores of young skaters. Component C3 exerts the greatest influence and is consistently significant across all models, and it corresponds to the outcomes of the 15m Skating test. Its influence is statistically significant at the level of p = 0.001, affecting both the results of singular events, such as the National Youth Figure Skating Championships, and the recorded results (Table 5).
In the Advanced Novice and Junior category (Group 2), the C3 component, as with Group 1, contributes most significantly to explaining the variance. However, this C3 component, in this instance, is highly correlated with variables representing the results of the TJR, TRL, and SLJ tests (jumps in the horizontal direction), and has a notable effect. Regarding the regression model for the short program components (RCH_SP_Pcs; SB3_SP_Pcs), both for the outcome of the single competition in the national championship and the average of the three best races in the season, the effect of C3 is statistically significant at the level of p = 0.05. In all other cases, the effect of C3 is significant at the level of p = 0.01 (Table 6).
4. Discussion
Previous studies [2,4,5,7,28] on young figure skaters investigated performance in motor ability tests. As far as we know, our study is the first to assess whether the results of both nonspecific and specific physical field tests can predict success in competitions in young female and male figure skaters. Vertical jumps, acceleration in locomotion, and jumping for distance are commonly employed in the training, testing, and monitoring of elite athletes, as well as fitness indicators monitored in this study [29]. The analysis was made based on long-term monitoring of physical parameters such as explosive strength and reactive strength of the lower limbs, acceleration running speed, and acceleration skating speed, and IJS scores in the most important official competitions. The performance level of figure skaters was assessed not only based on the results from the top single event such as the National Championship in the corresponding category, but also using averaged results from the three best placements in competitions that qualified figure skaters for the National Championship. We believe that this approach provided a comprehensive view of the level of performance of young figure skaters included in the Talented Youth Training Project throughout the season.
The data show that our tests assess four neuromuscular qualities derived from identified components: fast SSC capability for vertical jumping, slow SSC capability for horizontal jumping, and fast SSC capability for the acceleration phase in both skating and running. Cross-sectional studies [28,30] indicate that SSC performance improves with age and maturation during childhood and adolescence, which corresponds to our finding that the composition of the main components remains consistent across age groups.
These manifestations of explosive strength are internally uncorrelated (orthogonal), which makes them essential for training control in explosive strength development. In line with Suchomel et al. [31], we assumed that muscle strength influences force-time characteristics during various sporting movements, including figure skating [3,10,11,32]. These explosive actions are based on coordinated muscle contractions of the lower extremities during the stretch-shortening cycle (SSC) [11,33,34,35].
The analyses indicate that locomotion speed and strength, as assessed by the field tests in young skaters (8 to16-year old), are important predictors of long-term performance and success in the National Championships. Higher correlations were found for SB3 scores, representing the average score of the three best competitions leading up to the National Championship in both categories. This suggests that greater explosive lower limb strength and locomotion speed enable athletes to effectively practice and execute more complex elements in training, which are subsequently rewarded with higher scores in competitions. These findings are consistent with the studies by Yordanova [6] and Rauer et al. [7].
In the younger Basic Novice category (Group 1, 8 to 12 years), the speed of specific locomotion on ice was identified as a significant predictor of performance. This finding underlines the importance of coaching practices that prioritize movement dynamics, which is crucial for executing higher difficulty elements in free skating. Additionally, maintaining dynamic balance is essential for mastering individual program components and combinations, making it a determining factor in achieving higher IJS scores in this age Group 1.
On the contrary, in the advanced novice and junior Groups 2 (12 to 16 years), the influence of lower-limb explosive strength parameters, particularly in horizontal jumps (SLJ, TJR/TJL), is more pronounced in explaining the variance in IJS scores. In this age category, the successful execution of jumps and pirouettes, which require substantial explosive lower-limb strength, becomes increasingly important for competitive success. This emphasizes the need for early participation in strength and conditioning programs to maximize athleticism and supports the findings of Cruz et al. [2] and Comuk & Erden[11]. Interestingly, our results suggest that vertical force impulse alone, often viewed by coaches as critical for mastering multi-revolution jumps, is not the sole determinant of success for young figure skaters.
Although limited studies assess the impact of explosive lower limb strength on competition performance, others, such as Cheng & Gonzalez [36] examined individual elements, particularly jumps. Cabell & Bateman [3] note that the trajectory of a jump is established at take-off, and modifying the shape of the jump arc in air is not possible. Furthermore, longer jumps typically require more horizontal velocity, which can enhance performance in combination jumps. Hirosawa et al. [37] also indicate that jump scoring is influenced by the base value and grade of execution (GOE), linking dynamic force characteristics to successful execution and judges’ scoring.
In conclusion, this study provides novel insights into the influence of explosive strength of the lower limbs and acceleration speed of running and skating on competition results in young female figure skaters. The results of our analysis indicate that explosive strength and speed parameters, derived from six motor tests and 15 monitored variables, can be reduced to four main components, explaining 82–84% of variance between age groups. Although the composition of these factors is consistent, their relative importance varies in figure skaters of different age. For skaters aged 8 to 11 years (Group 1), short-distance locomotion speed on ice emerges as the critical factor for scoring. On the contrary, for skaters aged 12 to 16 years (Group 2), explosive strength in horizontal jumps significantly affects competition scores. These findings underline the importance of effective on- and off-ice training that emphasizes locomotion and gradual acceleration for younger skaters, along with developing a dynamic stereotype of jumps in various directions. Future research should explore the long-term effects of these training aims and their time order on performance outcomes.
Author Contributions
For research articles with several authors, a short paragraph specifying their individual contributions must be provided. The following statements should be used “Conceptualization, J.H. and M.L.; methodology, J.H.; investigation, J.H.; data curation, J.H.; writing—original draft preparation, J.H. and M.L; writing—review and editing, J.H. and M.L; visualization, J.H. All authors have read and agreed to the published version of the manuscript.”
Funding
This research received no external funding.
Institutional Review Board Statement
The study was conducted according to the Declaration of Helsinki and approved by the Czech Figure Skating Association.
Informed Consent Statement
Informed consent was obtained from all subjects involved in the study.
Data Availability Statement
The raw data supporting the conclusions of this article will be made available by the authors on request. The data are not publicly available due to ethical and privacy restrictions.
Conflicts of Interest
The authors declare no conflicts of interest.
References
- Brenner, J.S. ; Council on sports medicine and fitness. Sports Specialization and Intensive Training in Young Athletes. Pediatrics 2016, 138, e20162148. [Google Scholar] [CrossRef]
- Cruz, J.; Vriner, M.; Mangum, L.; Slater, L. Longitudinal Changes in Athletic Performance in Competitive Figure Skaters. J. Sci. Sport Exerc. 2021, 3, 332–339. [Google Scholar] [CrossRef]
- Cabell, L.; Bateman, E. Biomechanics in figure skating. In The Science of Figure Skating; Routledge: London, UK, 2018. [Google Scholar]
- Kutlay, E.; Haslofça, F.; Haslofça, E. The relationship between anthropometric characteristics and physical fitness parameters of figure skating athletes. Eur. J. Phys. Educ. Sport Sci. 2020, 6. [Google Scholar] [CrossRef]
- Slater, L.V.; Vriner, M.; Zapalo, P.; Arbour, K.; Hart, J.M. Difference in Agility, Strength, and Flexibility in Competitive Figure Skaters Based on Level of Expertise and Skating Discipline. J. Strength Cond. Res. 2016, 30, 12. [Google Scholar] [CrossRef] [PubMed]
- Yordanova, T. Judging Results in Figure Skating After the ISU Judging System Was Introduced In 2004. J. Appl. Sports Sci. 2022, 2, 64–76. [Google Scholar] [CrossRef]
- Rauer, T.; Pape, H.C.; Knobe, M.; Pohlemann, T.; Ganse, B. Figure skating: Increasing numbers of revolutions in jumps at the European and World Championships. PLoS ONE 2022, 17, e0265343. [Google Scholar] [CrossRef] [PubMed]
- Lom, S.E. Changing rules, changing practices: The direct and indirect effects of tight coupling in figure skating. Organ. Sci. 2016, 27, 36–52. [Google Scholar] [CrossRef]
- Mochida, M.; Jin, B.; Zhang, Y. Effects of stretching training on lower limb explosive strength in figure skating athletes. Rev. Bras. De Med. Do Esporte 2022, 29, e2022_0350. [Google Scholar] [CrossRef]
- Shulman, C. The complete book of figure skating. 2002, Human Kinetics.
- Comuk, N.; Erden, Z. The effect of muscular strength and endurance on technical skill in professional figure skaters. Isokinet. Exerc. Sci. 2012, 20, 85–90. [Google Scholar] [CrossRef]
- Cattle, A.; Mosher, A.; Mazhar, A.; Baker, J. Early specialization and talent development in figure skating: Elite coaches’ perspectives. Curr. Issues Sport Sci. (CISS) 2023, 8, 013. [Google Scholar] [CrossRef]
- Mostaert, M.; Deconinck, F.; Pion, J.; Lenoir, M. Anthropometry, physical fitness and coordination of young figure skaters of different levels. Int. J. Sports Med. 2016, 37, 531–538. [Google Scholar] [CrossRef] [PubMed]
- Flanagan, E.P.; Comyns, T.M. The use of contact time and the reactive strength index to optimize fast stretch-shortening cycle training. Strength Cond. J. 2008, 30, 32–38. [Google Scholar] [CrossRef]
- Tkac, M.; Hamar, D.; Komadel, L.; Kuthanova, O. Measurement of anaerobic power of the lower limbs by a method of repeated vertical jumps. Sports Medicine, Train. Rehabil. 1990, 1, 317–325. [Google Scholar] [CrossRef]
- Zemková, E.; Hamar, D. Jump ergometer in sport performance testing. Gymnica - Acta Univ. Palacki. Olomuc. 2005, 35, 7–16. [Google Scholar]
- Lloyd, R.S.; Oliver, J.L.; Hughes, M.G.; Williams, C.A. The influence of chronological age on periods of accelerated adaptation of stretch-shortening cycle performance in pre and postpubescent boys. J. Strength Cond. Res. 2011, 25, 1889–1897. [Google Scholar] [CrossRef]
- EUROFIT Handbook for the eurofit tests of physical fitness. Rome: Committee for the Development of Sport, 1988, Council of Europe.
- Madruga-Parera, M.; Bishop, C.; Fort-Vanmeerhaeghe, A.; Beltran-Valls, M.R.; Skok, O.G.; Romero-Rodríguez, D. Interlimb asymmetries in youth tennis players: Relationships with performance. J. Strength Cond. Res. 2020, 34, 2815–2823. [Google Scholar] [CrossRef] [PubMed]
- Fernandez-Santos, J.R.; Ruiz, J.R.; Cohen, D.D.; Gonzalez-Montesinos, J.L.; Castro-Piñero, J. Reliability and validity of tests to assess lower-body muscular power in children. J. Strength Cond. Res. 2015, 29, 2277–2285. [Google Scholar] [CrossRef]
- Seiberl, W.; Hahn, D.; Power, G.A.; Fletcher, J.R.; Siebert, T. Editorial: The stretch- Shortening cycle of active muscle and muscle-tendon complex: What, why and how it increases muscle performance? Front. Physiol. 2021, 12, 693141. [Google Scholar] [CrossRef]
- Davey, K.; Read, P.; Coyne, J.; Jarvis, P.; Turner, A.; Brazier, J.; Bishop, C. An assessment of the hopping strategy and inter-limb asymmetry during the triple hop test: A test–retest pilot study. Symmetry 2021, 13, 1890. [Google Scholar] [CrossRef]
- Bös, K.; Schlenker, L.; Büsch, D.; Lämmle, L.; Müller, H.; Oberger, J.; Tittlbach, S. Deutscher Motorik Test 6-18:(DMT 6-18). Hamburg, 2009: Czwalina.
- Helešic, J. Rychlost lokomoce a dynamická síla dolních končetin hráčů ledního hokeje dorosteneckého a juniorského věku. (Locomotion speed and dynamic strength of lower extremities in adolescent and junior ice hockey players). Praha, 1999, UK FTVS.
- Tukey, J.W. Exploratory data analysis. Menlo Park, 1977: Addison-Wesley.
- Ogasawara, H. Standard errors for the direct Oblimin solution with Kaiser’s normalization. Shinrigaku Kenkyu Jpn. J. Psychol. 1999, 70, 333–338. [Google Scholar] [CrossRef] [PubMed]
- Nunnally, J.C.; Bernstein, I.H. Psychometric theory. New York, 1994: McGraw Hill.
- Lehnert, M.; Psotta, R.; Helešic, J. Influence of chronological age on reactive strength in 8–13-year-old female figure skaters. J. Phys. Educ. Sport 2022, 22, 724–731. [Google Scholar] [CrossRef]
- Andersen, L.L.; Aagaard, P. Influence of maximal muscle strength and intrinsic muscle contractile properties on contractile rate of force development. Eur. J. Appl. Physiol. 2006, 96, 46–52. [Google Scholar] [CrossRef] [PubMed]
- Radnor, J.M.; Oliver, J.L.; Waugh, C.M.; Myer, G.D.; Moore, I.S.; Lloyd, R.S. The Influence of Growth and Maturation on Stretch-Shortening Cycle Function in Youth. Sports Med. 2018, 48, 57–71. [Google Scholar] [CrossRef] [PubMed]
- Suchomel, T.J.; Nimphius, S.; Bellon, C.R.; Stone, M.H. The Importance of Muscular Strength: Training Considerations. Sports Med. 2018, 48, 765–785. [Google Scholar] [CrossRef]
- Taylor, R. Examining the relationship between physical fitness and performance in developmental figure skaters, University of British Columbia, 2016. [CrossRef]
- Harrison, A.; Gaffney, S. Motor development and gender effects on stretch-shortening cycle performance. J. Sci. Med. Sport/Sports Med. Aust. 2002, 4, 406–415. [Google Scholar] [CrossRef]
- Williams, M.; Squillante, A.; Dawes, J. The Single Leg Triple Hop for Distance Test. Strength Cond. J. 2017, 39, 94–98. [Google Scholar] [CrossRef]
- Arcos, A.L.; Yanci, J.; Mendiguchia, J. Specificity of jumping, acceleration and quick change of direction motor abilities in soccer players. Kinesiology 2017, 49, 22–27. [Google Scholar] [CrossRef]
- Cheng, D.; Gonzalez, J. Technical and Program Component scores frozen together: Difficulty bias and outcome prediction in international figure skating. Math. Sports 2022, 4, 1. [Google Scholar]
- Hirosawa, S.; Watanabe, M.; Aoki, Y. Determinant analysis and developing evaluation indicators of grade of execution score of double axel jump in figure skating. J. Sports Sci. 2022, 40, 470–481. [Google Scholar] [CrossRef] [PubMed]
Table 3.
PCA components loadings of leg strength variables after Oblimin rotation with Kaiser normalization for Basic Novice (Group 1).
Table 3.
PCA components loadings of leg strength variables after Oblimin rotation with Kaiser normalization for Basic Novice (Group 1).
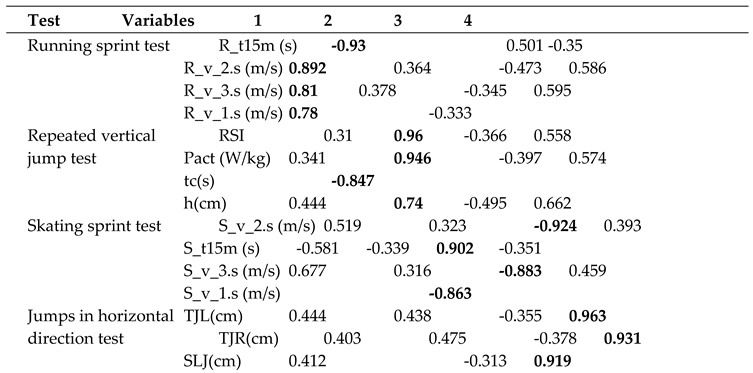 |
Note: SLJ (cm) - Standing Long Jump, TJR (cm)/ TJL (cm) -Triple jump test with right/left leg, tc (s) - Contact time, Pact (W/kg) - power in the active phase of the take-off, h (cm) - height of the jump, RSI - Reactive Strength Index, R_t15m (s) - Runing 15 m, R_v_1. s (m/s) - Runing velocity 1. S, R_v_2. s (m/s) - Runing velocity 2. S, R_v_3. s (m/s) - Runing velocity 3. S, S_t15m (s) - Skating 15 m, S_v_1. s (m/s) - Skating velocity 1.s, S_v_2. s (m/s) - Skating velocity 2.s, S_v_3. s (m/s) - Skating velocity 3.s.
Table 4.
PCA Components loadings of the leg strength variables after Oblimin rotation with Kaiser normalization for Advance Novice and Junior (Group 2).
Table 4.
PCA Components loadings of the leg strength variables after Oblimin rotation with Kaiser normalization for Advance Novice and Junior (Group 2).
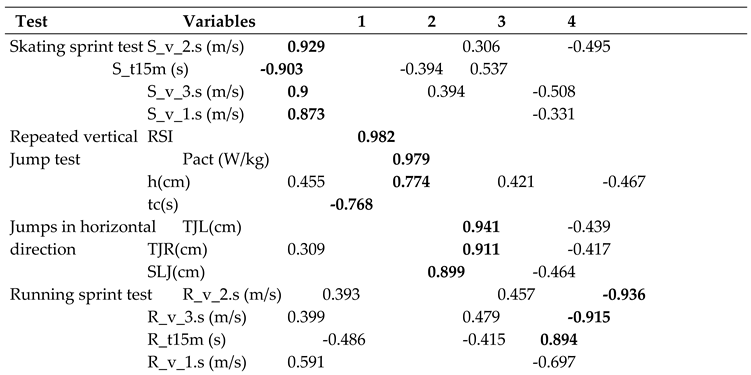 |
Note: SLJ (cm) - Standing Long Jump, TJR (cm)/ TJL (cm) - Triple jump test with right/left leg, tc (s)- Contact time, Pact (W/kg) - power in the active phase of the take-off, h (cm) - height of the jump, RSI - Reactive Strength Index, R_t15m (s) - Runing 15 m, R_v_1. s (m/s) - Runing velocity 1. S, R_v_2. s (m/s) - Runing velocity 2. S, R_v_3. s (m/s) - Runing velocity 3. S, S_t15m (s) - Skating 15 m, S_v_1. s (m/s) - Skating velocity 1.s, S_v_2. s (m/s) - Skating velocity 2.s, S_v_3. s (m/s) - Skating velocity 3.s.
Table 5.
Statistics of MRA model Basic Novice Group 1 for results of Republic championship and the mean of three best season results.
Table 5.
Statistics of MRA model Basic Novice Group 1 for results of Republic championship and the mean of three best season results.
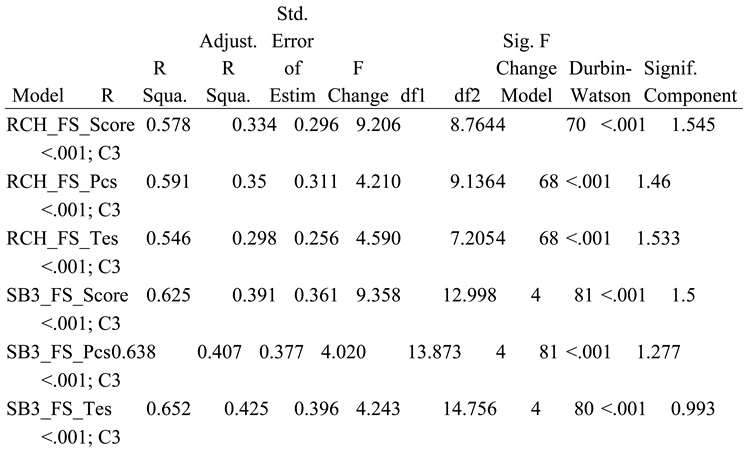 |
Note: RHC – Republic Championship, SB3- Three best results, Total score – SP + FS score. SP – Short programme score, FS – Free skates score, Tes – Technical score, Pcs – Programme components score.
Table 6.
Statistics of MRA model Advance Novice and Junior, Group 2 for results of National championship and the mean of three best season results.
Table 6.
Statistics of MRA model Advance Novice and Junior, Group 2 for results of National championship and the mean of three best season results.
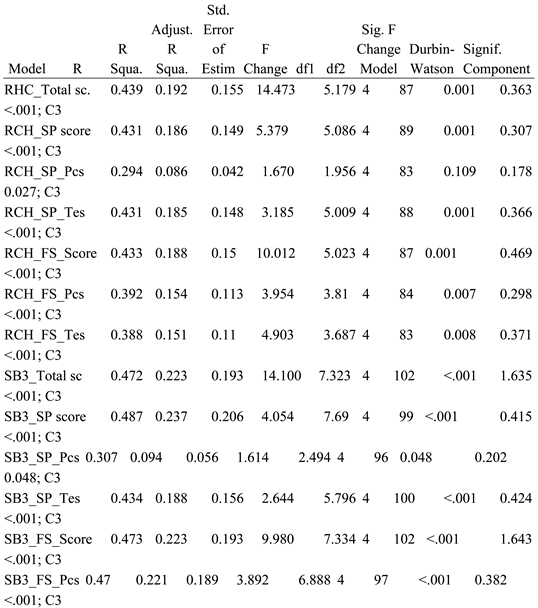 |
Note: RHC – Republic Championship, SB3 - Three best results, Total score – SP + FS score. SP – Short programme score, FS – free skates score, Tes – technical score, Pcs – programme components score.
Disclaimer/Publisher’s Note: The statements, opinions and data contained in all publications are solely those of the individual author(s) and contributor(s) and not of MDPI and/or the editor(s). MDPI and/or the editor(s) disclaim responsibility for any injury to people or property resulting from any ideas, methods, instructions or products referred to in the content. |
© 2024 by the authors. Licensee MDPI, Basel, Switzerland. This article is an open access article distributed under the terms and conditions of the Creative Commons Attribution (CC BY) license (http://creativecommons.org/licenses/by/4.0/).
Copyright: This open access article is published under a Creative Commons CC BY 4.0 license, which permit the free download, distribution, and reuse, provided that the author and preprint are cited in any reuse.


