
Submitted:
19 September 2024
Posted:
20 September 2024
You are already at the latest version
Abstract
This study profiled morphological and laboratory-derived performance biomechanics by position of American style football players training for the National Football League draft. Fifty-five players were categorized into Big (e.g., lineman; n=17), Big-skill (e.g., tight end; n=11), and Skill (e.g., receiver; n=27) groups. Body fat (BF%), lean body mass (LBM), total body mass, running force and ground contact time (GCT), countermovement jump height (CMJ-JH), CMJ normalized peak power (CMJ-NPP), and reactive strength were measured in a laboratory. Asymmetry was calculated for running force, GCT, and CMJ eccentric and concentric impulse (IMP). MANOVA determined between-group differences, and radar plots for morphological and performance characteristics were created using Z-scores. There was a significant between-group difference, F(26,80)=5.70, p<0.001;Wilk’s Λ=0.123, partial η2=0.649. Fisher’s least squares difference post-hocs showed Skill had greater JH, CMJ-NPP, reactive strength, and running force versus Big but not Big-skill, p<0.05. Big had greater BF%, LBM, total body mass, and GCT than Skill and Big-Skill, p<0.05. Big-skill had greater GCT asymmetry than Skill and Big, p<0.05. Asymmetries in running forces, and CMJ eccentric and concentric IMP were not different, p>0.05. Morphological and performance biomechanics differences are pronounced between Skill and Big. Big-skill possess characteristics from both groups. Laboratory-derived results provide specialized profiles of draft trainees.
Keywords:
body composition
; running kinetics
; jumping kinetics
; countermovement jump
; asymmetry
; motion capture
; lower-body power
1. Introduction
American style football is a collision-based sport characterized by short bursts of power alternated with rest [1] in which players compete in different positions that have specific technical, tactical, and physical activity demands. The playing field is 91.4 by 48.7 meters (100 by 53.3 yards). In the United States, the game is played at the university level in the National Collegiate Athletic Association (NCAA) and the professional level in the National Football League (NFL). Players are divided into 8 position groups: offensive linemen (OL), quarterback (QB), running backs (RB), tight end (TE), wide receiver (WR), defensive backs (DBs), defensive linemen (DL), and linebackers (LBs), each with different tactical and physical demands [2,3]. These demands require different body types to be successful [4,5,6]. Morphological and activity profiling has been conducted in American style football at NFL and NCAA division levels [4,5,6,7,8,9,10,11,12,13]. Since different player positions within the sport require different speed and movement demands, profiles are often position specific as well. See Table 1 for a brief description of the sport specific positional differences.
NFL try-outs are limited where players must meet strict eligibility requirements (e.g., be out of high school for at least three years and finish their NCAA eligibility). In the 2023 NFL draft, there were 259 players drafted across 32 teams [[14] website]. Draft hopefuls train specifically for the combine where they will undergo a medical history and examination that includes body composition, psychological assessment, on-field position drills, and physical skills testing. However, players representing all positions are invited to the combine and, with very little exception, perform the same battery of tests. Specifically, the combine battery is made up of the 36.6 m sprint with split times at 9.1 and 18.3 m; vertical and horizontal jump distances; the 18.3 m shuttle and 3-cone drill times to measure change-of-direction ability; and the 102.1-kg bench press for maximum repetitions to measure upper-body strength. Two of the physical skills tests are the 36.6 m (40 yards) sprint and the vertical jump [15]. The 36.6 m sprint is an indicator of linear speed. It is the most anticipated and receives considerable media attention [16]. Drafted players have been shown to perform better in the 36.6 m sprint than non-drafted players [17] and performance has been associated with draft position [16]. Biomechanical markers of linear speed (disregarding the start) include short ground contact times (GCT) and large vertical ground reaction forces (vGRF) [18,19]. Mean GCT of 0.102 s and 0.168 s have been reported for male elite sprinters [18] and university American style football players [19] respectively [20]. We selected average over peak vGRF because they are subject less to intraindividual differences [21]. Bilateral deficit, or asymmetry in force production is also a recommended biomechanical marker to study for sport performance and training optimization [22]. Subtle asymmetries are not always perceptible to the coach’s naked eye, even in experts, nor are they necessarily apparent to the athlete [23]. Thus, an advanced analysis of a player’s running pattern is necessary to assess symmetry in biomechanical factors such as vGRF and GCT. The same could be stated for the biomechanical variables of the vertical jump, another physical skills test for which American style football players must prepare. The vertical jump has long been used to determine lower limb muscular power and is particularly accurate when force plates are used [24]. In addition to jump height, dual force plates allow for measurement of additional variables that provide useful insight into a player’s jump strategy such as modified reactive strength index (RSImod), peak power, that can be normalized to body mass for comparisons, and impulse asymmetry in both the eccentric (loading) and concentric (propulsion) phases. RSImod provides greater insight into neuromuscular and stretch-shortening cycle (SSC) function than jump height alone since it accounts for the time to takeoff during a CMJ [24]. Participants with high RSImod have been shown to produce larger force, power, and velocity both eccentrically (during loading) and concentrically (during propulsion) and generate impulse characterized by high force within a short time [24]. Physics dictates that impulse is equal to the change in momentum of an object. Thus, inquiry on the symmetry of impulse generation between player groups seems prudent.
Profiling can be a valuable means of identifying talent, strengths, and weaknesses, and helping in the design of optimal strength and conditioning programs [4,5,6,7,8,13,15]. Holistic testing that involves morphology, biomechanics, and performance improves the profile [7]. To the best of our knowledge, we are not aware of any study documenting laboratory based running kinetics in addition to jump biomechanics and body composition metrics in this population. This is relevant for strength and conditioning specialists responsible for designing, implementing, and supervising training programs for draft-eligible American style football players [4,7,8]. Further, with the global growth of American style football, results may provide scouts, coaches, and medical personnel with valuable data. Therefore, the purpose of this study was to document the morphologic and performance biomechanics characteristics of draft-eligible American style football players.
2. Materials and Methods
Fifty-five players (age, 22.9±x 1.0 yrs; height, 1.87±0.06 m; mass, 103.5±18.3 kg) who had just finished their collegiate seasons and were in their first week of specialized training for the NFL draft at an off-campus performance center volunteered for this study. Participants represented three position groups, Big (e.g., offensive linemen; n=17), Big-skill (e.g., tight end; n=11), and Skill (e.g., wide receiver; n=27). Participants showed to the lab in groups of three at a designated time. All data were collected over two days in the Sports Performance and Gait Science Laboratory at Nova Southeastern University. The study was approved by the University’s Institutional Review Board (#2022-570), conducted in accordance with the ethical standards of the Helsinki Declaration and participants provided written informed consent.
2.1. Morphological Measurements
Body fat percent (BF%), lean body mass (LBM; kg), and total body mass (kg) were measured with an InBody 270 multifrequency bioelectrical impedance device (InBody USA, Cerritos, California, USA). Participants were instructed to void prior to testing and refrain from eating or exercising within three hours prior to testing. Procedures were in accordance with the manufacturer’s guidelines where participants stood on the platform of the device barefoot with the soles of their feet on the electrodes. Participants then grasped the handles of the unit with the thumb and fingers maintaining direct contact with the electrodes. The elbows were fully extended and the glenohumeral joints were abducted to approximately 30 degrees. The duration of the test was less than one minute. See Figure 1.
Following the morphological measurements, participants underwent a standardized 25 min. warm-up administered by a single coach that consisted of dynamic stretching, muscle readiness and reactivity exercises.
2.2. Running Kinetics
The running trial took place on an instrumented split belt treadmill (Bertec, Columbus, OH, USA) with participants running on one side. Participants began the trial holding onto the handrail fixed at chest height of the treadmill walking at 1 m/s. Then the treadmill was increased 1 m/s in one second increments until 6.5 m/s was reached, which was the maximum afforded by the treadmill. Participants were instructed to release their grip when they were comfortable, and vGRFs and contact times were collected at 1000 Hz for 5 sec. See Figure 1. This time was selected to mimic the 36.6 m run durations at the NFL combine. Participants then transferred their weight to the non-moving belt, and the treadmill belt was decelerated to a stop. Only one running trial was collected from each subject that included 6-8 steps from both right and left sides. All trials were initially processed with Vicon Nexus software (ver. 2.15) with a low pass Butterworth filter with a cut-off frequency of 40 Hz. A custom MATLAB (MathWorks Inc., Natick, MA) program was used to obtain peak vGRF and the GCT. GCT was a measure of continuous foot-ground contact time in milliseconds (ms) with the treadmill when the vGRF exceeded 40N. vGRF data were normalized using participants’ body weight (BW). Interlimb asymmetries in percentages were calculated between vGRF and GCT using the following equation [26,27]:
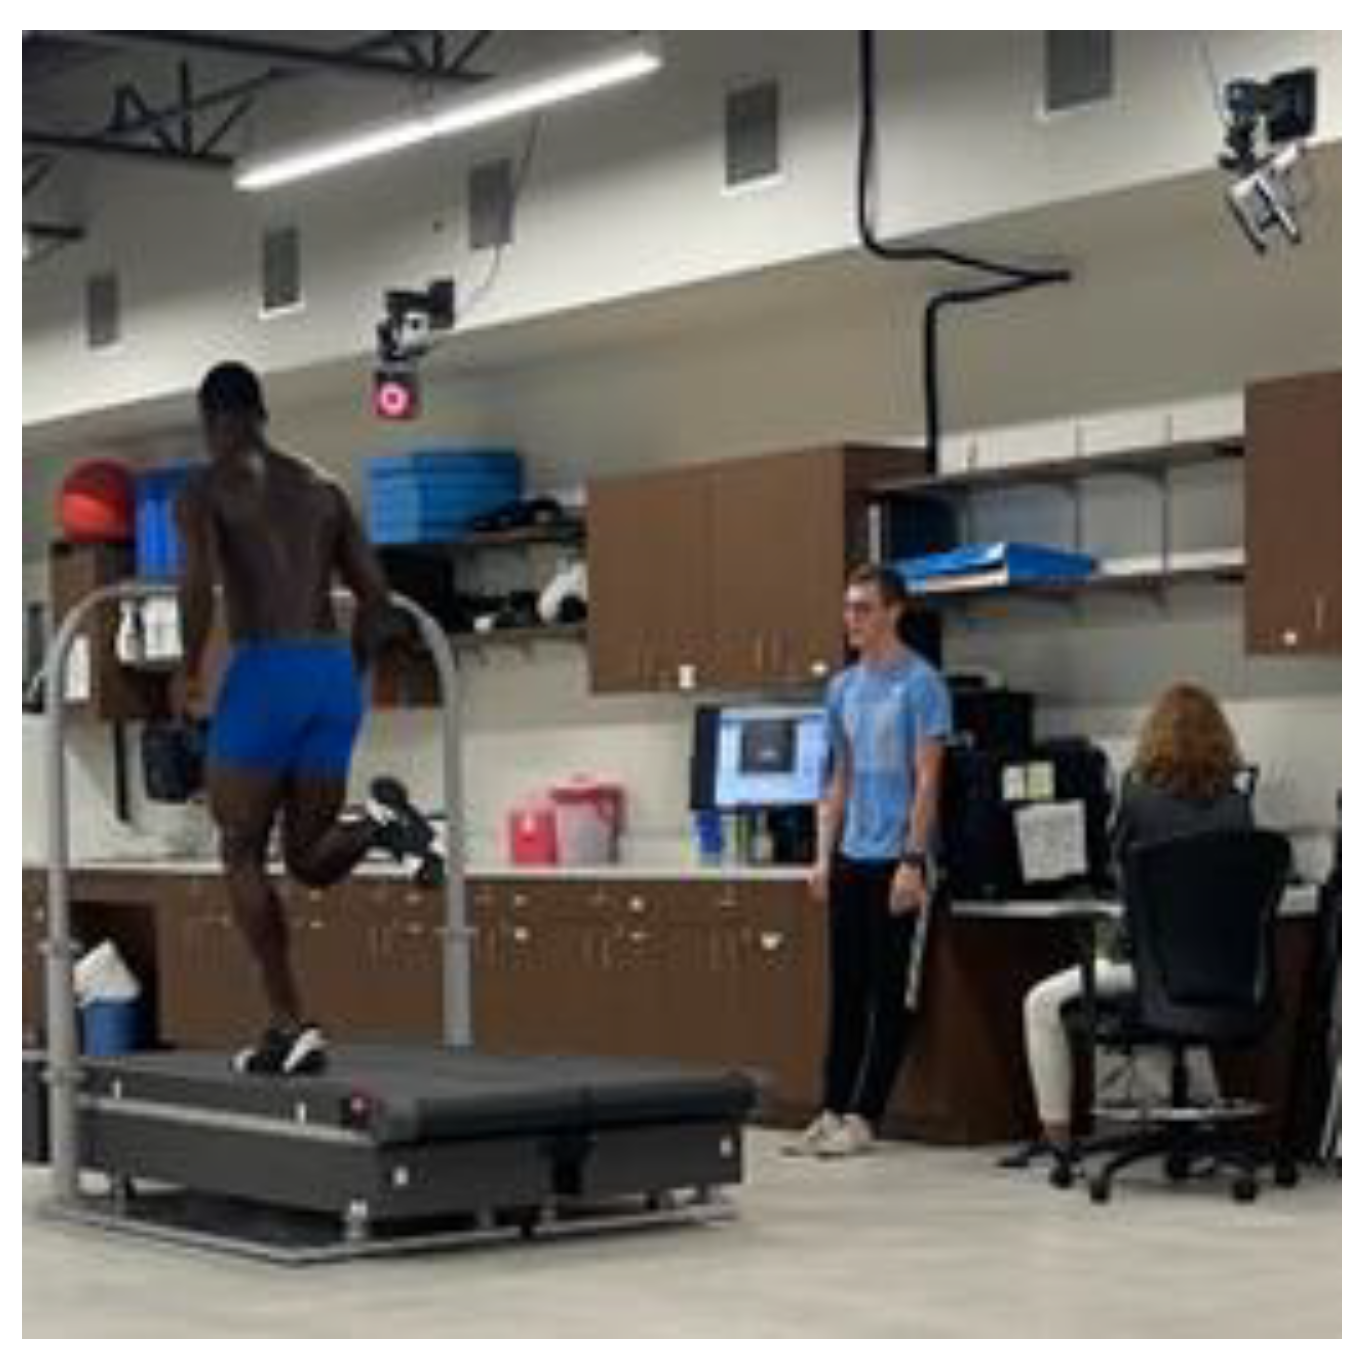
Figure 2.
Running assessment using motion capture and instrumented treadmill.
2.3. Countermovement Jump Measurements
Participants performed 1-2 submaximal practice CMJ using a dowel held horizontally across the posterior shoulders. Then, two maximal effort CMJ with the dowel were performed and recorded on dual uniaxial force plates (FD Lites, Vald Performance, Queensland, Australia) sampling at 1000 Hz. See Figure 3. ForceDecks software (ver. 1.8.6, Vald Performance, Queensland, Australia) was used to calculate averages of both CMJ for the variables that are described in Table 2. ForceDecks uses a 20-N offset from the measured bodyweight, which was quantified before all jump trials to define the start of the movement. The end of the eccentric phase and start of the concentric phase was defined as minimum absolute displacement (zero velocity), and take-off was defined as the time point at which the total vertical force fell below the threshold of 30 N below bodyweight [27]. Interlimb asymmetries in concentric and eccentric impulse (IMP) were calculated using the same equation as for the running kinetics. The investigators used the absolute value of the asymmetry results since the side of the asymmetry was not of interest in this study. CMJ landing was not analyzed in this study.
2.4. Statistical Analysis
All statistical analyses were processed using the Statistics Package for Social Sciences (ver. 28; IBM Corporation, New York, NY, USA). Descriptives (means ± standard deviations (SD); 95% confidence intervals (CI) were calculated by position groups (Skill, Big-skill, Big). A multivariate analysis of variance (MANOVA) with Least Square Difference (LSD) post-hoc for multiple pairwise comparisons, was used to calculate differences in the morphological and biomechanics performance characteristics between groups, p≤0.05. Effect sizes (d) were also calculated for the pairwise comparisons. An effect size of less than 0.2 was considered trivial, 0.2–0.6 a small effect, 0.6–1.2 a moderate effect, 1.2–2.0 a large effect, 2.0–4.0 a very large effect, and 4.0 and above an extremely large effect [29].
3. Results
Table 3, Table 4 and Table 5 display the results for the morphological, running biomechanics, and CMJ biomechanics for each position group, respectively.
3.1. MANOVA Group Differences
There was a significant between-group difference in the characteristics, F(26,80)=5.70, p<0.001; Wilk’s Λ=0.123, partial η2=0.649 indicating that player position group moderately affects morphology and speed running and jumping biomechanics performance. LSD post-hocs showed Big had significantly greater BF%, LBM, total body mass, and GCT than Skill (large effects) and Big-Skill (large effects), p<0.05. Big-skill had significantly greater GCT asymmetry than Skill (small effect) and Big (large effect), p<0.05. Skill had significantly greater JH, CMJ-NPP, reactive strength, and running force versus Big (moderate and large effects), p<0.05, but not Big-skill (p>0.05). Asymmetries in running forces, and CMJ eccentric and concentric IMP were not significantly different between groups, p>0.05.

Table 3.
Morphological characteristics (means ± SD; 95% CI) by player position group, and pairwise comparison results.
Table 3.
Morphological characteristics (means ± SD; 95% CI) by player position group, and pairwise comparison results.
| Player position group | Total body mass (kg) |
Lean body mass (kg) |
Body fat (%) |
|||
|---|---|---|---|---|---|---|
| Skill (n=27) | 89.3±7.6b (85.8, 92.7) |
80.9±6.9b (78.6, 83.3) |
9.3±2.8b (7.6, 10.9) |
|||
| Big-skill (n=11) | 105.6±4.0b (100.2, 111.0) |
93.8±4.6b (90.1, 97.5) |
11.1±3.4b (8.6, 13.7) |
|||
| Big (n=17) | 126.7±12.5a (122.4, 131.1) |
102.3±5.5a (99.5, 105.3) |
18.8±6.2a (16.7, 20.8) |
|||
| Pairwise Comparisons | ||||||
| p value | d | p value | d | p value | d | |
| Skill vs Big-skill | <0.001 | 2.68 | <0.001 | 2.20 | 0.233 | 0.58 |
| Skill vs Big | <0.001 | 3.62 | <0.001 | 3.55 | <0.001 | 1.97 |
| Big-skill vs Big | <0.001 | 2.27 | <0.001 | 1.77 | <0.001 | 1.54 |
Note: Group means with same lowercase letter are not statistically different from one another, p>0.05.
Table 4.
Running biomechanics characteristics (means ± SD; 95% CI) by player position group, and pairwise comparison results.
Table 4.
Running biomechanics characteristics (means ± SD; 95% CI) by player position group, and pairwise comparison results.
| Player position group |
Running GCT (sec) |
Running GCT asymmetry (%) |
Running force (BW) |
Running force asymmetry (%) | ||||||
|---|---|---|---|---|---|---|---|---|---|---|
| Skill (n=27) | 0.15±0.02b (0.14, 0.16) |
3.3±3.6b (1.8, 4.6) |
2.94±0.31a (2.82, 3.1) |
5.2±4.4a (2.8, 3.1) |
||||||
| Big-skill (n=11) | 0.16±0.02b (0.15, 0.18) |
4.3±3.1a (2.2, 6.4) |
2.73±0.28ab (2.54, 2.92) |
7.6±11.3a (2.6, 3.0) |
||||||
| Big (n=17) | 0.20±0.03a (0.19, 0.21) |
1.5±2.4b (0.2, 2.8) |
2.68±0.35b (2.52, 2.83) |
5.4±4.7 (2.5, 2.8) |
||||||
| Pairwise Comparisons | ||||||||||
| p value | d | p value | d | p value | d | p value | d | |||
| Skill vs Big-skill | 0.430 | 0.50 | 0.485 | 0.30 | 0.233 | 0.71 | 0.381 | 0.28 | ||
| Skill vs Big | <0.001 | 1.96 | <0.001 | 0.59 | <0.001 | 0.79 | 0.020 | 0.04 | ||
| Big-skill vs Big | 0.001 | 1.57 | <0.001 | 1.01 | <0.001 | 0.16 | >0.999 | 0.25 | ||
Notes: Group means with same lowercase letter are not statistically different from one another, p>0.05. GCT = ground contact time. BW = body weight.
Table 5.
Countermovement jump biomechanics characteristics (means ± SD; 95% CI) by player position group, and pairwise comparison results.
Table 5.
Countermovement jump biomechanics characteristics (means ± SD; 95% CI) by player position group, and pairwise comparison results.
| Player position group | CMJ height (cm) | RSImod (m/s) |
Normalized peak power (W/kg) |
Eccentric impulse asymmetry (%) |
Concentric impulse asymmetry (%) | |||||||||
|---|---|---|---|---|---|---|---|---|---|---|---|---|---|---|
| Skill (n=27) |
46.7±5.8a (43.2, 47.6) |
0.62±0.12a (0.57, 0.66) |
63.2±4.7a (61.2, 65.1) |
9.0±7.4a (6.5, 11.6) |
5.7±6.5a (3.4, 8.1) |
|||||||||
| Big-skill (n=11) | 42.3±3.5ab (38.8, 45.5) |
0.52±0.07ab (0.45, 0.60) |
59.0±2.0ab (56.0, 61.9) |
9.5±5.9a (5.6, 13.5) |
6.5±5.7a (2.8, 10.1) |
|||||||||
| Big (n=17) |
38.9±6.7b (36.7, 45.7) |
0.48±0.13b (0.42, 0.54) |
55.3±6.4b (52.9, 57.7) |
7.9±5.5a (3.1, 9.0) |
6.1±5.6a (4.7, 11.1) |
|||||||||
| Pairwise Comparisons | ||||||||||||||
| p value | d | p value | d | p value | d | p value | d | p value | d | |||||
| Skill vs Big-skill |
0.430 | 0.92 | 0.106 | 1.02 | 0.063 | 1.16 | >0.999 | 0.07 | >0.999 | 0.13 | ||||
| Skill vs Big | <0.001 | 1.24 | <0.001 | 1.12 | <0.001 | 1.41 | >0.999 | 0.17 | >0.999 | 0.07 | ||||
| Big-skill vs Big | 0.001 | 0.64 | 0.957 | 0.38 | 0.180 | 0.78 | >0.999 | 0.28 | >0.999 | 0.07 | ||||
Notes: Group means with same lowercase letter are not statistically different from one another, p>0.05. CMJ = countermovement jump. RSImod = modified reactive strength index.
3.2. Radar Plot
Figure 4 is a radar plot constructed from the Z-scores of each of the 12 characteristics to visually display player position group differences.
4. Discussion
This is the first study to provide a detailed profile of laboratory-based morphological and performance biomechanics characteristics of NFL draft-eligible American style football players. Previous investigators have detailed the characteristics of morphological and/or field-based performance in junior college [30], NCAA Division I [6,7,31,32], Division II [32], Division III [33,34], and professional [4,8,13] players by position providing context for the current study. The inclusion of speed running kinetics derived from an instrumented treadmill in the current study is unique and adds greater detail to the force application strategy used by players of different positions. Collection of such information is currently uncommon due to equipment expense and accessibility, time constraints, and required expertise. However, with the emergences of markerless motion capture technology, highly trained sport scientists working with teams, and the desire by coaches and athletes for greater specificity of performance, we see data from the current study being used by future practitioners and researchers. Further, in addition to CMJ peak power, we have presented impulse asymmetry measures that may not only be of interest to the aforementioned parties, but athletic trainers and sports physiotherapists.
Results show a trend amongst Skill, Big-skill, and Big groups of American style football players. Big players possessed the greatest morphology characteristics, whereas Skill players produced the better performance characteristics such as the smallest speed running GCT and the highest CMJ height, power, and reactive strength. The Big-skill group possesses a combination of the Big and the Skill group characteristics. Specifically, regarding the morphology measurements, we hypothesized that players in the Big group would be heavier (greater total body mass and LBM) and possess greater BF% when compared to the Big-skill and Skill players. This hypothesis was confirmed. For the speed running biomechanics, we hypothesized that Bigs would have longer GCT, greater GCT and force asymmetries, but smaller normalized force when compared to the other two groups. This was partially supported as Bigs had significantly longer GCT than Big-skill and Skill. Further differences will be discussed in the next section. For the CMJ performance biomechanics, we hypothesized that Bigs would have the lowest JH, RSImod, CMJ-NPP, and IMP asymmetries when compared to Big-skill and Skill players. This hypothesis was generally supported, but comparisons were not statistically significant. The profiles will be discussed in more detail in the following sections.
4.1. Big Player Group
Big players are offensive and defensive linemen. Strength and large physical characteristics are advantageous for linemen given their field position requirements. It is widely recognized that body sizes in American style football have been increasing over time [10,35]. The weight at all positions except kickers has significantly increased over time with offensive linemen experiencing the greatest change [35]. One key factor is that there are no weight limits in the NFL. If they have the strength to hold the line or push through the line of scrimmage, a larger weight would be more difficult for the opponent to stop. However, a balance between increasing body fat % and lean body mass is essential. Increasing one’s overall body mass correlates with decreased endurance performance [36,37,38,39,40], whereas increasing one’s lean body mass also correlates with regional increases in strength [25,38]. To be an effective lineman, players need the impulse (force x time) and muscular strength to push against a force that’s also pushing against them and compete throughout all four quarters of the game. While body mass is important for these players, it comes at a cost to their agility. These players tend to have longer ground contact times with a lower CMJ height, CMJ reactive strength, and CMJ normalized peak power suggesting that they sacrifice the biomechanics needed for fast speed and higher vertical jump for their increased mass and strength. Examining participants at the NFL combine from 2005-2009, the Big players scored better than all other positions at tests involving strength, such as maximum repetition bench press and predictive measure of maximal strength, while scoring lower than all other positions in the speed and jump tests [13]. An interesting biomechanical finding within the Big player population is their running GRF when normalized to body weight. These players have the greatest weight and are expected to have a greater absolute GRF, but when normalized, they tend to have the least force placed onto the group. Previous studies have noticed this finding in obese recreational runners [41] and a similar group of American style football players [42]. However, future studies need to be conducted to further investigate this trend since this player group has shown significant increases in mass over the last 50 years but is running faster at the combine [7]. The major trend these players follow is focusing on increasing their weight and strength. Even though these players need to be well-rounded in all their performance measures, they need to excel at strength and physical explosiveness tests to compete with the other linemen.
4.2. Skill Player Group
Athletes categorized in the Skill player group, such as wide receivers and defensive backs, have completely opposite characteristics. Opposed to favoring a large body mass habitus like the Big players, Skill players tend to favor biomechanics needed for improved agility. They have lower ground contact times and greater CMJ attributes, which are ideal qualities for the quick movements required of their positions. From previous NFL combine data, cornerbacks and wide receivers performed better in the 36.6m sprint than all other positions, and similarly, cornerbacks, free safeties, and strong safeties all performed better on the CMJ vertical jump than all other positions [13]. Improving one’s speed, specifically for wide receivers during the 9.1m (10 yards) and 18.3m (20 yards) sprints, is correlated with a better draft position [43], while having a better CMJ could help increase the catch radius for these players. Each Skill player position has a unique job on the football field, but collectively, they all require quickness and mobility to compete effectively. On the other hand, their body mass characteristics tend to be less than the positions in the Big player group. There are some inter-positional differences in body characteristics, but when examining intra-positional differences, offensive and defensive positions that mirror each other on the football field share similar body composition measures, such as total fat mass and lean body mass [11]. Having similar body mass and biomechanics between mirroring positions allows for competitive physicality when going after football. If a cornerback is slower or can’t jump as high as the wide receiver, the offense would continuously outperform the opponent’s defense. It is important to note that the body mass characteristics may be lower than the larger linemen, but their mass is generally greater than age matched controls [36]. The combination of exercise and weightlifting places increased metabolic stress on the body, and these players need to routinely replenish the lost calories with a high calorie diet. Like the linemen, a balance should exist within their training. Strength training is important, but improving biomechanics relating to speed and agility may help the player stand out from others in the same position. Should info be added on potential training programs?
4.3. Big-Skill Player Group
The Big-skill players, like tight ends, are athletes who have qualities similar to both linemen and wide receivers in addition to their mirror defensive counterparts. Their body mass characteristics and CMJ attributes were in between the two groups. Tight ends, specifically, weigh significantly less but match a similar height as the linemen, and when compared to wide receivers, they are significantly taller and heavier [11]. This makes this position very versatile. They have the mass to block linebackers and other defensive players but also can run quick passing routes as a receiver. In predictive models, tight ends having increased height, BMI, bench press, total college yards, and decreased forty-yard dash times predict a better draft order for these players [44]. Many variables play into the selection process, but a true balance between large morphologic characteristics, strength, and improved biomechanics for speed and agility are important for players in the Big-skill position. Interestingly, this study found a unique trend of greater asymmetry amongst positions in the Big-skill group. They produced the greatest percent asymmetries for eccentric impulse, concentric impulse, running GCT, and running force. This may reflect the variability of their field position requirements. However, reducing these asymmetries may improve performance at the NFL combine for the 36.6m sprint and the vertical jump.
5. Conclusions
This study described differences in body composition, and laboratory-based biomechanics markers of speed-running and countermovement jumping between three position groups (Big, Big-skill, Skill) in American style football players training for the NFL draft. The results show stark differences between Big and Skill players with Big-skill possessing a mix of characteristics. These players' tremendous natural abilities, and team training regimens, have led them through advancing filters to the pinnacle of the sport, and along the way, they have acquired specific body habitus and characteristics fitted to their unique positions. The Big players have maximized their body mass characteristics, Skill players have maximized their agility, and Big-skill players are a combination of the two. Through their specialization, they have amassed morphological imbalances pointed out by biomechanical testing. These imbalances, such as Big players with longer GCT, lower CMJ height, reactive strength, and CMJ normalized peak power, and Big skill players with the greatest asymmetries for eccentric impulse, concentric impulse, running GCT, and running force, can be targeted with individually tailored training. Athletic trainers and coaches can use biomechanical and morphological data to help improve these imbalanced areas, maximize the performance requirements at each position, and limit injury. Longitudinal studies are needed following individualized training programs, to quantify performance improvements and degree of injury prevention.
Author Contributions
The large number of authors on this paper reflects the team approach used not only to conceptualize the study and compile the supporting literature, but to collect on such a large sample size in only two days utilizing high-tech laboratory-based equipment. Each author contributed in the following specific ways: Conceptualization, G.M.M. and P.B.; methodology, G.M.M., M.B., A.R., J.P., A.N., T.T., A.S., J.S., E.T..; software, G.M.M, M.B., T.T.; validation, G.M.M., A.S., J.S.; formal analysis, G.M.M., M.B., A.R.; writing—original draft preparation, G.M.M., A.S., J.S.; and writing—review and editing, G.M.M., M.B., A.R., J.P., A.S., J.S., A.N., T.T., E.T., P.B.; All authors have read and agreed to the published version of the manuscript.
Funding
This research received no external funding.
Institutional Review Board Statement
The study was conducted in accordance with the Declaration of Helsinki, and approved by the Institutional Review Board of Nova Southeastern University (Protocol code 2018-684, 5, January, 2023).
Informed Consent Statement
Informed consent was obtained from all participants involved in the study. Written informed consent has been obtained from the patient(s) to publish this paper.
Data Availability Statement
The data presented in this study are available on request from the corresponding author. The data are not publicly available due to privacy protections of the participants.
Conflicts of Interest
The authors declare no conflicts of interest.
References
- Iosia, M.F.; Bishop, P.A. Analysis of exercise-to-rest ratios during division IA televised football competition. J Strength Cond Res 2008, 22, 332–40. [Google Scholar] [CrossRef] [PubMed]
- Pincivero, D.M.; Bompa, T.O. A physiological review of American style football. Sports Med 1997, 23, 247–260. [Google Scholar] [CrossRef] [PubMed]
- Bosch, T.A.; Carbuhn, A.F.; Stanforth, P.R.; Oliver, J.M.; Keller, K.A.; Dengel, D.R. Body composition and bone mineral density of division 1 collegiate football players: A consortium of college athlete research study. J Strength Cond Res 2019, 33, 1339–1346. [Google Scholar] [CrossRef] [PubMed]
- Ward, P.A.; Ramsden, S.; Coutts, A.J.; Hulton, A.T.; Drust, B. Positional differences in running and nonrunning activities during elite American style football training. J Strength Cond Res 2018, 32, 2072–2084. [Google Scholar] [CrossRef]
- Miller, T.A.; White, E.D.; Kinley, K.A.; Congleton, J.J.; Clark, M.J. The effects of training history, player position, and body composition on exercise performance in collegiate football players. J Strength Cond Res 2002, 16, 44–49. [Google Scholar]
- Melvin, M.N.; Smith-Ryan, A.E.; Wingfield, H.L.; Ryan, E.D.; Trexler, E.T.; Roelofs, E.J. Muscle characteristics and body composition of NCAA Division I football players. J Strength Cond Res 2014, 28, 3320–3329. [Google Scholar] [CrossRef]
- Jacobson, B.H.; Conchola, E.G.; Glass, R.G.; Thompson, B.J. Longitudinal morphological and performance profiles for American, NCAA Division I football players. J Strength Cond Res 2013, 27, 2347–2354. [Google Scholar] [CrossRef]
- Pryor, J.L.; Huggins, R.A.; Casa, D.J.; Palmieri, G.A.; Kraemer, W.J.; Maresh, C.M. A profile of a National Football League team. J Strength Cond Res 2014, 28, 7–13. [Google Scholar] [CrossRef]
- Dengel, D.R.; Evanoff, N.G. Positional differences in muscle-to-bone ratio in National Football League players. Int J Sports Med 2023, 2023 44, 720–727. [Google Scholar] [CrossRef]
- Anzell, A.R.; Potteiger, J.A.; Kraemer, W.J.; Otieno, S. Changes in height, body weight, and body composition in American style football players from 1942 to 2011. J Strength Cond Res 2013, 27, 77–284. [Google Scholar] [CrossRef]
- Kraemer, W.J.; Torine, J.C.; Silvestre, R.; French, D.N.; Ratamess, N.A.; Spiering, B.A.; Hatfield, D.L.; Vingren, J.L.; Volek, J.S. Body size and composition of National Football League players. J Strength Cond Res 2005, 19, 485–489. [Google Scholar] [PubMed]
- Vitale, J.A.; Caumo, A.; Roveda, E.; Montaruli, A.; La Torre, A.; Battaglini, C.L.; Carandente, F. Physical attributes and NFL combine performance tests between Italian National League and American style football players: a comparative study. J Strength Cond Res 2016, 30, 2802–2808. [Google Scholar] [CrossRef] [PubMed]
- Robbins, D.W. Positional physical characteristics of players drafted into the National Football League. J Strength Cond Res 2011, 25, 2661–2667. [Google Scholar] [CrossRef] [PubMed]
- 2023 NFL draft: Every team's full set of picks. Available online: https://www.nfl.com/news/2023-nfl-draft-every-team-s-full-set-of-picks (accessed on 3 February 2024).
- Teramoto, M.; Cross, C.L.; Willick, S.E. Predictive value of national football league scouting combine on future performance of running backs and wide receivers. J Strength Cond Res 2016, 30, 1379–1390. [Google Scholar] [CrossRef]
- Tucker, R.; Black, W. Predictive validity of the physical skills test of the 40-yard dash and draft placement in the NFL draft. The Sport Journal 2023, 26. [Google Scholar]
- Sierer, S.P.; Battaglini, C.L.; Mihalik, J.P.; Shields, E.W.; Tomasini, N.T. The National Football League combine: Performance differences between drafted and nondrafted players entering the 2004 and 2005 drafts. J Strength Cond Res 2008, 22, 6–12. [Google Scholar] [CrossRef]
- Haugen, T.; McGhie, D.; Ettema, G. Sprint running: From fundamental mechanics to practice—a review. Eur J Appl Physiol 2019, 119, 1273–1287. [Google Scholar] [CrossRef]
- Clark, K.; Weyand, P. Are running speeds maximized with simple-spring stance mechanics? J Appl Physiol 2014, 116, 604–615. [Google Scholar] [CrossRef]
- Mokha, G.M.; Silver, T.A.; Bommarito, P. NFL draft prep players improve 40-yard run times and foot-ground kinetics. Res Dir Strength Perfor, 2021; 1, 4. [Google Scholar]
- Munro, C.F.; Miller, D.I.; Fuglevand, A.J. Ground reaction forces in running: A reexamination. J Biomech 1987, 29, 147–155. [Google Scholar] [CrossRef]
- Škarabot, J.; Cronin, N.; Strojnik, V.; Avela, J. Bilateral deficit in maximal force production. Eur J Appl Physiol 2016, 116, 2057–2084. [Google Scholar] [CrossRef]
- Girard, O.; Morin, J.; Ryu, J.; Read, P.; Townsend, N. Running velocity does not influence lower limb mechanical asymmetry. Front Sports Act Living 2019, 1, 36. [Google Scholar] [CrossRef] [PubMed]
- McMahon, J.J.; Jones, P.A.; Suchomel, T.J.; Lake, J.; Comfort, P. Influence of the reactive strength index modified on force-- and power--time curves. Int J of Sports Physiol Perform. 2018, 13, 220–227. [Google Scholar] [CrossRef] [PubMed]
- Harman, E.A.; Rosenstein, M.T.; Frykman, P.; Rosenstein, R.M.; Kraemer, W.J. Estimation of human power output from vertical jump. J Strength Cond Res 1991, 5, 116–120. [Google Scholar]
- Bell, D.R.; Sanfilippo, J.L.; Binkley, N.; Heiderscheit, B.C. Lean mass asymmetry influences force and power asymmetry during jumping in collegiate athletes. J Strength Cond Res 2014, 28, 884–891. [Google Scholar] [CrossRef] [PubMed]
- Bishop, C.; Read, P.J.; Chavda, S.; Turner, A.N. Asymmetries of the lower limb: The calculation conundrum in strength training and conditioning. Strength Cond J 2016, 38, 27–32. [Google Scholar] [CrossRef]
- Key moments and phases of a countermovement jump. Available online: https://support.vald.com/hc/en-au/articles/4999710329113-Key-Moments-and-Phases-of-a-Countermovement-Jump (accessed on 3 February 2024).
- Hopkins, W.G. How to interpret changes in an athletic performance test. Sportscience 2004, 8, 1–7. [Google Scholar]
- Lockie, R.G.; Lazar, A.; Orjalo, A.J.; Davis, D.L.; Moreno, M.R.; Risso, F.G.; Hank, M.E.; Stone, R.C.; Mosich, N.W. Profiling of junior college football players and differences between position groups. Sports 2016, 4, 41. [Google Scholar] [CrossRef]
- Secora, C.A.; Latin, R.W.; Berg, K.E.; Noble, J.M. Comparison of physical and performance characteristics of NCAA Division I football players: 1987 and 2000. J Strength Cond Res 2004, 18, 286–291. [Google Scholar] [CrossRef]
- Garstecki, M.A.; Latin, R.W.; Cuppett, M.M. Comparison of selected physical fitness and performance variables between NCAA Division I and II football players. J Strength Cond Res 2004, 18, 292–297. [Google Scholar] [CrossRef]
- Schmidt, W.D. Strength and physiological characteristics of NCAA Division III American style football players. J Strength Cond Res 1999, 13, 210–213. [Google Scholar]
- Stuempfle, K.J.; Katch, F.I.; Petrie, D.F. Body composition relates poorly to performance tests in NCAA Division III football players. J. Strength Cond. Res. 2003, 17, 238–244. [Google Scholar] [CrossRef] [PubMed]
- Yamamoto, J.B.; Yamamoto, B.E.; Yamamoto, P.P; Yamamoto, L.G. Epidemiology of college athlete sizes, 1950s to current. Res Sports Med 2008, 16, 111–27. [Google Scholar] [CrossRef] [PubMed]
- Elliot, K.R.; Harmatz, J.S.; Zhao, Y.; Greenblatt, D.J. Body size changes among National Collegiate Athletic Association New England Division III football players, 1956-2014: Comparison with age-matched population controls. J Athl Train 2016, 51, 373–381. [Google Scholar] [CrossRef] [PubMed]
- Spartali, I.; Kostantinos, H.; Ioannis, K.; Thrasivoulos, P. Body fat percentage and body mass index as predictors of cadets’ physical performance. Open Sports Sci J 2014, 7, 53–59. [Google Scholar] [CrossRef]
- Charlton, K.; Batterham, M.; Langford, K.; Lateo, J.; Brock, E.; Walton, K.; Lyons-Wall, P.; Eisenhauer, K.; Green, N.; McLean, C. Lean body mass associated with upper body strength in healthy older adults while body fat limits lower extremity performance and endurance. Nutrients 2015, 7, 7126–7142. [Google Scholar] [CrossRef]
- Maciejczyk, M.; Wiecek, M.; Szymura, J.; Szygula, Z.; Wiecha, S.; Cempla, J. The influence of increased body fat or lean body mass on aerobic performance. PLoS One 2014, 9, e95797. [Google Scholar] [CrossRef]
- Harris, T. Muscle mass and strength: Relation to function in population studies. J Nutr 1997, 127, 1004S–1006S. [Google Scholar] [CrossRef]
- Vincent, H.K.; Kilgore, J.E.; Chen, C.; Bruner, M.; Horodyski, M.; Vincent, K.R. Impact of body mass index on biomechanics of recreational runners. Phys Med Rehabil 2020, 12, 1106–1112. [Google Scholar] [CrossRef]
- Stensland, J.; Schafer, A.; Thompson, T.; Petruzzelli, J.; Berrocales, M.; Nasri, A.; Rohman, A.; Siegel, M.; Rocanelli, R.; Bommarito, P.; Mokha, M. Bigger players run softer: Body composition and running kinetics of American style football players. InterLACE, Ft. Lauderdale, United States, 14 April 2023.
- Kuzmits, F.E.; Adams, A.J. The NFL combine: Does it predict performance in the National Football League? J Strength Cond Res 2008, 22, 1721–1727. [Google Scholar] [CrossRef]
- Mulholland, J.; Jensen, S.T. Predicting the draft and career success of tight ends in the National Football League. J Quant Anal Sports 2014, 10, 381–396. [Google Scholar] [CrossRef]
Figure 1.
Morphological measurements taken using InBody 270.
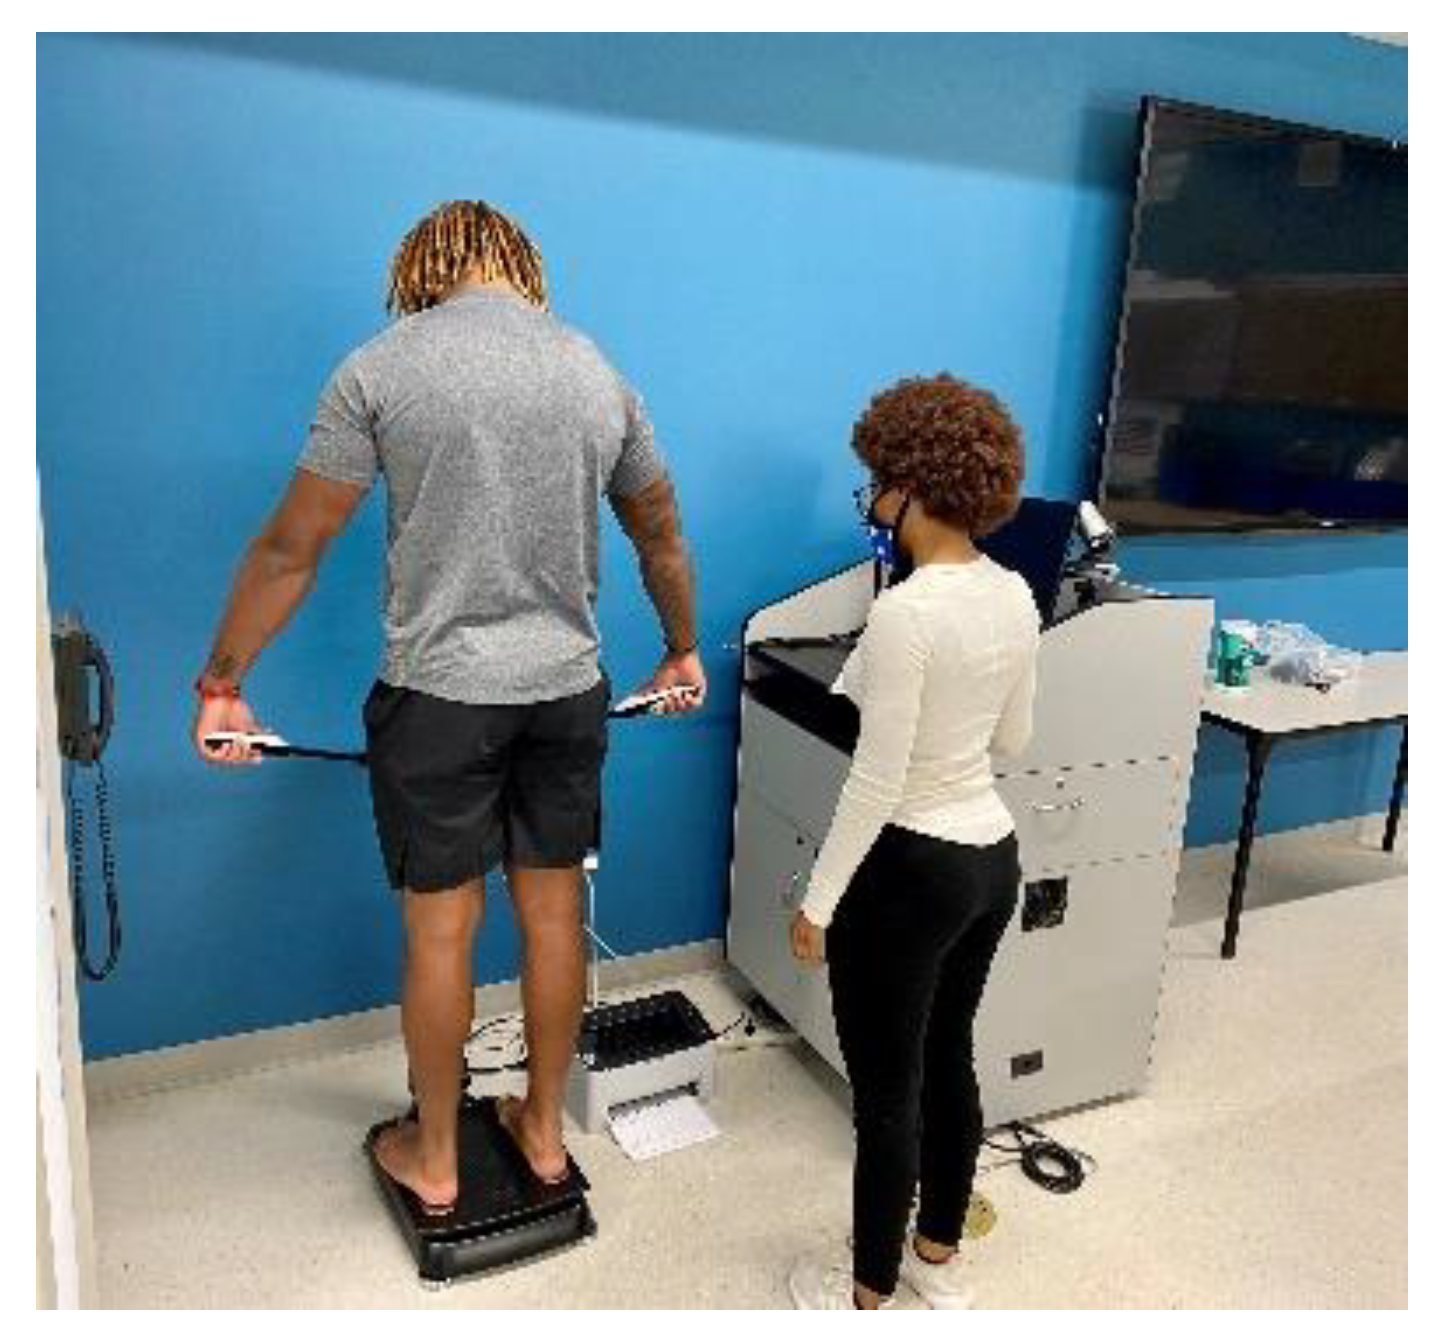
Figure 3.
Countermovement jump assessment using dual uniaxial force plates.
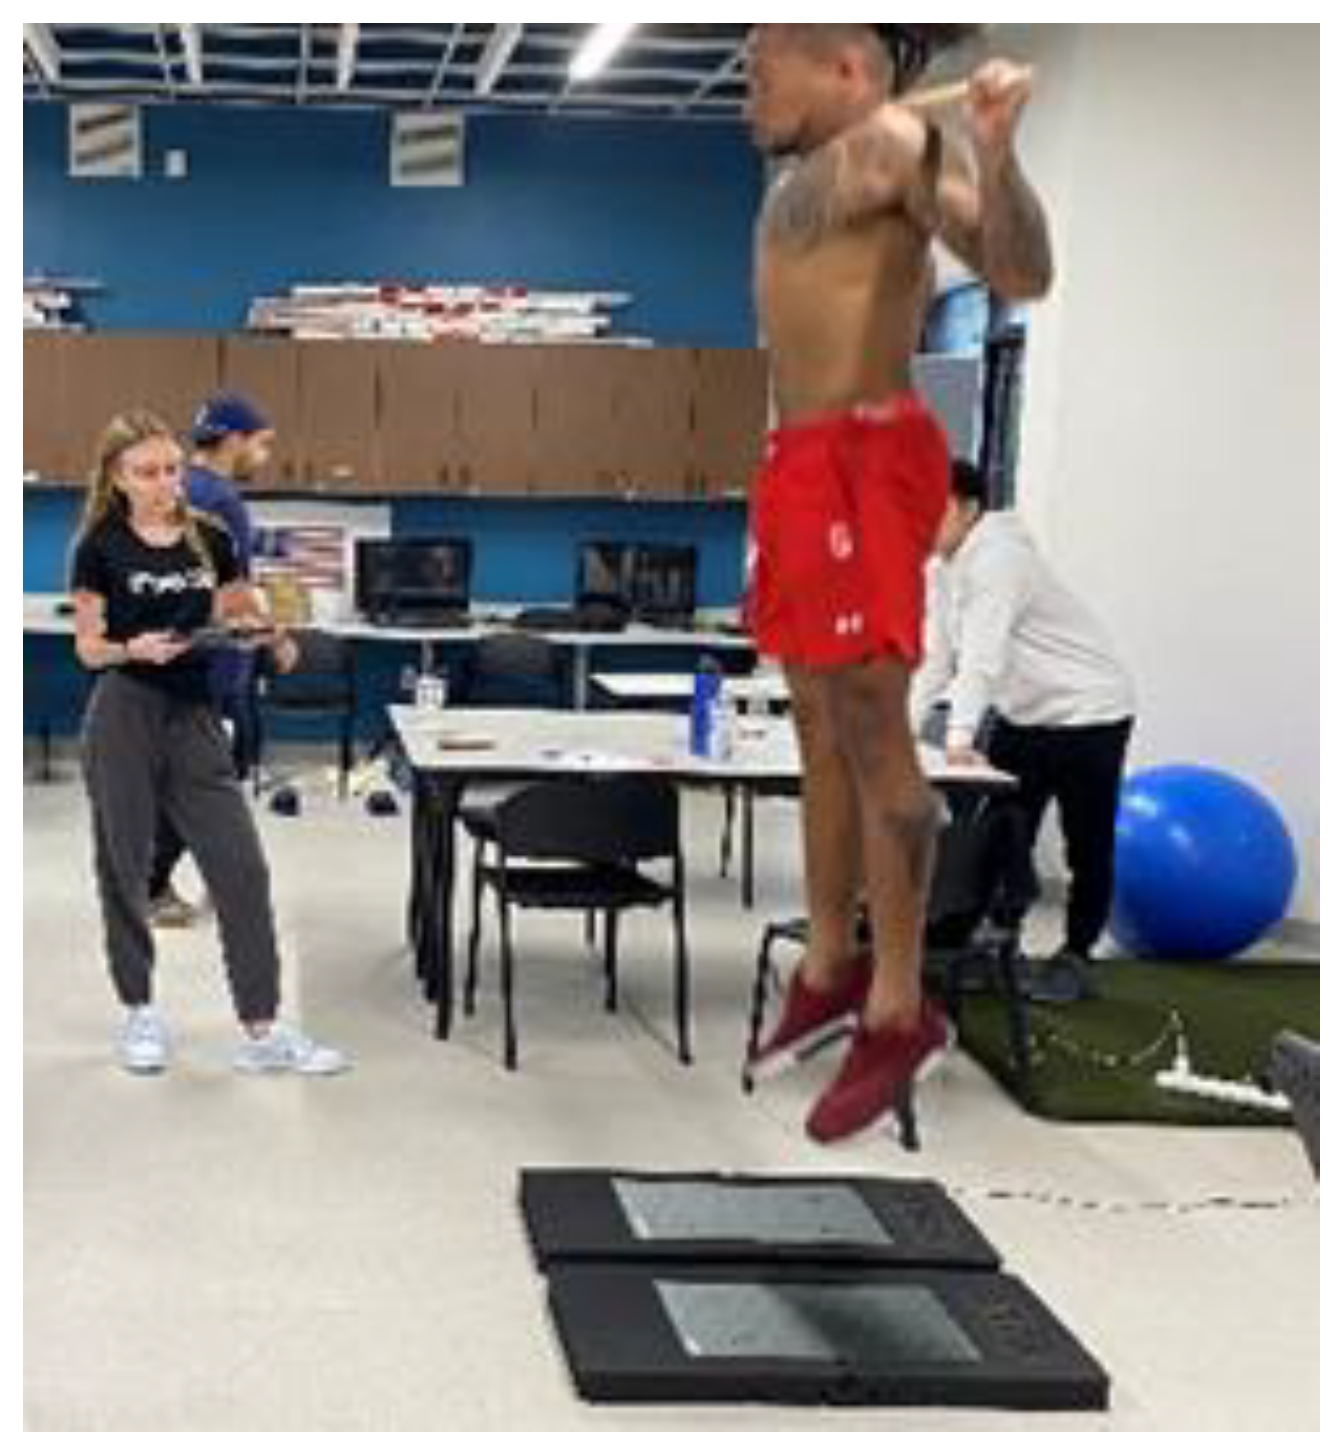
Figure 4.
Radar plot of the 12 morphological and biomechanics performance characteristics based on player position group. CMJ = countermovement jump.
Figure 4.
Radar plot of the 12 morphological and biomechanics performance characteristics based on player position group. CMJ = countermovement jump.
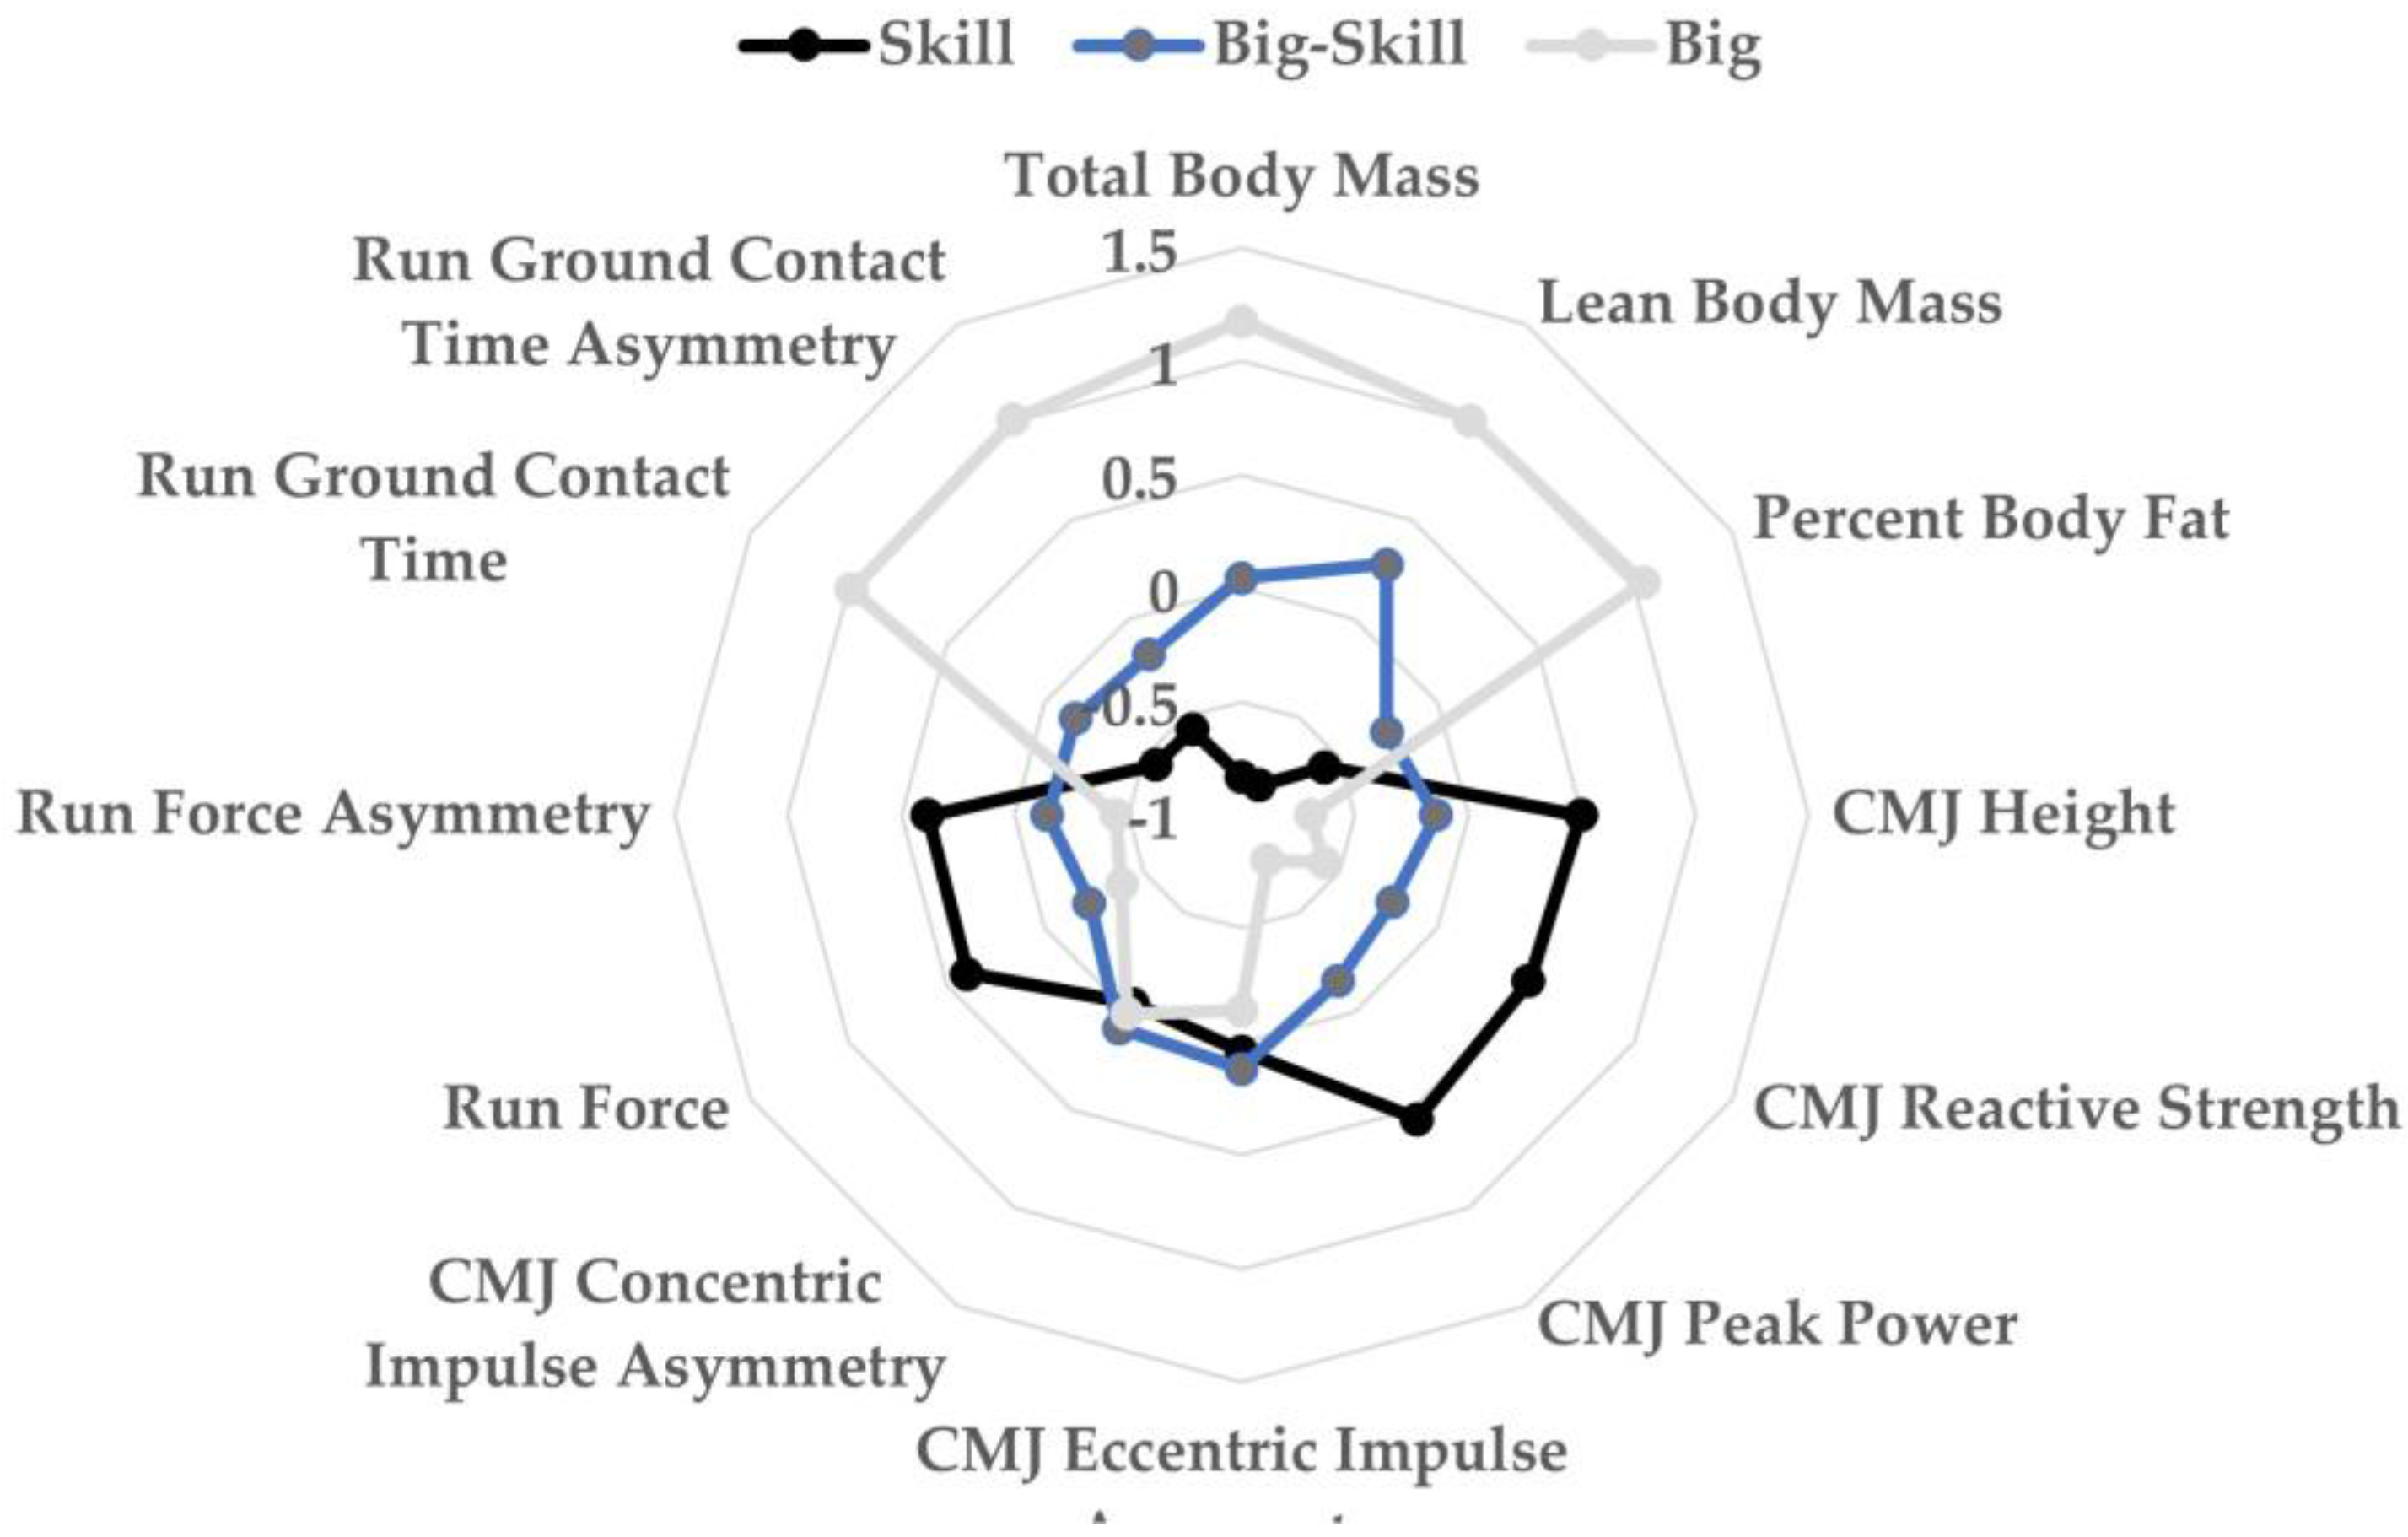
Table 1.
General description of field specific positional differences in American style football.
| Position | Description | Group |
|---|---|---|
| Offensive linemen | Protect the quarterback by blocking the defensive line of the opposition; typically, do not handle the ball (aside from the snap from the center lineman) | Big |
| Quarterbacks | Receives the ball to start the play where he may run the ball himself, throw it to a player further up the field, or hand it to a ball carrier to run with it | Big-skill |
| Running backs | May be handed the ball to run with it, catch passes, or block | Skill |
| Tight ends | Hybrid position and may block or run routes and catch passes | Big-skill |
| Wide receivers | Run pass routes and catch the ball | Skill |
| Defensive backs | Cover wide receivers to break up passes and to make interceptions | Skill |
| Defensive linemen | Rush the quarterback, tackle runners to disrupt the play | Big |
| Linebackers | Tackle ball carriers, rush the quarterback | Big-skill |
Table 2.
Description of countermovement jump variables collected using dual uniaxial plates.
| Variable | Units | Definition |
| Jump height | cm | Maximal displacement of the participant’s center of mass (CoM); (take-off velocity)2 / 2(9.81m/s2) |
| Reactive strength index, modified | m/s | Ability to change quickly from eccentric to concentric contraction; jump height / contraction time |
| Normalized peak power | W/kg | Highest power output during the jump relative to a participant’s body mass |
| Concentric impulse asymmetry | % | Absolute difference in right and left limbs in total work from the point of the lowest portion of the CoM to the point of take-off, or the propulsion phase |
| Eccentric impulse asymmetry | % | Absolute difference in right and left limbs in total work from the point the movement starts to the lowest point of the CoM depth |
Disclaimer/Publisher’s Note: The statements, opinions and data contained in all publications are solely those of the individual author(s) and contributor(s) and not of MDPI and/or the editor(s). MDPI and/or the editor(s) disclaim responsibility for any injury to people or property resulting from any ideas, methods, instructions or products referred to in the content. |
© 2024 by the authors. Licensee MDPI, Basel, Switzerland. This article is an open access article distributed under the terms and conditions of the Creative Commons Attribution (CC BY) license (http://creativecommons.org/licenses/by/4.0/).
Copyright: This open access article is published under a Creative Commons CC BY 4.0 license, which permit the free download, distribution, and reuse, provided that the author and preprint are cited in any reuse.


