1. Introduction
Global inequalities stem from conflicts related to race, gender, nationality, religion, generation, and economic status, often manifesting in various forms of discrimination (Go, 2014). One of the most visible manifestations is housing discrimination, which can take forms such as racial steering, where real estate agents discourage individuals of certain racial backgrounds from purchasing or renting in specific areas, thereby reinforcing segregation (Mouratidis, 2018). Additionally, landlords may evict or deny rentals to individuals with physical or mental disabilities by failing to provide necessary accommodations or imposing higher rents and deposits, obstructing equal housing opportunities (Yang, 2015). Families with children often face rejection for apartment rentals or are restricted to specific buildings or floors, along with higher security deposits, forcing them into less desirable housing conditions or greater financial burdens (Hwang et al., 2017). Discrimination against socially disadvantaged groups, particularly economically poor individuals and those with disabilities, is primarily manifested through prejudice and exclusion (Statistics Korea, 2023). Surveys show that 82% of South Koreans perceive significant societal discrimination, with high responses pertaining to gender (40.1%), disability (30.6%), and economic disparity (26.2%) (National Human Rights Commission of Korea, 2020). The economically poor (38.2%) and individuals with disabilities (33.7%) are recognized as the most vulnerable groups experiencing human rights violations and discrimination (National Human Rights Commission of Korea, 2022). Such attitudes exacerbate broader societal challenges, including the acceptance of people with disabilities, obligations toward poverty alleviation, and the welfare of older adults.
Attitudes toward socially disadvantaged groups are closely linked with residential satisfaction, which refers to overall contentment with one’s living environment (Kwon & Park, 2014). The residential environment influences individual perceptions and plays a crucial role in children’s development (Jeong, 2000). Residential conditions shape social relationships, values, attitudes, and behaviors (Kim & Kim, 2017). Thus, residential satisfaction can significantly impact attitudes toward socially disadvantaged groups. Previous studies have highlighted issues such as the intergenerational transmission of economic disparity due to social exclusion within residential spaces and the effects of residential and neighborhood environments on social capital (Go, 2014; Jeong, 2000; Jung, 2000).
Attitudes toward socially disadvantaged individuals are also strongly associated with social capital, which is defined as the sum of actual and potential resources available through social networks (Bourdieu, 1986; Francescato, 1979). Social capital centers on interpersonal relationships and directly affects attitudes (Ryu & Kim, 2013). Studies have demonstrated its influence on attitudes toward socially disadvantaged adolescents (Shim et al., 2016, 2020) and perceptions of social conflict and inclusivity (Kwon & Choi, 2021). Social capital, therefore, has the potential to alter attitudes toward socially disadvantaged individuals by fostering greater inclusivity and social cohesion.
While existing research has extensively analyzed residential factors and social capital independently, there is a notable absence of comprehensive studies that integrate these factors to examine their collective influence on attitudes toward socially disadvantaged individuals (Go, 2014; Jeong, 2000; Kwon & Park, 2014; Kim & Kim, 2017; Francescato, 1979; Bourdieu, 1986; Ryu & Kim, 2013; Shim et al., 2016, 2020; Kwon & Choi, 2021). Moreover, previous studies have primarily focused on children or adolescents, leaving a gap in understanding how these dynamics operate in adult populations. This study addresses these gaps by examining the relationships among social capital, residential satisfaction, and attitudes toward socially disadvantaged individuals, particularly among adults, to explore how these factors might vary across different vulnerable group classifications.
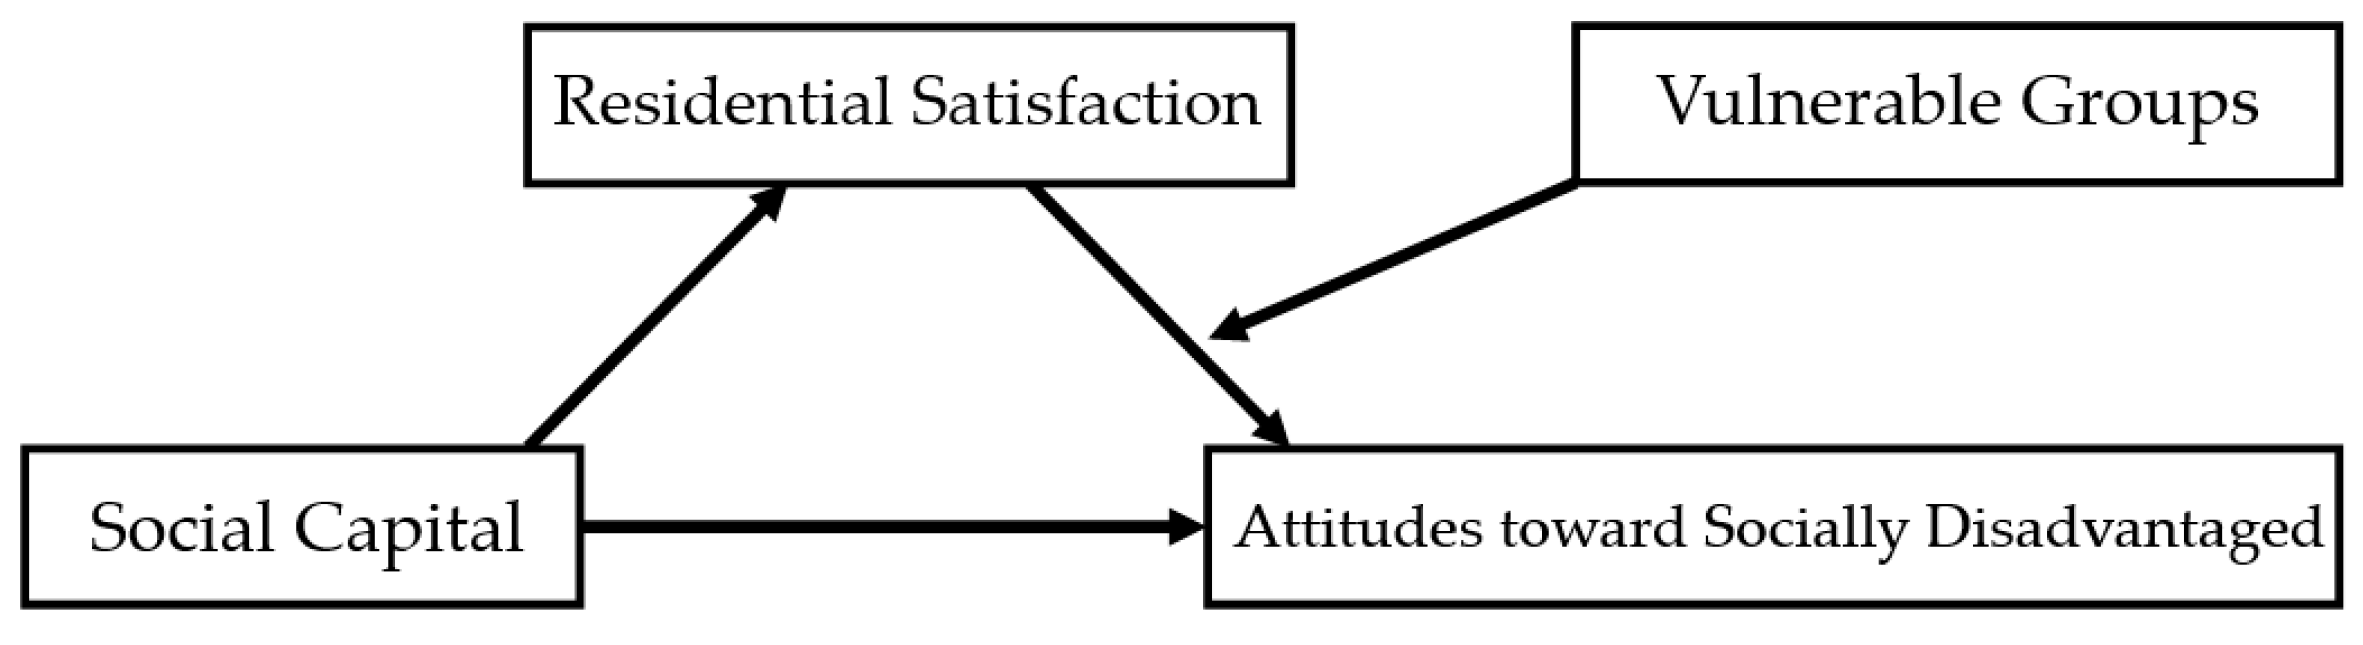
The primary objective of this study is to examine how residential satisfaction mediates the relationship between social capital and attitudes toward socially disadvantaged individuals, while also investigating how vulnerability status (such as educational and employment vulnerabilities) moderates this relationship. Specifically, this study tests whether the mediating effect of residential satisfaction varies based on vulnerability status, thereby revealing how different subgroups may experience these social and residential dynamics differently.
To achieve these aims, data from the 2022 Seoul Survey were used to conduct a mediation and moderated mediation analysis using Hayes’ (2013) Process Macro Model 14. By analyzing the collective influence of social capital and residential satisfaction on attitudes toward socially disadvantaged individuals, with moderation by vulnerability status, this study provides critical insights for housing policy and social capital development aimed at fostering social cohesion and inclusivity.
2. Review of Literature
2.1. Definition and Influencing Factors of Attitudes Toward Socially Disadvantaged Groups
The term “socially disadvantaged” refers to individuals in unfavorable social positions across various environmental contexts (Yoon & Song, 2018). Attitudes toward these groups are often shaped by perceived social distance and prejudice from other societal members. Scholars have explored these attitudes in terms of cognitive and policy-related dimensions (Hwang et al., 2017), while others define them as preferential attitudes toward the disadvantaged (Kim & Kim, 2022). Enhancing attitudes toward socially disadvantaged individuals requires focusing on relational variables, such as social capital, which has been supported by previous research.
Shim et al. (2020) identified the indirect effects of social capital elements—teacher trust, parental relationships, and peer relationships—on attitudes toward the disadvantaged through a disposition to care for them. Similarly, Kwon and Choi (2021) examined the relationship between social capital and social conflict, highlighting that improving institutional trust, enhancing perceptions of fairness, bolstering group trust, and fostering intergroup communication are crucial in addressing inclusivity, a key component of social conflict. Furthermore, Kim (2010) demonstrated that trust, a key aspect of social capital, influences welfare consciousness, with social trust (as opposed to private trust) having a greater impact on welfare attitudes. Collectively, these studies suggest that higher levels of social capital correlate with more positive attitudes toward socially disadvantaged individuals.
In addition to social capital, residential factors also influence attitudes toward disadvantaged groups. The living environment impacts individual attitudes, values, and behaviors (Kim & Kim, 2017). Childhood residential experiences significantly affect attitudes in adulthood (Jeong, 2000; Parkes et al., 2002). Lee (2020) found that homeownership and housing expenditure influence welfare attitudes, further indicating that residential conditions affect attitudes toward socially disadvantaged individuals.
2.2. Relationship Between Social Capital and Residential Environment
Social capital, first defined by Hanifan in 1916 as a network of relationships that enhances community welfare (Farr, 2004), has been explored and expanded by various scholars. Coleman (1988) defined it as intangible capital that operates within interpersonal relationships, while Putnam (1993) conceptualized it as social characteristics—networks, trust, and norms—that facilitate collective action and societal cohesion.
Bourdieu (1986) categorized social capital into networks and norms, and Coleman (1990) expanded this to include social trust and communication. Domestically, Kwon and Park (2010) highlighted networks, trust, norms, group cooperation, and openness as key elements of social capital, while Kwon and Choi (2018) added participation and reciprocity to this framework.
The residential environment, which is essential for human well-being, encompasses more than just physical housing conditions. It includes the economic, social, and cultural contexts that define the overall living environment (Kwon & Shon, 2010; Kim & Seo, 2015). Residential environments have both tangible aspects, such as housing structures, and intangible elements, such as the social dynamics of the community (Kim, 1994; Shim et al., 2020).
Although social capital and residential satisfaction may initially seem unrelated, the residential environment plays a significant role in shaping social capital. Go (2014) found that different housing types are associated with varying levels of social capital, with higher levels observed in multifamily housing settings. Kleinhans et al. (2007) further demonstrated that homeowners and single-family residents tend to have higher levels of social capital compared to renters. Additionally, social exclusion within residential spaces can perpetuate economic disparities and influence social capital formation (Go, 2014).
In summary, the residential environment significantly affects social capital by shaping the networks, trust, and social norms within a community. As the residential environment influences the development of social capital, it can also impact attitudes toward socially disadvantaged groups. This study aims to explore the intersection of these factors, building on the existing literature to better understand how the residential environment shapes social attitudes through its effects on social capital.
Figure 1.
Research model.
Figure 1.
Research model.
2.3. Study Contributions
Social capital, first defined by Hanifan in 1916 as a network of relationships that enhances community welfare (Farr, 2004), has been explored and expanded by various scholars. Coleman (1988) defined it as intangible capital that operates within interpersonal relationships, while Putnam (1993) conceptualized it as social characteristics—networks, trust, and norms—that facilitate collective action and societal cohesion.
Bourdieu (1986) categorized social capital into networks and norms, and Coleman (1990) expanded this to include social trust and communication. Domestically, Kwon and Park (2010) highlighted networks, trust, norms, group cooperation, and openness as key elements of social capital, while Kwon and Choi (2018) added participation and reciprocity to this framework.
The residential environment, which is essential for human well-being, encompasses more than just physical housing conditions. It includes the economic, social, and cultural contexts that define the overall living environment (Kwon & Shon, 2010; Kim & Seo, 2015). Residential environments have both tangible aspects, such as housing structures, and intangible elements, such as the social dynamics of the community (Kim, 1994; Shim et al., 2020).
Although social capital and residential satisfaction may initially seem unrelated, the residential environment plays a significant role in shaping social capital. Go (2014) found that different housing types are associated with varying levels of social capital, with higher levels observed in multifamily housing settings. Kleinhans et al. (2007) further demonstrated that homeowners and single-family residents tend to have higher levels of social capital compared to renters. Additionally, social exclusion within residential spaces can perpetuate economic disparities and influence social capital formation (Go, 2014).
In summary, the residential environment significantly affects social capital by shaping the networks, trust, and social norms within a community. As the residential environment influences the development of social capital, it can also impact attitudes toward socially disadvantaged groups. This study aims to explore the intersection of these factors, building on the existing literature to better understand how the residential environment shapes social attitudes through its effects on social capital.
3. Materials and Methods
To examine attitudes toward vulnerable populations in contemporary society, we utilized the latest data available from 2022. The spatial scope of our study was Seoul, where the concentration of vulnerable populations is increasingly pronounced (Hwang & Goo, 2019). To test the hypotheses, we analyzed data from the 2022 Seoul Survey, incorporating demographic characteristics along with factors such as housing environment satisfaction, social capital, and attitudes toward vulnerable populations.
3.1. Data
3.1.1. Data Sources and Variables
Data from the 2022 Seoul Survey were utilized. This survey aimed to investigate vulnerable populations residing in Seoul. Vulnerable populations in this study were classified based on their education, employment type, and pre-tax monthly average income. The criteria for each variable were as follows: education ranged from none (including preschool) (1) to university (2, 3 years); employment type included temporary wage workers (2), daily wage workers (3), special employment workers (4), self-employed with no employees (6), and unpaid family workers (7); and pre-tax monthly average income ranged from less than €349 (1) to €1,047 or more but less than €698 (4).
Table 1 summarizes the variables used in the study.
3.1.2. Housing Environment Satisfaction
The housing environment satisfaction variables used in this study were based on previous research by Kim and Kim (2022), Yoon and Lee (2016), as well as additional studies by Choi and Park (2019), Shin and Jung (2020), and Lee (2021). These studies provide a comprehensive framework for evaluating residential satisfaction by considering various dimensions of the residential environment, including safety, transportation, pedestrian environment, educational environment, green environment, housing, and access to culture and leisure activities.
Safety was measured as residents' satisfaction with the overall safety of their living area, as defined by Kim and Kim (2022). Transportation referred to satisfaction with the available transportation infrastructure, including public transit and road conditions (Choi & Park, 2019). The pedestrian environment was assessed in terms of satisfaction with the quality of pedestrian walkways and infrastructure around the home (Yoon & Lee, 2016). Educational environment satisfaction was evaluated based on access to and quality of education facilities in the residential area (Shin & Jung, 2020). Green environment satisfaction reflected satisfaction with nearby natural spaces, such as parks and green areas (Lee, 2021). Housing satisfaction was focused on the overall quality and adequacy of the residence itself (Kim & Kim, 2022). Lastly, cultural and leisure satisfaction measured how residents rated access to cultural and recreational activities in their local area (Yoon & Lee, 2016).
The reliability of the housing environment satisfaction scale, measured by Cronbach's alpha, was found to be .811, indicating a high level of internal consistency across these factors.
3.1.3. Social Capital
The social capital variables in this study were based on the works of Lee and Jang (2004), Kwon and Choi (2021), as well as complementary studies by Bae and Park (2018), Lim and Lee (2019), and Jung (2020). These variables focused on three primary dimensions of social capital: institutional trust, perceptions of fairness, and social integration.
Institutional trust was defined as the degree of trust that residents have in governmental institutions, reflecting their confidence in the ability of these institutions to act fairly and effectively (Kwon & Choi, 2021). Perceptions of fairness assessed how individuals perceived societal structures in terms of equity and justice, measuring the fairness of resource distribution and opportunities in society (Lee & Jang, 2004; Lim & Lee, 2019). Social integration perception referred to individuals' overall assessment of the degree of societal cohesion, reflecting inclusivity and the strength of social bonds within the community (Bae & Park, 2018; Jung, 2020).
The reliability coefficient (Cronbach's alpha) for the social capital scale in this study was .858, indicating strong internal consistency among the variables.
3.2. Analytic Methods
Statistical analyses for this study were conducted using SPSS version 25.0. First, the reliability of each scale was confirmed by calculating Cronbach’s alpha for all the key variables. Second, a frequency analysis was performed to describe the general characteristics of the study participants, providing a foundational understanding of the sample demographics. Third, descriptive statistics, including means, standard deviations, skewness, and kurtosis, were computed to assess the distribution of the research variables and to check whether the assumptions of normality were met.
Following these preliminary steps, Pearson’s correlation analysis was conducted to examine the relationships among the primary research variables, allowing for an exploration of the degree of association between social capital, housing environment satisfaction, and attitudes toward vulnerable populations.
To test the hypothesized mediating effect of housing environment satisfaction on the relationship between social capital and attitudes toward vulnerable populations, Hayes’ (2013) Process Macro Model 4 was employed. This model is particularly well-suited for testing mediation effects, as it allows for a clear examination of whether housing environment satisfaction serves as a mediator between social capital and attitudes toward vulnerable groups.
In addition, to examine the moderating role of vulnerability status (such as educational and employment vulnerability) in the relationship between social capital and attitudes toward vulnerable populations through housing environment satisfaction, Hayes’ Process Macro Model 14 was used. This model enables an integrated analysis of both mediation and moderation, allowing the investigation of how vulnerability moderates the indirect effects of social capital through housing environment satisfaction.
All statistical tests were conducted at a 5% significance level, ensuring that the results are robust and reliable across all analyses.
4. Results
4.1. Descriptive Statistics
The general characteristics of the 39,340 individuals selected from the 2022 Seoul Survey data were analyzed to provide a comprehensive overview of the study participants.
Table 2 presents the results of the frequency analysis, illustrating the demographic distribution of respondents. The survey focused on individuals aged 15 years and older, with the largest proportion of respondents holding high school diplomas (36.2%). Regarding employment type, the majority of respondents were regular wage workers (41.9%), followed by nonworkers (33.7%). In terms of income, the pre-tax monthly average income indicated that the highest proportion of respondents earned between €139,600 and €209,400 (₩139,600,000 and ₩209,400,000) (22.2%), with another significant portion earning between €209,400 and €279,200 (₩209,400,000 and ₩279,200,000) (22.1%).
To assess the levels of the measured variables, means and standard deviations were calculated. Specifically, the mean score for social capital was 3.14, housing environment satisfaction was 3.31, and attitudes toward vulnerable populations were 3.21. Skewness and kurtosis were computed to test for normality assumptions. All variables satisfied the assumption of normality, with skewness values below 3 and kurtosis values below 10, aligning with Kline’s (2016) guidelines for normal distribution.
Table 3 presents the descriptive statistics of the main variables. Social capital, which served as the independent variable in this study, was measured on a scale of 1 to 5, with a mean score of 3.14, indicating moderate levels of social capital. Housing environment satisfaction, the mediating variable, was also measured on a 5-point scale, showing a mean of 3.31, slightly above the moderate level. Attitudes toward vulnerable populations, the dependent variable, similarly ranged from 1 to 5, with a mean score of 3.21, suggesting attitudes were generally moderate among the respondents.
To explore the relationships among the variables, Pearson’s correlation analysis was conducted. The results indicated significant positive correlations between attitudes toward vulnerable populations and social capital (r = .411, p < .001), as well as between attitudes toward vulnerable populations and housing environment satisfaction (r = .347, p < .001). Furthermore, a strong positive correlation was found between social capital and housing environment satisfaction (r = .556, p < .001) (
Table 4). These findings suggest that higher levels of social capital and housing satisfaction are associated with more favorable attitudes toward vulnerable populations.
4.2. Mediation Analysis: Housing Satisfaction as a Mediator
To verify the mediating effect of housing environment satisfaction on the relationship between social capital and attitudes toward vulnerable populations, we conducted an analysis using Hayes’ (2013) Process Macro Model 4. This model is well-suited for examining how an independent variable (social capital) influences a dependent variable (attitudes toward vulnerable populations) both directly and indirectly through a mediating variable (housing environment satisfaction).
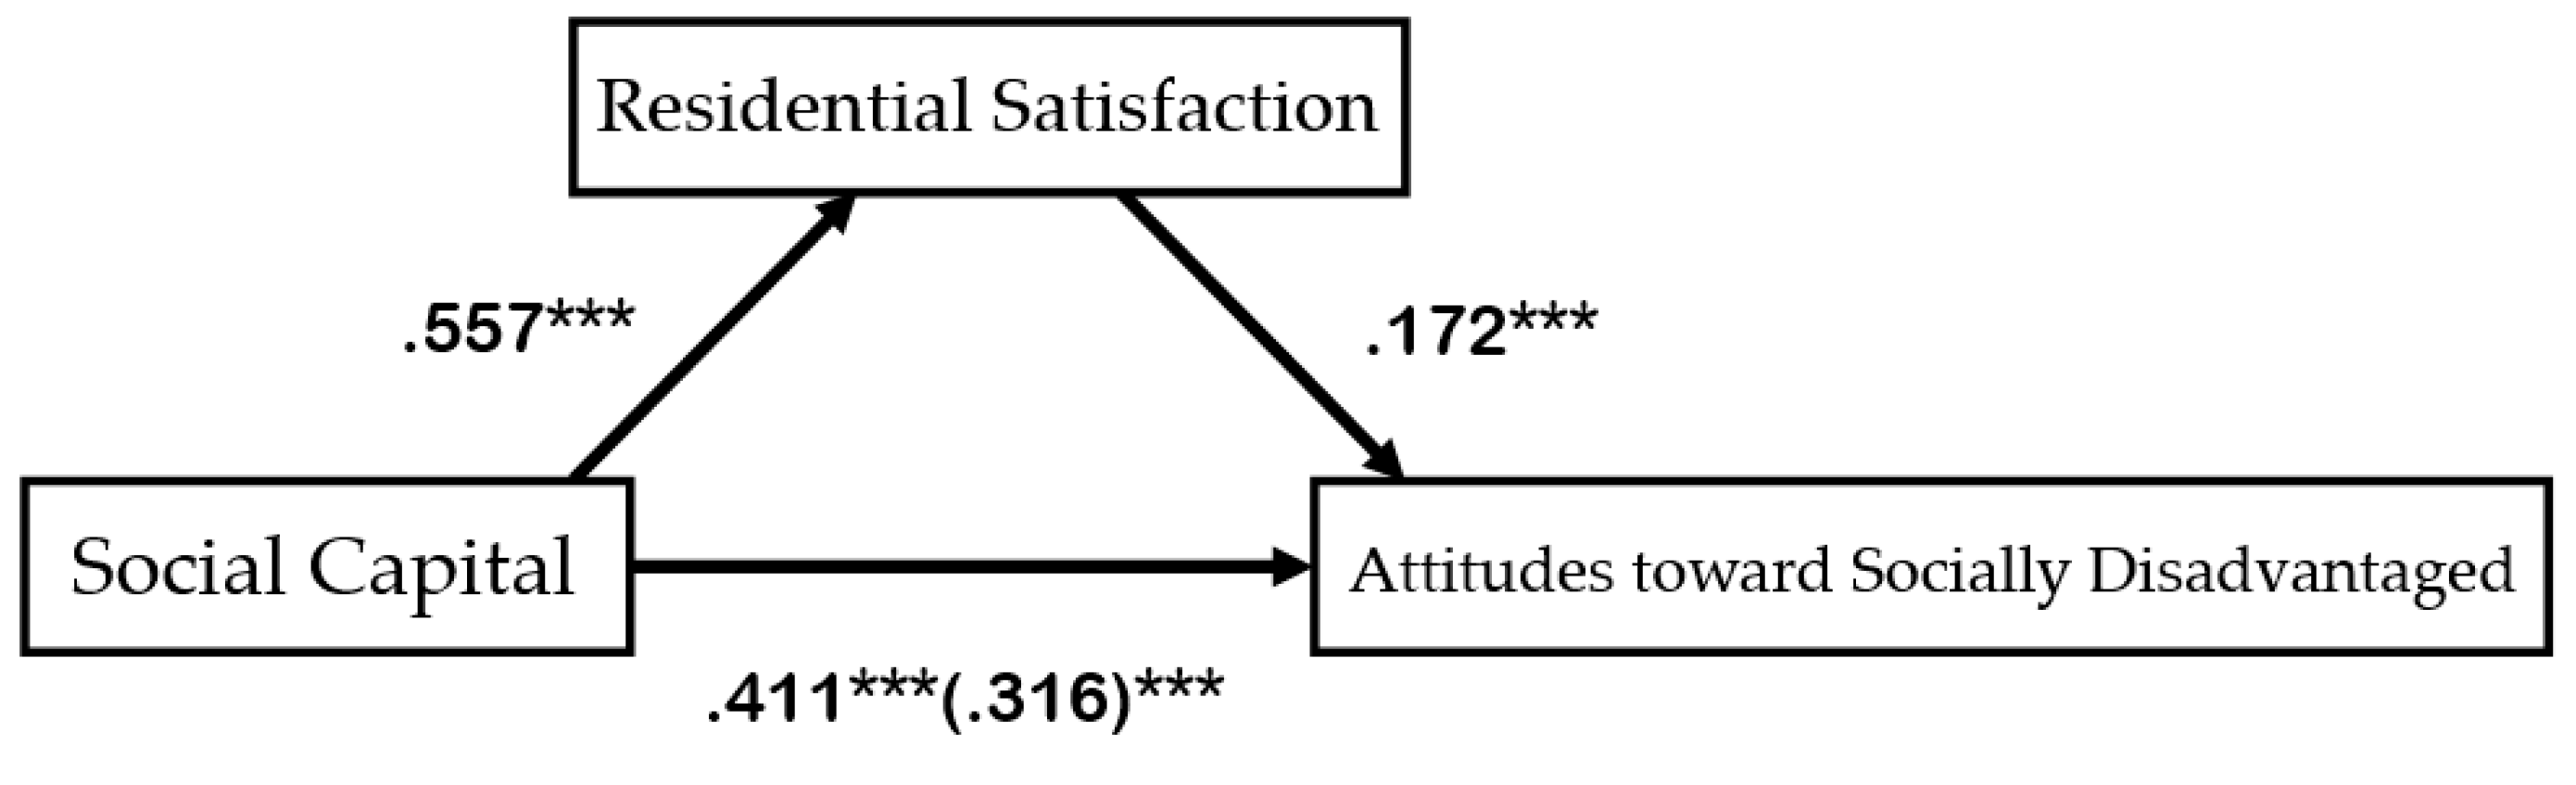
In Step 1, the analysis revealed that social capital had a significant positive influence on housing environment satisfaction (β = .557, p < .001), indicating that higher levels of social capital are associated with greater satisfaction with the housing environment. Step 2 showed that social capital also had a significant positive effect on attitudes toward vulnerable populations (β = .411, p < .001), demonstrating that individuals with stronger social capital tend to have more favorable attitudes toward vulnerable groups.
In Step 3, when both social capital and housing environment satisfaction were included in the model, both variables were found to have significant positive effects on attitudes toward vulnerable populations. Social capital maintained its significant influence (β = .316, p < .001), while housing environment satisfaction also showed a positive impact (β = .172, p < .001). These results suggest that housing environment satisfaction partially mediates the relationship between social capital and attitudes toward vulnerable populations. The detailed results of this mediation analysis are presented in
Table 5.
We further verified the mediating effect of housing environment satisfaction using bootstrap procedures with 5,000 samples. The indirect effect of housing environment satisfaction on attitudes toward vulnerable populations, through social capital, did not include zero within the 95% confidence interval (CI). Therefore, the mediating effect of housing environment satisfaction was deemed statistically significant.
Figure 2 visually depicts the mediation model, showing how housing environment satisfaction mediates the relationship between social capital and attitudes toward vulnerable populations. This figure illustrates the strength of the direct and indirect pathways.
4.3. Moderation of Vulnerability Groups in the Mediation Process
In the first stage, social capital had a significant positive effect on residential environmental satisfaction (B = 0.518, p < .001). In the second stage, both social capital (B = 0.412, p < .001) and residential environment satisfaction (B = 0.222, p < .001) had a significant positive effect on attitudes toward vulnerable groups. Educationally vulnerable groups had a significant negative effect on attitudes toward vulnerable groups (B = -0.029, p < .001), while the interaction term between residential environment satisfaction and educationally vulnerable groups had a significant positive effect on attitudes toward vulnerable groups (B = 0.030, p < .05). This indicates a significant moderating effect of educationally vulnerable groups on the relationship between residential environmental satisfaction and attitudes toward vulnerable groups. Thus, the results indicate that the positive effect of residential environment satisfaction on attitudes toward vulnerable groups was enhanced among educationally vulnerable groups.
In the first stage, social capital had a significant positive effect on residential environmental satisfaction (B = 0.518, p < .001). In the second stage, both social capital (B = 0.412, p < .001) and residential environment satisfaction (B = 0.222, p < .001) had a significant positive effect on attitudes toward vulnerable groups. Educationally vulnerable groups had a significant negative effect on /attitudes toward vulnerable groups (B = -0.029, p < .001), while the interaction term between residential environment satisfaction and educationally vulnerable groups had a significant positive effect on attitudes toward vulnerable groups (B = 0.030, p < .05). This indicates a significant moderating effect of educationally vulnerable groups on the relationship between residential environmental satisfaction and attitudes toward vulnerable groups. Thus, the results indicate that the positive effect of residential environment satisfaction on attitudes toward vulnerable groups was enhanced among educationally vulnerable groups.
As illustrated in
Table 7, the first-stage verification indicated that social capital significantly influenced residential environmental satisfaction (p < .001). In the second stage, social capital (p < .001), residential environment satisfaction (p < .001), and educationally vulnerable groups (moderating variable) (p < .001) significantly influenced the dependent variable attitudes toward vulnerable groups. The interaction between residential environment satisfaction and educationally vulnerable groups was also significant (p < .05).
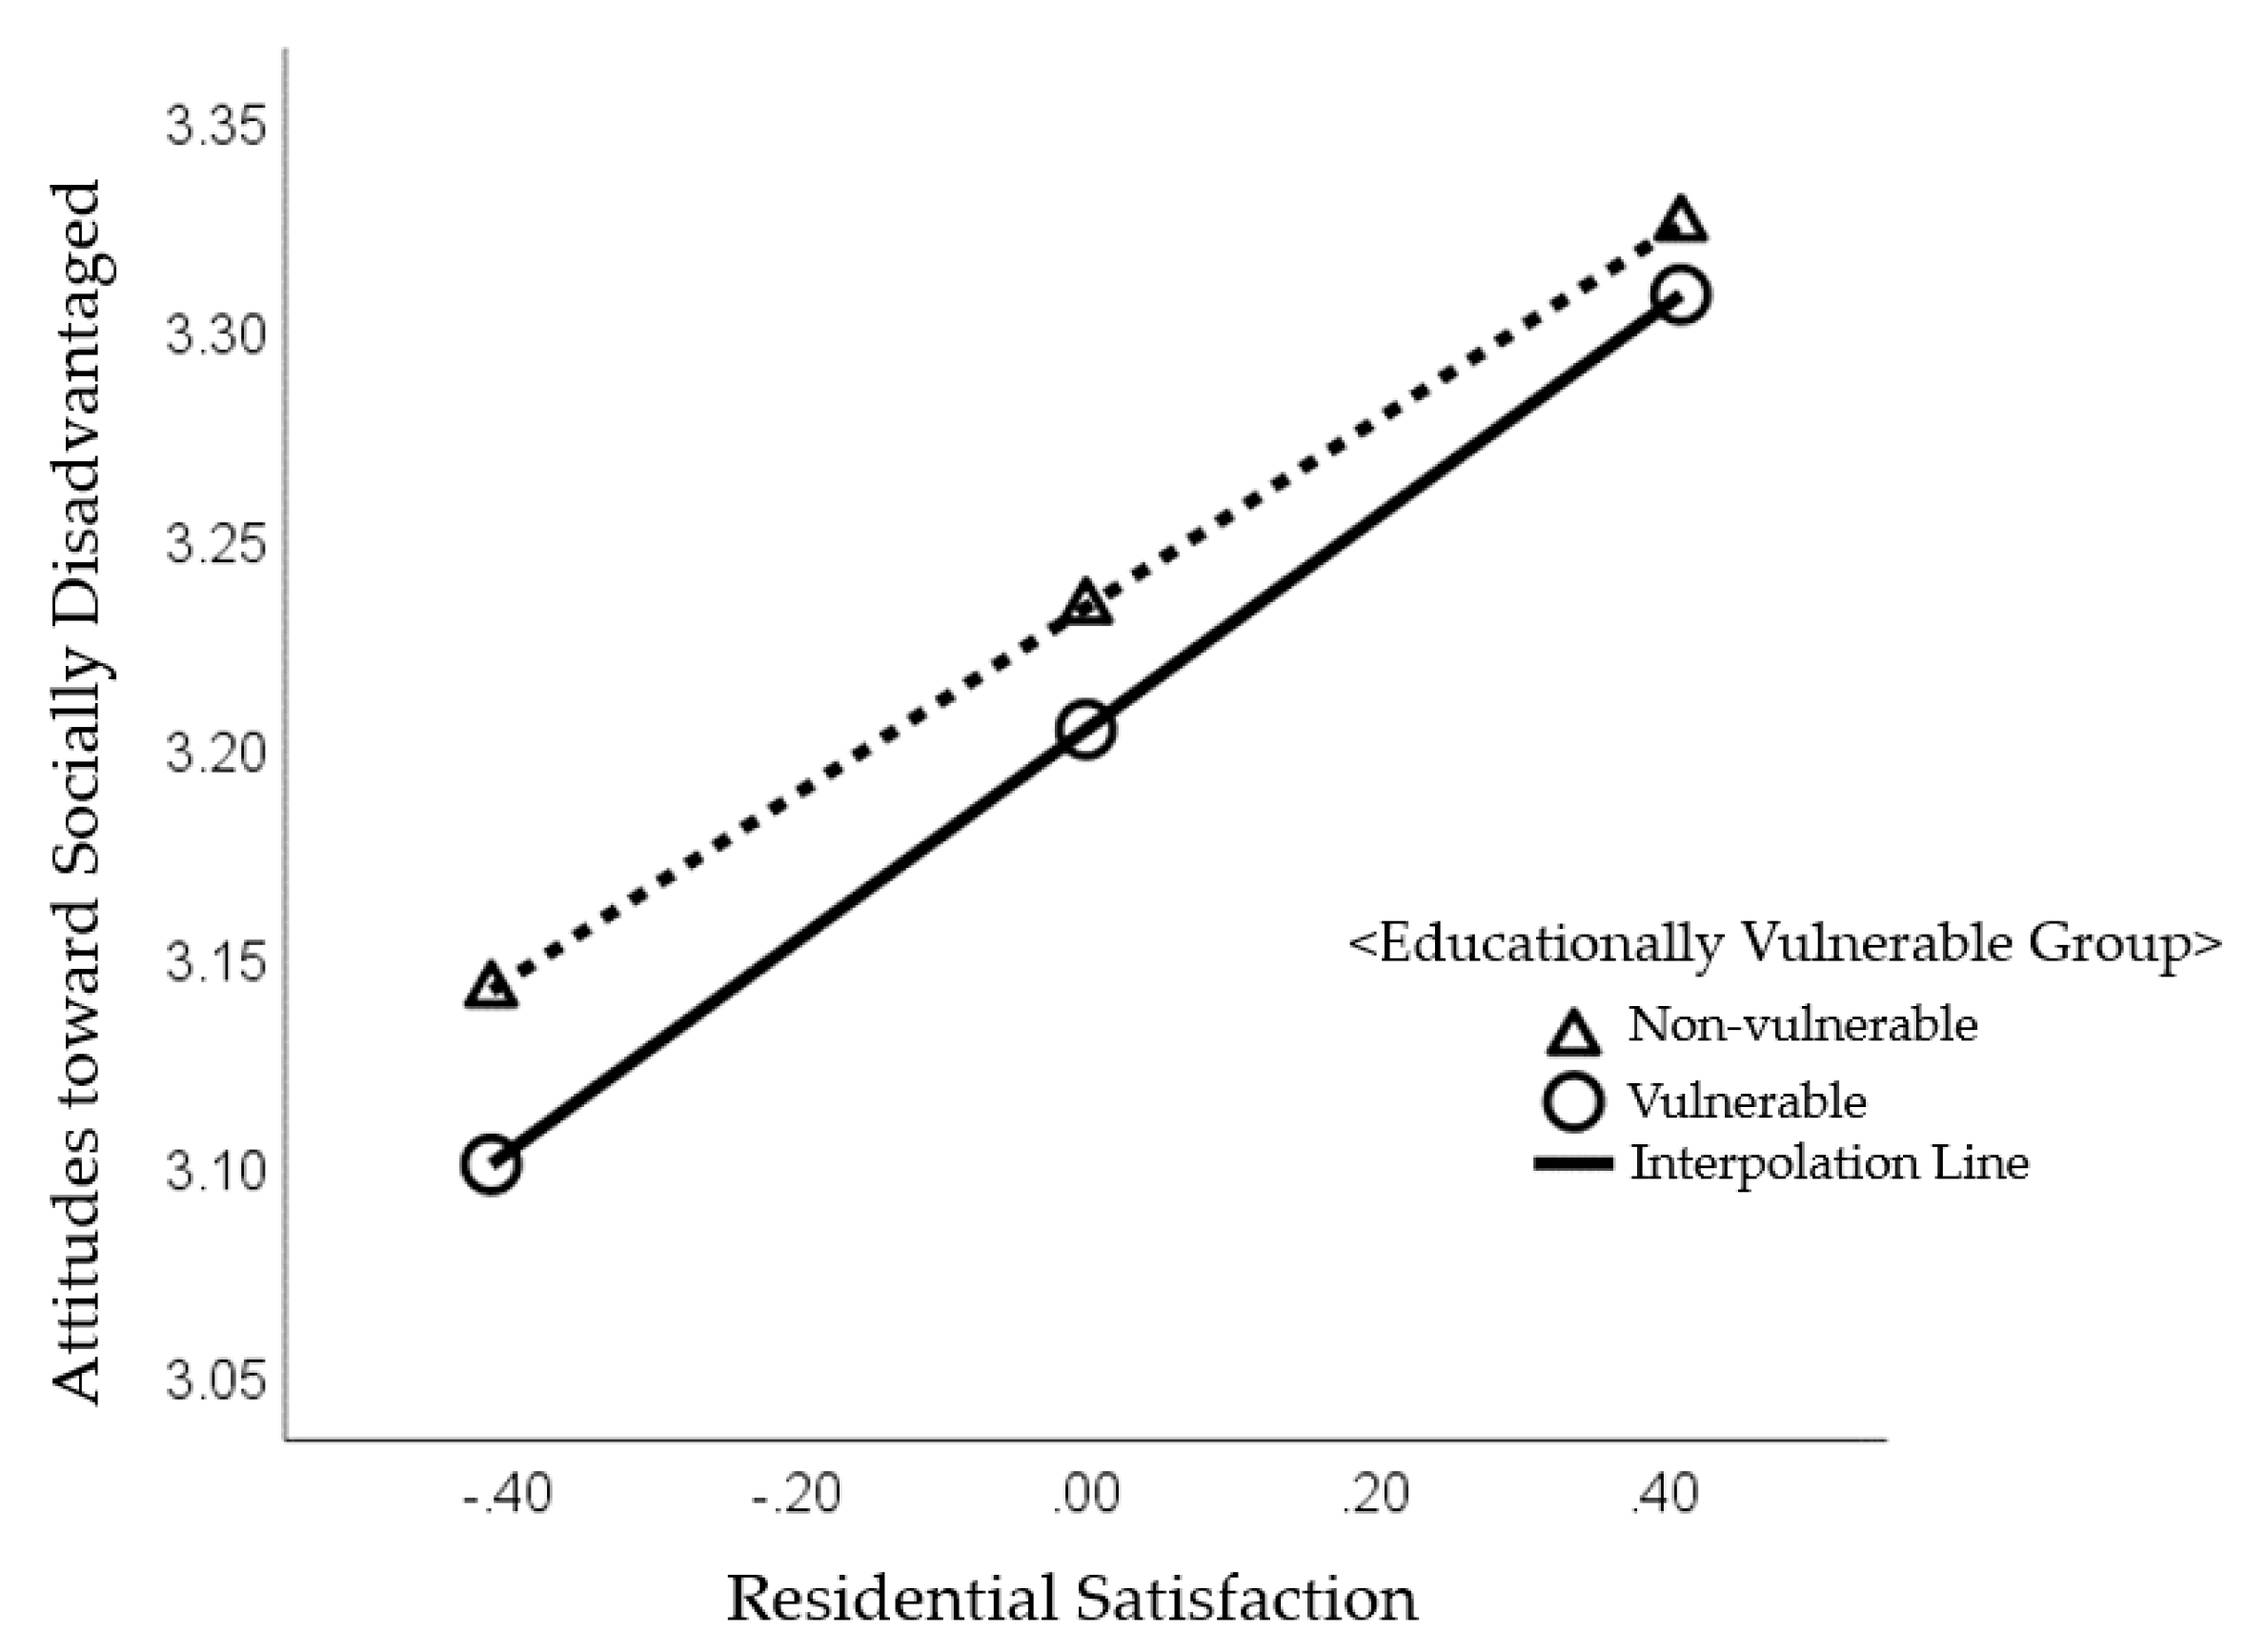
Figure 3 visualizes the moderating effect of educationally vulnerable groups on the relationship between residential environment satisfaction and attitudes toward vulnerable groups. This figure illustrates that the slope of the effect of residential environment satisfaction on attitudes toward vulnerable groups increased more sharply for educationally vulnerable groups than for non-vulnerable groups. Therefore, it is evident that educationally vulnerable groups enhance the positive effect of residential environment satisfaction on attitudes toward vulnerable groups.
Subsequently, to examine how the moderating effect of educationally vulnerable groups manifested, the significance of the effect of residential environment satisfaction on attitudes toward vulnerable groups was tested for both vulnerable and non-vulnerable groups. As demonstrated in
Table 8, the effect of residential environment satisfaction on attitudes toward vulnerable groups was significant for both the educationally vulnerable and non-vulnerable groups, with the effect being stronger for the educationally vulnerable group.
The moderated mediation effect on educationally vulnerable groups was tested using a Process Macro bootstrap analysis. As the CI for the moderated mediation effect did not include zero, the moderated mediation effect of the educationally vulnerable groups was significant. Therefore, educationally vulnerable groups moderated the effect of social capital on attitudes toward vulnerable groups through residential environmental satisfaction (
Table 9).
4.4. Moderated Mediation Effect of Employment Vulnerability
In the first stage, social capital had a significant positive effect on residential environmental satisfaction (B = 0.522, p < .001). In the second stage, both social capital (B = 0.417, p < .001) and residential environment satisfaction (B = 0.249, p < .001) had a significant positive effect on attitudes toward vulnerable groups. Employment vulnerability had a significant negative effect on attitudes toward vulnerable groups (B = -0.058, p < .001), and the interaction term between residential environment satisfaction and employment vulnerability had a significant negative effect on attitudes toward vulnerable groups (B = -0.050, p < .01). This indicates that the moderating effect of employment vulnerability on the relationship between residential environmental satisfaction and attitudes toward vulnerable groups was significant. These results indicate that employment vulnerability reduces the positive effect of residential environmental satisfaction on attitudes toward vulnerable groups.
As demonstrated in
Table 10, the first-stage verification indicated that social capital significantly influenced residential environmental satisfaction (p < .001). In the second stage, social capital (p < .001), residential environment satisfaction (p < .001), and employment vulnerability (moderating variable) (p < .001), significantly influenced attitudes toward vulnerable groups. The interaction between residential environment satisfaction and employment vulnerability was significant (p < .01).
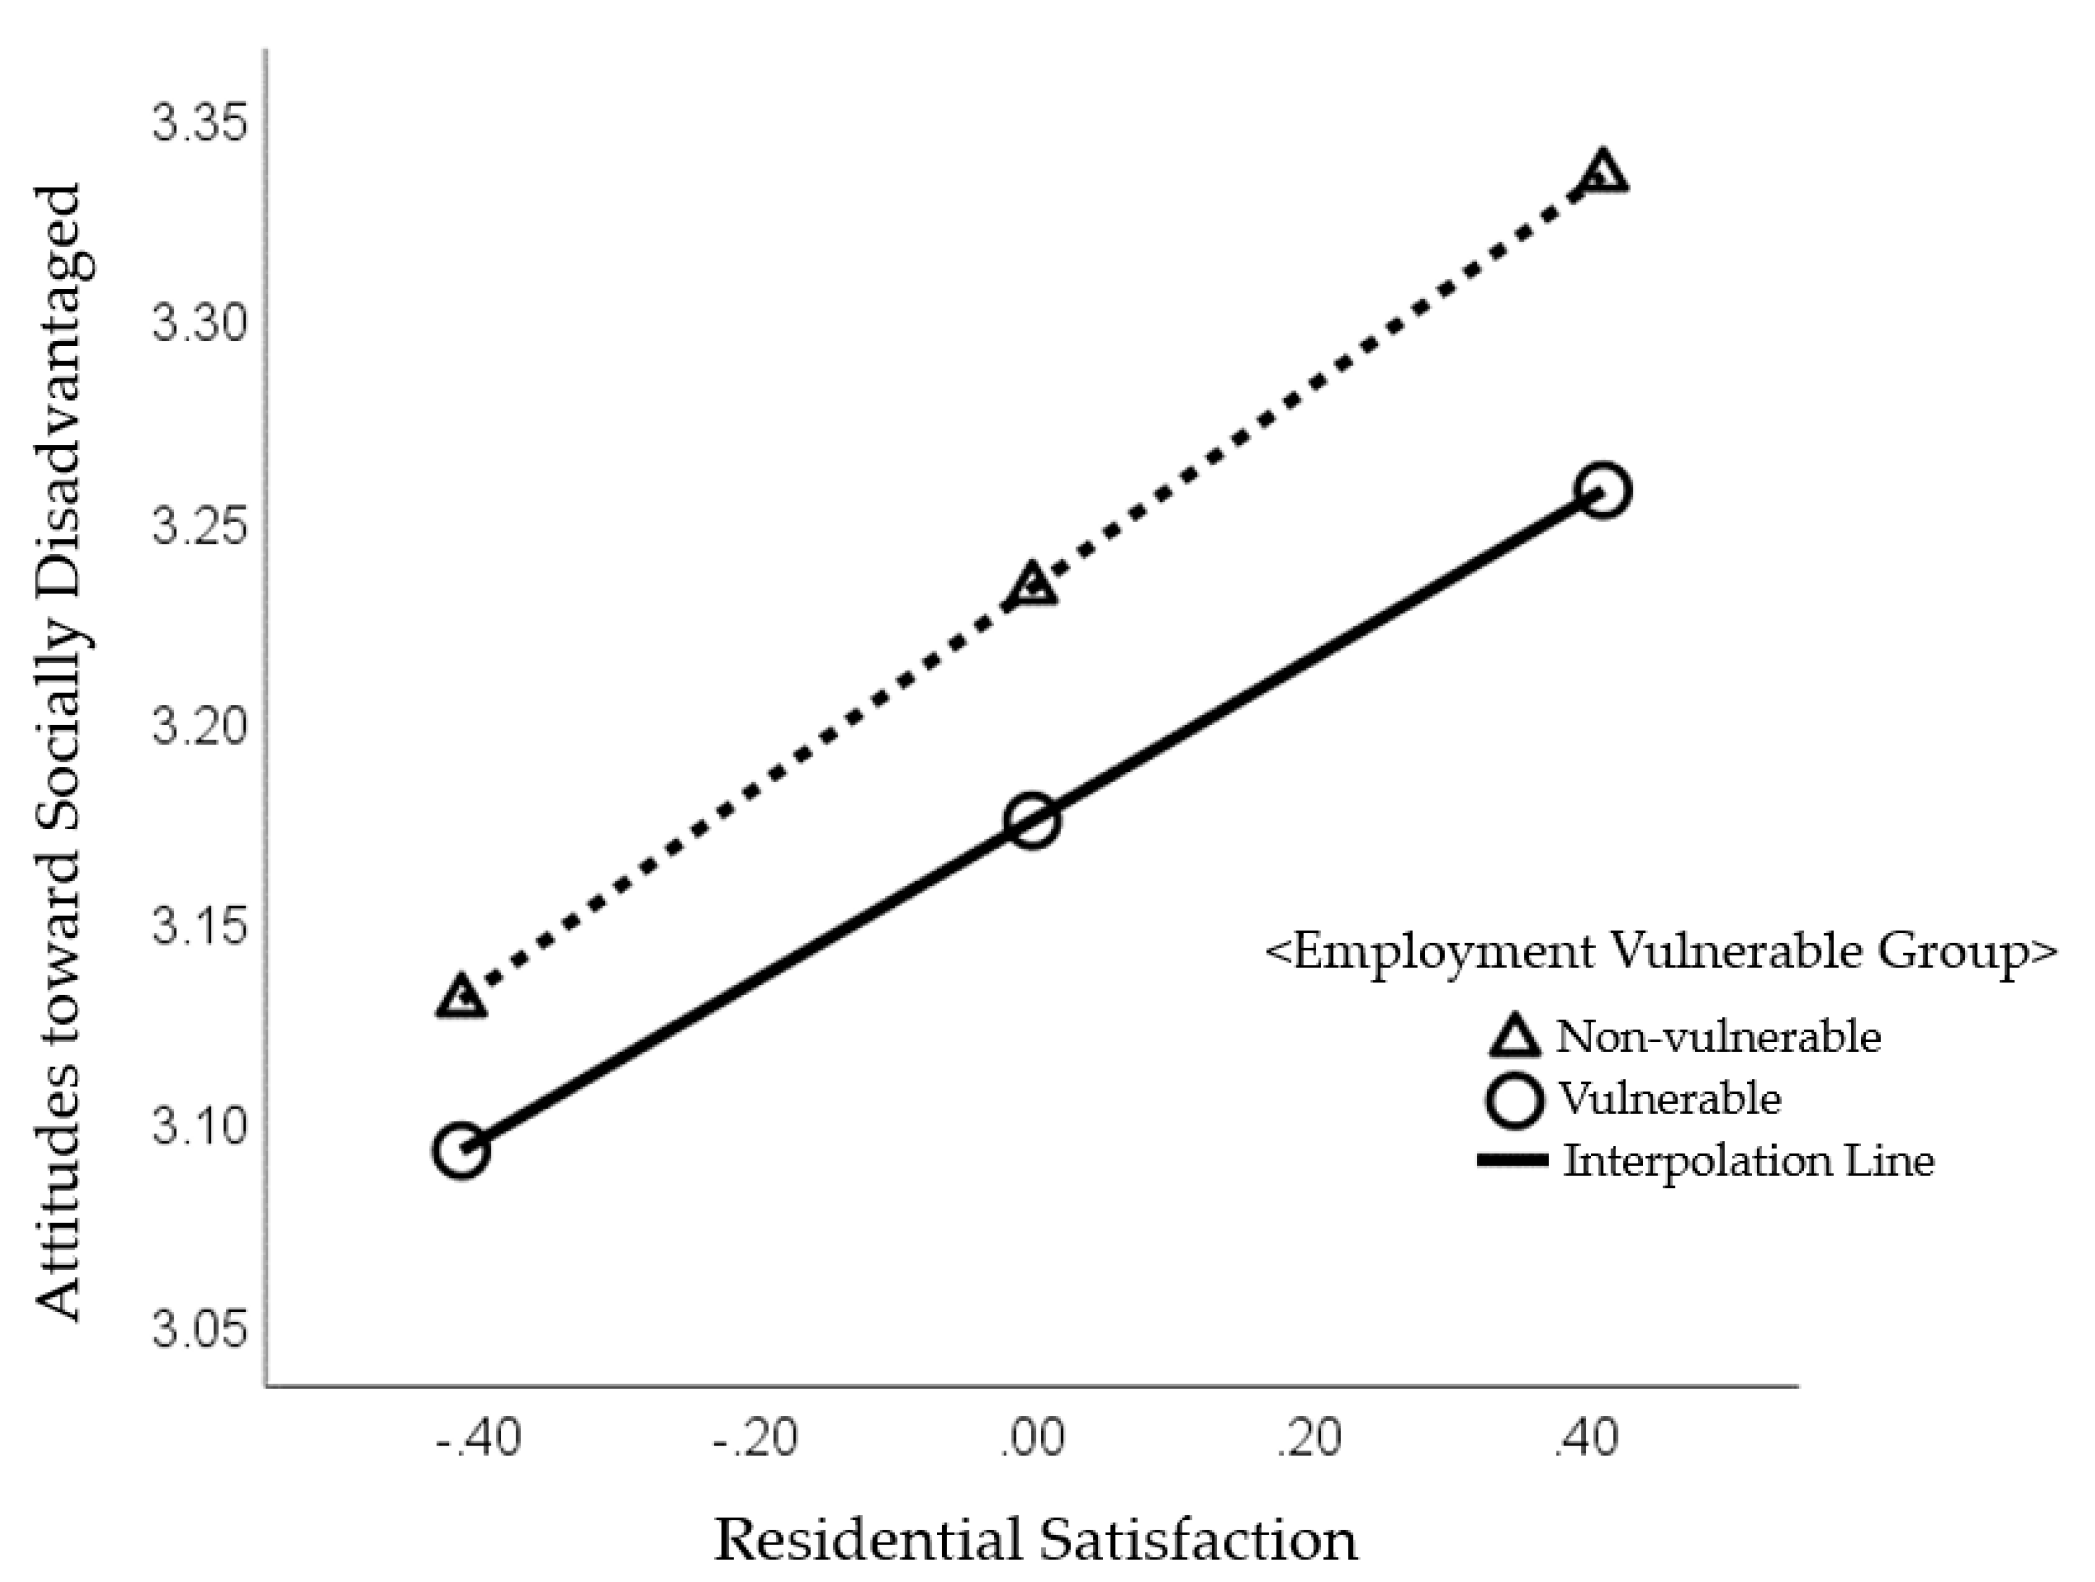
Figure 4 visualizes the moderating effect of employment vulnerability on the relationship between residential environment satisfaction and attitudes toward vulnerable groups. This figure illustrates that the slope of the effect of residential environment satisfaction on attitudes toward vulnerable groups is gentler for employment-vulnerable groups than for non-vulnerable groups. Therefore, it is evident that employment vulnerability decreases the positive effect of residential environment satisfaction on attitudes toward vulnerable groups. This suggests that those with stable employment may have more generous attitudes.
Subsequently, to examine the moderating effect of employment vulnerability, the significance of the effect of residential environment satisfaction on attitudes toward vulnerable groups was tested for both vulnerable and non-vulnerable groups. As shown in
Table 11, the effect of residential environment satisfaction on attitudes toward vulnerable groups was significant for both the employment-vulnerable and non-vulnerable groups, with the effect being weaker for the employment-vulnerable group.
The moderated mediation effect of employment vulnerability was tested using a Process Macro bootstrap analysis. As the CI for the moderated mediation effect did not include zero, the moderated mediation effect of employment vulnerability was significant. Therefore, employment vulnerability moderated the effect of social capital on attitudes toward vulnerable groups through residential environmental satisfaction (
Table 12).
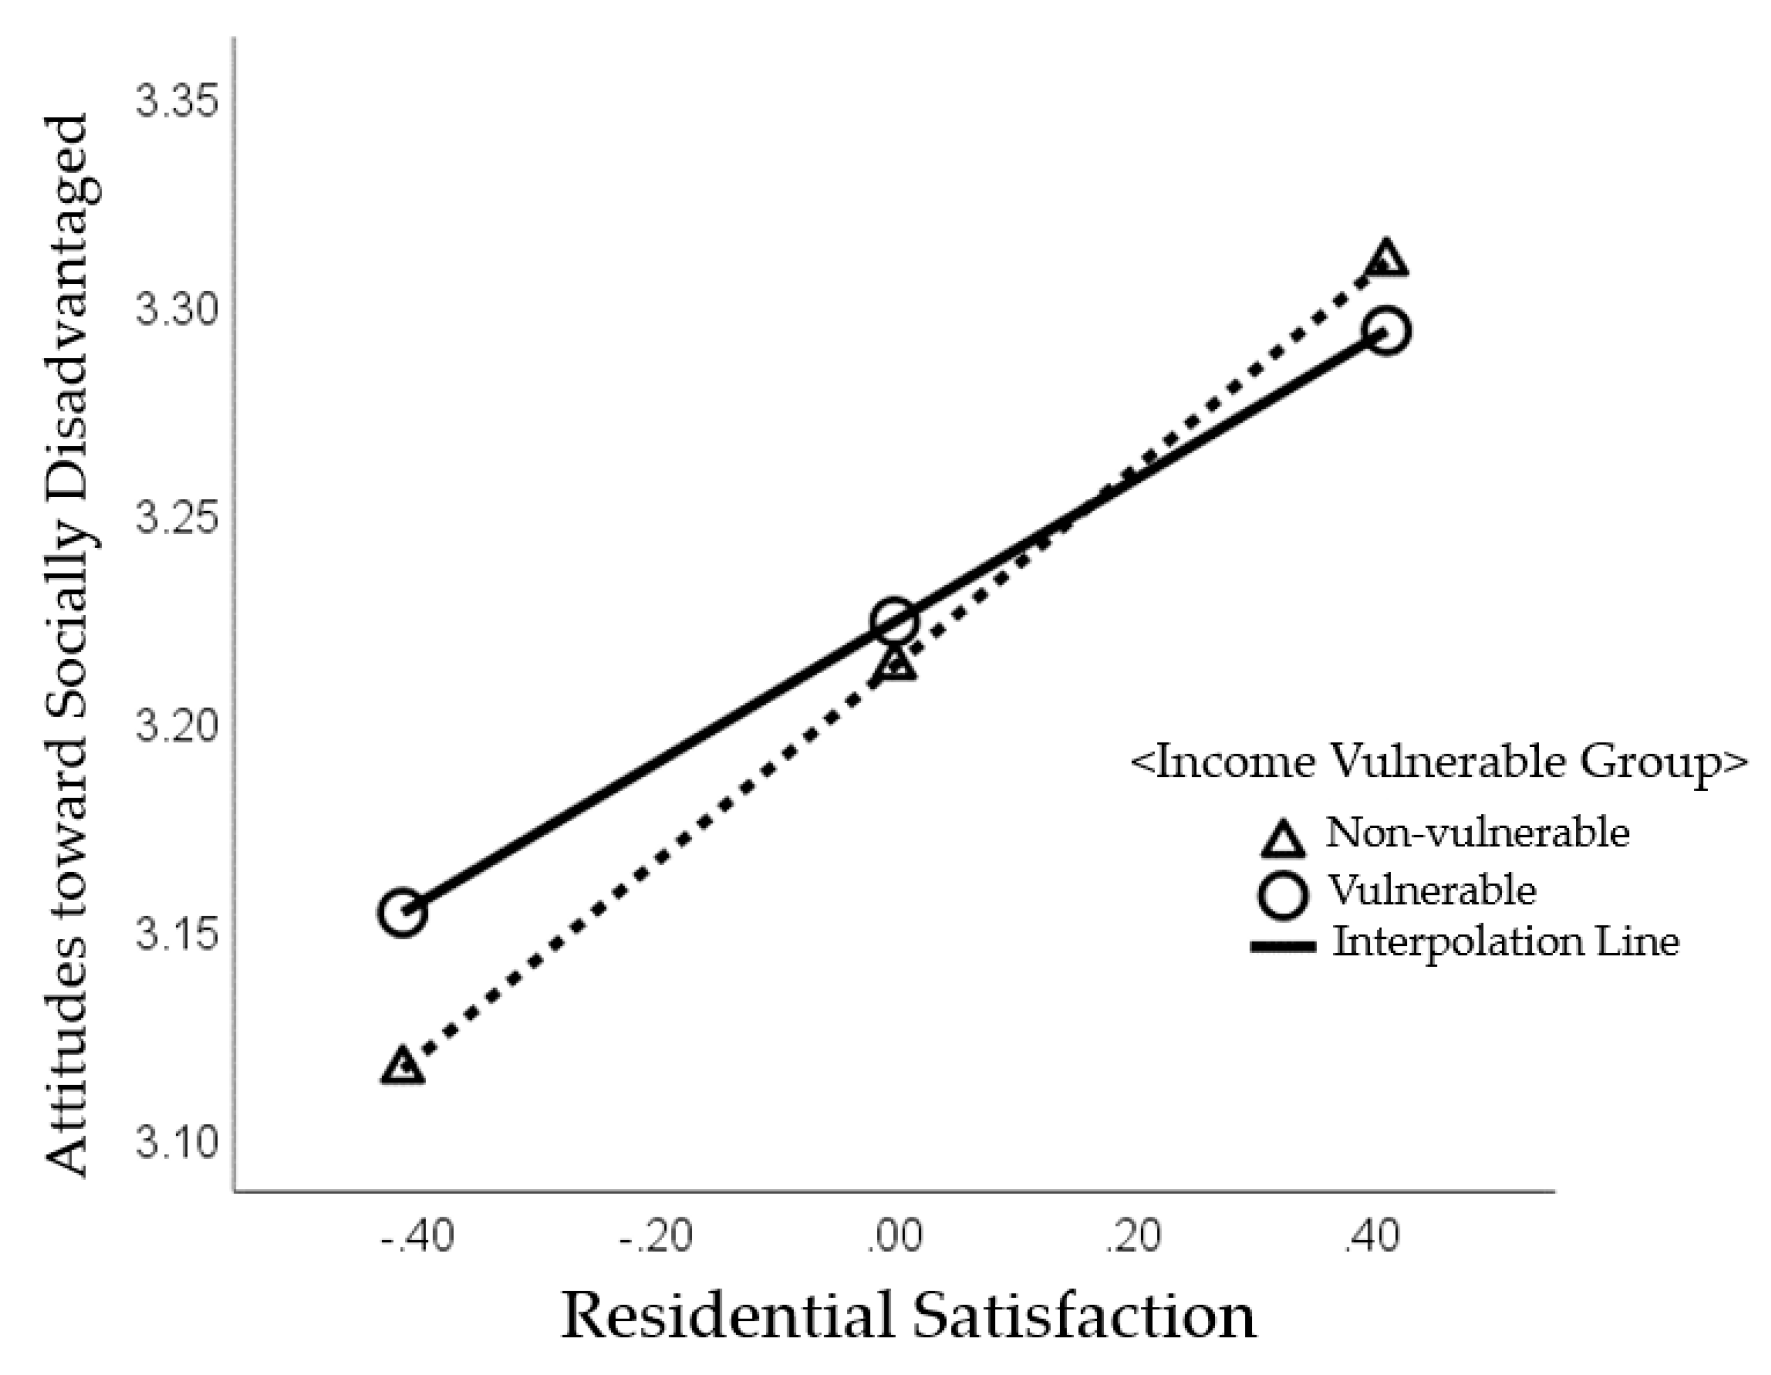
4.5. Moderated Mediation Effect of Employment Income Vulnerability
In the first stage, social capital had a significant positive effect on residential environmental satisfaction (B = 0.522, p < .001). In the second stage, both social capital (B = 0.421, p < .001) and residential environment satisfaction (B = 0.235, p < .001) had a significant positive effect on attitudes toward vulnerable groups. The interaction term between residential environment satisfaction and employment income vulnerability had a significant negative effect on attitudes toward vulnerable groups (B = -0.066, p < .01). This indicates a significant moderating effect of employment income vulnerability on the relationship between residential environmental satisfaction and attitudes toward vulnerable groups. Thus, the results indicate that employment income vulnerability decreases the positive effect of residential environmental satisfaction on attitudes toward vulnerable groups.
As demonstrated in
Table 13, the first-stage verification indicated that social capital significantly influenced residential environmental satisfaction (p < .001). In the second stage, social capital (p < .001) and residential environment satisfaction (p < .001) significantly influenced attitudes toward vulnerable groups. However, employment income vulnerability (moderating variable) did not significantly influence attitudes toward vulnerable groups (p > .05). The interaction between residential environment satisfaction and employment income vulnerability was significant (p < .01).
Figure 5 visualizes the moderating effect of employment income vulnerability on the relationship between residential environment satisfaction and attitudes toward vulnerable groups. This figure illustrates that the slope of the effect of residential environment satisfaction on attitudes toward vulnerable groups is gentler for employment income-vulnerable groups than for non-vulnerable groups. Therefore, it is evident that employment income vulnerability decreases the positive effect of residential environment satisfaction on attitudes toward vulnerable groups.
Subsequently, to examine the moderating effect of employment income vulnerability, the significance of the effect of residential environment satisfaction on attitudes toward vulnerable groups was tested for both vulnerable and non-vulnerable groups. The effect of residential environment satisfaction on attitudes toward vulnerable groups was significant for both vulnerable and non-vulnerable employment income groups, with the effect being weaker for the vulnerable employment income groups (
Table 14).
The moderated mediation effect of employment income vulnerability was tested using a Process Macro bootstrap analysis. As the CI for the moderated mediation effect did not include zero, the moderated mediation effect of employment income vulnerability was significant. Therefore, employment income vulnerability moderated the effect of social capital on attitudes toward vulnerable groups through residential environmental satisfaction (
Table 15).
5. Discussion
This study investigated the relationships among social capital, residential satisfaction, and attitudes toward vulnerable populations, emphasizing the mediating and moderated mediation effects of housing environment satisfaction. The findings highlight the complex interactions between social capital and housing satisfaction in shaping attitudes toward vulnerable populations, particularly when moderated by vulnerability in education and employment.
The analysis revealed that social capital significantly contributes to both residential satisfaction and positive attitudes toward vulnerable groups. This finding is consistent with previous research emphasizing the role of social capital in fostering social cohesion and inclusive attitudes. Furthermore, this study extends the literature by demonstrating that residential satisfaction mediates this relationship. Higher levels of social capital lead to greater satisfaction with one's living environment, which subsequently fosters more positive attitudes toward vulnerable populations.
The moderated mediation analysis added further insights by showing that the mediating effect of residential satisfaction is stronger for educationally and employment-vulnerable groups. This suggests that improvements in residential satisfaction are more likely to positively influence attitudes among these vulnerable populations compared to non-vulnerable groups. Vulnerability status thus amplifies the importance of residential conditions in shaping social attitudes, indicating that targeted housing improvements could yield greater benefits for these populations.
The results of this study carry significant policy implications for urban planners, policymakers, and community leaders aiming to foster social inclusion. Enhancing social capital within urban communities should be a priority, with strategies focused on creating communal spaces, supporting local organizations, and promoting civic participation. By fostering trust, cooperation, and engagement, these strategies can help shape more inclusive attitudes toward vulnerable groups.
In addition, housing policies that improve living conditions for vulnerable groups, particularly those who are educationally or employment-vulnerable, will likely have a greater impact on fostering positive social attitudes. Improving neighborhood safety, accessibility, and amenities such as transportation and green spaces can enhance residential satisfaction, thereby contributing to social cohesion.
Finally, the study highlights the importance of integrating social and physical improvements in urban regeneration efforts. Urban policy should focus on enhancing both the physical environment and social capital to ensure that communities are both socially cohesive and physically conducive to better living conditions.
Although this study offers important insights, it is not without limitations. The cross-sectional nature of the data limits causal inferences, and future research should consider longitudinal approaches to capture the evolving dynamics of social capital, housing satisfaction, and attitudes toward vulnerable populations over time. Moreover, while this study focused on education and employment as key vulnerability factors, future studies could explore how other dimensions of vulnerability, such as age or health status, interact with these variables.
6. Conclusions
This study examined the intricate relationships among social capital, residential satisfaction, and attitudes toward vulnerable populations, with a particular focus on the mediating and moderated mediation effects of housing satisfaction. The results show that social capital significantly influences residential satisfaction, which in turn shapes attitudes toward vulnerable groups. The effect of residential satisfaction is stronger among educationally and employment-vulnerable individuals, underscoring the need for targeted housing interventions for these groups.
The findings provide valuable insights for policymakers. Enhancing social capital through community-building initiatives can directly foster positive attitudes toward vulnerable populations, while improving housing conditions can strengthen this effect, particularly for vulnerable individuals. Integrating both social and physical improvements in urban policy is crucial for promoting social inclusion and cohesion.
Urban policy should focus on both enhancing social capital and improving residential environments, especially for vulnerable groups. Addressing the needs of educationally and employment-vulnerable individuals can lead to more supportive and inclusive communities, thus fostering social integration and reducing societal disparities.
Future research should extend this analysis by exploring other vulnerability dimensions and employing longitudinal methods to assess the long-term effects of social capital and housing satisfaction. This study, however, provides valuable contributions by illustrating how these factors interact and offering practical recommendations for urban policy aimed at fostering greater social cohesion.
Despite its significance, this study has several limitations. It analyzed data from only one year (2022), reflecting short-term trends. Long-term trends can be discerned by incorporating the Seoul Survey data for extended analysis. Additionally, the study used panel data focused solely on Seoul citizens; although nationwide data are necessary, the Seoul Survey data were the sole panel data available that considered attitudes toward vulnerable populations. Future research should conduct nationwide surveys, including those in Seoul, to generalize the analysis results. Despite these limitations, this study holds theoretical significance in verifying the relationships among social capital, residential environment satisfaction, and attitudes toward vulnerable populations, and examining the moderating effects based on types of vulnerable groups.
Author Contributions
Author Contributions
Conceptualization, S.J., S.K.; methodology, S.J.; validation, S.J., S.K.; formal analysis, S.J., S.K.; investigation, S.J.; data curation, S.K.; original draft preparation, S.J.; review and editing.; supervision, S.J. All authors have read and agreed to the published version of the manuscript.
Funding
This work was supported by the Ministry of Land, Infrastructure and Transport under Grant (No.R2018045) as part of the Urban Regeneration Professional Human Resources Training Project.
Data Availability Statement
The data used in this study are publicly and freely available from the 2022 Seoul Survey, provided by Statistics Korea (
https://mdis.kostat.go.kr).
Conflicts of Interest
No potential conflict of interest was reported by the authors.
References
- Bourdieu, P. (1986). The forms of capital. In: Richardson, J., Handbook of Theory and Research for the Sociology of Education. Westport, CT: Greenwood. Handbook of theory and research for the sociology of education, 241–58. Greenwood Publishing Group. Retrieved from https://www.socialcapitalgateway.org/content/paper/bourdieu-p-1986-forms-capital-richardson-j-handbook-theory-and-research-sociology-educ.
- Coleman, J. (1990). Foundations of social theory. Harvard University Press. ISBN: 0-674-31225-2(alk, Paper).
- Coleman, J. S. (1988). Social capital in the creation of human capital. American Journal of Sociology, 94, S95–S120. [CrossRef]
- Farr, J. (2004). Social capital: A conceptual history. Political Theory, 32(1), 6–33. [CrossRef]
- Francescato, G. (1979). Residents’ satisfaction in HUD-assisted housing: Design and management factors. Office of Policy Development and Housing and Urban Development. Retrieved from https://www.huduser.gov/portal/publications/ Residents-Satisfaction-in-HUD-Assisted-Housing.html.
- Go, E. (2014). The influence of neighborhood environment on social diversity and formation of neighborhood social capital: A case study of Seoul [Doctoral Dissertation, Seoul National University]. Seoul National University. Retrieved from https://snu-primo.hosted.exlibrisgroup.com/permalink/f/1l6eo7m/82 SNU_INST21433155590002591.
- Hayes, A. F. (2013). Introduction to Mediation, Moderation, and Conditional Process Analysis: A Regression-Based Approach. New York: Guilford Press. ISBN 9781609182304.
- Hwang, J.-A., & Goo, J. (2019). Analysis of the impact of public rental housing acquisition on concentration of vulnerable groups. Journal of Housing and Urban Research, 9(3), 35–54. [CrossRef]
- Jung, J. (2000). A study on the emotional impact and significance of childhood residential environments. Journal of the Korean Housing Association, 11(4), 43–51. Retrieved from https://www.khousing.or.kr/publication/p-journal/list2/2000.
- Jung, S. , Jung, S., & Park, S. (2015). The impact of social enterprises’ employment of vulnerable groups on financial and social performance: Quantitative and qualitative approach. Journal of Social Value and Enterprise Studies, 8(2), 59–94. Retrieved from https://rise.or.kr:452/board/bbs.
- Kim, G., & Kim, K. (2022). Analysis of predictors of attitudes favorable to socially vulnerable: Focusing on the role of meritocracy. Korean Social Policy Review, 29(3), 177–205. Retrieved from https://www-dbpia-co-kr-ssl.oca.korea.ac.kr/journal/articleDetail?nodeId=NODE11139512.
- Kim, G. , & Kim, Y. (2017). A study on the determinants of safety in residential environments. Journal of Real Estate Studies, 71, 217–231. Retrieved from http://www.reacademy.org/sub3_5.php.
- Kim, H. (1994). A study on leisure policy development for the elderly [Doctoral Dissertation, Kookmin University]. Kookmin University. Retrieved from https://lib.kookmin.ac.kr/#/search/detail/9084.
- Kim, S. (2010). A study on determinants of welfare consciousness among Koreans: Focusing on attitudes toward the government’s public responsibility. Survey research, 11(1), 87–105. Retrieved from https://www.dbpia.co.kr/journal/articleDetail?nodeId=NODE10002071.
- Kim, T., & Seo, J. (2015). Determinants of local residents’ attitudes toward immigrants: Focusing on institutional and environmental factors for social integration. Local Government Studies, 19(1), 173–199. Retrieved from https://worldcat.org/title/5850505304.
- Kleinhans, R., Priemus, H., & Engbersen, G. (2007). Understanding social capital in recently restructured urban neighbourhoods: Two case studies in Rotterdam. Urban Studies, 44(5–6), 1069–1091. [CrossRef]
- Kline, R. B. (2016). Principles and practice of structural equation modeling. The Guilford Press. [CrossRef]
- Kwon, J., Shon, E. (2010). The effect of the elderly's self-awareness and discriminatory experiences on the elderly's social participation and the mediating effect of self-efficacy. Korean Society for the Welfare of the Elderly, 49, 81-105. [CrossRef]
- Kwon, S., & Park, H. (2014). A study on the factors influencing the residential environment satisfaction of single-person households in Seoul. Housing Studies, 22(1), 77–104. UCI: G704-000825.2014.22.1.001.
- Kwon, T., & Park, J. (2010). Analysis of the impact of social capital on urban competitiveness. Local Government Studies, 14(3), 97–116. Retrieved from http://www.klog.or.kr/bbs/board.php?bo_table=library_journal&wr_id=620&sfl=&stx=&sst=wr_hit&sod=desc&sop=and&page=14.
- Kwon, Y., & Choi, Y. (2018). Analysis of the impact of social capital and urban characteristics on the competitiveness of local governments. Journal of Land and Development, 96, 21–36. [CrossRef]
- Kwon, Y., & Choi, Y. (2021). Analysis of the impact of individual social capital on perceptions of social conflict and inclusiveness. Journal of Land and Development, 110, 95–112. [CrossRef]
- Lee, H. (2020). Exploration and response of housing crisis households in the post-COVID-19 era. Space and Society, 30(4), 124–171. UCI: I410-ECN-0102-2022-300-000244512.009@N2M.
- Lee, J. , & Jang, M. (2004). The influence of employment conditions on attitudes toward work and family. Economics and Society, 64, 172–208. UCI: G704-000107.2004..64.
- Mouratidis, K. (2018). Is compact city livable? The impact of compact versus sprawled neighbourhoods on neighbourhood satisfaction. Urban Studies, 55(11), 2408–2430. [CrossRef]
- National Human Rights Commission of Korea. (2020). Survey on national awareness of discrimination, 2020. Retrieved from https://www.humanrights.go.kr.
- National Human Rights Commission of Korea. (2022). Survey on awareness of human rights, 2022. Retrieved from https://www.humanrights.go.kr.
- Parkes, A. , Kearns, A., & Atkinson, R. (2002). What makes people dissatisfied with their neighbourhoods? Urban Studies, 39(13), 2413–2438. [CrossRef]
- Putnam, R. D. (1993). The prosperous community: Social capital and public life. American Prospect, 4(13), 35–42. UCI: G901:A-0006734723.
- Ryu, S., & Kim, S. (2013). The influence of human capital and social capital in personnel department on personnel management performance and employee attitudes. Journal of the Korean Academy of Management, 26(7), 1947–1969. UCI: G901:A-0003213789.
- Seoul Metropolitan Government. (2022). Seoul survey: Urban policy indicator survey. Retrieved from https://data.seoul.go.kr/.
- Shim, J., Bang, S., & Kim, K. (2016). Factors influencing socially vulnerable consideration of Korean adolescents. Journal of Educational Sociology Research, 26(1), 25–49. UCI: G901:A-0003213789.
- Shim, J., Kim, S., & Kim, K. (2020). Attitudes of high school students toward socially vulnerable: Analysis of structural equation model with family and school social capital in the entrance examination. Journal of Educational Sociology Research, 30(2), 43–73. [CrossRef]
- Statistics Korea. (2023). Survey on household financial welfare, 2023. Retrieved from https://kostat.go.kr/board.es?mid=a20106030000&bid=11737.
- Yang, J. (2015). Analysis of determinants of employment and wage levels of women with disabilities. Health and Social Welfare Review, 35(2), 226–253. [CrossRef]
- Yang, J. (2018). Analysis of the effectiveness of government support policies for vulnerable college students. Labor Policy Research, 18(1), 103–133. [CrossRef]
- Yoon, I., & Song, Y. (2018). Perceptions of social justice and human rights among Koreans: Focus on socially vulnerable and minority groups. Korean Social Science, 19(1), 95–131. [CrossRef]
- Yoon, S., & Lee, J. (2016). Identification of factors influencing residential environment satisfaction using housing survey data: Focused on Incheon metropolitan city. Urban Studies, 10, 69–97. [CrossRef]
Figure 2.
Mediation Model of Housing Satisfaction in the Relationship Between Social Capital and Attitudes Toward Vulnerable Groups.
Figure 2.
Mediation Model of Housing Satisfaction in the Relationship Between Social Capital and Attitudes Toward Vulnerable Groups.
Figure 3.
Moderating Effect of Educational Vulnerability on Residential Satisfaction and Attitudes Toward Vulnerable Groups.
Figure 3.
Moderating Effect of Educational Vulnerability on Residential Satisfaction and Attitudes Toward Vulnerable Groups.
Figure 4.
Moderating Effect of Employment Vulnerability on the Relationship Between Residential Satisfaction and Attitudes Toward Vulnerable Groups.
Figure 4.
Moderating Effect of Employment Vulnerability on the Relationship Between Residential Satisfaction and Attitudes Toward Vulnerable Groups.
Figure 5.
Moderating effect of income-vulnerable groups on the relationship between residential environment satisfaction and attitudes toward socially disadvantaged groups.
Figure 5.
Moderating effect of income-vulnerable groups on the relationship between residential environment satisfaction and attitudes toward socially disadvantaged groups.
Table 1.
Measurement variables.
Table 1.
Measurement variables.
| Variable Name |
Measurement Method |
| Independent variable: Social capital |
Institutional trust |
1. No trust at all
2. Little trust
3. Moderate trust
4. Some trust
5. High trust |
| Fairness |
1. Not fair at all
2. Little fair
3. Moderately fair
4. Somewhat fair
5. Very fair |
Social integration
perception |
1. Completely disagree
2. Somewhat disagree
3. Neutral
4. Somewhat agree
5. Completely agree |
Dependent variable: Housing
Environment
satisfaction |
Safety |
1. Not serious at all
2. Little serious
3. Moderately serious
4. Somewhat serious
5. Very serious |
| Transportation |
1. Very dissatisfied
2. Somewhat dissatisfied
3. Neutral
4. Somewhat satisfied
5. Very satisfied
9. Not applicable |
| Pedestrian environment |
1. Very dissatisfied
2. Somewhat dissatisfied
3. Neutral
4. Somewhat satisfied
5. Very satisfied |
| Educational environment |
1. Very dissatisfied
2. Somewhat dissatisfied
3. Neutral
4. Somewhat satisfied
5. Very satisfied
9. Not applicable |
| Green environment |
1. Very dissatisfied
2. Somewhat dissatisfied
3. Neutral
4. Somewhat satisfied
5. Very satisfied |
| Housing |
1. Not at all
2. Not much
3. Moderate
4. Somewhat
5. Very much |
| Culture and leisure |
1. Very dissatisfied
2. Somewhat dissatisfied
3. Neutral
4. Somewhat satisfied
5. Very satisfied |
Dependent variable:
Attitudes toward vulnerable populations |
1. Completely disagree
2. Somewhat disagree
3. Neutral
4. Somewhat agree
5. Completely agree |
Moderating variable:
Vulnerable population |
Education (1-5)
Employment type (2-4, 6-7)
Pre-tax monthly average income (1-4) |
Table 2.
Demographic Characteristics.
Table 2.
Demographic Characteristics.
| Variable |
Category |
N |
% |
| Education |
No education |
113 |
0.3 |
| Elementary school |
1,434 |
3.6 |
| Middle school |
2,531 |
6.4 |
| High school |
14,236 |
36.2 |
| Vocational school |
8,061 |
20.5 |
| College |
12,620 |
32.1 |
| Graduate school |
345 |
0.9 |
| Employment type |
Regular temporary worker |
16,502 |
41.9 |
| Temporary wage worker |
3,388 |
8.6 |
| Day labor wage worker |
570 |
1.4 |
| Special employment worker |
221 |
0.6 |
| Self-employed with employees |
1,543 |
3.9 |
| Self-employed without employees |
3,512 |
8.9 |
| Unpaid family worker |
329 |
0.8 |
| Not applicable |
13,275 |
33.7 |
| Monthly Pre-tax labor income |
Less than €83 |
582 |
1.5 |
| €83-€167 |
2,380 |
6.0 |
| €167-€250 |
8,715 |
22.2 |
| €250-€333 |
8,692 |
22.1 |
| €333-€417 |
3,547 |
9.0 |
| More than €417 |
2,149 |
5.5 |
| Not applicable |
13,275 |
33.7 |
| Total |
39,340 |
100.0 |
Table 3.
Descriptive statistics of the variables.
Table 3.
Descriptive statistics of the variables.
| Variable |
Mean |
StandardDeviation |
Skewness |
Kurtosis |
| Social capital |
3.14 |
0.44 |
-0.42 |
0.72 |
| Housing environment satisfaction |
3.31 |
0.41 |
-0.37 |
1.06 |
| Attitudes toward vulnerable populations |
3.21 |
0.58 |
-0.30 |
0.37 |
|
Table 4.
Results of the correlation analysis.
Table 4.
Results of the correlation analysis.
| Variable |
Social Capital |
Housing Environment Satisfaction |
Attitudes towardVulnerable Populations |
| Social capital |
1 |
|
|
| Housing environment satisfaction |
.556*** |
1 |
|
| Attitudes toward vulnerable populations |
.411*** |
.347*** |
1 |
Table 5.
Results of the mediation analysis.
Table 5.
Results of the mediation analysis.
| Model |
DV |
IV |
B |
SE |
Β |
T |
p |
F(R2) |
| 1 |
Housing environment satisfaction |
Social capital |
0.518 |
0.004 |
.557 |
132.836*** |
< .001 |
17645.393***
(.310) |
| 2 |
Attitudes toward vulnerable populations |
Social capital |
0.537 |
0.006 |
.411 |
89.457*** |
< .001 |
8002.571***
(.172) |
| 3 |
Attitudes toward vulnerable populations |
Social capital |
0.412 |
0.007 |
.316 |
57.753*** |
< .001 |
4596.371***
(.189) |
| Housing environment satisfaction |
0.241 |
0.008 |
.172 |
31.451*** |
< .001 |
Table 6.
Validation results of the mediating effects of educationally disadvantaged groups.
Table 6.
Validation results of the mediating effects of educationally disadvantaged groups.
| Model |
DV |
IV |
B |
SE |
t |
p |
F(R2) |
| 1 |
Residential environment satisfaction |
social capital |
0.518 |
0.004 |
132.836*** |
<.001 |
17645.393***
(.310) |
| 2 |
attitudes toward vulnerable populations |
social capital |
0.412 |
0.007 |
57.784*** |
<.001 |
2308.183***
(.190) |
| Residential environment satisfaction |
0.222 |
0.012 |
18.577*** |
<.001 |
| Educational Disadvantaged Group |
-0.029 |
0.006 |
-5.211*** |
<.001 |
| Housing Environment Satisfaction & Educational Disadvantaged Groups |
0.030 |
0.014 |
2.221* |
.026 |
Table 7.
Results of testing the moderated mediation effects for educationally disadvantaged groups.
Table 7.
Results of testing the moderated mediation effects for educationally disadvantaged groups.
| Model |
DV |
IV |
B |
SE |
t |
p |
F(R2) |
| 1 |
Residential environment satisfaction |
social capital |
0.518 |
0.004 |
132.836*** |
<.001 |
17645.393***
(.310) |
| 2 |
attitudes toward vulnerable populations |
social capital |
0.412 |
0.007 |
57.784*** |
<.001 |
2308.183***
(.190) |
| Residential environment satisfaction |
0.222 |
0.012 |
18.577*** |
<.001 |
| Educationally Vulnerable Groups |
-0.029 |
0.006 |
-5.211*** |
<.001 |
| residential environment satisfaction & educationally disadvantaged groups |
0.030 |
0.014 |
2.221* |
.026 |
| Note. * p<.05 ** p<.01 *** p<.001. |
Table 8.
Conditional Effects of Residential Satisfaction on Attitudes Toward Vulnerable Groups by Educational Vulnerability.
Table 8.
Conditional Effects of Residential Satisfaction on Attitudes Toward Vulnerable Groups by Educational Vulnerability.
| Education |
B |
S.E. |
t |
95% CI |
| LLCI |
ULCI |
| Non-vulnerable groups |
0.222 |
0.012 |
18.577 |
0.199 |
0.246 |
| Vulnerable groups |
0.252 |
0.009 |
28.577 |
0.235 |
0.270 |
Table 9.
Bootstrap analysis of the moderated mediation effects for educationally disadvantaged groups.
Table 9.
Bootstrap analysis of the moderated mediation effects for educationally disadvantaged groups.
| B |
S.E. |
95% CI |
| LLCI |
ULCI |
| 0.016 |
0.008 |
0.000 |
0.031 |
Table 10.
Results of testing the moderated mediation effects for employment type vulnerable groups.
Table 10.
Results of testing the moderated mediation effects for employment type vulnerable groups.
| Model |
DV |
IV |
B |
SE |
t |
p |
F(R2) |
| 1 |
Residential environment satisfaction |
social capital |
0.522 |
0.005 |
110.730*** |
<.001 |
12261.163***
(.320) |
| 2 |
attitudes toward vulnerable populations |
social capital |
0.417 |
0.009 |
48.718*** |
<.001 |
1638.102***
(.201) |
| Residential environment satisfaction |
0.249 |
0.011 |
23.358*** |
<.001 |
| Employment-vulnerable groups |
-0.058 |
0.007 |
-8.420*** |
<.001 |
| Residential environment satisfaction & employment-vulnerable groups |
-0.050 |
0.017 |
-2.952** |
.003 |
Table 11.
Conditional Effects of Residential Satisfaction on Attitudes Toward Vulnerable Groups by Employment Vulnerability.
Table 11.
Conditional Effects of Residential Satisfaction on Attitudes Toward Vulnerable Groups by Employment Vulnerability.
| Employment Status |
B |
S.E. |
t |
95% CI |
| LLCI |
ULCI |
| Non-vulnerable groups |
0.249 |
0.011 |
23.358 |
0.228 |
0.270 |
| Vulnerable groups |
0.199 |
0.015 |
13.360 |
0.170 |
0.228 |
Table 12.
Bootstrap Analysis of Moderated Mediation Effects for Employment Vulnerability.
Table 12.
Bootstrap Analysis of Moderated Mediation Effects for Employment Vulnerability.
| B |
S.E. |
95% CI |
| LLCI |
ULCI |
| -0.026 |
0.010 |
-0.046 |
-0.007 |
Table 13.
Results of testing the moderated mediation effects for earned income vulnerable groups.
Table 13.
Results of testing the moderated mediation effects for earned income vulnerable groups.
| Model |
DV |
IV |
B |
SE |
t |
p |
F(R2) |
| 1 |
Residential environment satisfaction |
social capital |
0.522 |
0.005 |
110.730*** |
<.001 |
12261.163***
(.320) |
| 2 |
attitudes toward vulnerable populations |
social capital |
0.421 |
0.009 |
49.111*** |
<.001 |
1638.102***
(.201) |
Residential environment
satisfaction |
0.235 |
0.010 |
24.173*** |
<.001 |
| income-vulnerable groups |
0.011 |
0.010 |
1.064 |
.287 |
| residential environment satisfaction & income-vulnerable groups |
-0.066 |
0.024 |
-2.686** |
.007 |
Table 14.
Conditional effects of residential environment satisfaction on attitudes toward vulnerable populations based on the conditional values of earned income vulnerable groups.
Table 14.
Conditional effects of residential environment satisfaction on attitudes toward vulnerable populations based on the conditional values of earned income vulnerable groups.
| Earned Income |
B |
S.E. |
t |
95% CI |
| LLCI |
ULCI |
| Non-vulnerable groups |
0.235 |
0.010 |
24.173 |
0.216 |
0.254 |
| Vulnerable groups |
0.169 |
0.023 |
7.227 |
0.123 |
0.215 |
Table 15.
Bootstrap analysis of the moderated mediation effects for earned income vulnerable groups.
Table 15.
Bootstrap analysis of the moderated mediation effects for earned income vulnerable groups.
| B |
S.E. |
95% CI |
| LLCI |
ULCI |
| -0.034 |
0.015 |
-0.064 |
-0.006 |
|
Disclaimer/Publisher’s Note: The statements, opinions and data contained in all publications are solely those of the individual author(s) and contributor(s) and not of MDPI and/or the editor(s). MDPI and/or the editor(s) disclaim responsibility for any injury to people or property resulting from any ideas, methods, instructions or products referred to in the content. |
© 2024 by the authors. Licensee MDPI, Basel, Switzerland. This article is an open access article distributed under the terms and conditions of the Creative Commons Attribution (CC BY) license (http://creativecommons.org/licenses/by/4.0/).