

Submitted:
02 September 2024
Posted:
02 September 2024
You are already at the latest version
Abstract
The resilience of towns and cities refers to their ability to adapt and recover when confronted with pressures or challenges. This study employs ten variables as indicators to assess the resilience of urban areas by analyzing official data and constructing a multilevel mixed-effects structural equation model. The empirical findings demonstrate that enhancing resilience significantly influ-ences urban service functions, such as strengthening healthcare systems, stabilizing the real estate market, and addressing socio-economic challenges. Specifically, factors such as healthcare re-sources, housing demand, population structure, and social security exhibit varying levels of resil-ience, which profoundly impact the spatial distribution of these factors and socio-economic de-velopment. Disparities in healthcare resource allocation, demographic aging trends, and shifts in the housing market closely correlate with resilience levels in different regions. Additionally, the study emphasizes that improving resilience not only boosts the reliability and security of urban services but also ensures that communities receive necessary support and protection during times of adversity. Consequently, policymakers should recognize the pivotal role of urban resilience in resource allocation and social equity, devising corresponding strategies to enhance the resilience of these areas.
Keywords:
Multilevel Mixed-Effects Structural Equation Modelling
; urban resilience
; urban service functions
; real estate market
; social equity
1. Introduction
Taiwan, situated in a seismically active zone, grapples with around 239 earthquakes of magnitude 5 or higher annually, alongside 3 to 4 significant typhoons. Flooding threats are exacerbated by rapid urbanization, environmental degradation, and looming climate change. Recent studies suggest climate change could heighten flood risks, particularly in the island's northern and southern regions, and central and southern coastal areas. Taiwan's response has been anchored in resilience, acknowledging disasters as inherent and emphasizing preparation and adaptation. This resilience is fortified by stringent building codes, early warning systems, and community engagement. Integrating indigenous knowledge into disaster management further strengthens Taiwan's approach, serving as a model for sustainable development.
The 7.4 magnitude earthquake off Hualien's coast on April 3, 2024, underscores Taiwan's perpetual vulnerability to natural disasters. However, commendable community resilience has been evident in the swift emergency response and recovery efforts. Harnessing indigenous knowledge and local experience bolsters disaster management effectiveness. These measures, coupled with international cooperation, highlight the importance of multifaceted resilience strategies.
2. Materials and Methods
Taiwan must now assess its towns and cities' resilience comprehensively to confront future challenges effectively. Urban resilience, critical for sustainable development, requires equitable access to resources, resilient infrastructure, and inclusive growth. Collaborative efforts among governments, communities, and international organizations are imperative to foster resilience.
As the global population increasingly urbanizes, urban resilience becomes paramount, especially given cities' economic significance. Sustainable Development Goals emphasize urban resilience's foundational role, yet comprehensive initiatives remain scarce. The COVID-19 pandemic accentuates cities' vulnerability, emphasizing the need for long-term resilience planning. Assessing resilience through tools like the Towns and Cities Resilience Index can guide improvement efforts.
In Taiwan, the Multilevel Mixed-Effects Equation Model assesses resilience levels in towns and cities, identifying areas for enhancement and informing policy decisions. For instance, analyzing disease resistance during the COVID-19 pandemic highlights fluctuations in resilience levels over time. Such assessments are crucial for guiding sustainable development goals amidst dynamic risks and uncertainties.
The United Nations introduced the "2030 Sustainable Development Goals" (SDGs) in 2015, which consist of 17 primary goals encompassing 169 sub-goals and 230 indicators, directing global efforts towards sustainability. Among these goals, SDG 9 aims to "build resilient infrastructure, promote inclusive and sustainable industrialization, and foster innovation," while SDG 11 aims to "make cities and human settlements inclusive, safe, resilient, and sustainable," with resilience as a central objective. The concept of resilience, initially proposed by [1], originates from physics as "the ability of a system to absorb disturbances and still retain its basic structure and function." Since then, resilience has found wide application in various research fields such as ecology, engineering, and disaster risk management.
Urban studies began incorporating resilience thinking relatively late, with more literature emerging around the turn of the century [2,3]. The concept of resilience in urban systems encompasses characteristics such as robustness, stability, flexibility, agility, coordination, redundancy, diversity, foresight, independence, connectivity, collaboration, adaptability, self-organization, creativity, innovation, efficiency, and equity [4, p. 14]. These characteristics interact and require balanced consideration, such as the trade-off between increasing in redundancy and loss in system efficiency. Sharifi [5] proposed a resilience assessment system for cities based on five dimensions: environmental resources, social welfare, economy, built environment and infrastructure, and governance and organization. Further integration was done by [3] to construct a comprehensive urban resilience assessment system consisting of five criteria and 122 indicators.
In light of the COVID-19 pandemic, urban resilience has become even more critical. Cities worldwide have faced challenges in responding to the pandemic and enhancing public health and disaster resilience. Resilient cities have shown better abilities to address pandemic-related challenges [6]. Factors such as housing, sanitation facilities, ventilation, and lighting directly affect the spread of COVID-19 [7], while stability and diversity increase economic resilience [8]. Engaging in community adaptation and disaster reduction plans strengthens social resilience [9,10,11].
The COVID-19 crisis has provided an opportunity for urban decision-makers to learn valuable lessons and build long-term resilience against natural or man-made disruptions. As one of the most destructive events to date, COVID-19 has highlighted the importance of resilient cities, with over 95% of cases occurring in urban areas [12].
Similarly, urban vitality is crucial for urban development. It is driven by urbanization, urban contraction, urban reconstruction, and revitalization, leading to urban regeneration. Urban vitality and urban resilience coexist within urban systems, each with its own set of indicators, some of which overlap [13]. The relationship between indicators and their measurements helps clarify the urban development system. Structural equation modeling and path analysis are common methods used in the literature to explain and predict variable.
2.1. Model for Framing Resilience
This article utilizes a multilevel mixed-effects structural equation model to establish a resilience measurement system for towns and cities areas using data obtained from official websites (Figure 1). Figure 1 illustrates that this model includes a lower-level latent variable "resilience" to represent the lower-level resilience, indicating varying levels of resilience at the towns and cities level. A higher-level latent variable "resilience" is used to represent the resilience level at the county level. This model displays that are measurement indicators of resilience. This can be expressed as follows (1):
where represents the p-th resilience measurement variable in town and city area, Y denotes the resilience indicator, which is a latent variable. stands for the resilience indicator at the upper county level, and the resilience indicators for different towns and cities areas within the same county are identical. , , are parameters, and represents the error term.
2.2. Prediction of Resilience for Local Districts
The aggregated value of towns and cities resilience indicators can be estimated using the equation: , assuming . The logarithmic likelihood function is as follows (2):
where is covariance. The factor scores obtained after first-order condition derivation are as follows (3):
where is town and city area resilience that represents resilience index.
3. Results
The resistance to disease, which serves as an indicator of resilience, is employed to depict the capacity of towns and cities areas to withstand and endure health risks compared to other districts (Figure 2). Figure 2 illustrates that from September 22, 2022, to October 29, 2022, the number of confirmed COVID-19 cases in six direct-controlled municipalities, Hsinchu City, and Keelung City gradually increased in Taiwan. Conversely, during the same period, the number of confirmed COVID-19 cases in the United States steadily decreased, in contrast to the trend observed in Taiwan. Initially, cities and towns in Taiwan exhibited a higher level of resistance to the pandemic compared to the USA. However, this resistance gradually declined and fell below that of the USA between September 22, 2022, and October 29, 20221.
3.1. Data and Variables
Town and city resilience pertains to the capacity of these locales to adapt and rebound when confronted with stress or challenges. This resilience can reshape the service functionalities of these regions. In urban settings, resilience can significantly influence the city's service functions, rendering them more adaptable and resilient. In rural areas, resilience can aid rural communities in more effectively tackling challenges in agriculture, the environment, and the economy (Table 1). Table 1 provides an explanation of the relevant variables, their definitions, and the implications of the data content.
- Healthcare: Strengthening urban resilience can enhance the healthcare system by expanding the number of hospitals and beds, improving the capacity to address public health emergencies, and ensuring timely access to medical services during crises for residents.
- Real Estate Market Stability: The improvement of town and city resilience may reinforce local economic and social stability, consequently positively impacting the real estate market. Stable economic and social conditions typically bolster confidence in the real estate sector, stimulating activities among homebuyers and investors and sustaining property prices.
- Increase in Vacant Properties among Low-Power Consumption Households: Increased town and city resilience may result in population mobility and urban-rural disparities, leading to migration from rural to urban areas and a decline in rural populations. This mobility could elevate housing demand and the prevalence of vacant properties in urban areas, exacerbating the issue of vacant properties in rural regions.
- Aging Population: Societal progress and the enhancement of town and city resilience may lead to widespread population aging. Consequently, the proportion of the population aged 15-64 may diminish as the demographic structure shifts towards aging.
- Increase in Disabilities and Low-Income Households: Despite advancements in town and city resilience in certain areas, social safety nets may remain insufficient, particularly for individuals with disabilities and low-income households. Inadequate social support could contribute to a rise in the number of people with disabilities and low-income families.
- Increase in ageing Population: Enhanced town and city resilience implies better healthcare services and infrastructure, contributing to improved infant and child health outcomes and reduced mortality rates, thus leading to an increase in the population aged 0-14.
- Average Housing Area: With the augmentation of town and city resilience, cities may become more appealing, attracting a greater influx of population and fostering urbanization. Responding to heightened demand, developers might prioritize efficiency by constructing smaller yet more numerous housing units, thereby reducing the average housing area. Overall, enhancing urban resilience can improve the reliability, safety, and adaptability of various urban services, ensuring that urban residents receive necessary support and protection when facing various challenges and changes.
3.2. Discussion and Implications
This study utilizes data released by official agencies to select 10 variables as indicators of town and city resilience, constructing a multilevel mixed-effects structural equation model (Table 2). Table 2 indicates that variables such as "hospital," "hospital beds," "low power," "low income," and "disabilities" exhibit significant spatial distribution variations, suggesting significant disparities and uneven distribution of vacant resources, medical resources, and vulnerable groups across different districts. This unequal distribution primarily stems from differences in town and city resilience. Other variables such as "patients served," "aging," "housing price," "dependency," and "building" demonstrate lower spatial distribution variations, indicating a more even spatial distribution of medical service density, aging population, family burden, and housing services attributed to the resilience where they are. The selection of these variables is based on their appearance in the literature and availability in databases.
The town and city resilience in this study refers to the resistance and adaptation capabilities of communities or districts to various challenges and pressures. The established multilevel mixed-effects structural equation model in this study (Figure 3) illustrates the close correlation between different levels of town and city resilience and the unequal distribution of various resources. Figure 3 indicates the crucial role of town and city resilience in ensuring community development and equity. Moreover, town and city resilience also exhibits spatial distribution differences. Disparities in resource distribution may have profound implications for the socioeconomic development of regions. For instance, differences in the number of hospital beds and beds per thousand people may lead to certain areas facing shortages of medical resources, while unequal spatial distribution of low-income households and persons with disabilities may exacerbate social inequality.
Based on these explanations, policies addressing resource allocation issues can be formulated to improve or enhance town and city resilience. Utilizing maximum likelihood estimation, the estimation results of the model are obtained (Table 3 and Figure 4). Table 3 and Figure 4 present the estimation results of the multilevel mixed-effects structural equation model for the resilience of towns and cities in Taiwan, including coefficients of latent variables, variances, variances of errors, and logarithmic likelihood values. From the results, it can be observed that variables such as the number of low power consumption households, number of hospital beds, average number of persons served per medical institution, average number of beds per thousand people in medical institutions, dependency ratio, aging index, housing prices, average building area, total number of persons with disabilities, and low income households are significantly correlated with district resilience. The coefficients of resilience reach significant levels in each model (p < 0.01), indicating the significant influence of town and city resilience on these factors. Additionally, M1[countycode] representing the resilience of the county or city to which the town or city area belongs also significantly impacts these factors. However, except for housing prices and average building area, the impact of town and city resilience on factors is greater than that of county or city resilience. The variance of M1[countycode] is higher than that of town and city resilience, indicating significant differences in resilience between different counties or cities, and the spillover effect of resilience remains more pronounced within small area ranges. This may be related to the level of economic development and allocation of social service resources in each area.
4. Discussion
Based on the substituted values of town and city variables into Equation (4), resilience indices are computed, and then presented using ArcGIS maps (Figure 5, Figure 6, Figure 7 and Figure 8). These figures from 5 to 8 depict different regions (such as townships, districts, and counties) along with their corresponding resilience index values. These values are used to classify regions into categories such as high resilience areas, low resilience areas, hotspots, and cold spots. The analysis reveals that high resilience areas are mainly concentrated in the plains of the northern, central, and southern regions, while low resilience areas are distributed in the central mountain range and eastern regions.
Furthermore, specific areas such as Taipei City, New Taipei City, Chiayi City, and Taichung City are described in terms of their resilience status, along with some hotspots, cold spots, and areas potentially affected by overflow effects. Finally, the study also describes the distribution of overall county-level resilience hotspots.
5. Conclusions
This study utilizes data released by official agencies to filter out ten indicators of town and city resilience and establishes a multilevel mixed-effects structural equation model. The results of the model show that town and city resilience is closely related to the unequal distribution of various resources, including vacant houses, medical resources, and vulnerable populations. Town and city resilience plays a crucial role in community development and equity, exhibiting spatial variations. The model estimation results obtained through maximum likelihood estimation indicate significant correlations between multiple factors and regional resilience, with town and city resilience having a greater impact on factors than county-level resilience. Improvement in town and city resilience may lead to an increase in the number of vacant houses and hospital beds but is negatively correlated with the average number of individuals served per medical institution. Differences in town and city resilience are closely related to changes in the dependency ratio, aging index, residential prices, average building area, total number of disabled individuals, and number of low-income households. These results highlight the importance of town and city resilience for socio-economic development and equity and propose policy recommendations to enhance town and city resilience for promoting sustainable development and social equity across regions.
Below are some recommendations based on the analysis of town and city resilience:
- Policy for Equal Resource Allocation: Given the disparities in town and city resilience and unequal resource distribution revealed by the analysis, the government can formulate corresponding policies to ensure equitable distribution of resources between town and city areas, especially in healthcare, education, and infrastructure development.
- Strengthening Healthcare Services in Rural Areas: Considering the relatively lower service population of medical institutions in rural areas, the government can enhance investment in healthcare resources in rural areas to improve the accessibility and quality of healthcare services, thus reducing the urban-rural healthcare gap.
- Promoting Balanced Urbanization and Rural Development: As urbanization progresses leading to population decline and increased vacant houses in rural areas, the government can promote balanced urbanization and rural development through policy implementation to enhance employment opportunities and living conditions in rural areas, thereby reducing population outflow.
- Diversification of Economic Development: Uneven economic development is one of the significant factors contributing to differences in town and city resilience. The government can promote diversification of economic development to enhance the economic vitality of rural areas, reduce poverty, and improve overall societal resilience.
- Enhancing Social Security and Welfare Policies: Given the income and social welfare disparities between town and city areas, the government can strengthen social security and welfare policies to improve the living standards of low-income households and vulnerable groups, thus reducing social inequality.
- Assessment and Monitoring of Regional Resilience: The government can establish an assessment and monitoring system for town and city resilience to periodically assess and monitor the resilience levels of various regions, promptly identify issues, and formulate corresponding response measures.
In summary, the government can formulate policies and measures tailored to the characteristics and needs of different regions to promote the enhancement of town and city resilience, thereby achieving comprehensive, coordinated, and sustainable development.
Author Contributions
Chich-Ping Hua is the sole author of this article. He is responsible for the research framework, literature collection and organization, data collection, model construction and operation, analysis and discussion, and report writing.
Funding
This research was funded by National Science and Technology Council Taiwan, grant number NSTC 112-2221-E-130 -003 -MY3.
Institutional Review Board Statement
Not applicable.
Informed Consent Statement
Not applicable.
Data Availability Statement
Data is available under request.
Conflicts of Interest
The author declares no conflicts of interest.
| 1 | This article defines resistance to disease on COVID-19 as , where is level of resistance to disease on COVID-19 of city i of Taiwan on date t, is the COVID-19 confirmed cases in the United States on date t and is the COVID-19 confirmed cases in city i of Taiwan on date t. |
References
- Holling, C.S. Engineering resilience. In Schulze, P.E. (Ed.), Engineering within ecological constraints; National Academy Press: Washington, DC, USA, 1996; pp. 31–43. [Google Scholar] [CrossRef]
- Sharifi, A.; Yamagata, Y. Urban resilience assessment: Multiple dimensions, criteria, and indicators. In Sharifi, A.; Yamagata, Y. (Eds.), Urban Resilience, Ed.; Springer International Publishing: Cham, Switzerland, 2014; pp. 259–276. [Google Scholar]
- Sharifi, A.; Yamagata, Y. Principles and criteria for assessing urban energy resilience: A literature review. Renew. Sustain. Energy Rev. 2016, 60, 1654–1677. [Google Scholar] [CrossRef]
- The National Academies of Sciences, Engineering, and Medicine. Disaster resilience: A national imperative; The National Academies Press: Washington, DC, USA, 2012. [Google Scholar] [CrossRef]
- Sharifi, A. A critical review of selected tools for assessing community resilience. Ecol. Indic. 2016, 69, 629–647. [Google Scholar] [CrossRef]
- Akter, S.; Hakim, S.S.; Rahman, M.S. Planning for pandemic resilience: COVID-19 experience from urban slums in Khulna, Bangladesh. J. Urban Manag. 2021, 10, 325–344. [Google Scholar] [CrossRef]
- Ghosh, S.; Seth, P.; Tiwary, H. How does COVID-19 aggravate the multidimensional vulnerability of slums in India? A commentary. Soc. Sci. Humanit. Open 2020, 2, Article 100068. [Google Scholar] [CrossRef]
- Norris, F.H.; Stevens, S.P.; Pfefferbaum, B.; Wyche, K.F.; Pfefferbaum, R.L. Community resilience as a metaphor, theory, set of capacities, and strategy for disaster readiness. Am. J. Community Psychol. 2008, 41, 127–150. [Google Scholar] [CrossRef] [PubMed]
- Berkes, F.; Ross, H. Community resilience: Toward an integrated approach. Soc. Nat. Resour. 2013, 26, 5–20. [Google Scholar] [CrossRef]
- Cutter, S.L.; Finch, C. Temporal and spatial changes in social vulnerability to natural hazards. Proc. Natl. Acad. Sci. USA 2008, 105, 2301–2306. [Google Scholar] [CrossRef] [PubMed]
- Kulig, J.C.; Edge, D.S.; Townshend, I.; et al. Community resiliency: Emerging theoretical insights. J. Community Psychol. 2013, 41, 758–775. [Google Scholar] [CrossRef]
- UN-HABITAT. World cities report 2022: Envisaging the future of cities; United Nations Human Settlements Programme: Nairobi, Kenya, 2022. [Google Scholar]
- Jiang, Y.; Chen, Z.; Sun, P. Urban shrinkage and urban vitality correlation research in the three north-eastern provinces of China. Int. J. Environ. Res. Public Health 2022, 19, Article 10650. [Google Scholar] [CrossRef] [PubMed]
Figure 1.
Multilevel mixed- effects structural equation model of town and city areas.
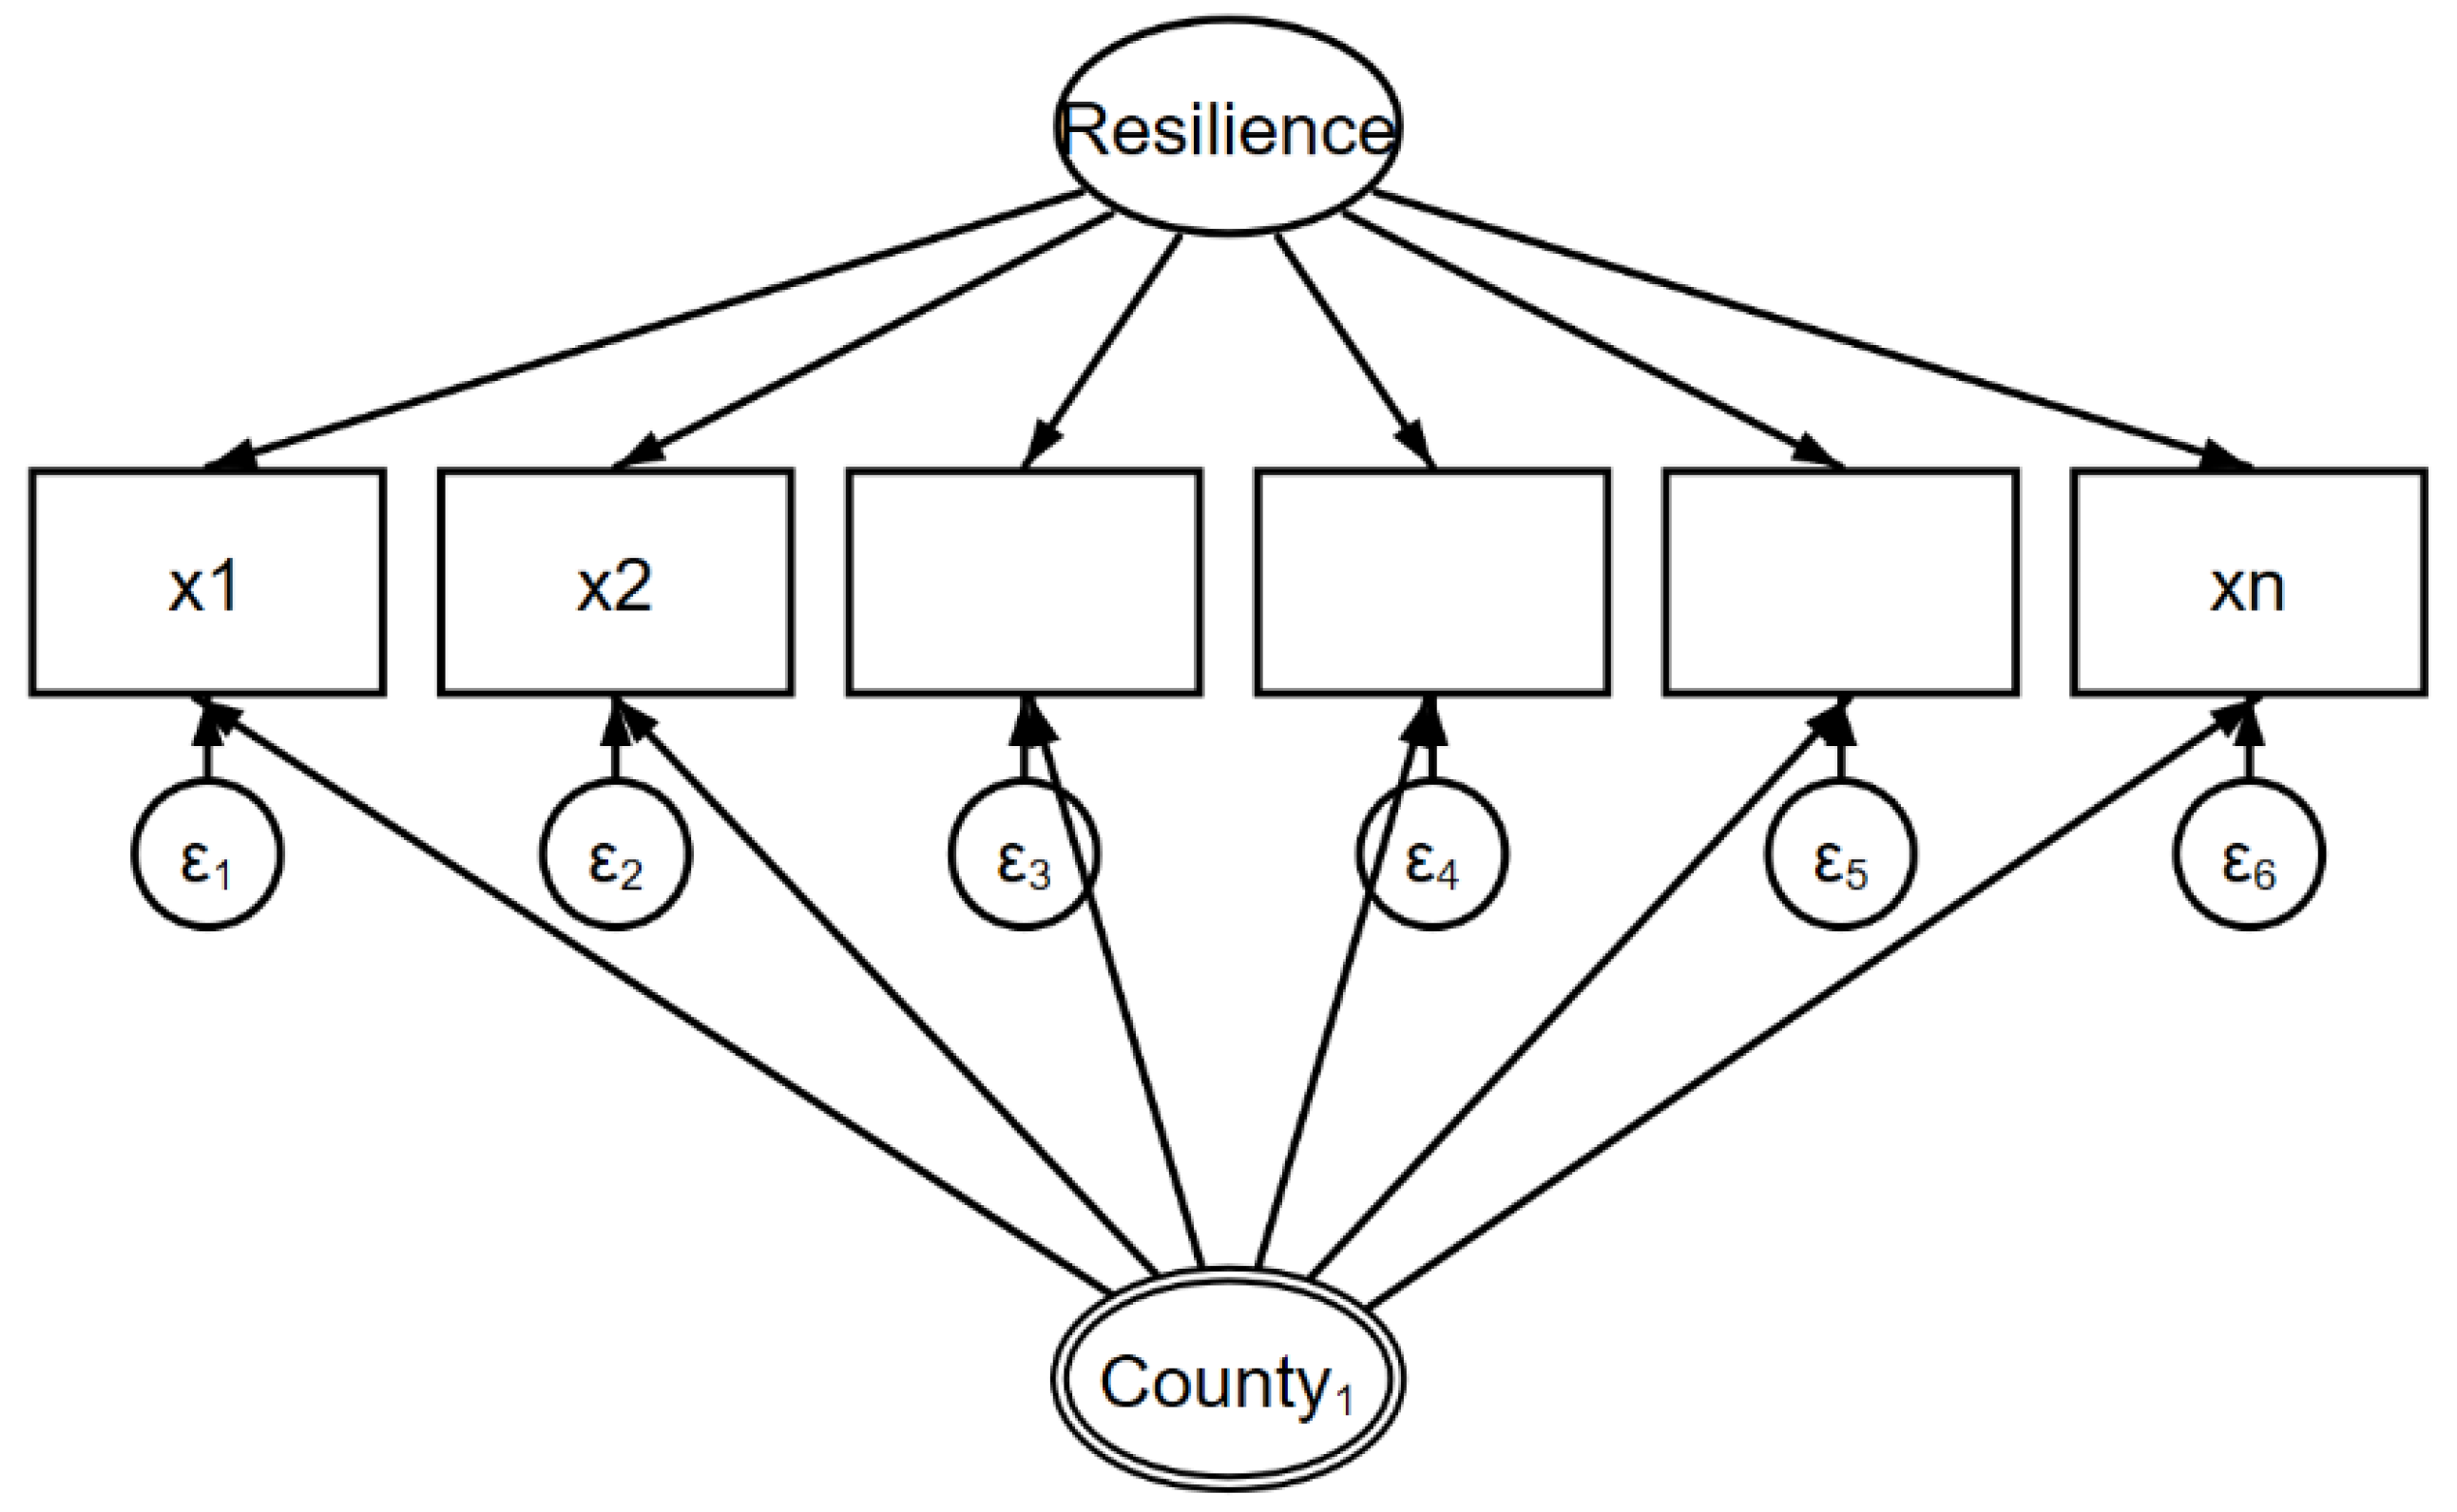
Figure 2.
The time series of COVID-19 cases and disease resistance in Taiwan relative to the USA from September 22 to October 29, 2022.
Figure 2.
The time series of COVID-19 cases and disease resistance in Taiwan relative to the USA from September 22 to October 29, 2022.
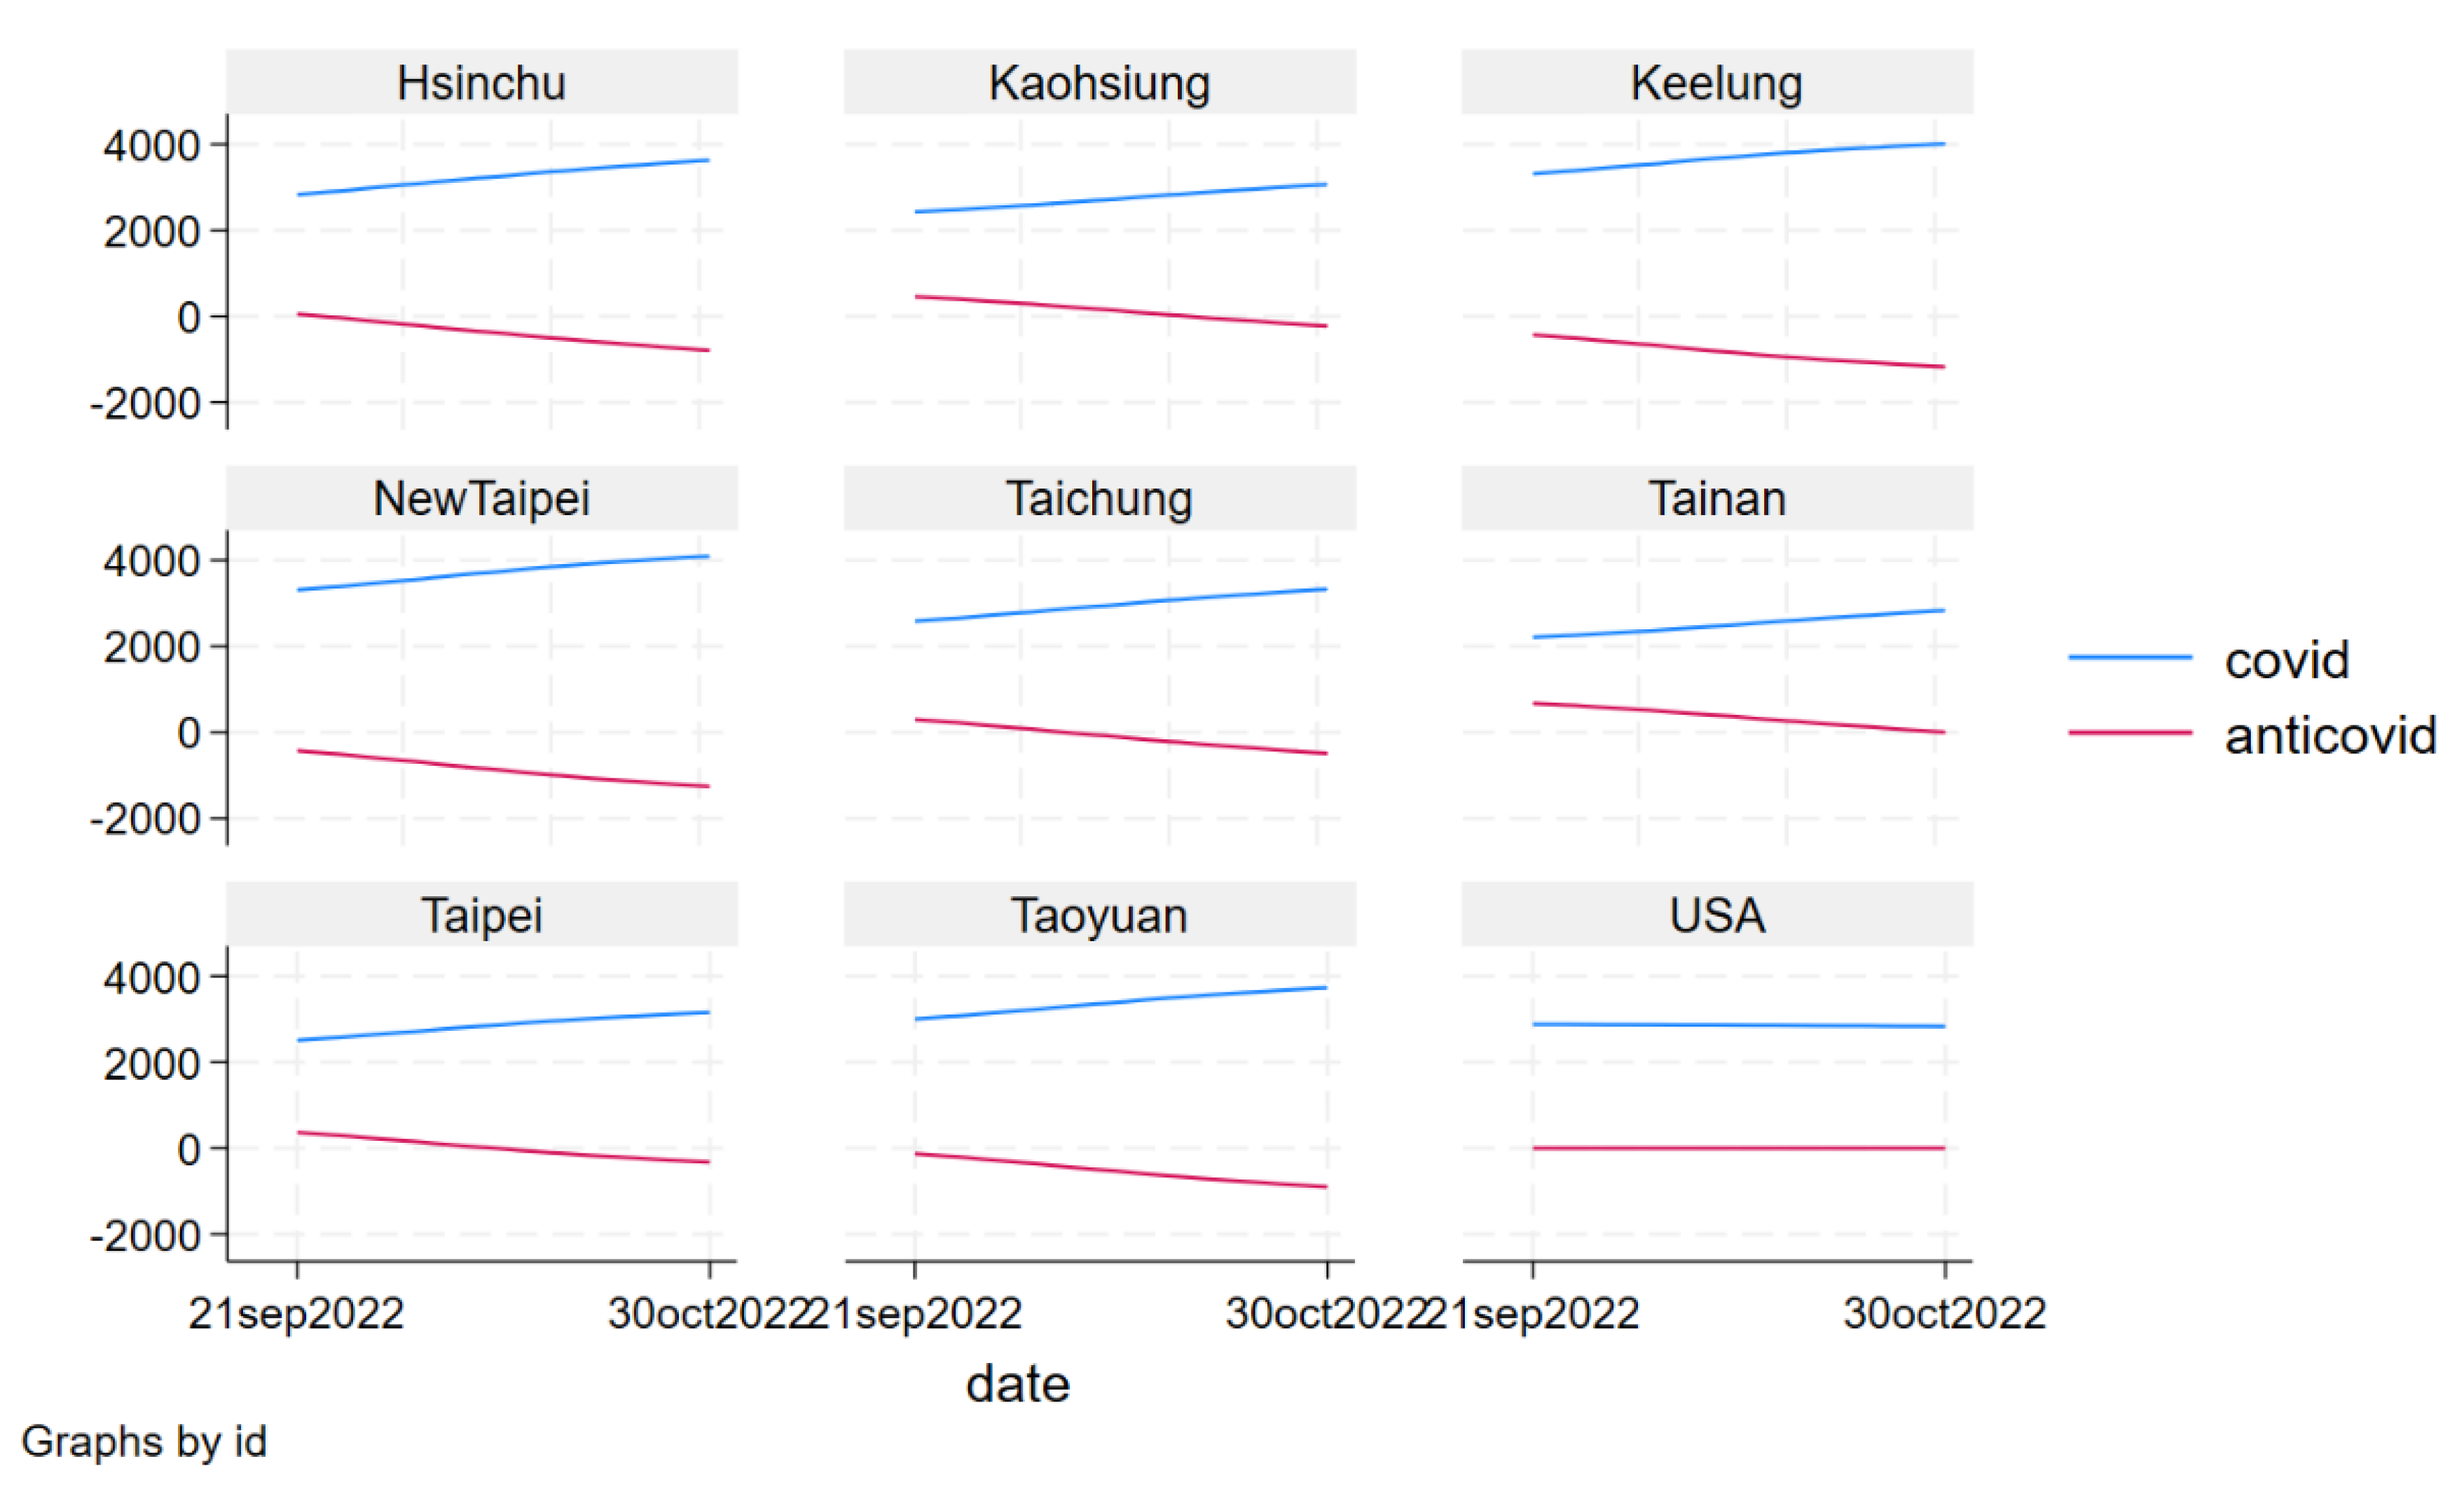
Figure 3.
Multilevel mixed-effects structural equation model for resilience of town and city in Taiwan.
Figure 3.
Multilevel mixed-effects structural equation model for resilience of town and city in Taiwan.
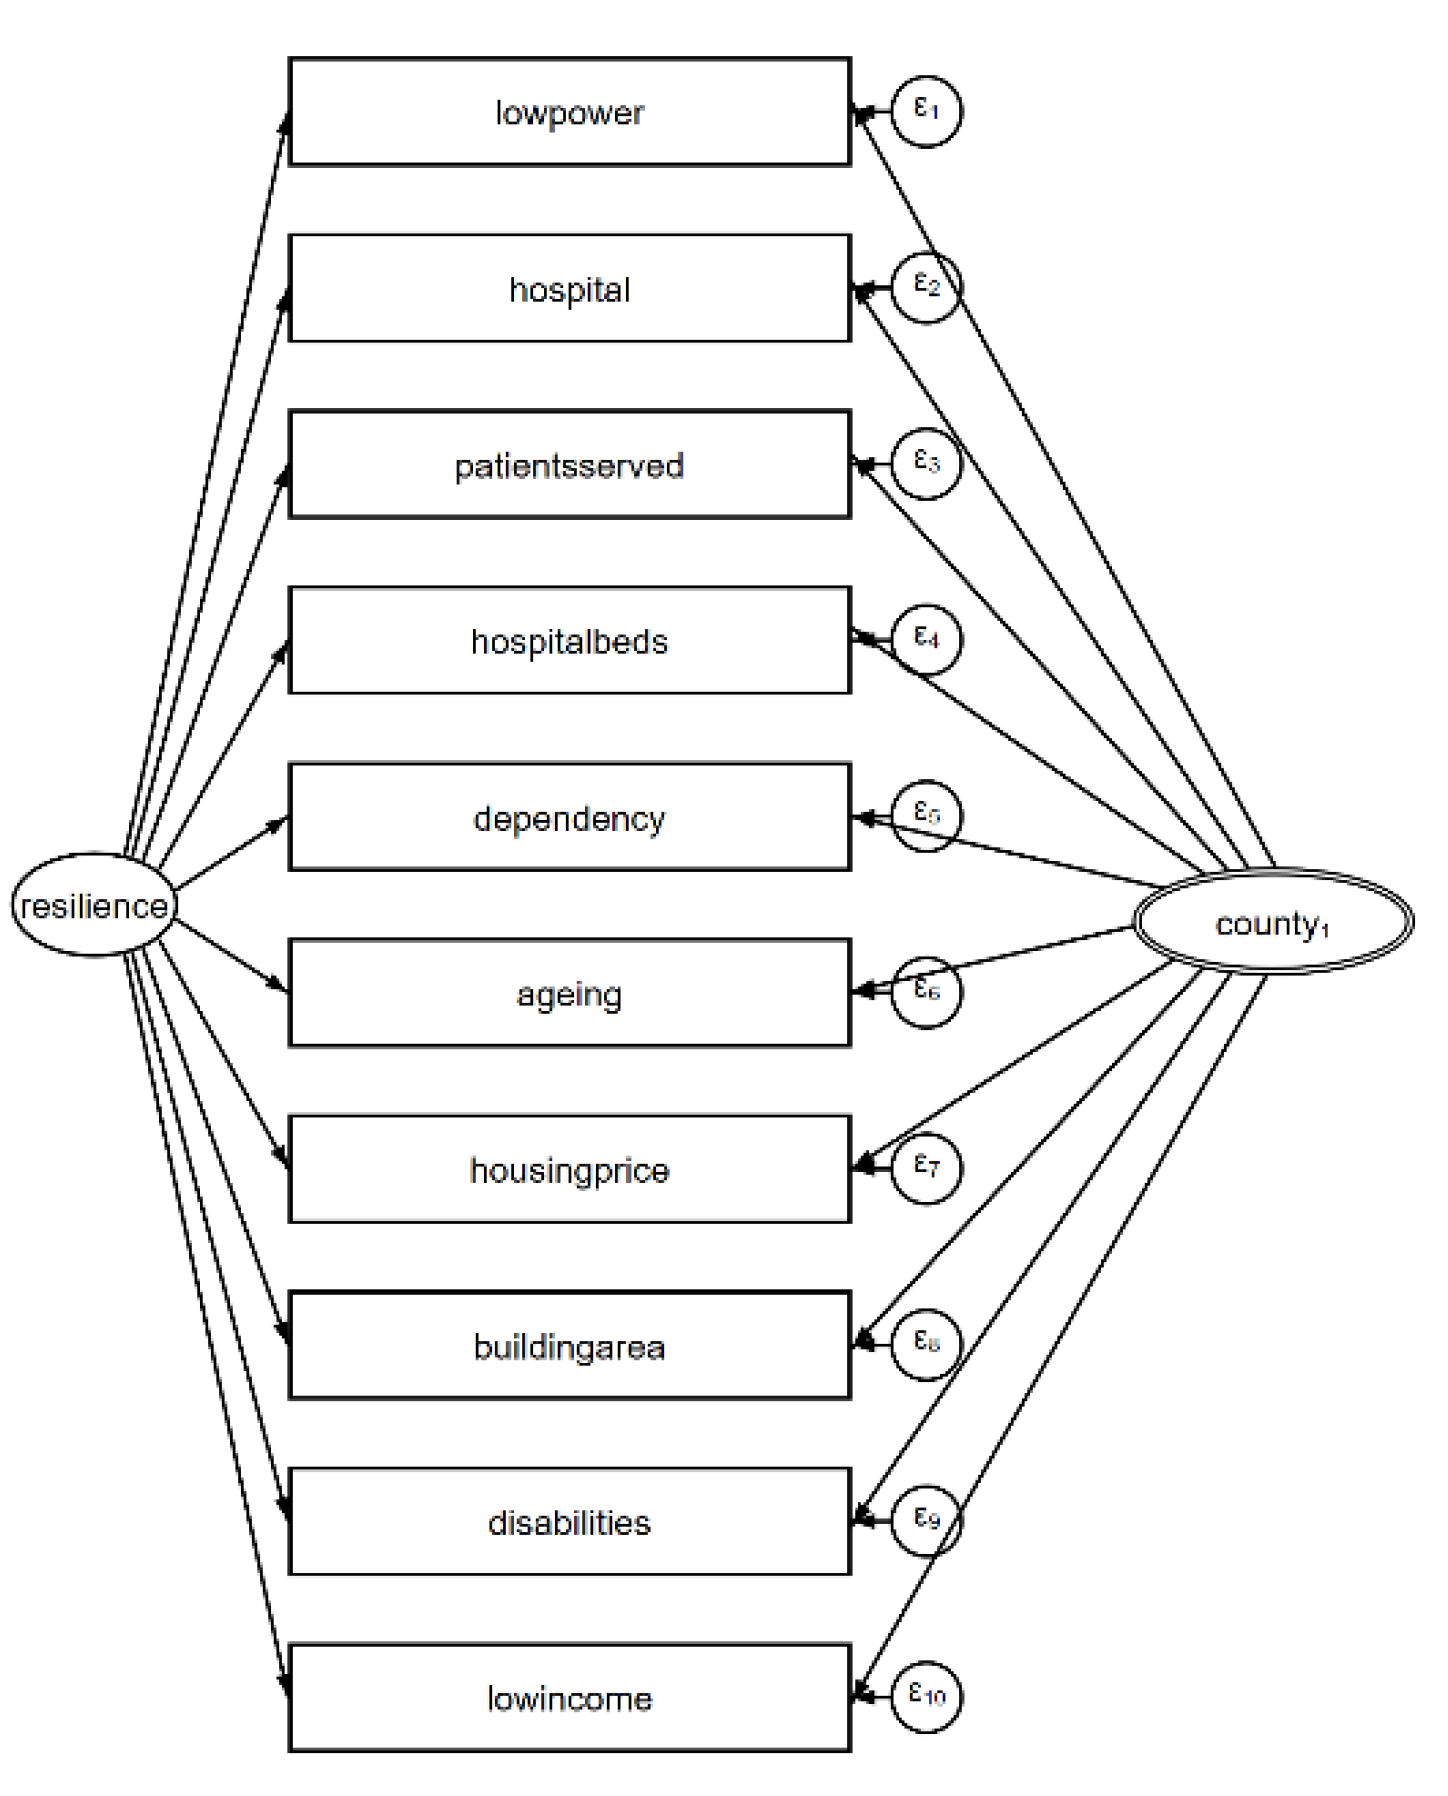
Figure 4.
Empirical results of research on multilevel mixed-effects structural equation model of resilience of town and city in Taiwan.
Figure 4.
Empirical results of research on multilevel mixed-effects structural equation model of resilience of town and city in Taiwan.
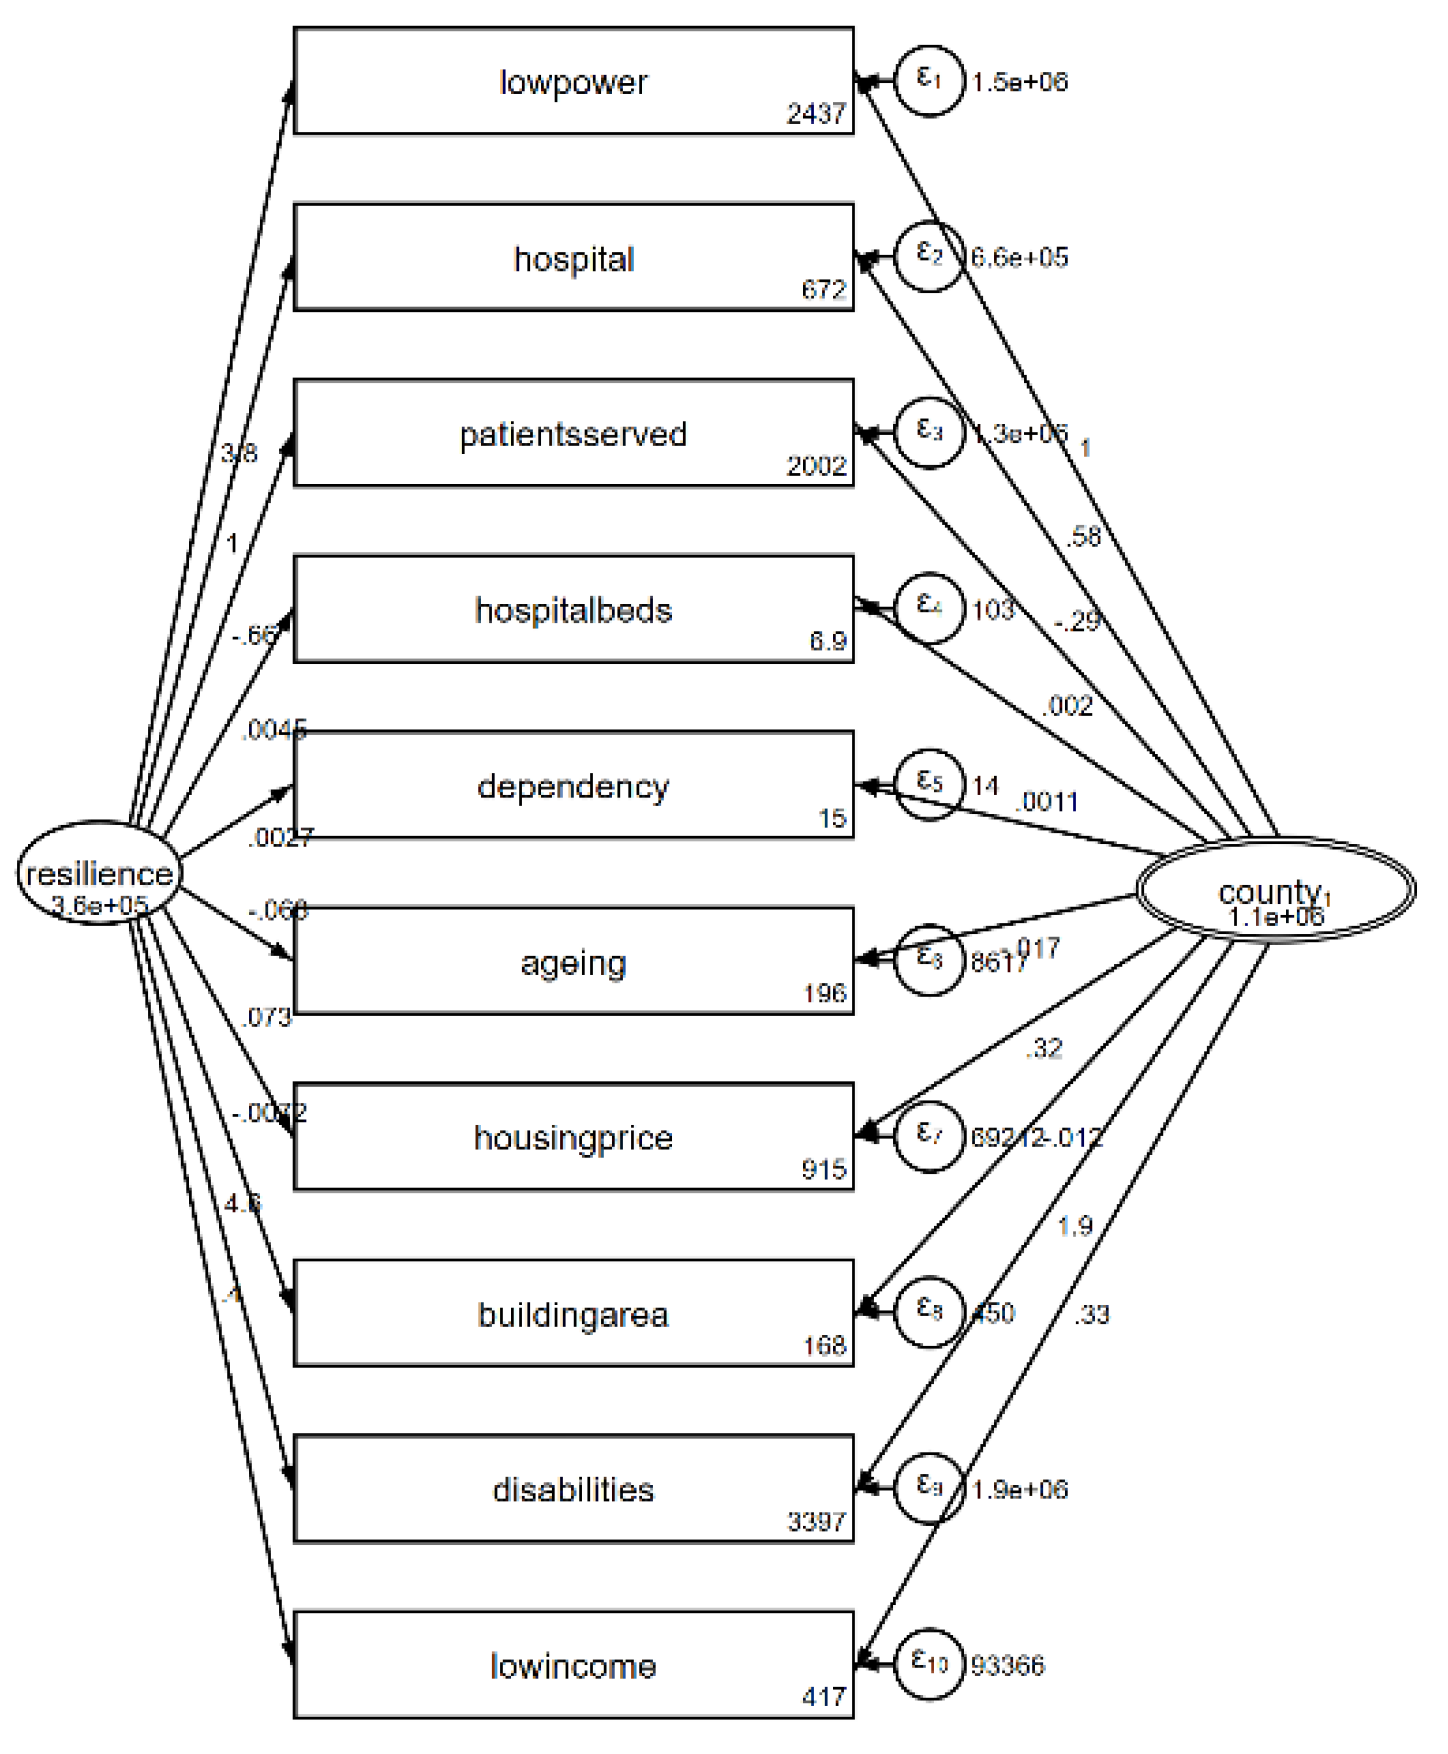
Figure 5.
Resilience index distribution of urban and town areas in Taiwan.
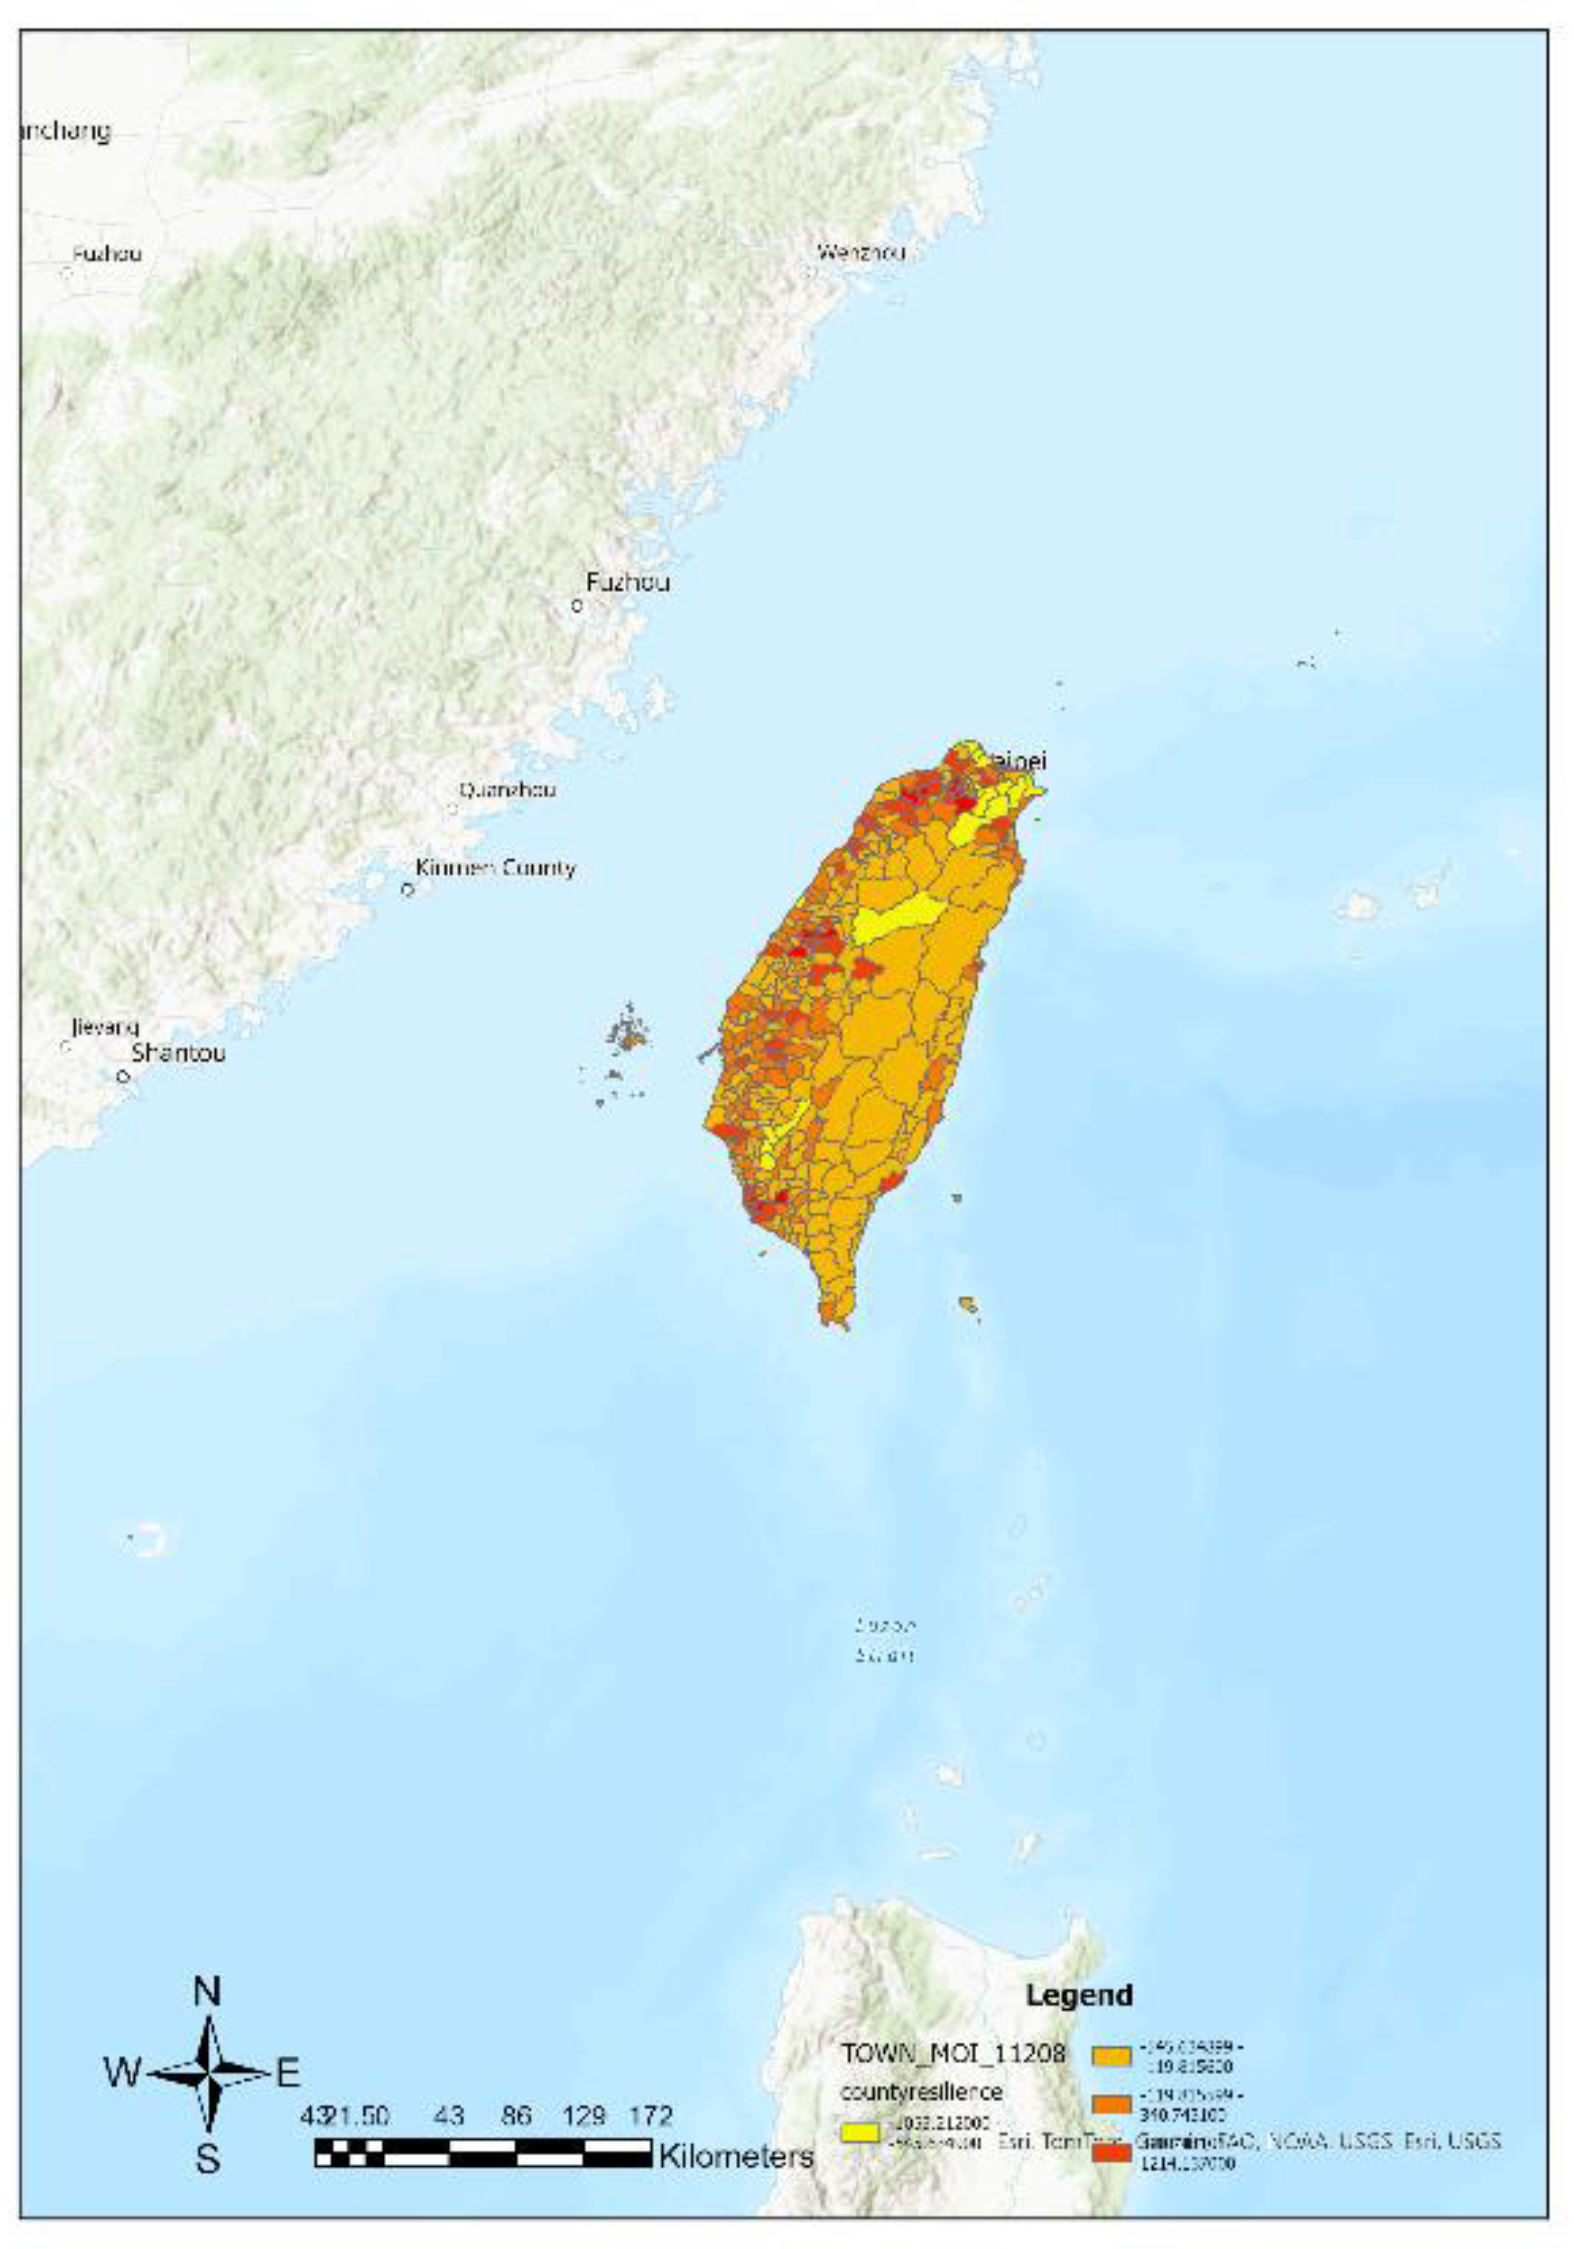
Figure 6.
Resilience index distribution of city areas in Taiwan.
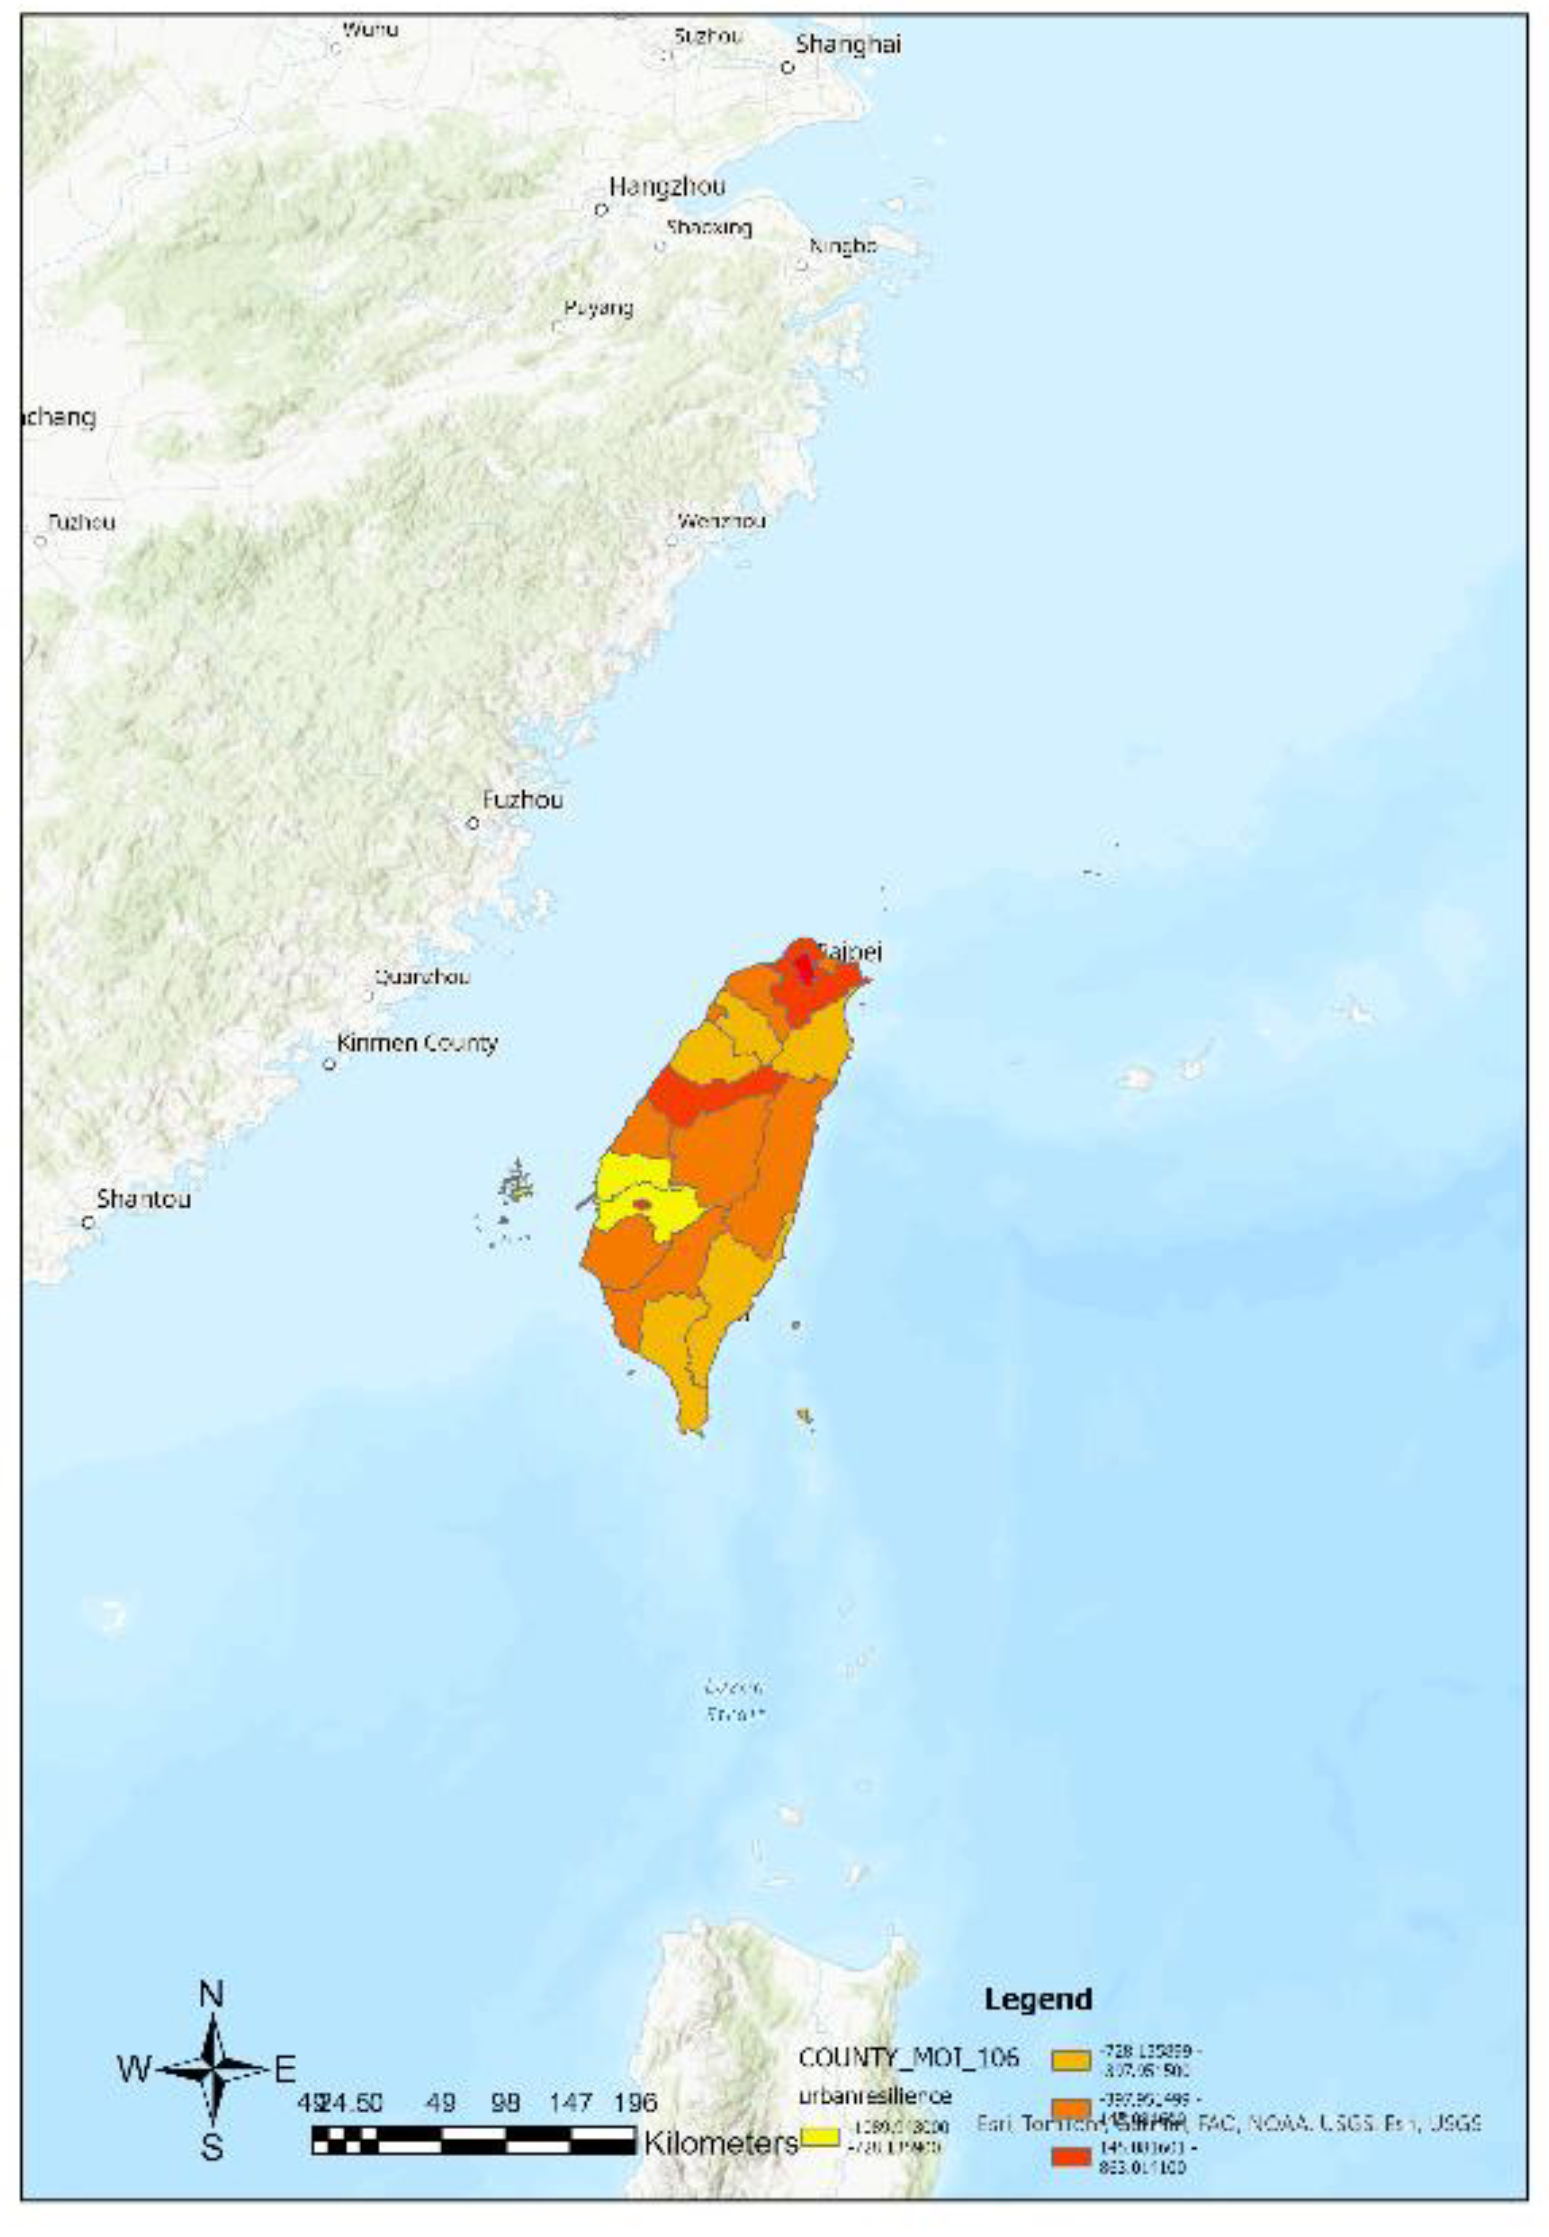
Figure 7.
Local indicators of spatial association distribution of resilience indices of urban and town areas in Taiwan.
Figure 7.
Local indicators of spatial association distribution of resilience indices of urban and town areas in Taiwan.
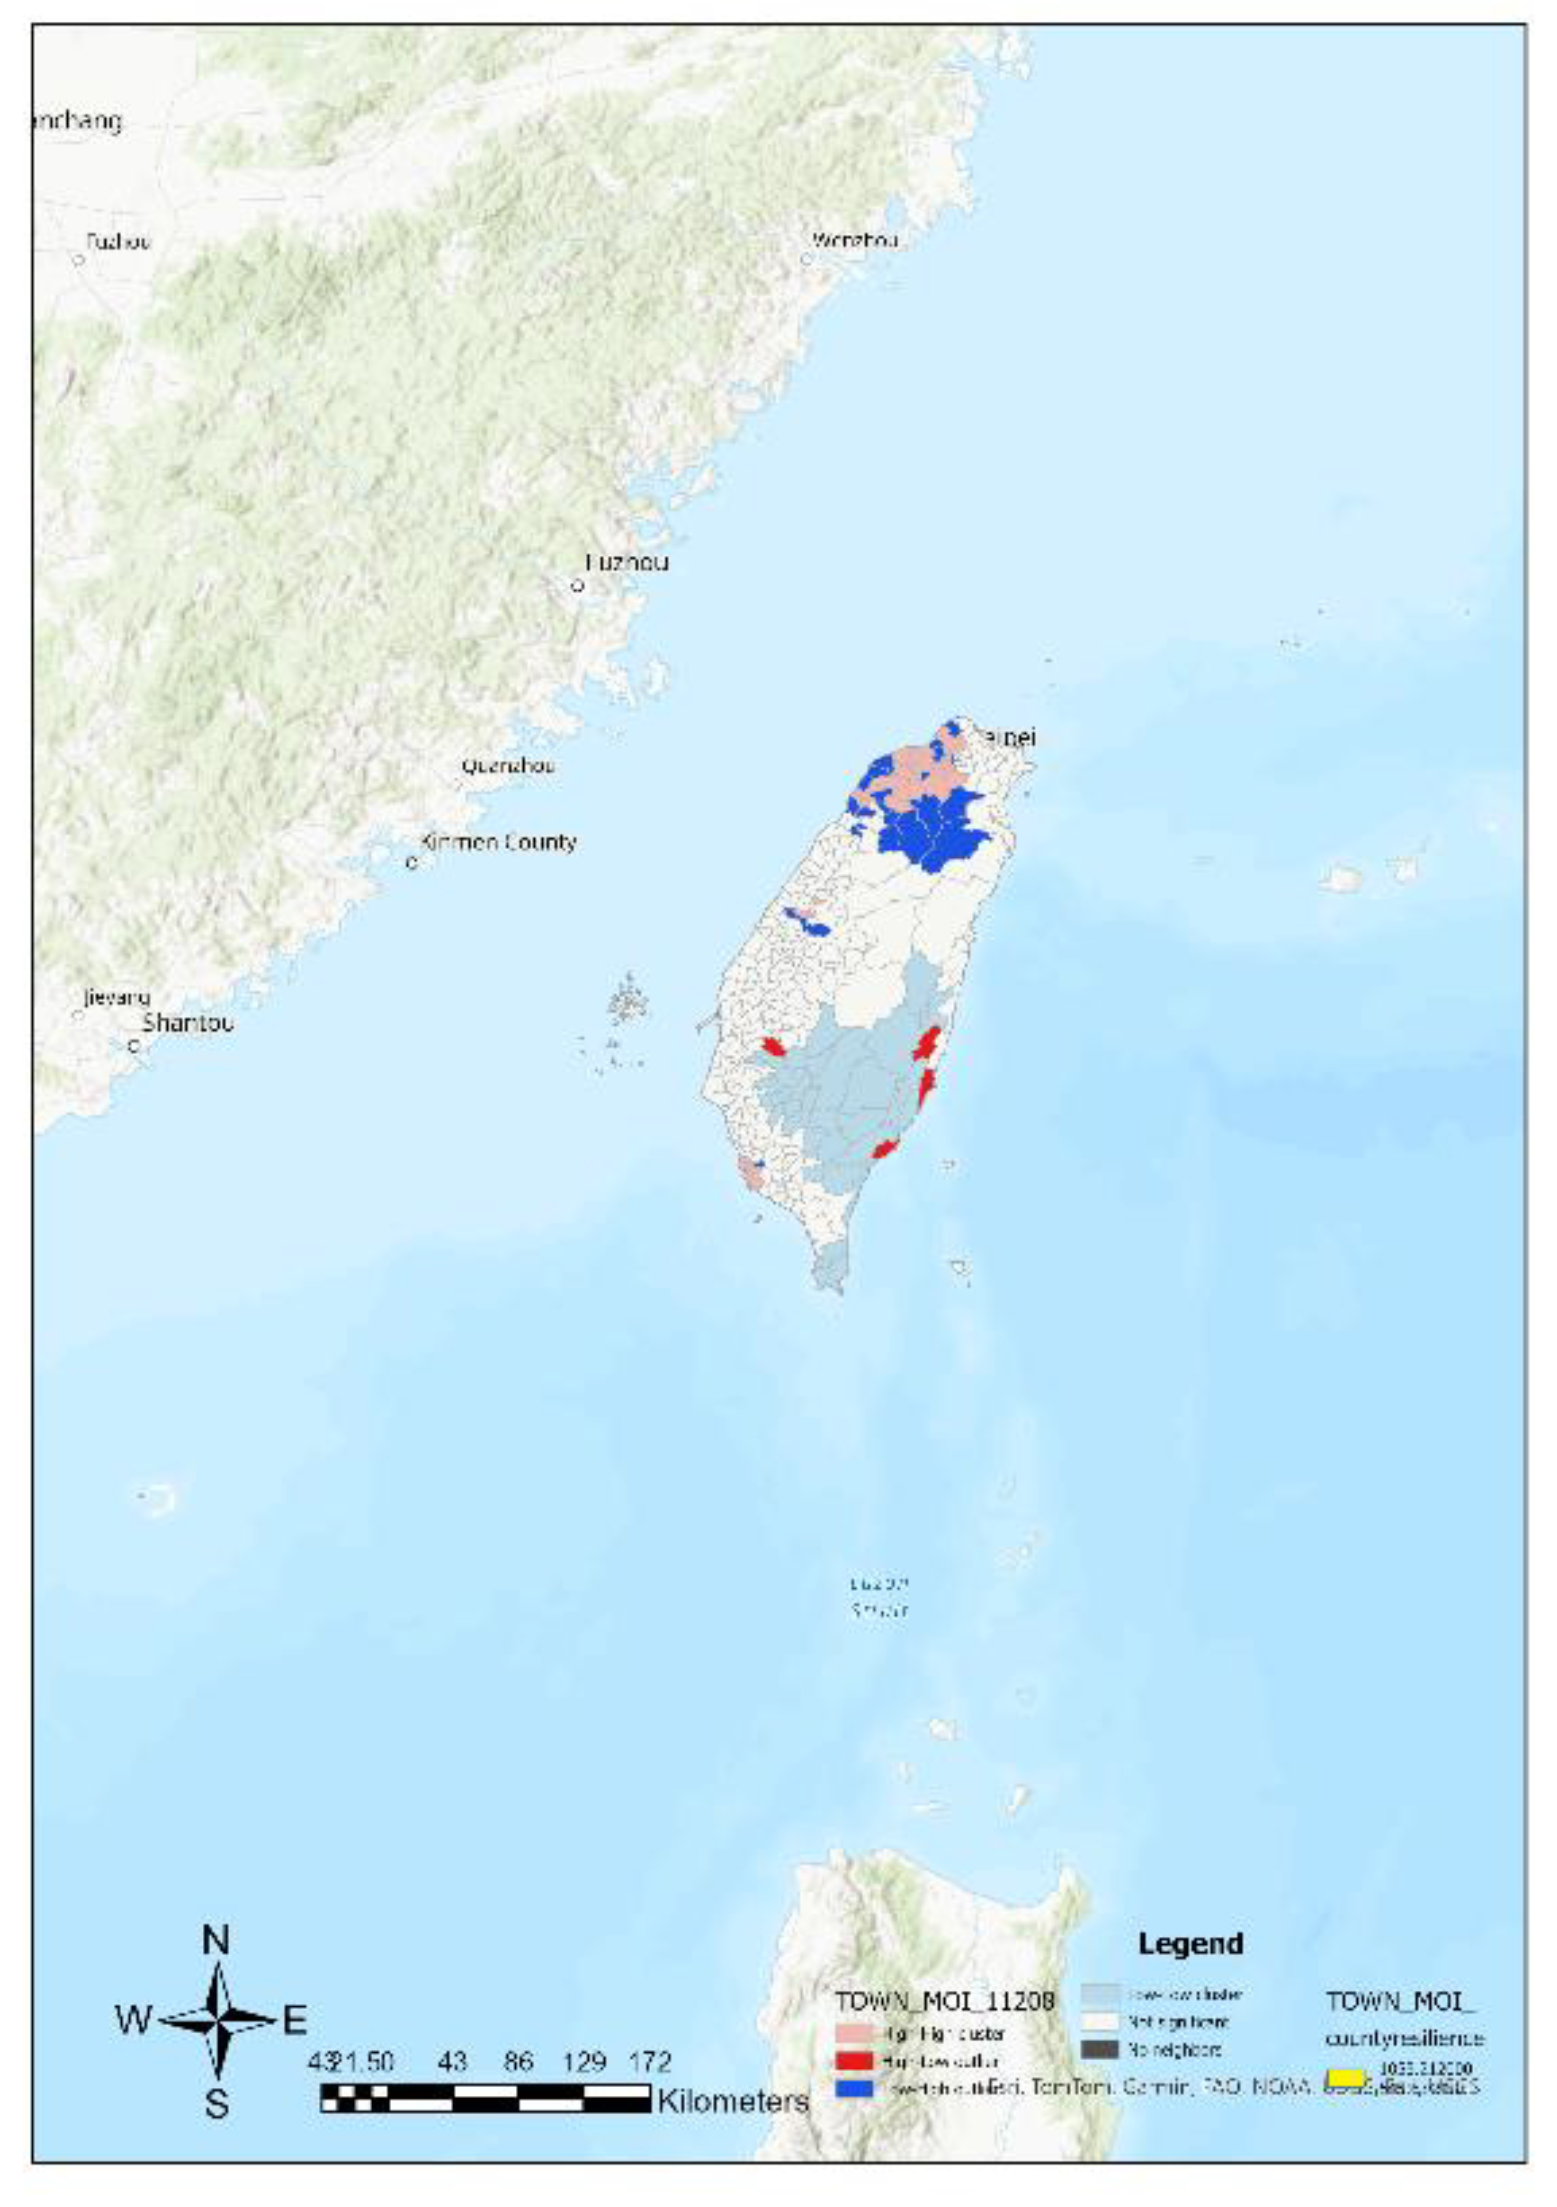
Figure 8.
Local indicators of spatial association distribution of resilience indices of city areas in Taiwan.
Figure 8.
Local indicators of spatial association distribution of resilience indices of city areas in Taiwan.
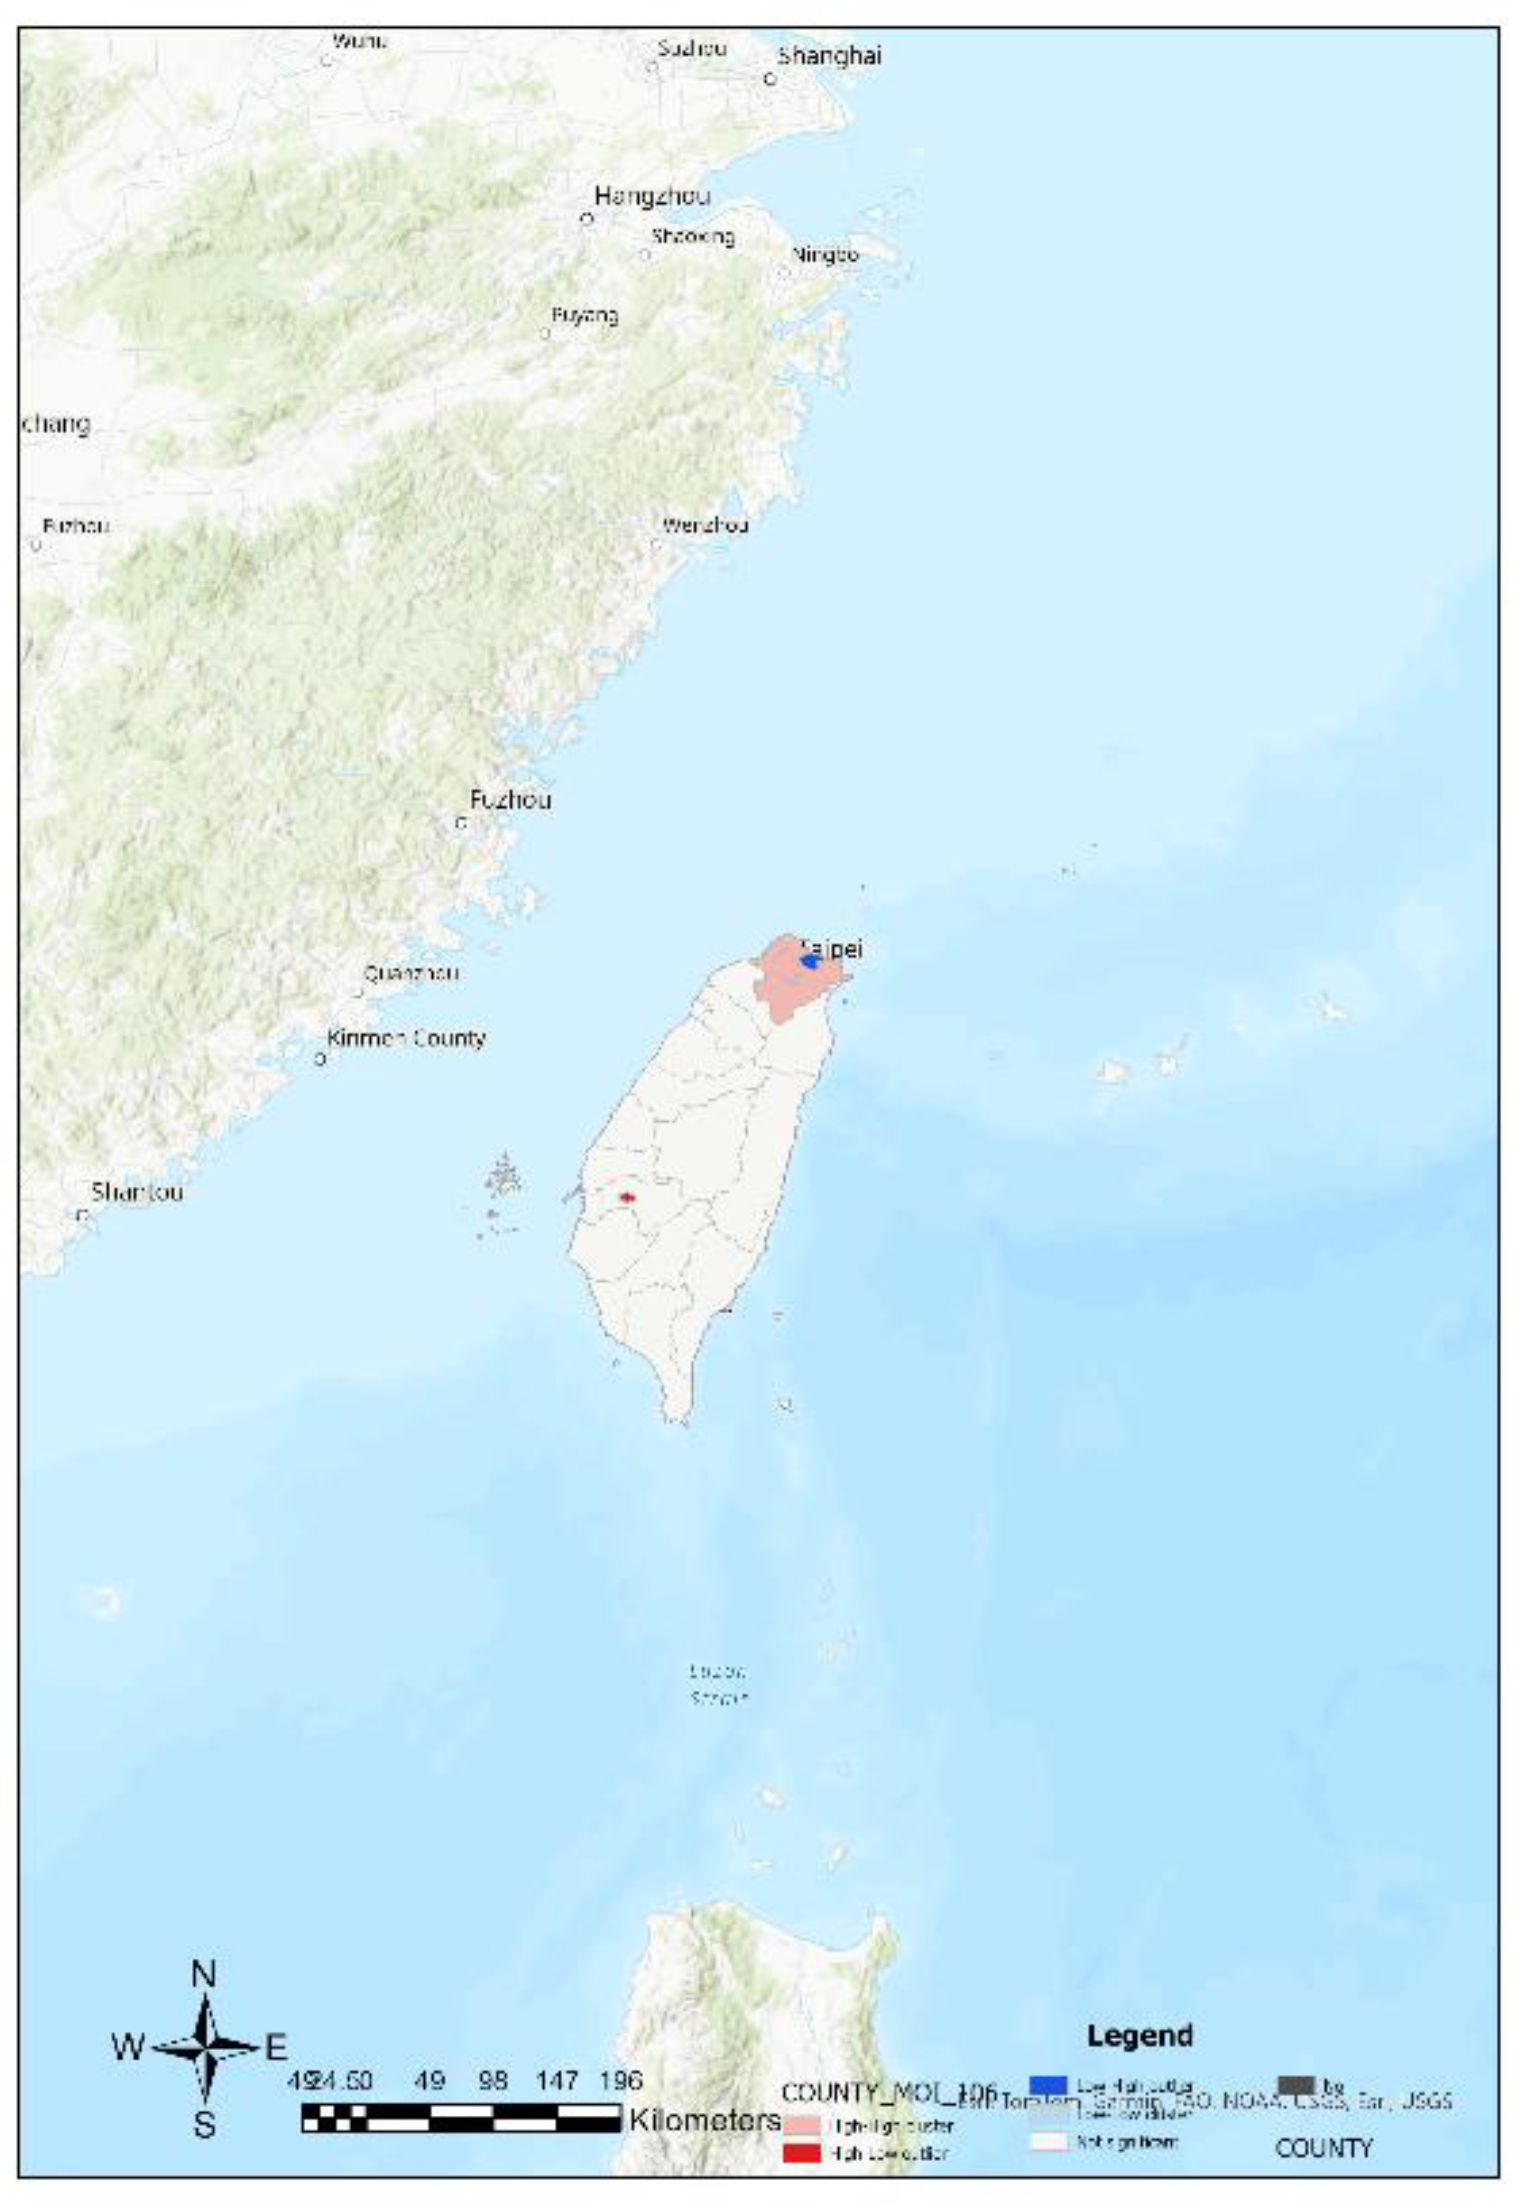

Table 1.
Variables and data specification.
| Variable | Specification | Unit | Type | Data Source |
| low power | Number of residential households with average electricity consumption equal to or less than 60 kilowatt-hours per month in November and December each year | Dwelling Unit | Discrete | Ministry of Interior Real Estate Information Platform (https://pip.moi.gov.tw) |
| hospital | Number of hospital beds in medical institutions | Hospital Beds | Discrete | Social Economic Geography Information System (https://segis.moi.gov.tw) |
| patients served | Average number of patients served per medical institution | Person | Continuous | Social Economic Geography Information System (https://segis.moi.gov.tw) |
| hospital beds | Average number of hospital beds per thousand people | Hospital Beds/1000 persons | Continuous | Social Economic Geography Information System (https://segis.moi.gov.tw) |
| dependency | The ratio of the population aged 0-14 to the population aged 15-64, multiplied by 100 | - | Continuous | Social Economic Geography Information System (https://segis.moi.gov.tw) |
| ageing | The ratio of the population aged 65 and above to the population aged 0-14, multiplied by 100 | - | Continuous | Social Economic Geography Information System (https://segis.moi.gov.tw) |
| housing price | Average price of residential property | Ten Thousand Dollars | Continuous | Ministry of Interior Real Estate Information Platform (https://pip.moi.gov.tw) |
| building | Average area of residential property | Square Meters | Continuous | Ministry of Interior Real Estate Information Platform (https://pip.moi.gov.tw) |
| disabilities | Total population with disabled | Person | Discrete | Social Economic Geography Information System (https://segis.moi.gov.tw) |
| low income | Total number of low-income households | Household | Discrete | Social Economic Geography Information System (https://segis.moi.gov.tw) |
Table 2.
Descriptive statistics of variables.
| Variable | Observation | Mean | Standard Deviation | Minimum | Maximum | Coefficient of Variation |
| low power | 358 | 2400.204 | 2741.791 | 46 | 20232 | 1.142 |
| hospital | 358 | 650.900 | 1138.048 | 0 | 6365 | 1.748 |
| patients served | 358 | 2012.778 | 1248.217 | 281.16 | 9920 | 0.620 |
| hospital beds | 358 | 6.861 | 10.654 | 0 | 83.6 | 1.553 |
| dependency | 358 | 15.315 | 4.164 | 6.44 | 32.29 | 0.272 |
| ageing | 358 | 196.515 | 102.696 | 37.21 | 722.22 | 0.523 |
| housing price | 160 | 1028.074 | 456.170 | 323 | 3276 | 0.444 |
| building | 307 | 168.062 | 24.478 | 105 | 269 | 0.146 |
| disabilities | 358 | 3328.427 | 3500.517 | 122 | 23389 | 1.052 |
| low income | 358 | 404.5894 | 489.6498 | 20 | 3906 | 1.210 |
Table 3.
Estimation of multilevel mixed effects structural equation model on town and city resilience in Taiwan.
Table 3.
Estimation of multilevel mixed effects structural equation model on town and city resilience in Taiwan.
| Variable | Coefficient | Standard Deviation |
| low power | ||
| M1[countycode] | 1 | |
| resilience | 3.783*** | 0.327 |
| constant | 2437.141*** | 278.345 |
| hospital | ||
| M1[countycode] | 0.581*** | 0.083 |
| resilience | 1 | |
| constant | 672.363*** | 150.580 |
| patients served | ||
| M1[countycode] | -0.287*** | 0.077 |
| resilience | -0.662*** | 0.118 |
| constant | 2002.172*** | 94.871 |
| hospital beds | ||
| M1[countycode] | 0.002*** | 0.001 |
| resilience | 0.004*** | 0.001 |
| constant | 6.935*** | 0.738 |
| dependency | ||
| M1[countycode] | 0.001*** | 0.000 |
| resilience | 0.003*** | 0.000 |
| constant | 15.357*** | 0.348 |
| ageing | ||
| M1[countycode] | -0.017*** | 0.006 |
| resilience | -0.068*** | 0.010 |
| constant | 195.887*** | 6.768 |
| housing price | ||
| M1[countycode] | 0.325*** | 0.055 |
| resilience | 0.073** | 0.034 |
| constant | 914.897*** | 82.871 |
| building | ||
| M1[countycode] | -0.012*** | 0.002 |
| resilience | -0.007*** | 0.002 |
| constant | 168.319*** | 3.194 |
| disabilities | ||
| M1[countycode] | 1.859*** | 0.197 |
| resilience | 4.563*** | 0.393 |
| constant | 3397.088*** | 478.776 |
| low income | ||
| M1[countycode] | 0.331*** | 0.047 |
| resilience | 0.402*** | 0.041 |
| constant | 416.805*** | 82.707 |
| Var(M1[countycode]) | 1136491 | |
| Var(resilience) | 360776.9 | |
| Var (e. low power) | 1532138 | |
| Var (e. hospital) | 660546.4 | |
| Var (e. patients served) | 1329641 | |
| Var (e. hospital beds) | 102.792 | |
| Var (e. dependency) | 13.581 | |
| Var (e. ageing) | 8617.395 | |
| Var (e. housing price) | 69221.59 | |
| Var (e. building) | 450.301 | |
| Var (e. disabilities) | 1942738 | |
| Var (e. low income) | 93365.51 | |
| Log likelihood | -22032.252 |
***: p<0.01, **: p<0.05, *: p<0.1.
Disclaimer/Publisher’s Note: The statements, opinions and data contained in all publications are solely those of the individual author(s) and contributor(s) and not of MDPI and/or the editor(s). MDPI and/or the editor(s) disclaim responsibility for any injury to people or property resulting from any ideas, methods, instructions or products referred to in the content. |
© 2024 by the authors. Licensee MDPI, Basel, Switzerland. This article is an open access article distributed under the terms and conditions of the Creative Commons Attribution (CC BY) license (http://creativecommons.org/licenses/by/4.0/).
Copyright: This open access article is published under a Creative Commons CC BY 4.0 license, which permit the free download, distribution, and reuse, provided that the author and preprint are cited in any reuse.


