
Submitted:
13 November 2024
Posted:
14 November 2024
You are already at the latest version
Abstract
Melanoma is an aggressive cancer with increasing incidence and high mortality, driven by chemotherapy resistance and molecular dysregulation. Nanotechnology, specifically silver nanoparticles (AgNPs), shows promise as a treatment due to their ability to cause oxidative stress and apoptosis in cancer cells. However, traditional colloidal AgNPs lack selectivity, causing significant harm to normal cells. In this study, we present a green synthesis of AgNPs using plant extracts, which offers an eco-friendly alternative with a more targeted antitumor effect than traditional colloidal AgNPs. Using label-free DIA/SWATH MS quantitative proteomics, we compared the antitumor effects of AgNPs synthesized via traditional and green methods on A375 melanoma cells at 24 and 48 hours. Green AgNP exposure selectively reduced melanoma cell viability while sparing healthy keratinocytes (HaCaT), unlike Colloidal AgNPs. Proteomic analysis revealed that Green AgNPs exposure significantly decreased a panel of oncogenes and increasing carbohydrate metabolism, and dysregulating copper homeostasis. This is the first study to report the effects of differently synthesized AgNPs on melanoma cells using an integrated proteomic approach. It emphasizes the potential of green AgNPs in cancer therapy at a molecular level.
Keywords:
melanoma
; green chemistry
; silver nanoparticles
; proteomic analysis
; cancer nanomedicine
1. Introduction
Melanoma, a multifactorial disorder, is a significant global health issue due to its rising incidence, aggressive nature, and high costs associated with its prevention, diagnosis, and treatment (1). Its propensity for advanced metastasis and chemotherapy resistance contributes to high mortality rates (2). At the molecular level, dysregulation of intracellular signaling pathways, driven by autocrine growth factor secretion, mutations in regulatory genes, and loss of adhesion receptors, plays a critical role in melanoma progression (3). In light of this, the need for therapeutic tools based on a deeper understanding of melanoma pathology has led researchers to explore innovative nanotechnology solutions for this pressing public health issue (4,5). Malignant melanoma, the most lethal form of skin cancer, shows resistance to drug-induced apoptosis (6). Nanotechnology provides various tools to treat cancer, particularly with metal nanoparticles (NPs) (7). Among these, silver nanoparticles (AgNPs) are notable for inducing toxicity in cancer cells by altering cellular morphology, reducing cell viability, and causing oxidative stress (8, 9).
Although numerous physical and chemical synthesis methods for AgNPs are discussed in the literature (10,11, 12, 13), bio-mediated synthesis has gained attention due to the demand for eco-friendly ("green") technologies (14, 15, 16). Green synthesis methods use polyphenols from leaf extracts as reducing and stabilizing agents for metallic ions like silver, avoiding toxic and time-consuming approaches. These methods typically produce nanoparticles ranging from 10 to 100 nm (17), which is crucial for anti-tumor therapy. The cytotoxic effects of AgNPs on cancer cells include generating reactive oxygen species (ROS), cell cycle disruption, and genotoxic impacts, leading to inflammation, apoptosis, and cell death (13, 18,19,20). Additionally, specific protein expression can be altered (21, 22).
In addition, here, we present a comprehensive label free data independent acquisition (DIA)/SWATH quantitative proteomics analysis for determining the global proteomic changes in the human A375 melanoma cell line upon exposure to AgNPs synthesized via conventional and green routes at two time points (24 and 48 hours). Prior to cell experiments, AgNPs were fully characterized by Transmission Electron Microscopy (TEM), Dynamic Light Scattering (DLS), and zeta potential. Raman Spectroscopy was used to assess the organic vibration on the surface. This study seeks to unveil the precise proteins and cellular networks influenced by AgNPs treatments, highlighting key shifts in the proteomic landscape of human melanoma cells. By utilizing eco-friendly silver nanoparticles (AgNPs) derived from *Laurus nobilis* leaf extract and colloidal AgNPs, the research aims to reveal pivotal molecular alterations with potential therapeutic implications.
Our results indicate that AgNPs exposure impairs gene activity, decreasing cell viability in cancer cells while preserving healthy HaCaT keratinocytes. Proteomic changes consistent with the activation or depletion of key pathways were observed. Notably, the significant proteins altered in response to AgNPs were associated with the cell cycle, cell morphology, cellular function, endoplasmic reticulum stress, oxidative stress, and mitochondrial dysfunction, leading to cell death through apoptosis and/or autophagy activation. More specifically, the treatment with green AgNPs induces dysregulation of key proteins associated with critical biological pathways, reflecting in the inhibition of oncogene expression, modulation of carbohydrate metabolism, and disruption of copper homeostasis. To our knowledge, this is the first study to report the effects of differently synthesized AgNPs on melanoma cells using an integrated DIA/SWATH MS quantitative proteomic approach.2. Materials and Methods
The Materials and Methods should be described with sufficient details to allow others to replicate and build on the published results. Please note that the publication of your manuscript implicates that you must make all materials, data, computer code, and protocols associated with the publication available to readers. Please disclose at the submission stage any restrictions on the availability of materials or information. New methods and protocols should be described in detail while well-established methods can be briefly described and appropriately cited.
Research manuscripts reporting large datasets that are deposited in a publicly available database should specify where the data have been deposited and provide the relevant accession numbers. If the accession numbers have not yet been obtained at the time of submission, please state that they will be provided during review. They must be provided prior to publication.
Interventionary studies involving animals or humans, and other studies that require ethical approval, must list the authority that provided approval and the corresponding ethical approval code.
2. Materials and Methods
2.1. Synthesis of AgNPs
AgNPs were synthesized using an eco-friendly approach outlined in (23). Leaves of Laurus Nobilis were gathered, cleansed with MilliQ water to eliminate impurities, and air-dried at ambient temperature for 24 hours. Subsequently, 10 grams of these leaves were immersed in a glass flask containing 100 mL of MilliQ water (in a 1:10 ratio) and boiled at 100 °C for 20 minutes. After cooling, the extract was filtered to prepare it for nanoparticle synthesis. 5 mL of the purified extract was added to a solution containing AgNO3 dissolved in MilliQ water. The mixture was stirred at 400 rpm for 1 hour at room temperature until the color of the solution turns from yellow to brown. Upon this color change, the solution underwent centrifugation at 4000 rpm for 1 hour to gather the nanoparticles in the pellet, which were then purified with MilliQ water through three cycles of centrifugation at 13000 rpm.
2.2. Nanoparticles Characterization
The shape and spread of the magnetic nanoparticles (MNPs) were analyzed using a JEOL JEM-1011 transmission electron microscope (TEM) running at 100 kV. To prepare the nanoparticles, a few microliters of the nanoparticle solution were dropped onto a copper grid coated with formvar. The images of the free MNPs presented were taken with grids that were prepared immediately after the synthesis process, using a few microliters of highly concentrated final suspensions diluted in an appropriate buffer or water, depending on the surface coating. For DLS and ζ-potential measurements of AgNPs in aqueous solutions (at 25 °C and pH 7), a Zetasizer Nano-ZS equipped with a HeNe laser (633 nm, 4.0 mW) and a detector (ZEN3600, Malvern Instruments Ltd., Malvern, UK) was employed.
UV-vis analysis spanning the spectral range of 300÷800 nm was conducted at room temperature using a Varian Cary 5 spectrophotometer (ZEN3600, Malvern Instruments Ltd., Malvern, UK) equipped with a quartz cuvette having a 10 mm path length.
The Raman spectra of Ag-NPs and Green Ag-NPs were obtained using a MicroRaman Xplora (Horiba) with a laser source at 532 nm.
2.3. Determination of AgNPs Concentration
The concentrations of colloidal AgNPs and green AgNPs were determined through elemental analyses employing ICP-OES Perkin Elmer AVIO 500. In this process, 150 μL of the NP solutions were digested overnight by adding 1.5 mL of HNO3, followed by dilution with MilliQ water (at a 1:10 ratio). The resulting concentration of colloidal AgNPs was found to be 1.5 mM, while that of green AgNPs was 741 μM.
2.4. Cell Culture
Human melanoma cells (A375) and human epidermal keratinocyte line (HaCaT) were maintained in Dulbecco’s Modified Eagle Medium (DMEM) (Sigma-Aldrich, Dorset, UK) enriched with 2mM glutamine, penicillin/streptomycin (Sigma-Aldrich, Dorset, UK) and 15 % of Fetal Bovine Serum (FBS) (Sigma-Aldrich, Dorset, UK). Cells have been grown in a humidified controlled atmosphere with a 95 to 5% ratio of air/CO2, at 37 °C. Cells were grown to 97% confluence prior to treatment with nanoparticles.
A375 and HaCaT cells were seeded starting from a 97% of confluence, with 5.27 × 10⁵ cells for 1ml, thus having in 7 ml an initial number of cells of 3.689.000 counted at T20 Automated cell counter (Bio-Rad, USA).
In each well, we seeded 400 µL of cells + 1,6 mL DMEM, thus having 1.85 × 10⁶ cells at a concentration of 5 × 10³ cells per well in 6-well plates and stabilized in humidified controlled atmosphere with a 95 to 5% ratio of air/CO2, at 37 °C for 24 hours.
Subsequently, green AgNPs (C= 3 µM) and colloidal AgNPs (C= 3 µM) were resuspended in cell media (DMEM), and aliquoted into each well for the nanoparticle treatment.
2.5. Cell Viability Assessment
A375 and HaCaT were seeded at a concentration of 5 × 10³ cells per well in 96-well plates and stabilized in humidified controlled atmosphere with a 95 to 5% ratio of air/CO2, at 37 °C for 24 hours. Subsequently, green and colloidal AgNPs at three different concentrations (1 µM, 3 and 5 µM) were added to cell media. After incubation times of 24 and 48 h, standard WST-8 assay (96992, Sigma Aldrich, Dorset, UK) was used. WST-8 is one of water-soluble tetrazolium salts (WST) [2-(2-methoxy-4-nitrophenyl)- 3-(4-nitrophenyl)-5-(2,4-disulfophenyl)-2H-tetrazolium. The control tests were performed o cells incubated with equivalent volumes grown solution of 10% (v/v) dimethyl sulfoxide (DMSO, Sigma-Aldrich, Dorset, UK) in Dulbecco's phosphate-buffered saline (DPBS). Samples was measured by using a Fluo Star Optima (BMG LABTECH) microplate reader at a wavelength of 460 nm. Data were collected by Control Software and elaborated with MARS Data Analysis Software (BMG LABTECH). The data, obtained on 8 different viability experiments, were expressed as mean ± SD.
2.6. Sample Preparation for Mass Spectrometry
Human melanoma cells (A375) and human epidermal keratinocyte line (HaCaT) were grown as described in materials and methods chapter 2.4. Label free data independent acquisition (DIA) quantitative proteomics method was employed to study the proteotype changes triggered by AgNPs. A375 melanoma cancer cells were exposed to 3 μM colloidal and green AgNPs for 24 and 48 hours, subsequently, their impact on the differential regulation of proteins was studied. Control samples (WT cells) consisted of A375 melanoma cells in DMEM medium with no nanoparticle treatment. All the timepoints and treatments, beside control samples, were prepared in three discrete wells in six well cell culture plate (SARSTEDT, DE) grown up to 97% cell confluency yielding three biological repetitions. Next, cultured cells were three times washed on cell culture plate with PBS (phosphate buffered saline) and scraped into the lysis buffer consisting 8 M Urea in 0.1 M Tris/HCl, pH 8.5 (Urea buffer). Samples were then two times snap frozen in liquid nitrogen, 5 min sonicated in the sonication bath (ELMA, CH) and left on ice for 30 min. Protein lysates were cleared by centrifugation at 30 min/ 14000 g at 8°C. Clean supernatants were transferred into the clean low binding tubes. The protein concentration in the sample has been determined by BCA protein assay according to manufacturer’s recommendations (Thermo, MA, USA). Approximately 50 µg of protein from each sample was taken for digestion using a modified Filter-aided sample preparation protocol (FASP) (24).
Microcon 10 kDa cut-off filter units (Millipore, USA) were used for tryptic digestion. Briefly, 200 μl of Urea buffer and a volume of lysate corresponding to 50 μg of protein were added to the filter unit. Filter units were centrifuged at 17 000 x g at 20°C for 30 min. For protein reduction, 100 μl of Urea buffer and 20 μl of 100 mM Tris (2-carboxyethyl) phosphine hydrochloride (Sigma-Aldrich, MO, USA) was added to the filter unit, and incubated for 30 min on a thermoblock set at 37°C/ 600 rpm. The filter unit was then centrifuged at 17 000 g for 20 min. Protein alkylation, was initiated by adding 20 μl of 300 mM iodoacetamide (Sigma-Aldrich,MO, USA) in 100 μl of Urea buffer and incubated in the darkness for 20 min at room temperature followed by centrifugation at 17 000 g for 20 min. Next, filter units were washed three times with 100 μl of 100 mM NH4HCO3, proceeding by centrifugation at 17 000 g for 30 min, the step was repeated three times in total. After changing collection tubes, 100 μl of 50mM NH4HCO3 and 1.5 μl of 0.5 μg/ μl trypsin solution in ddH2O (Promega, WI, USA), were added for the overnight digestion at 37°C. Tryptic peptides were next day collected by centrifugation at 17 000 g for 15 min. Filter units were washed with additional 50 μl of 0.5 M NaCl in LC-MS water, through spin down at 17 000 g/ 15 min.
Then, the peptide desalting on MicroSpin C18 columns (Harvard Apparatus, MA, USA) was performed via a modified protocol by Bouchal et al. (25). The presence of excessive salts interferes with peptide ionization and contributes to the compromised mass spectrometry analysis. Briefly, MicroSpin C18 columns (Harvard Apparatus, MA, USA) were twice conditioned with 200 μl of acetonitrile (ACN) + 0.1% formic acid (FA) while trying to avoid any bubbles formation on the frit surface, and subsequent spinning down at 200 rpm/ 2 min. The step was repeated 2 more times. Next, column equilibration required 200 μl of ddH2O + 0.1% FA followed by a centrifugation step at 300 rpm/ 2 min. The step was repeated two times in total. The C18 slurry was then hydrated by adding 200 μl of ddH2O + 0.1% FA, leaving it hydrating for 15 min followed by centrifugation at 300 rpm/ 2 min. Tryptic peptides were then transferred onto the activated C18 column, and centrifuged at 500 rpm/ 2 min. Following desalting was repeated 3 times in total by adding 200 μl of ddH2O + 0.1% FA followed by a centrifugation at 500 rpm/ 2 min. Afterwards, C18 columns were transferred to a new low binding collection tubes, and peptides were first eluted by 200 μl of 50% ACN + 0.1% FA followed by a centrifugation at 500 rpm/ 2 min. Next, elution steps were done two times by adding 200 μl of 80% ACN + 0.1% FA each time followed by centrifugation at 500 rpm/ 2 min. Desalted peptide eluates were dried by vacuum centrifugation for 3 hours at 30°C in a speedvac concentrator (Eppendorf, DE). Dry samples were stored at -80°C until the LC-MS analysis.
2.7. Liquid Chromatography-Mass Spectrometry (LC-MS/MS) Analysis
Liquid chromatography and mass spectrometry was performed inspired by a method as described in our previous publication (26). Briefly, samples were dissolved in 50 μl of 0.08% trifluoroacetic acid (TFA), 2.5% ACN in LC-MS water and approximately 1 μg of peptides were loaded into the fluidic system of liquid chromatograph UltiMate™ 3000 RSLC nano System (Thermo Scientific, MA, USA). Identical liquid chromatography conditions were used for both data dependent (DDA) and data independent (DIA) acquisition. Peptides were trapped on Acclaim PepMap 100, 5 µm particle size, 1 mm inner diameter, 5 mm length C18 pre-column (cat. no: 16045, Thermo Scientific, MA, USA). Loading pump flow was kept at 5 µl.min-1 with an isocratic mobile phase composition of 0.08% TFA, 2.5% ACN in LC-MS water. Analytical peptide separation was done on an analytical PepMap™ 100, 2 µm particle size, 1 mm inner diameter, 5 mm length C18 analytical column (cat.no:164534,Thermo Scientific, MA, USA). Peptides were separated by a linear gradient of 0.1% FA in ACN (v/v) (B) and 0.1% FA in water (v/v) (A). Analytical peptide separation has been started at 2.5% B followed by increasing its proportion up to 40% B in A over 90 min. A column flush at 95% B was performed over next 8 min, and finally 8 min were left for column equilibration at 2.5% B. Nano-electrospray was used to ionize the peptides, followed by their introduction into the Orbitrap Exploris™ 480 mass spectrometer (Thermo Scientific, MA, USA).
One technical replicate was acquired by a DDA method. The resolution for full scan operated in a profile mode was set to 120,000. Full scan scanned through a mass range spanning from m/z 350 Th up to m/z 1200 Th. Normalized AGC target was set to 300% with auto setting on maximum injection time. MS/MS scans were performed on the top 15 most intense precursor ions selected from the full scan. Once fragmented precursor ions were excluded for 20 sec with precursor exclusion mass tolerance set to 10 ppm. Minimum precursors with ion intensity below 5.0e3, and precursors outside of charge states range of +2 to +6 were suspended from the experiment. The precursor isolation window width was 2 Th. The collision energy was set to 30% and normalized collision energy type was selected. The MS/MS scan was operated in a centroid mode and the resolution was set to 120,000. Standard setting for normalized AGC target and 40 msec maximum injection time was set.
2.8. Data Independent Acquisition
Two technical replicates of each biological replicate were measured. DIA acquisition was accompanied by a full scan at 60,000 resolution and a mass range from m/z 350 Th up to m/z 1450 Th was considered. The normalized AGC target was set to 300% and maximum injection time was 100 msec. DIA method cycled in a precursor mass range spanning from m/z 350 Th up to m/z 1100 Th which was divided into 12 Th wide windows with 1 Th overlap. Therefore, a single DIA cycle consisted of 62 MS/MS scans. For each MS/MS scan a normalized collision energy type with collision energy set to 30% was set. Orbitrap resolution was set to 30,000. Normalized AGC target was set to 1000% with automatic setting on the maximum injection time parameter. Data type was profile.
2.9. Proteomics Data Analysis
Applying quantitative proteomics and data-independent acquisition (DIA) methodology enables the evaluation of the proteome landscape after different types of AgNPs treatments on melanoma cancer cells in different timepoints. Quantitative analysis is an essential aspect of biomarker discovery, and therefore we have performed a comparative bioinformatic evaluation of proteomic landscapes upon the colloidal and green AgNPs at 24 and 48 hour timepoint treatments as described below.
2.10. Spectral Library Generation and DIA Data Extraction
A MaxQuant search engine was implemented to search raw unprocessed DDA files. Homo sapiens SwissProt+UniProt search database (06_2023) and a reverse decoy database harboring equal amount of decoy sequences and common contaminant protein sequences was used to perform database search. Enzyme digestion was set to trypsin with allowance of two missed cleavages. Carbamidomethylation of cysteine was considered as a fixed modification. List of variable modifications harbored methionine oxidation, protein N-term acetylation. Other processing settings were left default. MaxQuant output files (MSMS file) were further used in Skyline-daily (64-bit, 20.1.9.234) software which transformed them into a spectral library .blib file. The “Score Threshold” was left default at 0.05 MaxQuant PEPscore. The FASTA file used for search was set for Skyline target generation background proteome. Peptides from .blib file were associated to proteins in Skyline target panel. Protein intensity extraction was performed in Skyline-daily (64-bit, 20.1.9.234) with identical settings as described in Faktor et al (26). Briefly, zero missed cleavages were allowed in Peptide settings tab. Maximum peptide length was set from 2 to 60 aminoacids and modified peptides were suspended from experiment. The precursor ion in a charge state from +1, to +5 and y and b product ions with +1 and +2 charges were included in the experiment. Product ion higher than the ion 4 up to the last product ion in series were included in the experiment. Ion match tolerance was set to 0.05 m/z. Peptides defined by at least 4 product ions were kept in the experiment, while up to 6 most intense product ions were selected for precursors where more product ions were available. DIA isolation scheme was auto-imported from raw DIA file. Orbitrap resolution was set to 30,000 at 200 m/z. Reversed decoy sequences were created from target sequences which were subsequently used for training mProphet peak scoring model.
2.11. Statistical Analysis of Skyline Extracted DIA Data
R (version 4.0.0) package MSstats 4.0.1. was used for statistical analysis of extracted intensities. mProphet q-value threshold was set to qvalue < 0.01. After summing the transition intensities the resulting peptide intensities were log2 transformed and quantile normalized. Protein quantitation was performed pairwise via mixed-effect models implemented in MSstats groupComparison function. T-test p-values were Benjamini Hochberg adjusted. Full protein comparison matrix is available in dataset as described in data availability section.
2.12. Data Visualization
Data were preprocessed using Python 3.9 and RStudio 2023.06.01. Volcano plots were generated in EnhancedVolcano 1.10.0. Inkcape 1.2 was used to process the graphics to final figures and to generate svg images.
3. Results
The synthesis of metal nanoparticles, including silver ones, through green chemistry starting from plant extracts represents an innovative and eco-friendly strategy compared to conventional colloidal synthesis techniques, thus emerging as a valid alternative for the design of promising nanomaterials appliable in nanomedicine (27,28,29). Based on this, we used laurel leaves as green raw starting material in our eco-friendly approach. Within this method, natural polyphenols that are present in the extract enables the production of stable AgNPs in an aqueous solution, thereby eliminating the need for conventional toxic capping or reducing agents. Both the adopted synthesis procedures, the traditional colloidal and the green ones, proved to be reproducible, leading to highly concentrated nanoparticle solutions, consistent with findings outlined in prior research (30, 31). AgNPs obtained from the two synthetic routes have been extensively characterized, from a physical and chemical point of view, using Transmission Electron Microscopy (TEM), Dynamic Light Scattering (DLS), Z-potential analysis, Inductively Coupled Plasma Atomic Emission Spectroscopy (ICP-AES), UV-Vis Absorption Spectroscopy, and Raman Spectroscopy.
The morphology and size of the two types of AgNPs were analyzed by TEM. In particular, colloidal AgNPs had a size of 20 ± 3 nm, whereas the green AgNPs were bigger showing a diameter of 35 ± 7 nm. Shape was nearly comparable between the AgNPs derived from the two synthesis approaches, confirming an almost spherical morphology, albeit more defined in the case of colloidal AgNPs. Overall, these nanostructures appeared to be generally monodispersed, and slightly tending to aggregate into small clusters.
Figure 1.
Representative TEM images of colloidal AgNPs and green AgNPs . Scale bar was 200 nm.
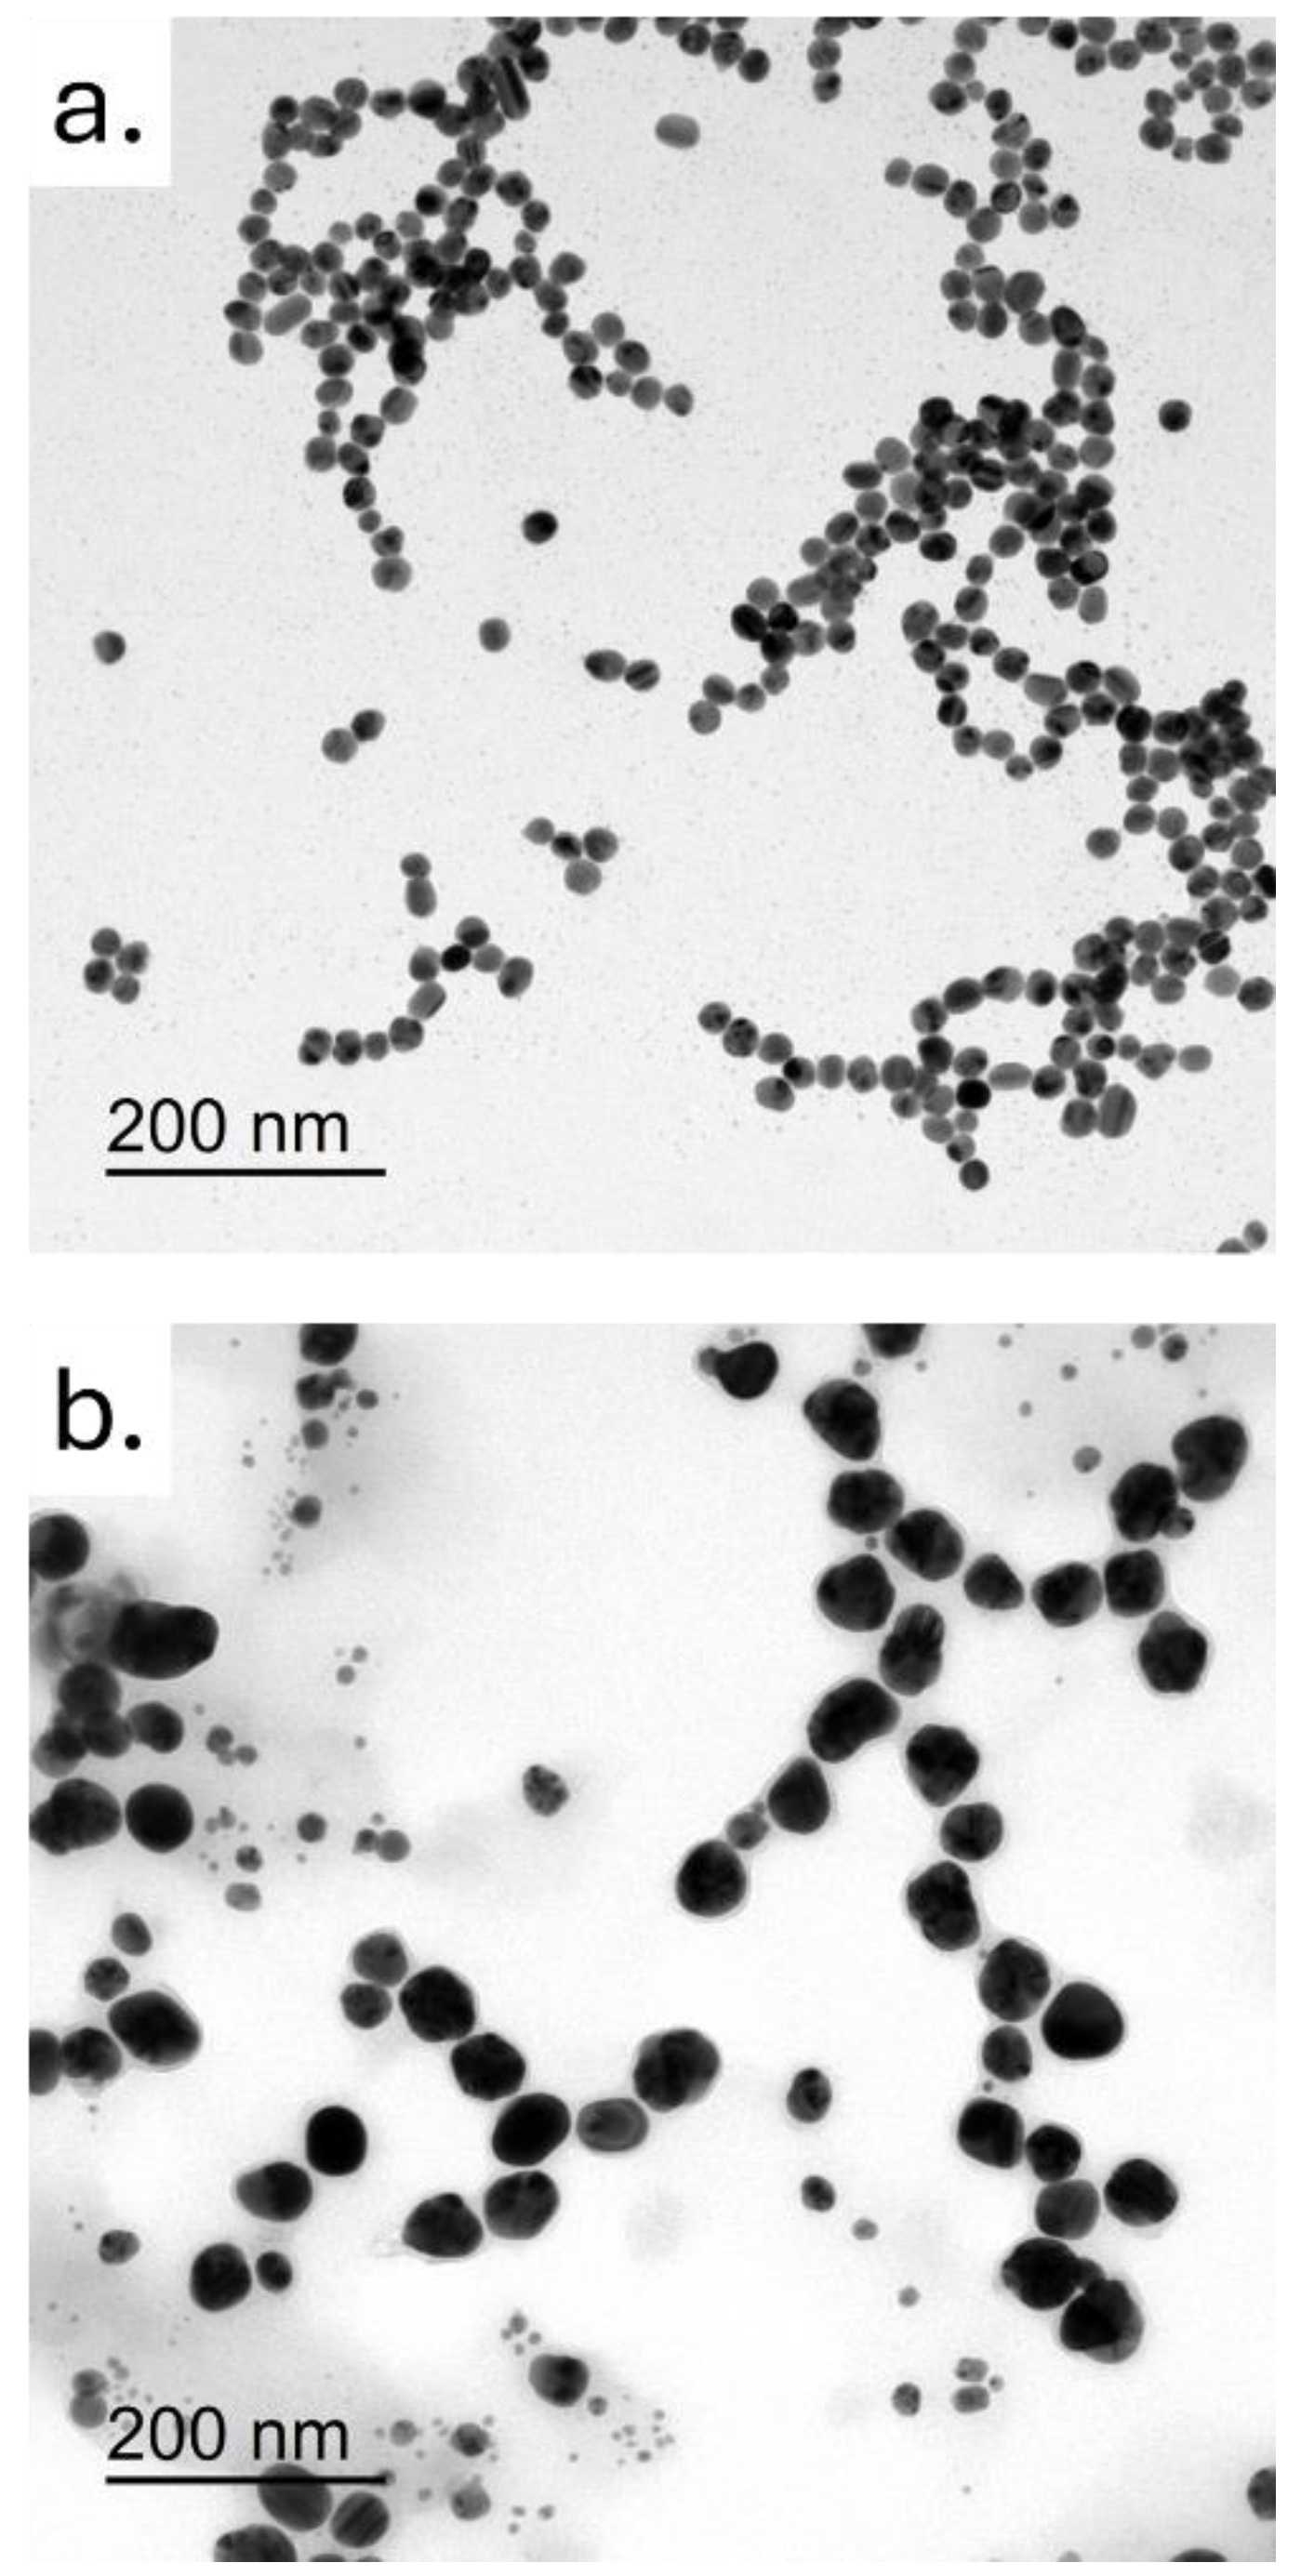
Their size was further confirmed through DLS analysis. DLS measurements conducted in water provided evidence of compatibility between the measured hydrodynamic radius of the AgNPs and the average size values detected in the TEM acquisitions. In particular, the hydrodynamic radius recorded for the green and colloidal AgNPs is respectively (36 ± 8) nm and (21 ± 3) nm. These measurements align closely with the TEM analysis. To evaluate the stability of AgNPs in cell culture medium, DLS measurements were performed in DMEM. The peculiar formation of protein corona on the NP surface led to an enhanced size value of (38 ± 7) nm for green AgNPs and (28 ± 3) for the colloidal ones (Table 1).
Moreover, assuming the dual functionality of polyphenols extracted from plants as both natural reducing and capping agents, the surface charge was found to be negative (-30 ± 6) mV and (-23 ±2) mV) for green and colloidal AgNPs respectively. Furthermore, the ζ-potential underwent a change due to the significant presence of serum proteins on the surface, becoming more negative (-41 ± 6 mV) and (-32 ±5). Additionally, an observed shift in the ζ-potential was noted, likely attributed to the substantial abundance of serum proteins on the surface, resulting in a more negative charge of (-41 ± 6 mV) (Table 1).
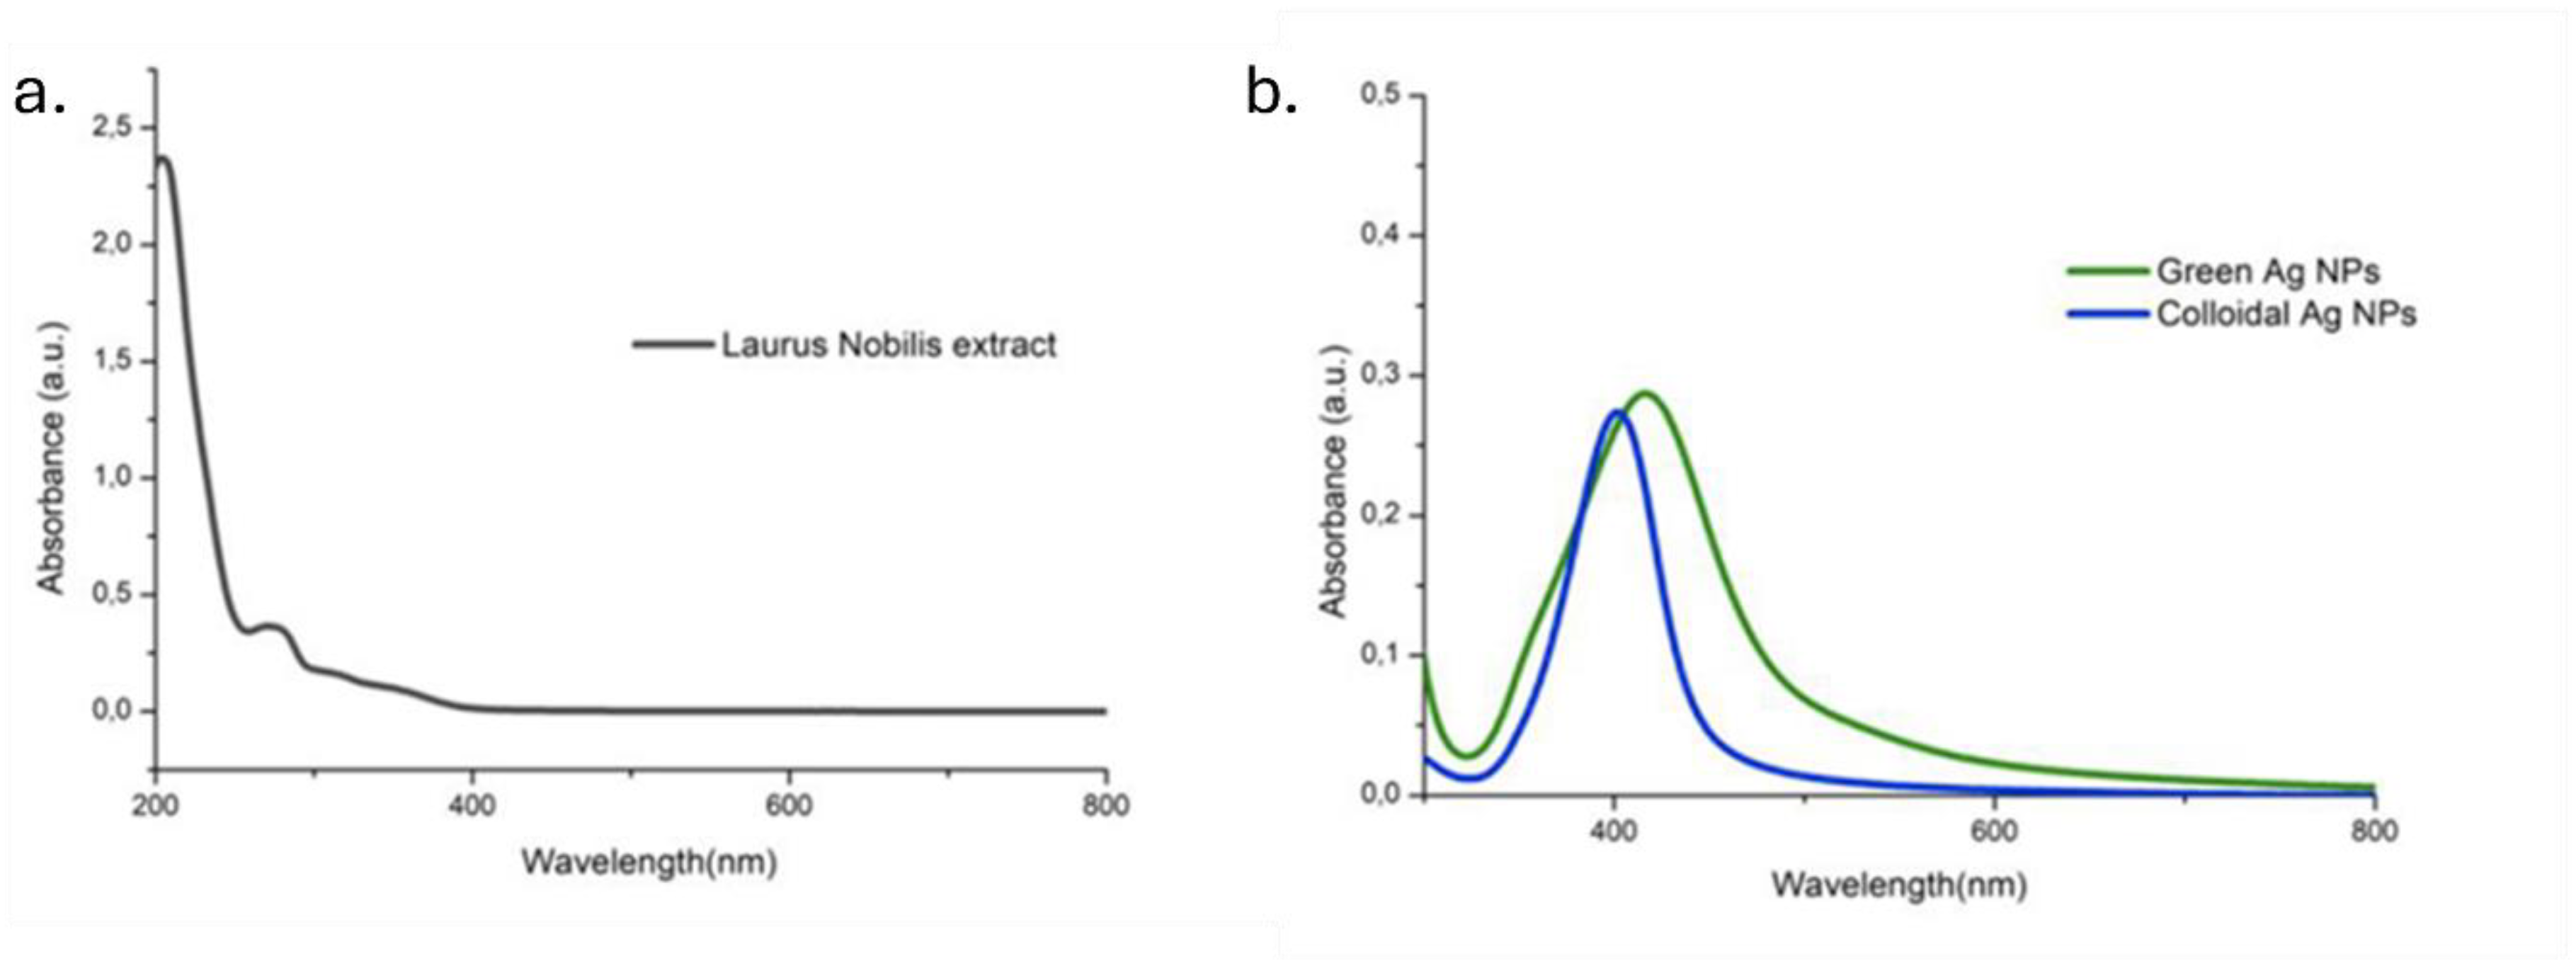
The UV-Vis absorption spectra of NPs were recorded in the range of 300-800 nm and compared with the spectrum of the corresponding Laurus Nobilis leaf extract (Figure 2). The analysis was conducted using the leaf extract, revealing the presence of a peak in the UV region at around 280 nm, likely stemming from the presence of aromatic compounds. Within the wavelength range of 300-800 nm, no absorption signal was detected. The spectrum of AgNPs obtained through the green approach showed a slightly broader peak compared to the peak of colloidal AgNPs, which instead was perfectly centered at 400 nm (typical value of absorption for spherical silver NPs).
Figure 2.
UV-Vis spectra of the samples: (a) Laurus Nobilis extract; (b) green AgNPs and colloidal AgNPs.
Figure 2.
UV-Vis spectra of the samples: (a) Laurus Nobilis extract; (b) green AgNPs and colloidal AgNPs.
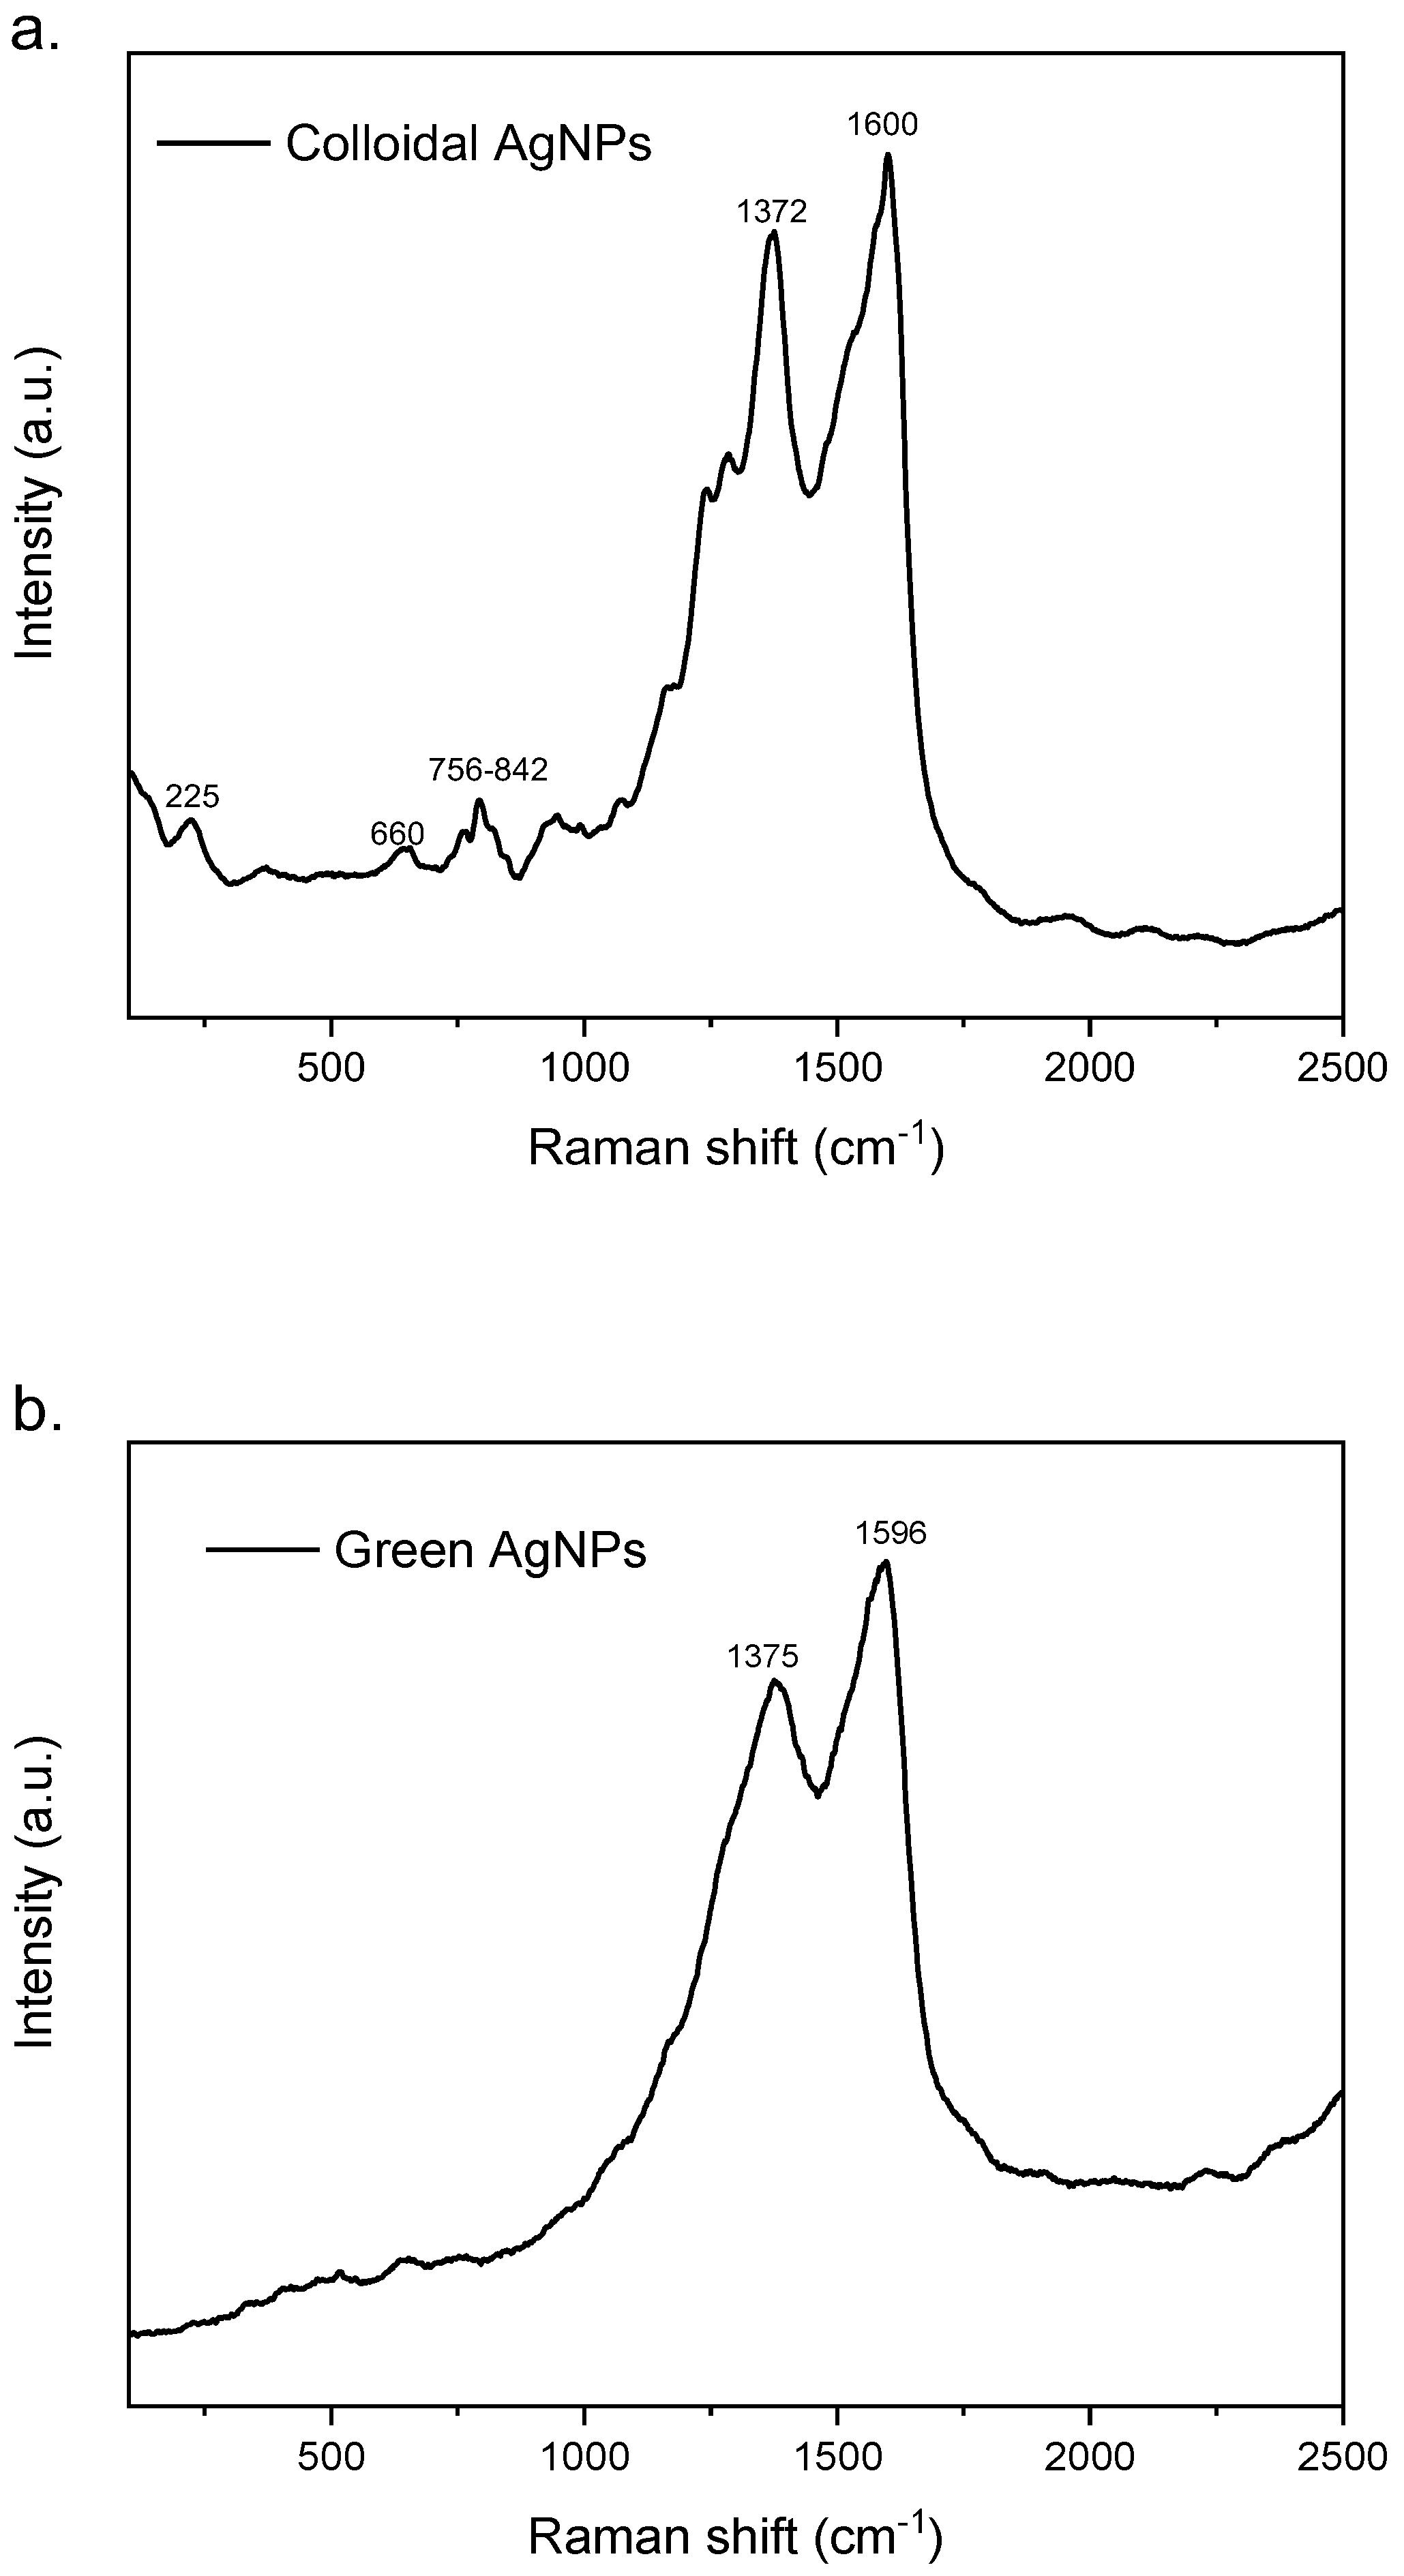
The Raman spectrum of colloidal AgNPs (Figure 3a) shows several weak and shouldered signals ascribed to citrate used as reducing agent in nanoparticles synthesis. The weak band at 225 cm−1 could be assigned to Ag–O stretching mode which indicates the formation of a chemical bond between silver and carboxylate groups of citrate molecules (32). The low and widen signal at about 660 cm-1 and the bands between 756-842 cm-1 could be assigned to COO bending mode, while the shoulder at 1575 cm-1 could instead be ascribed to symmetric stretching vibrations of COO (33). The intense and sharp signals at 1372 and 1600 cm-1 could be attributed to vibrational mode of C=O (34). On the contrary, the Raman spectrum of green AgNPs (Figure 3b) showed only two intense and broad peaks at about 1375 and 1596 cm-1 due to overlapping of different bands that could be attributed to vibrational mode of C=O, to symmetric stretching vibrations of COO− and C–C stretching vibrations of aromatic ring (34,32) present in the molecular structure of polyphenols.
Figure 3.
Raman spectra of colloidal AgNPs (a) and green AgNPs (b).
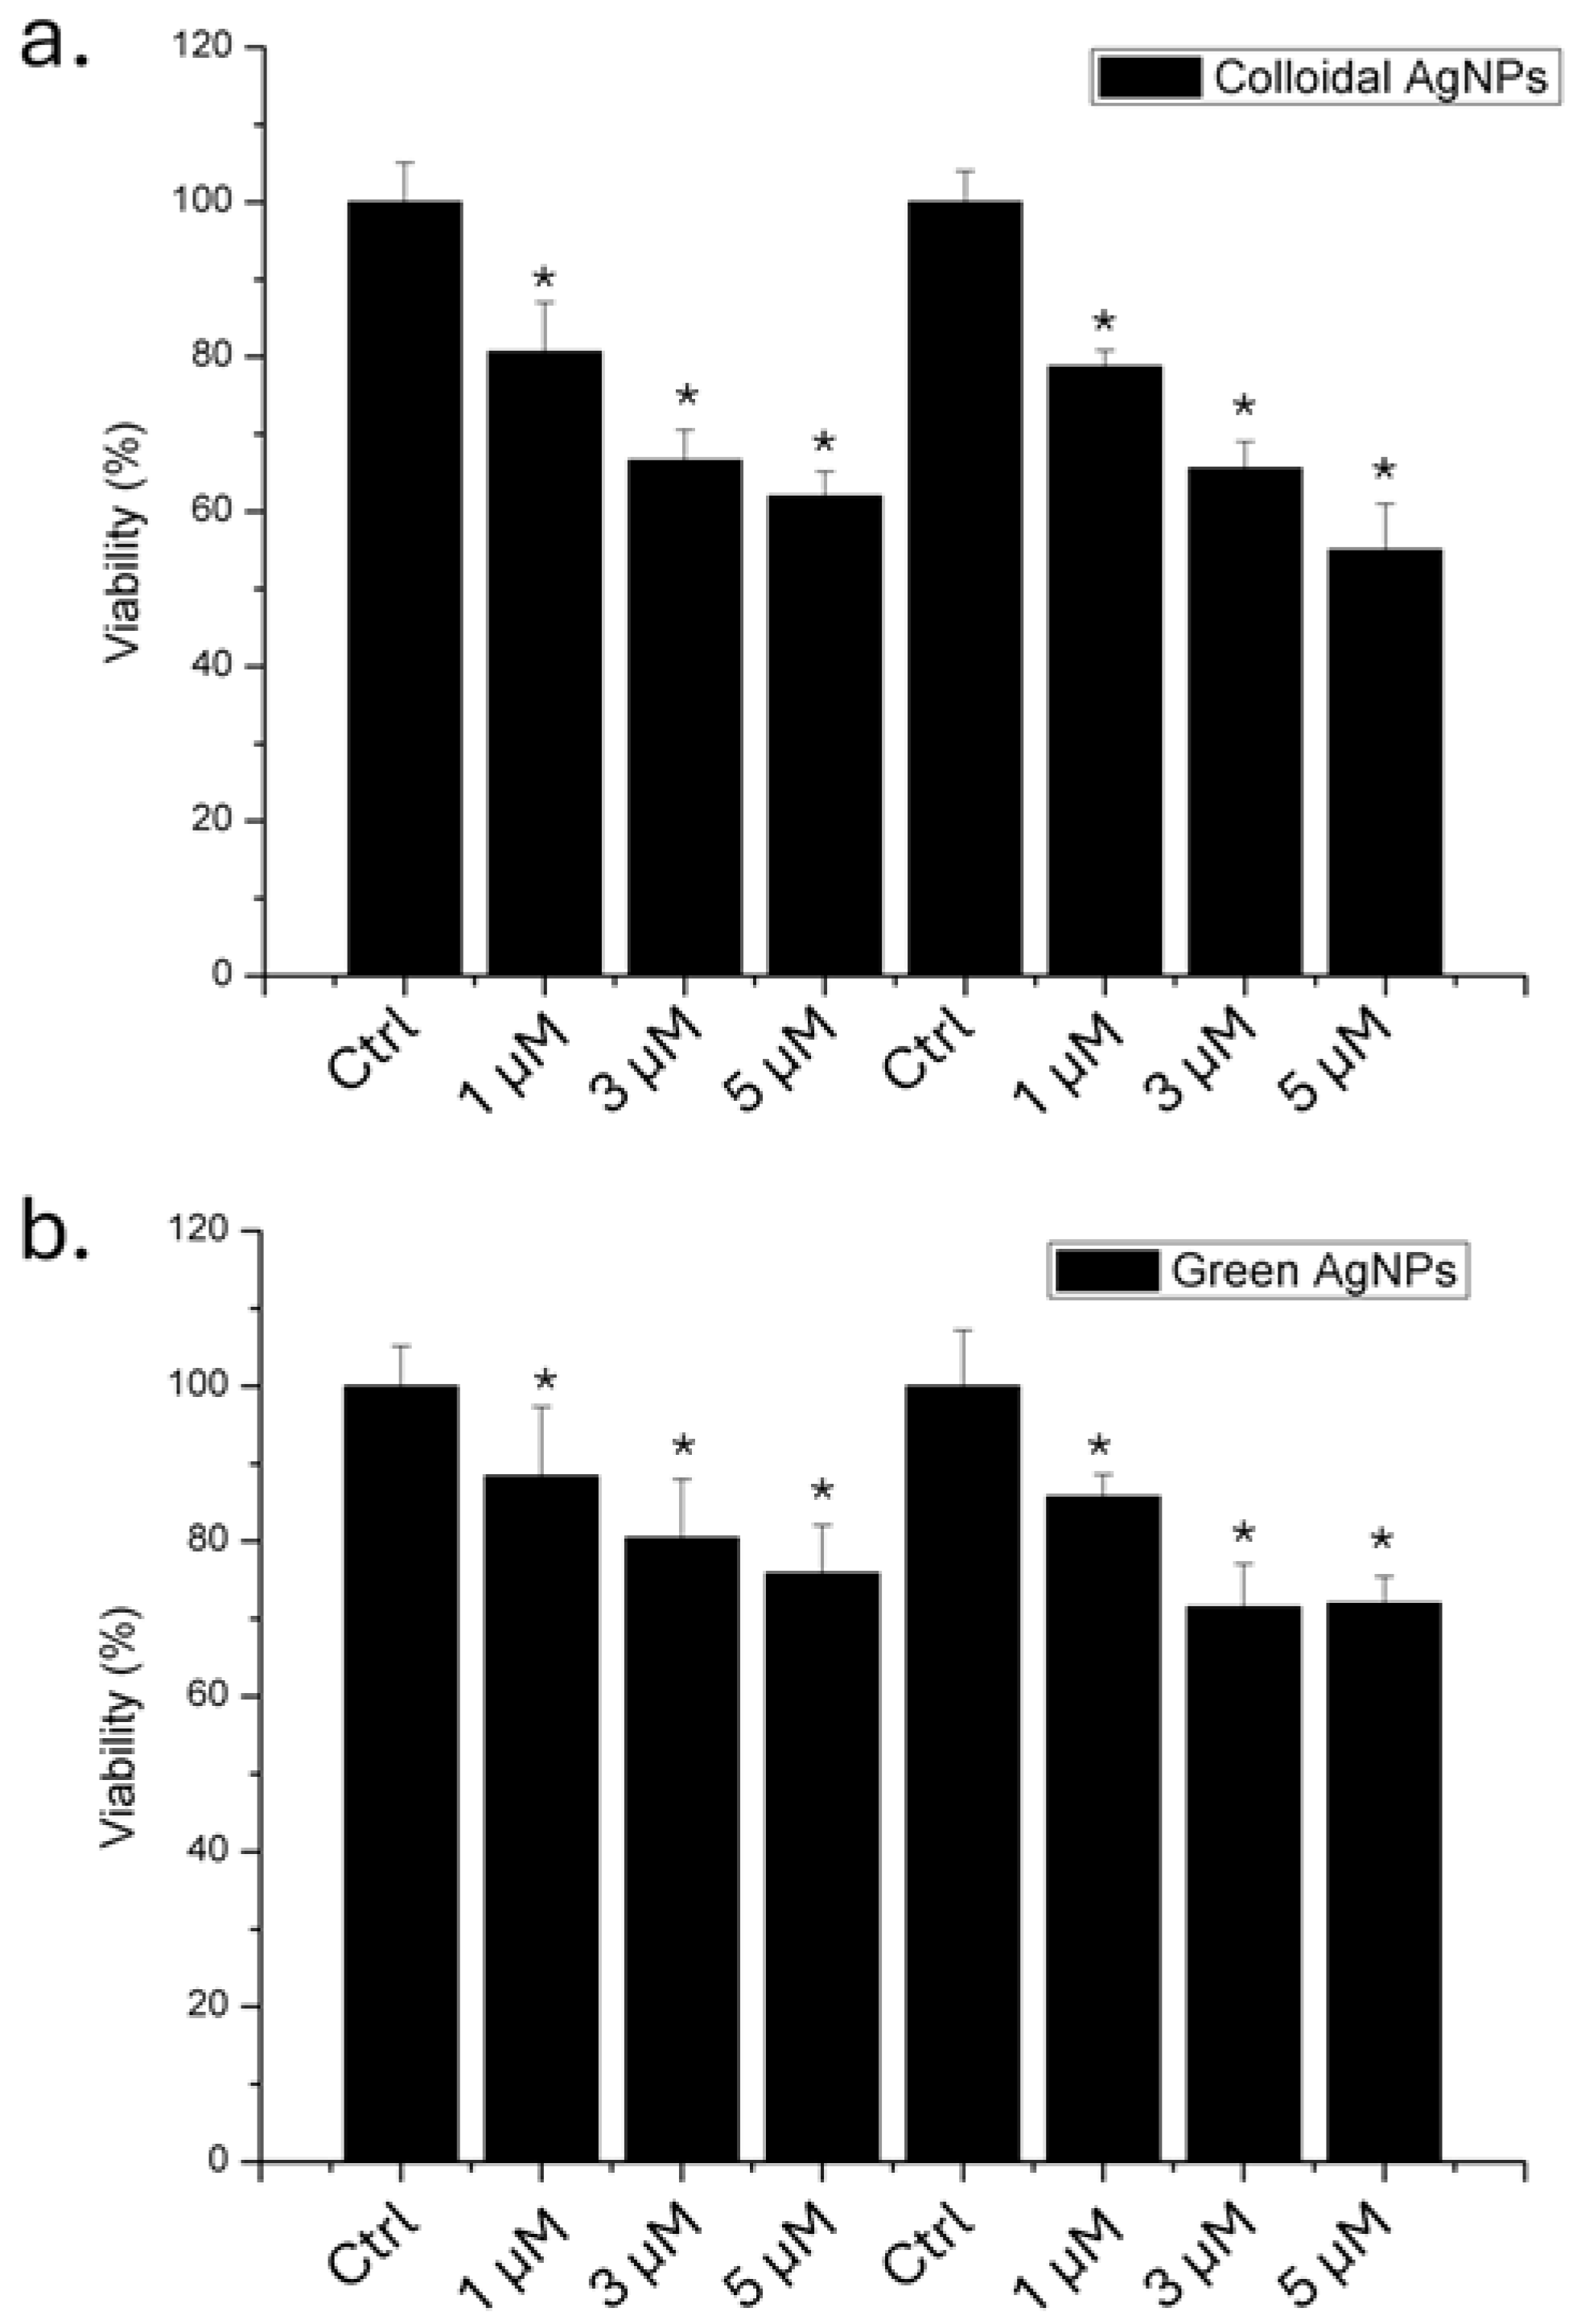
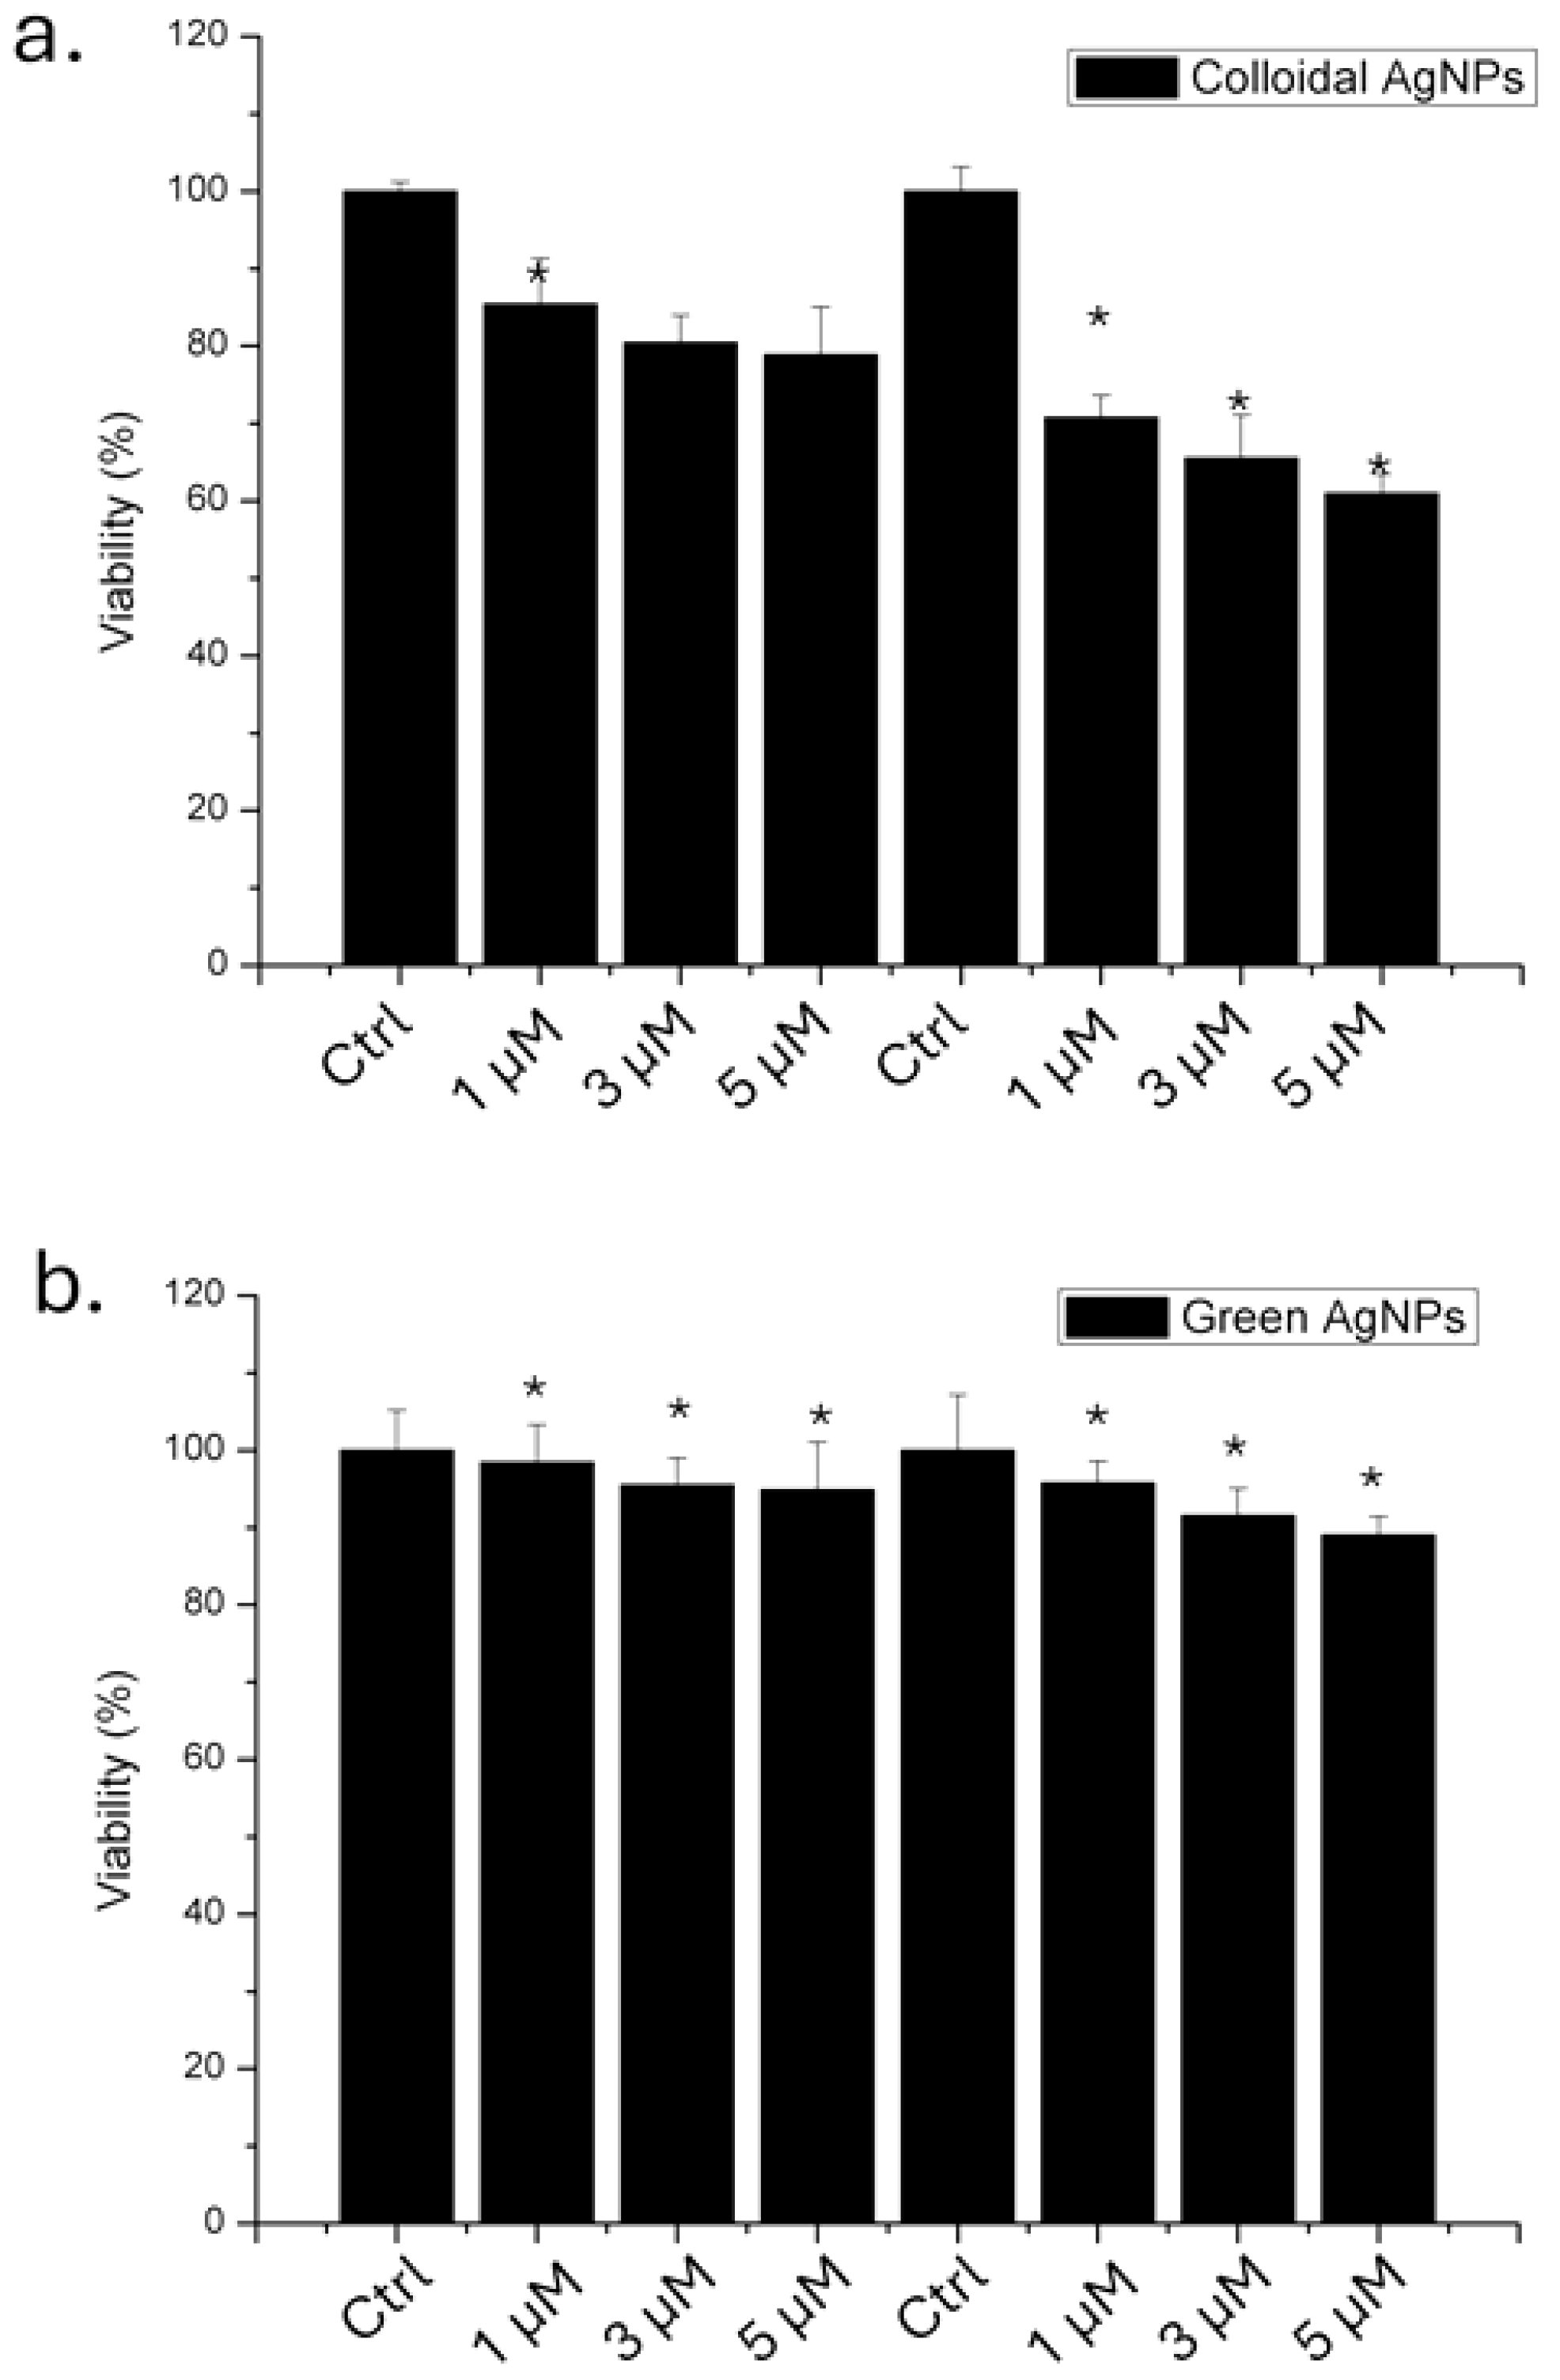
Following the physico-chemical characterization of the both types of AgNPs, we evaluated their impact on A375 cells in terms of viability using 1, 3 and 5 µM of AgNPs, for 24 and 48 hours. The results obtained through WST-8 assay (Figure 4) showed that the colloidal AgNPs were more toxic than green AgNPs. In particular, we demonstrated that after 48 hours using the higher concentration, 53 % of the cells remained viable. In contrast, when the cells were treated with green AgNPs, 78% of the cells were vital. Then, the anticancer effect was visible for both type of NPs, even if the effect was stronger for colloidal AgNPs in a time and concentration dependent manner.
Figure 4.
Viability assay (WST-8) of A375 cell lines exposed to 1 µM, 3 µM and 5 µM of colloidal (a) and green (b) AgNPs. The viability of NP-treated cells was normalized to non-treated control cells. As a positive control (P), the cells were incubated with 5% DMSO (data not shown). Data reported as the mean ± SD from three independent experiments are considered statistically significant, compared with the control (n = 8) for p value < 0.05 (<0.05 *).
In order to verify the impact in healthy cell lines, we performed viability assay also on HaCaT cells that can be considered the non tumoral counterpart of melanoma cells (Figure 5).
The results demonstrated that green AgNPs did not induce a significant reduction in viability compared to colloidal AgNPs. In particular, colloidal AgNPs at a concentration of 5 µM induced a 40% reduction in cell viability after 48 hours. Conversely, cells exposed to green AgNPs at the same concentration remained 88% viable. This finding is important in the context of using this type of AgNPs as an antitumor agent.
Figure 5.
Viability assay (WST-8) of HaCaT cell lines exposed to 1 µM, 3 µM and 5 µM of colloidal (a) and green (b) AgNPs. The viability of NP-treated cells was normalized to non-treated control cells. As a positive control (P), the cells were incubated with 5% DMSO (data not shown). Data reported as the mean ± SD from three independent experiments are considered statistically significant, compared with the control (n = 8) for p value < 0.05 (<0.05 *).
3.1. Mass Spectrometry Benchmark of the Effect of Green AgNPs and Colloidal AgNPs on Proteotype of A375 Melanoma Cells
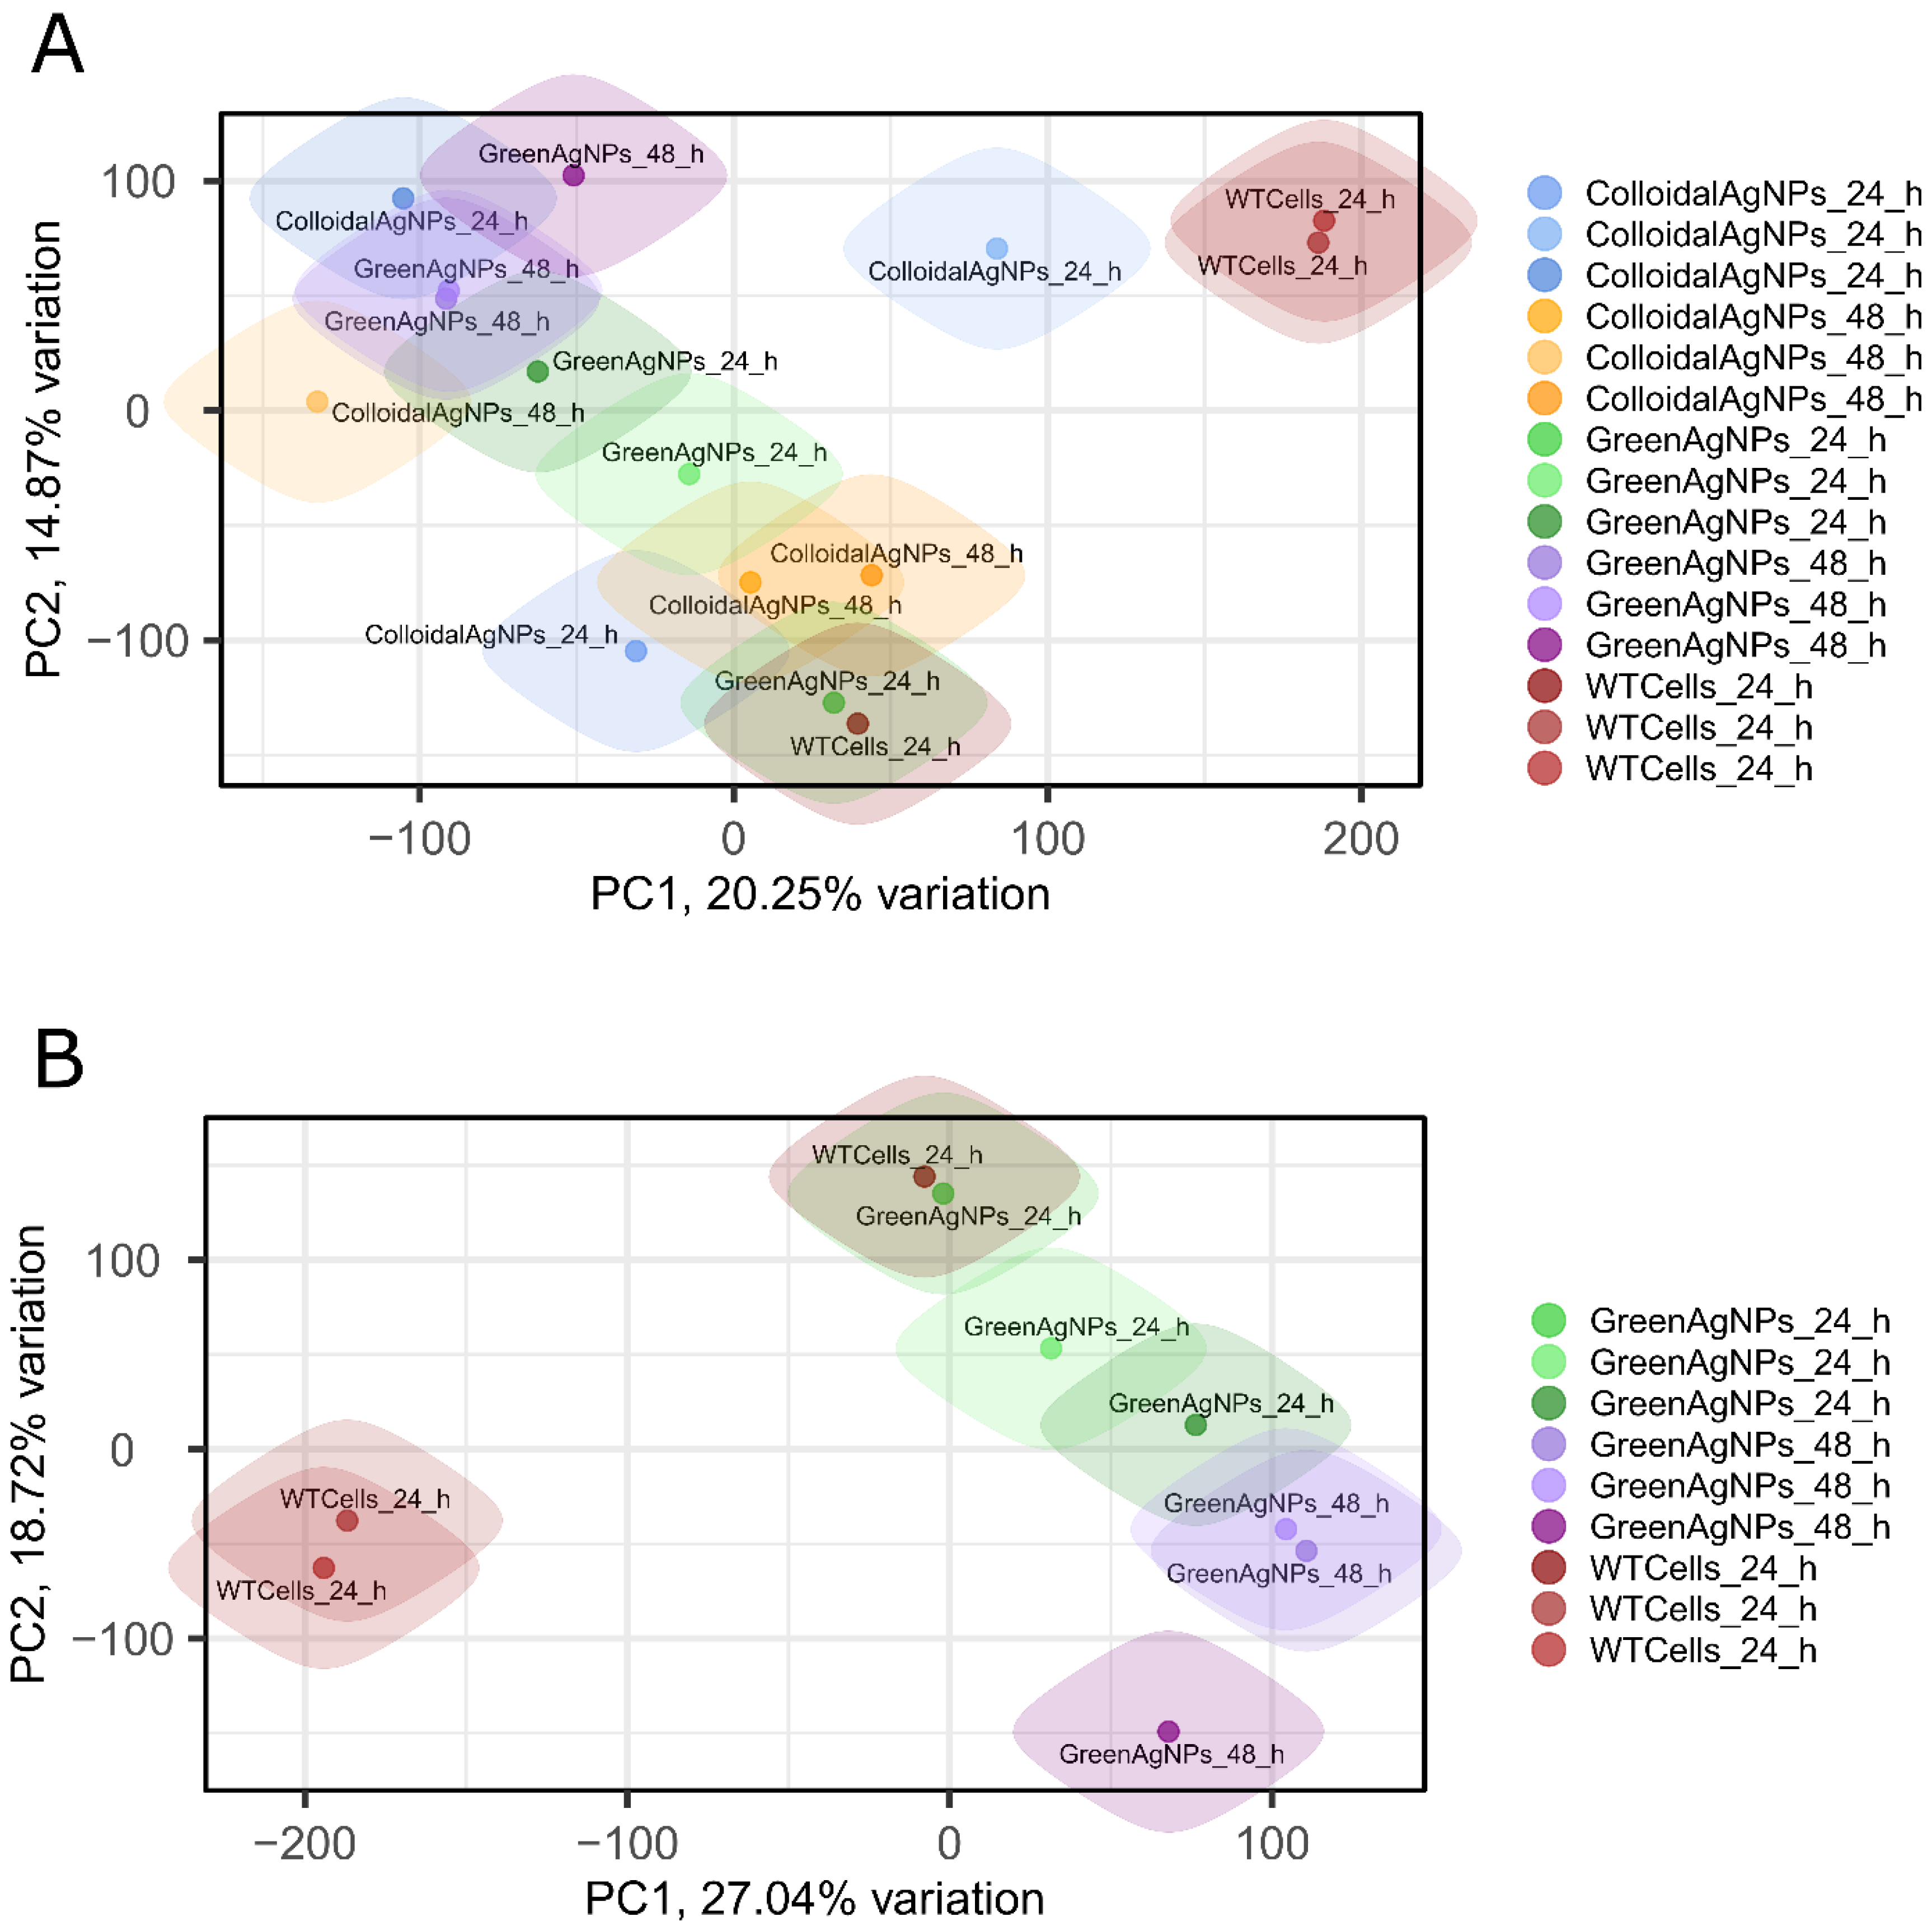
To elucidate the molecular mechanisms driving the selective properties of Green AgNPs over melanoma cells we have implemented DIA/SWATH quantitative mass spectrometry. It is a well-established method for comparing the proteotypes or evaluating the impact of treatment on protein level. In our mass spectrometry screen we compared proteotypes of both Green AgNPs and Colloidal AgNPs treated cells harvested in two timepoints 24, 48 h after treatment. Three biological replicates measured in a technical duplicate yielding 6 MS runs per condition were acquired. Initially, we examined the variability in our mass spectrometry data by evaluating the protein intensities proving relative consistency of the dataset with only minor effects of sample preparation and/or mass spectrometry contributing to variability. Particularly, we detected slightly greater extent of 0 or N/A values in two technical replicates of GreenAgNPs_48h, one replicate of WTCellsAgNPs_24h, and one replicate of WTCellsAgNPs_48h (Supplementary Figure 1, protein intensity QC plot). To further determine variability among induced proteotypes we performed two PCA analyses (Figure 6 A, B). Initially, proteotypes of Colloidal and Green AgNPs in both timepoints were investigated in principal component analysis (PCA). PCA analysis in Figure 6A highlights that the A375 cells treated with colloidal Green AgNPs or AgNPs are exhibiting almost distinct protein intensity profiles compared to control/wild type counterparts (WT) as there is a visible trend in separation along PC1, reflecting relative proteotype dissimilarity. However, a deeper insight into the global differences of Green AgNPs and WT proteotypes (Figure 6B) provides even clearer separation particularly of control cells and Green AgNPs treated melanoma cells. Proteotypes of WT and Green AgNPs treated cells (both at 24 h and 48 h) profile are positioned farther apart, displaying higher proteotype dissimilarity. This observation is in concert with viability assay if we extrapolate it to the selective Green AgNP effect over A375 cells. In addition, the PCA in Figure 6B shows temporal classification of the proteotypes along PC2, distinguishing the timepoints of Green AgNPs treatment of A375 cells.
Nevertheless, we consider these observations relying on global proteome changes imprecise but promising, as the separation along PC1 and PC2 might be driven by the proteins related to the selective mechanism of green AgNPs acting over melanoma A375 cells. Therefore, we further thoroughly examined the expression values of discrete proteins across conditions.
Figure 6.
The principal component analysis (PCA) plot analysis.A) PCA of a both Colloidal and Green AgNPs. B) PCA of Green AgNPs most promising therapy candidate. PCA indicates clear separation of control cells (WT) and Green AgNPs treated melanoma cells after 24 hours treatment which further develops over next 48 hours of treatment, apparently this observation is reflected in PC1 component.
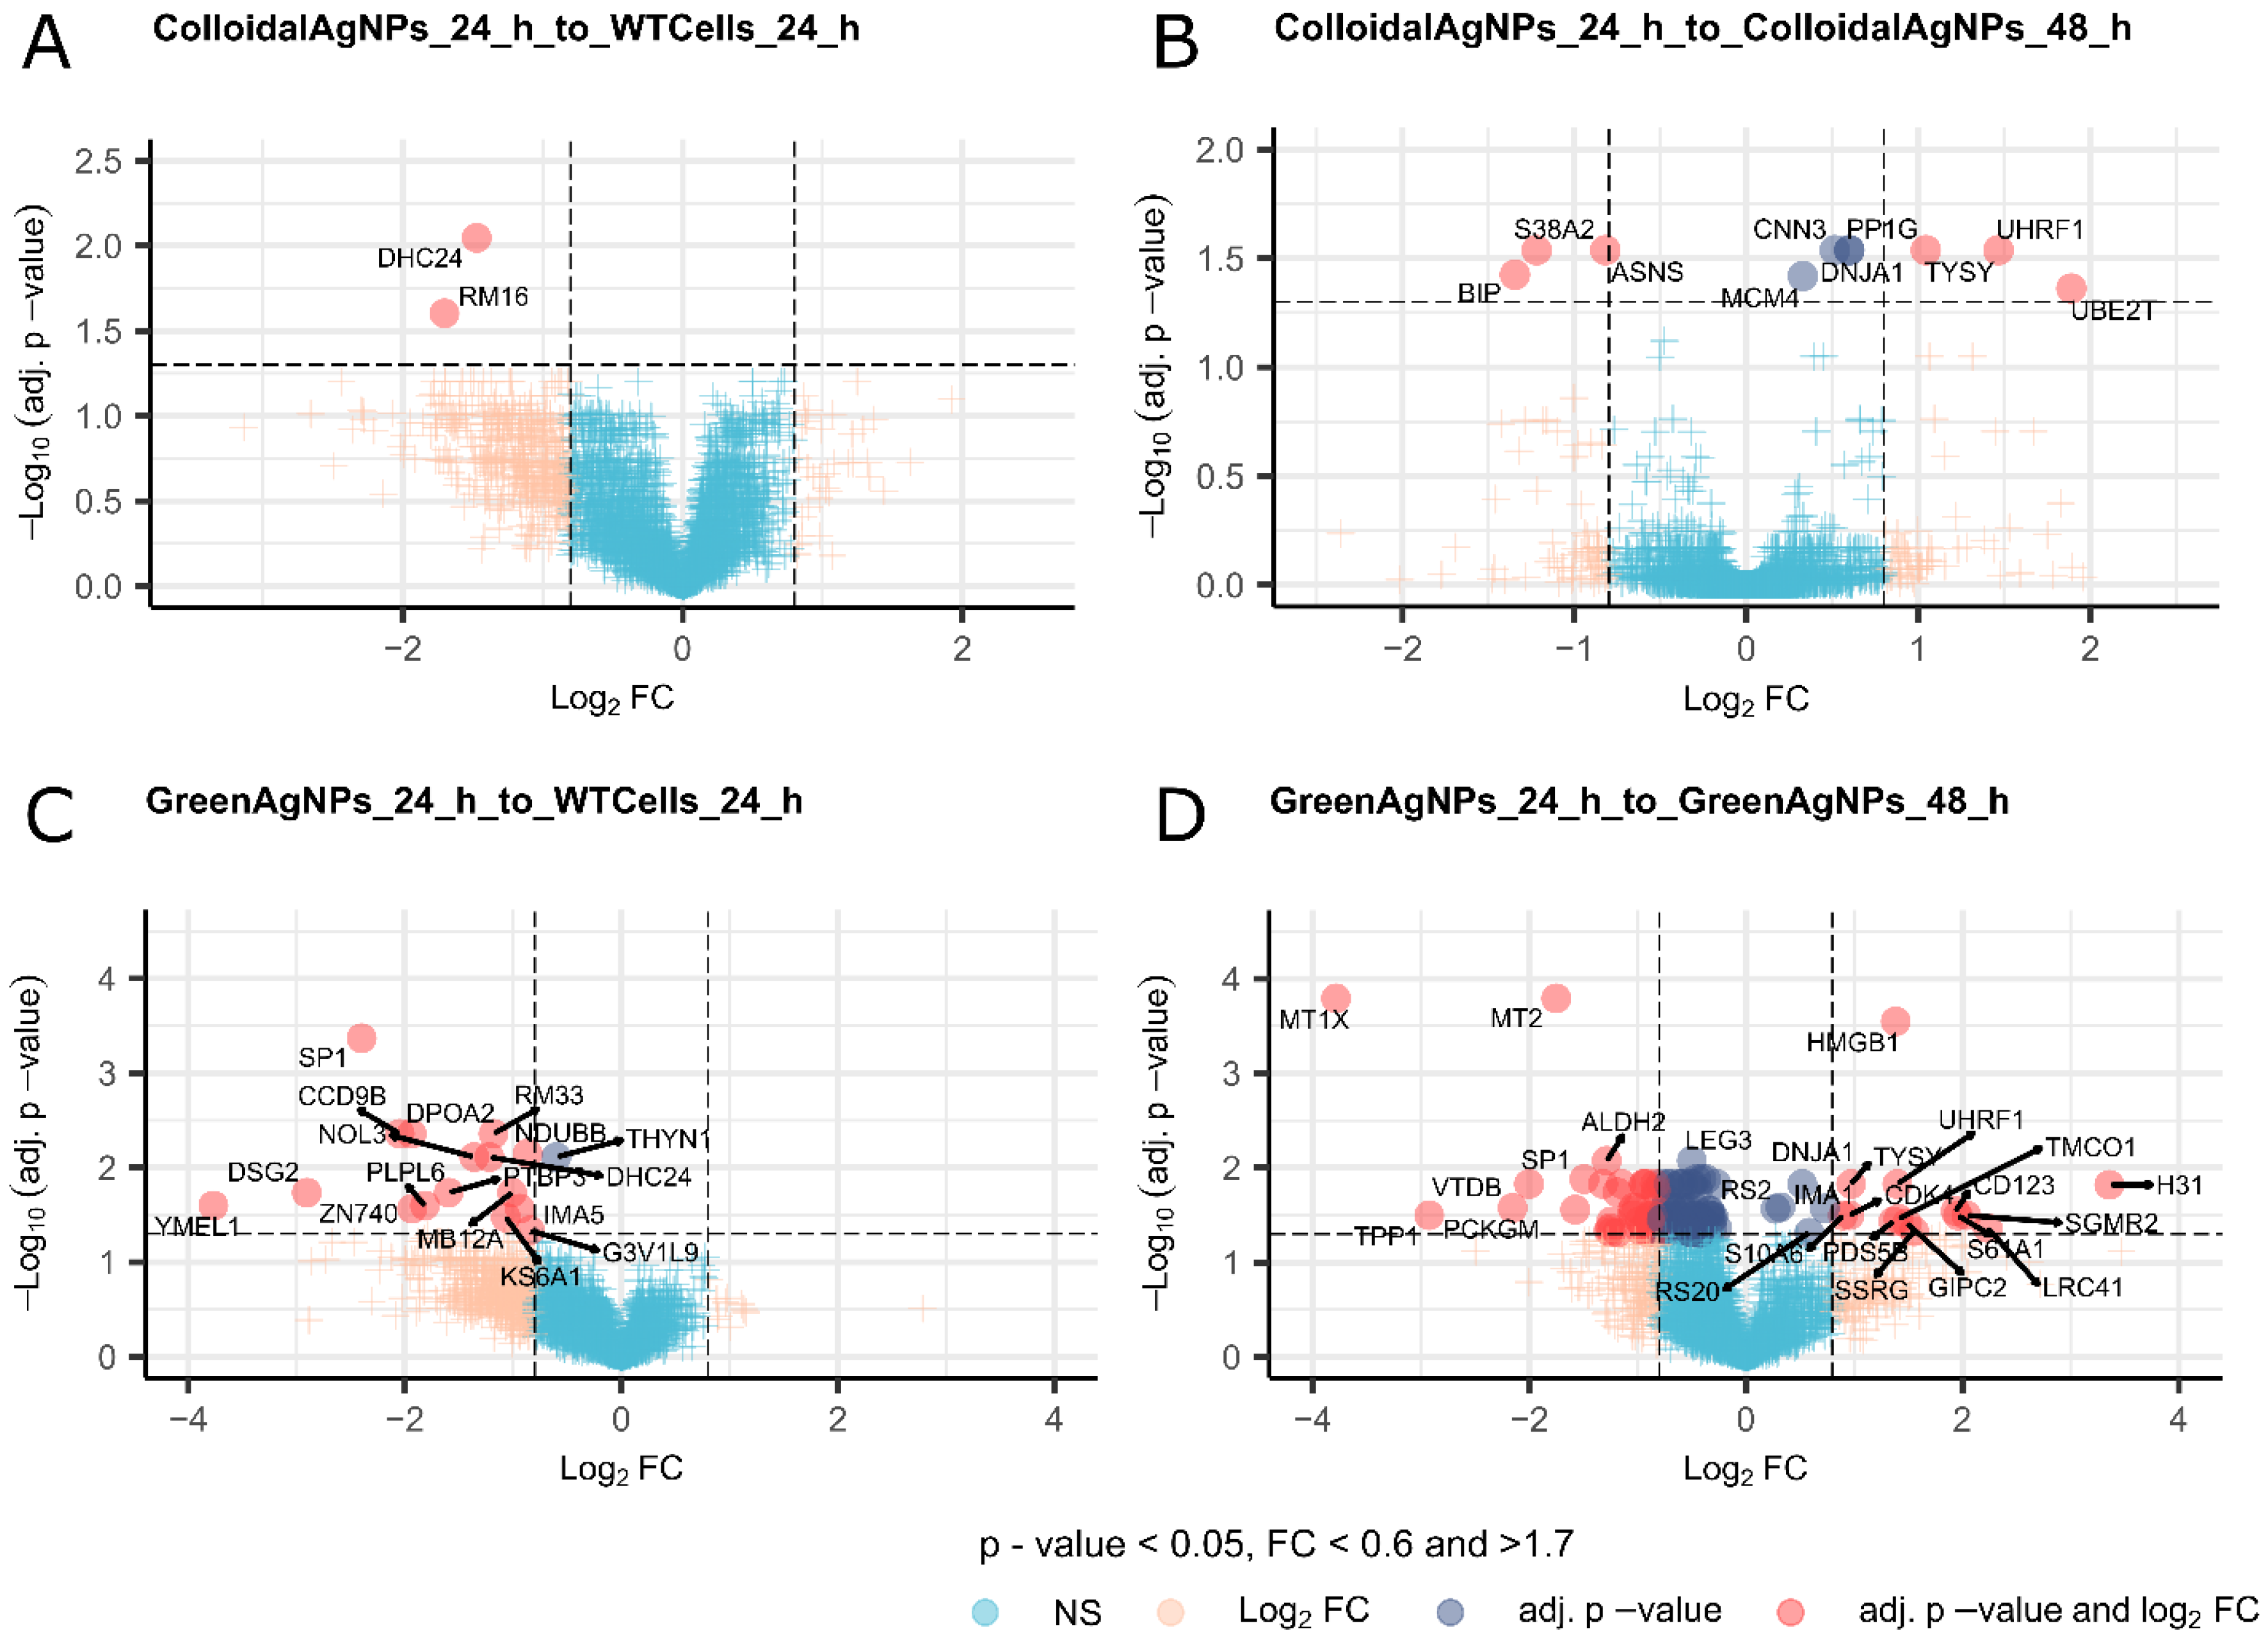
Delving into the changes of discrete proteins (Supplementary_table1_DIA_Quantitation_result_all_comparisons) and comparing them as a function as of time in both Green and Colloidal AgNPs to the WTcells reveals a remarkable differences in responses to the treatments on proteome level which are apparently in concert with observations from cellular viability assay and from PCA. In particular, assuming that the effect of decrease in the A375 cell viability will be reflected into dysregulation of proteins, we see a larger pool of dysregulated proteins (Figure 7C and D) upon GreenAgNPs treatment at any point if compared to Colloidal AgNPs (Figure 7A and B), respectively.
Figure 7.
V-plots of the comparisons: (a) Colloidal AgNPs 24h to WT Cells 24h; (b) Colloidal AgNPs 24h to Colloidal AgNPs 48h; (c) Green AgNPs 24h to WT Cells 24h; (d) Green AgNPs 24h to Green AgNPs 48h.
Figure 7.
V-plots of the comparisons: (a) Colloidal AgNPs 24h to WT Cells 24h; (b) Colloidal AgNPs 24h to Colloidal AgNPs 48h; (c) Green AgNPs 24h to WT Cells 24h; (d) Green AgNPs 24h to Green AgNPs 48h.
To uncover the molecular essence of more potent Green AgNPs action we thoroughly inspected the protein roles and their involvement in key biochemical processes. The exposure of melanoma cells to Green AgNPs for 24 hours predominantly resulted in the downregulation of cellular proliferation, survival, and differentiation compared to WT cells (Please refer to discussions). This reflects the cellular response primarily to DNA damage, programmed cell death, and autophagy. Moreover, proteins involved in motility, mitochondrial protein transport and stress response, DNA repair, autophagy, cell cycle regulation and chromatin organization were further decreased over next 24 hours of Green AgNPs action (Figure 7C and D). Knowingly, many of revealed processes might be involved antioncogenic effect, however some these processes have already been described as a general effects of nanoparticle treatment (for detailed information please see discussion section). In addition, some of the proteins from which we inferred the shift in processes/pathways might be involved in multiple processes, thus the interpretation of the meaning of change in the protein level this way might not be accurate.
3.2. Focusing on Revealing the Anti-Oncogenic Effect of Green AgNPs Using DIA/SWATH Mass Spectrometry Data
Therefore, we further examined the dysregulated protein pool in Green AgNPs treated A375 cells focusing on subtle shifts in processes/pathways involving multiple proteins (Gene ontology - GO), providing rather cumulative evidence of Green AgNP antioncogenic effect/s (Figure 8AB).
Figure 8.
V-plot shows the most profound biological mechanism/proteomics markers expression upon the treatment of Green AgNPs. Known oncoproteins decrease after incubation with Green AgNPs in both time points. While there is increase in metabolism of carboxylic acids after longer incubations (48h) with particle which might indicate increase in normal carbohydrate metabolism via Krebs cycle (and oxidative phosphorylation) rather than anaerobic glycolysis which is well known for cancer state (Warburg effect). This subtle shift might further prove the healing effect of the particle. Dysregulation in genes involved in copper homeostasis might reflect the reaction of the cells to Ag.
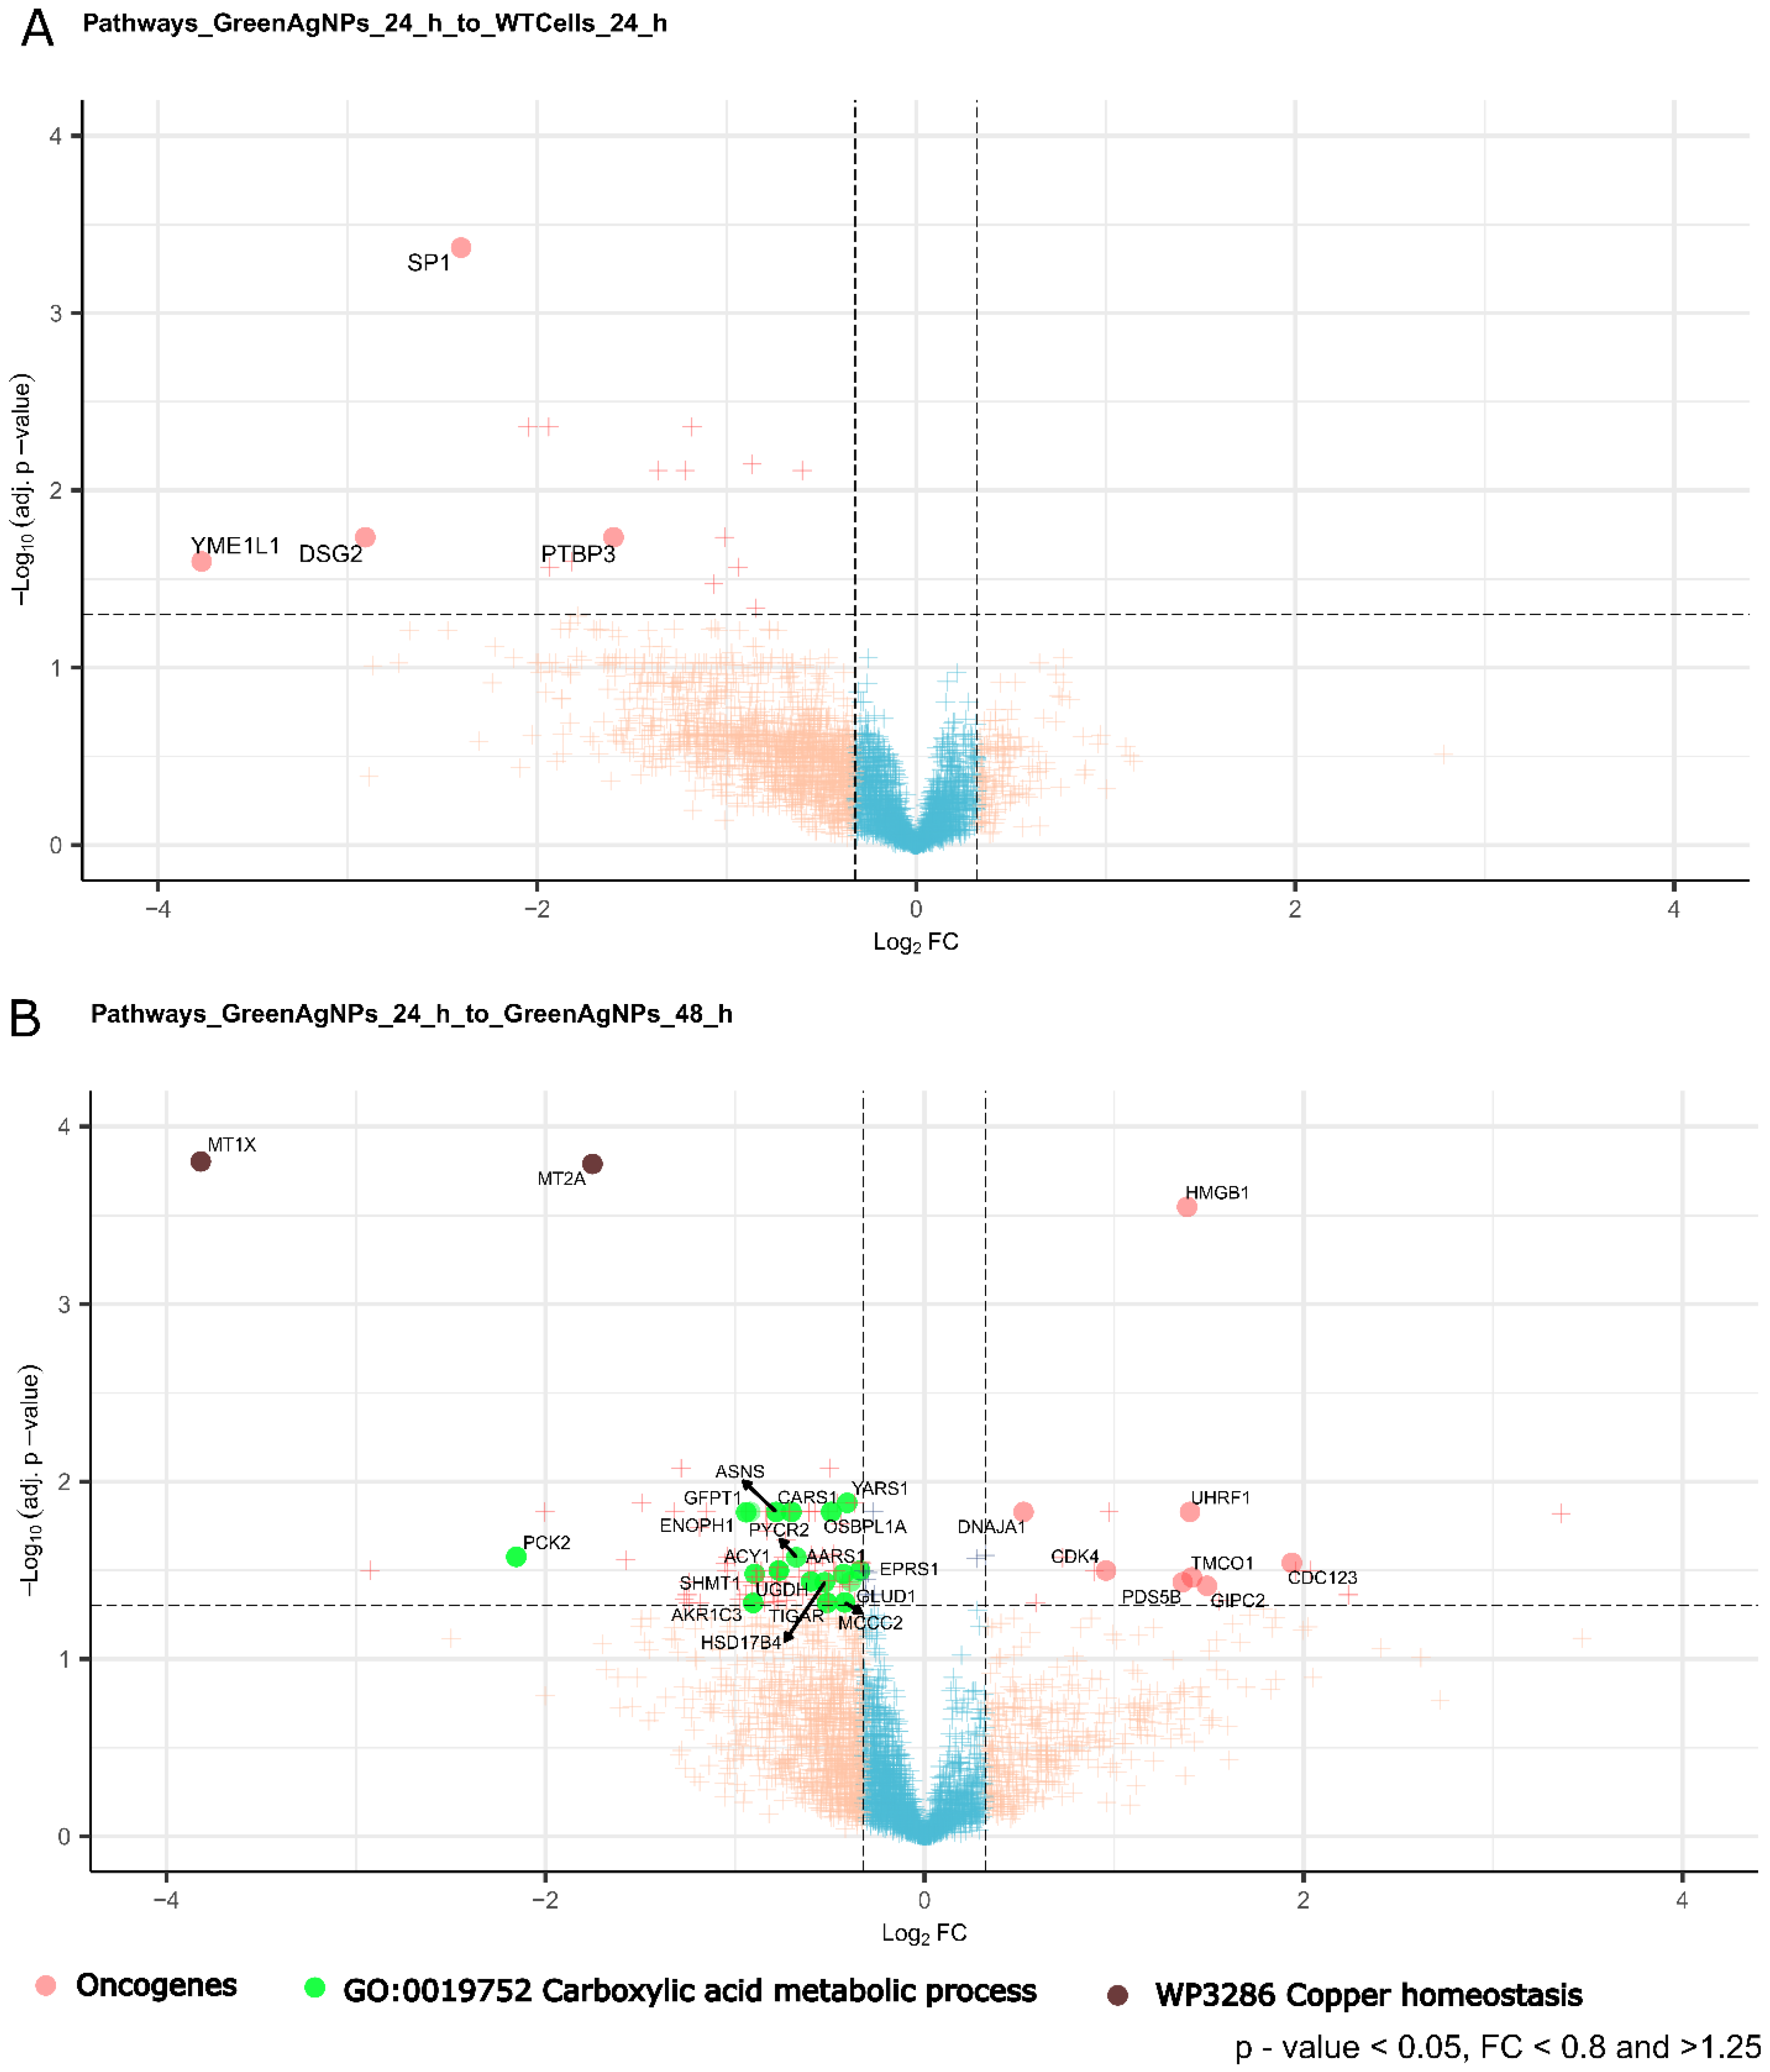
The most notable effects of Green AgNPs on A375 melanoma cells could be represented by key proteins either down or up-regulated upon Green AgNPs treatment, that are linked by GO-terms or common function providing a cumulative evidence in their role such as e.g. driving oncogenic transformation/processes (Figure 8AB). In addition, our dataset allows to screen evolution of this effects time-sensitive manner in two timepoints (Figure 8AB). Initial, exposure to Green AgNPs (24 hours) reveals (Figure 8A) a downregulation of several oncogenes known for their involvement in the tumorigenesis, cell proliferation, cell invasion and metastasis: PTBP3, SP1, DSG2, and YME1L.
Extending the incubation time of melanoma cells with nanoparticles to 48 hours (Figure 8B), a leads to even more significant decrease in the expression level and number of oncoproteins, clearly amplifying the cancer cell growth inhibition as a function of the treatment time. Peculiar is also the profound onset in metabolism of carboxylic acids after longer incubations (48h) with nanoparticles, that might indicate an increase in aerobic glycolysis and Krebs cycle rather than cancer related anaerobic glycolysis which is a prominent feature of cancer cells metabolism (Warburg effect). In addition, as clearly shown in volcano plot (Figure 8B), the presence of dysregulated genes required in copper homeostasis (MT1X, MT2A) might reflect the cancer cell response to AgNPs. On the other hand, copper is a crucial element in all solid tumors for the induction of angiogenesis, which is fundamental for the supply of oxygen and nutrients to the tumor (83). However, this point needs further clarifications.
4. Discussion
Here, we present a comprehensive results demonstrating selective antioncogenic effects of novel Green AgNPs acting selectively over cancer A375 cells. We performed thorough characterization of the AgNPs derived from two synthetic approaches: colloidal and green synthesis. The analysis confirmed their nearly spherical morphology and comparable nanometric size, as shown by TEM acquisitions and DLS measurements, while also verifying their stability in cell culture media. Additionally, UV-Visible absorption spectra confirmed the expected absorption peaks. Raman spectroscopy further revealed distinct signals attributed to citrate groups, for colloidal AgNPs, and to polyphenols aromatic rings, for green AgNPs. For sure, the eco-friendly method leverages natural resources, such as plant extracts, to produce AgNPs with unique properties, providing an effective and sustainable alternative for therapeutic and technological advancements. Our cell viability assay demonstrated that the Green AgNPs selectively decrease viability in A375 cells while this effect is not so potent in healthy HaCaT cell model. Of note, we did not detect such selective antioncogenic effect after treating A375 cells by Colloidal AgNPs. Hence, we performed a proteomic DIA/SWATH screen to reveal molecular background of the shift in A375 proteotypes induced by Green AgNP treatment in two timepoints and benchmarked it to Colloidal AgNP treatment. Strikingly, the phenotypic changes and global proteome changes were reflected even on molecular level mechanistically elucidating the antioncogenic effect of Green AgNPs on A375 melanoma cells.
Initially we defined difference in molecular effects on A375 cells after exposure to colloidal AgNPs and GreenAgNPs. Partially in line with cell viability assay Colloidal AgNPs acted less effectively over the A375 cancer cells. The 24 hour Colloidal AgNP treatment led to the dysregulation of only two proteins. Even prolonged exposure to colloidal AgNPs did not provide extensive effect. A relatively small set of dysregulated proteins, characteristic by down-regulated BIP, S38A2, ASNS and upregulated MCM4, CNN3, DNJA1, PP1G, TYSY, UHRF1, UBE2T with a prevalence of nuclear expression was detected. The downregulated subset of proteins contains proteins involved in transmembrane transport, an endoplasmic reticulum chaperone system (38), regulator of the mitotic cell cycle (40) and programmed cell death (41).
Conversely, the small subset of upregulated proteins harbors proteins involved in cell differentiation and signaling processes, a translation regulator, chromatin organization (43), DNA replication (44) and repair, mitotic cell cycle (UniProtKB) and cell adhesion-mediated activity (46). At the first glance we could conclude that the effect of colloidal AgNPs over A375 cells harbors multiple processes which are known effects of nanoparticles on cells in general but also processes involved in cancer. Nevertheless, the sets of affected proteins is too small to confidently conclude that the profound effect of colloidal AgNPs is antioncogenic.
However, after inspection of the dysregulated protein pool as a response to Green AgNPs at 24 hours to nontreated cells we see a much greater response with much greater dysregulated protein pool. It includes SP1, CCD9B, NOL3, DPOA2, RM33, DSG2, YMEL1, ZN740, and many others, predominantly downregulated at 24 hours. Multiple proteins are crucial for cellular proliferation, survival, and differentiation. This reflects the cellular response primarily to DNA damage, programmed cell death, and autophagy. Deeper analysis of the downregulated protein pool after 24 of Green AgNPs further reveals regulation of mechanisms involving the mitochondrion organization, electron transport in the respiratory chain, signaling, and cell junctions organization, all of which are related to the cellular response to nanoparticle treatment but also to cellular metabolism and cancer. The effect of Green AgNPs over the A375 cells becomes even more amplified in 48 hours of treatment.
There is a notable prevalence of altered protein expression both in the nucleus and cytoplasm, along with a remarkable presence of proteins localized to the endoplasmic reticulum. The expression profiles of several targeted proteins exhibit both downregulation and upregulation. Notably, proteins displaying increased level along with treatment such as TPP1, VTDB, PCKGM, SP1, ALDH2, and LEG3 play crucial roles in various biological processes, such as mitochondrial function, vitamin D transport, gene expression modulation, and inflammatory responses. Among these, ALDH2 and PCKGM are mitochondrial enzymes (UniProtKB), while VTDB is a secreted factor involved in vitamin D transport, scavenging extracellular G-actin, and enhancing chemotactic activity (64). SP1 functions as a transcription factor, while LEG3 acts as a pre-mRNA splicing factor in the nucleus and is implicated in inflammatory responses (65), cell adhesion, and cell differentiation (66).
It is noteworthy that MT1X and MT2, metallothioneins known for their involvement in the detoxification process with their metal ion binding function, exhibited a upregulation with the course of Green AgNP treatment. Interestingly, existing literature describes their upregulation in melanoma disease (68). Conversely, several proteins exhibit downregulation with the course of the treatment in cellular processes, each contributing to distinct functions within the cell, including protein synthesis, calcium signaling and cell motility, mitochondrial protein transport and stress response, DNA repair, autophagy, cell cycle regulation and chromatin organization and DNA stability regulation which might as well greatly contribute to the apoptosis of A375 cells. Clearly, these findings pave the way for further exploration of their functional implications in physiological and pathological processes.
Overall, these findings underscore the complex interplay of proteins in maintaining cellular homeostasis and highlight the need for further investigation into their roles in physiological and pathological contexts. Therefore as a result we performed a reanalysis of our proteomic data focusing our attention on the shifts in regulation on the known oncogenes as a function of the treatment. Additionally, we focused on protein networks/pathways that are linked by GO terms providing cumulative evidence of the Green AgNPs treatment effect. Strikingly, after 24 hours of Green AgNPs treatment we observed an early onset of a significant down regulation of several oncoproteins, this effect is even more profound after 48 h of treatment. Hence, below we discuss a role of suppressed oncogenes in cellular signalling related to cancer.
We expect that via these suppressed oncoproteins a pathways crucial for cancer signaling might be inhibited, together leading to arrest of the cancer growth by the nanoparticle action. In particular DSG2, required in maintaining the epithelial stability acting on cell-to-cell adhesion, targets PI3K/AKT, Hedgehog (Hh), and Wnt/β-catenin, which are widely implicated in human cancer and cancer cell models (75); Sp1, a complex key transcription factor, that acts on essential oncogenes, tumor suppressors, and housekeeping genes critical for the hallmarks of cancer. It also promotes tumor-associated angiogenesis through pro- and anti-angiogenic genes, also allowing replicative immortality activity, through p53 and Telomerase activity (76). In addition, YME1L is required for mitochondrial regulation of morphology, function and plasticity, also exerting an antiapoptotic activity, and the promotion of oxidative stress (77). Numerous evidence has linked Ca2+ signaling disorders with carcinogenesis and tumor progression (84). Among the plot outcomes, TMCO1, a calcium-selective channel, is able to prevent excessive calcium storage, thus contributing to calcium homeostasis (UniProtKB). Calcium-related pathways are involved both in melanogenesis and in melanoma tumorigenesis, in which specifically the calcium influx across multiple cell compartments in a primary melanoma represents a key regulator of the whole process (85). Strikingly, Wnt signaling pathway might have been impacted by the influence of nanoparticles treatment by GIPC2, a member of the GIPC family of proteins, known to activate the Wnt routes. In (86) the expression levels of GIPC2 were analyzed in a panel of cancers, resulting mainly low in cancer types compared with the tissue adjacent to the cancer. CDK4 acts as “master regulator” of the cell cycle, and it has been proved that many human tumors share altered CDK4/6-CYCLIN D-INK4-RB pathway by multiple mechanisms (87). The Cyclin D-CDK4 specifically contributes to various mitogenic and antimitogenic signals (UniProtKB). In this context, also PDS5B was influenced by the treatment, and as regulator of the cohesion of sister chromatid in mitosis, affects the cohesion and repair processes of DNA (UniProtKB), having also a proved role in carcinogenesis (88) and progression in prostate cells. Lastly, other reported signals are referred to HMGB1 a pro-inflammatory mediator responsible for tumor formation, progression, and metastasis in many cancers (89); UHRF1 has a DNA damage sensor activity (90) and is highly expressed in many human cancers compared to normal tissues, as well as being also associated with rapid disease progression (91). Then, among the oncogenes shown, DNAJA1 exert a role in the prevention of unfolded mutant p53 from proteasomal degradation, although its biological role remains unknown (92). Taken together we conclude that the observed selective decrease in cell viability of cancer cells is probably the result of inhibition of the discussed oncogenes. Revealed pool of suppressed oncoproteins elucidates a mechanism of selective action of Green AgNPs leading to arrest of the cancer growth which is not seen in Colloidal Nanoparticles.
Moreover, Gene ontology revealed a significant shift in metabolism of carboxylic acids underlaid by upregulation of almost 17 proteins knowingly involved in this process (GO). Some clinically significant hallmarks of cancer may provide additional reasons behind the upregulation of this process in the course of Green AgNP treatment, particularly aerobic glycolysis in cancer, occurring during the rapid proliferation supported by strong anabolism, the evasion of apoptotic cell death, and the ability to metastasize (78). This biochemical shift might further demonstrate the restorative effect of the tested Green AgNPs as carboxylic acid metabolism might represent increase in Krebs cycle which is rather characteristic to normal cells. In this panel (GO: 0019752 Carboxylic acid metabolic process term) not all 17 highlighted proteins link to the Krebs cycle directly, however there are several proteins whose increased activity has more direct link such as GLUD1, MCCC2, TIGAR, HSD17B4, PYCR2. TIGAR inhibits glycolysis by reducing fructose-2,6-bisphosphate in a p53/TP53-dependent manner, leading to the activation of the pentose phosphate pathway (PPP) and promoting NADPH production (79,80). It also lowers ROS levels by generating reduced glutathione, thereby protecting cells from oxidative and metabolic stress (80). Additionally, TIGAR supports cancer cell survival by activating DNA repair through PPP in a CDK5-ATM-dependent signaling pathway, in response to hypoxia or DNA damage (81). Then PCKGM, a mitochondrial phosphoenolpyruvate carboxykinase, plays a crucial role in gluconeogenesis and the cellular response to glucose and tumor necrosis factor (UniProtKB). Studies have shown that elevated expression of cytosolic phosphoenolpyruvate carboxykinase is linked to tumor repopulation in melanoma cells (82). Taken together, our reanalysis of quantitative proteomic data revealed a dysregulation in oncogenes and metabolic processes linked to the cancer. The shift in the involved proteins as a function of the treatment favors the antioncogenic effect or removal of the cancer cells. These observations are accompanied by switching to lower level of oncogenes and restoring normal glucose metabolism by selective impact of Green AgNPs which on the other hand is not detected in Colloidal AgNPs.
5. Conclusions
Green silver nanoparticles (AgNPs) synthesized through eco-friendly methods using plant extracts offer significant advantages due to their biocompatibility and reduced environmental impact. These nanoparticles retain the unique physicochemical properties of colloidal AgNPs, such as a high surface area-to-volume ratio, which enhances their ability to interact with biological systems and promotes efficient cellular uptake. Additionally, the optical and plasmonic properties typical of AgNPs, such as their localized surface plasmon resonance, make them highly suitable as active therapeutic tools in cancer treatment. The green synthesis approach also reduces the need for toxic chemicals, making these nanoparticles a safer option for therapeutic applications. Our study outlines the use of the DIA/SWATH-MS technique to produce comprehensive quantitative proteomics profiles. These profiles reveal the proteome alterations in cancer cells in response to nanoparticle treatment over time. For years, researchers have been working on using AgNPs for medical applications and drug delivery. The chosen AgNPs (colloidal and Green AgNPs) act on melanoma cells. Colloidal AgNPs treatment has shown to be less effective against melanoma cancer cells in the short and long term. On the other hand, our Green AgNPs have displayed promising results. They selectively inhibit the growth of melanoma cells and simultaneously make them safer for normal cells in terms of cell viability. Due to the Green AgNPs treatment over a short and long time, the key proteins from the three primary mechanisms have dysregulations in the melanoma cells. These include hampering the oncogene's expression, increasing carbohydrate metabolism, and dysregulating copper homeostasis (Table 2). Looking ahead, we believe that our approach will be a valuable resource for researchers interested in the DIA/SWATH quantitative MS proteomic analysis of nanoparticle treatments for the evaluation the role of NPs in the therapy, safety, biological mechanisms and biomarker discovery. There is a clear and pressing need for further studies to identify specific protein targets for therapy, and to explore the potential of Green AgNPs, either alone or in combination with other drugs, in melanoma therapy. This DIA/SWATH quantitative MS proteomic study represents the first step in demonstrating the direct application of Green AgNPs in melanoma therapy, and we look forward to future studies that will build on this foundation.
Funding
This research was funded by the International Research Agenda’s Program of the Foundation for Polish Science (MAB/2017/03), European Funds for Smart Economy 2021-2027 (FENG), Priority FENG.02 Innovation-friendly environment, Measure FENG.02.01 International Research Agendas in the frame of project “Science for Welfare, Innovations and Forceful Therapies (SWIFT)” no. FENG.02.01-IP.05-0031/23. Project PROM – International scholarship exchange for doctoral students and academic staff is financed by the European Social Fund under the Operational Programme Knowledge Education Development, non-competitive project entitled International scholarship exchange for doctoral students and academic staff, contract number POWR.03.03.00-00-PN13/18. The authors JF and SK would also like to thank the CI-TASK, Gdansk, and PL-Grid Infrastructure, Poland, for providing their hardware and software resources. VDM kindly acknowledges Programma Operativo Nazionale (PON) Ricerca e Innovazione 2014–2020-Azione IV.6 “Contratti su tematiche green”-DM 1062/2021 for sponsoring her salary and work.
Data Availability Statement
The data presented in this study are available in this article.
Conflicts of Interest
There are no conflicts to declare.
References
- Lopes, J. , Rodrigues, C. M. P., Gaspar, M. M., & Reis, C. P. (2022). Melanoma management: From epidemiology to treatment and latest advances. Cancers, 14(19), 4652. [CrossRef]
- Rigel DS, editor. Cancer of the skin. [Edinburgh]: Elsevier Saunders op. 2011.
- Dasari, S. , Yedjou, C. B. ( 9(1), 1500–1521. [CrossRef]
- Beiu, N. , Giurcaneanu, N. ( 9(2), 318. [CrossRef]
- Shan, X., Gong, X., Li, J., Wen, J., Li, Y., & Zhang, Z. (2022). Current approaches of nanomedicines in the market and various stage of clinical translation. Acta Pharmaceutica Sinica B, 12(7), 3028–3048. https://doi.org/10.1016/j.apsb.2022.02.025 (45) Hsieh, My., Hsu, SK., Liu, TY. et al. Melanoma biology and treatment: a review of novel regulated cell death-based approaches. Cancer Cell Int 24, 63 (2024). https://doi.org/10.1186/s12935-024-03220-9.
- Kozar, I. , Margue, C., Rothengatter, S., Haan, C., & Kreis, S. (2019). Many ways to resistance: How melanoma cells evade targeted therapies. Biochimica Et Biophysica Acta. Reviews on Cancer/Biochimica Et Biophysica Acta, CR. Reviews on Cancer, 1871(2), 313–322. [CrossRef]
- Zhao, J. , Gao, N. ( 561, 216148. [CrossRef] [PubMed]
- Wei, L. , Lu, J., Xu, H., Patel, A., Chen, Z., & Chen, G. (2015). Silver nanoparticles: synthesis, properties, and therapeutic applications. Drug Discovery Today, 20(5), 595–601. [CrossRef]
- Danciu, C. , Pinzaru, I. ( 134, 1–19. [CrossRef] [PubMed]
- Nguyen, N. P. U. , Dang, N. T., Doan, L., & Nguyen, T. T. H. (2023). Synthesis of Silver Nanoparticles: From Conventional to ‘Modern’ Methods—A Review. Processes, 11(9), 2617. [CrossRef]
- Xu, L. , Wang, Y., Huang, J., Chen, C., Wang, Z., & Xie, H. (2020). Silver nanoparticles: Synthesis, medical applications and biosafety. Theranostics, 10(20), 8996–9031. [CrossRef]
- Dawadi, S. , Katuwal, S., Gupta, A., Lamichhane, U., Thapa, R., Jaisi, S., Lamichhane, G., Bhattarai, D. P., & Parajuli, N. (2021). Current research on silver nanoparticles: synthesis, characterization, and applications. Journal of Nanomaterials, 2021, 1–23. [CrossRef]
- De Matteis, V. , Cascione, M., Toma, C. C., & Leporatti, S. (2018). Silver nanoparticles: synthetic routes, in vitro toxicity and theranostic applications for cancer disease. Nanomaterials, 8(5), 319. [CrossRef]
- Kaur R, Mishra A, Saha S. An overview of phyto-assisted fabrication of metallic nanoparticles. Biocatal Agric Biotechnol. 2023; 50:102723. [CrossRef]
- Kaur, R. , Mishra, A., & Saha, S. (2023). An overview of phyto-assisted fabrication of metallic nanoparticles. Biocatalysis and Agricultural Biotechnology, 50, 102723. [CrossRef]
- Arshad, F. , Naikoo, G. A., Hassan, I. U., Chava, S. R., El-Tanani, M., Aljabali, A. A., & Tambuwala, M. M. (2023). Bioinspired and green synthesis of silver nanoparticles for medical applications: A Green Perspective. Applied Biochemistry and Biotechnology. [CrossRef]
- De Matteis, V. , Martano, S., Pellegrino, P., Ingrosso, C., Costa, D., Mazzotta, S., Toca-Herrera, J. L., Rinaldi, R., & Cascione, M. (2024). Green silver nanoparticles: Prospective nanotools against neurodegenerative cell line model. Ibrain, 10(2), 123–133. [CrossRef]
- Rohde, M. M. , Snyder, C. M., Sloop, J., Solst, S. R., Donati, G. L., Spitz, D. R., Furdui, C. M., & Singh, R. (2021). The mechanism of cell death induced by silver nanoparticles is distinct from silver cations. Particle and Fibre Toxicology, 18(1). [CrossRef]
- Li, L. , Cui, J., Liu, Z., Zhou, X., Li, Z., Yu, Y., Jia, Y., Zuo, D., & Wu, Y. (2018). Silver nanoparticles induce SH-SY5Y cell apoptosis via endoplasmic reticulum- and mitochondrial pathways that lengthen endoplasmic reticulum-mitochondria contact sites and alter inositol-3-phosphate receptor function. Toxicology Letters, 285, 156–167. [CrossRef]
- Muhamad, M. , AbRahim, N., Omar, W. a. W., & Kamal, N. N. S. N. M. (2022). Cytotoxicity and genotoxicity of biogenic silver nanoparticles in A549 and BEAS-2B cell lines. Bioinorganic Chemistry and Applications/Bioinorganic Chemistry and Applications, 2022, 1–22. [CrossRef]
- Buttacavoli, M. , Albanese, N. N., Di Cara, G., Alduina, R., Faleri, C., Gallo, M., Pizzolanti, G., Gallo, G., Feo, S., Baldi, F., & Cancemi, P. (2017). Anticancer activity of biogenerated silver nanoparticles: an integrated proteomic investigation. Oncotarget, 9(11), 9685–9705. [CrossRef]
- Verano-Braga, T. , Miethling-Graff, R., Wojdyla, K., Rogowska-Wrzesinska, A., Brewer, J. R., Erdmann, H., & Kjeldsen, F. (2014). Insights into the Cellular Response Triggered by Silver Nanoparticles Using Quantitative Proteomics. ACS Nano, 8(3), 2161–2175. [CrossRef]
- Cascione, M. , Rizzello, L. ( 15(3), 775. [CrossRef]
- Wiśniewski, J. R. , Zougman, A. ( 6(5), 359–362. [CrossRef]
- Bouchal, P. , Roumeliotis, T., Hrstka, R., Nenutil, R., Vojtesek, B., & Garbis, S. D. (2008). Biomarker Discovery in Low-Grade Breast Cancer Using Isobaric Stable Isotope Tags and Two-Dimensional Liquid Chromatography-Tandem Mass Spectrometry (iTRAQ-2DLC-MS/MS) Based Quantitative Proteomic Analysis. Journal of Proteome Research, 8(1), 362–373. [CrossRef]
- Faktor, J. , Kote, S., Bienkowski, M., Hupp, T. R., & Marek-Trzonkowska, N. (2024). Novel FFPE proteomics method suggests prolactin induced protein as hormone induced cytoskeleton remodeling spatial biomarker. Communications Biology, 7(1). [CrossRef]
- Alharbi, N. S. , Alsubhi, N. S., & Felimban, A. I. (2022). Green synthesis of silver nanoparticles using medicinal plants: Characterization and application. Journal of Radiation Research and Applied Sciences, 15(3), 109–124. [CrossRef]
- Simon, S. , Sibuyi, N. R. S., Fadaka, A. O., Meyer, S., Josephs, J., Onani, M. O., Meyer, M., & Madiehe, A. M. (2022). Biomedical applications of plant Extract-Synthesized silver nanoparticles. Biomedicines, 10(11), 2792. [CrossRef]
- Arshad, F. , Naikoo, G. A., Hassan, I. U., Chava, S. R., El-Tanani, M., Aljabali, A. A., & Tambuwala, M. M. (2023b). Bioinspired and green synthesis of silver nanoparticles for medical applications: A Green Perspective. Applied Biochemistry and Biotechnology. [CrossRef]
- Cascione, M. , Rizzello, L. ( 15(3), 775. [CrossRef]
- De Matteis, V. , Martano, S., Pellegrino, P., Ingrosso, C., Costa, D., Mazzotta, S., Toca-Herrera, J. L., Rinaldi, R., & Cascione, M. (2024). Green silver nanoparticles: Prospective nanotools against neurodegenerative cell line model. Ibrain, 10(2), 123–133. [CrossRef]
- Biswas, N. , Kapoor, S., Mahal, H. S., & Mukherjee, T. (2007c). Adsorption of CGA on colloidal silver particles: DFT and SERS study. Chemical Physics Letters, 444(4–6), 338–345. [CrossRef]
- Munro, C. H. , Smith, W. E., Garner, M., Clarkson, J., & White, P. C. (1995b). Characterization of the surface of a Citrate-Reduced colloid optimized for use as a substrate for Surface-Enhanced resonance Raman Scattering. Langmuir, 11(10), 3712–3720. [CrossRef]
- Mohammadi, E. , & Amini, S. M. (2024d). Green synthesis of stable and biocompatible silver nanoparticles with natural flavonoid apigenin. Nano-Structures & Nano-Objects, 38, 101175. [CrossRef]
- Lu, X. , Li, Y., Liu, J., Cao, X., Wang, X., Wang, D., Seo, H., & Gao, B. (2011). The membrane topological analysis of 3β-hydroxysteroid-Δ24 reductase (DHCR24) on endoplasmic reticulum. Journal of Molecular Endocrinology, 48(1), 1–9. [CrossRef]
- Brown, A. , Amunts, A. ( 346(6210), 718–722. [CrossRef]
- Hatanaka, T. , Huang, W., Wang, H., Sugawara, M., Prasad, P. D., Leibach, F. H., & Ganapathy, V. (2000). Primary structure, functional characteristics and tissue expression pattern of human ATA2, a subtype of amino acid transport system A. Biochimica Et Biophysica Acta (BBA) - Biomembranes, 1467(1), 1–6. [CrossRef]
- Dana, R. C. , Welch, W. J. ( 126(1), 672–674. [CrossRef]
- Basrur, V. , Yang, F., Kushimoto, T., Higashimoto, Y., Yasumoto, K., Valencia, J., Muller, J., Vieira, W. D., Watabe, H., Shabanowitz, J., Hearing, V. J., Hunt, D. F., & Appella, E. (2002). Proteomic analysis of early melanosomes: identification of novel melanosomal proteins. Journal of Proteome Research, 2(1), 69–79. [CrossRef]
- Greco, A. , Gong, S. ( 9(6), 2350–2359. [CrossRef] [PubMed]
- Cui, H. , Darmanin, S., Natsuisaka, M., Kondo, T., Asaka, M., Shindoh, M., Higashino, F., Hamuro, J., Okada, F., Kobayashi, M., Nakagawa, K., Koide, H., & Kobayashi, M. (2007). Enhanced Expression of Asparagine Synthetase under Glucose-Deprived Conditions Protects Pancreatic Cancer Cells from Apoptosis Induced by Glucose Deprivation and Cisplatin. Cancer Research, 67(7), 3345–3355. [CrossRef]
- Rahman, L. , Voeller, D. ( 5(4), 341–351. [CrossRef] [PubMed]
- Karagianni, P. , Amazit, L. ( 28(2), 705–717. [CrossRef] [PubMed]
- Connelly, M. A. , Zhang, H., Kieleczawa, J., & Anderson, C. W. (1998). The Promoters for Human DNA-PKcs(PRKDC) andMCM4:Divergently Transcribed Genes Located at Chromosome 8 Band q11. Genomics, 47(1), 71–83. [CrossRef]
- Machida, Y. J. , Machida, Y. ( 23(4), 589–596. [CrossRef] [PubMed]
- Guo, Z. , Neilson, L. J., Zhong, H., Murray, P. S., Zanivan, S., & Zaidel-Bar, R. (2014). E-cadherin interactome complexity and robustness resolved by quantitative proteomics. Science Signaling, 7(354). [CrossRef]
- Koseki, T. , Inohara, N. ( 95(9), 5156–5160. [CrossRef]
- Gustafsson, Å. B. , Tsai, J. A. ( 279(20), 21233–21238. [CrossRef]
- Stoss, O. , Schwaiger, F. ( 274(16), 10951–10962. [CrossRef] [PubMed]
- Castello, A. , Fischer, B., Eichelbaum, K., Horos, R., Beckmann, B. M., Strein, C., Davey, N. E., Humphreys, D. T., Preiss, T., Steinmetz, L. M., Krijgsveld, J., & Hentze, M. W. (2012). Insights into RNA Biology from an Atlas of Mammalian mRNA-Binding Proteins. Cell, 149(6), 1393–1406. [CrossRef]
- Fang, Z. , Li, P., Li, H., Chong, W., Li, L., Shang, L., & Li, F. (2022). New insights into PTBP3 in human cancers: immune cell infiltration, TMB, MSI, PDCD1 and M6A markers. Frontiers in Pharmacology, 13. [CrossRef]
- Collins, K. , Russo, A. ( 12(12), 4555–4566. [CrossRef]
- De Mateo, S. , Castillo, J. ( 11(13), 2714–2726. [CrossRef]
- Greber, B. J. , & Ban, N. ( 85(1), 103–132. [CrossRef]
- Hurley, J. H. , & Hanson, P. I. (2010). Membrane budding and scission by the ESCRT machinery: it’s all in the neck. Nature Reviews Molecular Cell Biology, 11(8), 556–566. [CrossRef]
- Tsunematsu, T. , Yamauchi, E., Shibata, H., Maki, M., Ohta, T., & Konishi, H. (2010). Distinct functions of human MVB12A and MVB12B in the ESCRT-I dependent on their posttranslational modifications. Biochemical and Biophysical Research Communications, 399(2), 232–237. [CrossRef]
- Flower, T. G. , Takahashi, Y., Hudait, A., Rose, K., Tjahjono, N., Pak, A. J., Yokom, A. L., Liang, X., Wang, H., Bouamr, F., Voth, G. A., & Hurley, J. H. (2020c). A helical assembly of human ESCRT-I scaffolds reverse-topology membrane scission. Nature Structural & Molecular Biology, 27(6), 570–580. [CrossRef]
- Signes, A. , & Fernandez-Vizarra, E. (2018). Assembly of mammalian oxidative phosphorylation complexes I–V and supercomplexes. Essays in Biochemistry, 62(3), 255–270. [CrossRef]
- 59) Stroud, D. A. , Surgenor, E. T. ( 538(7623), 123–126. [CrossRef]
- Seo, H. G. , Kim, H. B., Kang, M. J., Ryum, J. H., Yi, E. C., & Cho, J. W. (2016). Identification of the nuclear localisation signal of O-GlcNAc transferase and its nuclear import regulation. Scientific Reports, 6(1). [CrossRef]
- Stiburek, L. , Cesnekova, J. ( 23(6), 1010–1023. [CrossRef] [PubMed]
- Anjum, R. , & Blenis, J. (2008). The RSK family of kinases: emerging roles in cellular signalling. Nature Reviews Molecular Cell Biology, 9(10), 747–758. [CrossRef]
- Lyly, A. , Von Schantz, C., Heine, C., Schmiedt, M., Sipilä, T., Jalanko, A., & Kyttälä, A. (2009). Novel interactions of CLN5 support molecular networking between Neuronal Ceroid Lipofuscinosis proteins. BMC Cell Biology, 10(1). [CrossRef]
- Nagasawa, H. , Uto, Y., Sasaki, H., Okamura, N., Murakami, A., Kubo, S.,... & Hori, H. (2005). Gc protein (vitamin D-binding protein): Gc genotyping and GcMAF precursor activity. Anticancer research, 25(6A), 3689-3695.
- Henderson, N. C. , & Sethi, T. (2009). The regulation of inflammation by galectin-3. Immunological Reviews, 230(1), 160–171. [CrossRef]
- Buhrke, T. , Lengler, I., & Lampen, A. (2011). Analysis of proteomic changes induced upon cellular differentiation of the human intestinal cell line Caco-2. Development Growth & Differentiation, 53(3), 411–426. [CrossRef]
- Sleat, D. E. , Donnelly, R. J., Lackland, H., Liu, C., Sohar, I., Pullarkat, R. K., & Lobel, P. (1997). Association of Mutations in a Lysosomal Protein with Classical Late-Infantile Neuronal Ceroid Lipofuscinosis. Science, 277(5333), 1802–1805. [CrossRef]
- Weinlich, G. , Eisendle, K., Hassler, E., Baltaci, M., Fritsch, P. O., & Zelger, B. (2006). Metallothionein – overexpression as a highly significant prognostic factor in melanoma: a prospective study on 1270 patients. British Journal of Cancer, 94(6), 835–841. [CrossRef]
- Khatter, H. , Myasnikov, A. ( 520(7549), 640–645. [CrossRef] [PubMed]
- Bruneel, A. , Labas, V., Mailloux, A., Sharma, S., Royer, N., Vinh, J., Pernet, P., Vaubourdolle, M., & Baudin, B. (2005). Proteomics of human umbilical vein endothelial cells applied to etoposide-induced apoptosis. PROTEOMICS, 5(15), 3876–3884. [CrossRef]
- Hoyaux, D. , Boom, A., Van Den Bosch, L., Belot, N., Martin, J., Heizmann, C. W., Kiss, R., & Pochet, R. (2002). S100A6 Overexpression within Astrocytes Associated with Impaired Axons from Both ALS Mouse Model and Human Patients. Journal of Neuropathology & Experimental Neurology, 61(8), 736–744. [CrossRef]
- Gotoh, T. , Terada, K., Oyadomari, S., & Mori, M. (2004). hsp70-DnaJ chaperone pair prevents nitric oxide- and CHOP-induced apoptosis by inhibiting translocation of Bax to mitochondria. Cell Death and Differentiation, 11(4), 390–402. [CrossRef]
- Stark, J. L. , Mehla, K., Chaika, N., Acton, T. B., Xiao, R., Singh, P. K., Montelione, G. T., & Powers, R. (2014). Structure and function of human DNAJ homologue subfamily A member 1 (DNAJA1) and its relationship to pancreatic cancer. Biochemistry, 53(8), 1360–1372. [CrossRef]
- Wei, J. , Alfajaro, M. M., DeWeirdt, P. C., Hanna, R. E., Lu-Culligan, W. J., Cai, W. L., Strine, M. S., Zhang, S., Graziano, V. R., Schmitz, C. O., Chen, J. S., Mankowski, M. C., Filler, R. B., Ravindra, N. G., Gasque, V., De Miguel, F. J., Patil, A., Chen, H., Oguntuyo, K. Y.,... Wilen, C. B. (2020). Genome-wide CRISPR screens reveal host factors critical for SARS-COV-2 infection. Cell, 184(1), 76-91.e13. [CrossRef]
- Chen, L. , Liu, Y., Xu, Y., Afify, S. M., Gao, A., Du, J., Liu, B., Fu, X., Liu, Y., Yan, T., Zhu, Z., & Seno, M. (2022). Up-regulation of Dsg2 confered stem cells with malignancy through wnt/β-catenin signaling pathway. Experimental Cell Research, 422(1), 113416. [CrossRef]
- Beishline, K. , & Azizkhan-Clifford, J. (2014). Sp1 and the ‘hallmarks of cancer.’ FEBS Journal, 282(2), 224–258. [CrossRef]
- Cheng, F. , Huang, H., Yin, S., Liu, J., & Sun, P. (2024). Expression and functional implications of YME1L in nasopharyngeal carcinoma. Cell Death and Disease, 15(6). [CrossRef]
- Bose, S. , Zhang, C., & Le, A. (2021). Glucose metabolism in cancer: the Warburg Effect and beyond. Advances in Experimental Medicine and Biology, 3–15. [CrossRef]
- Bensaad, K. , Tsuruta, A., Selak, M. A., Vidal, M. N. C., Nakano, K., Bartrons, R., Gottlieb, E., & Vousden, K. H. (2006). TIGAR, A P53-Inducible regulator of glycolysis and apoptosis. Cell, 126(1), 107–120. [CrossRef]
- Wanka, C. , Steinbach, J. P., & Rieger, J. (2012). Tp53-induced Glycolysis and Apoptosis Regulator (TIGAR) Protects Glioma Cells from Starvation-induced Cell Death by Up-regulating Respiration and Improving Cellular Redox Homeostasis. Journal of Biological Chemistry, 287(40), 33436–33446. [CrossRef]
- Yu, H. , Xie, J., Li, B., Sun, Y., Gao, Q., Ding, Z., Wu, H., & Qin, Z. (2015). TIGAR regulates DNA damage and repair through pentosephosphate pathway and Cdk5-ATM pathway. Scientific Reports, 5(1). [CrossRef]
- Li, Y. , Luo, S. ( 75(7), 1191–1196. [CrossRef]
- Skvortsov, A. N. , Ilyechova, E. V. ( 451, 131093. [CrossRef]
- Zheng, S. , Zhao, D., Hou, G., Zhao, S., Zhang, W., Wang, X., Li, L., Lin, L., Tang, T., & Hu, Y. (2022). iASPP suppresses Gp78-mediated TMCO1 degradation to maintain Ca2+ homeostasis and control tumor growth and drug resistance. Proceedings of the National Academy of Sciences, 119(6). [CrossRef]
- Zhang, H. , Chen, Z. J. ( 23(3), 1010. [CrossRef]
- Kang, M. , & Su, Z. (2023). Increased expression of GIPC2 in colon adenocarcinoma is associated with a favorable prognosis and high levels of immune cell infiltration. Oncology Reports, 49(4). [CrossRef]
- Baker, S. J. , Poulikakos, P. I., Irie, H. Y., Parekh, S., & Reddy, E. P. (2022). CDK4: a master regulator of the cell cycle and its role in cancer. Genes & Cancer, 13, 21–45. [CrossRef]
- Xu, H. , Zhou, W., Zhang, F., Wu, L., Li, J., Ma, T., Cao, T., Lian, C., Xia, J., Wang, P., Ma, J., & Li, Y. (2021). PDS5B inhibits cell proliferation, migration, and invasion via upregulation of LATS1 in lung cancer cells. Cell Death Discovery, 7(1). [CrossRef]
- Lu, H. , Zhu, M. ( 14(19), 4875. [CrossRef]
- Mancini, M. , Magnani, E., Macchi, F., & Bonapace, I. M. (2021). The multi-functionality of UHRF1: epigenome maintenance and preservation of genome integrity. Nucleic Acids Research, 49(11), 6053–6068. [CrossRef]
- Kostyrko, K. , Román, M., Lee, A. G., Simpson, D. R., Dinh, P. T., Leung, S. G., Marini, K. D., Kelly, M. R., Broyde, J., Califano, A., Jackson, P. K., & Sweet-Cordero, E. A. (2023). UHRF1 is a mediator of KRAS driven oncogenesis in lung adenocarcinoma. Nature Communications, 14(1). [CrossRef]
- Kaida, A. , Yamamoto, S. ( 40(31), 5013–5025. [CrossRef]

Table 1.
DLS and zeta potential values of green and colloidal AgNPs in water and DMEM.
| DLS in water | Zeta potential | |
| Colloidal AgNPs | 21 ± 3 nm | -23 ± 2 mV |
| Green AgNPs | 36 ± 5 nm | -30 ± 6 mV |
| DLS in DMEM | Zeta potential in DMEM | |
| Colloidal AgNPs | 28 ± 3 nm | -32 ± 5 mV |
| Green AgNPs | 38 ± 7 nm | -41 ± 6 mV |
Table 2.
The list of the proteins from the three primary mechanisms have dysregulations in the melanoma cells to the treatment of Green AgNPs.
Table 2.
The list of the proteins from the three primary mechanisms have dysregulations in the melanoma cells to the treatment of Green AgNPs.
| Group | Protein | Gene | Comparison | log2FC | Adj.pvalue | Fold Change | |
|---|---|---|---|---|---|---|---|
| DNJA1 | DNAJA1 | GrAg24_to_GrAg48 | 0.52 | 0.015 | 1.44 | ||
| Oncogene | |||||||
| CDK4 | CDK4 | GrAg24_to_GrAg48 | 0.96 | 0.032 | 1.94 | ||
| PDS5B | PDS5B | GrAg24_to_GrAg48 | 1.36 | 0.037 | 2.57 | ||
| HMGB1 | HMGB1 | GrAg24_to_GrAg48 | 1.39 | 2.82E-04 | 2.61 | ||
| UHRF1 | UHRF1 | GrAg24_to_GrAg48 | 1.4 | 0.015 | 2.64 | ||
| TMCO1 | TMCO1 | GrAg24_to_GrAg48 | 1.41 | 0.035 | 2.66 | ||
| GIPC2 | GIPC2 | GrAg24_to_GrAg48 | 1.49 | 0.039 | 2.81 | ||
| CD123 | CDC123 | GrAg24_to_GrAg48 | 1.94 | 0.029 | 3.83 | ||
| PTBP3 | PTBP3 | GrAg24_to_WT | -1.6 | 0.018 | 0.33 | ||
| SP1 | SP1 | GrAg24_to_WT | -2.4 | 4.28E-04 | 0.19 | ||
| DSG2 | DSG2 | GrAg24_to_WT | -2.91 | 0.018 | 0.13 | ||
| YMEL1 | YME1L1 | GrAg24_to_WT | -3.77 | 0.025 | 0.073 | ||
| GO:0019752 Carboxylic acid metabolic process | SYYC | YARS1 | GrAg24_to_GrAg48 | -0.41 | 0.013 | 0.75 | |
| ASNS | ASNS | GrAg24_to_GrAg48 | -0.78 | 0.015 | 0.58 | ||
| SYCC | CARS1 | GrAg24_to_GrAg48 | -0.70 | 0.015 | 0.61 | ||
| GFPT1 | GFPT1 | GrAg24_to_GrAg48 | -0.92 | 0.015 | 0.53 | ||
| ENOPH | ENOPH1 | GrAg24_to_GrAg48 | -0.94 | 0.015 | 0.52 | ||
| P5CR2 | PYCR2 | GrAg24_to_GrAg48 | -0.68 | 0.027 | 0.63 | ||
| OSBL1 | OSBPL1A | GrAg24_to_GrAg48 | -0.49 | 0.015 | 0.71 | ||
| SYAC | AARS1 | GrAg24_to_GrAg48 | -0.43 | 0.033 | 0.74 | ||
| ACY1 | ACY1 | GrAg24_to_GrAg48 | -0.77 | 0.032 | 0.59 | ||
| SYEP | EPRS1 | GrAg24_to_GrAg48 | -0.34 | 0.032 | 0.79 | ||
| GLYC | SHMT1 | GrAg24_to_GrAg48 | -0.90 | 0.033 | 0.54 | ||
| UGDH | UGDH | GrAg24_to_GrAg48 | -0.60 | 0.037 | 0.66 | ||
| DHE3 | GLUD1 | GrAg24_to_GrAg48 | -0.39 | 0.037 | 0.76 | ||
| MCCB | MCCC2 | GrAg24_to_GrAg48 | -0.42 | 0.048 | 0.75 | ||
| TIGAR | TIGAR | GrAg24_to_GrAg48 | -0.51 | 0.048 | 0.70 | ||
| DHB4 | HSD17B4 | GrAg24_to_GrAg48 | -0.53 | 0.037 | 0.69 | ||
| AK1C3 | AKR1C3 | GrAg24_to_GrAg48 | -0.90 | 0.048 | 0.53 | ||
| PCKGM | PCK2 | GrAg24_to_GrAg48 | -2.15 | 0.027 | 0.22 | ||
|
Copper homeostasis |
MT2 | MT2A | GrAg24_to_GrAg48 | -1.75 | 1.62E-04 | 0.30 | |
| MT1X | MT1X | GrAg24_to_GrAg48 | -3.79 | 1.62E-04 | 0.073 |
Disclaimer/Publisher’s Note: The statements, opinions and data contained in all publications are solely those of the individual author(s) and contributor(s) and not of MDPI and/or the editor(s). MDPI and/or the editor(s) disclaim responsibility for any injury to people or property resulting from any ideas, methods, instructions or products referred to in the content. |
© 2024 by the authors. Licensee MDPI, Basel, Switzerland. This article is an open access article distributed under the terms and conditions of the Creative Commons Attribution (CC BY) license (http://creativecommons.org/licenses/by/4.0/).
Copyright: This open access article is published under a Creative Commons CC BY 4.0 license, which permit the free download, distribution, and reuse, provided that the author and preprint are cited in any reuse.


