Preprint
Article

This version is not peer-reviewed.

Synergistic Effects of Green Nanoparticles on Antitumor Drug Efficacy in Hepatocellular Cancer

A peer-reviewed article of this preprint also exists.

Submitted:

23 January 2025

Posted:

24 January 2025

You are already at the latest version

Abstract

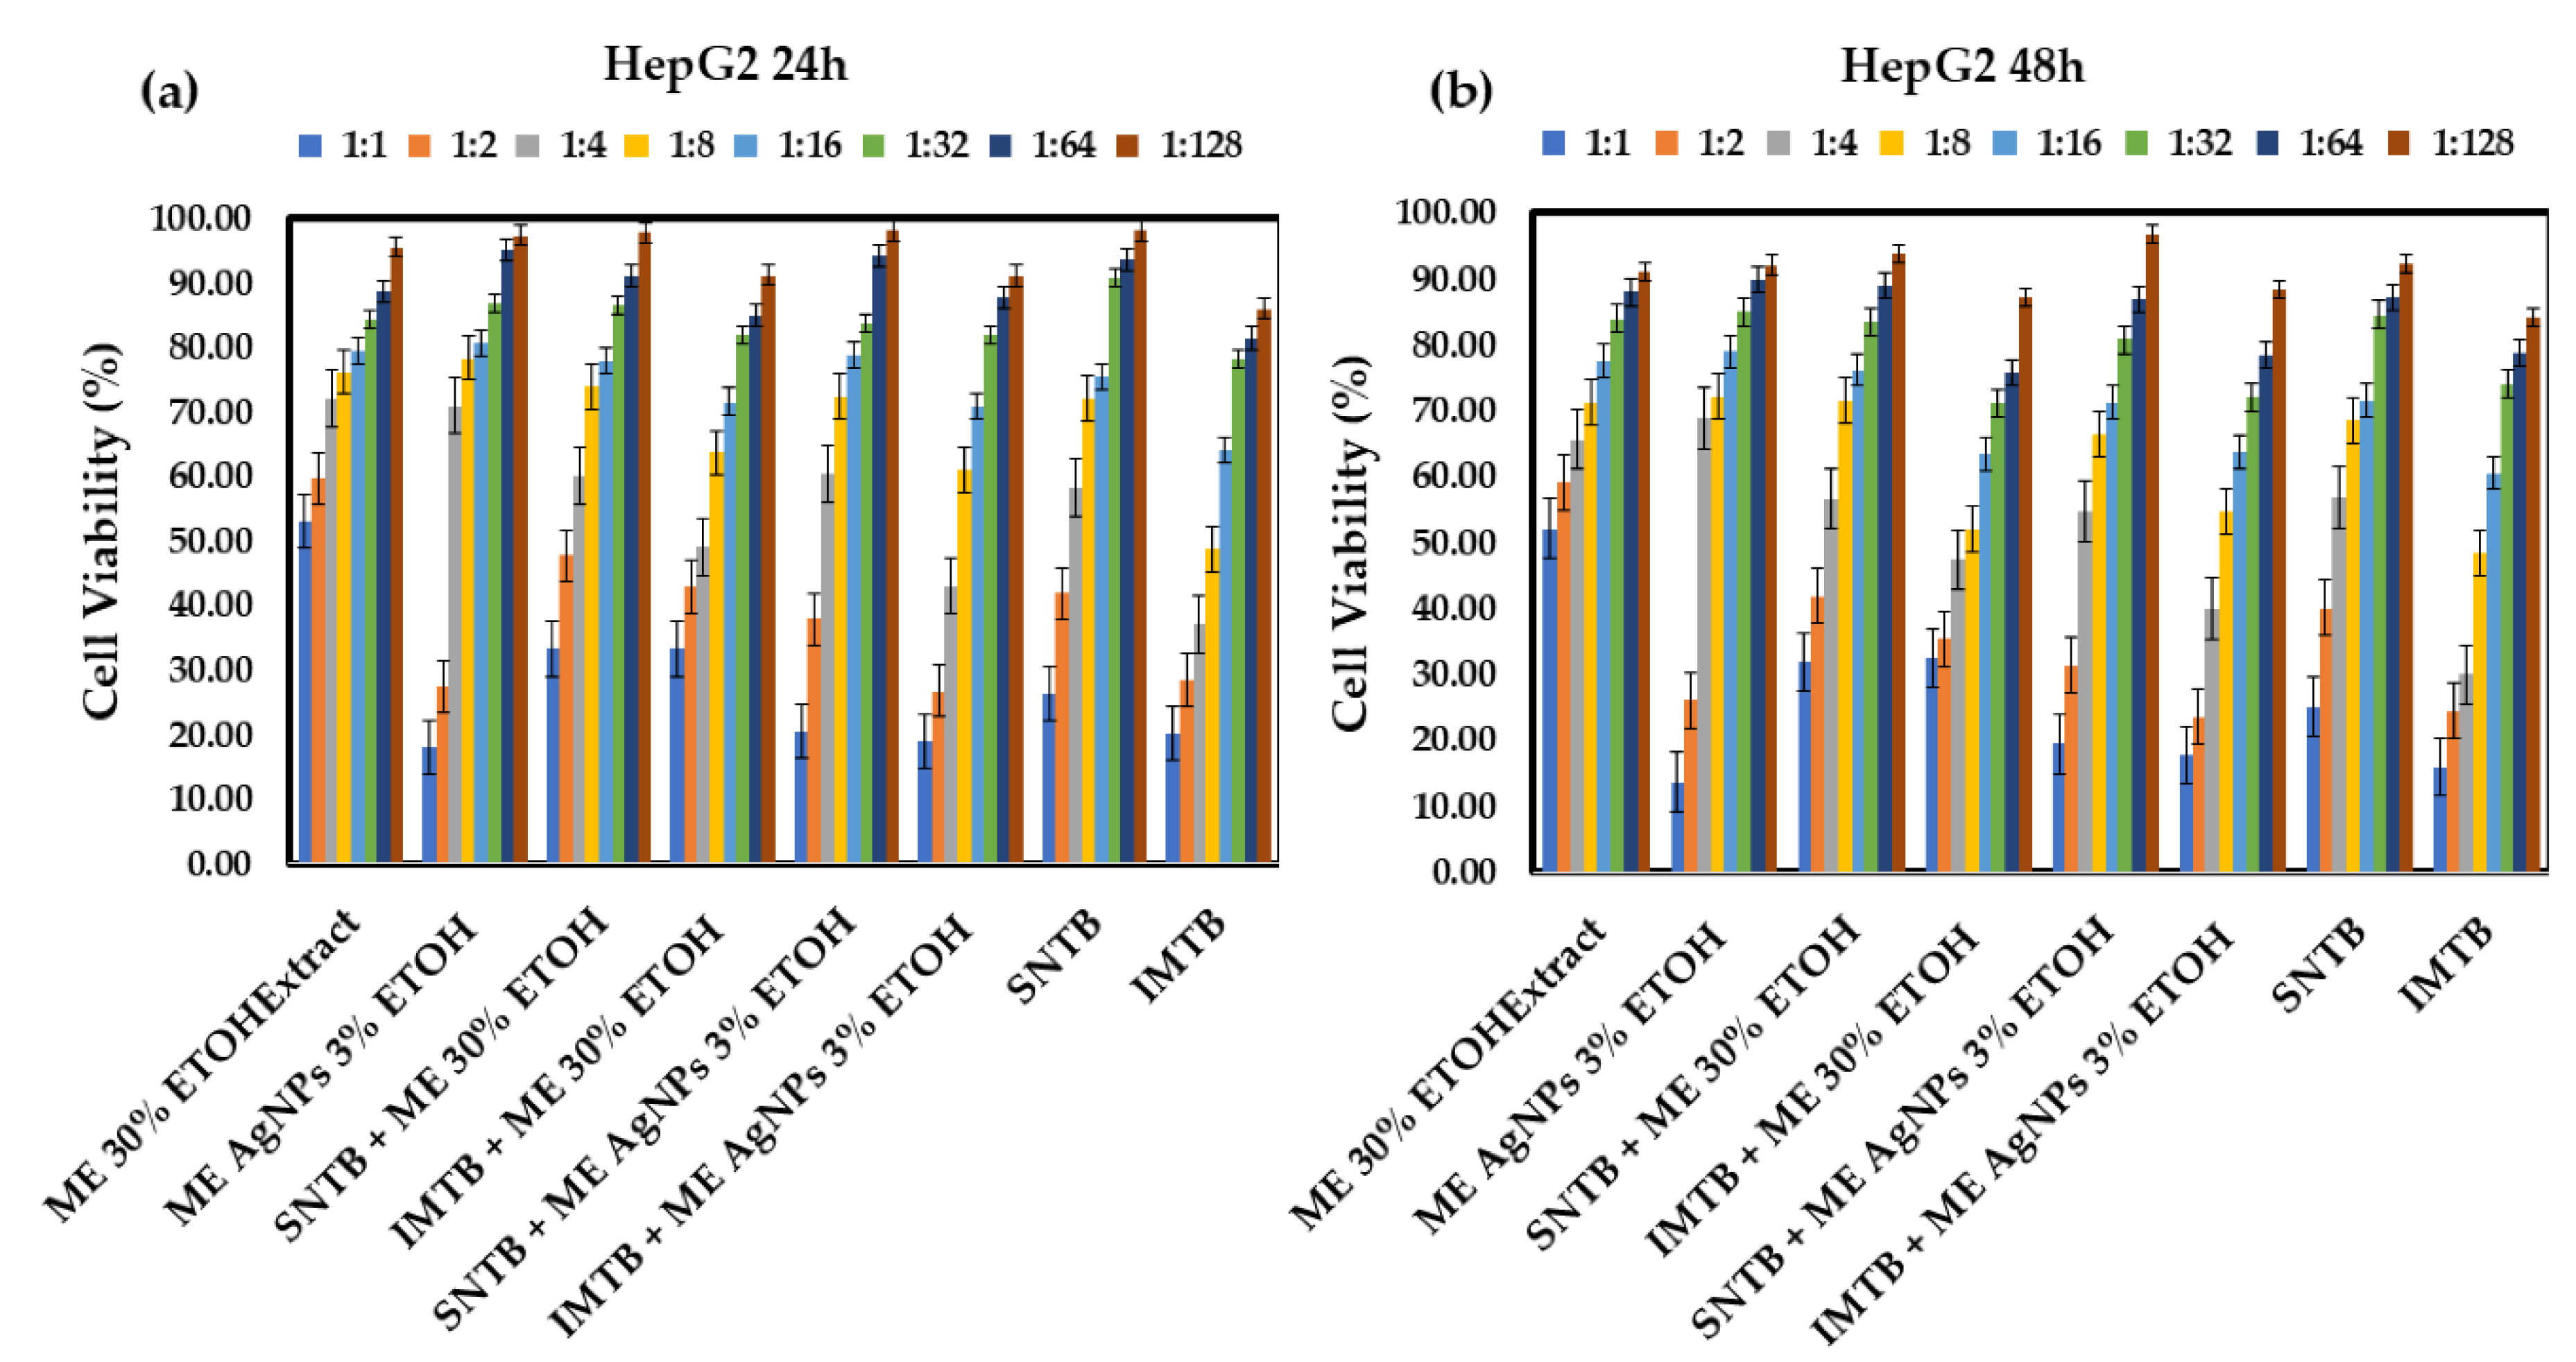
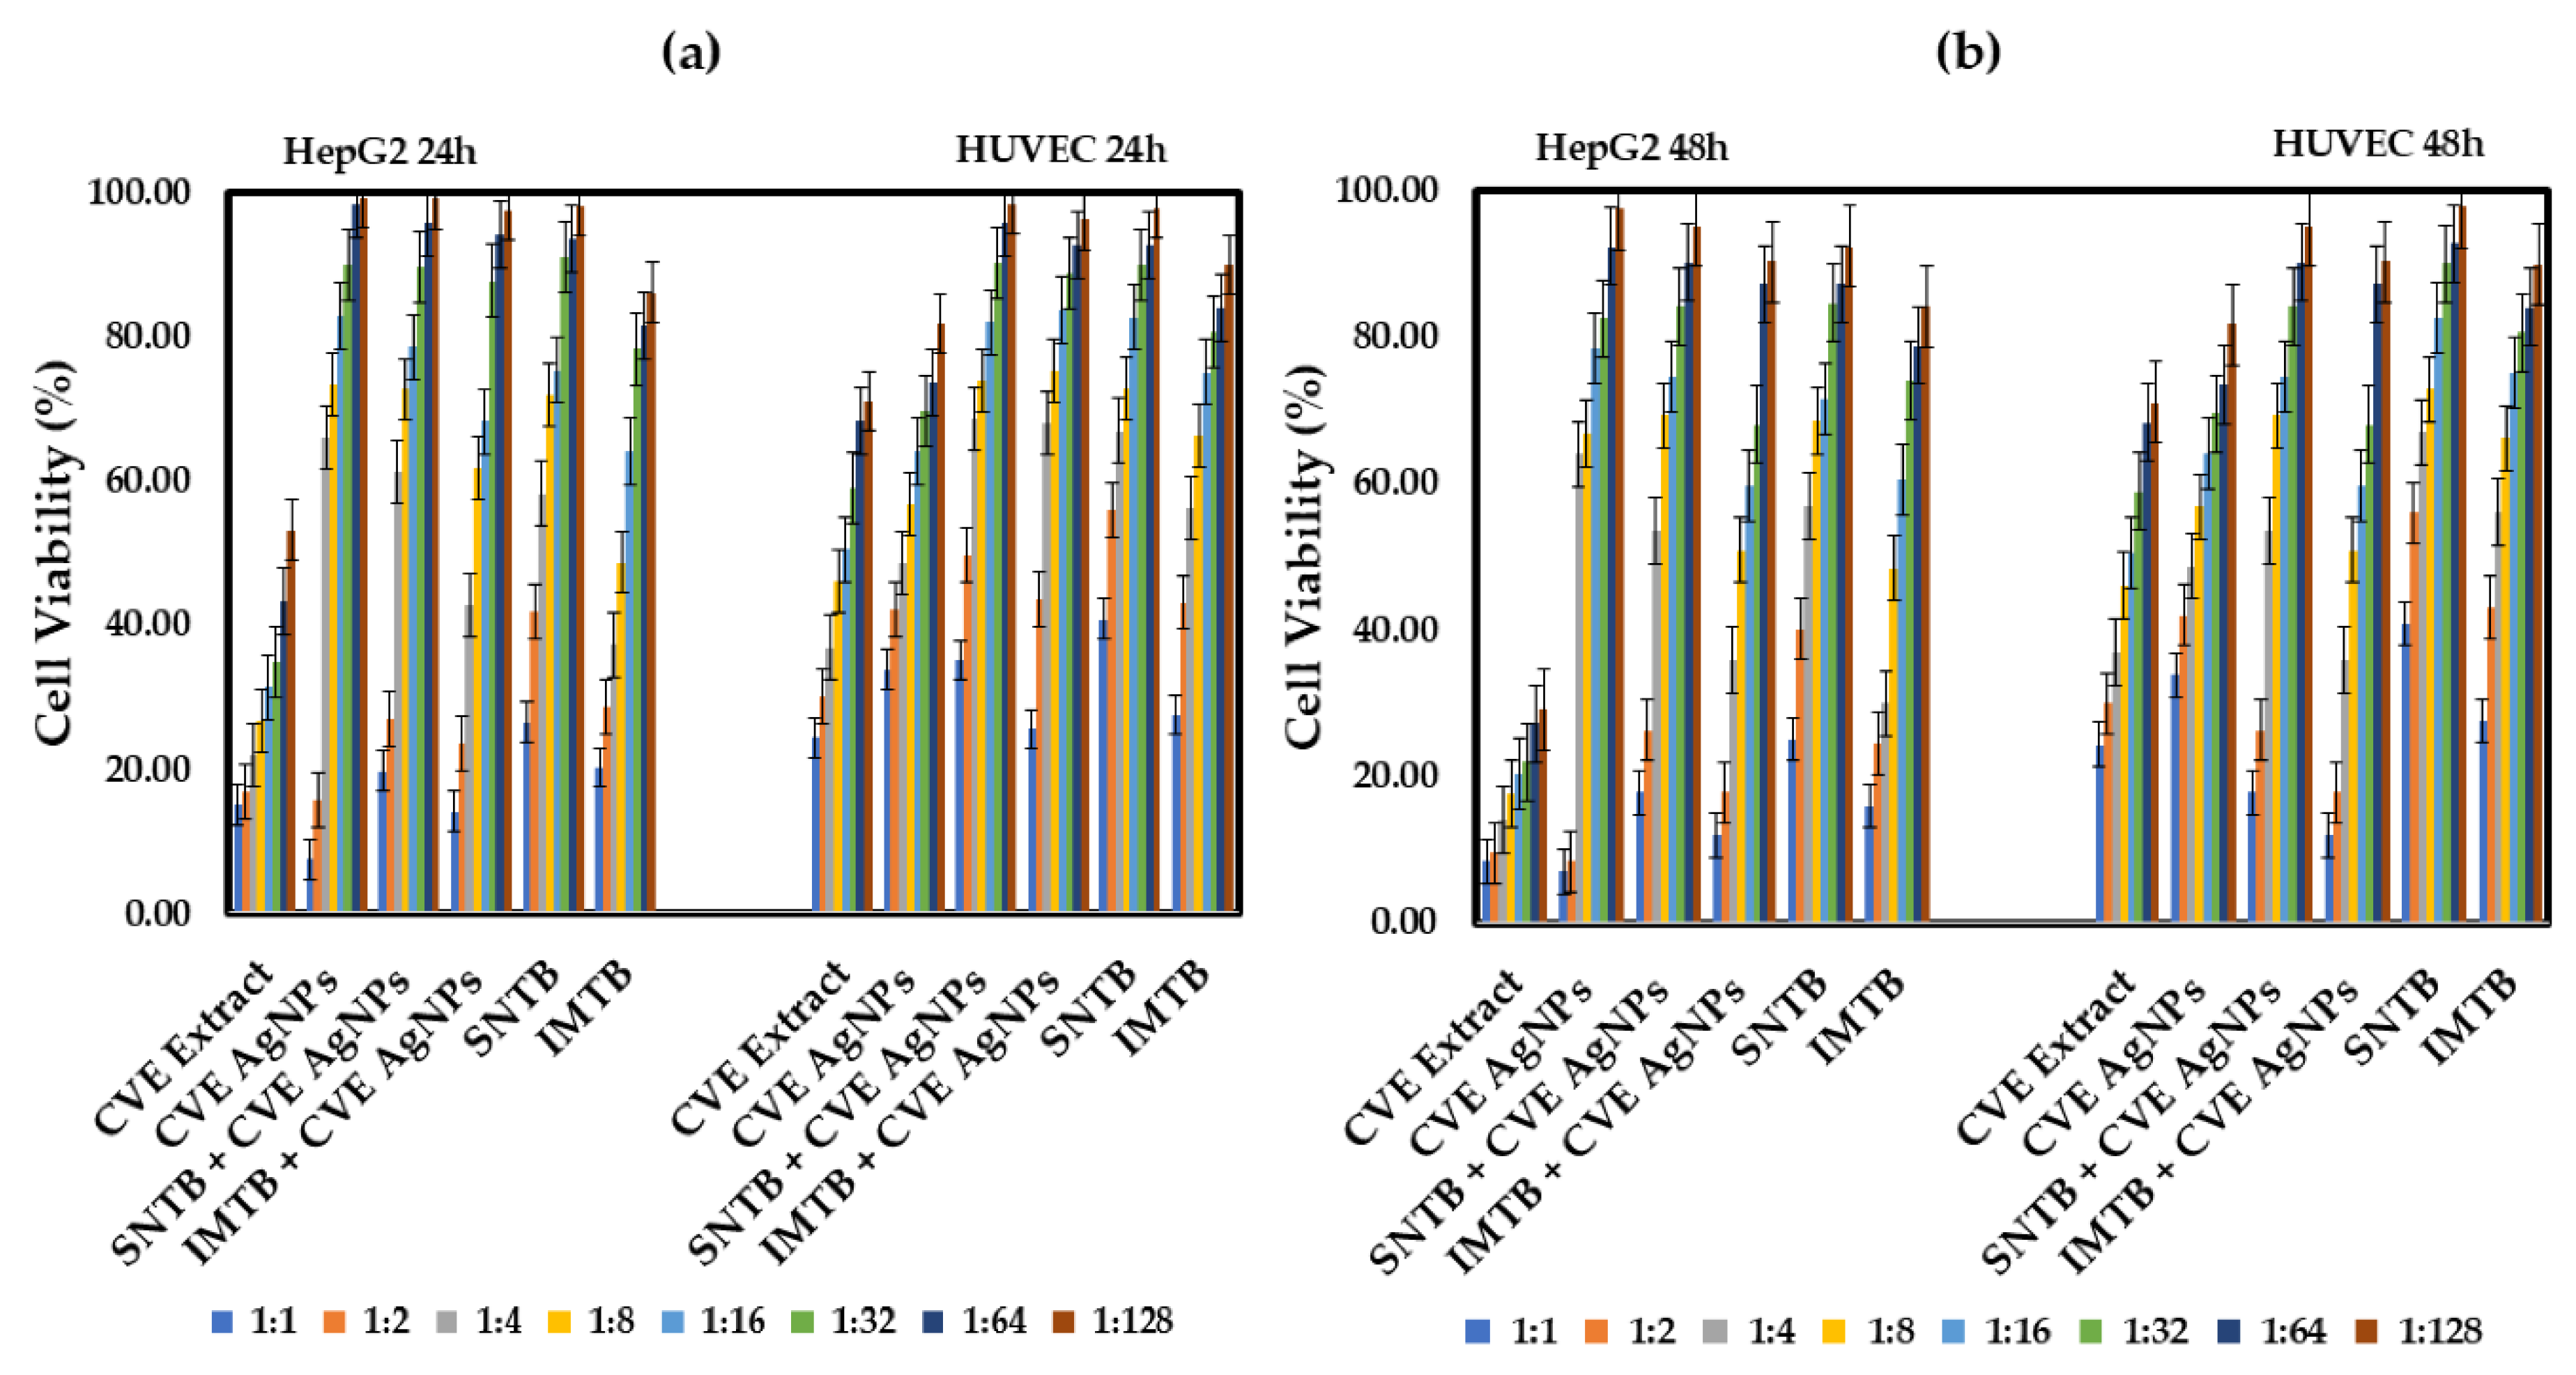
Cancer is one of the leading causes of mortality worldwide, and despite significant advances in treatment plans and drug development, survival prospects are still low, and treatment side effects are life altering. This article examines plant-derived extracts and their therapeutic potential against various types of hepatocellular carcinoma as a means of inducing fewer side effects compared to existing treatments. The focus is on the in vitro synergistic effect of silver bio-nanoparticles obtained from Clematis vitalba, Melissa officinalis, and Taraxacum officinale extracts (Clematis vitalbae extractum—CVE, Melissae extractum—ME, Taraxaci extractum—TE), alongside important drugs employed in liver cancer treatments (sunitinibSNTB and imatinibIMTB), and their effect on HepG2 cell lines (human hepatocellular carcinoma) and normal HUVEC cell lines (human umbilical vein endothelial cells). The nanoparticles (AgNPs) were characterized in terms of their dimensions, maximum absorption, and stability in solutions using techniques such as UV-Vis, DLS, zeta potential, and SEM. Meanwhile, antitumor effect was determined based on the viability of the HepG2 cells after 24 and 48 hours of treatment with each extract, mixtures of extracts with nanoparticles, and combinations of the extracts with antitumor drugs. Tests were repeated on the HUVEC cell line to determine normal cell toxicity. M. officinalis-derived silver nanoparticles (ME AgNPs) and the Clematis vitalba extract with silver nanoparticles (CVE AgNPs) significantly reduced HepG2 cell viability, enhancing efficacy when combined with conventional therapies (SNTB + ME AgNPs 1:1 vs SNTB: 20.01% vs 25.73% (p = 0.002), IMTB + ME AgNPs 1:1 vs IMTB: 17.80% vs 18.08% (p = 0.036); SNTB + CVE AgNPs 1:1 vs SNTB: 18.73% vs 25.73% (p = 0.000), SNTB + CVE AgNPs 1:2 vs SNTB: 26.62% vs 41.00% (p = 0.018), IMTB + CVE AgNPs 1:1 vs IMTB: 12.99% vs 18.08% (p = 0.001)). In contrast, the Taraxacum extract showed comparable cytotoxicity to its silver nanoparticles but did not exceed the efficacy of the extract alone after 24 hours. Of the three extracts, CVE demonstrated the most potent antitumor effect, resulting in an increase in the anticancer efficacy of the synthetic drug with remarkable therapeutic benefits in the fight against cancer. The findings of this study highlight the promising potential of plant-derived silver bio-nanoparticles to enhance the efficacy of conventional liver cancer treatments, paving the way for future research into more effective and less toxic therapeutic options.

Keywords: 
;  ;  ;  ;  ;  ;  ;  ;  ;  ;  

1. Introduction

Cancer, the second leading cause of mortality worldwide after cardiovascular diseases in developed nations, is characterized by the uncontrolled multiplication and spread of abnormal cells in the body. Today, cancer remains a significant challenge for pharmacology, despite major advances in treatment and drug development that have allowed more people to live longer, reaching ages where malignant tumors become common [1].
Although both benign and malignant tumors involve uncontrolled cell proliferation, malignant tumors are distinguished by their capacity for de-differentiation, invasiveness, and ability to metastasize. This behavior reflects altered gene expression patterns in cancer cells, resulting from acquired or inherited mutations [1].
Current anticancer drugs include hormones, protein kinase inhibitors, monoclonal antibodies, miscellaneous agents, and antiproliferative agents that damage DNA and trigger cell apoptosis by affecting cell division. Natural plant derivatives affecting microtubule function, including taxanes, Vinca alkaloids, and camptothecins, represent a specific therapeutic synthesis and have inspired the study of other plant-derived products as important sources of antitumor compounds [1]. Among these are alkaloids, phenolics, carotenoids, and flavonoids, which are highly researched for their wide range of medicinal properties, including antitumor activity against various cancer cell types [2,3,4,5].
The medical importance of plant-derived compounds is well recognized in oncology, especially as an alternative to the limitations of conventional drug therapies, which can involve severe toxicity, side effects, or even inefficacy due to the emergence of multi-drug resistance [6]. Several studies have highlighted the spectrophotometric evaluation of the polyphenolic profile, the antioxidant activity, and the anti-proliferative effects of dandelion extracts (Taraxacum officinale), noting their potential to inhibit the growth of various tumor cells in a dose-dependent manner [7,8,9]. However, the anticancer activity of dandelion remains anecdotal, requiring solid comparative studies with synthetic anticancer agents to substantiate its antitumor effects. Dandelion extracts have shown in previous studies the ability to exert anti-angiogenesis effects both in vivo and in vitro on hepatocellular carcinoma by suppressing the expression of VEGF and HIF-1α [10]. Additionally, they can inhibit proliferation, induce apoptosis, and cause cell cycle arrest in hepatocellular carcinoma cell lines such as HepG2 and Hs7, possibly through immunomodulation by increasing CD4+ T cell ratios and T cell infiltration in tumor tissues [11]. Investigations into the antiproliferative activity of methanolic extracts of dandelion root on cell viability of HepG2, MCF7, HCT116, and normal Hs27 cells have shown that they can activate and control the AMP protein kinase pathway [12]. Moreover, dandelion polysaccharides may also exert anticancer effects by inhibiting the PI3K/AKT/mTOR pathway and enhancing immune responses [13].
Melissa officinalis, or lemon balm, is widely used in traditional medicine and aromatherapy for its calming effects, though it has received less attention for its anticancer potential. Nevertheless, some papers have reported in vitro and in silico studies, phytochemical screening, and also its antioxidant, cytotoxic, and antiproliferative activities, suggesting high potential as a potent therapeutic agent [14,15]. The antiproliferative action of lemon balm has been studied for its chemopreventive effects against lung cancer [16], breast cancer [17], colon cancer [18], and against melanogenesis in murine melanocytes [19,20]. Furthermore, aqueous extracts of M. officinalis have demonstrated a significant impact on decreasing serum biomarkers of liver damage, showcasing in vivo antioxidant activity and hepatoprotective effects against diethyl nitrosamine-induced hepatocellular carcinoma in rats [21,22,23].
In addition to these plants, the aerial parts of Clematis vitalba (also known as traveller’s joy or old man’s beard) are traditionally used in European medicine to alleviate pain and fever due to their anti-inflammatory, antinociceptive, and antipyretic effects. The plant’s chemical composition, which includes saponins, coumarins, flavonoids, anthocyanins, and alkaloids, aids in its use as a diuretic and in treating rheumatic pain [24,25]. Previous studies have highlighted its phytotoxicity, including its abilities to inhibit mitosis, induce apoptosis, and alter cell cycles [26]. Clematis vitalba’s potential antimicrobial activity has been researched, but its antitumor activity, especially in comparison with synthetic anticancer agents, remains unexplored [27].
Research into plant-synthesized nanoparticles or nanoformulations has introduced a new dimension to the study of plant-derived compounds for anticancer therapies [28,29]. For example, nanoparticles synthesized from Melissa officinalis and dandelion have demonstrated promising antitumor effects [30,31]. These nanoparticles exhibit enhanced bioavailability and targeted delivery, which can significantly improve therapeutic outcomes while minimizing side effects. However, the full potential of these nanoparticles, particularly when directly compared to existing synthetic anticancer agents, warrants further investigation. Additionally, there is currently no evidence of studies exploring the antitumor effects of nanoparticles derived from Clematis vitalba or the simultaneous antitumoral effects of synthetic anticancer drugs combined with silver nanoparticles from plants.
The aim of this study is to investigate the synergistic antitumor effects of plant-derived nanoparticles synthesized from Melissa officinalis and Clematis vitalba in conjunction with conventional hepatic anticancer drugs. Previous our studies have demonstrated the antitumoral activities of dandelion and their biogenic nanoparticles, revealing significant potential of these plants and their nanoparticles on several tumor lines, showing comparative toxicity with cisplatin and doxorubicin, two important chemotherapeutic agents used in the treatment of certain tumors [32]. In this study, the synthesized nanoparticles were examined for their synergistic effects alongside antitumoral medications for the treatment of liver cancer. Sunitinib and Imatinib were selected as synthetic anticancer drugs used as a reference in this study because they are potent, new-generation molecules that act as tyrosine kinase inhibitors with substantial antitumor activity in different types of cancer, even in some refractory metastatic carcinomas or advanced unresectable hepatocellular carcinoma [33,34,35,36,37]. Although both have an apparently identical mechanism of action, such anticancer drugs have different activation sites (sunitinib is a pan-kinase inhibitor; imatinib is a BCR-Abl tyrosine kinase inhibitor), which justifies their selection as control drugs in this study precisely as a result of their particular specificity.
The study evaluates their combined impact on the viability, proliferation, and apoptotic pathways in hepatocellular carcinoma cells in comparison to their effects on normal hepatic cells. Through this research, we assess the potential enhancement in therapeutic efficacy and reduction of adverse effects, paving the way for innovative treatment strategies in liver cancer therapy.

2. Materials and Methods

2.1. Plant Materials and Plant Extracts Preparation

Fresh leaves of Melissa officinalis L. were collected from Dâmboviţa County, from a cultivated culture, in May 2024. Flowers and leaves of Taraxacum officinale L. and Clematis vitalba L. were harvested from Argeș County in July 2024. The plants were identified and authenticated in the Pharmaceutical Laboratory at Titu Maiorescu University, Faculty of Pharmacy, Bucharest.
Plants were dried at room temperature, in a shaded area, for 10 days and subsequently ground using a grinder. Extracts were prepared by refluxing 10 g of the dried plant material with 90 g of a 30% ethanol solution (w/w) for dandelion and lemon balm (30% ethanolic extracts) and water for Clematis sp. (aqueous extract) in a water bath for 30 minutes. The mixture was then filtered using filter paper, and the resulting extracts were stored in a refrigerator at 4°C [38].

2.2. Silver Nanoparticle Biosynthesis

For the synthesis of silver nanoparticles (AgNPs), begin by heating the magnetic plate and placing a beaker containing the 0.5 mM AgNO₃ (Sigma Aldrich, St. Louis, MO, USA) solution on it. Allow the solution to reach 60°C while maintaining continuous magnetic stirring. Begin adding the plant extracts from the cylinder using a Pasteur pipette at a rate of 45 drops per 30 seconds. Prepare Falcon tubes for sampling during the synthesis process. At each observed color change, approximately 2 mL of the sample is taken and placed into the appropriately labeled Falcon tubes for subsequent UV-Vis spectroscopic analysis of the maximum absorption characteristics associated with the formation of silver nanoparticles.

2.3. Physical-Chemical Characterization Methods of Nanoparticles

The absorption properties of AgNPs were assessed using a model U-0080D UV-Vis photodiode array spectrophotometer (Hitachi, Japan). The hydrodynamic diameter and surface charge of NP-Ag were analyzed using a Beckman Coulter Delsa Nano C equipped with dynamic light scattering (DLS) and electrophoretic light scattering (ELS) capabilities.
Time-dependent fluctuations of laser light intensity were generated by illuminating the nanoparticles with a dual 30 mW laser diode. Morphological investigation of the nanoparticles was conducted using a Nova NanoSEM 630, a field emission scanning electron microscope (FE-SEM) from FEI Company, USA, operating at an acceleration voltage of 10.0 kV and a magnification of 200 0000x.

2.4. Cytotoxicity Evaluation of Cell Cultures and Treatments - In Vitro Antitumoral Tests

The cytotoxic potential of the investigated plant extracts, their combination with nanoparticles, their combination with antitumor drugs, and anticancer drugs used as control groups (sunitinib and imatinib) was assessed on a standardized adherent human cancer cell line and compared to their effects on normal human endothelial cells, using the oncolytic drug commonly employed in cancer therapy as a benchmark. The human hepatic adenocarcinoma cell line (HepG2, HB-8065) and human umbilical vein endothelial cells (HUVEC, CRL-1730) were obtained from the American Type Culture Collection (ATCC, Manassas, Virginia, USA).
Sunitinib capsules 50 mg (Sunitinib® - Accord, Barcelona, Spain) and Imatinib tablets 100 mg (Imakrebin® – Alvogen, Luxembourg) were used as classic anticancer agents to treat the cell control groups. Working solutions were prepared fresh for each experiment through serial dilutions of stock solutions in the culture medium. Adherent cells were maintained in DMEM/F12 medium supplemented with 10% fetal bovine serum, 2 mM L-glutamine, 100 units/mL penicillin, and 100 μg/mL streptomycin (Sigma Aldrich, St. Louis, MO, USA). The cultures were incubated at 37°C in a humidified environment with 5% CO. Upon reaching approximately 60% confluence after 24 hours, the cells were treated with 100 μL of various concentrations of the test samples for 24 hours and 48 hours. Following treatment, cells were detached using a non-enzymatic PBS/1 mM EDTA solution, washed twice in PBS, and subsequently utilized in cytotoxicity assays. Untreated cells served as controls throughout the experiments.
  • MTS-Based Cytotoxicity Assay
Cell viability was assessed using the MTS-based colorimetric assay, CellTiter 96® AQueous One Solution Cell Proliferation Assay (Promega, Madison, USA). The experiments were conducted in triplicate using 96-well flat-bottom microtiter plates (Falcon, Teterboro, NJ, USA). This assay measures cell viability by quantifying the reduction of MTS, a yellow tetrazolium salt (MTS; Owen’s reagent), into a soluble colored formazan product by metabolically active cells [39]. A total of 1 × 10 cells per well were seeded in 100 μL of culture medium and incubated for 24 hours. Following incubation, the culture supernatants were removed, and the cells were exposed to increasing concentrations of the test drugs for 24 and 48 hours. After the treatment period, 20 μL of the reagent, containing (a) MTS [3-(4,5-dimethylthiazol-2-yl)-5-(3-carboxymethoxyphenyl)-2-(4-sulfophenyl)-2H-tetrazolium, inner salt] and (b) PES (phenazine ethosulfate), was added to each well. The plates were incubated for an additional 4 hours at 37°C with gentle agitation every 15 minutes. The reduction of MTS to formazan was quantified spectrophotometrically at a wavelength of 492 nm using a DYNEX Technologies MRS plate reader (Dynex, Pennsylvania, USA). The percentage of cell viability relative to untreated control cells (considered 100% viable) was calculated using the following formula:
C e l l   V i a b i l i t y % = a b s o r b a n c e   o f   t r e a t e d   c e l l s a b s o r b a n c e   o f   c u l t u r e   m e d i u m a b s o r b a n c e   o f   u n t r e a t e d   c e l l s a b s o r b a n c e   o f   c u l t u r e   m e d i u m × 100
The percentage of cell viability relative to untreated control cells was determined, and the results were reported as the mean ± standard deviation (SD) from experiments conducted in triplicate (n = 3).

2.5. Preparation of In Vitro-Tested Samples

For each of the three plant extracts studied (Taraxaci extractum—TE, Melissae extractum—ME, Clematis vitalbae extractum—CVE) prepared according to the procedure described in Section 2.1., successive serial dilutions of 1:1, 1:2, 1:4, 1:8, 1:16, 1:32, 1:64, and 1:128 in deionized water were carried out. Subsequently, the samples thus processed were subjected to the MTS cytotoxicity assay.
Also, samples with silver nanoparticles obtained according to the biosynthesis described in Section 2.2. were prepared in serial dilutions from 1:1, 1:2, 1:4, 1:8, 1:16, 1:32, 1:64 to 1:128 with deionized water.
Two control groups were used for the reference antitumor action, consisting of Sunitinib (SNTB) and Imatinib (IMTB). The control samples were prepared following the same preparation conditions for successive dilutions from 1:1 to 1:128 as those for test samples. Compared to the anticancer action of these two synthetic drugs used in clinical practice, all the cytotoxic results obtained for each plant extract, plant extract-nanoparticle combination, or plant extract ± nanoparticle-drug combination were reported and compared.
All the abbreviations used in this study to define the treatments applied to HEPG2 and HUVEC cells are presented and explained below in Table 1 for Taraxaci extractum treatment groups, in Table 2 for Melissae extractum treatment groups, in Table 3 for Clematis vitalbae extractum treatment groups, and in Table 4 for control treatment groups.

2.6. Statistical Analysis

Statistical analysis was carried out using IBM SPSS Statistics Software Version 29.0.2.0 (20) (IBM Corporation, Chicago, IL, USA) in order to evaluate the statistically significant differences of the tested groups (TE-derived samples, ME-derived samples, and CVE-derived samples) between the control ones (SNTB and IMTB). The essential assumptions for the application of statistical tests (such as the continuity of variables, the normality and linearity of data, the absence of outliers, the homogeneity of variances, and the independence of observations) were evaluated for each set of experimental data before running the parametric statistical assays. Normality tests (Kolmogorov–Smirnov test and Shapiro–Wilk test), Levene’s test for the homogeneity of variances, and robust tests of equality of means (Welch t-test and Brown–Forsythe’s test) were implemented to assess and verify data analysis criteria [40,41,42,43]. When certain experimental datasets deviate from the normal distribution criteria or some mandatory assumptions are violated, a two-step transformation procedure is used for resistant datasets so that they become normally distributed and can be subjected to one-way analysis of variance (ANOVA), followed by post hoc tests. We chose to apply a modified version of the Games-Howell post hoc test instead of the Dunnett test, in which we were only interested in the differences between each treatment group and the control group, because we have unequal size groups with unequal variances (α < 0.05). All the results were expressed as means and standard deviations (mean ± SD) for at least three replications for each sample (n = 3). The chosen level of significance was set at 0.05, and the results were considered statistically significant when p < 0.05.

3. Results and Discussions

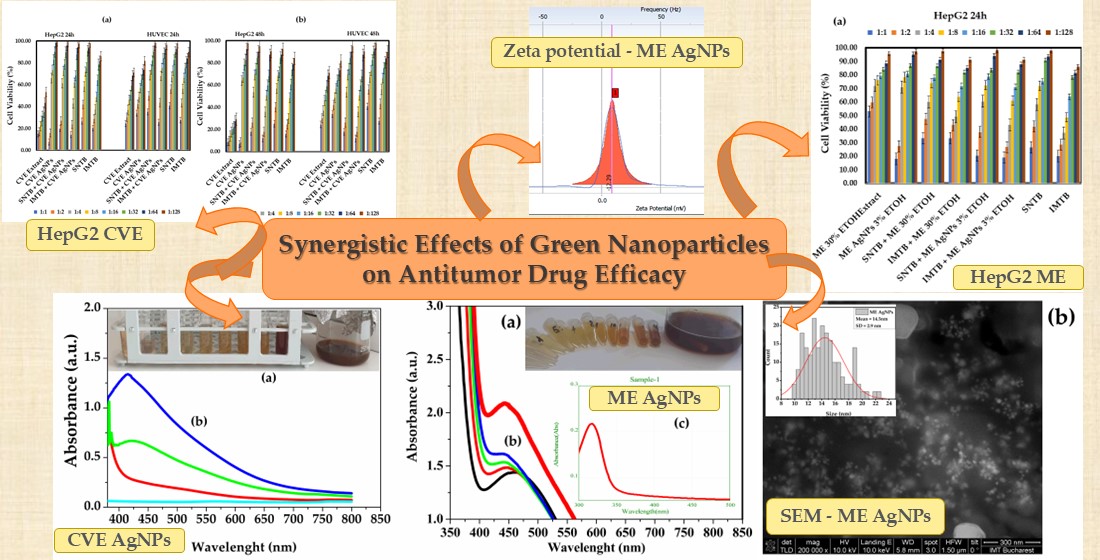
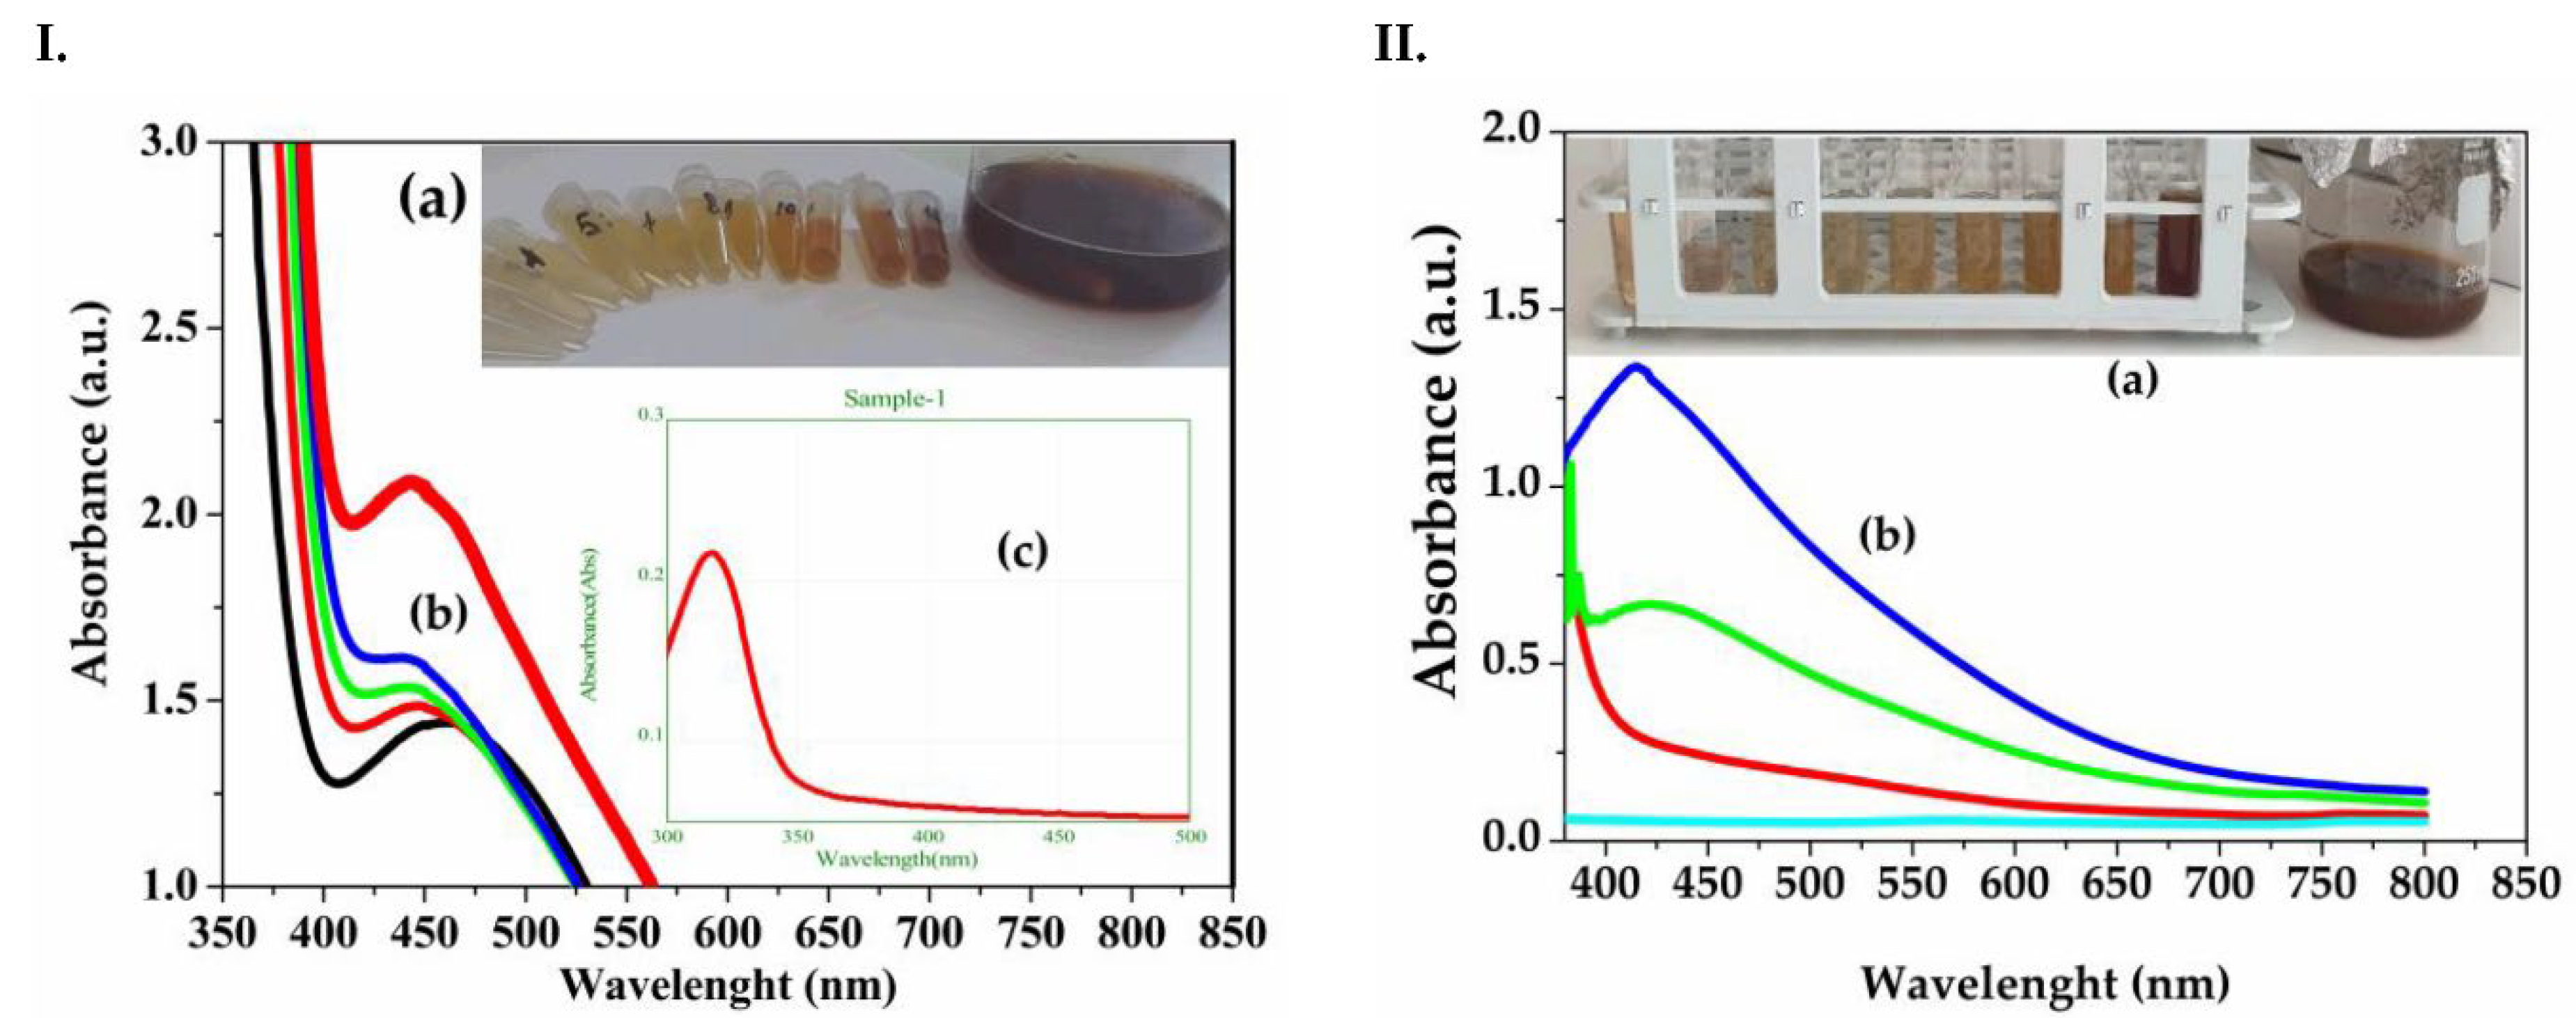
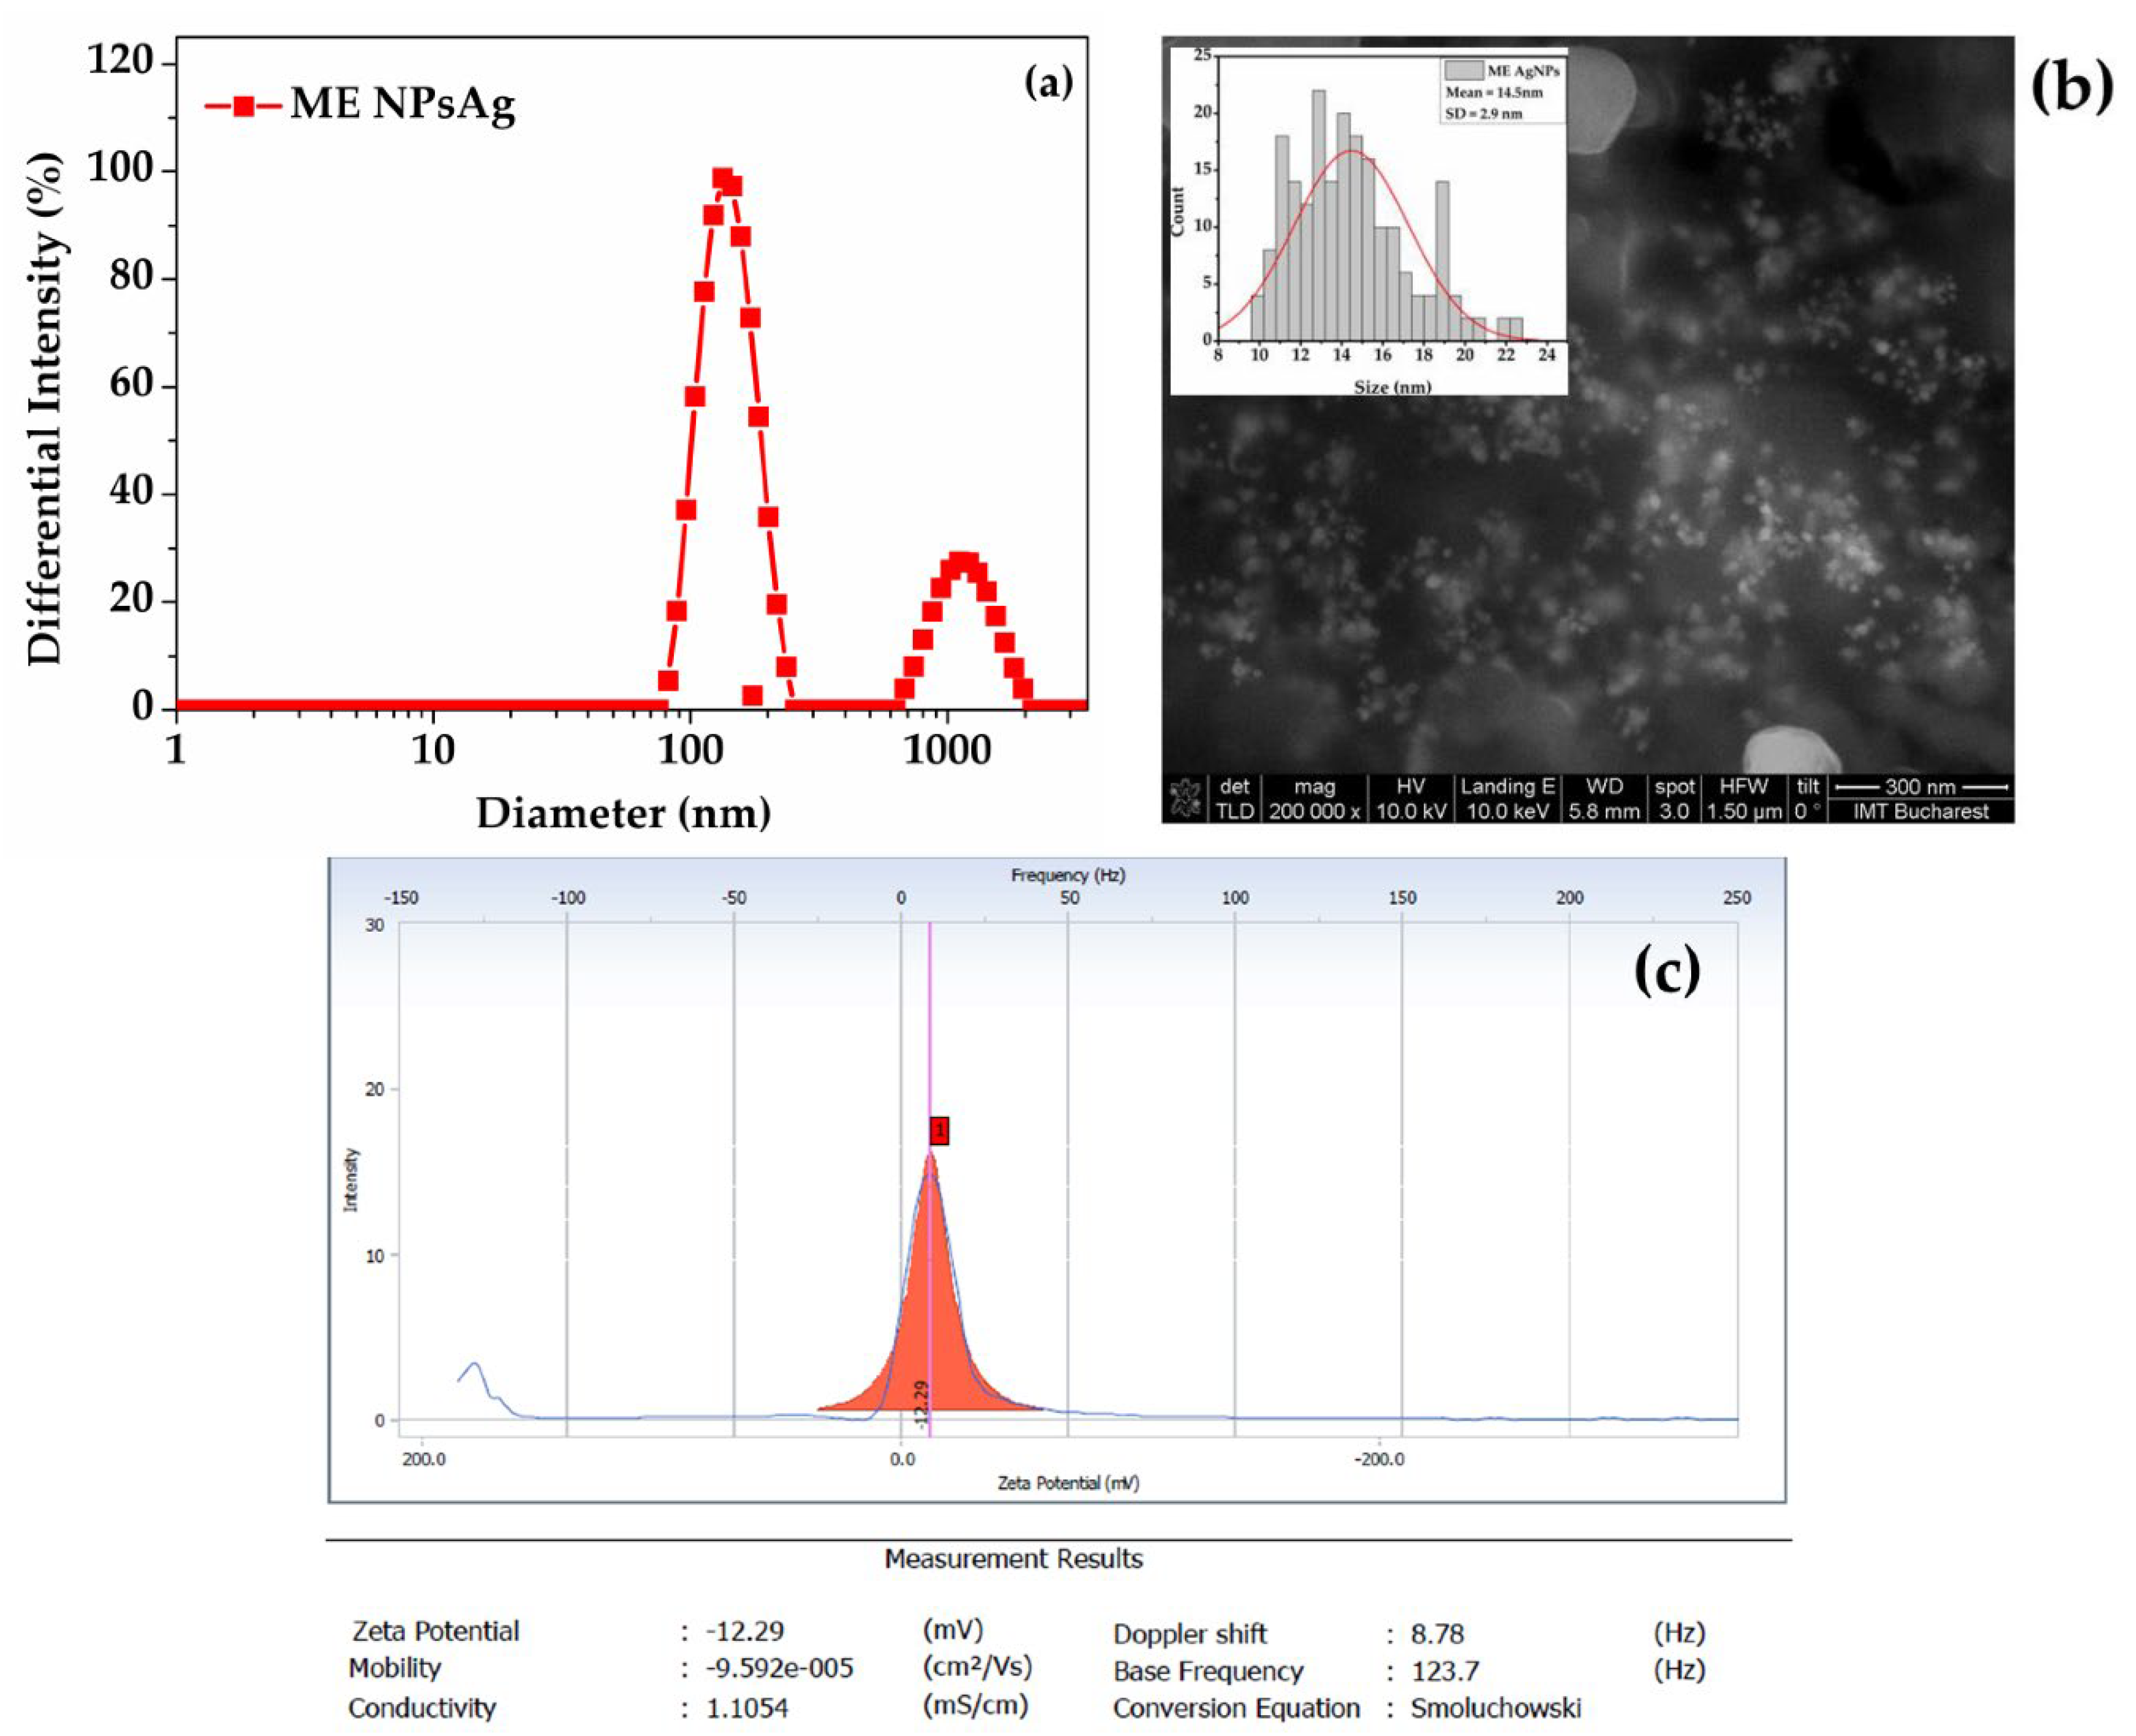
3.1. Physical-Chemical Nanoparticles Characterization

UV-VIS Spectrometry
Figures 1 I. and 1 II. showed the UV-Vis spectra for the recorded samples during the synthesis of silver nanoparticles (AgNPs) from Melissa officinalis (ME AgNPs) and Clematis vitalba (CVE AgNPs), respectively. The methods for obtaining the dandelion extract were previously presented in our study, with the maximum absorbance for dandelion silver nanoparticles synthesized at 462 nm by the ethanolic extract and 450 nm for AgNPs by the aqueous extract [32]. As seen in Figures 1a and 2a, there was a change in color from a brownish-red to a dark brown after mixing the AgNO3 solution with the extracts. This color change was attributed to the formation of silver nanoparticles. Additionally, the formation of the nanoparticles was confirmed by the appearance of absorption maxima with values between 400-460 nm for both syntheses. Figure 1b, regarding the formation of ME AgNPs, showed an initial absorption maximum of 453 nm, which then shifted to a lower value and stabilized at 440 nm after 30 minutes for ME AgNPs. The volume ratio between the 0.5 mM AgNO3 solution and the Melissa extract at the end of the synthesis was 3.2:1 (v:v). In the case of the formation of silver nanoparticles from Clematis vitalba, the absorption maximum eventually stabilized at a lower value of 413 nm. The lower values of the absorption maximum recorded for silver nanoparticles were correlated in the literature with smaller nanoparticle sizes [44]. Thus, for the silver nanoparticles from Clematis vitalba, smaller nanoparticle sizes were obtained compared to those from Melissa, though the volume added from the extract was slightly greater, with the ratio between the Ag salt and the Clematis extract being 2:1 (v:v).
  • Dynamic Light Scattering (DLS), Zeta Potential, and Scanning Electron Microscopy (SEM)
In this study, Dynamic Light Scattering (DLS), Electrophoretic Light Scattering (ELS), and Scanning Electron Microscopy (SEM) were employed to analyse the interactions of two types of biogenic silver nanoparticles in their colloidal final forms post-biosynthesis. Although the plant extracts were filtered prior to being used for nanoparticle biosynthesis, the nanoparticles themselves were not purified, leading to the possibility of larger extract particles remaining alongside the nanoparticles.
Figure 2(a) illustrates the intensity-based size distributions for silver nanoparticles synthesized using Melissa officinalis extracts (ME AgNPs). The size distribution profile revealed two populations of particles: a broad distribution ranging from 75 nm to 255 nm centered at 143 nm, and a larger size population cantered at 1108 nm, the latter attributed to larger particles from the Melissa officinalis extract. The SEM image of the colloidal solution with the nanoparticles and Melissa extract (Figure 2(b)), after dehydration, indicated that the nanoparticles were considerably smaller than those determined by DLS, suggesting that they were coated with extract negative charge compounds. This observation is corroborated by the stable negative zeta potential of -12.2 mV for the Melissa extract nanoparticles, as shown in Figure 2(c).
For the nanoparticles synthesized from Clematis vitalba, their very small size led to aggregation, confirmed by an increase in hydrodynamic diameter and consequently resulted in a negative but very low zeta potential, indicating instability in the resultant nanoparticle solution. Figure S1(a-c) in the Supplementary Materials presents the hydrodynamic diameter, SEM image with inset hystogram, and the recorded zeta potential for the silver nanoparticles derived from Clematis vitalba. The nanoparticles diameter of the CVE AgNPs and ME AgNPs was presented in Table 5.
The size distribution of samples CVE AgNPs and ME AgNPs was determined from SEM images by measuring approximately 200 nanoparticles per sample. The open-access program “ImageJ” was utilized to extract the necessary data from the SEM micrographs and generate the corresponding histograms. The nanoparticle sizes ranged from 6 nm to 18 nm for CVE AgNPs and 9 nm to 22 nm for ME AgNPs. These measurements were compiled into histograms, which were accurately modeled using Gaussian fitting to represent the distribution.
The Full Width at Half Maximum (FWHM) analysis revealed that the highest percentage of nanoparticles for CVE AgNPs fell within the size range of 9–13 nm (as it saw uin Figure S1, while for ME AgNPs, it was within 11–17 nm (inset of Figure 2(b)). The mean diameter of the nanoparticles was calculated to be 11.1 ± 1.9 nm for CVE AgNPs and 14.5 ± 2.9 nm for ME AgNPs, highlighting a slightly larger size distribution for the ME AgNPs sample. These findings provide a detailed characterization of the nanoparticle size distribution, essential for understanding their morphological and functional properties.

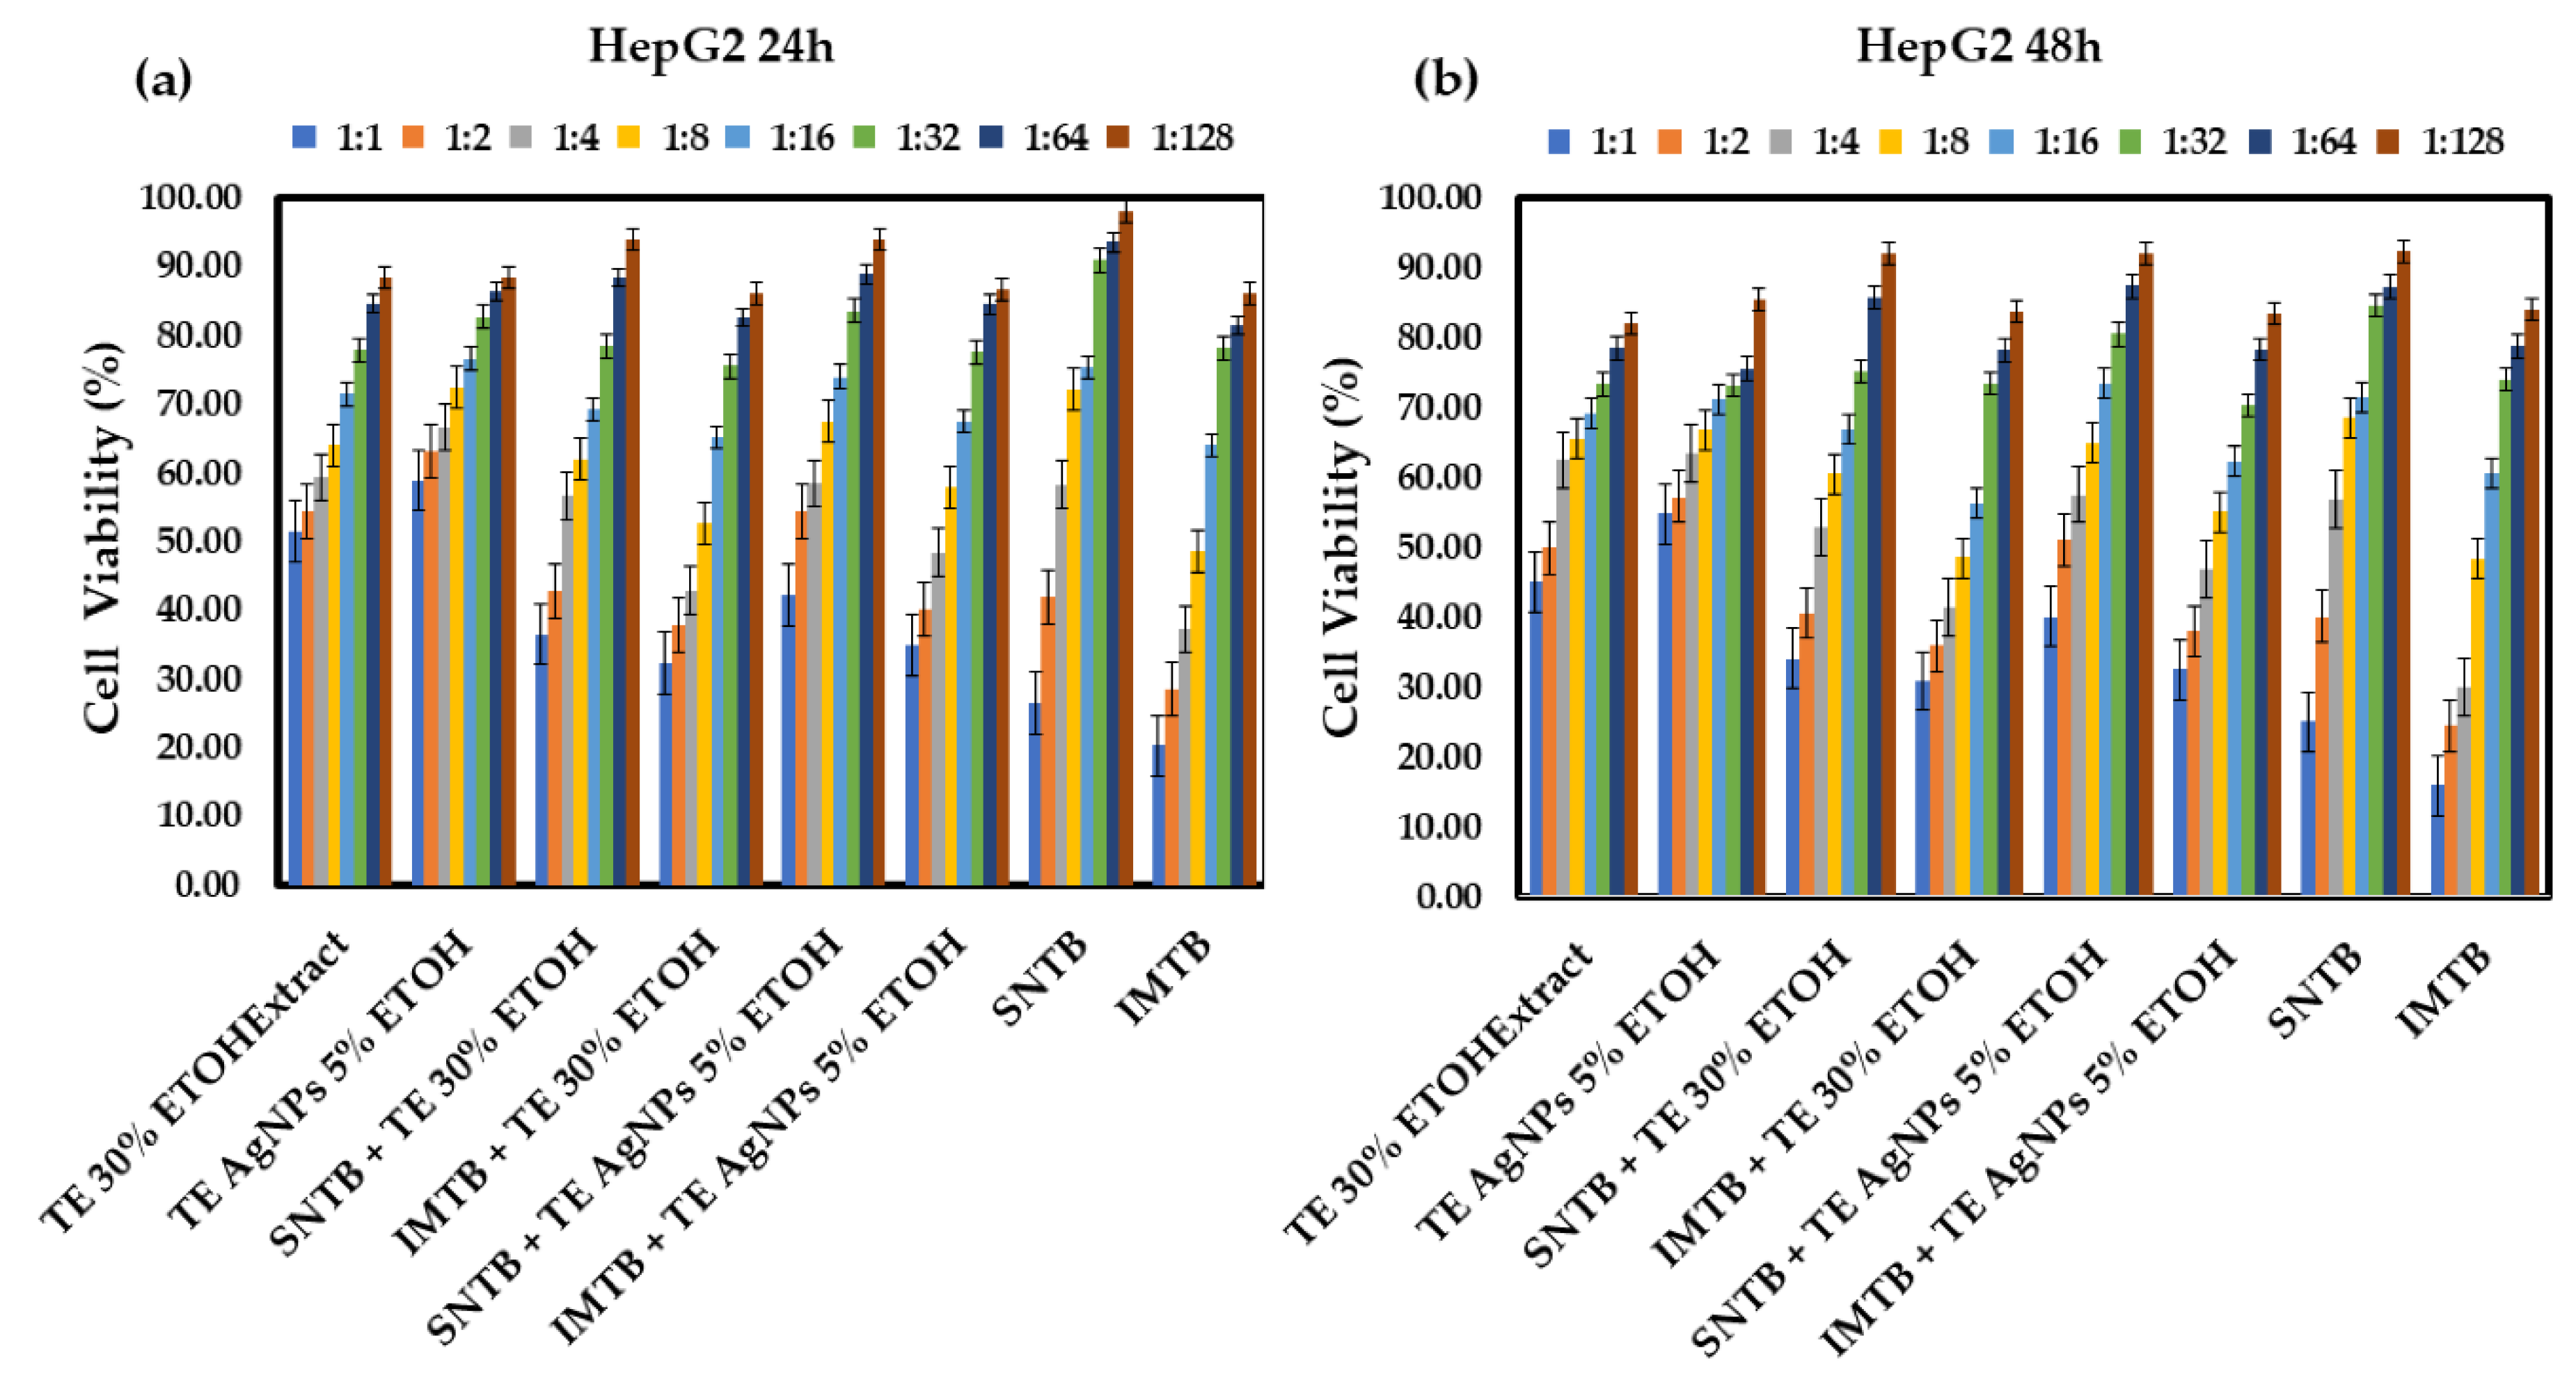
3.2. In vitro Antitumoral Studies

  • Taraxaci extractum (TE) - based samples
Figures 3(a) and 3(b) illustrate the cell viability in the treatment of the HepG2 liver tumor cell line with samples derived from dandelion after 24 hours and 48 hours. Different concentrations of treatments were applied to the HepG2 liver tumor cell line. Variation in values suggests differing treatment effectiveness based on concentration and time. Normality histograms and normal Q-Q plots for each TE group versus each control group on HepG2 cells are presented in Supplementary Materials Figures S2–S5.
At 24 hours, each treatment exhibits a range of values with varying intensities. The antitumor activity of all samples is evident, especially at dilutions up to a certain concentration. The medications demonstrate the strongest effect on liver tumor cells at this dilution. The combination of the 30% alcohol extract of dandelion demonstrates nearly the same cytotoxic effect as this combination with silver nanoparticles derived from dandelion (TE AgNPs). However, the addition of nanoparticles does not lead to an improvement in the antitumoral effect on the HepG2 hepatic cell line after 24 hours.
After 48 hours, the treatments appear to exhibit the same behavior; however, smaller dilutions become more effective, gradually demonstrating cytotoxicity against tumor cells over time. Nevertheless, the samples containing silver nanoparticles do not show any improvement in antitumor efficacy (p > 0.05), suggesting that this combination is less effective than conventional chemotherapeutic agents.
Although the results obtained for dandelion-based samples, compared to the control groups (sunitinib and imatinib), were not statistically significant, we can say that the viability of the liver tumor cells of the groups treated with TE AgNPs and synthetic drugs is very close to those obtained for the control groups.
Furthermore, the toxic effects of dandelion-derived samples on the normal HUVEC cell line were investigated. While a cytotoxic effect on hepatic tumor cells was clearly observed at both 24 and 48 hours, it is preferable that these samples do not exert toxic effects on normal HUVEC cells. The cytotoxic effect of dandelion-derived samples was also observed in HUVEC cells, similarly to chemotherapeutic drugs. However, a slight improvement in cell viability was noted when sunitinib was administered alongside silver nanoparticles, indicating that the toxicity of sunitinib on endothelial cells is mitigated by the addition of silver nanoparticles.
Silver nanoparticles biosynthesized from dandelion have been documented in several studies to possess antioxidant effects, thereby potentially protecting cells from oxidative stress induced by sunitinib [3]. The viability of HUVEC cells after 24- and 48-hours post-treatment with dandelion-based samples is presented in the Supplementary Materials Figure S6.
  • Melissae extractum (ME) - based samples
Studies indicate that the ethanolic extract of Melissa officinalis exhibits cytotoxic effects on colon and breast cancer cells, primarily through the induction of apoptosis and the generation of reactive oxygen species [4,5,17,18]. Additionally, its active compounds, particularly rosmarinic acid, contribute to antiproliferative and antimigratory effects, suggesting potential for chemoprevention in breast cancer and also in hepatocellular carcinoma [6,21]. Furthermore, the cytotoxic effect of this plant has also been demonstrated on the HepG2 cellular line, an effect that was concentration-dependent [23].
The treatments outlined in this study aim to utilize silver nanoparticles derived from Melissa officinalis, which have also been shown to play a significant role in inhibiting tumor cell proliferation, exhibiting a more potent effect than the extract alone. The combination of the alcoholic extract and biogenic silver nanoparticles obtained from Melissa officinalis (ME AgNPs) may enhance treatment efficacy and could be as effective, or even more effective, with minimal toxic effects on normal cells. Thus, the cytotoxic effect of the extracts derived from Melissa officinalis was evaluated after 24 hours and 48 hours post-treatment. Figures 4(a) and 4(b) present measurements of cell viability after 24 hours and, respectively, 48 hours of treatment with the extracts derived from Melissa officinalis, compared to the drugs administered alone.
At 48 hours, the antitumor effect is enhanced for the dilutions of silver nanoparticles from M. officinalis at ratios of 1:1 and 1:2 (ME AgNPs 1:1 and 1:2). Combination therapy with these medications potentiates their antitumor effect compared to the administration of the drugs alone.
In the case of M. officinalis nanoparticles added following treatment with medications, they demonstrate remarkable efficacy at the first and second dilutions, proving to be even more potent than the chemotherapeutic agents, sunitinib and imatinib.
In Table 6 and Table 7, the statistically significant results obtained compared to the control group can be identified (SNTB + ME AgNPs 1:1 vs SNTB (p = 0.002) and IMTB + ME AgNPs 1:1 vs IMTB (p = 0.036)). So, the established antitumor effect of M. officinalis is enhanced when it is formulated as a colloidal solution of silver nanoparticles resulting from biosynthesis. Furthermore, other authors have observed in their studies the effectiveness of silver nanoparticles derived from M. officinalis on the HepG2 cell line, which induces apoptosis. According to their findings, the activation of apoptosis may be attributed to the excessive production of reactive oxygen species (ROS), thereby affecting the tumor cell DNA [45].
Among the two drugs, sunitinib exhibits a weaker antitumor effect (25.73% HepG2 cell viability) compared to imatinib (18.08% HepG2 cell viability). When used in combination with nanoparticles, the antitumor efficacy surpasses that of the drugs administered alone (SNTB + ME AgNPs 1:1 vs SNTB: 20.01% vs 25.73% (p = 0.002) and IMTB + ME AgNPs 1:1 vs IMTB: 17.80% vs 18.08% (p = 0.036)).
A slight increase in the proliferation of normal cells is observed compared to the administration of the drugs alone at low dilutions when combinations with nanoparticles are employed. This also confirms findings related to dandelion, where the combination with silver nanoparticles reduces the toxicity of the medications over normal cells, HUVEC.
Normality histograms and normal Q-Q plots for each ME group versus each control group on HepG2 cells are presented in Supplementary Materials Figures S7–S10.
Statistically significant differences compared to the control group (SNTB or IMTB) were detected for ME AgNPs administered alone: ME AgNPs 1:1 vs SNTB (p = 0.003), ME AgNPs 1:2 vs SNTB (p = 0.022), and ME AgNPs 1:1 vs IMTB (p = 0.028). However, the nanoparticles alone (ME AgNPs) exhibit the highest toxicity at elevated concentrations, becoming toxic to normal HUVEC cells as well. The toxicity towards normal cells manifests at high concentrations and when only extracts combined with the medications are administered. The cytotoxicity of the combination of drugs and nanoparticles against tumor cells is significantly greater than that of the drugs alone at all lower dilutions (1:4), while the toxicity towards normal cells decreases with dilution.
One possible reason for the potent inhibitory effects of M. officinalis on HepG2 cells could be that AgNPs reduce adenosine triphosphate (ATP) content in the cells by damaging mitochondria, which, in turn, increases the production of reactive oxygen species (ROS) in a dose-dependent manner. The anticancer effect of silver nanoparticles might also be attributed to their small size (< 15 nm) and the doping of secondary metabolites, such as phenols or flavonoids, on their surface, leading to mitochondrial damage, increased ROS production, and apoptosis.
Cell viability (%) of the HUVEC cell line measured for samples derived from M. officinalis was presented in the Supplementary Materials Figure S11.
  • Clematis vitalbae extractum (CVE) - based samples
Figures 5(a) and 5(b) illustrate the cellular viability following treatment of HepG2 cells with samples derived from the species Clematis vitalba. Numerous studies on Clematis species have identified constituents such as flavonoids, triterpenoid saponins, lignans, steroids, polyphenols, and coumarins [24,46,47]. Notably, several compounds, particularly flavonoids and alkaloids, exhibit substantial evidence of biological significance [48]. Among the three extracts analyzed, Clematis vitalba demonstrated the most pronounced cytotoxicity against the HepG2 hepatic cell line. This cytotoxic effect persisted for 24 hours and for 48 hours even at the greatest dilution of 1:128. Furthermore, when combined with silver nanoparticles (CVE AgNPs), the cytotoxicity was reduced but still remained statistically significant (p < 0.05) at the initial two dilutions (1:1 and 1:2).
It is important to highlight that the cytotoxicity of the C. vitalba extract on HUVEC cells was observed at a lower magnitude. However, normal cellular proliferation was unaffected at higher dilutions—dilutions at which the extract effectively inhibited the proliferation of hepatic tumor cells.
An additional noteworthy finding was that both the extract and the derived samples, including nanoparticles and their combination with drugs, exhibited a more potent antitumor effect compared to the administration of synthetic drugs alone, especially at dilutions up to 1:2 or 1:4 as seen in Table 8 and Table 9. Furthermore, the proliferation of the normal HUVEC cell line was not as significantly impacted by these treatments as it was by the conventional drugs used for liver cancer treatment, up to the aforementioned dilution level.
All applied treatment groups were compared separately against the 2 control groups (sunitinib - SNTB and imatinib - IMTB), and therefore the statistical analysis confirms our observations, because statistical significance (p < 0.05) was achieved during post hoc tests as follows: CVE 1:1 vs SNTB (p = 0.004), CVE 1:2 vs SNTB (p = 0.010), CVE 1:4 vs SNTB (p = 0.035), CVE AgNPs 1:1 vs SNTB (p = 0.005), CVE AgNPs 1:2 vs SNTB (p = 0.005), SNTB + CVE AgNPs 1:1 vs SNTB (p = 0.000), and SNTB + CVE AgNPs 1:2 vs SNTB (p = 0.018). These concrete results highlight the fact that both CVE (1:1, 1:2, 1:4) and CVE AgNPs (dilution 1:1 and 1:2) determined a significant decrease in the viability of HepG2 tumor cells compared to the synthetic chemotherapeutic drug sunitinib. Between the CVE extract and the CVE extract combined with silver nanoparticles, CVE AgNPs 1:1 showed a more significant cytotoxic effect, inducing a decrease in tumor cell viability of approximately 7.25% compared to CVE 1:1, where the decrease in viability was 11.71%. Thus, the antitumor effect was much more potent than that observed in the control group treated only with sunitinib in the highest 1:1 concentration, where cell viability was 25.73%. In addition, the cytotoxic activity of CVE amplifies as the exposure time of HepG2 cells increases from 24 hours to 48 hours, especially for the 1:1, 1:2, and 1:4 dilutions, regardless of whether it is the CVE extract, the combination with nanoparticles, or the association with the reference drug. Normality histograms and normal Q-Q plots for each CVE group versus each con-trol group on HepG2 cells are presented in Supplementary Materials Figures S12–S15.
Similar significant results were also highlighted after the comparison with the control group treated only with imatinib, as follows: CVE 1:1 vs IMTB (p = 0.023), CVE AgNPs 1:1 vs IMTB (p = 0.011), CVE AgNPs 1:2 vs IMTB (p = 0.028), and IMTB + CVE AgNPs 1:1 vs IMTB (p = 0.001). The CVE 1:2 influence on hepatic tumor cell viability compared to the IMTB control we considered to be on the edge of significance, although the p-value exceeds the established significance threshold (p = 0.066 > 0.05), because it is known that the statistical significance is higher when the p-value is closer to the alpha value, so this very narrow approach may show that Clematis vitalbae extractum 1:2 can bring statistically significant therapeutic benefits in medical research against tumor cells.
It can be noted that the association of CVE AgNPs nanoparticles diluted 1:1 and 1:2 together with classic antitumor drugs like sunitinib or imatinib causes a statistically significant decrease in the viability of HepG2 cells, much lower compared to that evaluated in the control group treated only with the synthetic drug (SNTB + CVE AgNPs 1:1 vs SNTB: 18.73% vs 25.73% (p = 0.000), SNTB + CVE AgNPs 1:2 vs SNTB: 26.62% vs 41.00% (p = 0.018), IMTB + CVE AgNPs 1:1 vs IMTB: 12.99% vs 18.08% (p = 0.001)).
Therefore, it can be stated that the addition of CVE AgNPs 1:1 and 1:2 to the reference antitumor drug causes a synergistic effect, resulting in an increase in the anticancer efficacy of the synthetic drug with remarkable therapeutic benefits in the fight against cancer.

4. Conclusions

From the experiments, it was confirmed that the co-administration of sunitinib and silver nanoparticles improved HUVEC cell viability, suggesting a protective effect against toxicity. All three extracts exhibited antitumoral potential, with their combination with silver nanoparticles eliciting varying degrees of success. The combination of TE with AgNPs performed poorly when compared to the 30% alcohol extract when used on HepG2 cell lines, displaying no significant effect on their viability. Moreover, dandelion-derived samples exhibited cytotoxic effects on normal HUVEC cells, similar to those of the control chemotherapeutic drugs. On the other hand, ME significantly enhanced the antitumor efficacy against HepG2 cell lines. The marked reduction in cell viability due to the synergistic effects of AgNPs and these drugs underscores the potential of ME as a complementary approach in cancer treatment, particularly in reducing the side effects associated with conventional therapies. Finally, CVE, particularly in combination with AgNPs, significantly reduced the viability of HepG2 cells, with its increasing effect with the passage of time cementing it as the most potent of the tested extracts, further supporting its therapeutic promise in cancer treatment, especially when used alongside conventional agents.
Although cancer as a disease remains a massive challenge for future generations of researchers, real therapeutic progress can be seen. Of the recent advances in drug therapy, the tyrosine kinase inhibitors have arguably been the most innovative advances, and their combination therapies with plant extract silver nanoparticles could bring significant insights into treatment antitumoral options.
Future research should focus on elucidating the specific mechanisms underlying the enhanced efficacy of these extracts and their respective nanoparticles. Furthermore, clinical studies will be necessary to assess the feasibility of integrating these natural products into existing cancer treatment regimens, potentially revolutionizing the approach to chemotherapy by minimizing side effects and improving patient outcomes.

Supplementary Materials

The following supporting information can be downloaded at the website of this paper posted on Preprints.org. Figure S1: (a) DLS measurements of CVE AgNPs; (b) SEM images of CVE AgNPs; (c) Zeta potential measurements for CVE AgNPs; Figure S2: Normality histogram for TE groups vs Sunitinib control group on HepG2 cells; Figure S3: Normal Q-Q plot for TE groups vs Sunitinib control group on HepG2 cells; Figure S4: Normality histogram for TE groups vs Imaitinib control group on HepG2 cells; Figure S5: Normal Q-Q plot for TE groups vs Imatinib control group on HepG2 cells; Figure S6: Cell viability (%) of HUVEC lines after: (a) 24 hours of treatment with various dilutions of Taraxaci extractum - based samples and the chemotherapeutic drugs Sunitinib and Imatinib and (b) presents the same measurements after 48 hours of treatment; Figure S7: Normality histogram for ME groups vs Sunitinib control group on HepG2 cells; Figure S8: Normal Q-Q plot for ME groups vs Sunitinib control group on HepG2 cells; Figure S9: Normality histogram for ME groups vs Imatinib control group on HepG2 cells; Figure S10: Normal Q-Q plot for ME groups vs Imatinib control group on HepG2 cells; Figure S11: Cell viability (%) of HUVEC lines after: (a) 24 hours of treatment with various dilutions of Melissae extractum - based samples and the chemotherapeutic drugs Sunitinib and Imatinib and (b) presents the same measurements after 48 hours of treatment; Figure S12: Normality histogram for CVE groups vs Sunitinib control group on HepG2 cells; Figure S13: Normal Q-Q plot for CVE groups vs Sunitinib control group on HepG2 cells; Figure S14: Normality histogram for CVE groups vs Imatinib control group on HepG2 cells; Figure S15: Normal Q-Q plot for CVE groups vs Imatinib control group on HepG2 cells.

Author Contributions

Conceptualization, M.C.R., L.P., R.C.S., C.-M.M. and E.T.; methodology, M.C.R., L.P., M.M., R.C.S., C.-M.M., A.B., O.B., M.S. and E.T.; software, M.C.R., L.P., M.M., R.C.S., D.C., C.-M.M. and A.G.; validation, M.C.R., L.P., C.-M.M., M.L.G., M.Pa., C.-E.M., A.G. and E.T.; formal analysis, M.C.R., L.P., M.M., D.C., C.-M.M., A.B., O.B., M.S., F.D.U., E.A. and E.T.; investigation, M.C.R., L.P., M.M., D.C., A.B., M.S., M.Po. and E.T.; resources, M.C.R., L.P., M.M., D.C., C.-M.M., M.L.G., M.Pa., C.-E.M., E.A., M.Po. and E.T.; data curation, M.C.R., L.P., D.C., C.-M.M., O.B., A.G. and E.T.; writing—original draft preparation, M.C.R., L.P., D.C., C.-M.M., M.S. and E.T.; writing—review and editing, M.C.R., L.P., M.M., R.C.S., D.C., C.-M.M., M.L.G., M.Pa., F.D.U. and E.T.; visualization, M.C.R., L.P., M.M., R.C.S., D.C., C.-M.M., M.L.G., M.Pa., C.-E.M., A.B., O.B., M.S., A.G., F.D.U., E.A., M.Po. and E.T.; supervision, M.C.R., R.C.S., C.-M.M., F.D.U. and E.T.; project administration, M.C.R., L.P., M.M., R.C.S., D.C., C.-M.M., F.D.U. and E.T.; funding acquisition, M.C.R., R.C.S., D.C. and C.-M.M. All authors have read and agreed to the published version of the manuscript.

Funding

This work was co-funded under grant agreement No.101140192, project UNLOOC (Unlocking data content of Organ-On-Chips) and supported by the CHIPS Joint Undertaking and its members.

Institutional Review Board Statement

Not applicable.

Informed Consent Statement

Not applicable.

Data Availability Statement

The original contributions presented in the study are included in the article/Supplementary Material, further inquiries can be directed to the corresponding author/s.

Conflicts of Interest

The authors declare no conflicts of interest.

References

  1. Ritter J.M., Robinson E., Fullerton J., Flower R.J., Henderson G., Loke Y.K., MacEwan D. - Rang & Dale's Pharmacology, Tenth Edition, Elsevier eBooks, London, U.K., 2024; pp. 764–782.
  2. Cosme, P., Rodríguez, A. B., Espino, J., & Garrido, M. (2020). Plant phenolics: Bioavailability as a key determinant of their potential health-promoting applications. Antioxidants, 9(12), 1263. https://doi.org/10.3390/antiox9121263.
  3. Linnewiel-Hermoni, K., Khanin, M., Danilenko, M., Zango, G., Amosi, Y., Levy, J., & Sharoni, Y. (2015). The anti-cancer effects of carotenoids and other phytonutrients resides in their combined activity. Archives of biochemistry and biophysics, 572, 28-35. https://doi.org/10.1016/j.abb.2015.02.018.
  4. Habli, Z., Toumieh, G., Fatfat, M., Rahal, O. N., & Gali-Muhtasib, H. (2017). Emerging cytotoxic alkaloids in the battle against cancer: Overview of molecular mechanisms. Molecules, 22(2), 250. https://doi.org/10.3390/molecules22020250.
  5. Shrihastini, V., Muthuramalingam, P., Adarshan, S., Sujitha, M., Chen, J. T., Shin, H., & Ramesh, M. (2021). Plant derived bioactive compounds, their anti-cancer effects and in silico approaches as an alternative target treatment strategy for breast cancer: An updated overview. Cancers, 13(24), 6222. doi: 10.3390/cancers13246222.
  6. Dehelean, C. A., Marcovici, I., Soica, C., Mioc, M., Coricovac, D., Iurciuc, S., et al. (2021). Plant-derived anticancer compounds as new perspectives in drug discovery and alternative therapy. Molecules, 26(4), 1109. doi: 10.3390/molecules26041109.
  7. Costea, L., Ghica, M., Costea, T., & Gird, C. E. (2021). Spectrophotometric evaluation of flavonoids, phenolcarboxylic acids and total phenolic contents of several indigenous herbal products with potential hepatoprotective effect. Farmacia, 69(6). https://doi.org/10.31925/farmacia.2021.6.23.
  8. Costea, L., Chițescu, C. L., Boscencu, R., Ghica, M., Lupuliasa, D., Mihai, D. P., et al. (2022). The polyphenolic profile and antioxidant activity of five vegetal extracts with hepatoprotective potential. Plants, 11(13), 1680. https://doi.org/10.3390/plants11131680.
  9. Saratale, R. G., Benelli, G., Kumar, G., Kim, D. S., & Saratale, G. D. (2018). Bio-fabrication of silver nanoparticles using the leaf extract of an ancient herbal medicine, dandelion (Taraxacum officinale), evaluation of their antioxidant, anticancer potential, and antimicrobial activity against phytopathogens. Environmental Science and Pollution Research, 25, 10392-10406. https://doi.org/10.1007/s11356-017-9581-5.
  10. Ren, F., Wu, K., Yang, Y., Yang, Y., Wang, Y., & Li, J. (2020). Dandelion polysaccharide exerts anti-angiogenesis effect on hepatocellular carcinoma by regulating VEGF/HIF-1α expression. Frontiers in Pharmacology, 11, 460. https://doi.org/10.3389/fphar.2020.00460.
  11. Ren, F., Zhang, Y., Qin, Y., Shang, J., Wang, Y., Wei, P., et al. (2022). Taraxasterol prompted the anti-tumor effect in mice burden hepatocellular carcinoma by regulating T lymphocytes. Cell Death Discovery, 8(1), 264. https://doi.org/10.1038/s41420-022-01059-5.
  12. Rehman, G., Hamayun, M., Iqbal, A., Khan, S. A., Khan, H., Shehzad, A., et al. (2017). Effect of methanolic extract of dandelion roots on cancer cell lines and AMP-activated protein kinase pathway. Frontiers in pharmacology, 8, 875. https://doi.org/10.3389/fphar.2017.00875.
  13. Ren, F., Li, J., Yuan, X., Wang, Y., Wu, K., Kang, L., et al. (2019). Dandelion polysaccharides exert anticancer effect on Hepatocellular carcinoma by inhibiting PI3K/AKT/mTOR pathway and enhancing immune response. Journal of Functional Foods, 55, 263-274. https://doi.org/10.1016/j.jff.2019.02.034.
  14. Moacă, E. A., Farcaş, C., Ghiţu, A., Coricovac, D., Popovici, R., Cărăba-Meiţă, N. L., et al. (2018). A comparative study of Melissa officinalis leaves and stems ethanolic extracts in terms of antioxidant, cytotoxic, and antiproliferative potential. Evidence-Based Complementary and Alternative Medicine, 2018(1), 7860456. https://doi.org/10.1155/2018/7860456.
  15. Luță, E. A., Biță, A., Moroșan, A., Mihăiescu, D. E., Ghica, M., Mihai, D. P., et al. (2022). The influence of phytosociological cultivation and fertilization on polyphenolic content of Menthae and Melissae folium and evaluation of antioxidant properties through in vitro and in silico methods. Plants, 11(18), 2398. https://doi.org/10.3390/plants11182398.
  16. Mohammed A., Waleed A., Al-Khafaji K., Abid M.M, Kadhom M., Alhaydary E., Yousif E. - Comprehensive analysis of anticancer activities in Melissa officinalis extract: Gas chromatography profiling, biological assessment, network pharmacology, and molecular docking, 2025, Letters in Applied NanoBioScience, 14(1), 15. doi:10.33263/LIANBS141.012.
  17. Dehghan-Nayeri, N., Darvishi, M., Mashati, P., Rezapour-Kalkhoran, M., Rezaiefard, M., & Younesian, S. (2020). Comparison of cytotoxic activity of herbal extracts on the most commonly used breast cancer cell lines (MCF7 and SKBR3): A systematic review. Journal of Research in Pharmacy, 24(1), 1-22. https://doi.org/10.35333/jrp.2020.121.
  18. Encalada, M. A., Hoyos, K. M., Rehecho, S., Berasategi, I., de Ciriano, M. G. Í., Ansorena, D., et al. (2011). Anti-proliferative effect of Melissa officinalis on human colon cancer cell line. Plant Foods for Human Nutrition, 66, 328-334. https://doi.org/10.1007/s11130-011-0256-y.
  19. Jun, H. J., Roh, M., Kim, H. W., Houng, S. J., Cho, B., Yun, E. J., et al. (2011). Dual inhibitions of lemon balm (Melissa officinalis) ethanolic extract on melanogenesis in B16-F1 murine melanocytes: Inhibition of tyrosinase activity and its gene expression. Food science and biotechnology, 20, 1051-1059. doi: 10.1007/s10068-011-0143-1.
  20. Niu, C., & Aisa, H. A. (2017). Upregulation of melanogenesis and tyrosinase activity: Potential agents for vitiligo. Molecules, 22(8), 1303. https://doi.org/10.3390/molecules22081303.
  21. Shamseini, M., Mohammadi, M., Shirazi, F. H., Andalib, S., Gholami, S., Hosseini, S. H., et al. (2019). Prevention of liver cancer by standardized extract of Melissa officinalis L. in a rat model of hepatocellular carcinoma: Its potential role as a chemopreventive agent. International Pharmacy Acta, 2(1), 2e8-1. https://doi.org/10.22037/ipa.v2i1.23970.
  22. Yoo, G., Kim, M., Randy, A., Son, Y. J., Hong, C. R., & Nho, C. W. (2019). Lemon balm extract and its major chemical compound, rosmarinic acid, alleviate damages of liver in an animal model of nonalcoholic steatohepatitis (NASH)(P06-093-19). Current Developments in Nutrition, 3, nzz031-P06. https://doi.org/10.1093/cdn/nzz031.P06-093-19.
  23. Sammar, M., Abu-Farich, B., Rayan, I., Falah, M., & Rayan, A. (2019). Correlation between cytotoxicity in cancer cells and free radical-scavenging activity: In vitro evaluation of 57 medicinal and edible plant extracts. Oncology Letters, 18(6), 6563-6571. https://doi.org/10.3892/ol.2019.11054.
  24. Yesilada, E., & Küpeli, E. (2007). Clematis vitalba L. aerial part exhibits potent anti-inflammatory, antinociceptive and antipyretic effects. Journal of Ethnopharmacology, 110(3), 504-515. https://doi.org/10.1016/j.jep.2006.10.016.
  25. Șuțan, N. A., Popescu, D. I., Drăghiceanu, O. A., Topală, C., Şuţan, C., Negrea, A. D., et al. (2023). In vitro cytotoxic activity of phytosynthesized silver nanoparticles using Clematis vitalba L. (Ranunculaceae) aqueous decoction. Caryologia, 76(2), 67-81. https://doi.org/10.36253/caryologia-2330.
  26. Şuțan, N.A.; Dobrescu, C.M.; Drăghiceanu, O.A.; Fierăscu, I.; Fierăscu, R.C.; Şuțan, C.; Soare, L.C. (2022). Phytotoxicity of Clematis vitalba L. (Ranunculaceae) aqueous extract and nanostructured mixture. Chem. Proc., 7, 21. https://doi.org/10.3390/chemproc2022007021.
  27. Buzzini, P., & Pieroni, A. (2003). Antimicrobial activity of extracts of Clematis vitalba towards pathogenic yeast and yeast-like microorganisms. Fitoterapia, 74(4), 397-400. https://doi.org/10.1016/s0367-326x(03)00047-9.
  28. Sandulovici, R. C., Mihăilescu, C. M., Grigoroiu, A., Moldovan, C. A., Savin, M., Ordeanu, V., et al. (2022). The physicochemical and antimicrobial properties of silver/gold nanoparticles obtained by “green synthesis” from willow bark and their formulations as potential innovative pharmaceutical substances. Pharmaceuticals, 16(1), 48. https://doi.org/10.3390/ph16010048.
  29. Ungureanu, A. R., Ozon, E. A., Musuc, A. M., Anastasescu, M., Atkinson, I., Mitran, R. A., et al. (2024). Preparation and preliminary analysis of several nanoformulations based on plant extracts and biodegradable polymers as a possible application for chronic venous disease therapy. Polymers, 16(10), 1362. https://doi.org/10.3390/polym16101362.
  30. Triantafillidis, J. K., Triantafyllidi, E., Sideris, M., Pittaras, T., & Papalois, A. E. (2022). Herbals and plants in the treatment of pancreatic cancer: A systematic review of experimental and clinical studies. Nutrients, 14(3), 619. https://doi.org/10.3390/nu14030619.
  31. Abdulrahman, A. S., Rasul, K. H., Mustafa, I. A., & Abdulqadir, S. Z. (2025). In vitro anti-cancer potentiality of quince and dandelion leaves extract against leukemia cell lines and database retrieval expression of BCR ABL and TCR genes in leukemia. Immunopathologia Persa, x(x): e41730. doi: 10.34172/ipp.2025.41730.
  32. Manuscript no. HELIYON-D-24-63740R1, Eco-friendly dandelion and sweet wormwood-synthesized nanoparticles: Polyphenolic drug delivery systems with antitumoral and antibacterial properties and low toxicity, in revision.
  33. Faivre, S., Raymond, E., Boucher, E., Douillard, J., Lim, H. Y., Kim, J. S., et al. (2009). Safety and efficacy of sunitinib in patients with advanced hepatocellular carcinoma: An open-label, multicentre, phase II study. The lancet oncology, 10(8), 794-800. https://doi.org/10.1016/s1470-2045(09)70171-8.
  34. Rini, B. I., Michaelson, M. D., Rosenberg, J. E., Bukowski, R. M., Sosman, J. A., Stadler, W. M., et al. (2008). Antitumor activity and biomarker analysis of sunitinib in patients with bevacizumab-refractory metastatic renal cell carcinoma. Journal of Clinical Oncology, 26(22), 3743-3748. https://doi.org/10.1200/jco.2007.15.5416.
  35. Zhu, A. X., Duda, D. G., Sahani, D. V., & Jain, R. K. (2009). Development of sunitinib in hepatocellular carcinoma: Rationale, early clinical experience, and correlative studies. The Cancer Journal, 15(4), 263-268. https://doi.org/10.1097/PPO.0b013e3181af5e35.
  36. Tolomeo, M., Grimaudo, S., Di Cristina, A., Pipitone, R. M., Dusonchet, L., Meli, M., et al. (2008). Galangin increases the cytotoxic activity of imatinib mesylate in imatinib-sensitive and imatinib-resistant Bcr-Abl expressing leukemia cells. Cancer letters, 265(2), 289-297. https://doi.org/10.1016/j.canlet.2008.02.025.
  37. Keshavarz-Pakseresht, B., Shandiz, S. A. S., & Baghbani-Arani, F. (2017). Imatinib induces up-regulation of NM23, a metastasis suppressor gene, in human Hepatocarcinoma (HepG2) Cell Line. Gastroenterology and Hepatology from Bed to Bench, 10(1), 29-33.
  38. Sandulovici, R. C., Gălăţanu, M. L., Cima, L. M., Panus, E., Truţă, E., Mihăilescu, C. M., et al. (2024). Phytochemical characterization, antioxidant, and antimicrobial activity of the vegetative buds from Romanian Spruce, Picea abies (L.) H. Karst. Molecules, 29(9), 2128. https://doi.org/10.3390/molecules29092128.
  39. Ghica, A., Tănase, M. L., Niculițe, C. M., Tocilă, A., Popescu, L., Luță, E. A., et al. (2024). In vitro toxicity evaluation of some plant extracts and their potential application in Xerosis cutis. Cosmetics, 11(4), 124. https://doi.org/10.3390/cosmetics11040124.
  40. Manolache, M., Cadar, E., Antonescu, D., Mircioiu, C., Prasacu, I., & Sandulovici, R. (2018). Bioethics approach of biostatistics in clinical trials. Avoid the use of excessive or inadequate numbers of research subjects. Journal of Science and Arts, 18(1), 239-246.
  41. Gherghiceanu, F., Sandulovici, R., Prasacu, I., Anuta, V., & Mircioiu, C. (2016). Bioequivalence implies therapeutic equivalence. I. Biostatistical approach. Farmacia, 64(6), 823-827.
  42. Truţă, E., Vartic, M., & Cristea, A. N. (2011). Clinical study regarding preemptive analgesic effect of ketamine and remifentanyl in laparoscopic cholecystectomy. Farmacia, 59, 2.
  43. Truță, E., Davitoiu, A. M., Jinescu, G., Mitu, A. M., Caragea, G., Ionica, M., & Stanciulescu, E. L. (2016). Study on the correlation of urinary leaden levels and attention deficit hyperactivity disorder. Rev. Chim. Bucharest, 67(4). https://doi.org/10.37358/Rev.Chim.1949.
  44. Sikder, M., Lead, J. R., Chandler, G. T., & Baalousha, M. (2018). A rapid approach for measuring silver nanoparticle concentration and dissolution in seawater by UV–Vis. Science of the total environment, 618, 597-607. https://doi.org/10.1016/j.scitotenv.2017.04.055.
  45. Ahmeda, A., Zangeneh, A., & Zangeneh, M. M. (2020). Preparation, formulation, and chemical characterization of silver nanoparticles using Melissa officinalis leaf aqueous extract for the treatment of acute myeloid leukemia in vitro and in vivo conditions. Applied organometallic chemistry, 34(2), e5378. https://doi.org/10.1002/aoc.5378.
  46. Da-Cheng, H. A. O., Pei-Gen, X. I. A. O., Hong-Ying, M. A., Yong, P. E. N. G., & Chun-Nian, H. E. (2015). Mining chemodiversity from biodiversity: Pharmacophylogeny of medicinal plants of Ranunculaceae. Chinese journal of natural medicines, 13(7), 507-520. https://doi.org/10.1016/s1875-5364(15)30045-5.
  47. Wen-Tsai, W. (2003). A revision of Clematis sect. Clematis (Ranunculaceae). Journal of Systematics and Evolution, 41(1), 1-62.
  48. Hao, D. C., He, C. N., Shen, J., & Xiao, P. G. (2017). Anticancer chemodiversity of Ranunculaceae medicinal plants: Molecular mechanisms and functions. Current genomics, 18(1), 39-59. https://doi.org/10.2174/1389202917666160803151752.
Figure 1. I. (a) Color change of the solution from brownish-red to a dark brown due the silver bioreduction by Melissa officinallis extract; (b) UV–Vis spectra of ME AgNPs samples obtained by reduction in time with Melissa officinallis extract; (c) UV–Vis spectra of 0.5 mM AgNO3 aqueous solution; II. (a) Color change of the solution from brownish-red to a dark brown due the silver bioreduction by Clematis vitalba extract; (b) UV–Vis spectra of CVE AgNPs samples obtained by reduction in time with Clematis vitalba extract.
Preprints 147096 g001
Figure 2. (a) DLS measurements of ME AgNPs; (b) SEM images of ME AgNPs; (c) Zeta potential (mV) of ME AgNPs.
Preprints 147096 g002
Figure 3. Cell viability (%) of HepG2 lines after: (a) 24 hours of treatment with various dilutions of Taraxaci extractum - based samples and the chemotherapeutic drugs Sunitinib and Imatinib and (b) presents the same measurements after 48 hours of treatment.
Preprints 147096 g003
Figure 4. Cell viability (%) of HepG2 lines after: (a) 24 hours of treatment with various dilutions of Melissae extractum - based samples and the chemotherapeutic drugs Sunitinib and Imatinib and (b) presents the same measurements after 48 hours of treatment.
Preprints 147096 g004
Figure 5. Cell viability (%) after: (a) 24 hours of treatment of HepG2 and HUVEC by Clematis vitalbae extractum - based samples and (b) 48 hours of treatment of HepG2 and HUVEC by Clematis vitalbae extractum - based samples.
Preprints 147096 g005
Table 1. Taraxaci extractum (TE) Treatment Groups.
TE 30% ETOHExtract – dandelion 30% ehtanolic extract (Taraxaci extractum);
TE AgNPs 5% ETOH – dandelion silver nanoparticles 5% ethanolic extract;
SNTB + TE 30% ETOH – sunitinib + dandelion 30% ehtanolic extract;
IMTB + TE 30% ETOH – imatinib + dandelion 30% ehtanolic extract;
SNTB + TE AgNPs 5% ETOH – sunitinib + dandelion silver nanoparticles 5% ehtanolic extract;
IMTB + TE AgNPs 5% ETOH – imatinib + dandelion silver nanoparticles 5% ehtanolic extract.
Table 2. Melissae extractum (ME) Treatment Groups.
ME 30% ETOHExtract – lemon balm 30% ehtanolic extract (Melissae extractum);
ME AgNPs 3% ETOH – lemon balm silver nanoparticles 3% ethanolic extract;
SNTB + ME 30% ETOH – sunitinib + lemon balm 30% ehtanolic extract;
IMTB + ME 30% ETOH – imatinib + lemon balm 30% ehtanolic extract;
SNTB + ME AgNPs 3% ETOH – sunitinib + lemon balm silver nanoparticles 3% ehtanolic extract;
IMTB + ME AgNPs 3% ETOH – imatinib + lemon balm silver nanoparticles 3% ehtanolic extract.
Table 3. Clematis vitalbae extractum (CVE) Treatment Groups.
CVE Extract – traveller’s joy aqueous extract (Clematis vitalbae extractum);
CVE AgNPs – Clematis vitalbae extractum silver nanoparticles;
SNTB + CVE AgNPs – sunitinib + Clematis vitalbae extractum silver nanoparticles;
IMTB + CVE AgNPs – imatinib + Clematis vitalbae extractum silver nanoparticles.
Table 4. Control Groups.
SNTB – sunitinib (synthetic anticancer drug);
IMTB – imatinib (synthetic anticancer drug).
Table 5. The nanoparticles size of samples CVE AgNPs and ME AgNPs.
Sample Nanoparticle diameter (nm)
Min – Max FWHM Mean ± SD
CVE AgNPs 6-18 9-13 11.1 ± 1.9
ME AgNPs 9-22 11-17 14.5 ± 2.9
Table 6. Statistical significance of the ME influence on tumor cell viability compared to the SNTB control.
(I) HepG2_Treatment_ME_vs_SNTB (J) Control_Group Mean
Difference (J-I)
Std. Error Sig.
(p value)
ME AgNPs 1:1 Control_SNTB 0.61259* 0.08632 0.003
ME AgNPs 1:2 Control_SNTB 0.39760* 0.07941 0.022
SNTB + ME AgNPs 1:1 Control_SNTB 0.49988* 0.07853 0.002
*. The mean difference is significant at the 0.05 level.
Table 7. Statistical significance of the ME influence on tumor cell viability compared to the IMTB control.
(I) HepG2_Treatment_ME_vs_IMTB (J) Control_Group Mean
Difference (J-I)
Std. Error Sig.
(p value)
ME AgNPs 1:1 Control_IMTB 0.45994* 0.10684 0.028
IMTB + ME AgNPs 1:1 Control_IMTB 0.37692* 0.07202 0.036
*. The mean difference is significant at the 0.05 level.
Table 8. Statistical significance of the CVE influence on tumor cell viability compared to the SNTB control.
(I) HepG2_Treatment_CVE_vs_SNTB (J) Control_Group Mean
Difference (J-I)
Std. Error Sig.
(p value)
CVE 1:1 Control_SNTB 0.51588* 0.07305 0.004
CVE 1:2 Control_SNTB 0.46707* 0.06980 0.010
CVE 1:4 Control_SNTB 0.40876* 0.09289 0.035
CVE AgNPs 1:1 Control_SNTB 0.68835* 0.06493 0.005
CVE AgNPs 1:2 Control_SNTB 0.50431* 0.08197 0.005
SNTB + CVE AgNPs 1:1 Control_SNTB 0.37086* 0.04998 0.000
SNTB + CVE AgNPs 1:2 Control_SNTB 0.26627* 0.05312 0.018
*. The mean difference is significant at the 0.05 level.
Table 9. Statistical significance of the CVE influence on tumor cell viability compared to the IMTB control.
(I) HepG2_Treatment_CVE_vs_IMTB (J) Control_Group Mean
Difference (J-I)
Std. Error Sig.
(p value)
CVE 1:1 Control_IMTB 0.43148* 0.08789 0.023
CVE 1:2 Control_IMTB 0.37713† 0.08879 0.066
CVE AgNPs 1:1 Control_IMTB 0.62611* 0.06099 0.011
CVE AgNPs 1:2 Control_IMTB 0.42165* 0.09653 0.028
IMTB + CVE AgNPs 1:1 Control_IMTB 0.40090* 0.05021 0.001
*. The mean difference is significant at the 0.05 level.
Disclaimer/Publisher’s Note: The statements, opinions and data contained in all publications are solely those of the individual author(s) and contributor(s) and not of MDPI and/or the editor(s). MDPI and/or the editor(s) disclaim responsibility for any injury to people or property resulting from any ideas, methods, instructions or products referred to in the content.
Copyright: This open access article is published under a Creative Commons CC BY 4.0 license, which permit the free download, distribution, and reuse, provided that the author and preprint are cited in any reuse.
Prerpints.org logo

Preprints.org is a free preprint server supported by MDPI in Basel, Switzerland.

Subscribe

Disclaimer

Terms of Use

Privacy Policy

Privacy Settings

© 2025 MDPI (Basel, Switzerland) unless otherwise stated