
Submitted:
12 November 2024
Posted:
13 November 2024
You are already at the latest version
Abstract
The fall armyworm (Spodoptera frugiperda) is a significant agricultural pest with a broad host range and adaptability, posing challenges to pest management worldwide. To elucidate the molecular mechanisms underpinning their development and resilience, we performed a comprehensive transcriptomic analysis across nine developmental stages, spanning from the 1st instar larvae to adult forms. Utilizing differential expression analysis and time-series clustering, we identified 6,834 differentially expressed genes (DEGs), uncovering key stage-specific expression patterns. Notably, 3,072 stage-specific genes (SSGs) were defined using the Tau index, highlighting their roles in development and physiological adaptation. Functional enrichment revealed that the 6th instar stage prioritizes pathways related to growth and tissue remodeling, while adult males emphasize reproductive and sensory functions. Furthermore, we characterized 104 cytochrome P450 (P450) genes, showcasing distinct temporal expression patterns critical for detoxification and metabolic processes. A tandem array of P450 genes on chromosome 13 was identified, suggesting a coordinated mechanism enhancing insecticide resistance. Our findings shed light on the complex genetic regulation that facilitates the developmental transitions and adaptive capabilities of S. frugiperda. These insights offer potential molecular targets for innovative pest management strategies aimed at mitigating the widespread impact of this pest.
Keywords:
Spodoptera frugiperda
; Transcriptome analysis
; Differentially expressed genes
; Stage-specific genes
; Cytochrome P450
1. Introduction
The fall armyworm (Spodoptera frugiperda) is a major agricultural pest known for its ability to cause extensive damage to a wide range of economically important crops, including corn, rice, and sorghum. Originally native to the tropical and subtropical regions of the Americas, this species has recently spread to Africa, Asia, and Australia, adapting to a variety of climates and cropping systems [1,2]. Its global proliferation has raised serious agricultural and economic concerns, as S. frugiperda exhibits a high reproductive rate, remarkable migratory capacity, and adaptive responses to diverse environmental conditions [3]. Furthermore, this pest is known for rapidly developing resistance to several classes of insecticides, including pyrethroids and organophosphates, posing significant challenges to traditional pest management strategies [4,5].
The adaptability and resilience of S. frugiperda are underpinned by complex genetic and molecular mechanisms that enable it to undergo various physiological and behavioral changes at different developmental stages [6,7]. In insects, developmental transitions from larval stages to adulthood are tightly regulated by gene expression networks, which coordinate processes such as growth, tissue differentiation, and hormonal signaling [8,9]. These regulatory networks often involve differentially expressed genes (DEGs) and stage-specific genes (SSGs), allowing the organism to meet the specific physiological demands of each stage. Advances in transcriptomic analysis have made it possible to investigate gene expression changes across different stages, providing insights into the regulatory mechanisms underlying development and adaptation [10]. Transcriptome studies offer an opportunity to explore the expression profiles of thousands of genes, revealing SSGs and widely shared genes that play essential roles throughout their life cycle. By identifying key DEGs across developmental stages—particularly those involved in detoxification, hormonal regulation, and metabolic adaptation—we can gain insights into how S. frugiperda adjusts its physiology to meet the demands of each stage and withstand environmental challenges.
In this study, we conducted a comprehensive analysis of gene expressions across various developmental stages of S. frugiperda, focusing on differentially expressed genes (DEGs), stage-specific genes (SSGs), and the intricate expression patterns of cytochrome P450 genes. By employing approaches, including differential expression analysis, clustering, and pathway enrichment studies, we aimed to map the genetic landscape that underpins developmental transitions and physiological adaptations. This investigation sought to identify key regulatory genes and pathways that are crucial for growth, metamorphosis, and survival under environmental pressures, providing insights into potential molecular targets for the development of more targeted pest management strategies. The findings from this research shed light on the complex regulatory mechanisms that enable S. frugiperda to thrive, adapt, and develop resistance.
2. Materials and Methods
2.1. Data Acquisition
We collected transcriptome datasets for S. frugiperda across different developmental stages from the NCBI Sequence Read Archive (SRA) [11], resulting in 27 raw datasets covering nine stages: 1st instar, 2nd instar, 3rd instar, 4th instar, 5th instar, 6th instar larvae, pupae, female adults, and male adults. The SRA accessions range from SRR11196256 to SRR11196282 [12]. The reference genome and gene annotations were obtained from RefSeq (accession number GCF_023101765.2) [13].
2.2. Transcriptome Analysis
We used the fasterq-dump tool from the SRA Toolkit to decompress and convert the raw transcriptome data into FASTQ format. Quality control and adapter trimming were performed on the FASTQ files using fastp v0.19.7 [14] with default parameters, resulting in clean data suitable for expression quantification. Gene expression levels for each sample were calculated using RSEM v1.3.3 [15], employing Bowtie2 v2.5.1 [16] as the alignment software. This process generated the read count matrix for all 27 samples for subsequent analyses.
DESeq2 v1.32.0 [17] was used for count normalization, principal component analysis, and differential expression analysis, identifying differentially expressed genes (DEGs) with an adjusted p-value ≤ 0.05 and an absolute log₂ fold change ≥ 2. Time-series analysis was conducted using Mfuzz v2.52.0 [18].
2.3. Identification of Stage-Specific Genes
The Tau index measures the specificity or breadth of a gene or transcript's expression across studied tissues or stages, ranging from 0 (broadly expressed) to 1 (highly specific) [19,20]. Tau was calculated as follows:
where n is the number of stages and xi represents each expression profile component normalized by the maximum component value. Using this formula, we calculated Tau values for all expressed genes. The Tau distribution was visualized using ggplot2 v3.3.6 in R v4.1.1, and genes with Tau ≥ 0.9 were designated as stage-specific genes (SSGs).
2.4. Functional Analysis
Functional annotation of protein coding genes was conducted using eggNOG-mapper v2 [21] and NCBI BLAST v2.14.1+ [22]. KEGG ortholog annotation and pathway visualization were performed with BlastKOALA and KEGG Mapper from KEGG [23]. Gene function enrichment analysis was carried out using clusterProfiler v4.0.5 [24,25], considering KEGG pathways or gene ontologies with p-values ≤ 0.05 as significantly enriched.
2.5. Identification and Location of P450 Genes
We selected the longest mRNA as the representative sequence for each gene. Protein homologs of P450 genes were subsequently retrieved from UniProt [26] and InsectBase 2.0 [27] and filtered based on sequence length (>350 amino acids) and the presence of the P450 Pfam domain (PF00067) [28].
These homologs were then aligned against the official gene sets of 12 insects using NCBI BLASTP with an e-value threshold of 1e-10. HMMER v3.1 [29] was used to identify PFAM domains, and genes passing both analyses were designated as candidate P450 genes. To further improve accuracy, two rounds of gene prediction were performed using Bitacora v1.4.2 in "full mode" and GeMoMa v1.7 [30], with the second round employing an iterative search. The results from both tools were merged to generate the final P450 datasets. Finally, R package RIdeogram v0.2.2 was employed for visualization of the clustered P450 genes [31].
3. Results
3.1. Analysis of Differential Gene Expressions Across Developmental Stages
Using the reference genome and official gene sets of S. frugiperda, we calculated the expression levels of 14,922 protein coding genes from 27 transcriptome samples spanning nine developmental stages. After filtering out genes with low read counts (<100), we obtained a high-quality read count matrix comprising 13,622 genes. To identify DEGs between adjacent stages, we used DESeq2 to generate nine comparison groups. The normalized counts produced by DESeq2 were utilized for downstream analyses. Principal Component Analysis (PCA) revealed minimal differences among samples within the same stage (Figure 1A), confirming the reliability of the transcriptome data used. In contrast, significant differences were observed among samples from different stages.
Subsequently, we identified genes with adjusted p-values ≤ 0.05 and |log₂ fold change| ≥ 2 as DEGs, resulting in a total of 6,834 DEGs across different stages. The results showed that few DEGs were present from the 1st to the 5th instar larvae, indicating that the biological processes and functions during these stages are relatively consistent, with stable gene expression profiles. In contrast, a high number of DEGs were observed from the 5th instar larvae to adults, especially between the 5th and 6th instar larvae (2,965 DEGs) and from pupae to male adults (3,073 DEGs) (Figure 1B). The increased number of differentially expressed genes reflects that insects undergo extensive and complex physiological, morphological, and behavioral changes during these critical developmental stages.
Next, time-series analysis of DEGs revealed 12 distinct expression clusters (Clusters 1–12), each exhibiting unique temporal expression patterns across nine developmental stages (Figure 2). Notably, Clusters 1, 3, 5, 6, 7, 8, 9, 11, and 12 show characteristic peaks in expression at specific stages, followed by declines or stabilization, suggesting stage-specific regulatory roles. In contrast, Clusters 2, 4, and 10 demonstrate more moderate changes without pronounced peaks, implying broader regulatory functions across multiple stages. This clustering underscores the temporal dynamics of DEG expression, indicating that certain gene groups may play pivotal roles at specific stages, while others support ongoing developmental processes throughout the lifecycle.
3.2. Identification and Characterization of Widely Shared DEGs
Given that our data encompasses the entire life cycle of the fall armyworm, we sought to identify DEGs that undergo significant changes across multiple developmental stages. To this end, we analyzed the number of comparison groups in which each DEG appeared. The results show a progressive decrease in the number of DEGs as the number of groups they belong to increases (Figure 1C). Most DEGs (2,028) were identified in only one group, while only five DEGs were identified across eight groups.
We then explored the expression patterns of these five DEGs, which revealed distinct stage-specific expression trends (Figure 3). Four of these DEGs (LOC118261897, LOC118264101, LOC118276086, and LOC118278649) exhibited peaks and troughs in expression levels, indicating a significant correlation with the developmental stages of the insect. In contrast, LOC118267927 maintained low expression levels from stages 1 to 8 but showed a sharp increase at the male adult stage, suggesting a specialized function in male adults.
Furthermore, we annotated the functions of these five genes to explore their potential biological roles (Table 1). Due to the lack of homologous protein information, two DEGs (LOC118267927 and LOC118276086) were annotated as uncharacterized proteins, making it difficult to speculate on their functions. However, we noted that LOC118261897 was annotated as an ecdysone-induced protein 78C, which plays a role directly related to ecdysone signaling [32,33]. Additionally, LOC118278649 was predicted to be a UDP-glycosyltransferase, a major phase II enzyme involved in the metabolic detoxification of xenobiotics [34]. These findings suggest that these widely shared DEGs may play critical roles in the development and physiological processes of S. frugiperda.
3.3. Identification and Analysis of Stage-Specific Genes
Analyzing stage-specific gene expressions is essential for revealing regulatory mechanisms at different developmental stages and understanding how genes uniquely drive progression in each phase. To quantify this specificity, we used the Tau index, which indicates the extent to which a gene or transcript is restricted to certain stages or broadly expressed across them. We calculated the Tau index for a total of 13,622 genes, revealing a bimodal distribution with peaks near 0.5 and 0.9. This indicates that most genes are either broadly expressed or highly stage-specific (Figure 4A). The Tau index values ranged from 0.08 to 1, averaging 0.673, with 73.9% of genes scoring above 0.5 and 22.6% above 0.9. Genes with a Tau index of ≥0.9 were classified as SSGs, yielding 3,072 SSGs for further analysis.
We analyzed the SSGs identified across developmental stages and observed that, except for the 6th instar and adult male stages, each stage contained a similar number of SSGs, suggesting a balanced regulation of gene expression throughout development (Figure 4B). This consistency likely reflects a stable demand for specific gene functions tailored to meet the physiological needs characteristic of each developmental phase. Such a distribution implies that the organism maintains a degree of functional stability across stages while also adapting gene expression to fulfill stage-specific requirements.
The unique deviation seen in the 6th instar and male adult stages may underscore distinctive physiological or behavioral needs exclusive to these periods, potentially associated with final growth and maturation in the 6th instar or reproductive functions in adult males. This distinct pattern suggests that gene expression at these stages is fine-tuned to support critical biological transitions that differ from the broader developmental requirements of other stages.
3.4. Function Enrichment Analysis of SSGs in 6th Instar and Male Adults
To further examine the unique functional roles of SSGs in the 6th instar larvae and male adult stages, we performed functional enrichment analyses, revealing distinct functional profiles tailored to each developmental phase.
In the 6th instar larvae, KEGG pathway enrichment (Figure 5A) highlighted pathways such as oxidative phosphorylation, thermogenesis, and phagosome formation, supporting the high energy demands of the final growth stages and preparing the organism for the pupal phase. The phagosome pathway is essential for tissue degradation and remodeling, facilitating metamorphic transition and enabling structural and physiological adaptations for adulthood.
In adult males, enriched pathways shifted towards reproductive and sensory functions, with a notable presence of neuroactive ligand-receptor interaction and glutamatergic synapse pathways (Figure 5B). These pathways are crucial for neural signaling required for mate-seeking and reproductive behaviors, aligning with the reproductive strategies of male Lepidoptera. Gene Ontology (GO) analysis (Figure 5C and 5D) further underscored cellular adaptations: in the 6th instar larvae, there was enrichment in cilium organization and microtubule-based movement, while in adult males, electron transfer activity and mitochondrial respiratory chain functions were prominent, supporting increased energy metabolism necessary for reproduction and sensory responsiveness.
Overall, these analyses reveal a dynamic regulation of gene expression that meets the developmental and physiological demands of each stage. Genes in the 6th instar larvae focus on growth and tissue remodeling, while gene expression in adult males prioritizes neural and sensory functions critical for reproductive success. This stage-specific modulation reflects precise regulatory mechanisms that align gene functions with the organism's developmental and reproductive requirements, ensuring functional stability through key life-stage transitions.
Given the significant enrichment of oxidative phosphorylation among the SSGs of both the 6th instar larvae and adult male stages, we selected this pathway for detailed visualization of SSGs (Figure 7). We observed extensive representation of SSGs from both stages across the pathway. Notably, five key enzymes—NADH-quinone oxidoreductase subunit A (EC 7.1.1.2), succinate dehydrogenase flavoprotein subunit (EC 1.3.5.1), ubiquinol-cytochrome c reductase cytochrome b/c1 subunit (EC 7.1.1.8), cytochrome c oxidase cbb₃-type subunit I (EC 7.1.1.9), and F-type H⁺-transporting ATPase subunit a (EC 7.1.2.2)—were found within the SSGs for both two stages.
The extra expression of these enzymes underscores the adaptive modulation of oxidative phosphorylation to meet the distinct metabolic demands of each developmental phase. This pathway-specific functional specialization through SSGs is vital for supporting the high energy demands during the 6th instar larvae's growth and tissue remodeling, as well as sustaining the energy-intensive activities required for reproductive readiness and sensory responsiveness in adult males. This adaptive deployment of SSGs within oxidative phosphorylation highlights the critical role of stage-specific extra gene expression in orchestrating developmental transitions, ensuring both the organism's successful maturation and reproductive potential.
3.5. Temporal Gene Expression Patterns of P450 Genes in S. frugiperda
The cytochrome P450 gene family plays a crucial role in the detoxification of various insecticides and has recently been identified as a key determinant of insecticide selectivity [4,7,35]. Recent studies have validated the critical role of P450 genes in the development of resistance in various noctuids, including Helicoverpa armigera, H. zea, S. frugiperda, S. exigua, and S. litura. Finally, we further explored the temporal gene expression patterns of P450 genes in S. frugiperda [36].
By employing a combination of two annotation methods, we identified 108 P450 genes within the chromosomal sequences of S. frugiperda (excluding P450 genes in contigs). We then normalized the count matrix of these P450 genes using DESeq2 and selected 104 P450 genes after removing genes with low expression levels. The results revealed that the P450 genes clustered into seven groups with distinct gene expression patterns (Figure 7). The majority of P450 genes (29 genes) were found in Cluster 1, which exhibited high expression levels in 5th instar larvae.
Figure 7.
A Heatmap of 104 P450 genes across different stages.
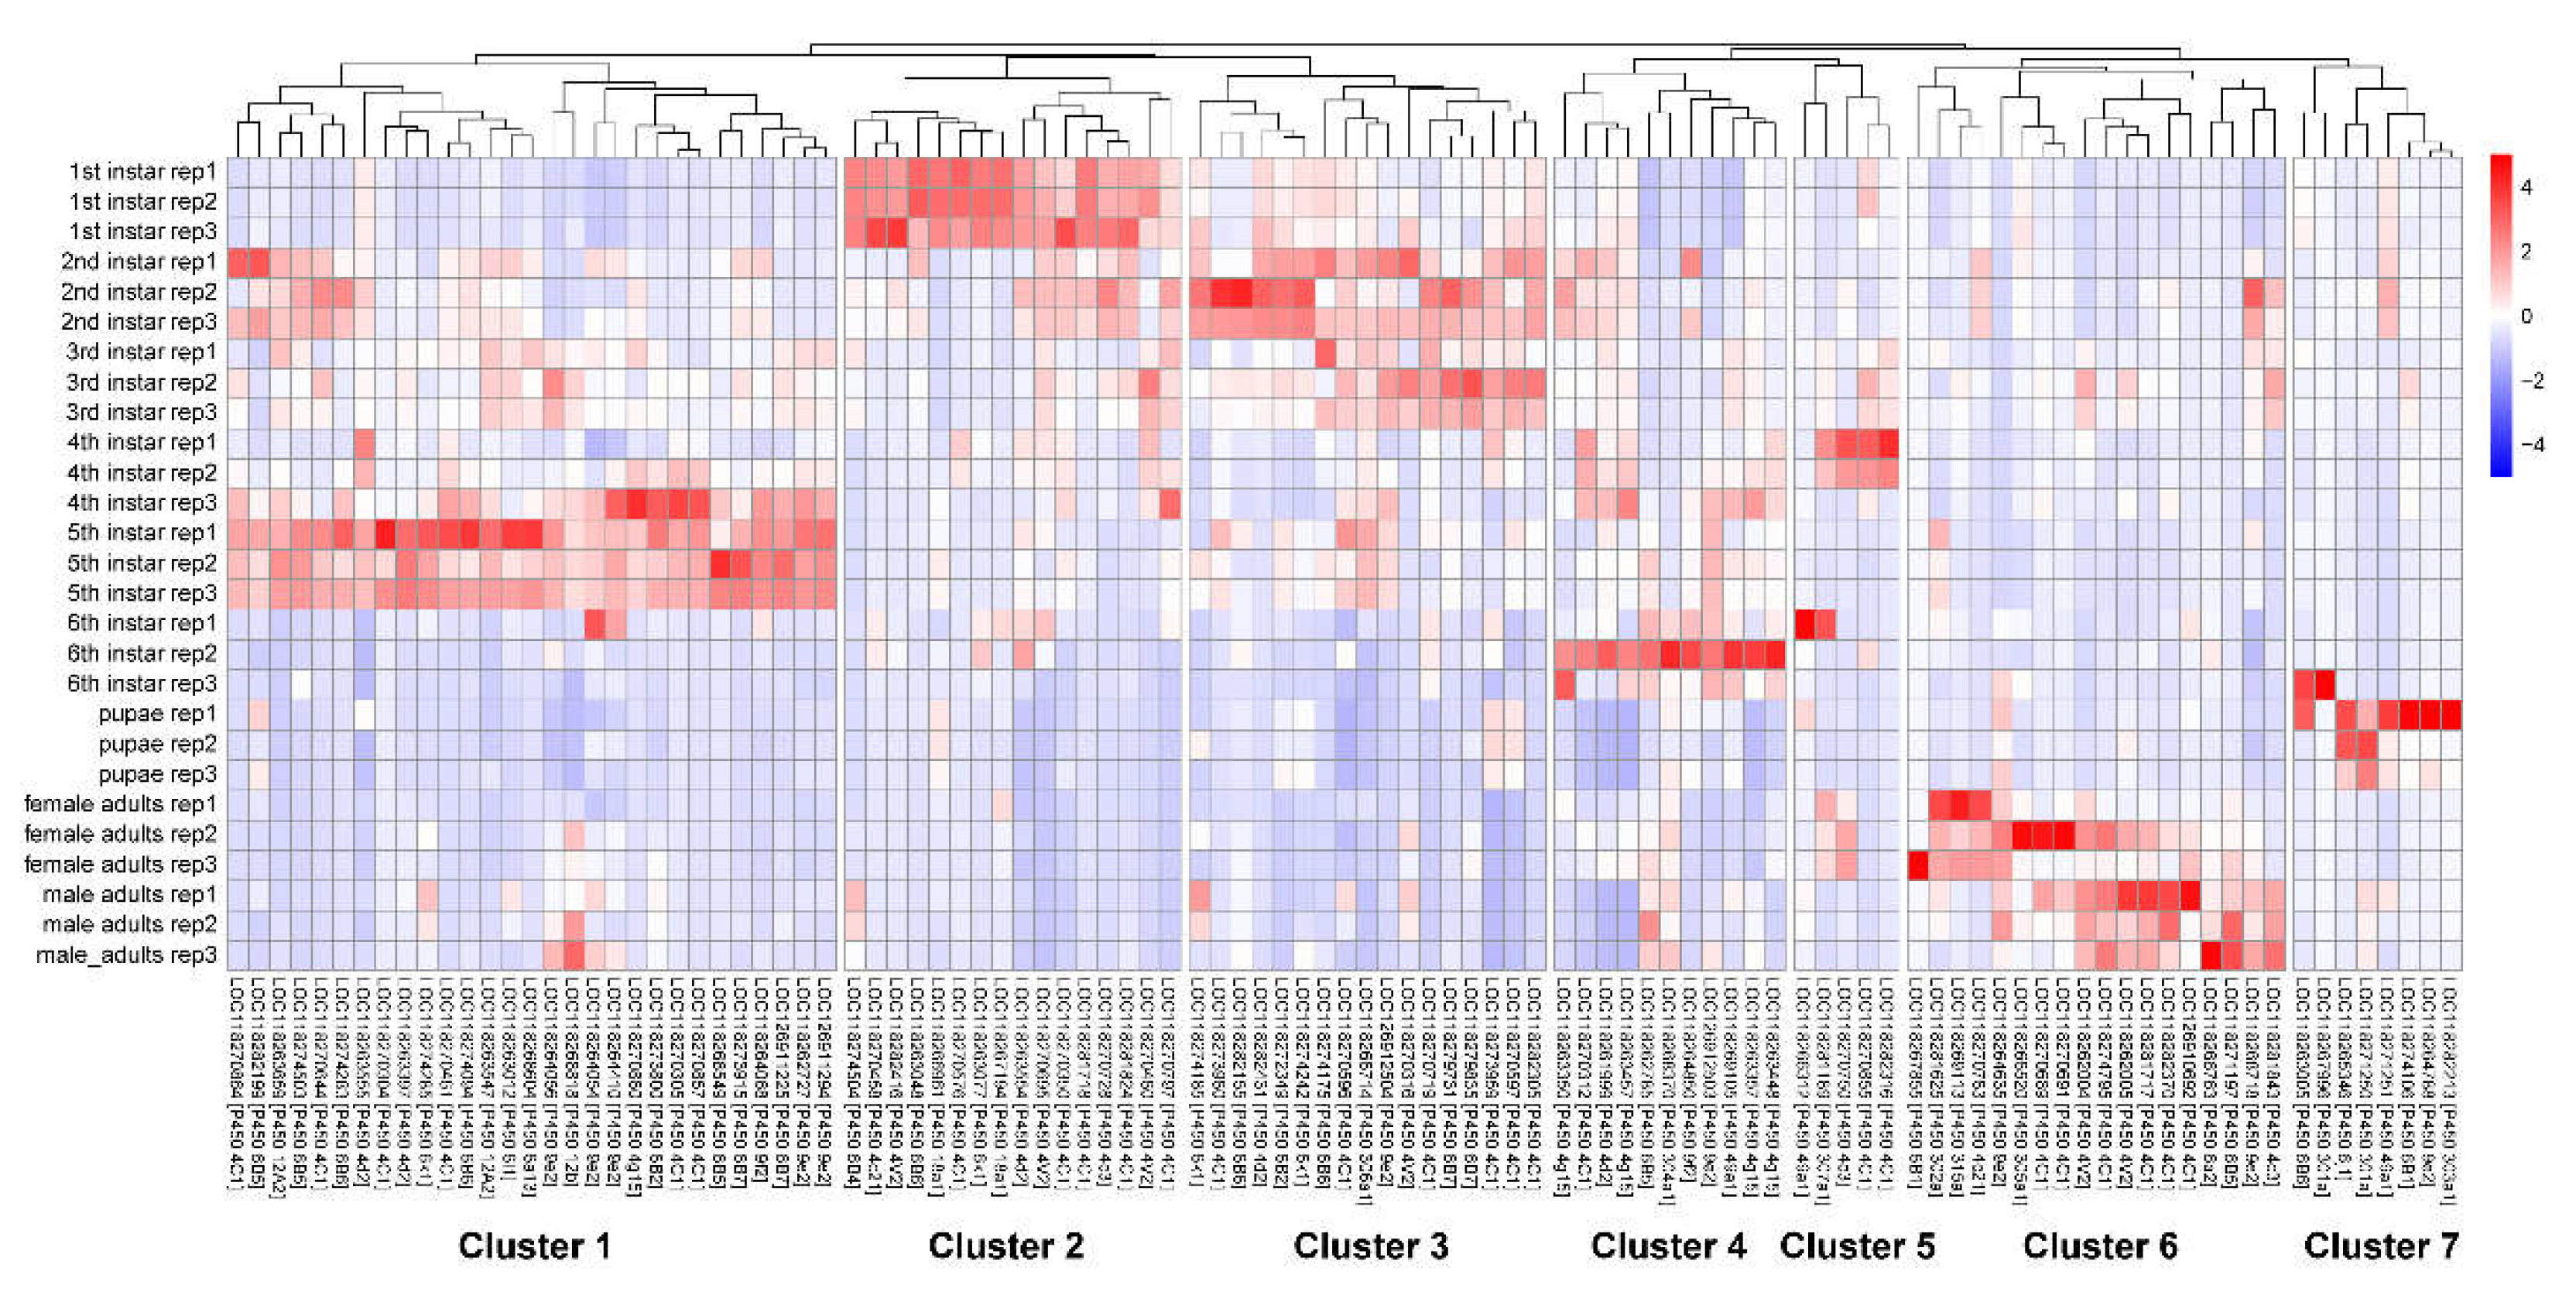
Moreover, P450 genes in Clusters 2 through 7 exhibited high expression levels at specific developmental stages: Cluster 2 in first instar larvae; Cluster 3 in second and third instar larvae; Cluster 4 in sixth instar larvae; Cluster 5 in fourth instar larvae; Cluster 6 in adults; and Cluster 7 in pupae. Of the 104 P450 genes analyzed, 98 were identified as DEGs, further highlighting the extensive expression diversity among P450 genes. These findings suggest that insecticide resistance is mediated by P450 genes in the fall armyworm involves stage-specific expression patterns, with certain P450 genes highly expressed at distinct developmental stages. Such stage-specific expression may optimize energy metabolism throughout the life cycle. The dynamic expression of P450 genes in S. frugiperda underscores the adaptability of its detoxification mechanisms across developmental stages.
We then examined whether these P450 clusters were correlated with their chromosomal distribution. A total of 104 P450 genes were found to be dispersed across 20 chromosomes, with multiple P450 clusters identified (Figure 8). However, genes exhibiting similar expression patterns were not observed to be co-located on the chromosomes. Notably, a significant P450 cluster comprising a tandem array of 18 P450 genes was identified on chromosome 13 (NC_064224.1). Functional annotation revealed that these genes were characterized as cytochrome P450 4C1. The stage-specific expression of different genes within this tandem array underscores the intricate mechanisms of P450-mediated insecticide resistance in the fall armyworm.
4. Discussion
Our comprehensive analysis of gene expression across the developmental stages of S. frugiperda reveals significant insights into the intricate regulatory mechanisms that underpin its growth, physiological adaptations, and reproductive strategies.
4.1. Developmental Regulation and Functional Specialization of DEGs
The surge in DEGs from the 5th instar to adult stages indicates a critical period of physiological and morphological transformation, where changes in gene expression are necessary for organ development, tissue remodeling, and functional adaptations. The DEGs identified across multiple stages include genes associated with key developmental processes, such as ecdysone signaling, which plays a pivotal role in insect molting and metamorphosis [37]. This observation aligns with previous research on ecdysone-related gene regulation during metamorphic transitions, suggesting a conserved regulatory pathway that drives morphological adaptations essential for adult functionality [37,38].
Furthermore, the presence of UDP-glycosyltransferase genes among the widely shared DEGs underscores the significance of detoxification pathways across developmental stages [39,40]. As insects encounter diverse environmental challenges throughout their life cycle, the activation of detoxification genes may provide a generalized protective mechanism, supporting survival through biochemical adaptability.
4.2. Insights from SSGs in 6th Instar and Male Adult Stages
The 6th instar larvae and adult male stages exhibit unique physiological demands, reflected in the distinctive enrichment of specific biological pathways. In 6th instar larvae, pathways such as oxidative phosphorylation and thermogenesis are enriched, aligning with the increased metabolic requirements for final growth and tissue remodeling. This observation is consistent with the energetic demands preceding pupation, during which tissue breakdown and reorganization are essential for transformation into adult form. The stage-specific expression of phagosome-related genes at this stage further supports the notion of developmental restructuring, as cellular remodeling processes are instrumental in facilitating metamorphosis.
In male adults, the enrichment of neuroactive ligand-receptor interaction and glutamatergic synapse pathways indicates a shift in gene function toward reproductive and sensory adaptations. These pathways are crucial for behaviors such as mate-seeking, which require enhanced neural signaling [41,42]. This distinct focus on sensory and reproductive gene expression in males aligns with their biological role, wherein energy-intensive functions are directed toward reproductive success, reinforcing the selective pressures that drive these gene expression patterns.
The consistent enrichment of oxidative phosphorylation-related genes of SSGs in both the 6th instar larvae and male adult stages suggests an adaptive strategy to meet high metabolic demands. During the 6th instar, oxidative phosphorylation supports growth and structural remodeling, preparing the organism for metamorphosis. In adult males, it facilitates the energy requirements of reproductive and sensory functions. This pathway-specific modulation indicates a finely tuned regulatory mechanism that aligns metabolic capacity with the specific demands of each life stage. The extra expression of enzymes such as NADH-quinone oxidoreductase and cytochrome c oxidase in both stages further emphasizes the critical role of oxidative phosphorylation in supporting these energy-intensive processes.
4.3. Temporal Gene Expression Patterns of P450 Genes
The cytochrome P450 gene family, known for its crucial role in detoxification and insecticide resistance, displayed distinct and dynamic expression patterns throughout development. Clustering analysis of 104 P450 genes into seven groups revealed their contributions to stage-specific detoxification processes. The high expression of certain P450 genes during key larval and adult stages reflects the insect's adaptive strategies to manage metabolic demands and bolster resistance to environmental and chemical stressors. The flexibility in expression patterns ensures that S. frugiperda can adapt its detoxification and metabolic processes in a stage-appropriate manner, ultimately supporting its lifecycle and ecological success.
The identification of a tandem array of 18 P450 genes on chromosome 13 is particularly significant. This gene cluster likely represents an evolutionary adaptation, providing S. frugiperda with a strategic advantage for enhanced detoxification and survival. The co-expression of these genes, despite differing temporal expression profiles, suggests a coordinated mechanism that optimizes detoxification processes to different developmental needs and environmental pressures. This arrangement enhances the insect’s ability to mitigate the impacts of various insecticides, which may explain its resilience and widespread pest status.
Due to this complex expression pattern, developing insecticide targets against a single P450 gene is unlikely to cause lethal effects on the pest. The redundancy and coordinated expression among multiple P450 genes mean that inhibiting one gene can be compensated for by others. Therefore, future insecticide development must fully consider the impact of this mechanism. Strategies that target multiple genes or disrupt the regulatory networks controlling P450 expression may be more effective in overcoming the pest's adaptive detoxification capabilities.
5. Conclusions
Overall, our findings reveal that the regulation of gene expression in S. frugiperda is finely tuned to support its developmental transitions and environmental adaptability. The distinct roles of DEGs, SSGs, and P450 genes reflect a comprehensive strategy to balance growth, metabolic needs, and resistance mechanisms throughout its lifecycle. These insights not only deepen our understanding of the genetic basis for the success of S. frugiperda as an adaptable pest but also provide potential molecular targets for developing effective pest management strategies. Addressing these genetic pathways could lead to more targeted approaches in controlling the spread and impact of this significant agricultural pest.
Supplementary Materials
The following supporting information can be downloaded at: Preprints.org, Figure S1, Figure S2, Figure S3.
Author Contributions
Ziqi Cheng: Writing–original draft, Resources, Formal analysis, Investigation, Methodology, Visualization, Software. Zhe Huang: Formal analysis, Data curation, Investigation, Resources. Bin Yan: Data curation, Software. Xing Huang: Writing – review & editing. Shuai Liu: Writing – review & editing, Resources, Funding acquisition, Project administration. Yang Mei: Writing–review & editing, Methodology, Data curation, Visualization, Project administration.
Funding
This work was supported by the Biological Breeding-National Science and Technology Major Project (2022ZD04021).
Data Availability Statement
Data are available at https://doi.org/10.5281/zenodo.13999367.
Acknowledgments
We would like to express our sincere gratitude to the organizations and re-searchers who provided access to the public genomic data sets used in this study.
Conflicts of Interest
The authors declare no conflicts of interest.
References
- Montezano, D.G.; Specht, A.; Sosa-Gómez, D.R.; Roque-Specht, V.F.; Sousa-Silva, J.C.; Paula-Moraes, S.V.; Peterson, J.A.; Hunt, T.E. Host Plants of Spodoptera Frugiperda (Lepidoptera: Noctuidae) in the Americas. Afr. Entomol. 2018, 26, 286–300. [Google Scholar] [CrossRef]
- Pogue, M. A World Revision of the Genus Spodoptera Guenée: (Lepidoptera: Noctuidae); American Entomological Society, 2002.
- Gui, F.; Lan, T.; Zhao, Y.; Guo, W.; Dong, Y.; Fang, D.; Liu, H.; Li, H.; Wang, H.; Hao, R.; et al. Genomic and Transcriptomic Analysis Unveils Population Evolution and Development of Pesticide Resistance in Fall Armyworm Spodoptera Frugiperda. Protein Cell 2022, 13, 513–531. [Google Scholar] [CrossRef] [PubMed]
- Hilliou, F.; Chertemps, T.; Maïbèche, M.; Le Goff, G. Resistance in the Genus Spodoptera: Key Insect Detoxification Genes. Insects 2021, 12, 544. [Google Scholar] [CrossRef]
- Amezian, D.; Nauen, R.; Le Goff, G. Comparative Analysis of the Detoxification Gene Inventory of Four Major Spodoptera Pest Species in Response to Xenobiotics. Insect Biochem. Mol. Biol. 2021, 138, 103646. [Google Scholar] [CrossRef] [PubMed]
- Li, X.; Schuler, M.A.; Berenbaum, M.R. Molecular Mechanisms of Metabolic Resistance to Synthetic and Natural Xenobiotics. Annu. Rev. Entomol. 2007, 52, 231–253. [Google Scholar] [CrossRef] [PubMed]
- Hawkins, N.J.; Bass, C.; Dixon, A.; Neve, P. The Evolutionary Origins of Pesticide Resistance. Biol. Rev. Camb. Philos. 2019, 94, 135–155. [Google Scholar] [CrossRef]
- Rewitz, K.F.; Yamanaka, N.; O’Connor, M.B. Developmental Checkpoints and Feedback Circuits Time Insect Maturation. In Current Topics in Developmental Biology; 2013; Volume 103, pp. 1–33. [Google Scholar]
- Martín, D.; Chafino, S.; Franch-Marro, X. How Stage Identity Is Established in Insects: The Role of the Metamorphic Gene Network. Curr. Opin. Insect Sci. 2021, 43, 29–38. [Google Scholar] [CrossRef]
- Stark, R.; Grzelak, M.; Hadfield, J. RNA Sequencing: The Teenage Years. Nat. Rev. Genet. 2019, 20, 631–656. [Google Scholar] [CrossRef]
- NCBI Resource Coordinators; Agarwala, R.; Barrett, T.; Beck, J.; Benson, D.A.; Bollin, C.; Bolton, E.; Bourexis, D.; Brister, J.R.; Bryant, S.H.; et al. Database Resources of the National Center for Biotechnology Information. Nucleic Acids Res. 2018, 46, D8–D13. [Google Scholar] [CrossRef]
- Xiao, H.; Ye, X.; Xu, H.; Mei, Y.; Yang, Y.; Chen, X.; Yang, Y.; Liu, T.; Yu, Y.; Yang, W.; et al. The Genetic Adaptations of Fall Armyworm Spodoptera Frugiperda Facilitated Its Rapid Global Dispersal and Invasion. Mol. Ecol. Resour. 2020, 20, 1050–1068. [Google Scholar] [CrossRef]
- Haft, D.H.; Badretdin, A.; Coulouris, G.; DiCuccio, M.; Durkin, A.S.; Jovenitti, E.; Li, W.; Mersha, M.; O’Neill, K.R.; Virothaisakun, J.; et al. RefSeq and the Prokaryotic Genome Annotation Pipeline in the Age of Metagenomes. Nucleic Acids Res. 2024, 52, D762–D769. [Google Scholar] [CrossRef] [PubMed]
- Chen, S.; Zhou, Y.; Chen, Y.; Gu, J. Fastp: An Ultra-Fast All-in-One FASTQ Preprocessor. Bioinformatics 2018, 34, i884–i890. [Google Scholar] [CrossRef] [PubMed]
- Li, B.; Dewey, C.N. RSEM: Accurate Transcript Quantification from RNA-Seq Data with or without a Reference Genome. BMC Bioinformatics 2011, 12, 323. [Google Scholar] [CrossRef] [PubMed]
- Langmead, B.; Salzberg, S.L. Fast Gapped-Read Alignment with Bowtie 2. Nat. Methods 2012, 9, 357–359. [Google Scholar] [CrossRef] [PubMed]
- Love, M.I.; Huber, W.; Anders, S. Moderated Estimation of Fold Change and Dispersion for RNA-Seq Data with DESeq2. Genome Biol. 2014, 15, 550. [Google Scholar] [CrossRef]
- Kumar, L.; Futschik, M.E. Mfuzz: A Software Package for Soft Clustering of Microarray Data. Bioinformation 2007, 2, 5–7. [Google Scholar] [CrossRef]
- Yanai, I.; Benjamin, H.; Shmoish, M.; Chalifa-Caspi, V.; Shklar, M.; Ophir, R.; Bar-Even, A.; Horn-Saban, S.; Safran, M.; Domany, E.; et al. Genome-Wide Midrange Transcription Profiles Reveal Expression Level Relationships in Human Tissue Specification. Bioinformatics 2005, 21, 650–659. [Google Scholar] [CrossRef]
- Kryuchkova-Mostacci, N.; Robinson-Rechavi, M. A Benchmark of Gene Expression Tissue-Specificity Metrics. Briefings Bioinf. 2017, 18, 205–214. [Google Scholar] [CrossRef]
- Cantalapiedra, C.P.; Hernández-Plaza, A.; Letunic, I.; Bork, P.; Huerta-Cepas, J. eggNOG-Mapper v2: Functional Annotation, Orthology Assignments, and Domain Prediction at the Metagenomic Scale. Mol. Biol. Evol. 2021, 38, 5825–5829. [Google Scholar] [CrossRef]
- Altschul, S.F.; Gish, W.; Miller, W.; Myers, E.W.; Lipman, D.J. Basic Local Alignment Search Tool. J. Mol. Biol. 1990, 215, 403–410. [Google Scholar] [CrossRef]
- Kanehisa, M.; Furumichi, M.; Tanabe, M.; Sato, Y.; Morishima, K. KEGG: New Perspectives on Genomes, Pathways, Diseases and Drugs. Nucleic Acids Res. 2017, 45, D353–D361. [Google Scholar] [CrossRef] [PubMed]
- Wu, T.; Hu, E.; Xu, S.; Chen, M.; Guo, P.; Dai, Z.; Feng, T.; Zhou, L.; Tang, W.; Zhan, L.; et al. clusterProfiler 4.0: A Universal Enrichment Tool for Interpreting Omics Data. The Innovation 2021, 2, 100141. [Google Scholar] [CrossRef]
- The Gene Ontology Consortium The Gene Ontology Resource: 20 Years and Still GOing Strong. Nucleic Acids Res. 2019, 47, D330–D338. [CrossRef]
- The UniProt Consortium UniProt: A Worldwide Hub of Protein Knowledge. Nucleic Acids Res. 2019, 47, D506–D515. [CrossRef]
- Mei, Y.; Jing, D.; Tang, S.; Chen, X.; Chen, H.; Duanmu, H.; Cong, Y.; Chen, M.; Ye, X.; Zhou, H.; et al. InsectBase 2.0: a comprehensive gene resource for insects. Nucleic Acids Res. 2022, 50, D1040–D1045. [Google Scholar] [CrossRef]
- El-Gebali, S.; Mistry, J.; Bateman, A.; Eddy, S.R.; Luciani, A.; Potter, S.C.; Qureshi, M.; Richardson, L.J.; Salazar, G.A.; Smart, A.; et al. The Pfam Protein Families Database in 2019. Nucleic Acids Res. 2019, 47, D427–D432. [Google Scholar] [CrossRef] [PubMed]
- Eddy, S.R. Accelerated Profile HMM Searches. PLoS Comput. Biol. 2011, 7, e1002195. [Google Scholar] [CrossRef]
- Vizueta, J.; Sánchez-Gracia, A.; Rozas, J. bitacora : a comprehensive tool for the identification and annotation of gene families in genome assemblies. Mol. Ecol. Resour. 2020, 20, 1445–1452. [Google Scholar] [CrossRef] [PubMed]
- Hao, Z.; Lv, D.; Ge, Y.; Shi, J.; Weijers, D.; Yu, G.; Chen, J. RIdeogram: Drawing SVG Graphics to Visualize and Map Genome-Wide Data on the Idiograms. PeerJ, Comput. Sci. 2020, 6, e251. [Google Scholar] [CrossRef]
- Wu, J.J.; Chen, F.; Yang, R.; Shen, C.H.; Ze, L.J.; Jin, L.; Li, G.Q. Knockdown of Ecdysone-Induced Protein 93F Causes Abnormal Pupae and Adults in the Eggplant Lady Beetle. Biology 2022, 11, 1640. [Google Scholar] [CrossRef]
- Mohammadi, M.A.; Mansouri, M.; Derakhshani, A.; Rezaie, M.; Borhani, M.; Nasibi, S.; Mousavi, S.M.; Afgar, A.; Macchiaroli, N.; Rosenzvit, M.C.; et al. MicroRNA-Transcription Factor Regulatory Networks in the Early Strobilar Development of Echinococcus Granulosus Protoscoleces. BMC Genomics 2023, 24, 114. [Google Scholar] [CrossRef]
- Meech, R.; Hu, D.G.; McKinnon, R.A.; Mubarokah, S.N.; Haines, A.Z.; Nair, P.C.; Rowland, A.; Mackenzie, P.I. The UDP-Glycosyltransferase (UGT) Superfamily: New Members, New Functions, and Novel Paradigms. Physiol. Rev. 2019, 99, 1153–1222. [Google Scholar] [CrossRef] [PubMed]
- Dermauw, W.; Van Leeuwen, T.; Feyereisen, R. Diversity and Evolution of the P450 Family in Arthropods. Insect Biochem. Mol. Biol. 2020, 127, 103490. [Google Scholar] [CrossRef] [PubMed]
- Katsavou, E.; Riga, M.; Ioannidis, P.; King, R.; Zimmer, C.T.; Vontas, J. Functionally Characterized Arthropod Pest and Pollinator Cytochrome P450s Associated with Xenobiotic Metabolism. Pestic. Biochem. Physiol. 2022, 181, 105005. [Google Scholar] [CrossRef]
- Swevers, L. An Update on Ecdysone Signaling during Insect Oogenesis. Curr. Opin. Insect Sci. 2019, 31, 8–13. [Google Scholar] [CrossRef]
- Santos, C.G.; Humann, F.C.; Hartfelder, K. Juvenile Hormone Signaling in Insect Oogenesis. Curr Opin Insect Sci 2019, 31, 43–48. [Google Scholar] [CrossRef]
- Bock, K.W. The UDP-Glycosyltransferase (UGT) Superfamily Expressed in Humans, Insects and Plants: Animal-Plant Arms-Race and Co-Evolution. Biochem Pharmacol 2016, 99, 11–17. [Google Scholar] [CrossRef] [PubMed]
- Yang, X.-Y.; Yang, W.; Zhao, H.; Wang, B.-J.; Shi, Y.; Wang, M.-Y.; Liu, S.-Q.; Liao, X.-L.; Shi, L. Functional Analysis of UDP-Glycosyltransferase Genes Conferring Indoxacarb Resistance in Spodoptera Litura. Pestic. Biochem. Physiol. 2023, 196, 105589. [Google Scholar] [CrossRef]
- Zhang, S.; Wang, X.; Yang, Q.; Xia, Q.; Zhao, Y.; Zheng, X.; Zhang, Y.; Liu, K. Isopropyl 3-(3,4-Dihydroxyphenyl)-2-Hydroxypropanoate Plays an Anti-Hypoxic Role through Regulating Neuroactive Ligand-Receptor Interaction Signaling Pathway in Larval Zebrafish. Biomed. Pharmacother. = Biomed. Pharmacother. 2023, 161, 114570. [Google Scholar] [CrossRef]
- Frenguelli, B.G. The Glutamatergic Synapse - a Key Hub in Neuronal Metabolism, Signalling and Plasticity. Neuropharmacology 2022, 207, 108945. [Google Scholar] [CrossRef]
Figure 1.
Summary of differentially expressed genes (DEGs). (A) Principal component analysis (PCA) of 27 samples. (B) Number of up- and down- regulated DEGs across the nine comparison groups. (C) Number of comparison groups in which each DEG was identified.
Figure 1.
Summary of differentially expressed genes (DEGs). (A) Principal component analysis (PCA) of 27 samples. (B) Number of up- and down- regulated DEGs across the nine comparison groups. (C) Number of comparison groups in which each DEG was identified.
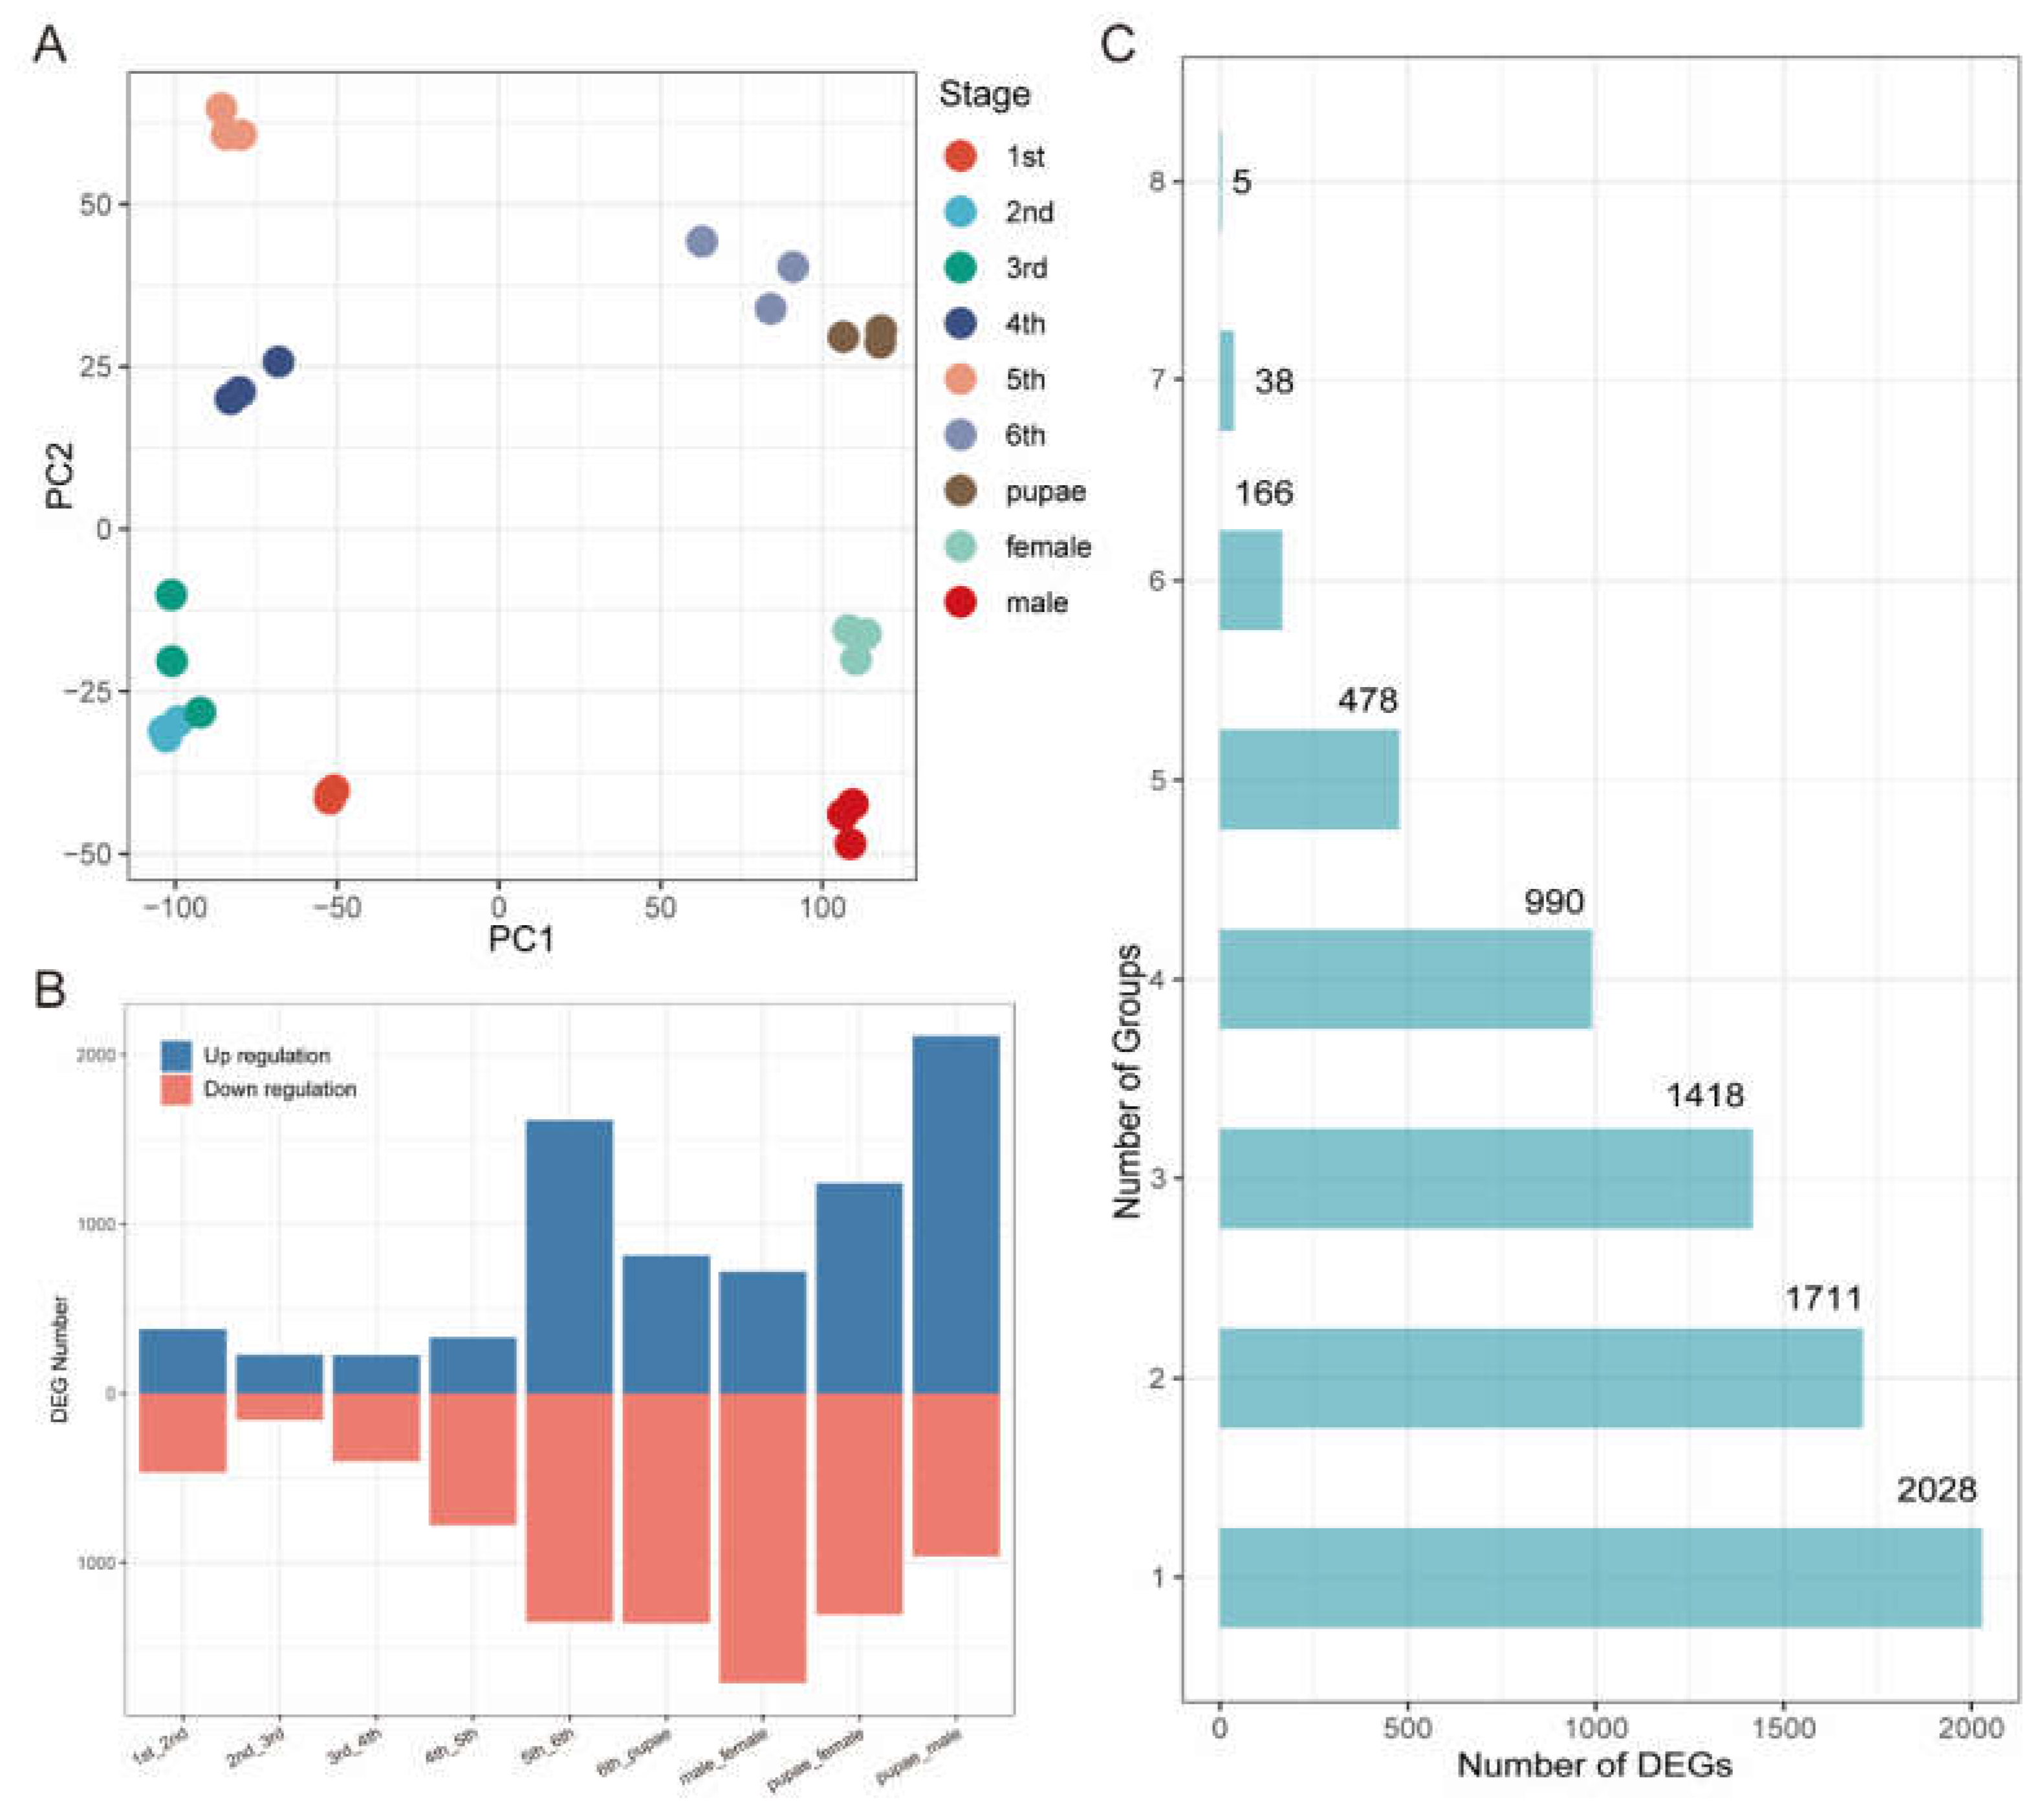
Figure 2.
Time-series analysis of 6,834 DEGs performed by Mfuzz. The numbers 1 through 9 on the horizontal axis correspond to the developmental stages: 1st instar, 2nd instar, 3rd instar, 4th instar, 5th instar, 6th instar, pupae, female adults, and male adults, respectively.
Figure 2.
Time-series analysis of 6,834 DEGs performed by Mfuzz. The numbers 1 through 9 on the horizontal axis correspond to the developmental stages: 1st instar, 2nd instar, 3rd instar, 4th instar, 5th instar, 6th instar, pupae, female adults, and male adults, respectively.
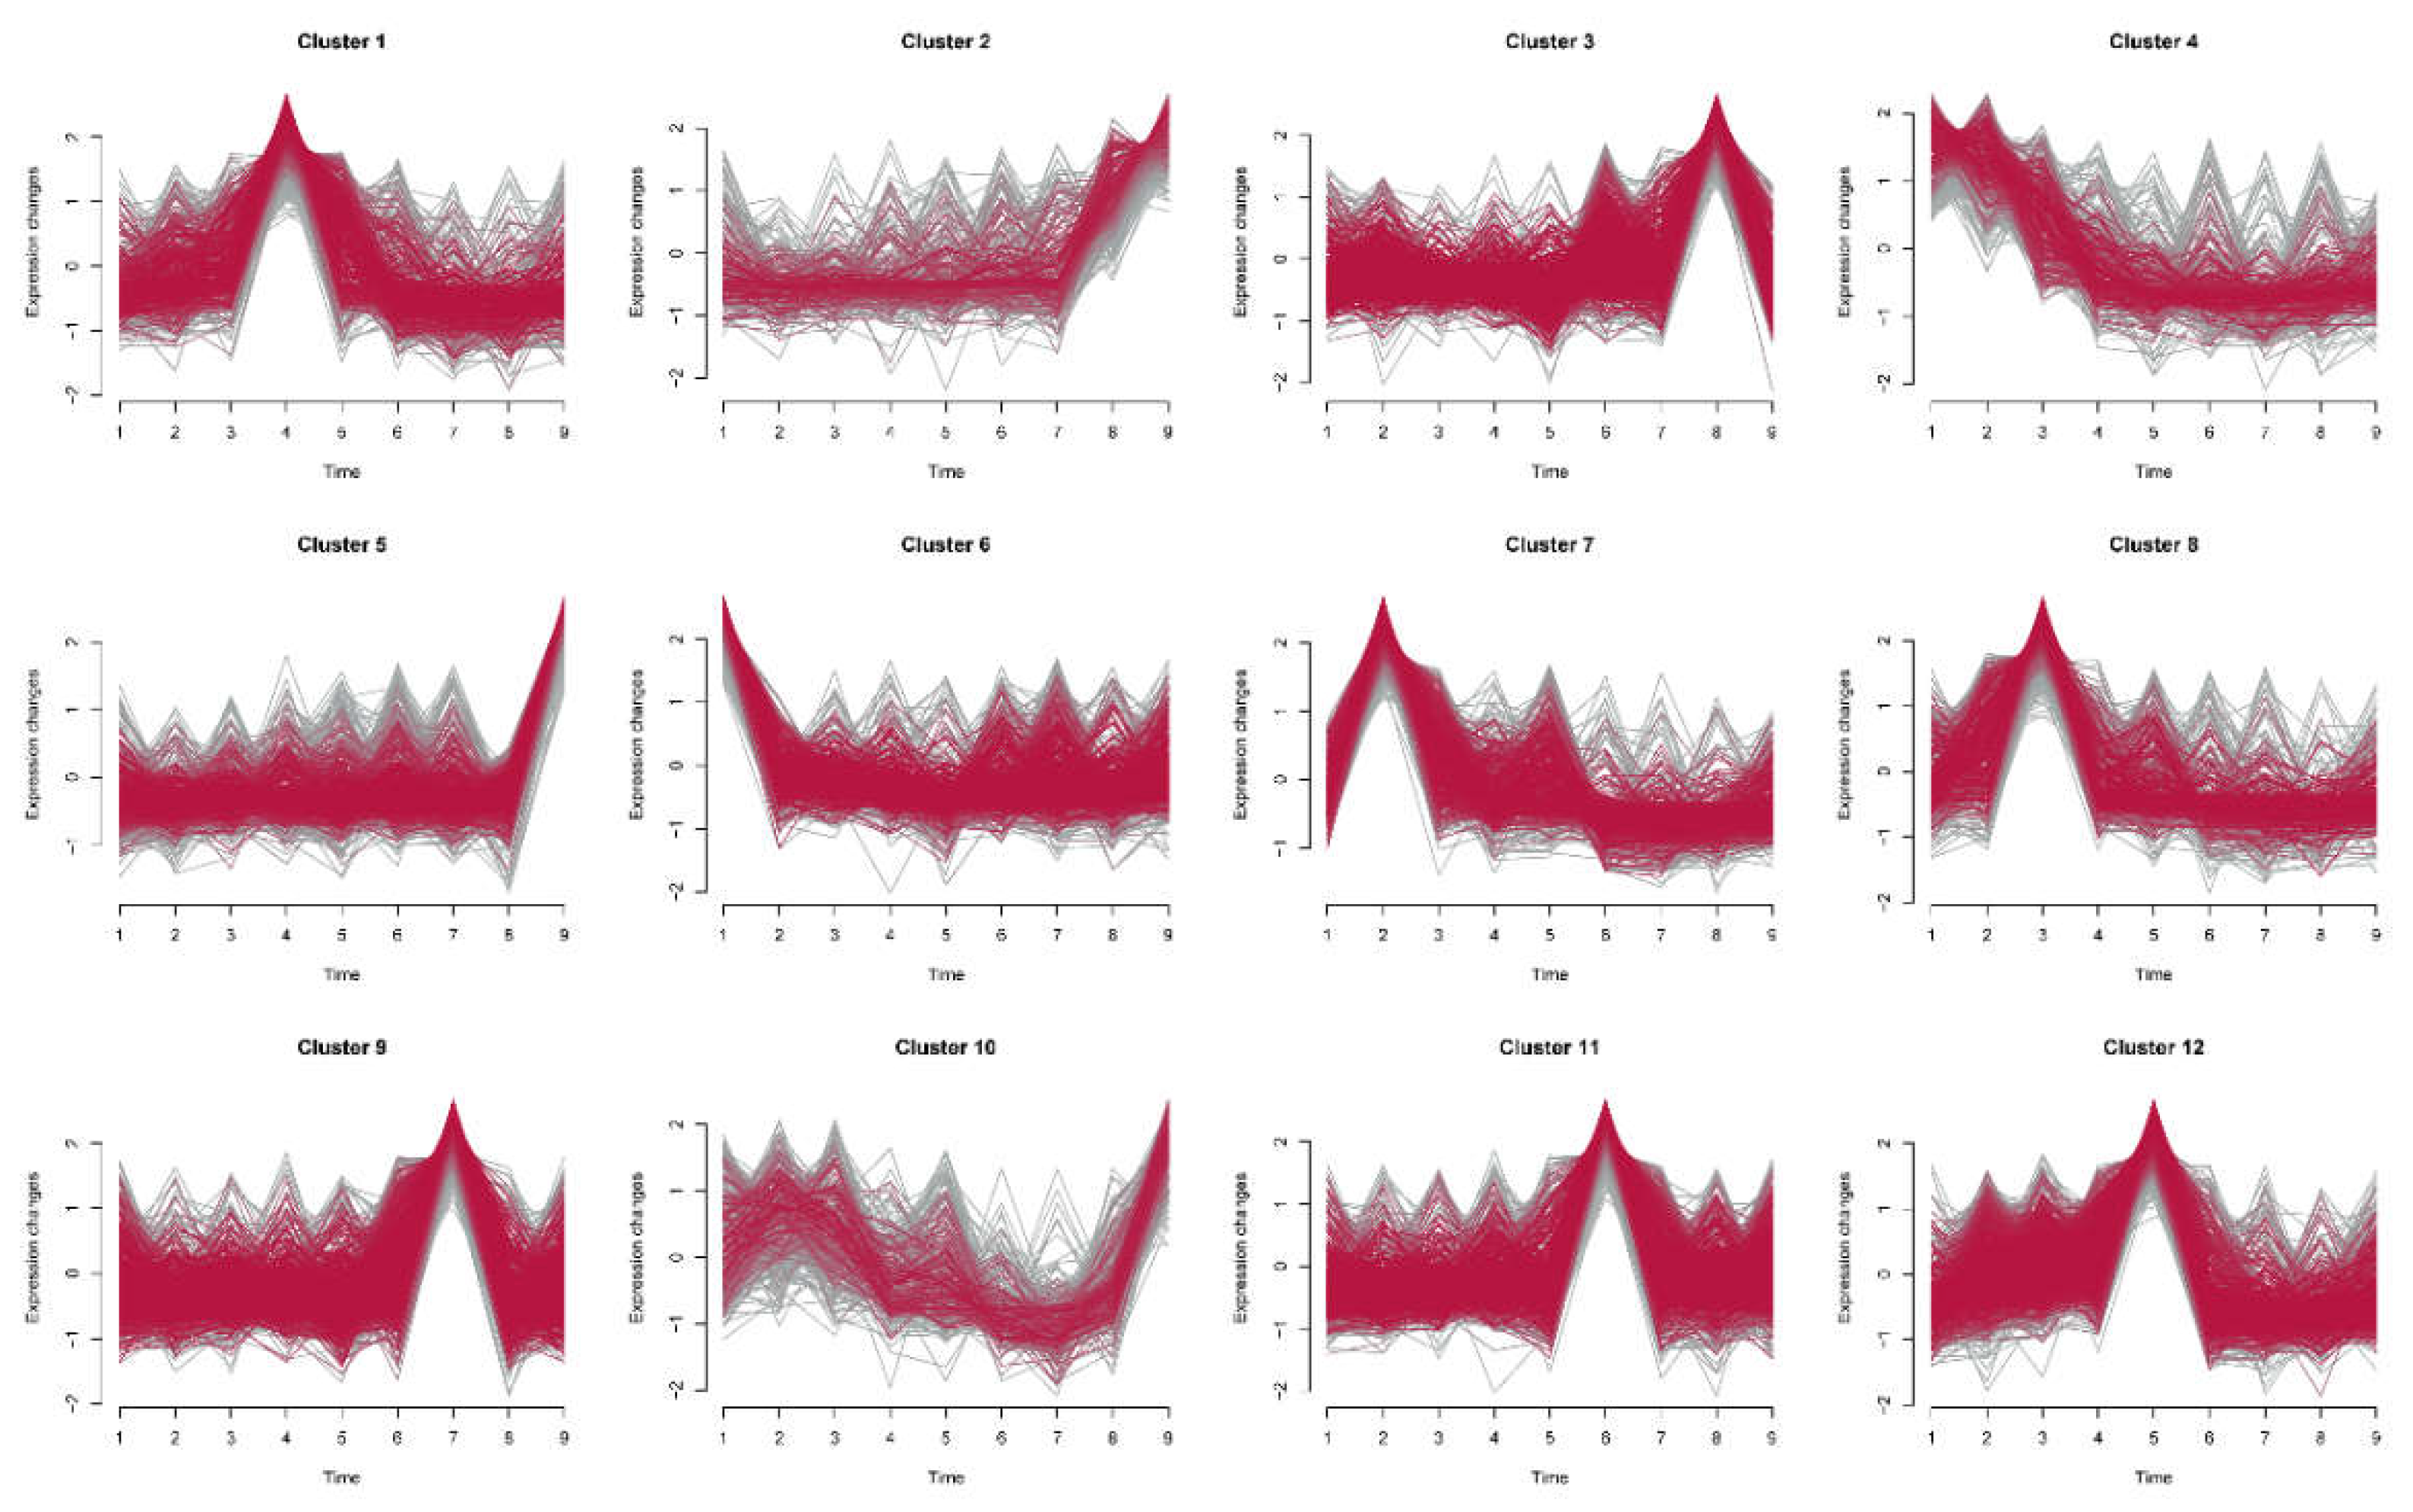
Figure 3.
Expression pattens of five widely shared DEGs. The normalized expression data are presented after log₁₀ transformation. The numbers 1 through 9 on the horizontal axis correspond to the developmental stages: 1st instar, 2nd instar, 3rd instar, 4th instar, 5th instar, 6th instar, pupae, female adults, and male adults, respectively.
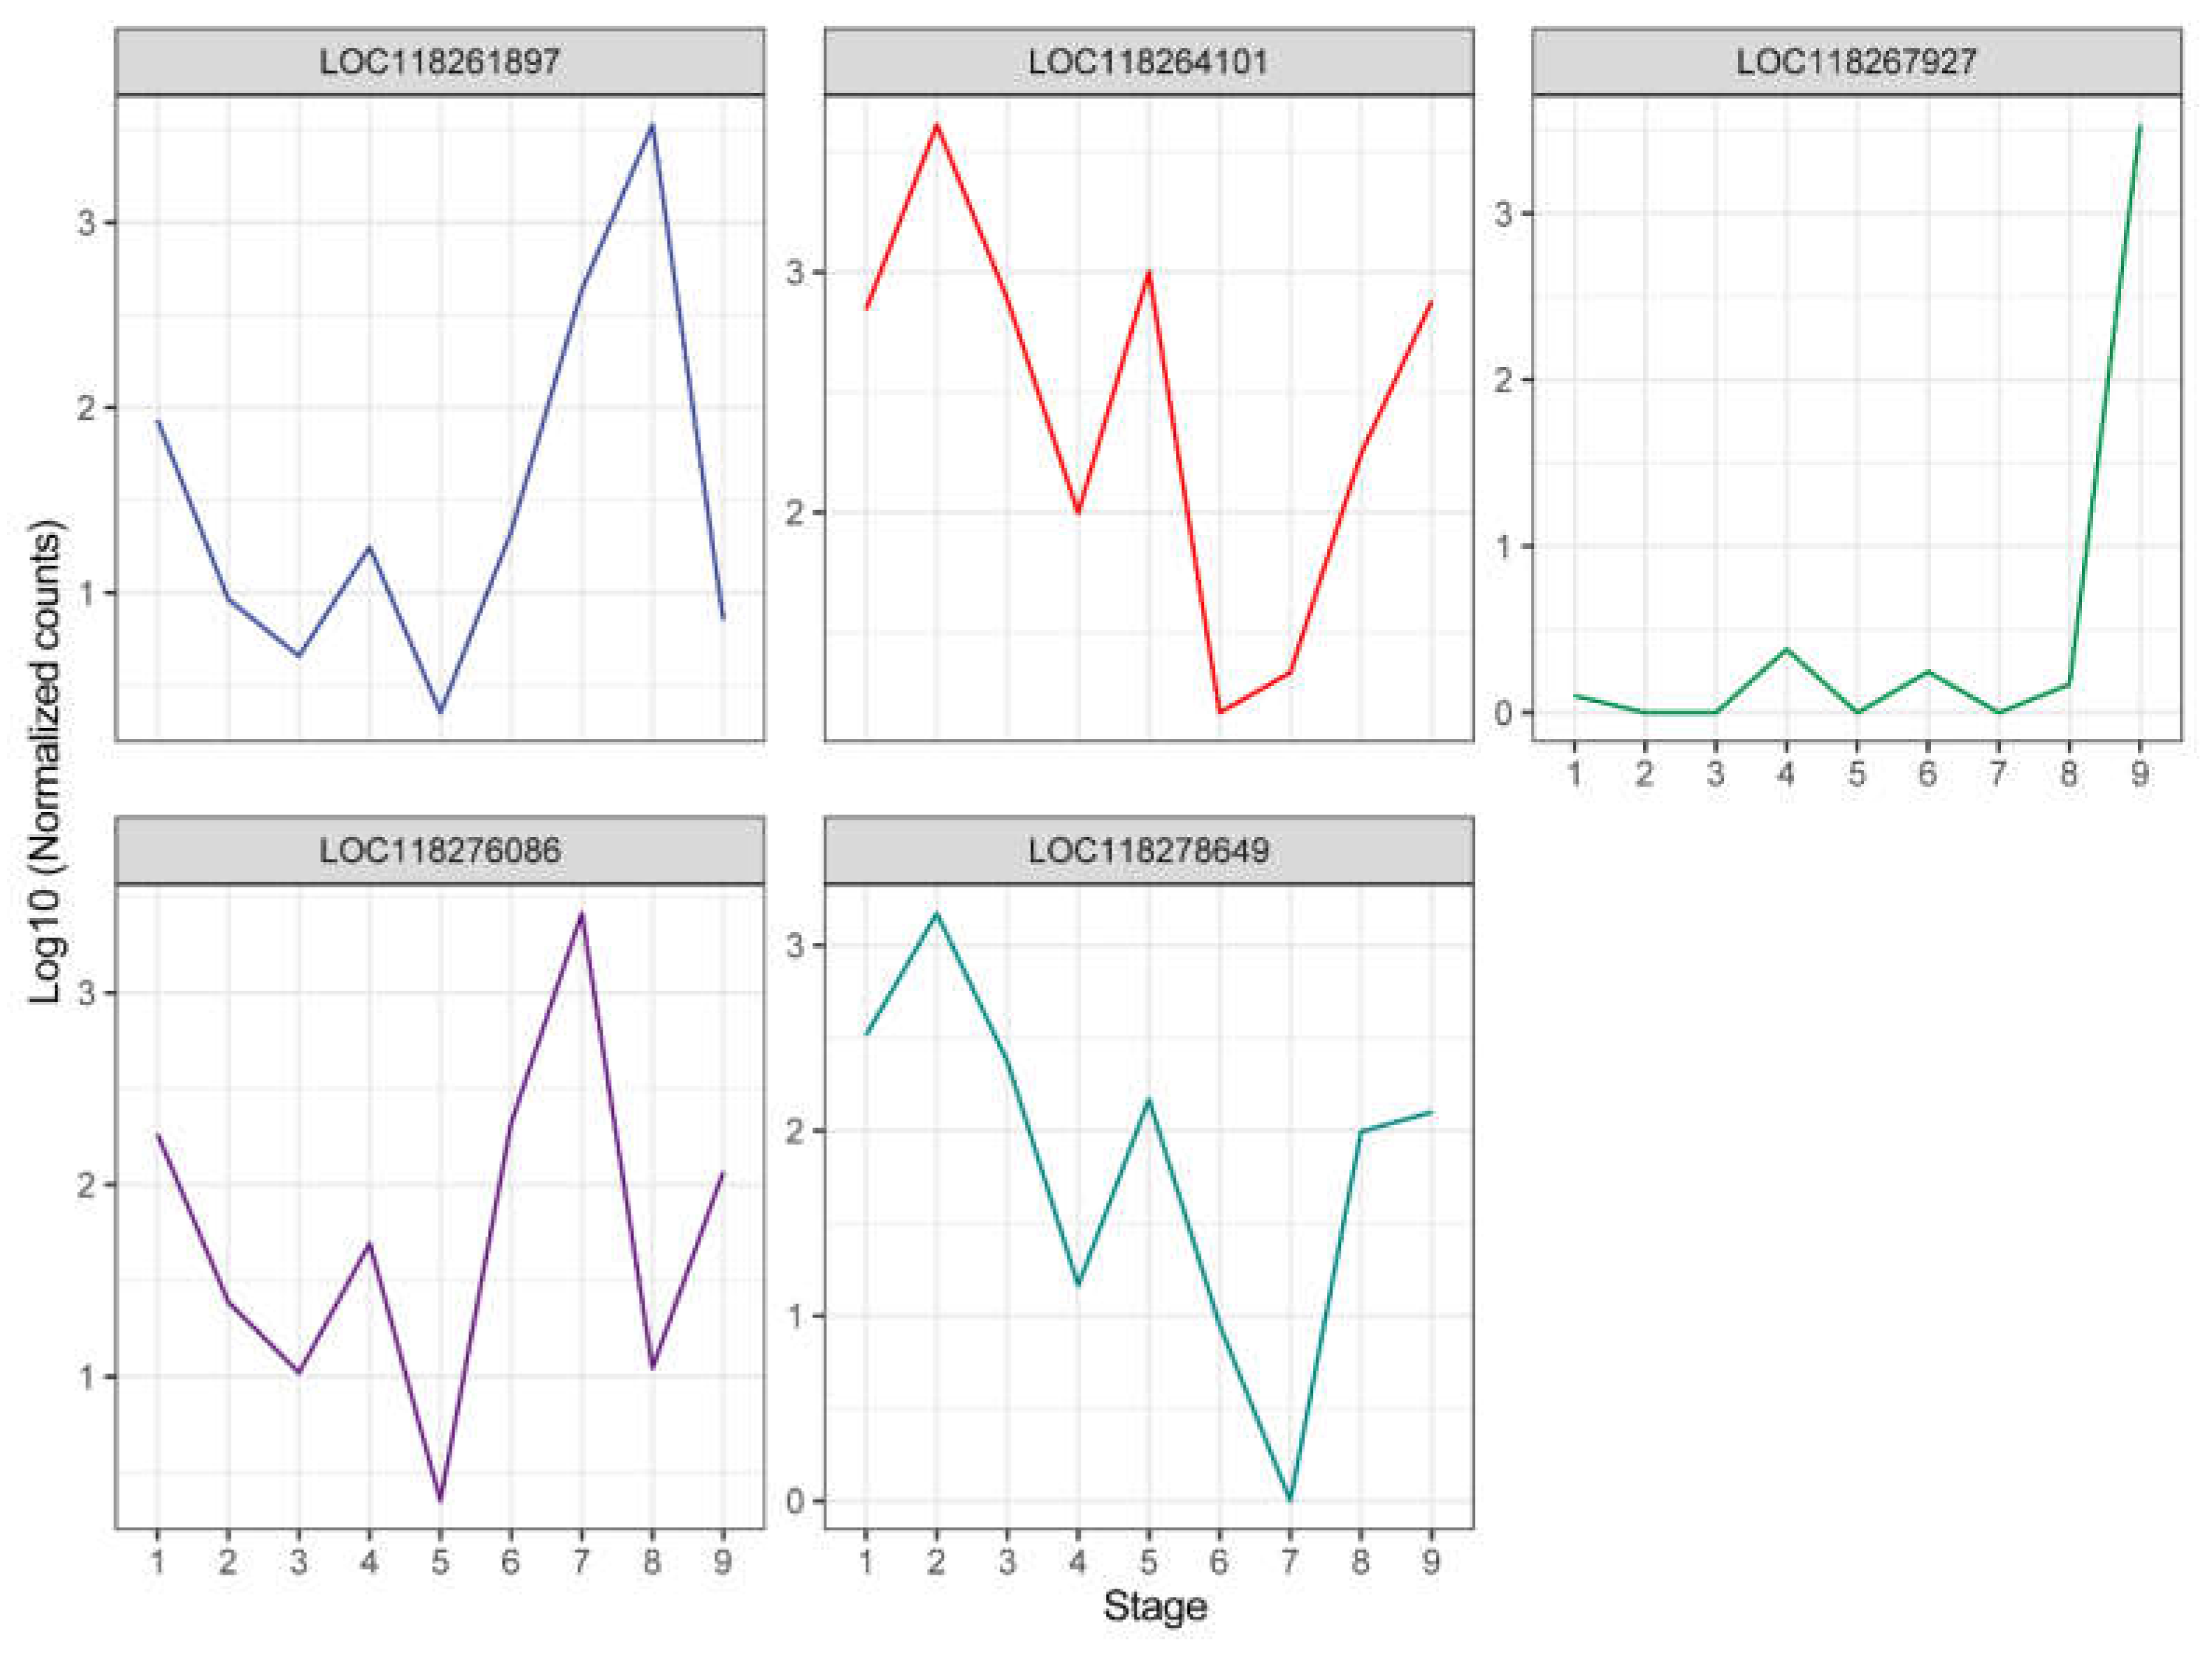
Figure 4.
(A) Distribution of Tau index for 13,622 genes. (B) Number of SSGs identified in different stages.
Figure 4.
(A) Distribution of Tau index for 13,622 genes. (B) Number of SSGs identified in different stages.
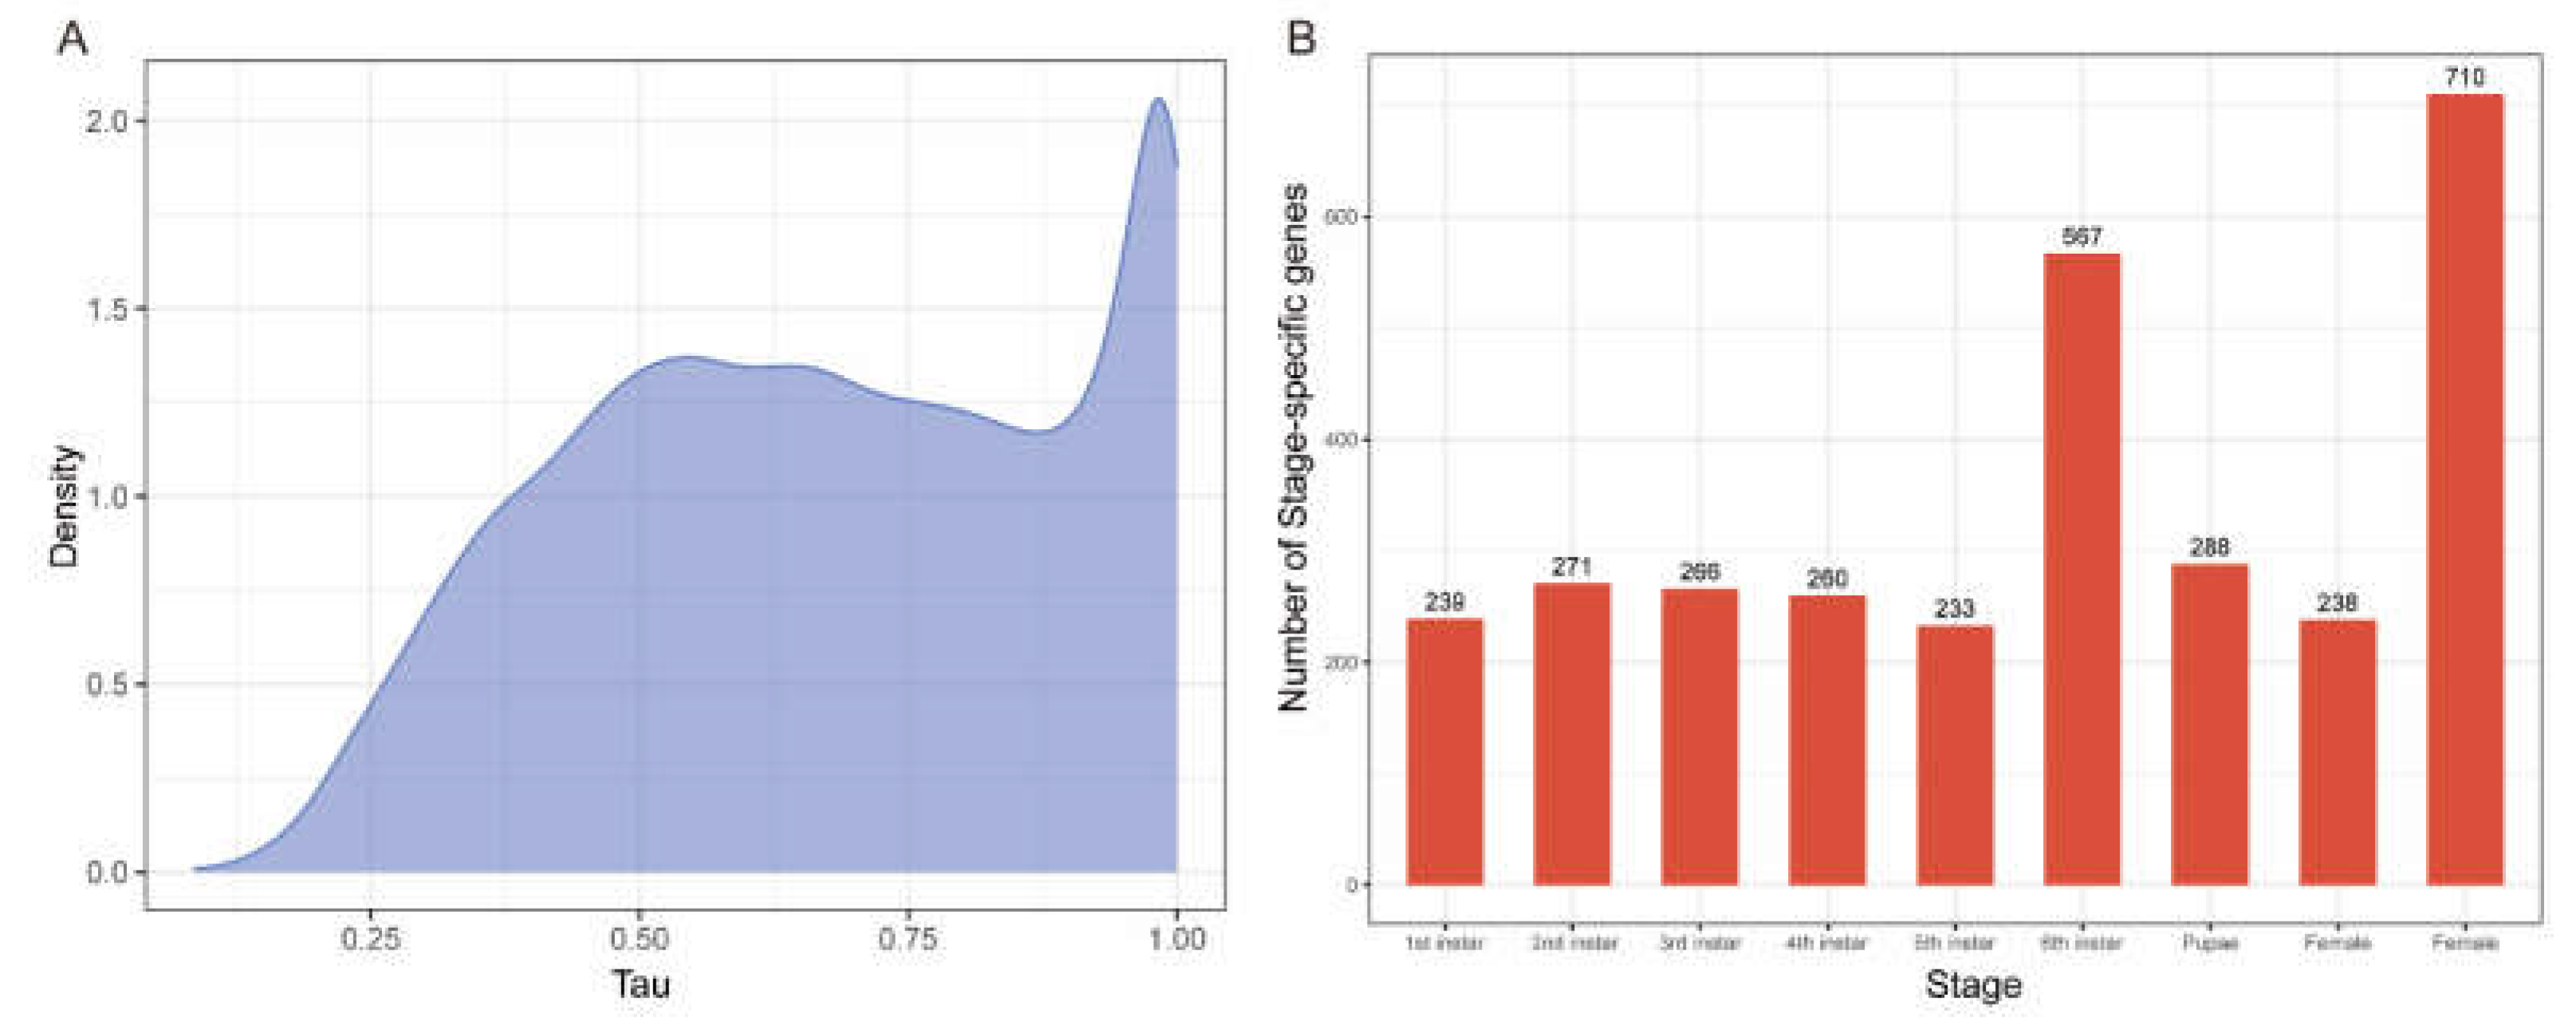
Figure 5.
Gene function enrichment analysis. KEGG pathway enrichment of SSGs in 6th instar (A) and male adults (B). Gene ontology enrichment of SSGs in 6th instar (C) and male adults (D).
Figure 5.
Gene function enrichment analysis. KEGG pathway enrichment of SSGs in 6th instar (A) and male adults (B). Gene ontology enrichment of SSGs in 6th instar (C) and male adults (D).
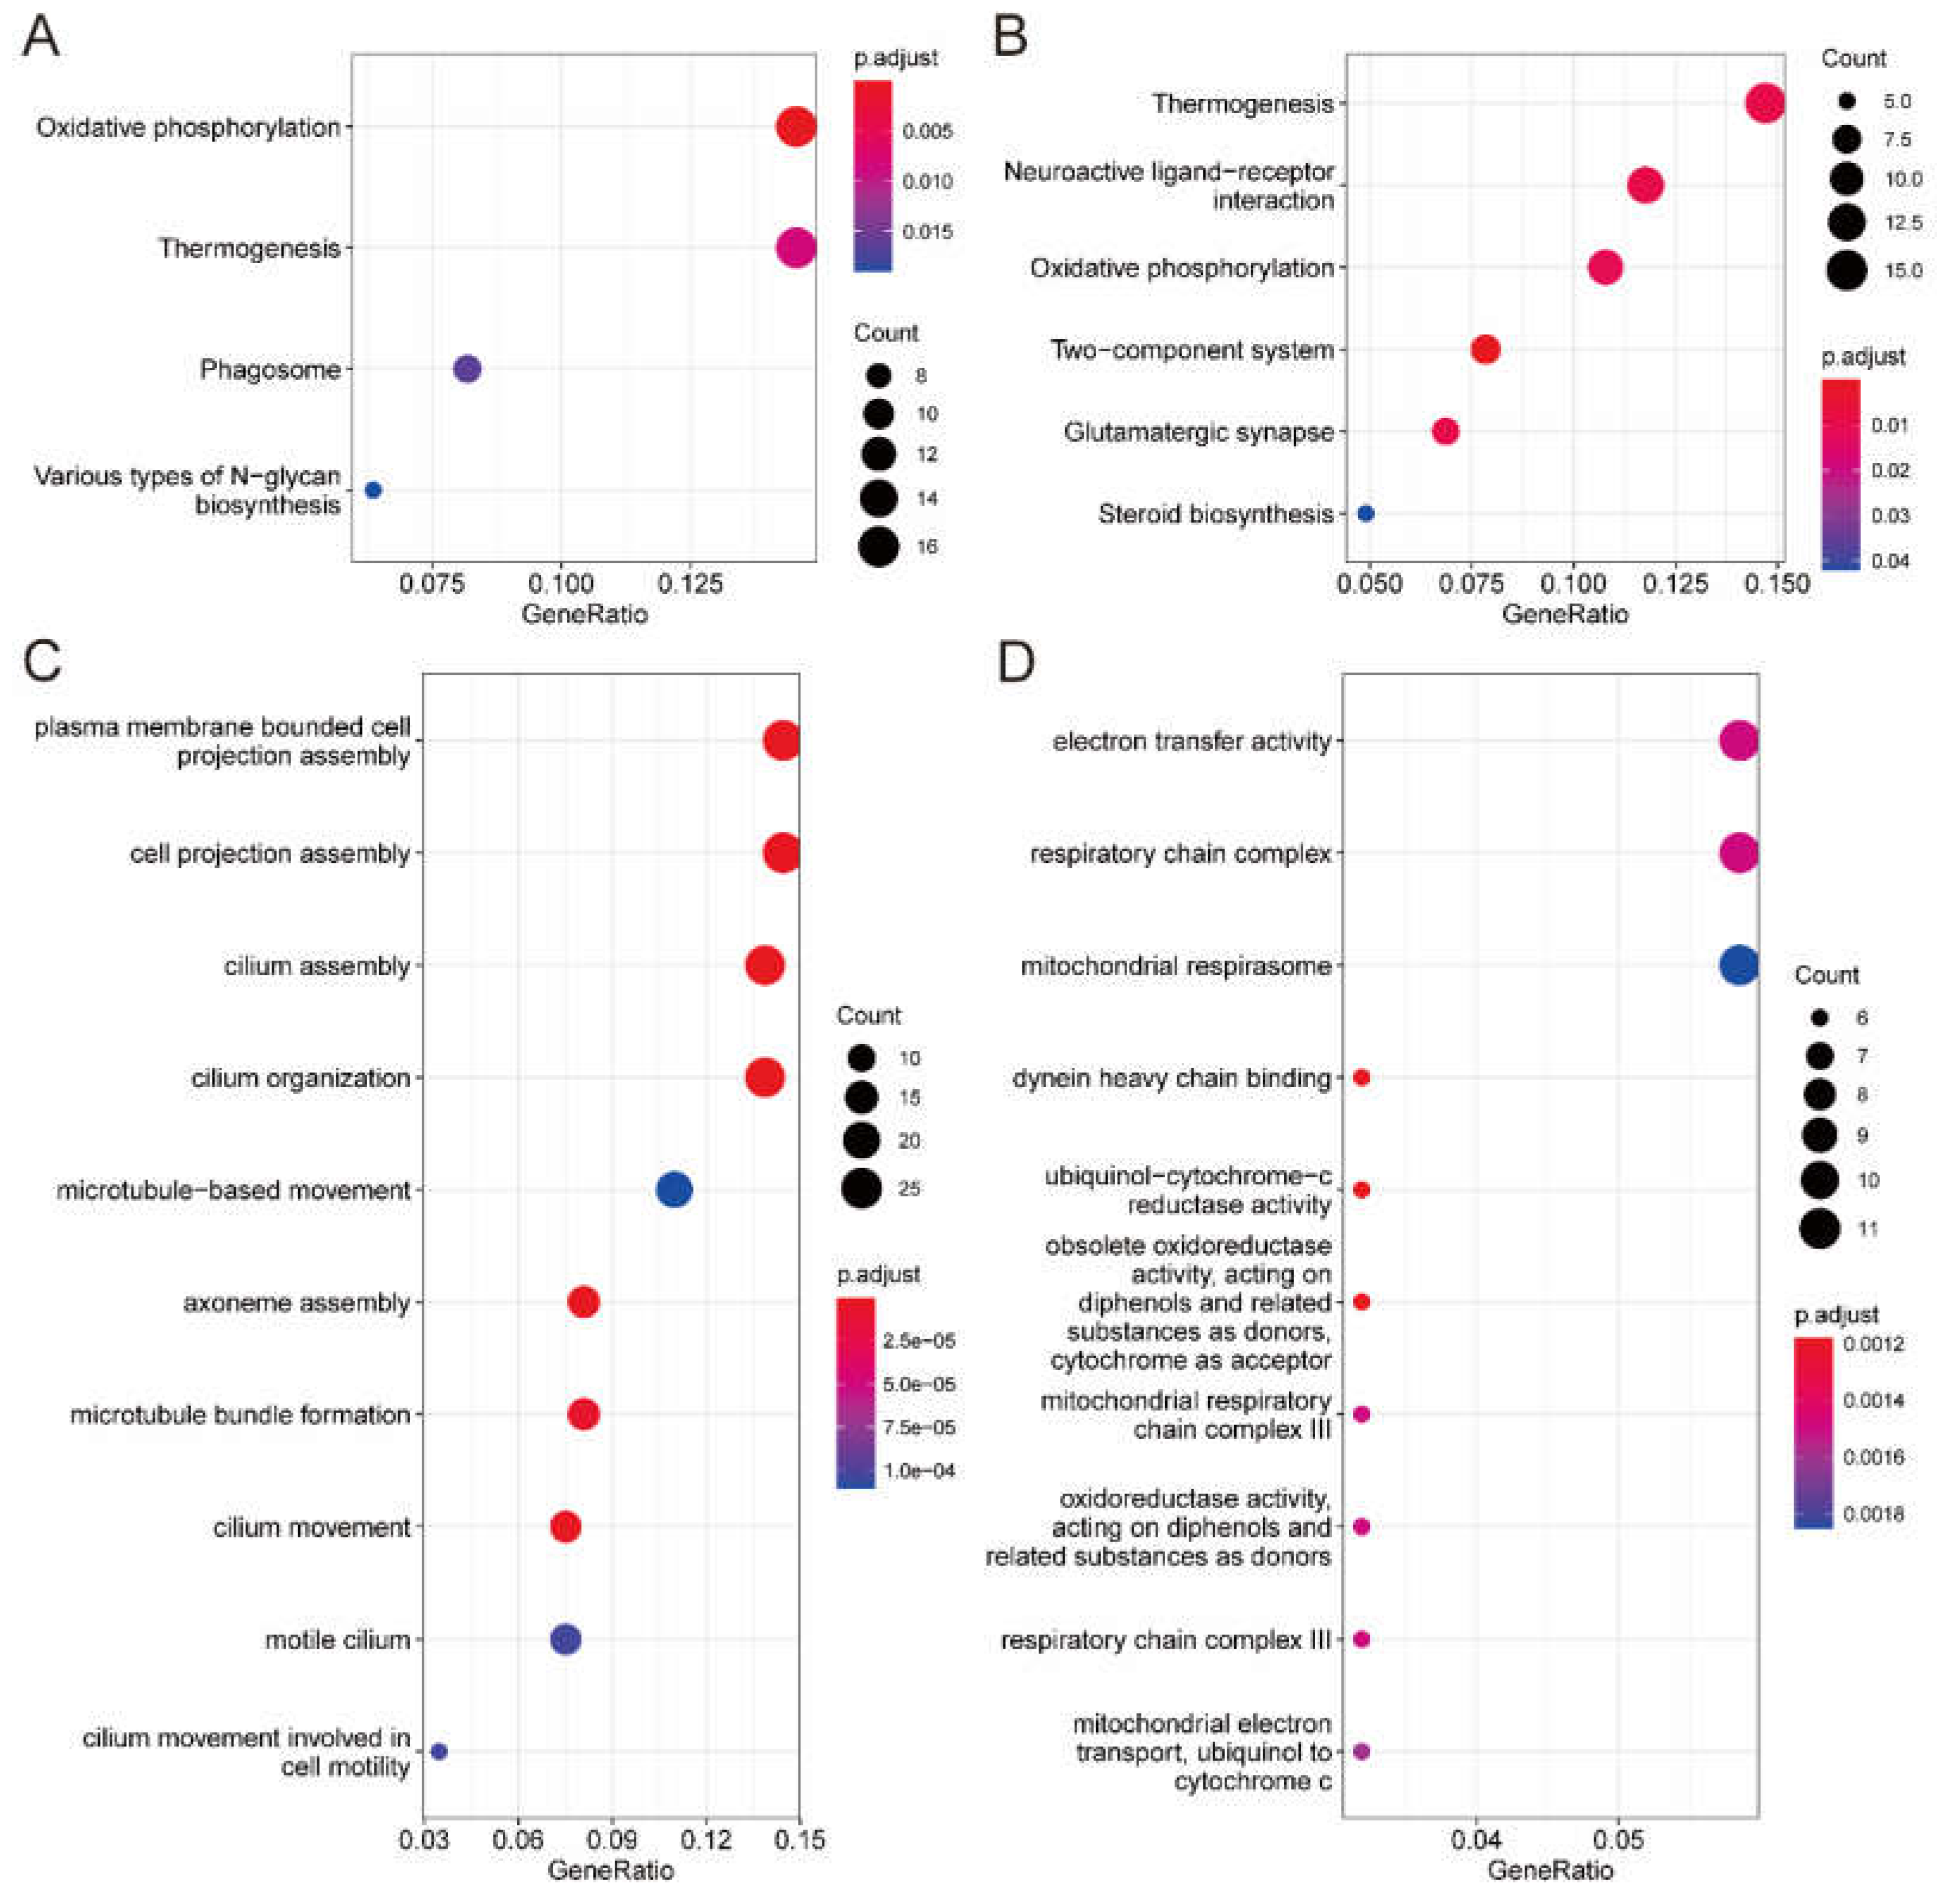
Figure 6.
Visualization of SSGs in 6th instar (colored as red) and male adults (colored as green) for oxidative phosphorylation (map00190).
Figure 6.
Visualization of SSGs in 6th instar (colored as red) and male adults (colored as green) for oxidative phosphorylation (map00190).
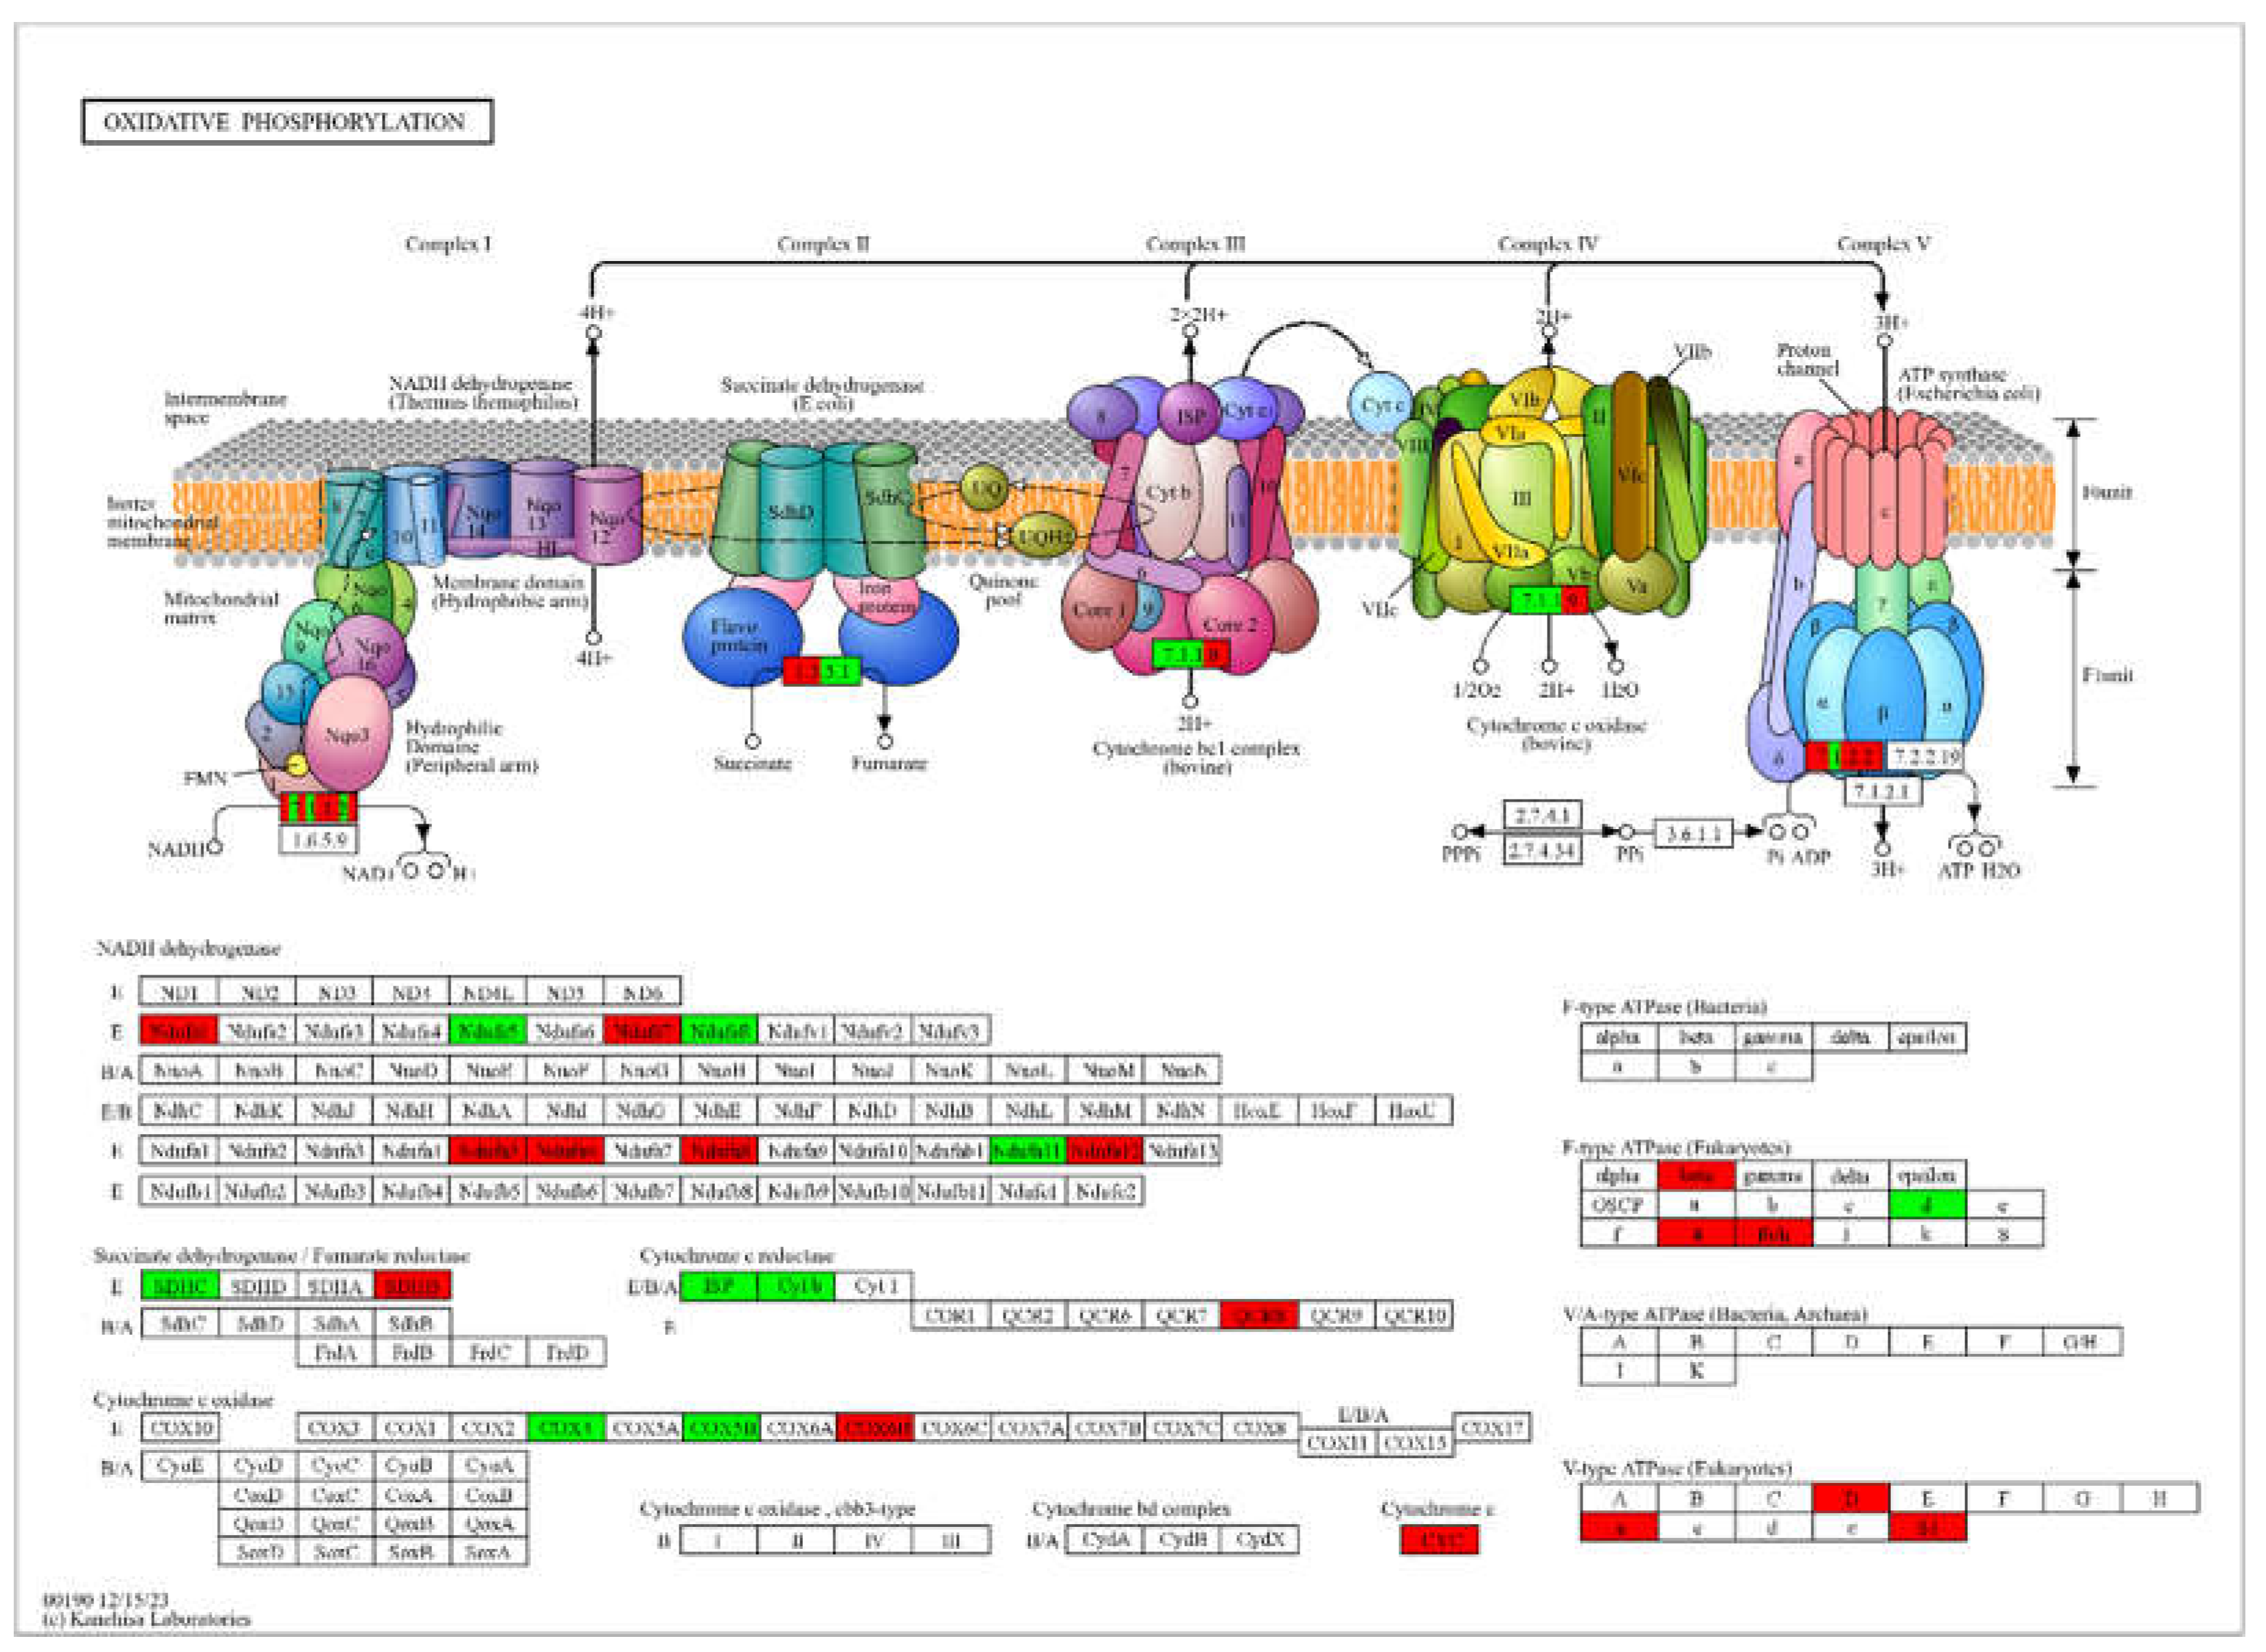
Figure 8.
Chromosomal locations of 104 P450 genes. The dots, shown in different colors, correspond to the P450 clusters depicted in Figure 7.
Figure 8.
Chromosomal locations of 104 P450 genes. The dots, shown in different colors, correspond to the P450 clusters depicted in Figure 7.
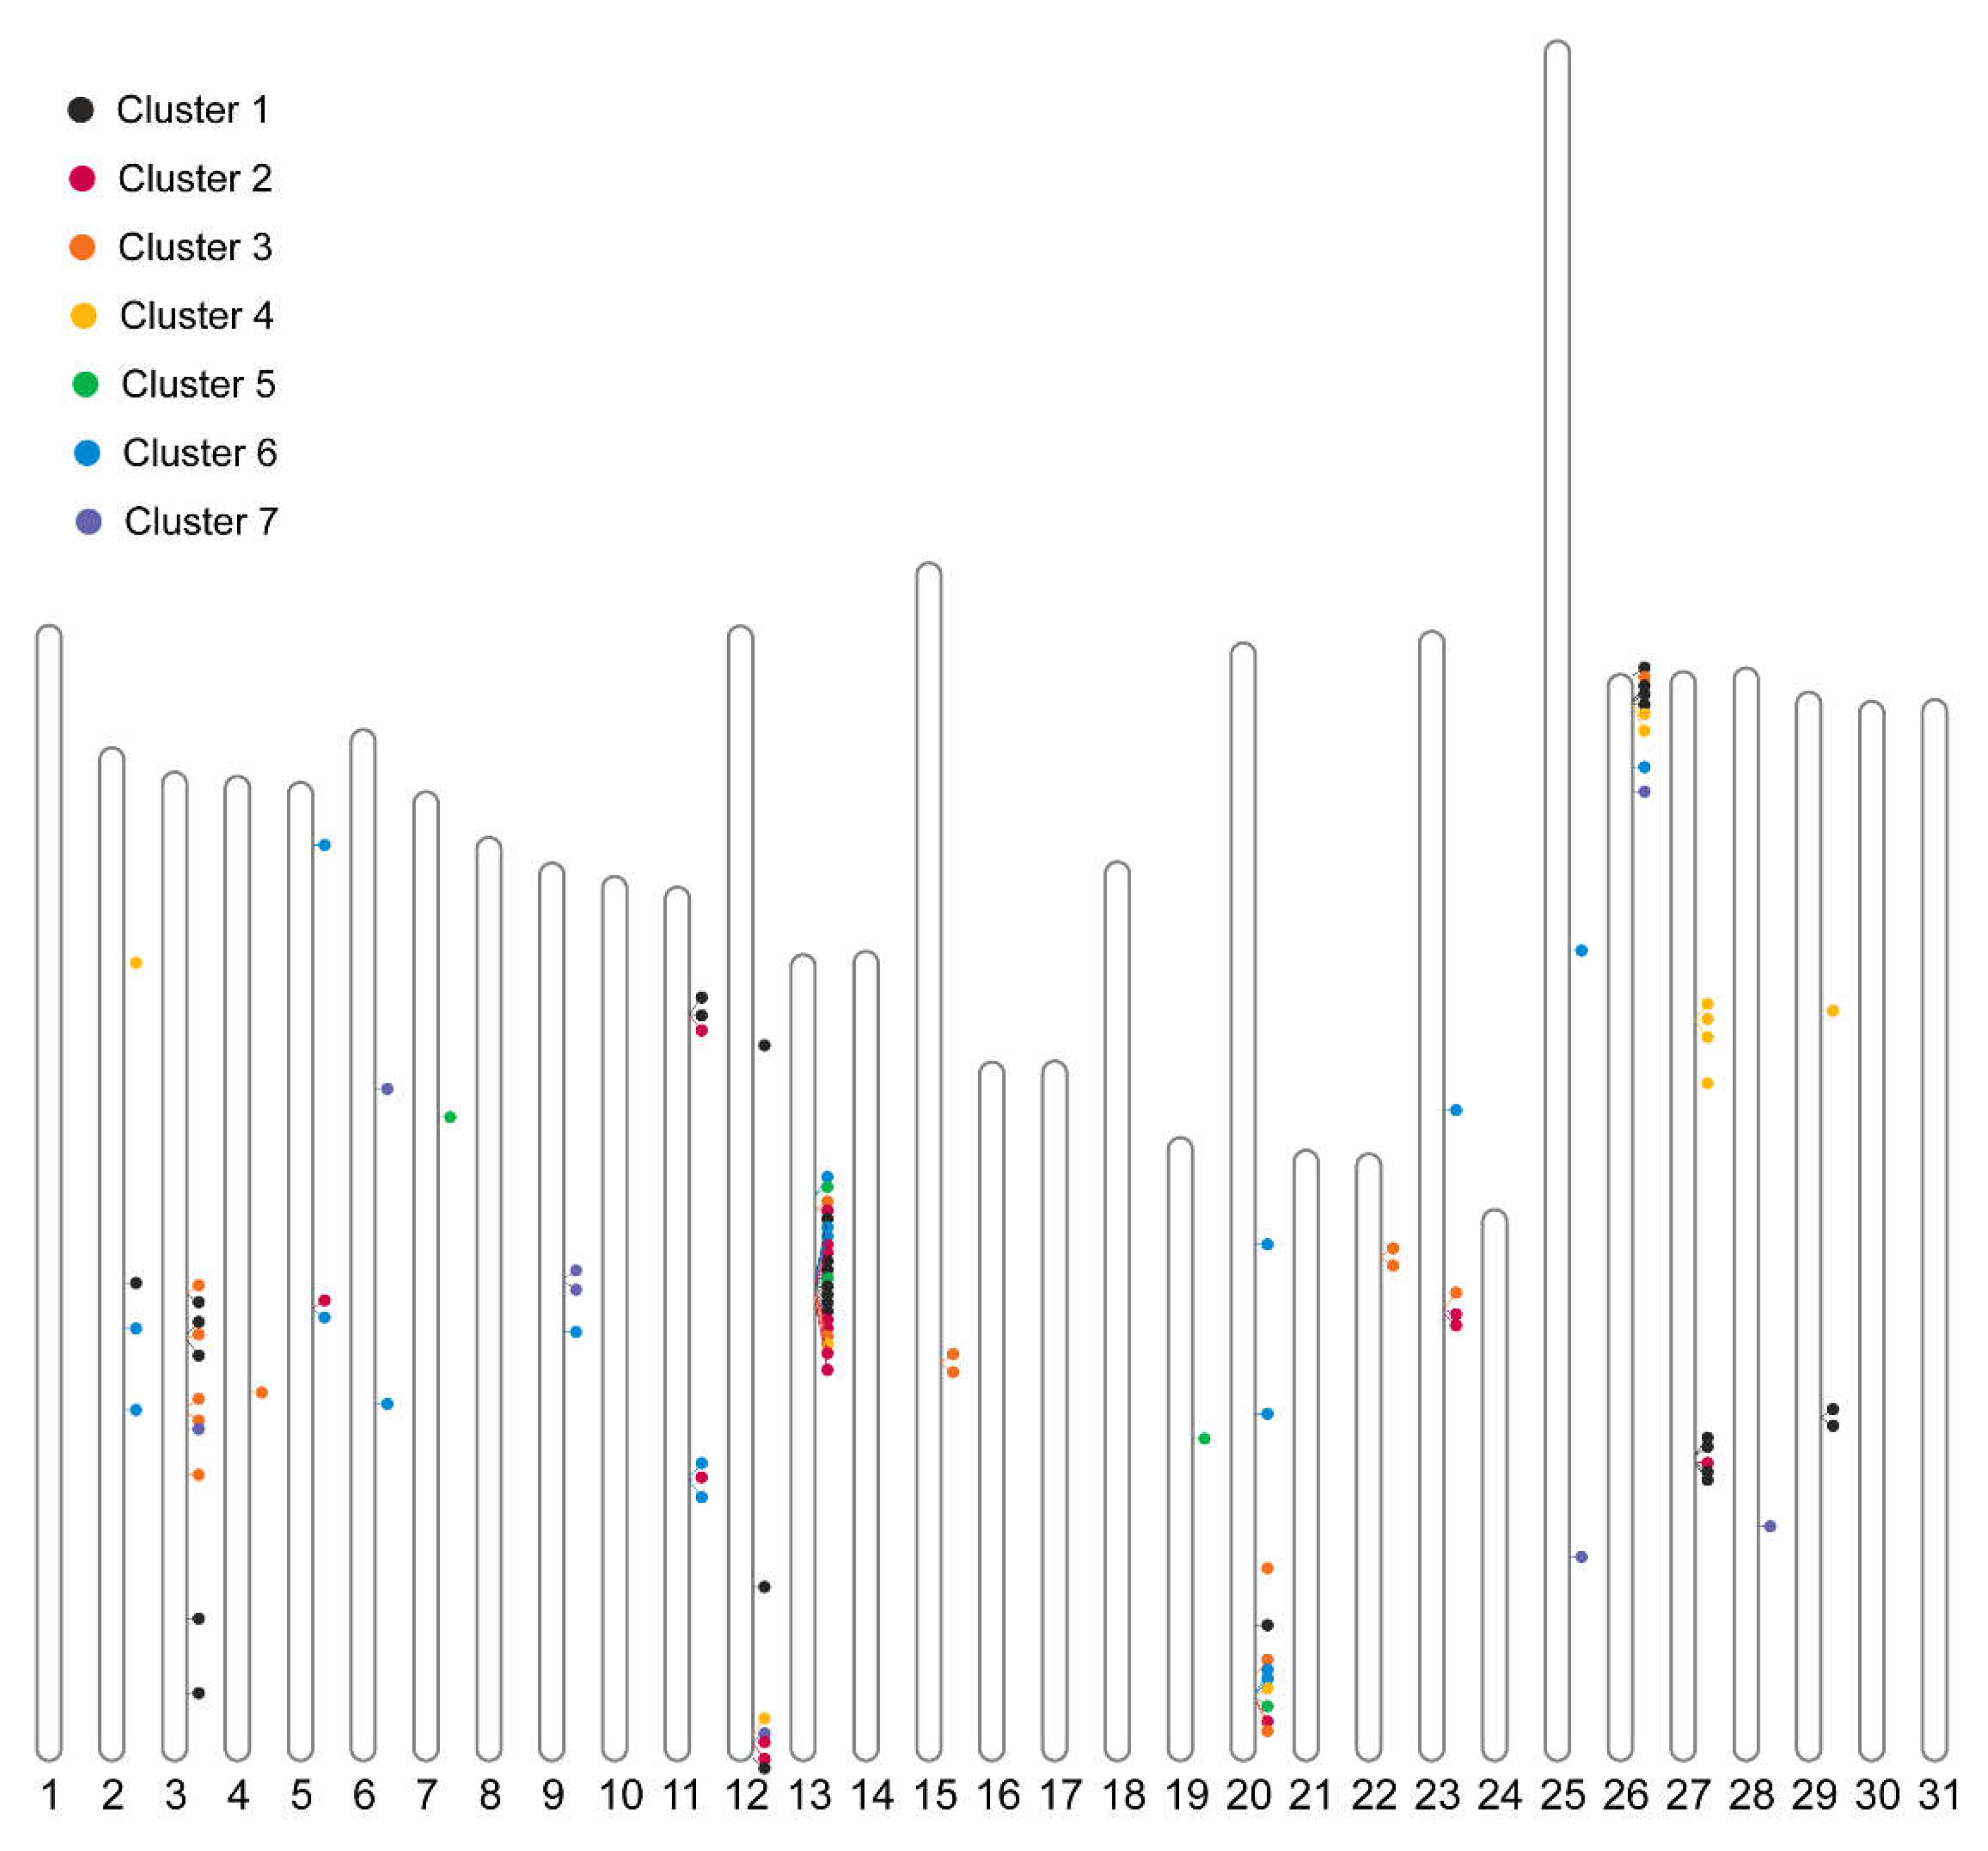

Table 1.
Function annotation of five widely shared DEGs.
| Gene ID | Description |
| LOC118261897 | ecdysone-induced protein 78C |
| LOC118264101 | prostaglandin reductase 1-like |
| LOC118267927 | uncharacterized protein |
| LOC118276086 | uncharacterized protein |
| LOC118278649 | UDP-glycosyltransferase UGT5-like |
Disclaimer/Publisher’s Note: The statements, opinions and data contained in all publications are solely those of the individual author(s) and contributor(s) and not of MDPI and/or the editor(s). MDPI and/or the editor(s) disclaim responsibility for any injury to people or property resulting from any ideas, methods, instructions or products referred to in the content. |
© 2024 by the authors. Licensee MDPI, Basel, Switzerland. This article is an open access article distributed under the terms and conditions of the Creative Commons Attribution (CC BY) license (http://creativecommons.org/licenses/by/4.0/).
Copyright: This open access article is published under a Creative Commons CC BY 4.0 license, which permit the free download, distribution, and reuse, provided that the author and preprint are cited in any reuse.


