
Submitted:
08 November 2024
Posted:
11 November 2024
You are already at the latest version
Abstract
Two decades ago, information and communication technologies were expected to precipitate changes, manifesting in the reorganisation of mobility patterns. The pandemic led to a disruption in the established daily routines, prompting a surge in e-commerce, e-learning and remote working. However, reports indicate disparities in access to e-services and mobility reduction. Nowadays, the prevalence of e-commerce and the practice of remote work is indeed widespread but in-depth analyses are necessary. The objective of this study is to gain a better understanding of teleworking practices and their impact on everyday mobility considering individual’s sociodemographic characteristics in the Metropolitan Region of Barcelona. In this paper, we employ sequence analysis of individual profiles and clustering techniques to examine the impact of teleworking on mobility choices and spatiotemporal patterns. Our results show that there are significant differences in teleworking practices according to the area of residence, education, and having young children in the household. Interestingly, gender does not play a determinant role. This study highlights inequalities, individuals likely to have face-to-face working arrangements tend to have lower education levels, likely to live in poor-deserved public transport areas. The implications of this study are of relevance for transport and city planning policy interventions.
Keywords:
teleworking
; working from home
; presence work
; hybrid working arrangements
; gender
; activity participation
; fragmentation
; sequence analysis
1. Introduction
Prior to the outbreak of the pandemic, there was a general consensus that the advent of Information and Communication Technologies (ICTs) would result in significant shifts in our lifestyle patterns, particularly with regard to how travel, for example, to work, shop and spend our leisure time as discussed by Lyons et al. [1]. This would be reflected in the organisation of daily activities, which would result in increased flexibility (in terms of both space and time) in scheduling our daily activities [2,3]. It was assumed that transport systems and transport demand would be affected, given that many activities would no longer be bound to specific times and specific places. Furthermore, as observed by Alexander et al. [4], this may even impact the requirement of dwellings.
It is evident that the pandemic outbreak led to a disruption in the established routines of daily life, prompting a surge in digitalisation activities. This included the exponential growth of e-commerce, teleworking and even e-schooling. However, reports have indicated that there are disparities in access to e-services [5,6]. Moreover, various studies have indicated that during the pandemic, at EU level, certain population groups were more likely to reduce their mobility in a higher proportion than others [7]. For instance, those with a higher socio-economic status [8] or those who were able to work from home (WfH) and were not employed as frontline workers. Fana [9] observed that in the EU, WfH individuals were often high-skilled workers with better wages and contract conditions.
In the decade preceding the pandemic, the proportion of the EU population engaged in remote work was 5.2%, with Spain exhibiting a figure of just 4.3%, according to Eurostat [10,11]. However, the pandemic significantly accelerated the integration of ICTs into everyday life, thereby facilitating the widespread adoption of e-commerce and telework practices [12,13,14].
Immediately following the pandemic, transport authorities informed that the public transport systems had experienced a significant reduction in its transport share compared to previous values [15]. However, more recent analyses have demonstrated that mobility is returning to its pre-pandemic levels [8,16,17].
It may be reasonably deduced that an increase in the utilisation of information and communication technologies (ICTs) for the completion of specific activities may result in a transformation of mobility behaviours, particularly among specific demographic groups and in relation to specific activities. The aim of this study is to unveil the determinants of tele-working practices and their impact on everyday mobility. In this paper, we employ an analysis of individual sequences to elucidate the impact of novel formats of work on transport, accessibility, and activity participation. The Metropolitan Region of Barcelona (RMB) is presented as a case study. This paper aims to gain a better comprehension of the spatiotemporal patterns and travel behaviour in Barcelona, analyse gendered mobility patterns, and discuss which characteristics play a pivotal role in shaping mobility, immobility, and digitalisation of our daily activities after the pandemic outbreak. Our approach is based on sequence analysis, utilising the two most recent mobility surveys in the Metropolitan Region of Barcelona (RMB) and EMEF surveys [17,18].
This paper aims to make a contribution to the existing literature on the impact of recent teleworking schemes on mobility patterns and transport choice after the COVID-19 outbreak. It does so by focusing on the role of individual characteristics, such as gender and socio-demographic and household characteristics in shaping these behaviours. To do so, we use the official EMEF surveys elaborated by the transport authority (ATM), which after 2021 collect information regarding family structure, working arrangements and in these two years fear of infection. At the same time, the paper seeks to make a contribution to the existing studies applying fragmentation indicators in transport behaviour, but using a totally different urban context, where, especially in some areas, multiple alternatives of public transportation are available.
The objectives of this research are the following.
- First, we analyse fragmentation indicators in the light of teleworking arrangements using an exploratory data analysis approach.
- Secondly, we carry out a clustering analysis to classify individuals that have similar mobility patterns.
- Finally, we present a generalised linear model to identify which socio-demographic characteristics play a relevant role in teleworking arrangements.
This paper is divided into four sections and organized as follows. After this introduction, and the literature review, we present the methodological approach and the case study in Section 2. Section 3 presents the results. Finally, we present in section 4 the discussion and the main conclusions and implications of this study.
2. Literature Review
The analysis of travel behaviour has been a prominent area of study for decades, with the objective of designing mobility policies that address the adverse effects of transport, including congestion, pollution, fuel consumption, accidents, time and monetary costs, while promoting sustainable mobility practices. Similarly, the interrelationship between travel behaviour, land-use planning and the negative externalities has been the subject of extensive analysis in multiple studies [19,20,21,22].
Mobility behaviour is a consequence of the built environment, the transport systems available, personal characteristics and social norms in the places where people live. In this regard, numerous authors from around the globe have highlighted the pivotal role of gender in shaping mobility practices [23,24,25,26,27,28]. Gender and life stage are fundamental factors influencing the reasons, modes, destinations, and companions of our mobility practices, as different studies observe [29,30].
The advent of new mobility alternatives is also a result of ICTs. Mobility alternatives, such as micro-mobility or mobility as a service, has recently influenced our mobility patterns. However, equity considerations remain absent from this evolving landscape [31,32]. Furthermore, the use of ICTs also facilitates participation in diverse activities in novel ways, transcending spatial and temporal limitations [33]. Consequently, the adoption of ICTs affects our mobility patterns, as they determine the manner and location in which certain activities, such as shopping and working, are conducted. It is evident that the pandemic served as a catalyst for the replacement of some person-to-person connectivity with virtual mobility. Nevertheless, research has revealed discrepancies between population groups in diverse geographical setting [34]. For instance, Bohman et al. [35] examined the ways in which the option of teleworking in Malmö (Sweden), differed among population groups, gender, and residential locations. Thulin et al. [36] employed a qualitative approach to investigate WfH after confinement in Sweden. The interviewees proffered a number of reasons for the continuation of WfH (at least partially), including efficiency when WfH, a slower pace of life, reduced time pressure and stress, commuter time savings, climate benefits, and others. It is noteworthy that the sample in question exhibited an overrepresentation of individuals with children residing in the household. Asmussen et al. [37] studied telework arrangements using a sample of workers in the state of Texas, before and after COVID. Their results show that women, individuals residing in rural settings, lower income, and in smaller homes with no private study-room in their residence, do not telework at the same levels of their counterparts.
2.1. Sequence analysis (SA) and Clustering Technique
As previously outlined, the complexity of individual travel behaviour has been analysed through the utilisation of diverse approaches and techniques pertaining to data analysis [38]. In recent decades, there has been a notable advancement in the development of more sophisticated models, including activity-based models [36]. One of the aims of activity-based modelling is to build activity sequences of individuals. In this respect, sequence analysis (SA) has emerged as a reliable alterative for representing the manner in which an individual allocates their time across all activities and travel during a day. SA is a method of studying longitudinal data in order to analyse the occurrence of activities or events in a structured manner, with a sequence representing the unit of analysis. A sequence is defined as an ordered list of activities, events or states that describes a person’s day. Sequence methods are a popular approach in the field of social sciences. Studer and Ritschard [39] identify many key aspects when comparing sequences, namely experienced states, distribution, duration, timing, and sequencing.
As observed by [40] the analysing of sequences of daily episodes (including places and trips) is a technique that may be considered preferable to others as the sequences include the entire trajectory of an individual’s entire daily activities. Furthermore, it is possible to evaluate the number and order of activities, together with their duration. Recently, sequence analysis has been applied in mobility analyses across diverse geographical contexts, including California, Barcelona, or Germany [40,41,42], among others.
The concept of fragmentation in sequence analysis pertains to how activities and travel patterns are spatiotemporal organised. This is achieved by subdividing activities into smaller components, which are performed at distinct times and/or locations. As outlined by [43] there are different indicators that may be used to analyse fragmentation. However, in the context of travel behaviour only a subset of these is commonly utilised.
Furthermore, while the underlying mechanisms and motivations behind the spatiotemporal activity fragmentation remain unclear, the categorisation of activity-travel fragmentation into clusters offers a means of elucidating the characteristics of distinct groups. For instance, it enables the establishment of a relationship between the socioeconomic characteristics of the segments and other factors. These are based on similarities within individuals and differences among groups of individuals. Authors such as McBride et al. [39] present a review of dissimilarity measures for sequence analysis. Furthermore, different approaches and examples of cluster analysis have been used to understand sequence analysis and/or activity fragmentation [4,41,44,45,46].
3. Materials and Methods
The SA theory is applied to the Metropolitan Region of Barcelona (RMB), as illustrated in Figure 1. The area is subdivided into thirty-six municipalities within the Metropolitan Area of Barcelona (AMB), which accounts for more than 3.2 million inhabitants. The remaining municipalities in the RMB area, comprising 164 municipalities, are home of 1,848,514 residents. The region is served by a wide public transportation network, comprising more than two hundred bus lines, ten metro lines, fifteen railway lines, and two tramway lines.
A recent report by Institut Metròpoli [47] demonstrated the existence of notable differences in mobility patterns by activity purpose. Mandatory mobility attains 24.3% of all trips, discretionary mobility accounts for 16.6%, and mobility related to work or study for 16.5% of the daily travel patterns. The remaining trips are for the purpose of returning home (42.6%). Conversely, the use of private vehicles increases as the area of residence moves away from Barcelona city, while the use of active modes and public transport decreases. A great proportion of residents in the Barcelona municipality utilise public transport for their journeys (25.8%) in comparison to those in the rest of the RMB (10.4%). It is noteworthy that the ratio of public transport trips exhibits a decline as one moves beyond the boundaries of the Barcelona municipality, with the following characteristics:
- The ratio of public to private transport within the Barcelona municipality is 208:100.
- The ratio of public to private transport between Barcelona municipality and the rest of the AMB (delimited in red in Figure 1) is 119:100.
- The ratio of public to private transport between Barcelona municipality and the rest of the RMB (delimited in blue in Figure 1) is 102:100.
Figure 2 depicts the mean walking access time to public transport stops and the average income per residential area. The access time is based on the centre of gravity of the Transport Analysis zones (TAZ-EMO) specified in the VISUM model [48] of the Metropolitan Region, with the values averaged across all zones included in a TAZ-EMEF macrozone. Figure 3 illustrates the population and employment densities.
Prior to and following the pandemic outbreak, multiple strategies and measures were implemented in Barcelona with the objective of reducing individual mobility by private vehicles. Among the initiatives to improve urban planning, the superblocks and green axes [49] are relevant examples. The pandemic served as a catalyst to reinforce and promote tactical urbanism within the city. Furthermore, in the last quarter of 2022, a national policy was introduced with the objective of compensating citizens due to elevated inflation, reducing the consumption of fossil fuels by private vehicles, and stimulating the use public transport. In the Metropolitan Area of Barcelona the policy was implemented as follows: commuter rail services were made free of charge, and a 50% discount was applied to the majority of transport tickets within the Barcelona Metropolitan Area [16]. Most discounts remain in effect in the current year (2024) [50]. The report from the Metropolitan Transport Authority ([51] in Catalan) indicates that thanks to the tariff discounts, there was a modal shift from other modes to public transport between 2021-2022 of almost 22%.
Additionally, the report by the Mobility Observatory [15], indicates that from 2019 to 2022, the percentage of individuals who were employed or engaged in academic studies from home evolved by 5%, 18%, 20% and 15,3%, respectively. Similarly, a recent report [52] shows that in 2023, a greater proportion of people residing in Barcelona engaged in WfH, accounting for 35.6 %, compared to a 25.2% in the rest of the Metropolitan area RMB
Barcelona has suffered from rising house prices which have skyrocketed in the past years, well above household incomes, because of among other issues, overtourism [53,54] which has triggered measures by the national and regional government [55]. Consequently, households with less economic resources tend to move out of the city centre and households with higher income remain in the city centre (as shown in Figure 2). Furthermore, Figure 2 shows, that accessibility to public transport stops worsens as one moves away from the city centre, whereas jobs tend to concentrate in the inner part of the city (see Figure 3).
3.1. Dataset
Since 2003, the Metropolitan Transport Authority from Barcelona has published an annual statistic, known as the Working Day Mobility Survey (EMEF) with the objective of identifying the main drivers of mobility on working days among the population aged 16 and older, residing within the Barcelona integrated tariff system [18]. The Barcelona region is subdivided into 173 macrozones, as illustrated in Error! Reference source not found. The aforementioned zones are utilised for the collation of survey data. In contrast to the Barcelona municipality, which is divided into ten macrozones, in the RMB each TAZ-EMEF macrozone in the RMB is represented by a single a municipality.
The information collected has evolved over time [56]. Prior to the pandemic, for instance, no data regarding WfH or online schooling was collected, which constraints the differentiation between undesirable immobility, sustainable practices, and hybrid working practices [57].
In this study, the official 2021-2022 EMEF survey is employed for the purpose of analysing activity sequences utilising discrete sequence data. These surveys collected data pertaining WfH, attitudes towards public transport (relevant after the pandemic outbreak) and other e-shopping activities. These two surveys contain data about the family structure that has not been previously analysed by the authors. It is worth noting that, although both surveys collected information regarding ICTs and daily activities, the approach employed between 2021 and 2022 differs. Some questions posed in 2021 were not repeated in 2022. Table 1 presents the sample and population size (based on expansion factors provided by ATM authorities) represented in the 2021-22 EMEF surveys.
In light of the aforementioned considerations, we have conducted two approaches. The first involves the independent analysis of the annual datasets, with a view to examining specific areas of interest. Afterwards we consolidate both datasets, with a particular focus on the harmonisation of comparable variables.
In this study, we employed sequence analysis to statistically examine the fragmentation of respondents’ daily activities using a minute-by-minute time series, wherein each minute of the day is represented by a distinct state for each individual in the study. These "states" correspond to the locations visited by individuals or transport modes used to move from one place to another during a working day.
Table 2 presents the dataset of activities and travel modes based on the types of locations individuals visit or the transport mode they use during a working day. They are defined by their job arrangements according to year 2021 and 2022. The following are Escorting (E), Casual (for not frequently visited places, C), Home (H), Work (W), Recurrent (frequently visited places that are not the working place, O), School (only for students, S). Transport modes are defined as TC for private transport (car, van, motorcycle), TE for e-scooters, TK for Bike, TP for public transport (bus, metro, tram, and train), and TW for active modes (walking).
3.2. Methodological Approach
The analysis of activity sequences is the base of our analysis. Our approach is based on the analysis of activity sequence.
Once the data has been orchestrated, filtered and the fragmentation indicators have been defined (see Figure 4), three different statistics methods are undertaken. First, an Exploratory Data Analysis (EDA) is conducted. Subsequently, a cluster analysis is developed, and finally, a generalized linear model (GLM) is built. The next subsections present the details of these approaches.
It is worth mentioning that the activity sequences of professional drivers were omitted from the analysis. Furthermore, multivariant outliers were identified in the fragmentation indicators, and also excluded from the sample.
The following sections present the details of the methodological approach employed for the analysis of activity sequences.
3.2.1. Fragmentation Indicators
The definition of activity sequence patterns is not a uniform concept across the literature. Consequently, this research employs the approach set forth in [44,58,59]. For each individual in the EMEF survey sample, we represent their activity sequence over the course of a working day.
In this study we will utilize the following subset of fragmentation indicators: entropy, turbulence, complexity, and travel time ratio. These indicators are commonly used in the field of mobility research.
The entropy indicator explores the variety in daily schedules and gives a measure of the proportion of total time spent in each state [59,60]
Where is the proportion of occurrences of the ith state in the specific sequence, S is the number of potential states, is the sequence of daily activities defined from minute to minute, and function log () refers to natural logarithm.
The turbulence indicator was proposed by Elzinga and Liefbroer [58] and gives a measure of how intricate daily schedules may be, based on the number of state recurrences and variability of daily activities’ duration.
For a given sequence , the turbulence considers: is the number of distinct subsequences that can be extracted from the distinct state sequence, considering time precedence; is the variance for the state duration; is the maximum variance, based on the sequence duration, computed as , where n-1 is the number of transitions in the sequence and is the sequence duration divided by the number of distinct states in the sequence.
The Complexity indicator is a score based on entropy and the different sequences of the individual’s [61]. It is defined as follows:
Where is the number of distinct transitions within a sequence, is the length of the sequence, is the entropy indicator, and is the maximum entropy in the sample.
The Travel Time Ratio (TTR) represents the trade-offs of people between travel and activity [40] and it is defined as follows:
It is computed as the total time spent on daily activities (), divided by the sum of the total time at home ( plus the total time on daily activities ().
3.2.2. Exploratory Data Analysis
Once the data orchestration process of the 2021-2022 EMEF surveys is carried out, activity sequences are defined, and the fragmentation indicators are calculated, the exploratory data analysis is undertaken (see Figure 4).
To do this, a data reduction technique based on multiple correspondence analysis [63] on activity sequences is addressed. The final step considers the classification of projected activity sequences onto the MCA reduced space and profiling clusters accounting for unit characteristics using FactoMineR package [63]in RStudio [62].
3.2.3. Clustering Analysis
An agglomerative hierarchical clustering method (HCPC method in FactoMineR library for R [63]) was employed following a dimensionality reduction through multiple correspondence analysis to mitigate the potential for biases resulting from information loss. This analytical procedure guarantees the utilisation of all available information (minute-by-minute activities), and it was designed to circumvent distortions during the dimensionality reduction process. The reduction is based on the Kaiser criteria [64], with the retained factorial axes accounting for more than 90% of the data variability, thus ensuring representativeness. These axes were employed for the projection of the sequences into the new space, resulting in a reduction of dimensions exceeding 95%. This enabled the utilisation of Ward linkage [65] for the aggregation of hierarchical cluster.
In order to ensure the reliability of the results obtained through multiple correspondence analysis, it is essential to have a sufficiently large sample size for each state. This study presents a set of eleven states and mobility transitions that fulfil this requirement, thereby guaranteeing the meaningfulness of the relationships identified.
In order to gain relevant insights into the differences between sequences, a clustering analysis was conducted (see Figure 4). As previously stated, the analysis is based on the identification of similarities within individuals and differences among groups of individuals. A clustering technique is employed for the purpose of grouping sequences of activities with similar dissimilarity scores. The final number of clusters was optimised in order to represent the data in an optimal manner, with the objective of achieving a balance between within-group similarity and across-groups dissimilarity. This is done based on a Silhouette chart [66]. It should be noted that the clusters are defined using activity sequences projected in the factorial space. Individuals’ characteristics are not active variables in this process; however they are useful for profiling of the clusters and in for constituting the explanatory variables used in the modelling approach for the WfH variable described in subsection 3.2.4.
3.2.4. Generalized Linear Model
As explained before, after the pandemic outbreak, questions regarding ICTs use and WfH were included in the EMEF 2021-22 surveys. However, the questions were not identical, necessitating the definition of a couple of variables that encompass different responses for similar issues. A variable pertaining to WfH was defined as a three-level factor, comprising non-active, hybrid teleworking schemes, and finally presence or face-to-face arrangement. Non-active workers are defined as homemakers, retired individuals or those that are unemployed.
The 2021-2022 subsample, comprising economically active people, was used. The target variable WfH has transform as a binary factor that is used as the response variable in the generalized linear model. A logistic regression approach has been developed to quantify the relevance of characteristics at individual level with respect to the probability of having hybrid WfH arrangements.
4. Results
The next paragraphs present the most relevant results of the analyses conducted in this study.
Table 4 shows that hybrid working arrangements are more common in Barcelona city, more than 10 points above the rest of the metropolitan crownsError! Reference source not found.. Similarly, presence working arrangements notably differ between Barcelona municipality and the rest of crowns.
Figure 6 provides further insights into work arrangements. It shows that flexibility is not equally distributed within the EMEF zones in the crowns. Error! Reference source not found.In comparison to other areas, the proportion of individuals engaged in presence work/study is lower in the municipality of Barcelona. In the case of the yellow macrozones, they refer to high income municipalities in the northern coast of the AMB and RMB (Alella, Teià, Sant Cebrià de Vallalta). We believe that this last one is not representative due to a small sample size, although it was not excluded in the filtering preprocess. The grey zones indicate clearly underrepresented values, with very few observations in the sample.
The results above need to be explored in relation to public transport services. Therefore, the availability of public transport services was obtained by accounting all types of public transport stops by TAZ macrozone and categorising them according to the percentiles. The resulting categories are as follows: 18 % have no stops (None); 30 % have less than two (Low); 70 % have less than ten (Med); 85 % have less than one hundred (Good); the last category (Super) is for more than 100 stops. Error! Reference source not found. depicts the results.
The comparison of Figure 6 and Figure 7 demonstrates that numerous areas with a high concentration of presence jobs also exhibit a poor network of public transport stops. This issue prompted us to conduct a more in-depth analysis of the dataset.
4.1. Exploratory Data Analysis
In this subsection we employ Multiple Correspondence Analysis (MCA) methods to further analyse the categorical data used in this study. Further details of this approach may be found at Husson et al. [63].
The distinct categories of the variable WfH are examined with a particular focus on the groups of individuals that fall within each category. WfH is a three-level factor, comprising: alwaysF2F, hybrid WfH arrangements, and nonactive. This definition encompasses the 2021-2022 survey questions, and the distribution can be seen in Table 5.
In this instance, each category of "WfH" defines a sub-population group. The catdes() function, as implemented in the FactoMineR Package in R [63], enables the exploration of variables, and whether each sub-population can be characterized by the levels of the categorical variables or mean values of numerical variables. Error! Reference source not found. presents the variable description.
To study the link between one “WfH” category and other categorical variable of the dataset, the function compares two proportions:
- the proportion of individuals who possess the selected category among those who possess the first category analysed.
- the global percentage of individuals who possess the selected category.
The categories that are significantly linked to the category WfH are shown in Error! Not a valid bookmark self-reference. shows that the order of these variables was higher in 2021 than in 2022, which implies a behavioural change as the period under consideration progresses. In the year 2022 vaccines were more commonly distributed in comparison to the year 2021, while restrictions had diminished in comparison to previous year. As a result, the fear of being infected exhibited a change between the two years.
Table 7, independently for years 2021 and 2022. Error! Not a valid bookmark self-reference. shows that the order of these variables was higher in 2021 than in 2022, which implies a behavioural change as the period under consideration progresses. In the year 2022 vaccines were more commonly distributed in comparison to the year 2021, while restrictions had diminished in comparison to previous year. As a result, the fear of being infected exhibited a change between the two years.
Table 7 presents the Pearson’s Chi-Square Test of Independence [67]. This test examines the most relevant variables that best characterise the sample according to the pvalue of the Independence Test. Two categorical variables (the WfH factor) during 2021 and 2022 accounting for individual characteristics are tested considering individual’s area of residence, educational level, age group, and other individual characteristics. It is important to note in this subsample, students were removed, and only active people is included. These tables present whether there is a global relationship among WfH and any of the categories with a p-value lower than 0.05 based on the independency between rows and columns in a contingency table. The results appear in an order of major to minor influence.
Furthermore, in Error! Not a valid bookmark self-reference. shows that the order of these variables was higher in 2021 than in 2022, which implies a behavioural change as the period under consideration progresses. In the year 2022 vaccines were more commonly distributed in comparison to the year 2021, while restrictions had diminished in comparison to previous year. As a result, the fear of being infected exhibited a change between the two years.
Table 7, some variables are marked with (*). These variables refer to themes surveyed related to the Covid-19 pandemic. Individuals were asked if they changed their mobility behaviour due to fear of infection (PuTrInfect), to reduce their commuting time (PuTrTime), to avoid wearing the (mandatory) mask in transport services (PuTrMask) or to avoid the lack of social distancing measures in transport (PuTrDist). Error! Not a valid bookmark self-reference. shows that the order of these variables was higher in 2021 than in 2022, which implies a behavioural change as the period under consideration progresses. In the year 2022 vaccines were more commonly distributed in comparison to the year 2021, while restrictions had diminished in comparison to previous year. As a result, the fear of being infected exhibited a change between the two years.
A refined analysis of the categorical variable WfH (working from home arrangements) is developed, by analysing the relationships between categories, in this case the groups of individuals to understand if distinct categories of the WFH are specially linked to other variables/categories of the dataset. For that sake, we carry out a description of a subpopulation or its categories by the categories having presence job or having flexible working arrangements. using the catdes() function.
Table 8 presents the target variable “Always face-to-face” and modality refers to the categories of the explanatory qualitative factors with significance or under-representation in the target class compared to the whole sample. The analysis of year 2021 showed that individuals who had presence jobs represent 72% of the subsample. Table 8 shows the following results: they attained only primary or secondary education or have no formal education. They live in the outskirts of the Barcelona Metropolitan Region, most likely commuting with bus or metro. Young 16-29 years old or older (between 45-64 years old) categories are overrepresented and most of them do not come neither from Spain, nor the Catalonian region (77% of foreigners have a whole presence job). They live in households with no children, and they had not considered to change their mobility habits due to the pandemic measures.
In comparison, Table 9 presents individuals in year 2021 with hybrid WfH arrangements, workers with hybrid arrangements represent about 14% of the subsample. They reached higher education, they live in Barcelona municipality and declared not having a principal commuter mode or having train as principal mode. They belong to the age group of 30-44 years old, living in households with two children under 13 years old. It may be related to the fact that in 2021 many home-schooling activities took place to reduce risk of infections, and therefore parents stayed at home. This is the only case where E-scooter appears as a relevant transport mode (borderline p-value).
Results in year 2022 show that those individuals that always have presence work (76% of the sub sample), who attained primary or secondary education levels and account for approx. 14% and 25% of the sample of active units, respectively. They are more likely to use public transport and live in the outer areas of Barcelona or even farther away, which implies longer commuting times. They are young (in the 16–29-year-old group) and no children under 13 years old in their household. Finally, they have not thought about changing transport habits (see Table 10).
In comparison to presence work, Table 11 presents the analysis of individuals with hybrid working arrangements (partially or mostly working from home) in 2022. The results show that they have higher educational levels, between 30-44 years old who live in Barcelona Municipality, with children (two kids under 13 years old). They were born in Catalonia. Risk of infection does not play a role in their mobility habits.
Figure 8 presents different histograms according to the different fragmentation indicators of people having presence jobs or hybrid teleworking arrangements (WfH factor variable). The mobility patterns start at 6 am to midnight. There are relevant differences among jobs’ arrangements. It is worth mentioning that complexity is related to the entropy and turbulence indicators. The entropy profile shows a greater incidence of large entropy values in the face-to-face job arrangements and the same applied to travel time ratio (TTR). Turbulence does not seem to be affected by the type of job arrangement.
We analysed the groups defined by presence (or face-to-face) jobs and hybrid jobs (both categories: always or frequent) in a subsample containing only active individuals using the catdes() partitioning method in FactoMineR package for R [63]. Table 12 presents the mean fragmentation indicators (numeric variables) and characteristics of individuals.
The results show that, in the case of presence workers all fragmentation indicators are significantly above the overall mean in the subsample, as well as other complementary variables as the family size characteristic and the number of trips. In the case of the hybrid working arrangement, the indicators show the opposite behaviour.
4.2. Cluster Analysis
Figure 9 presents the cluster analysis of sequences for years 2021 and 2022 for the nine clusters obtained in the clustering of 2021-22 activity sequences restricted to workers in hybrid arrangements and Figure 10 considers the state distribution based on the WfH categories of: always presence work (F2F), hybrid working arrangements and non-active workers. The clusters of activity sequences for workers with hybrid arrangements are shown in Figure 9:
- Cluster 1 reflects morning workers spending most of the time out of home,
- Cluster 2 overrepresents late afternoon workers,
- Cluster 3 shows presence workers in hybrid arrangements with afternoon and evening patterns involving other recurrent activities.
- Cluster 4 shows WfH employees most of the day.
- Cluster 5 is dominated by hybrid arrangement workers involving escorting.
- Clusters 7 and 8 accounts for hybrid arrangement workers that use part of the day in educational activities (presence studies).
- Cluster 9 presents immobility patterns.
- Finally, Cluster 6 obtained in the clustering process does not involve any hybrid workers, and therefore is not included in Figure 9.
A first glance into the figures, may lead us conclude that presence workers, spend more hours at work in comparison to hybrid workers. However, such a lecture is biased, as people stating that they are at home, are surveyed with the activity “at home” and the activities within home (which could be caring activities, WfH or homemaking) are neglected. This issue may also be appreciated in detail in the next Figure 10.
To see how different type of work arrangements lead to specific travel behavioural sequences, the state distribution for a finer WfH factor definition can be seen in Figure 11. It is remarkable the non-work activities in the late afternoon for the “some.online” and “mostly.online” categories.
4.3. Generalized Linear Model
Table 13 presents the sample size and categories used as binary target variables. The analysis of deviance table [68] to evaluate the significance of the net-effects of model components in the binary alternative presence work (F2F) and hybrid arrangements is presented in
Table 14. The positive outcome is hybrid working arrangements. The model includes different main effects and interaction terms related to the characteristics of individuals in the subsample of working population whose terms are statistically significant (p-value below 5%). The availability of public transport was included in the initial model, but the term was removed as it did not improve the quality of the model and was not significative.
Table 15 shows the final generalized linear model (GLM) that explains WfH jobs (at least hybrid working arrangements for active people according to different variables. Model selection is based on Bayesian Information Criteria (BIC) [69]. Furthermore, the Variance Inflation Factor (VIF) was checked to avoid collinearity effects in the final model [70].
The results clearly show that in comparison to year 2021, in year 2022 the WfH arrangements was notably reduced. The results show that education is key in the probability of at least hybrid working arrangements. Individuals with higher education are more likely to WfH. After education, the average income in the macrozone of residence appears as the second most relevant term. Moreover, female gender increases the probability of hybrid WfH arrangements depending on the educational level. The main effect of the number of children under 13 cannot be rejected globally at the 5% significance level (see net-effect test on Table 14).
The number of children younger than 13 years old seems to increase the probability of hybrid WfH arrangements, nevertheless it is worth noting the few observations of large families (three or more kids) that makes this third category not representative. Birthplace does not play a role in teleworking arrangements once the individuals attain higher educational levels. On the other hand, the younger the individuals are, the less likely are to WfH.
Figure 12, Figure 13 and Figure 14 graphically show different interaction terms regarding at hybrid teleworking arrangements.
Figure 12 presents the interaction among gender and education with teleworking arrangements. Figure 13 shows hybrid working arrangements with family members under 13 years of age in the household and gender.
Figure 14 shows the interaction of hybrid working conditions with average income in the macrozone where the individual lives (variable taz.AI) and education.
5. Discussion and Main Conclusions
This study presents an exploratory analysis of individuals residing in the Barcelona Metropolitan Region who may or may not be able to work from home. This study is based on the last two mobility surveys, conducted in 2021-2022, which included questions regarding ICTs activities.
In the year 2022, the WfH alternative decreased in comparison to the preceding year. Moreover, between 2021 and 2022 the significance of the variables related to getting infected by COVID-19 (such as mask-wearing in public transport or infection-related fear) diminished over time. The presence of children in the household, defined as family members younger than 13 years of age, is associated with an increased likelihood of teleworking arrangements. Education constitutes a highly relevant factor to WfH. Furthermore, our results indicate that gender does not exert a substantial influence on WfH in most of the cases. This information is relevant and builds upon previous analyses inexistent [57], which have demonstrated that the fragmentation of daily activities (as a measure of mobility behaviour) and immobility patterns converge between genders when individuals attain higher educational levels. At this stage, the difference among genders becomes inexistent. Thus, regarding our results, education is key in reducing the gender gap.
The geographical area of residence is also a highly relevant factor in WfH. As previously stated, dwelling prices are significantly higher especially in Barcelona Municipality than in the surrounding areas due to among others issues, overtourism and a shortage of affordable social housing. In contrast, this central area of Barcelona benefits from a wide offer of public transport services. Our findings indicate that individuals residing in the inner zones of Barcelona are more prone to having WfH arrangements and less likely to be employed in roles that necessitate physical presence. It is unsurprising that these individuals state that they do not have a principal transport mode, as multiple alternatives are available (and likely affordable to this group). Conversely, individuals residing in the outer areas are compelled to commute longer distances, predominantly utilising bus or metro as principal transport mode, and are more likely to be employed in non-remote or presence jobs, thereby limiting their probability of hybrid WfH arrangements. In light of these findings, equity considerations should be better analysed in urban and transport planning.
Indeed, novel formats of shopping, work, and mobility have emerged in our daily lives, with the pandemic outbreak serving as a catalyst for these changes. However, the impacts are not uniform across all population groups, and existent inequalities remain. In terms of the labour market, only those who have attained higher education are in a position to change to hybrid working arrangements (mostly or partially WfH): Many of these individuals live in zones with higher income, well-serviced public transport areas, whereas those individuals with lower educational attainment, have presence working arrangements and live in the outskirts of Barcelona (where house rents are not that expensive). This population group are captive users of public transport services and were not in the situation of considering changing to other transport mode, even with the pandemic restrictions.
The findings of this study also indicate that some issues need to be improved in the following surveys. Given the changes in activity patterns triggered by ICTs, activities at home, ranging from caring activities, WfH or homemaking, need to be better collected and identified. The act of remaining at home may encompass manyfold activities, including WfH arrangements on a full-time basis or on a hybrid arrangement, as well as homemaking or caring for others. Moreover, although this survey does collect escorting activities, these activities are limited to accompanying an individual from one place to another. In contrast, caring activities, cover a wider aspect, as they involve activities that intend to ensure the physical, psychological, and emotional needs of others [71]. Caring goes beyond a certain place and time and it occurs in multiple forms.
National, regional, and local governments should promote sustainable transport measures for the population segments that need it the most, and the revision of accessibility cannot be disentangled from residential area, ICTs, mobility alternatives, activities, and sociodemographic characteristics, to facilitate universal accessibility in most circumstances.
Author Contributions
Conceptualization, L.M., L.M.D. and J.B.; formal analysis, L.M., L.M.D. and J.B.; funding acquisition, L.M. and J.B.; methodology, L.M., L.M.D. and J.B.; software, L.M.; supervision, J.B.; writing—original draft, L.M.D.; writing—review and editing, L.M.D., L.M. and J.B. All authors have read and agreed to the published version of the manuscript.
Funding
This research was funded by PID2020-112967GB-C31 Spanish R+D Programs and by Secretaria d’Universitats-i-Recerca-Generalitat de Catalunya- 2021 SGR 01252. The datasets were kindly shared by the Autoritat del Transport Metropolità (ATM).
Data Availability Statement
Restrictions apply to the availability of EMEF data. Anonymized data were obtained from the Autoritat del Transport Metropolità (ATM) and datasets cannot be distributed without their permission.
Acknowledgments
EMEF datasets, previously processed, were kindly shared by the Autoritat del Transport Metropolità (ATM). Their contribution to our research is gratefully acknowledged.
Conflicts of Interest
The authors declare no conflict of interest.
References
- Lyons, G.; Mokhtarian, P.; Dijst, M.; Böcker, L. The Dynamics of Urban Metabolism in the Face of Digitalization and Changing Lifestyles: Understanding and Influencing Our Cities. Resour Conserv Recycl 2018, 132, 246–257. [CrossRef]
- Couclelis, H. From Sustainable Transportation to Sustainable Accessibility: Can We Avoid a New. 2000, 341–356. [CrossRef]
- Couclelis, H. Pizza over the Internet: E-Commerce, the Fragmentation of Activity and the Tyranny of the Region. Entrepreneurship & Regional Development 2006, 16, 41–54. [CrossRef]
- Alexander, B.; Ettema, D.; Dijst, M. Fragmentation of Work Activity as a Multi-Dimensional Construct and Its Association with ICT, Employment and Sociodemographic Characteristics. J Transp Geogr 2010, 18, 55–64. [CrossRef]
- Mejía-Dorantes, L.; Murauskaite-Bull, I. Transport Poverty – A Systematic Literature Review in Europe; EUR 31267 EN.; Publication Office of the European Union: Luxembourg, 2022; ISBN 978-92-76-58571-8,JRC129559.
- Trujillo-Sáez, F. The School Year 2020-2021 in Spain during the Pandemic; Joint Research Centre Technical Report; 2021;
- Christidis, P.; Christodoulou, A.; Navajas-Cawood, E.; Ciuffo, B. The Post-Pandemic Recovery of Transport Activity: Emerging Mobility Patterns and Repercussions on Future Evolution. Sustainability 2021, 13, 6359. [CrossRef]
- Mejía-Dorantes, L.; Montero, L.; Barceló, J. Mobility Trends before and after the Pandemic Outbreak: Analyzing the Metropolitan Area of Barcelona through the Lens of Equality and Sustainability. Sustainability (Switzerland) 2021, 13, 7908. [CrossRef]
- Fana, M.; Tolan, S.; Torrejón Pérez, S.; Urzi Brancati, M.C.; Fernández-Macías, E. The COVID Confinement Measures and EU Labour Markets; 2020;
- Eurostat How Usual Is It to Work from Home? Available online: https://ec.europa.eu/eurostat/web/products-eurostat-news/-/ddn-20200206-1 (accessed on 22 May 2021).
- EUROSTAT Working from Home in the EU Available online: https://ec.europa.eu/eurostat/web/products-eurostat-news/-/DDN-20180620-1 (accessed on 24 September 2022).
- Observatorio Nacional de Tecnología y Sociedad Teletrabajo; 2024;
- Comisión Nacional de los Mercados y la Competencia El comercio electrónico superó en España los 19.000 millones de euros en el primer trimestre de 2023, un 22,7% más que el año anterior | CNMC Available online: https://www.cnmc.es/prensa/ecommerce-1T23-20231006 (accessed on 26 October 2024).
- Instituto Nacional de Estadística (INE) El salto del comercio electrónico; 2020;
- Monzón, A.; López, C.; del Cuvillo, R.; Fernández, A.; González, A.; Hernández, S.; López-Puigcerver Irene Olmedo, Á.; San Juan de la Cruz, P. Informe OMM 2021 - Avance 2022; 2021;
- Mobility Observatory in Catalonia (OMC) Discount rates report - Mobility Observatory in Catalonia (OMC) - ATM Available online: https://omc.cat/en/w/discount-rates-report (accessed on 27 September 2024).
- Mobility Observatory in Catalonia (OMC) - ATM Working Day Mobility Surveys (EMEF) Available online: https://omc.cat/en/w/surveys-emef (accessed on 22 June 2024).
- Institut-Metropoli Working Day Mobility Surveys (EMEF) - Mobility Observatory in Catalonia (OMC) - ATM Available online: https://omc.cat/en/w/surveys-emef (accessed on 8 September 2023).
- Banister, D. Viewpoint: Assessing the Reality—Transport and Land Use Planning to Achieve Sustainability. J Transp Land Use 2012, 5, 1–14. [CrossRef]
- Graells-Garrido, E.; Serra-Burriel, F.; Rowe, F.; Cucchietti, F.M.; Reyes, P. A City of Cities: Measuring How 15-Minutes Urban Accessibility Shapes Human Mobility in Barcelona. PLoS One 2021, 16, e0250080. [CrossRef]
- Naess, P. Urban Structures and Travel Behaviour: Experiences from Empirical Research in Norway and Denmark. European Journal of Transport and Infrastructure Research 2003, 3, 155–178. [CrossRef]
- Rickaby, P.A. Six Settlement Patterns Compared. Environ Plan B Urban Anal City Sci 1987, 14, 193–223. [CrossRef]
- Cresswell, T.; Uteng, T.P. Gendered Mobilities: Towards an Holistic Understanding. In Gendered Mobilities; Routledge: London, UK, 2016; pp. 1–12 ISBN 9781315584201.
- Cresswell, T. Gendering Mobility: Insights into the Construction of Spatial Concepts. In Gendered Mobilities; Uteng, T., Cresswell, T., Eds.; Routledge Taylor and Francis Group: London, UK, 2008; pp. 97–112 ISBN 9781138252820.
- 25. Law, R. Beyond ‘Women and Transport’: Towards New Geographies of Gender and Daily Mobility. Prog Hum Geogr 1999, 23, 567–588. [CrossRef]
- Levy, C. Travel Choice Reframed: “Deep Distribution” and Gender in Urban Transport. Environ Urban 2013, 25, 47–63. [CrossRef]
- Murillo-Munar, J.; Gómez-Varo, I.; Marquet, O. Caregivers on the Move: Gender and Socioeconomic Status in the Care Mobility in Bogotá. Transp Res Interdiscip Perspect 2023, 21, 100884. [CrossRef]
- Soto Villagrán, P.; Mejía Dorantes, L. URBAN PROJECTS AND PUBLIC SPACE IN LATIN AMERICA AND THE CARIBBEAN: Walking Towards a Paradigm of Gender Equality. The Routledge Handbook of Urban Studies in Latin America and the Caribbean: Cities, Urban Processes, and Policies 2022, 535–560. [CrossRef]
- Levy, R.; Widmer, E.D. (eds) Gendered Life Courses between Individualization and Standardization.A European Approach Applied to Switzerland.; Wien, Lit Verlag, 2013; ISBN 978-3-643-80143-2.
- Montero, L.; Mejía-Dorantes, L.; Barceló, J. The Role of Life Course and Gender in Mobility Patterns: A Spatiotemporal Sequence Analysis in Barcelona. European Transport Research Review 2023, 15, 1–21. [CrossRef]
- Dill, J.; McNeil, N. Are Shared Vehicles Shared by All? A Review of Equity and Vehicle Sharing. J Plan Lit 2020, 36, 5–30. [CrossRef]
- Meng, S.; Brown, A. Docked vs. Dockless Equity: Comparing Three Micromobility Service Geographies. J Transp Geogr 2021, 96, 103185. [CrossRef]
- Kwan, M.P. Mobile Communications, Social Networks, and Urban Travel: Hypertext as a New Metaphor for Conceptualizing Spatial Interaction∗. The Professional Geographer 2007, 59, 434–446. [CrossRef]
- Dorantes, L.M.; Murauskaite-Bull, I. Revisiting Transport Poverty in Europe through a Systematic Review. Transportation Research Procedia 2023, 72, 3861–3868. [CrossRef]
- Bohman, H.; Ryan, J.; Stjernborg, V.; Nilsson, D. A Study of Changes in Everyday Mobility during the Covid-19 Pandemic: As Perceived by People Living in Malmö, Sweden. Transp Policy (Oxf) 2021, 106, 109–119. [CrossRef]
- Thulin, E.; Vilhelmson, B.; Brundin, L. Telework after Confinement: Interrogating the Spatiotemporalities of Home-Based Work Life. J Transp Geogr 2023, 113, 103740. [CrossRef]
- Asmussen, K.E.; Mondal, A.; Batur, I.; Dirks, A.; Pendyala, R.M.; Bhat, C.R. An Investigation of Individual-Level Telework Arrangements in the COVID-Era. Transp Res Part A Policy Pract 2024, 179, 103888. [CrossRef]
- Rasouli, S.; Timmermans, H. Activity-Based Models of Travel Demand: Promises, Progress and Prospects. International Journal of Urban Sciences 2014, 18, 31–60. [CrossRef]
- Studer, M.; Ritschard, G. What Matters in Differences between Life Trajectories: A Comparative Review of Sequence Dissimilarity Measures on JSTOR. Journal of the Royal Statistical Society A 2016, 179, 481–511.
- McBride, E.; Davis, A.; Goulias, K. Fragmentation in Daily Schedule of Activities Using Activity Sequences: Transportation Researc Record 2019, 2673, 844–854. [CrossRef]
- Ahmed, U.; Moreno, A.T.; Moeckel, R. Microscopic Activity Sequence Generation: A Multiple Correspondence Analysis to Explain Travel Behavior Based on Socio-Demographic Person Attributes. Transportation (Amst) 2021, 48, 1481–1502. [CrossRef]
- Montero, L.; Mejía-Dorantes, L.; Barceló, J. Applying Data Analytics to Analyze Activity Sequences for an Assessment of Fragmentation in Daily Travel Patterns: A Case Study of the Metropolitan Region of Barcelona. Sustainability 2023, Vol. 15, Page 14213 2023, 15, 14213. [CrossRef]
- Ritschard, G. Measuring the Nature of Individual Sequences. Sociol Methods Res 2021, 1–34. [CrossRef]
- McBride, E.C.; Davis, A.W.; Goulias, K.G. Exploration of Statewide Fragmentation of Activity and Travel and a Taxonomy of Daily Time Use Patterns Using Sequence Analysis in California: Transp Res Rec 2020, 2674, 38–51. [CrossRef]
- Shi, H.; Su, R.; Xiao, J.; Goulias, K.G. Spatiotemporal Analysis of Activity-Travel Fragmentation Based on Spatial Clustering and Sequence Analysis. J Transp Geogr 2022, 102, 103382. [CrossRef]
- Shi, H.; Goulias, K.G. Long-Term Effects of COVID-19 on Time Allocation, Travel Behavior, and Shopping Habits in the United States. J Transp Health 2024, 34, 101730. [CrossRef]
- Institut-Metròpoli La mobilitat a Barcelona supera els 20 milions de desplaçaments; 2024;
- PTV AG Germany VISUM 2020.
- Barcelona Superblock | Barcelona City Council Available online: https://www.barcelona.cat/pla-superilla-barcelona/en (accessed on 27 September 2024).
- Price Reduction on Transport Fares 2024 | Transports Metropolitans de Barcelona Available online: https://www.tmb.cat/en/barcelona-fares-metro-bus/transport-fares-reduction (accessed on 27 September 2024).
- Autoritat del Transport Metropolità (ATM) Balanç dels descomptes tarifaris 3r quadrimestre del 2022 (in Catalan); Barcelona, 2023;
- Institut Metròpoli; ATM Enquesta de mobilitat en dia feiner 2023 (EMEF 2023) - Resum Executiu (in Catalan) Available online: http://hdl.handle.net/11703/136649 (accessed on 21 May 2024).
- Gutiérrez, J.; García-Palomares, J.C.; Romanillos, G.; Salas-Olmedo, M.H. The Eruption of Airbnb in Tourist Cities: Comparing Spatial Patterns of Hotels and Peer-to-Peer Accommodation in Barcelona. Tour Manag 2017, 62, 278–291. [CrossRef]
- Experimental Infographic of Tourist Dwellings Available online: https://www.ine.es/en/experimental/viv_turistica/experimental_viv_turistica.htm?L=1 (accessed on 27 September 2024).
- Department-of-Territory Resolution TER/2408/2024, of July 1, Declaring a New Stressed Residential Market Area Made up of 131 Municipalities in Catalonia, in Accordance with State Law 12/2023, of May 24, for the Right in the House Available online: https://cido-diba-cat.translate.goog/legislacio/17696445/resolucio-ter24082024-d1-de-juliol-per-la-qual-es-declara-una-nova-zona-de-mercat-residencial-tensionat-formada-per-131-municipis-de-catalunya-dacord-amb-la-llei-estatal-122023-de-24-de-maig-pel-dret-a-lhabitatge-departament-de-territori?_x_tr_hl=en&_x_tr_sl=ca&_x_tr_tl=en (accessed on 27 September 2024).
- Roselló, X. Descripció de Les Enquestes de Mobilitat a Catalunya. Procediment de Fusió de Matrius de Mobilitat per Obtenir La Matriu 2006 General. (In Catalan) Available online: https://doc.atm.cat/ca/_dir_notestecniques/2010-11-enquestes-a-catalunya.pdf (accessed on 10 September 2023).
- Mejía-Dorantes, L.; Montero, L.; Barceló, J. Sustainable Mobility Reframed: Policy Implications Using Activity Fragmentation Indicators of Individual Mobility Sequences in Barcelona. In Proceedings of the Selected papers from NECTAR conference (forthcoming); in: Bonin, O., Geurs, K., Reggiani, A., Christidis, P. (Eds.), Transport in a Moving World: Emerging Trends and Policy Challenges. Edward Elgar Publishing Ltd., 2024.
- Elzinga, C.H.; Liefbroer, A.C. De-Standardization of Family-Life Trajectories of Young Adults: A Cross-National Comparison Using Sequence Analysis. European Journal of Population 2007, 23, 225–250. [CrossRef]
- Gabadinho, A.; Ritschard, G.; Müller, NS.; Studer, M. Analyzing and Visualizing State Sequences in R with TraMineR. J Stat Softw 2011, 40, 1–37. [CrossRef]
- McBride, E.; Davis, A.; Goulias, K. Exploration of Statewide Fragmentation of Activity and Travel and a Taxonomy of Daily Time Use Patterns Using Sequence Analysis in California. Transp Res Rec 2020, 2674, 38–51. [CrossRef]
- Gabadinho, A.; Ritschard, G.; Studer, M.; Müller, N.S. Indice de Complexité Pour Le Tri et La Comparaison de Séquences Catégorielles - Editions RNTI. Revue des Nouvelles Technologies de l’Information 2010, Extraction, 61–66.
- RStudio-Team RStudio: Integrated Development for R. 2022.
- Husson, F.; Lê, S.; Pages, J. Exploratory Multivariate Analysis by Example Using R.; 2nd Edition.; CRC PRESS, 2017; ISBN 9780367658021.
- Kaiser, H.F. The Application of Electronic Computers to Factor Analysis. Educ Psychol Meas 1960, 20, 141–151.
- Ward, J.H. Hierarchical Grouping to Optimize an Objective Function. J Am Stat Assoc 1963, 58, 236. [CrossRef]
- Rousseeuw, P.J. Silhouettes: A Graphical Aid to the Interpretation and Validation of Cluster Analysis. J Comput Appl Math 1987, 20, 53–65. [CrossRef]
- Pearson, K. X. On the Criterion That a given System of Deviations from the Probable in the Case of a Correlated System of Variables Is Such That It Can Be Reasonably Supposed to Have Arisen from Random Sampling. The London, Edinburgh, and Dublin Philosophical Magazine and Journal of Science 1900, 50, 157–175. [CrossRef]
- McCullagh, P.; Nelder, J.A. Generalized Linear Models, Second Edition; Taylor & Francis, 1989; ISBN 0412317605.
- Wit, E.; van den Heuvel, E.; Romeijn, J.W. ‘All Models Are Wrong...’: An Introduction to Model Uncertainty. Stat Neerl 2012, 66, 217–236. [CrossRef]
- Fox, J. Applied Regression Analysis, Linear Models, and Related Methods; Sage Publications, Ed.; 1997; ISBN 080394540X.
- International-Labour-Organization(ILO) Care Work and Care Jobs for the Future of Decent Work | International Labour Organization Available online: https://www.ilo.org/publications/major-publications/care-work-and-care-jobs-future-decent-work (accessed on 27 September 2024).
Figure 1.
RMB Study Area: Transportation Analysis Zones. Primary crown subarea (EMT) in green.
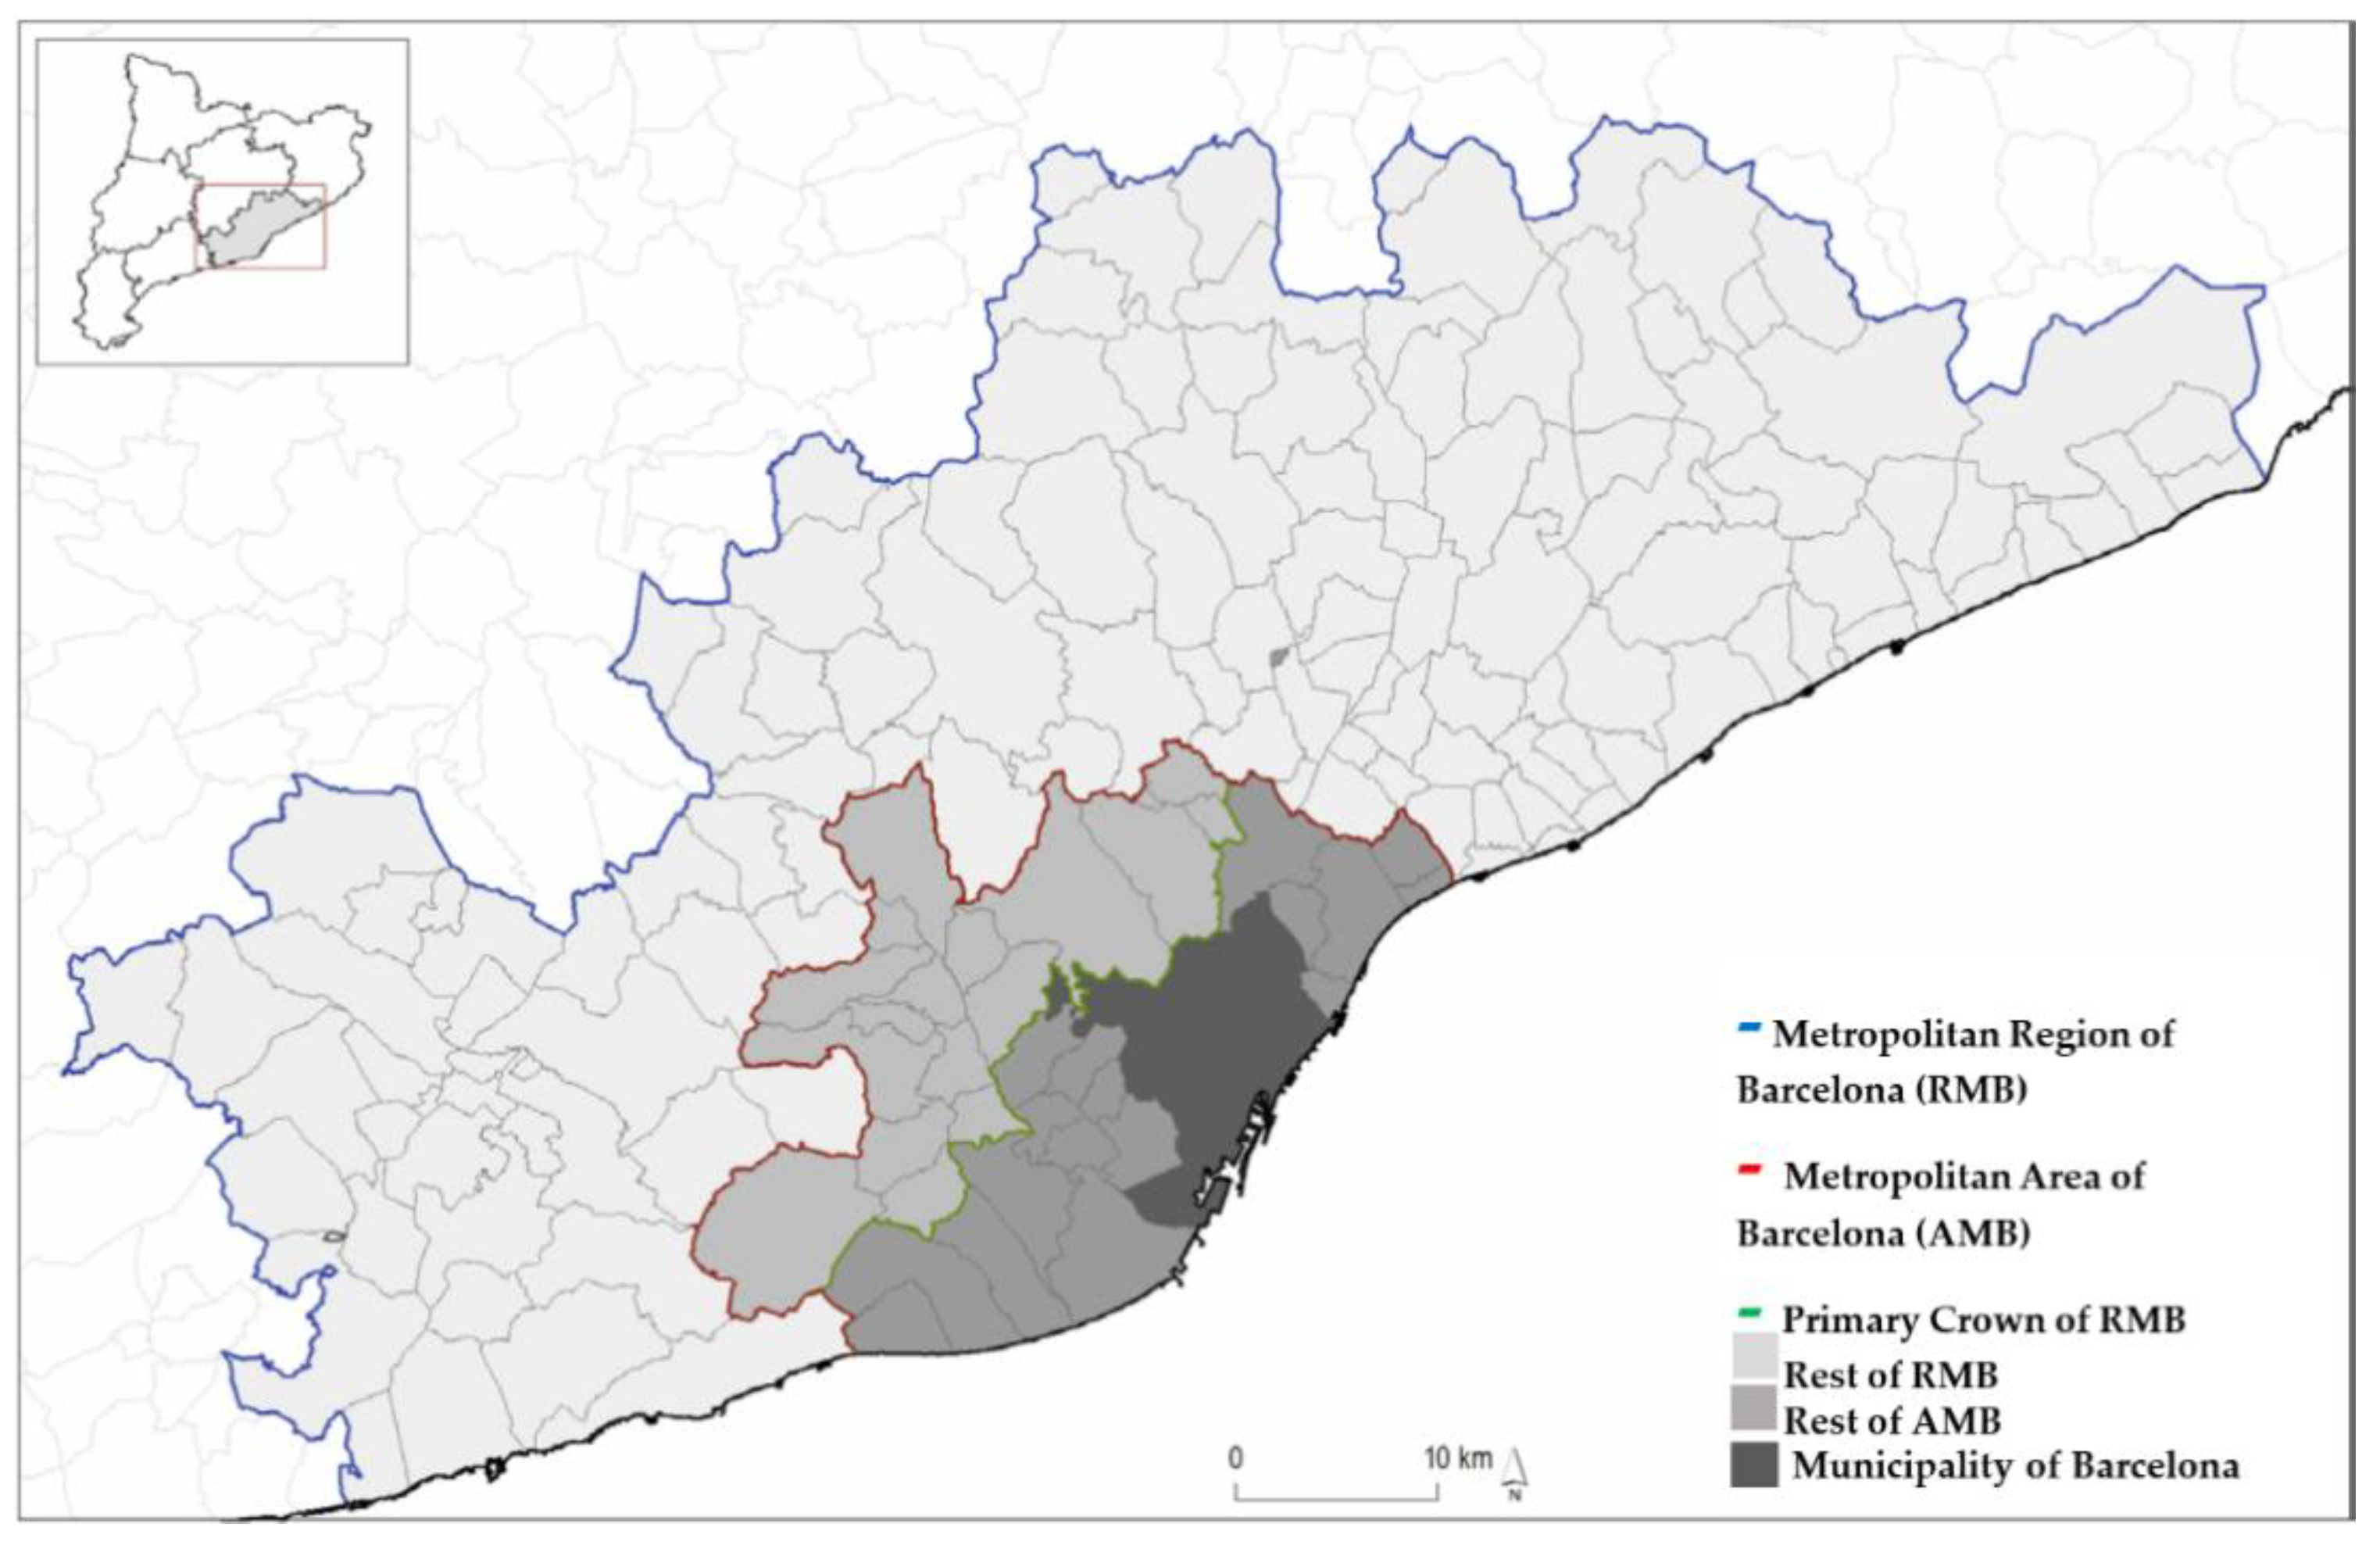
Figure 2.
Average walking access time to public transport stops (left) and average income per TAZ-EMEF (right).
Figure 2.
Average walking access time to public transport stops (left) and average income per TAZ-EMEF (right).
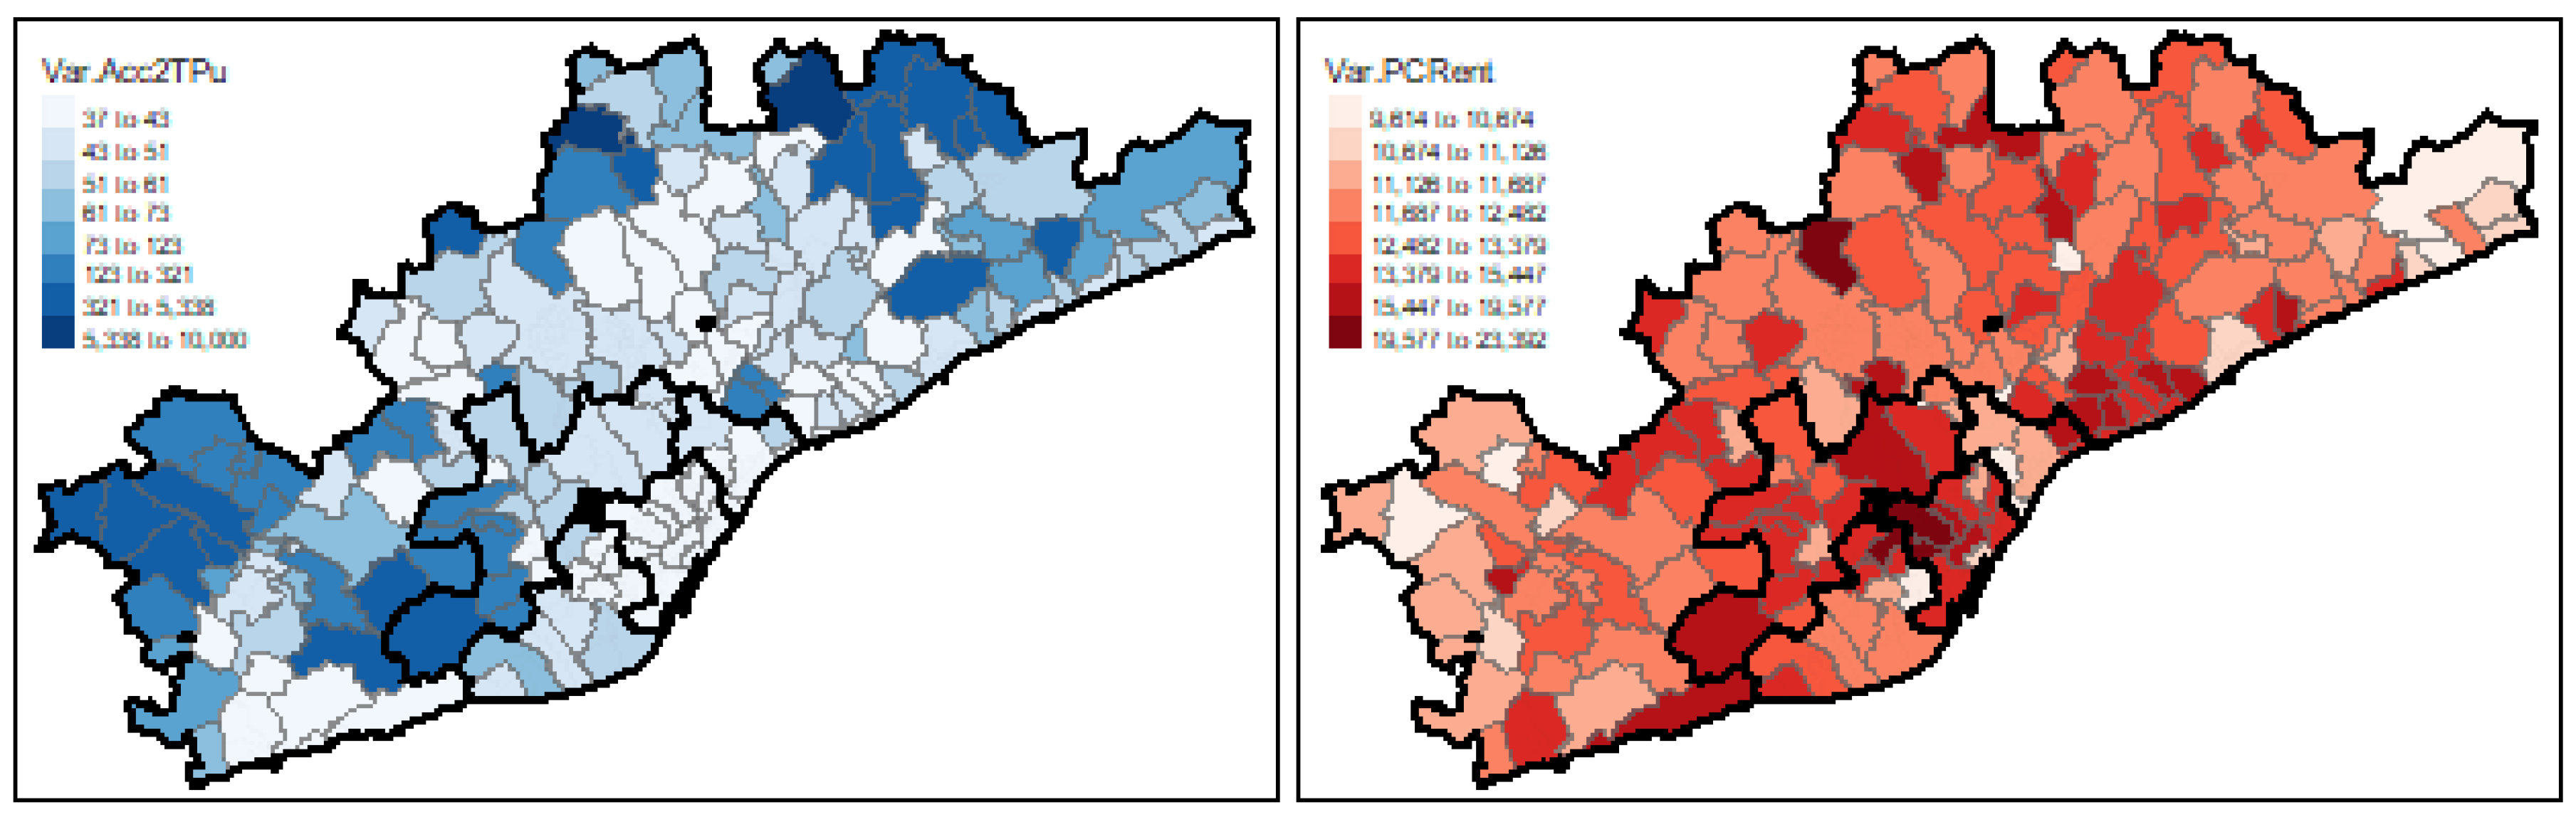
Figure 3.
Population density (left) and employment density (right) in the Metropolitan Region of Barcelona.
Figure 3.
Population density (left) and employment density (right) in the Metropolitan Region of Barcelona.
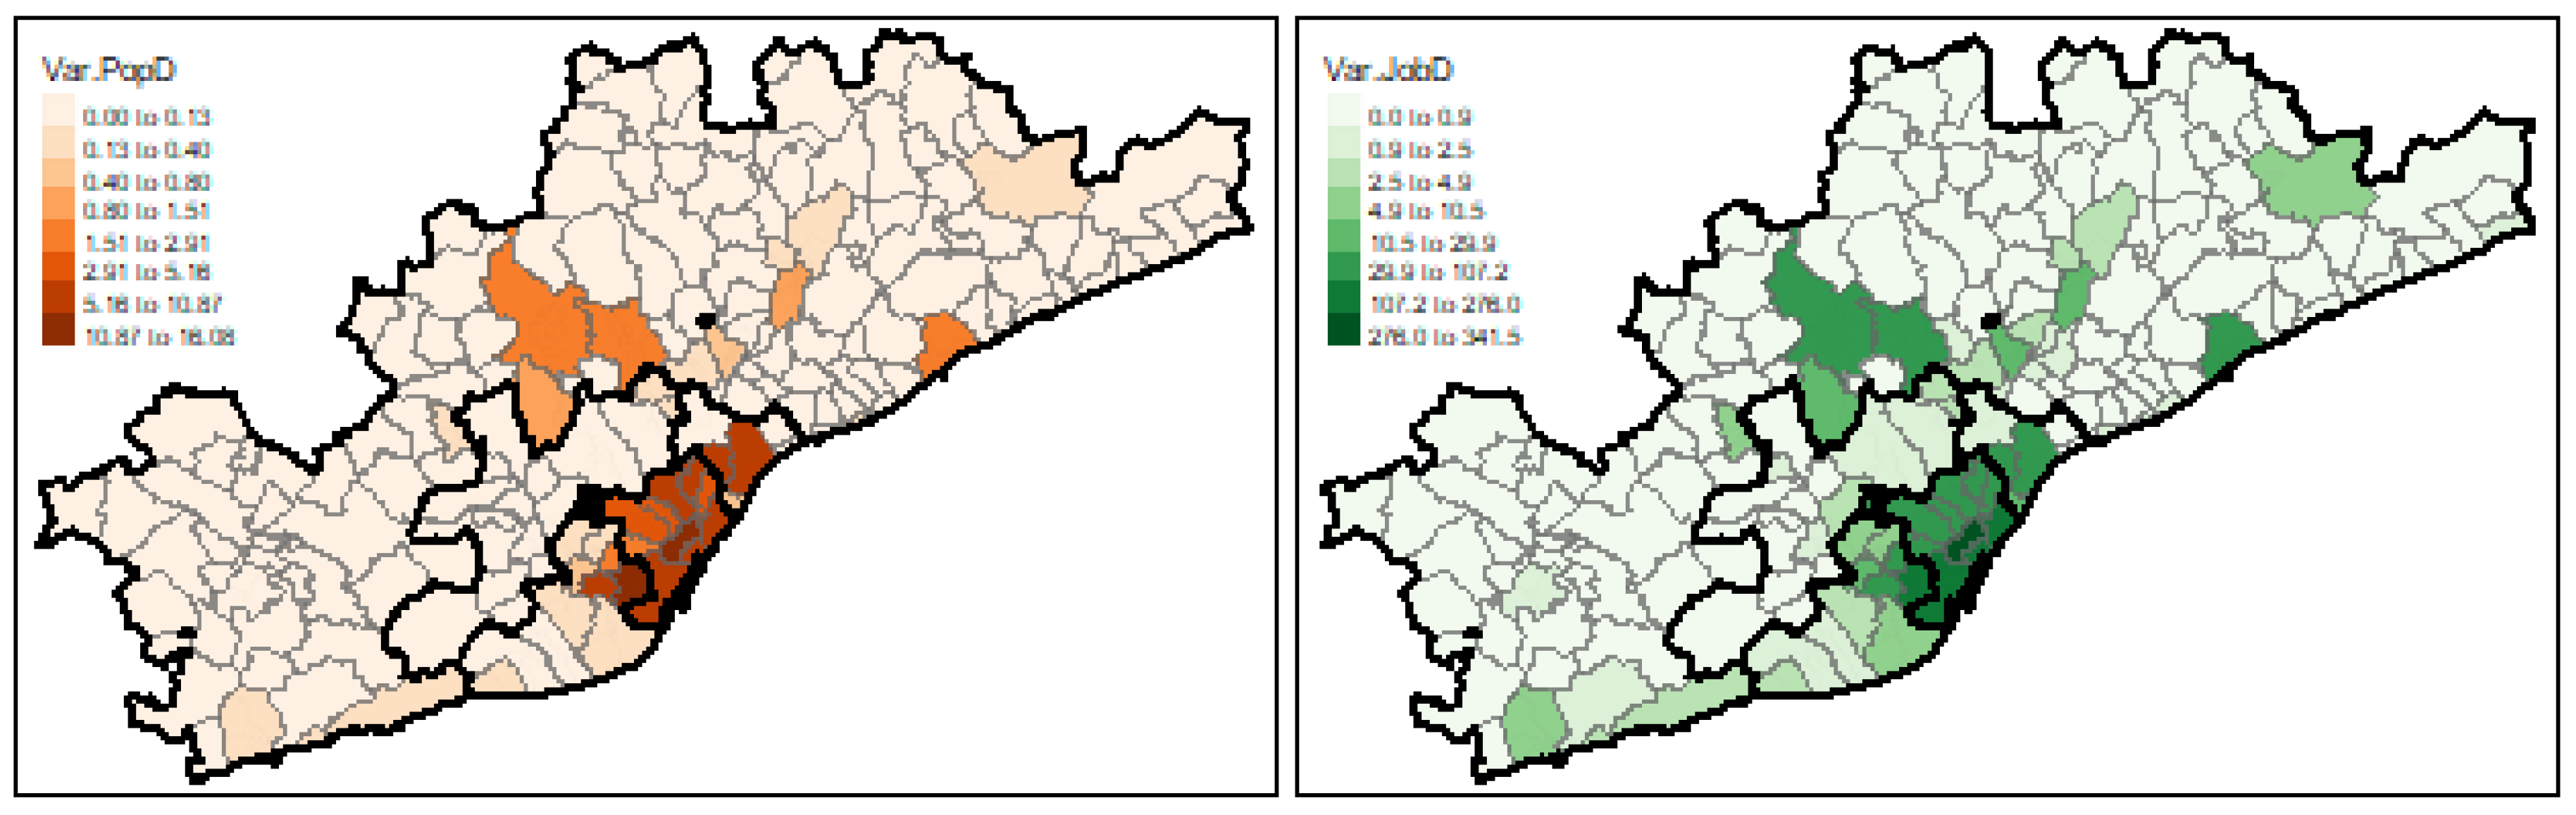
Figure 4.
Data Analysis process on 2021-22 EMEF data.
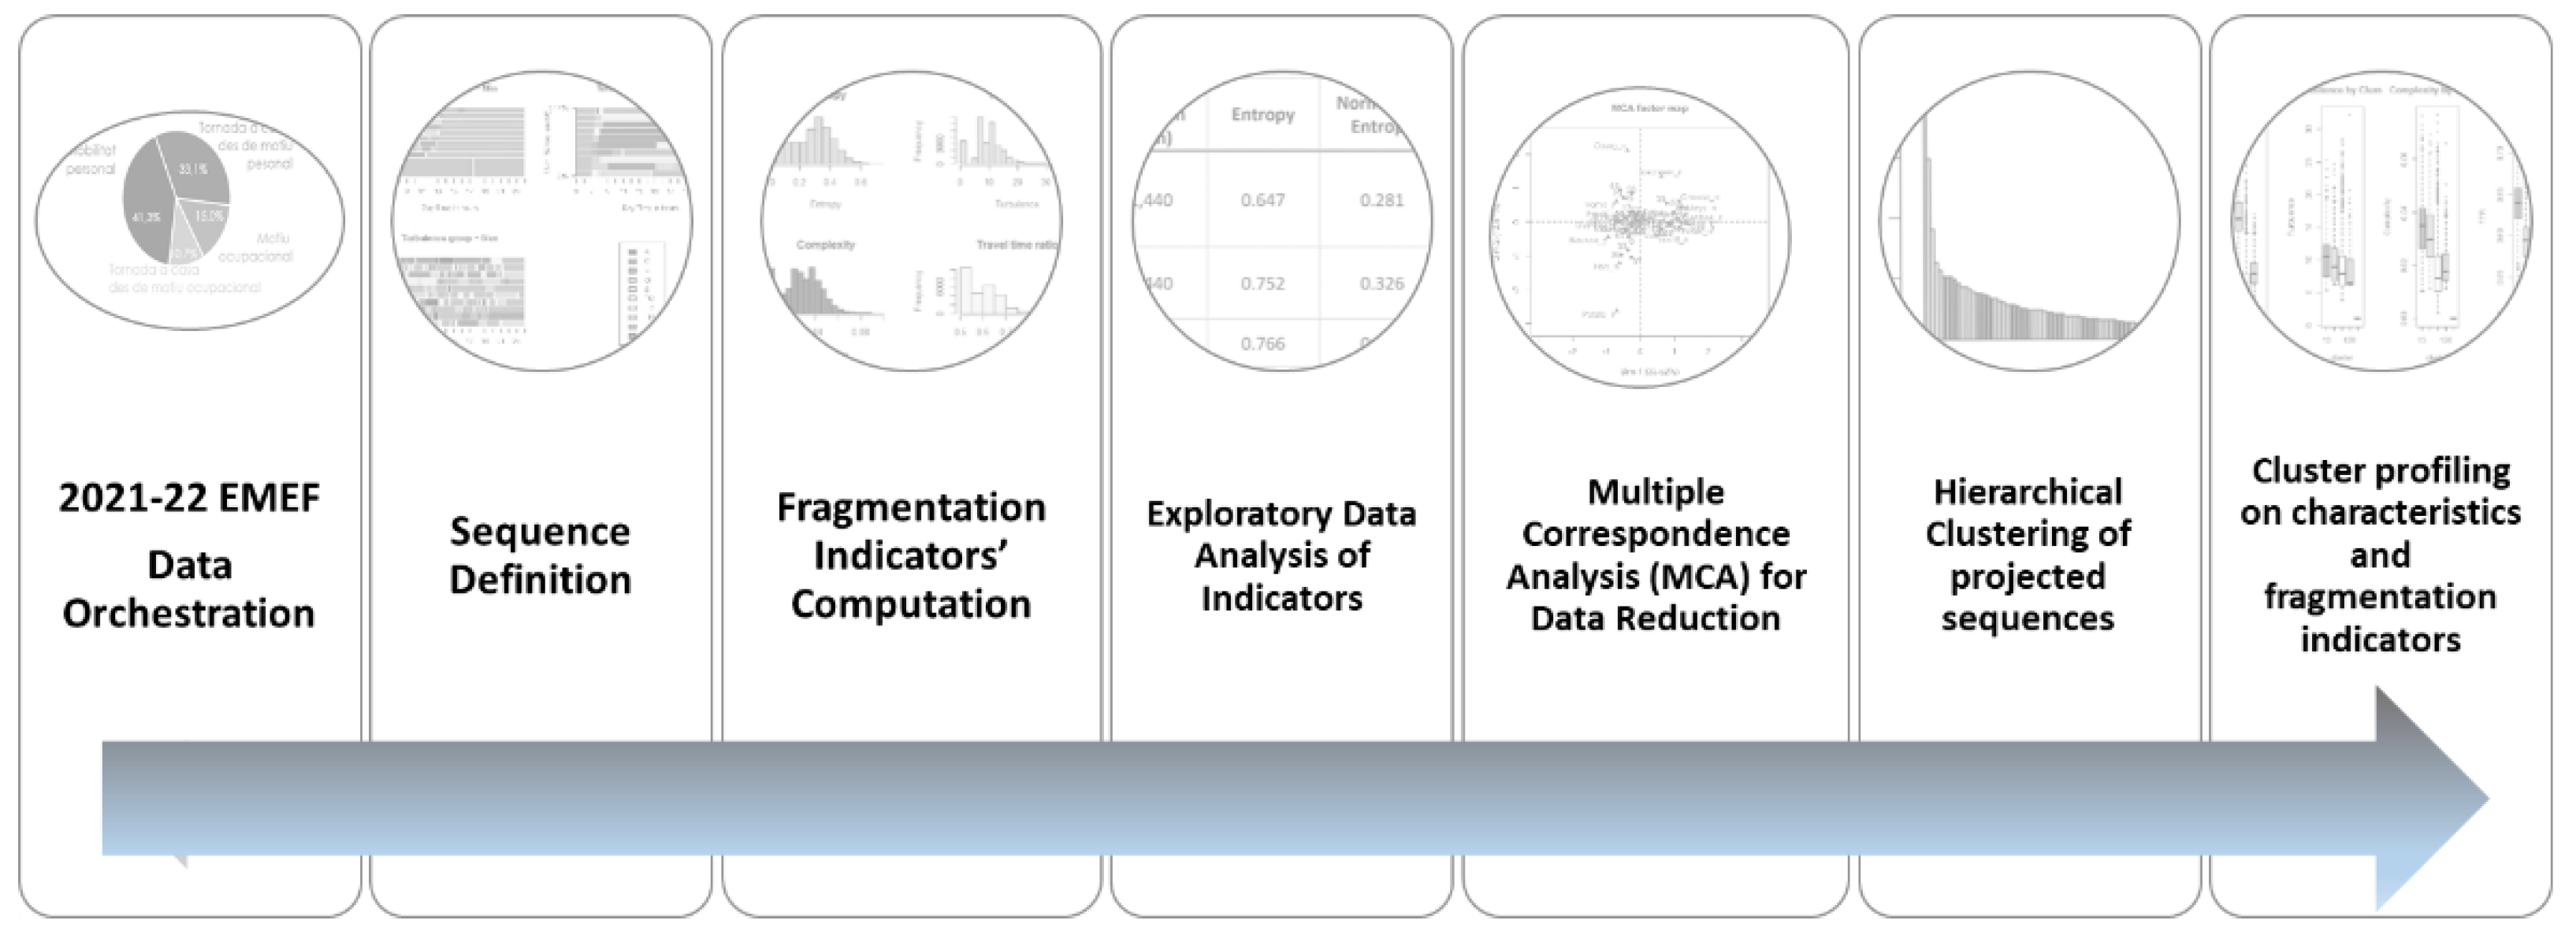
Figure 5.
Fragmentation indicators per year.
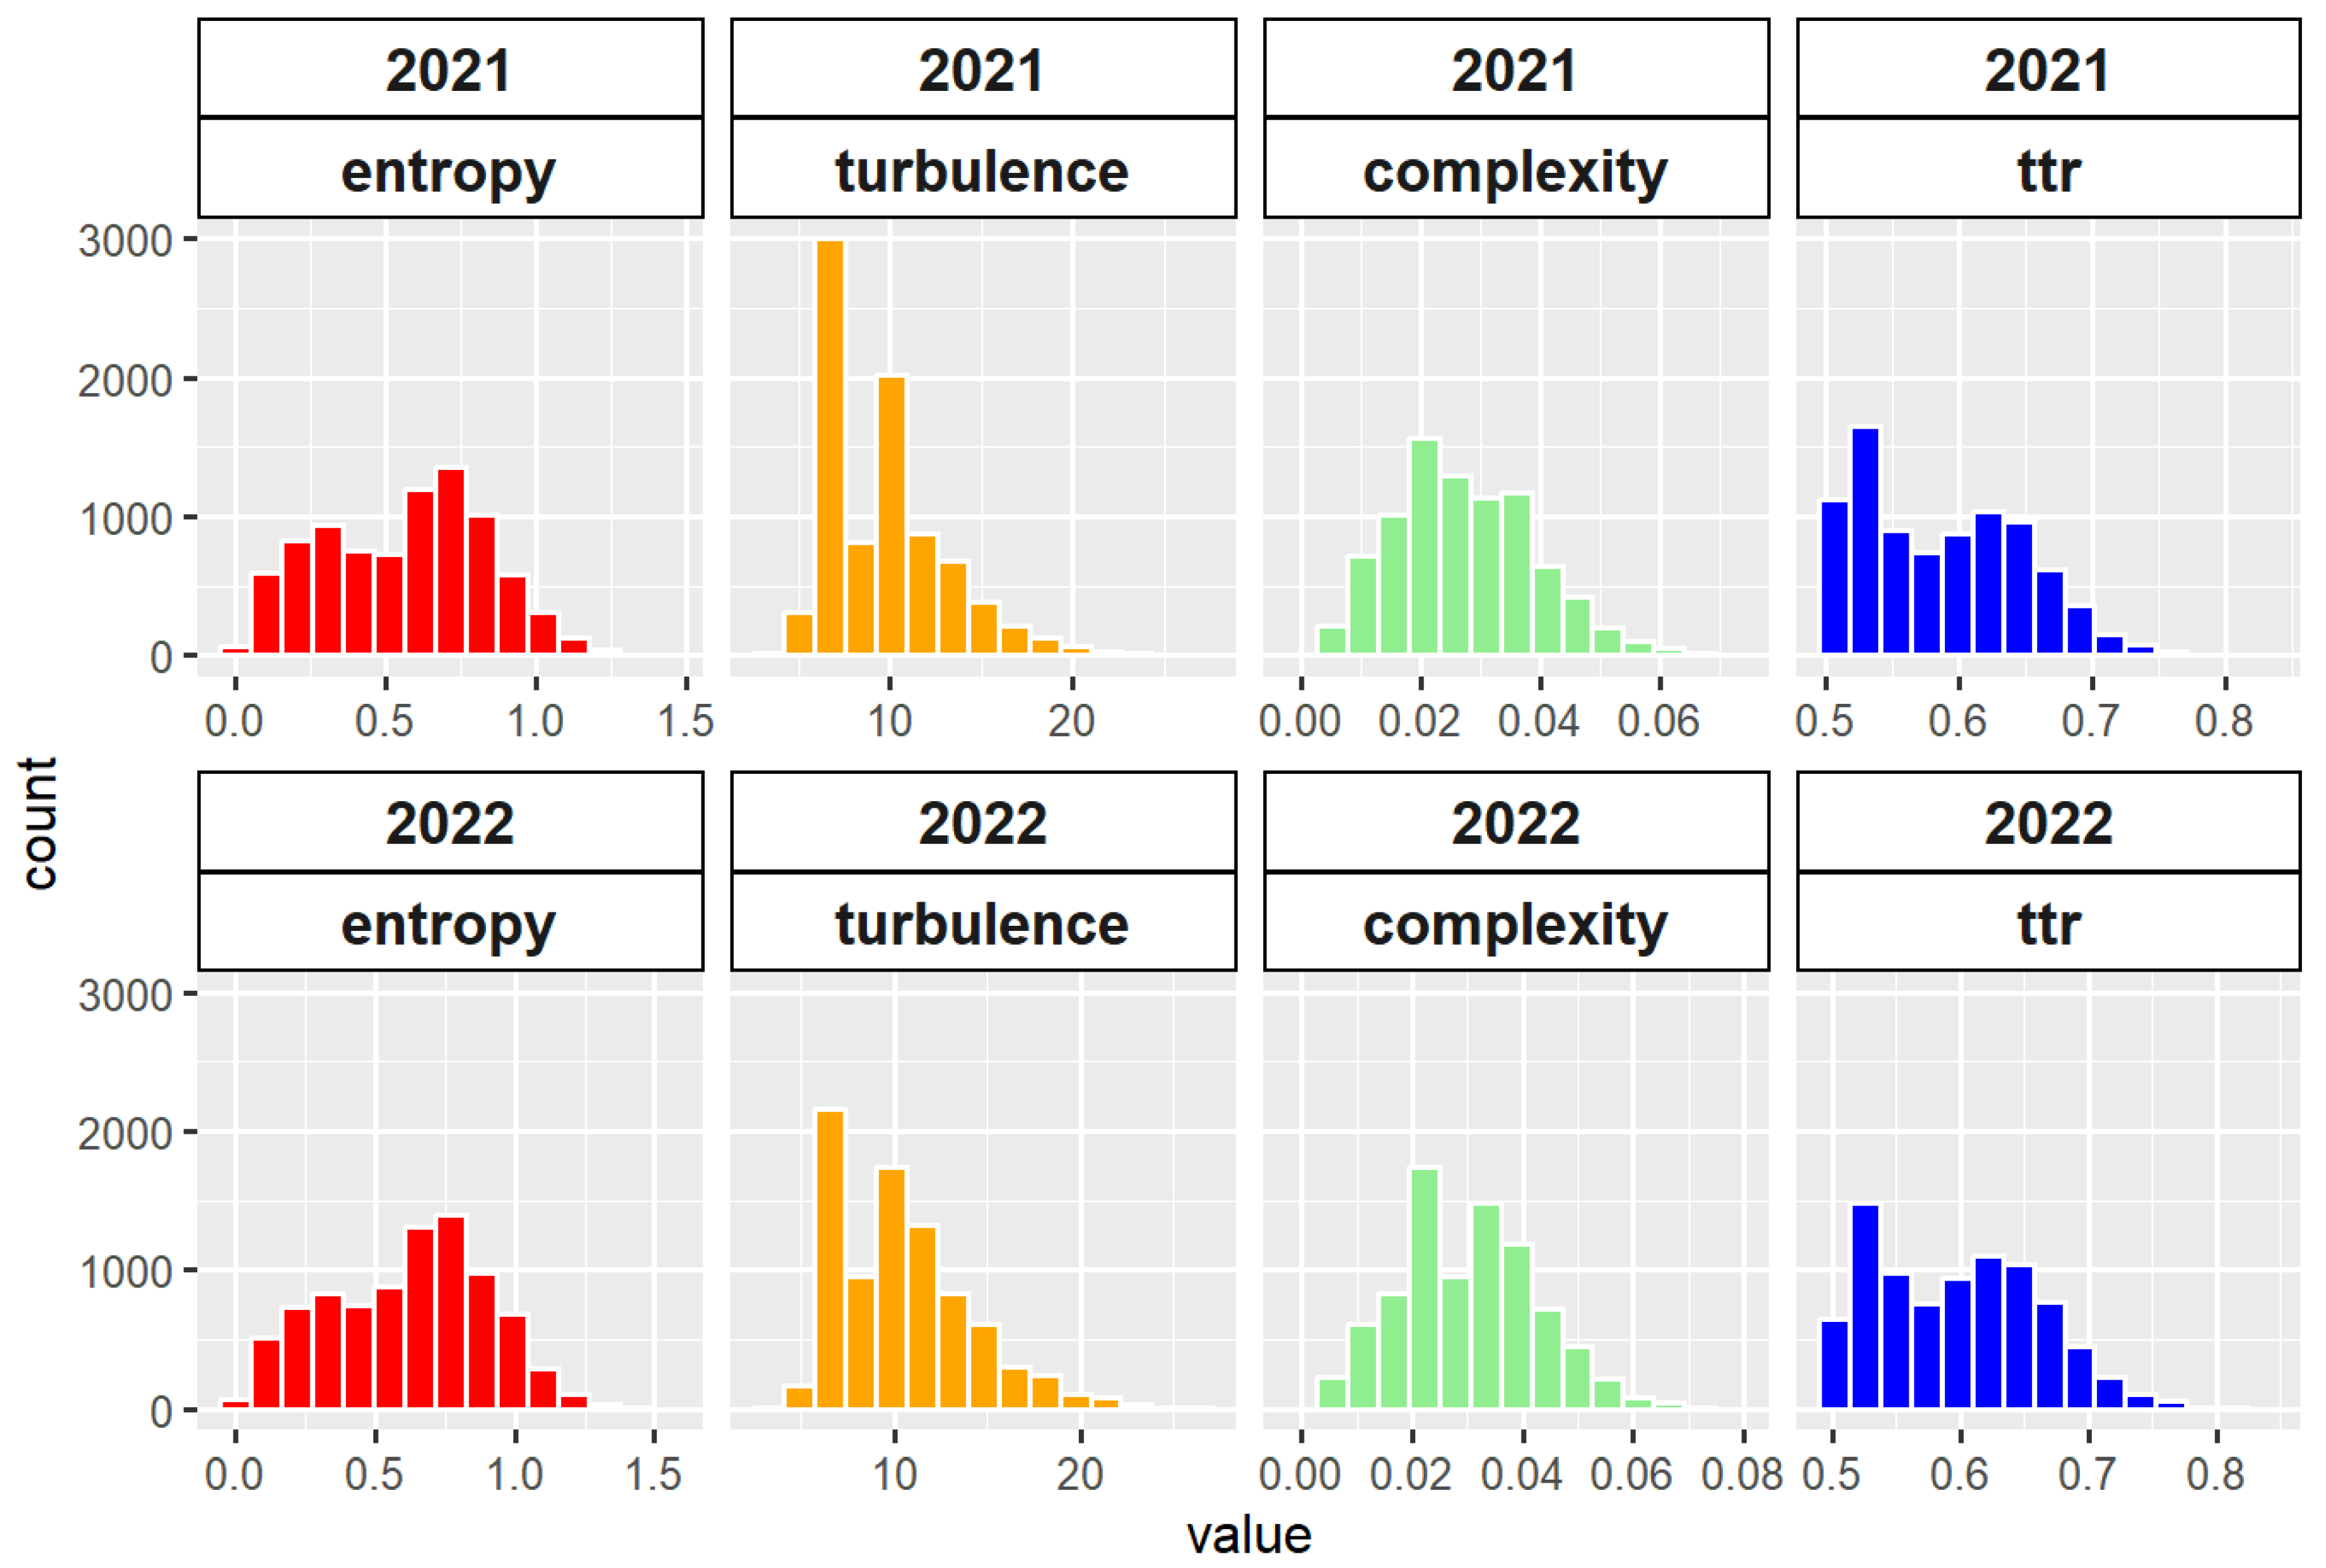
Figure 6.
Proportion of individuals with mandatory physical presence for work or studies according to EMEF 2021-2022 (below). Missing values indicate clearly underrepresented municipalities in the sample.
Figure 6.
Proportion of individuals with mandatory physical presence for work or studies according to EMEF 2021-2022 (below). Missing values indicate clearly underrepresented municipalities in the sample.
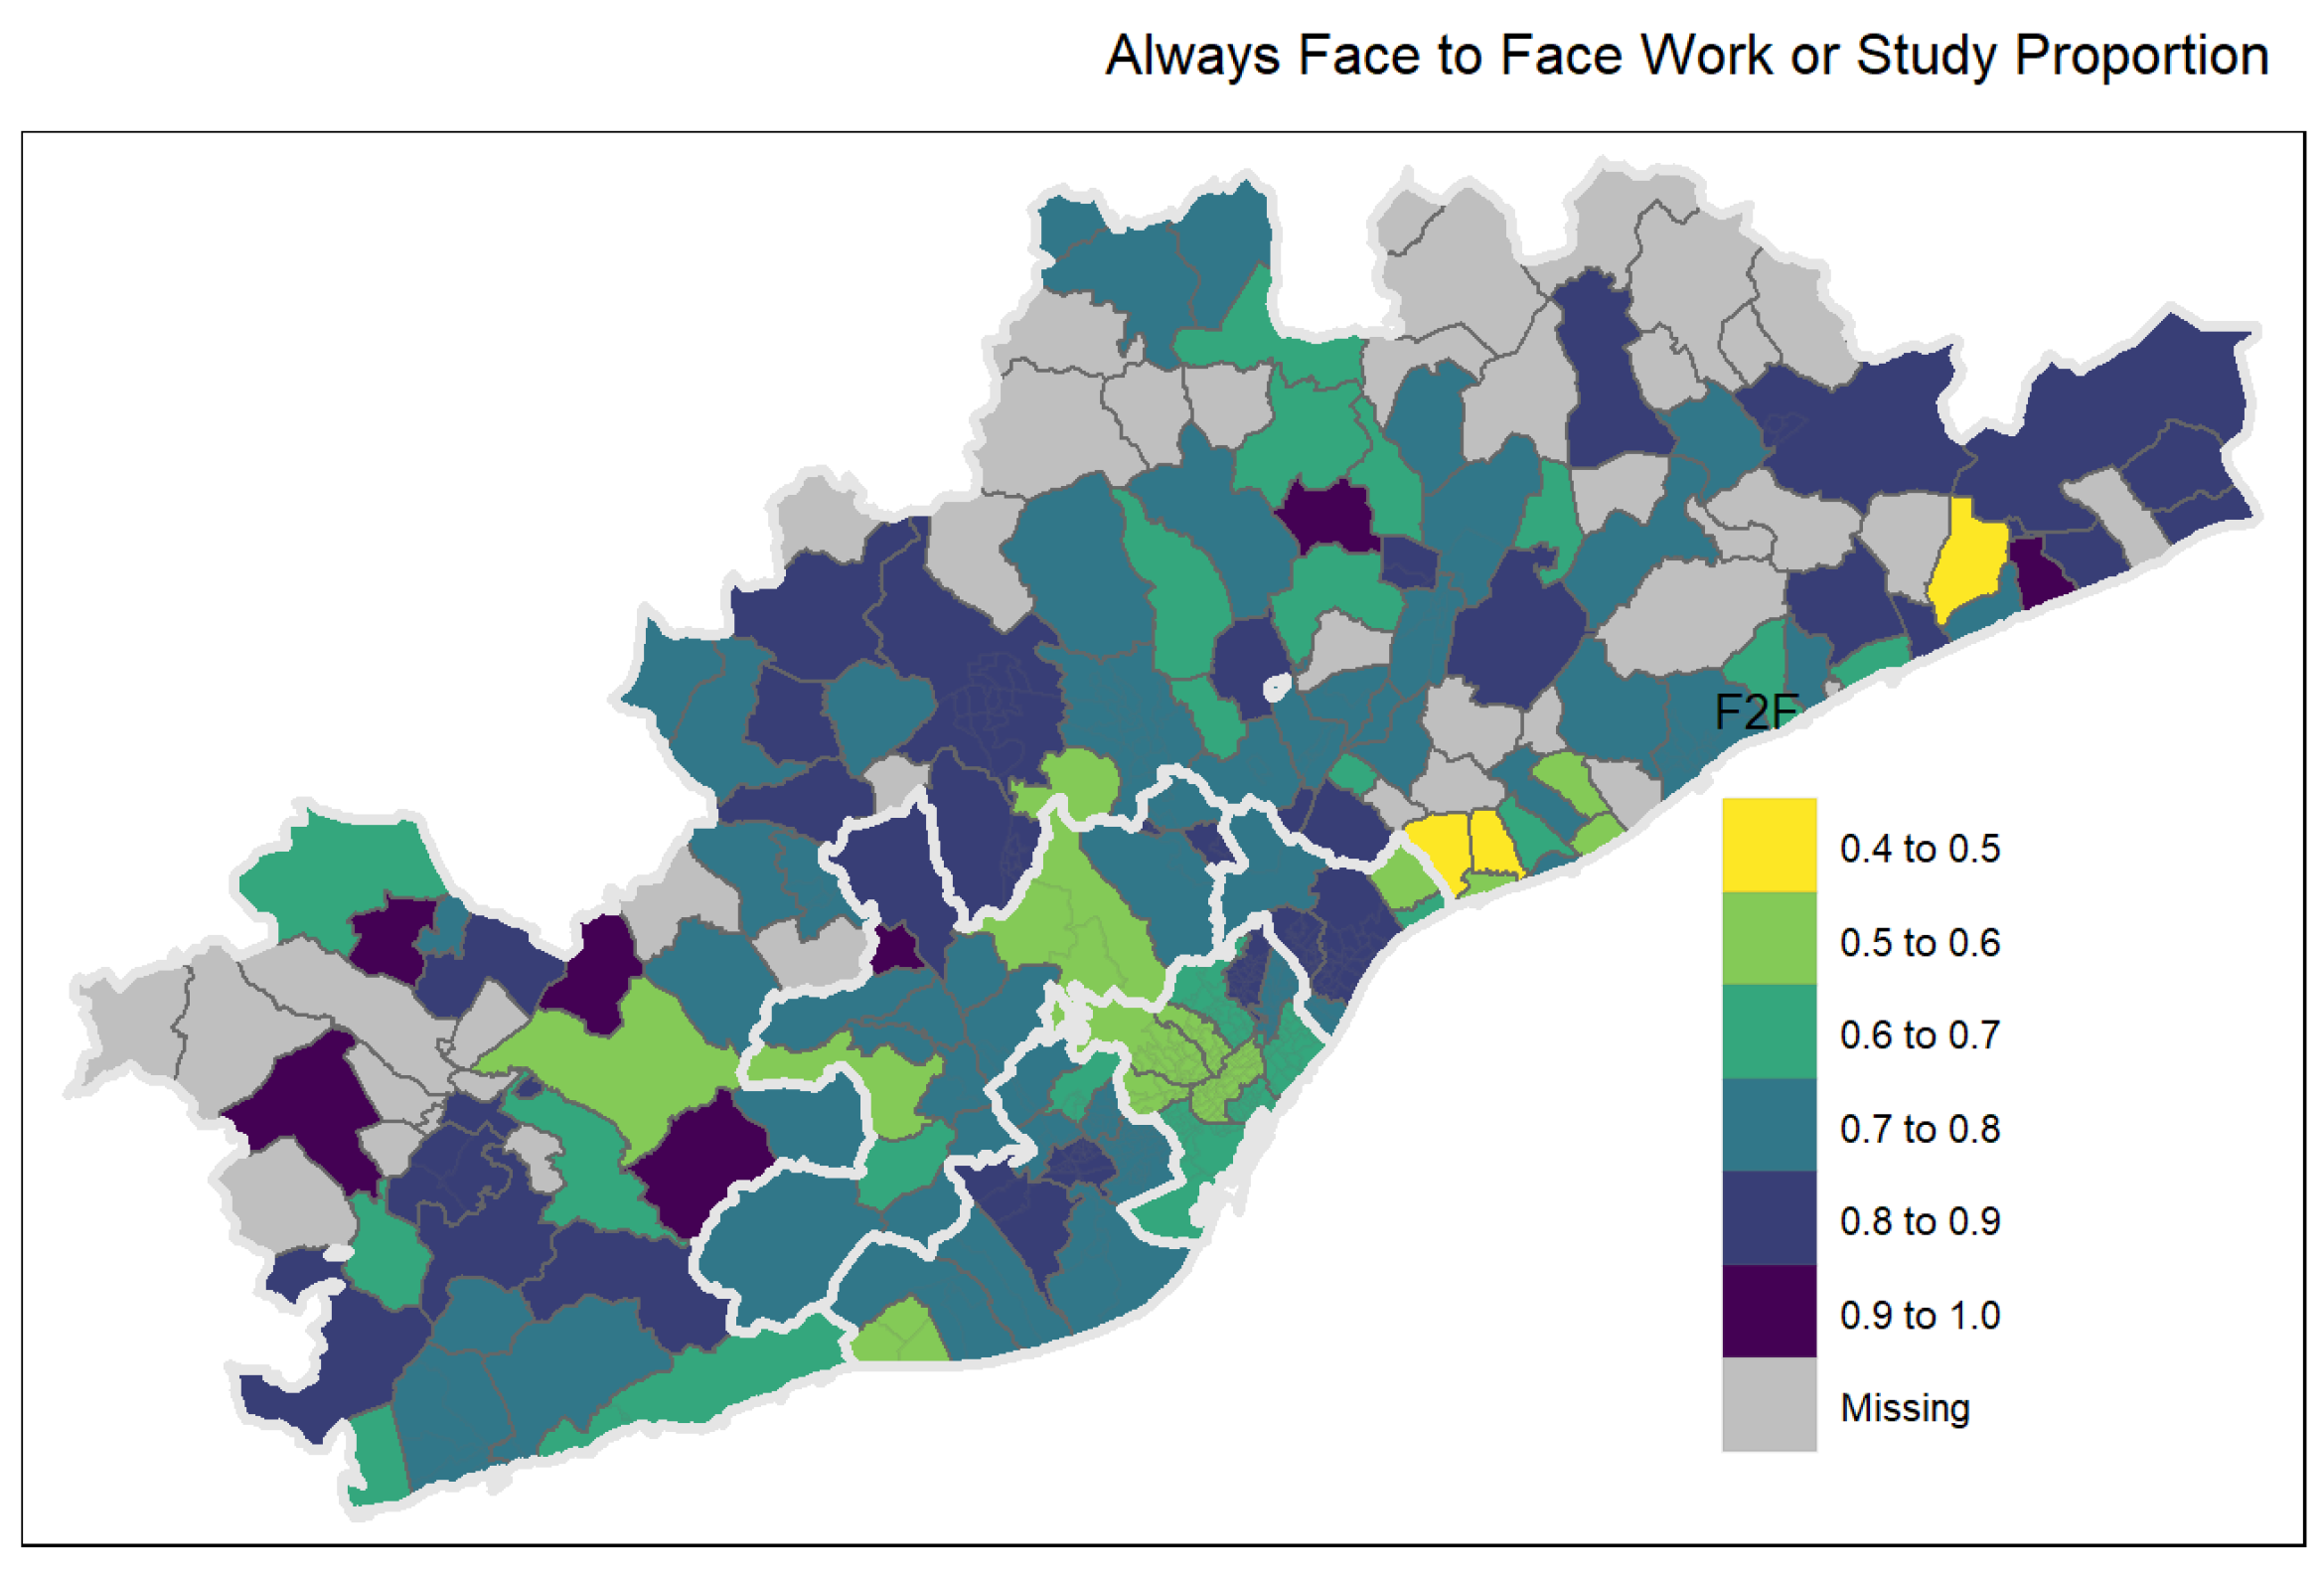
Figure 7.
Categorization of public transport services (Autoritat Transport Metropolità, ATM).
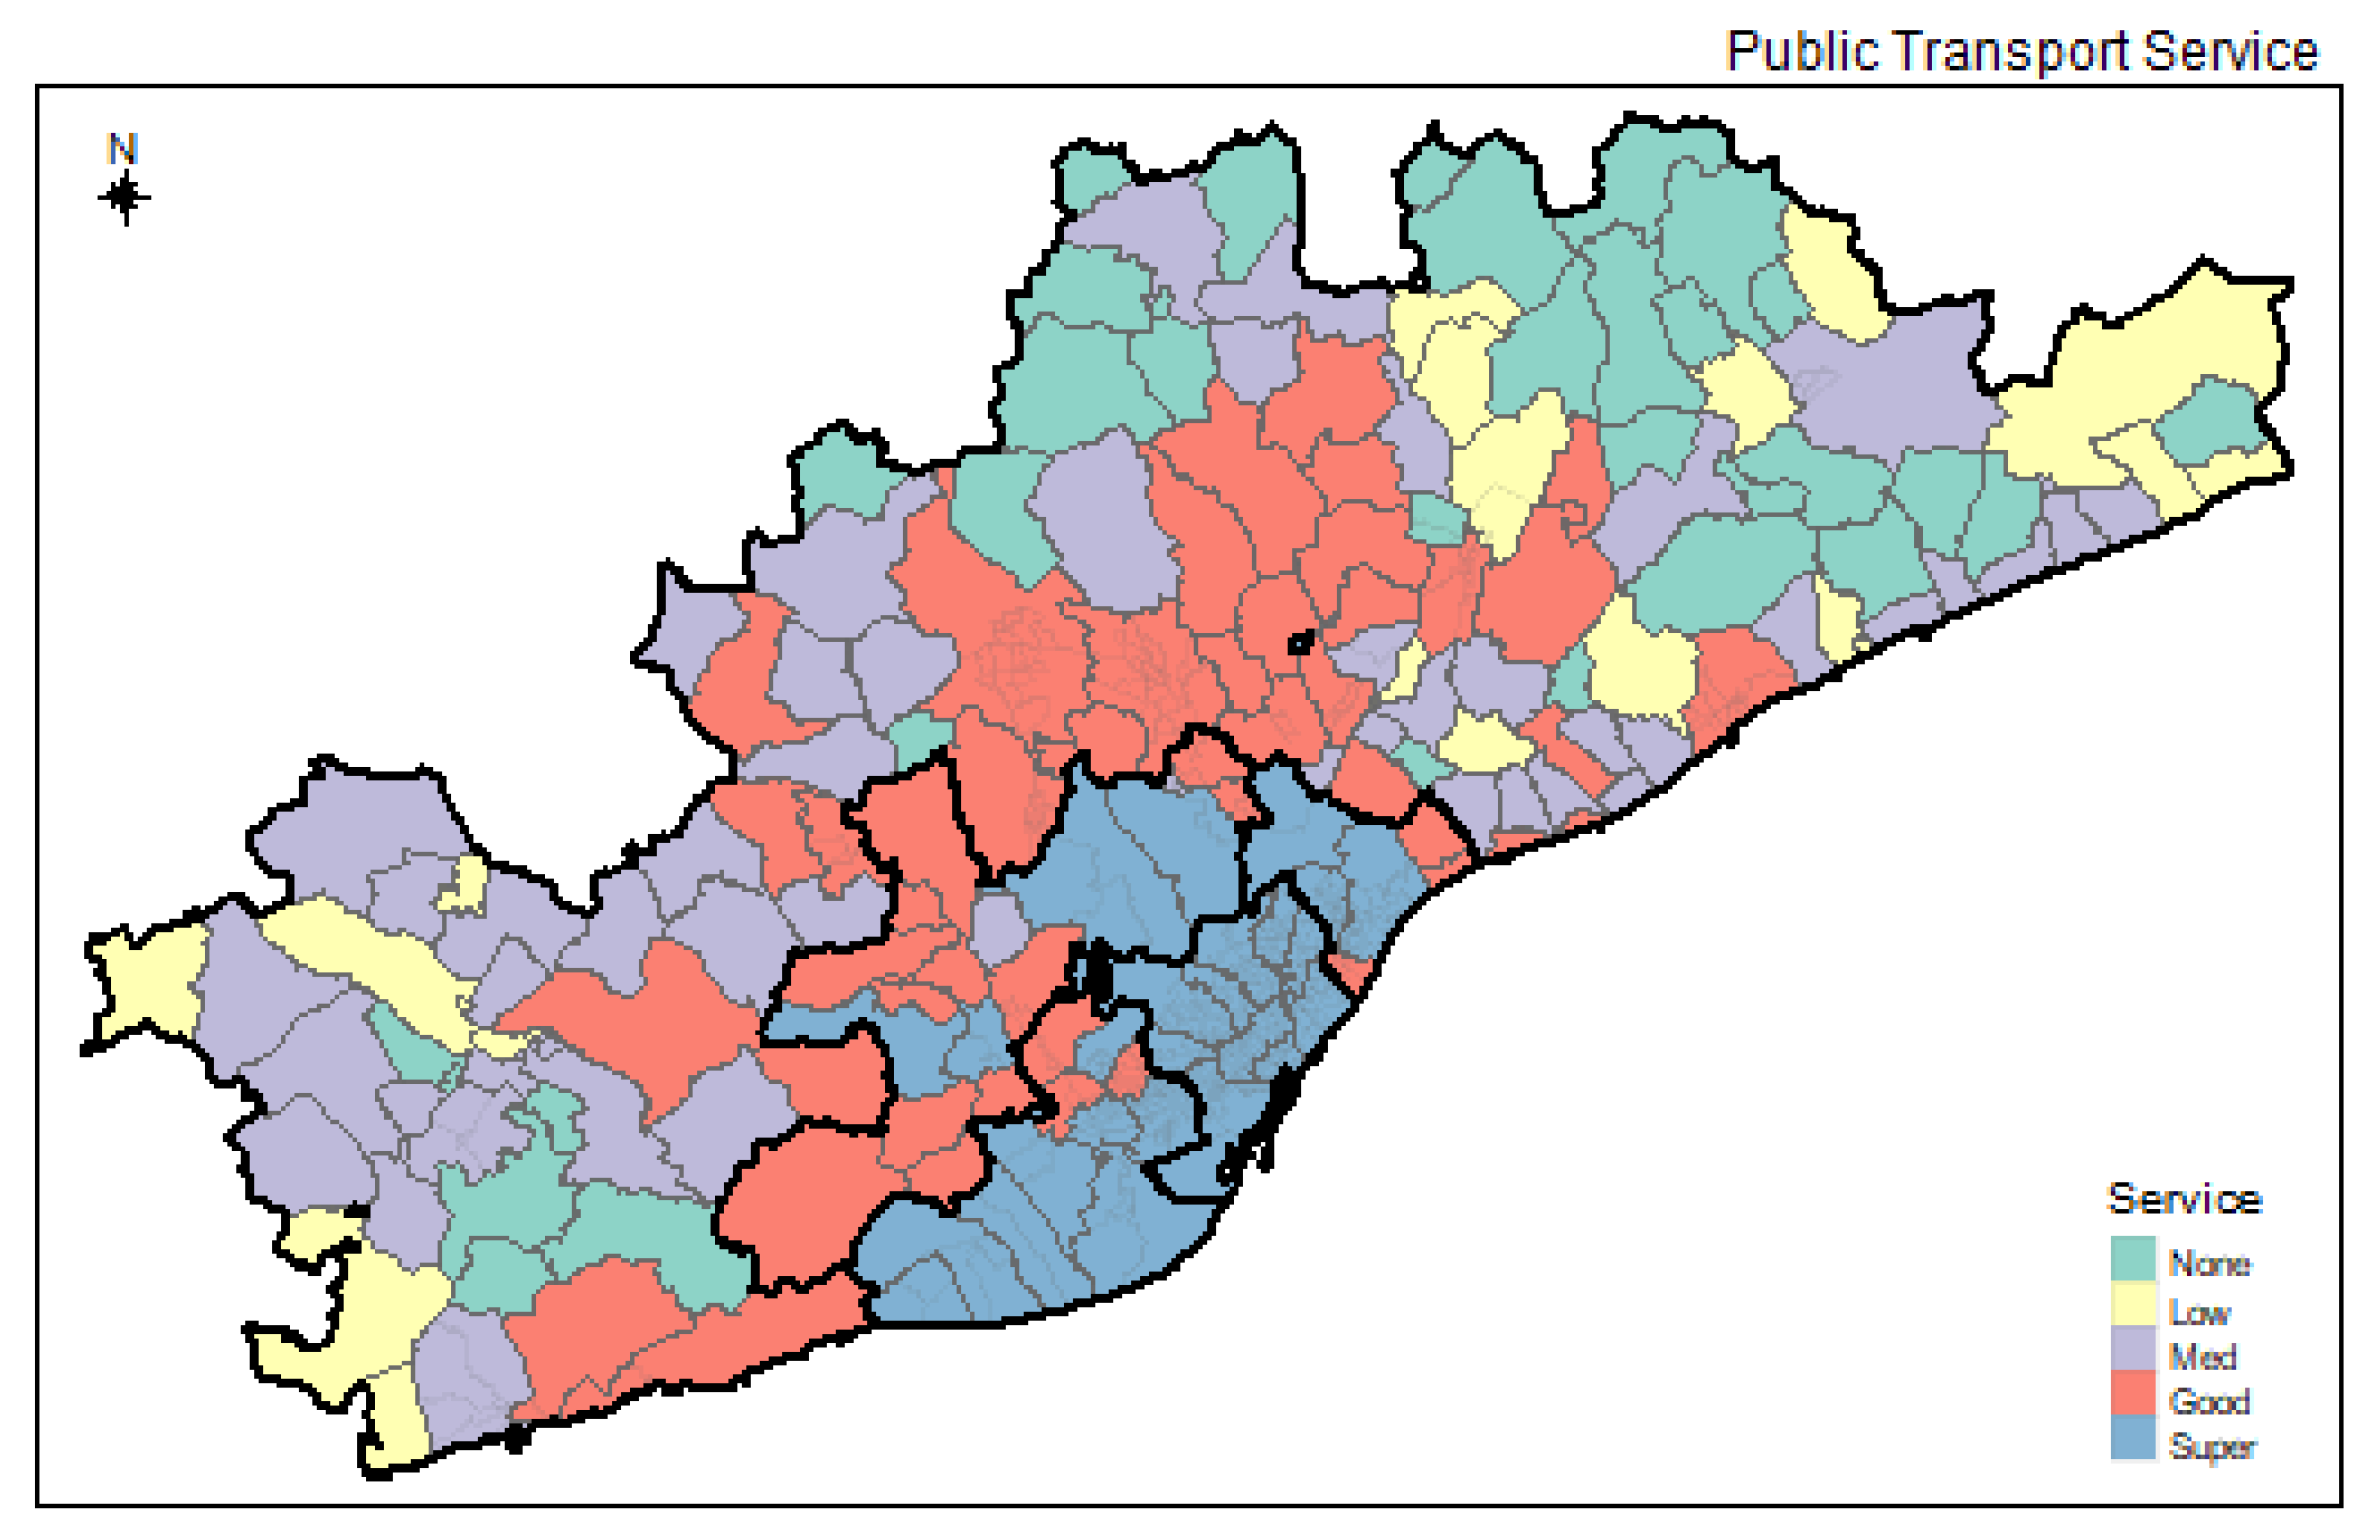
Figure 8.
Fragmentation indicators and job arrangements (WfH). EMEF21-22.
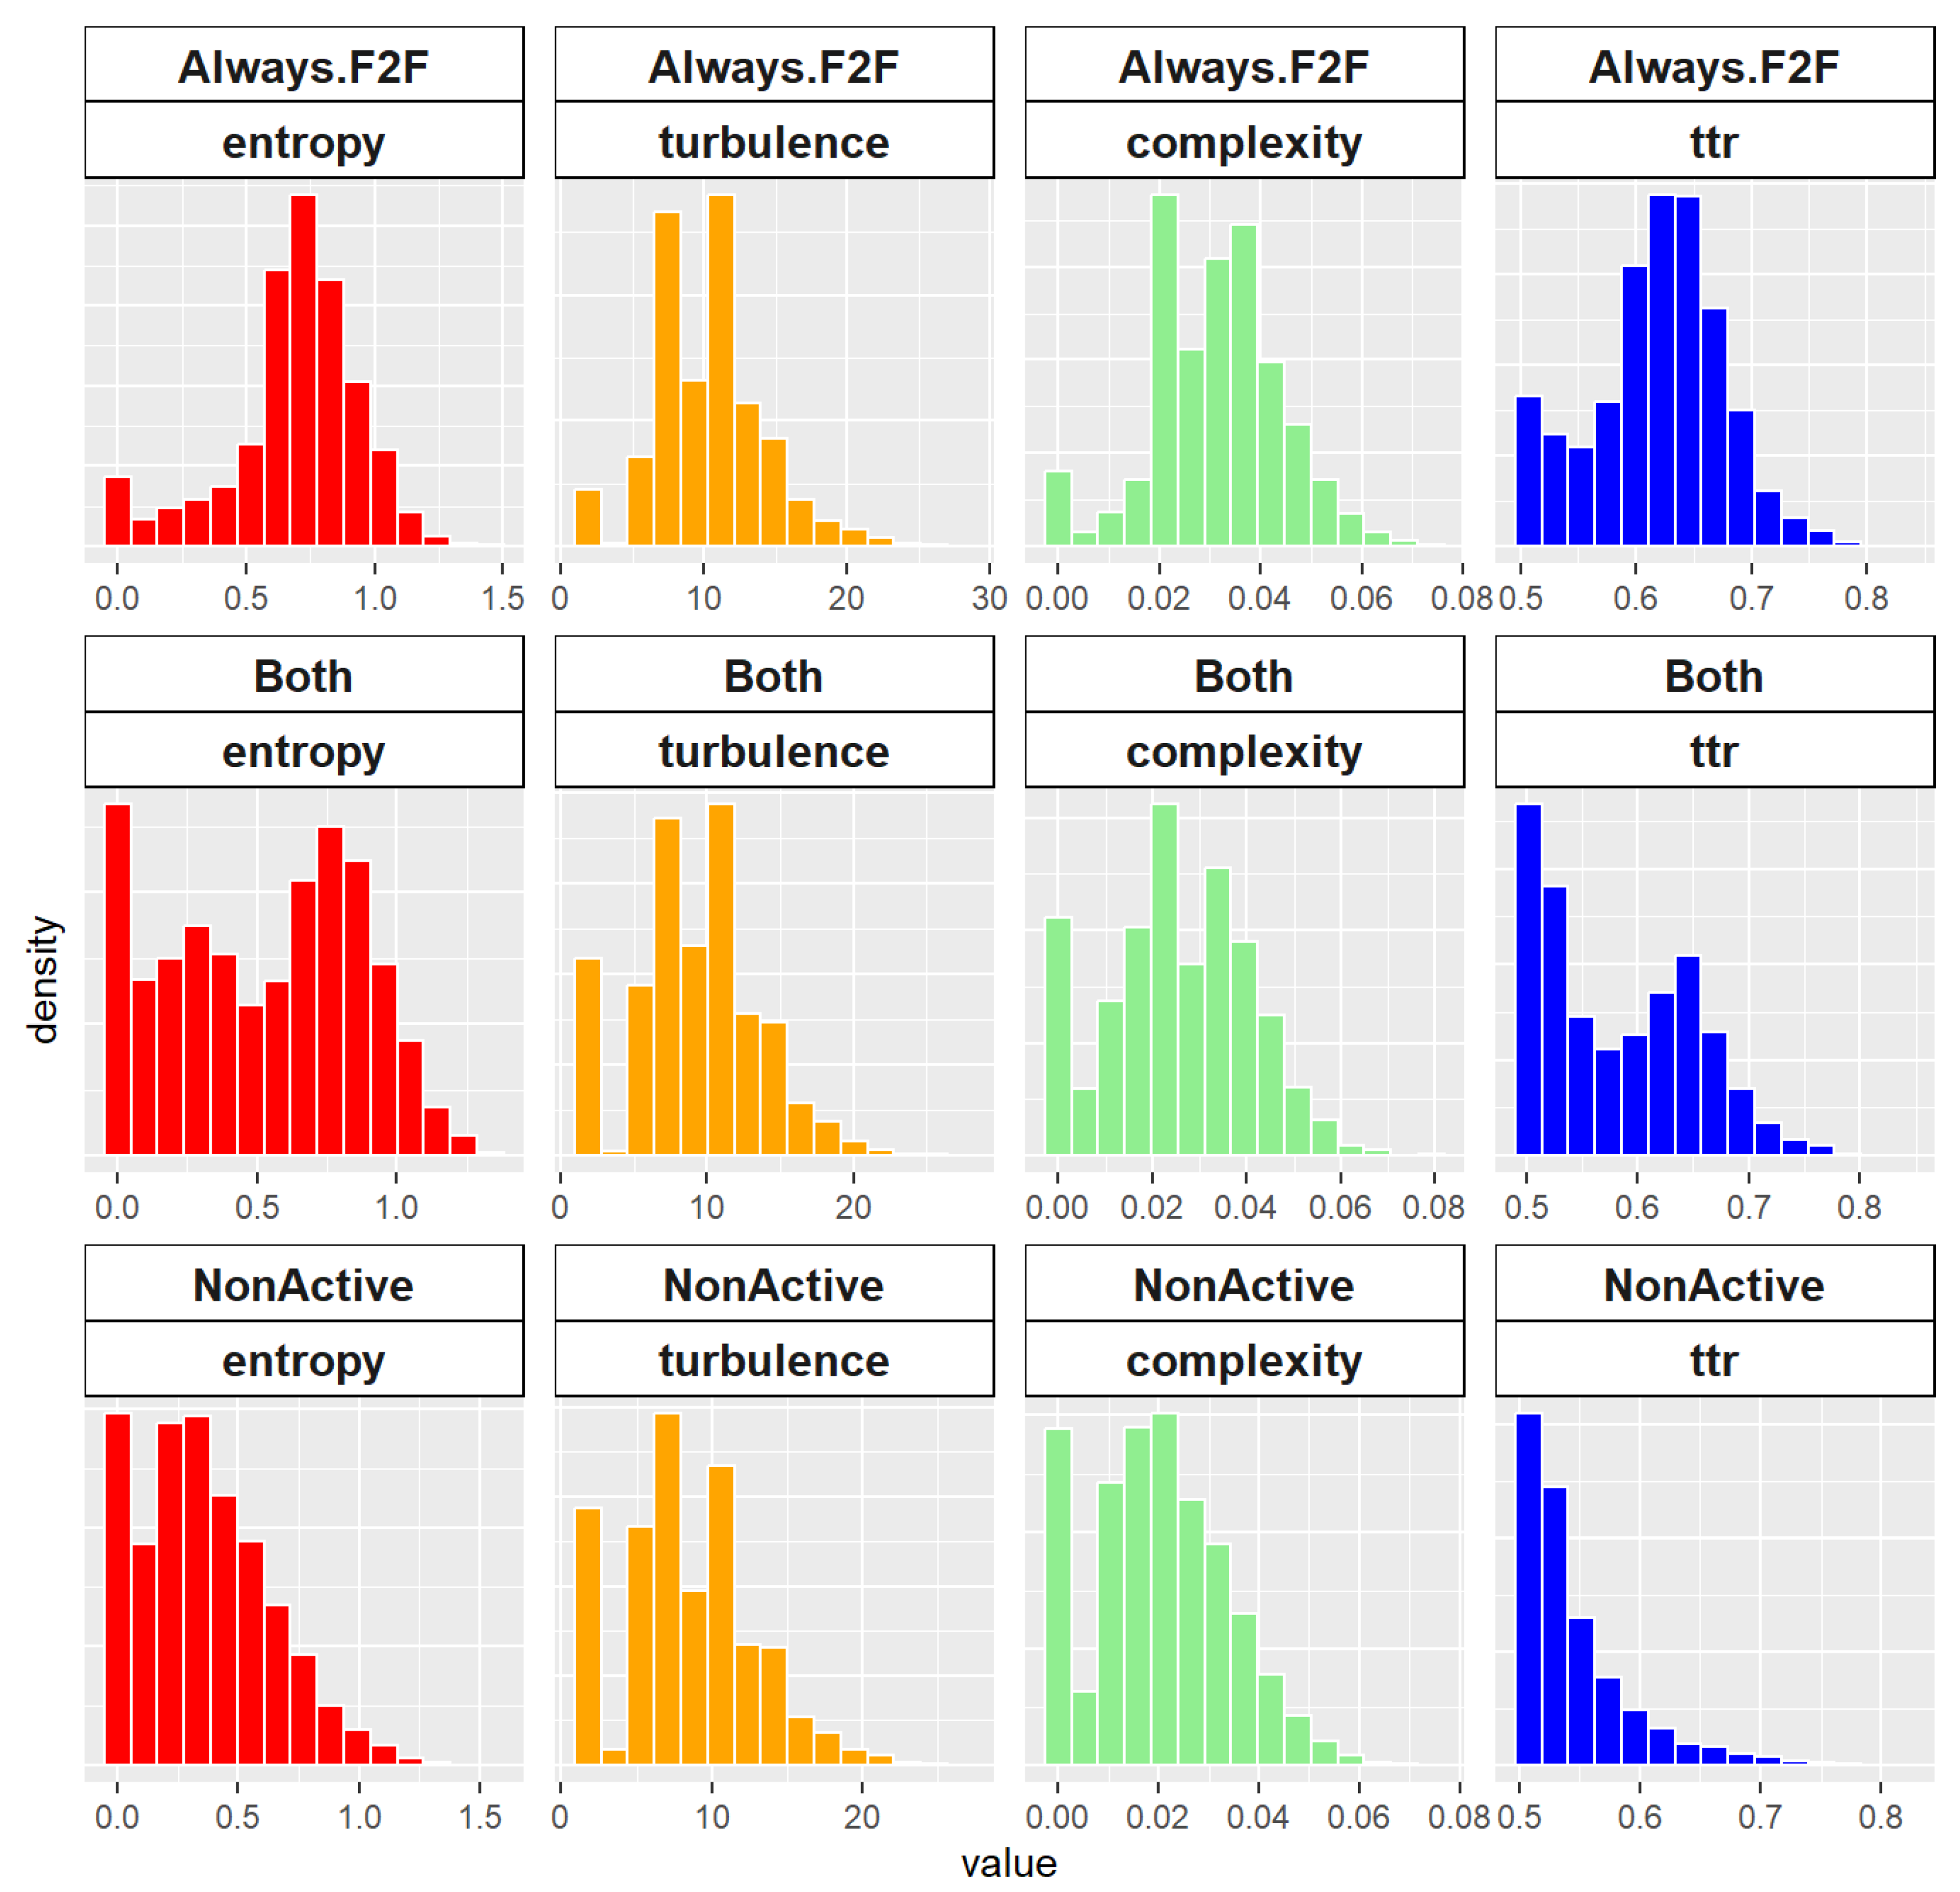
Figure 9.
Sequence analysis: states distribution in a working day for hybrid working arrangements using EMEF surveys 2021 and 2022.
Figure 9.
Sequence analysis: states distribution in a working day for hybrid working arrangements using EMEF surveys 2021 and 2022.
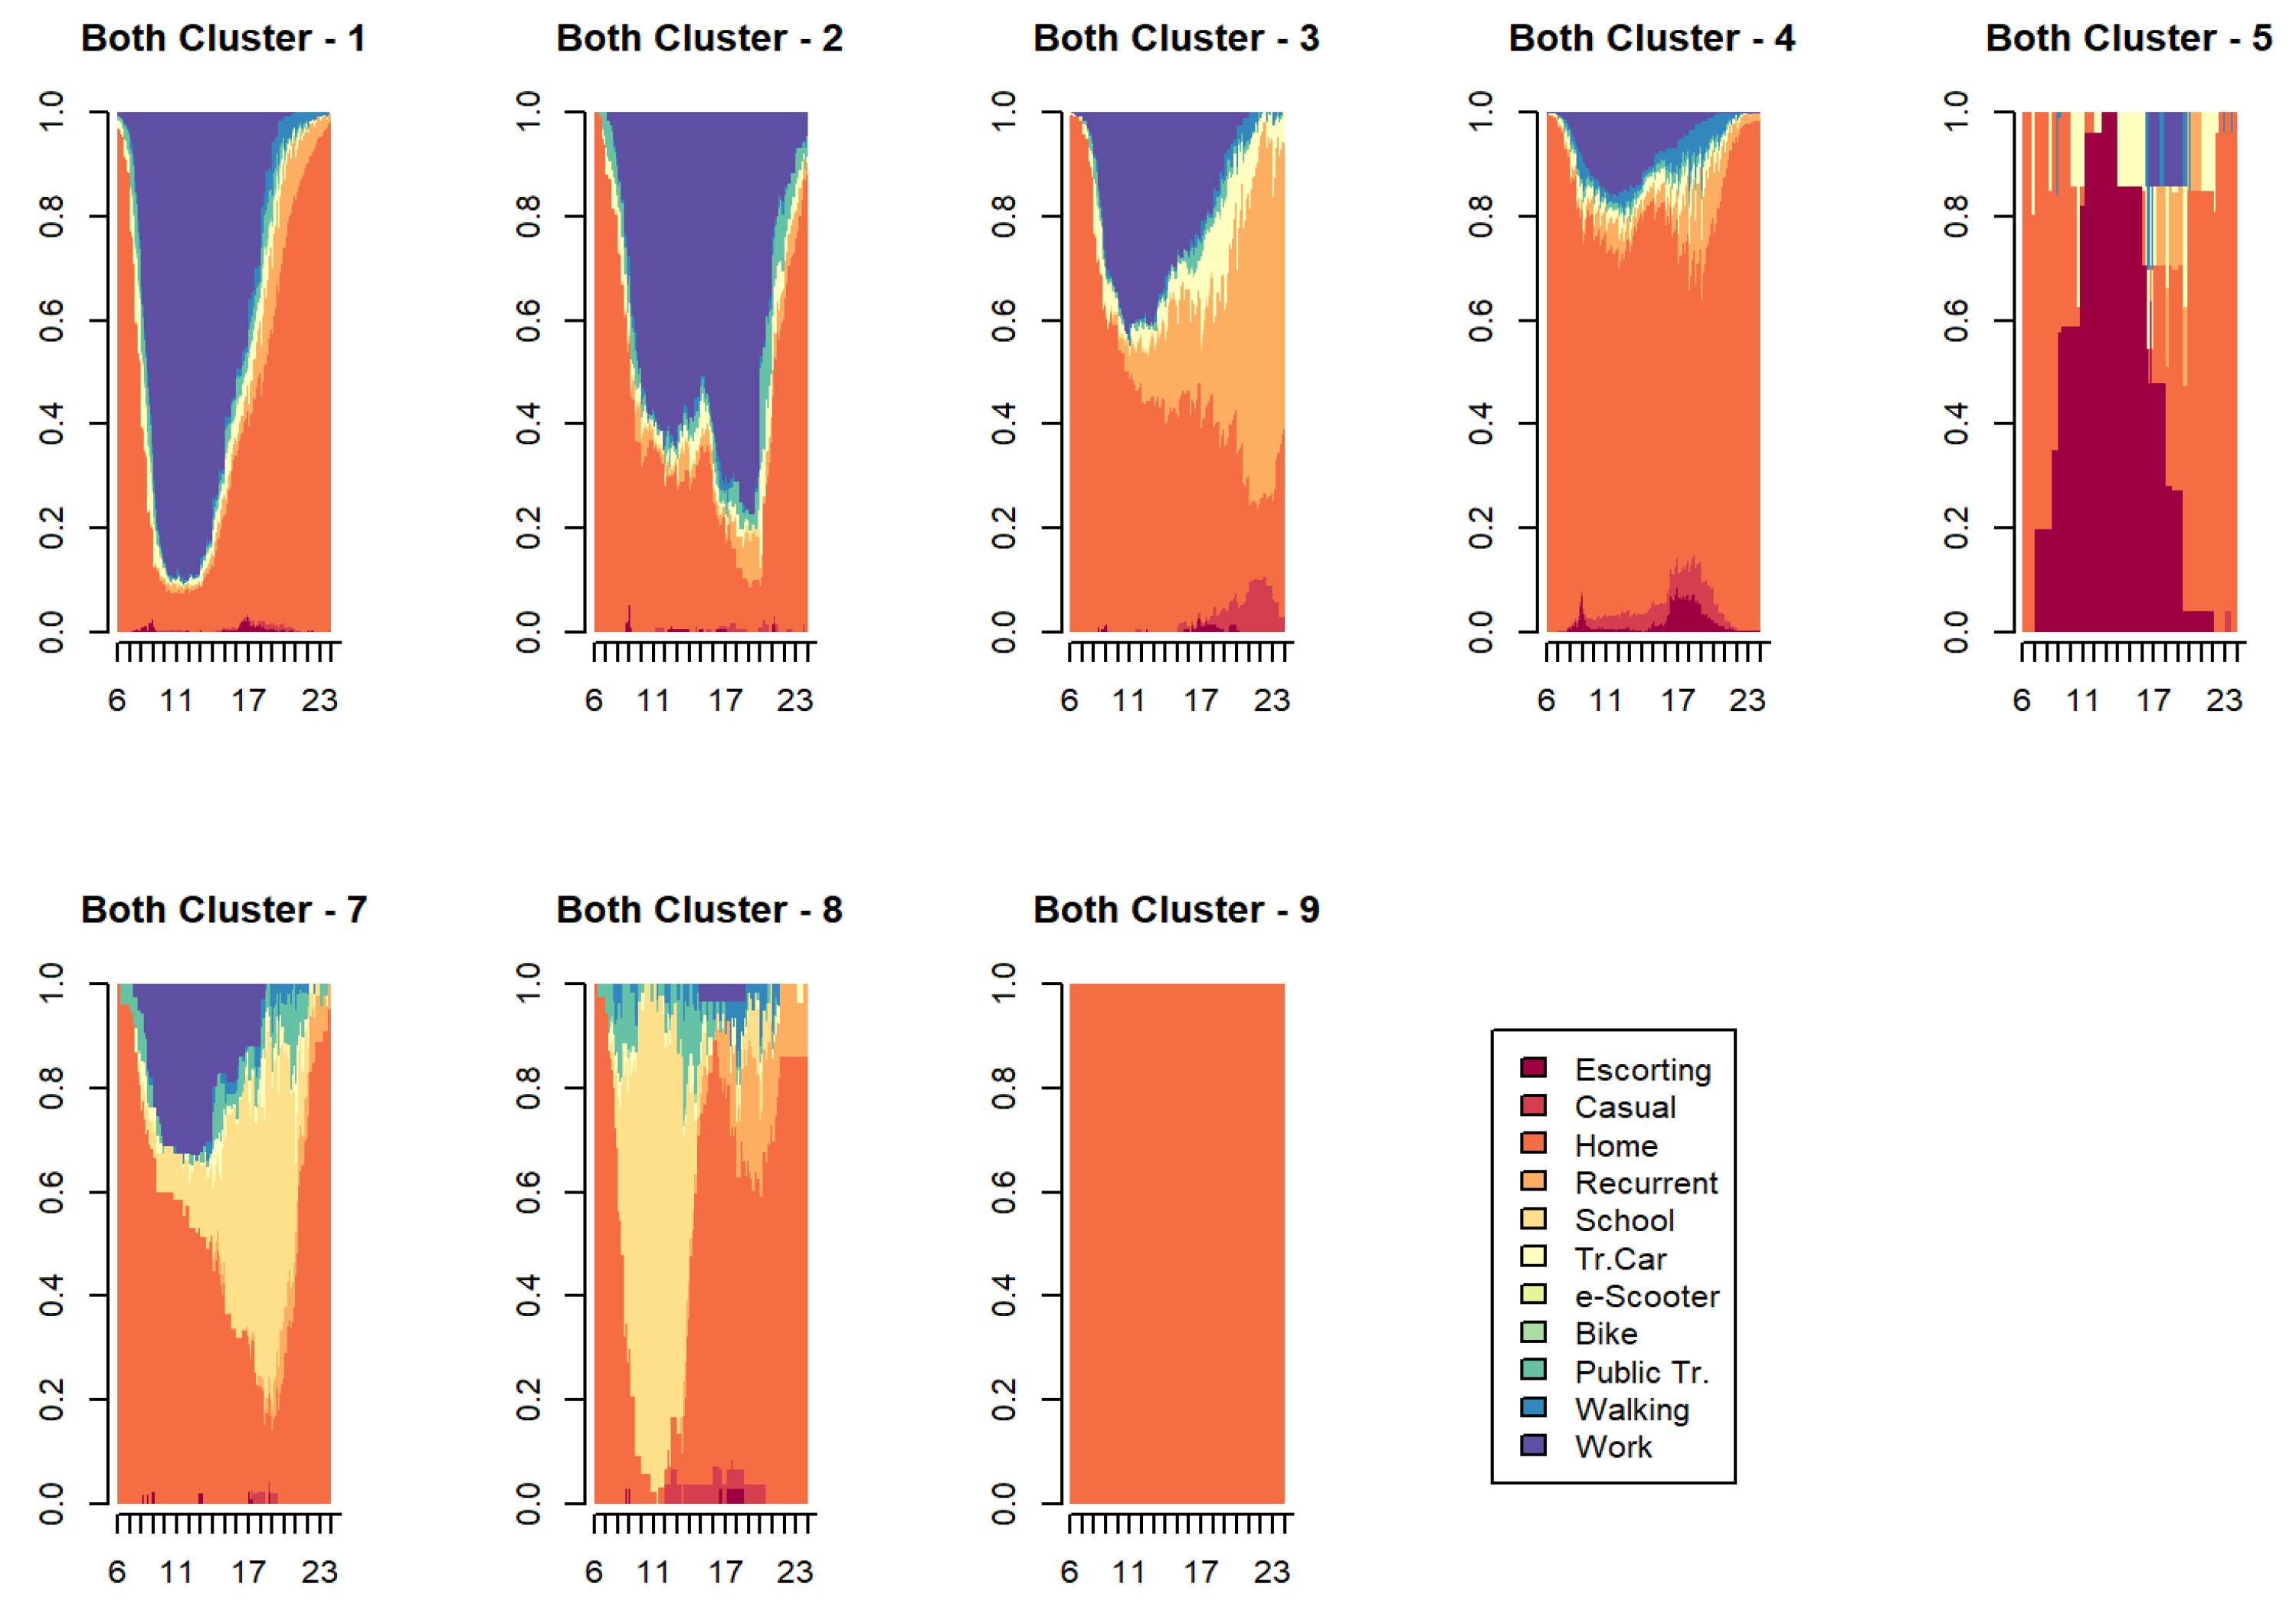
Figure 10.
Sequence analysis: states distribution across a working day according to WfH factor. EMEF 2021 and 2022.
Figure 10.
Sequence analysis: states distribution across a working day according to WfH factor. EMEF 2021 and 2022.
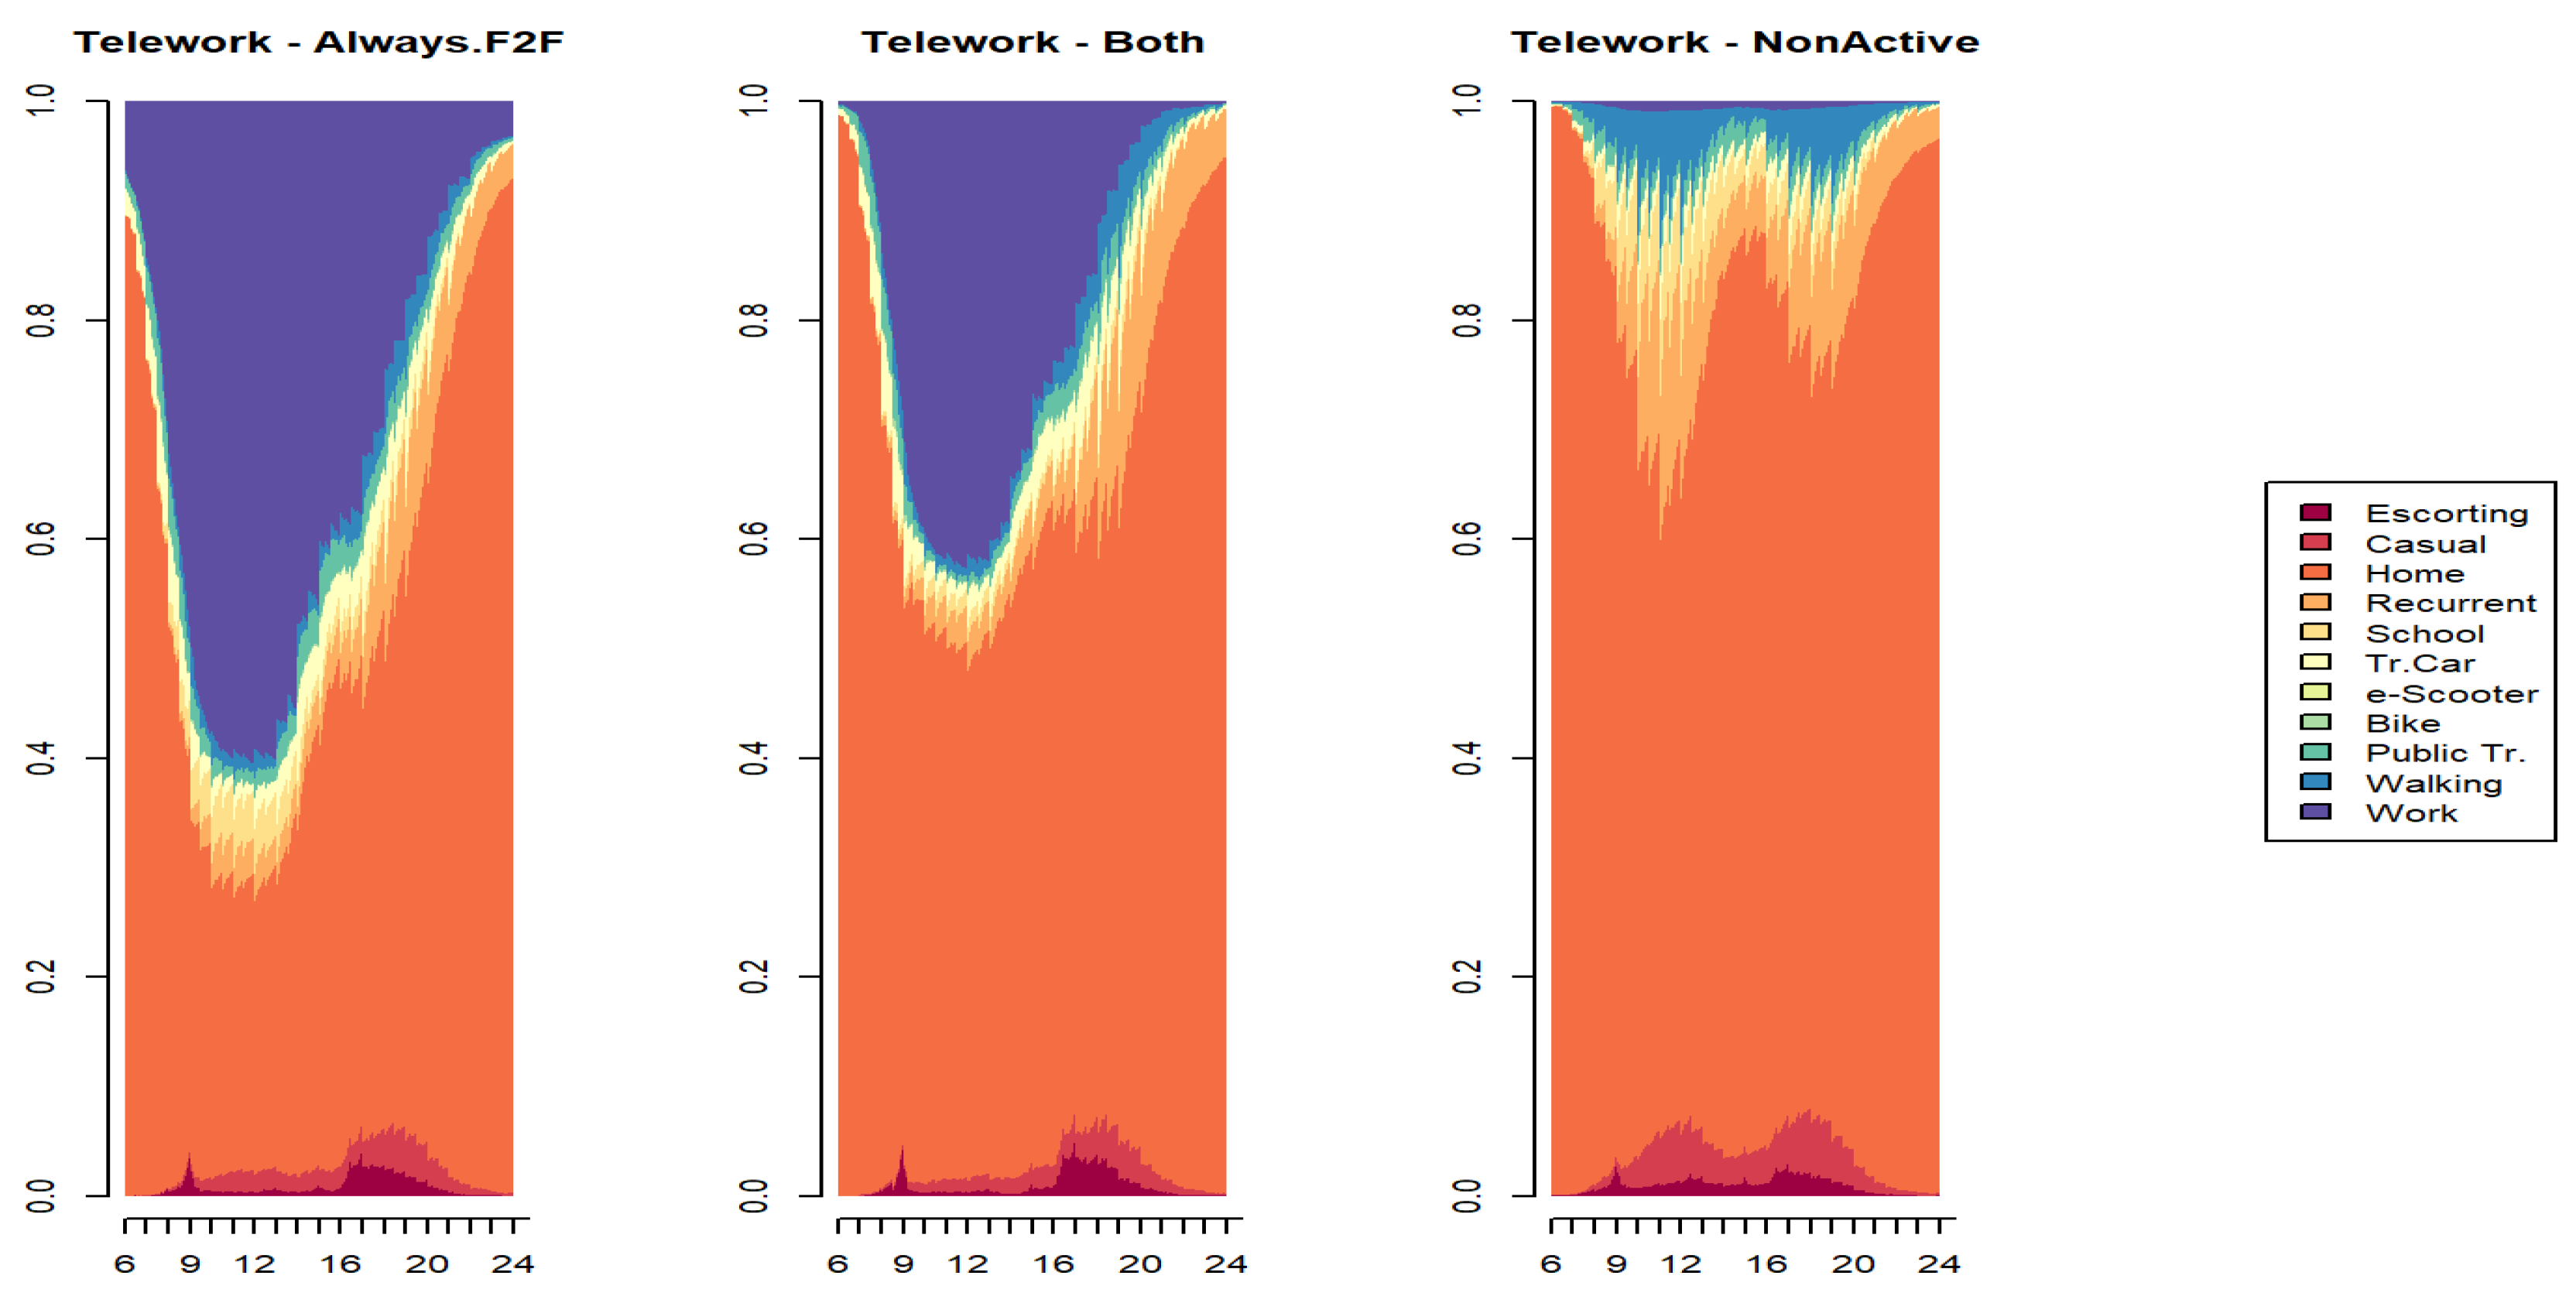
Figure 11.
Sequence analysis: states distribution across a working day according to WfH refined factor. EMEF 2021 and 2022.
Figure 11.
Sequence analysis: states distribution across a working day according to WfH refined factor. EMEF 2021 and 2022.
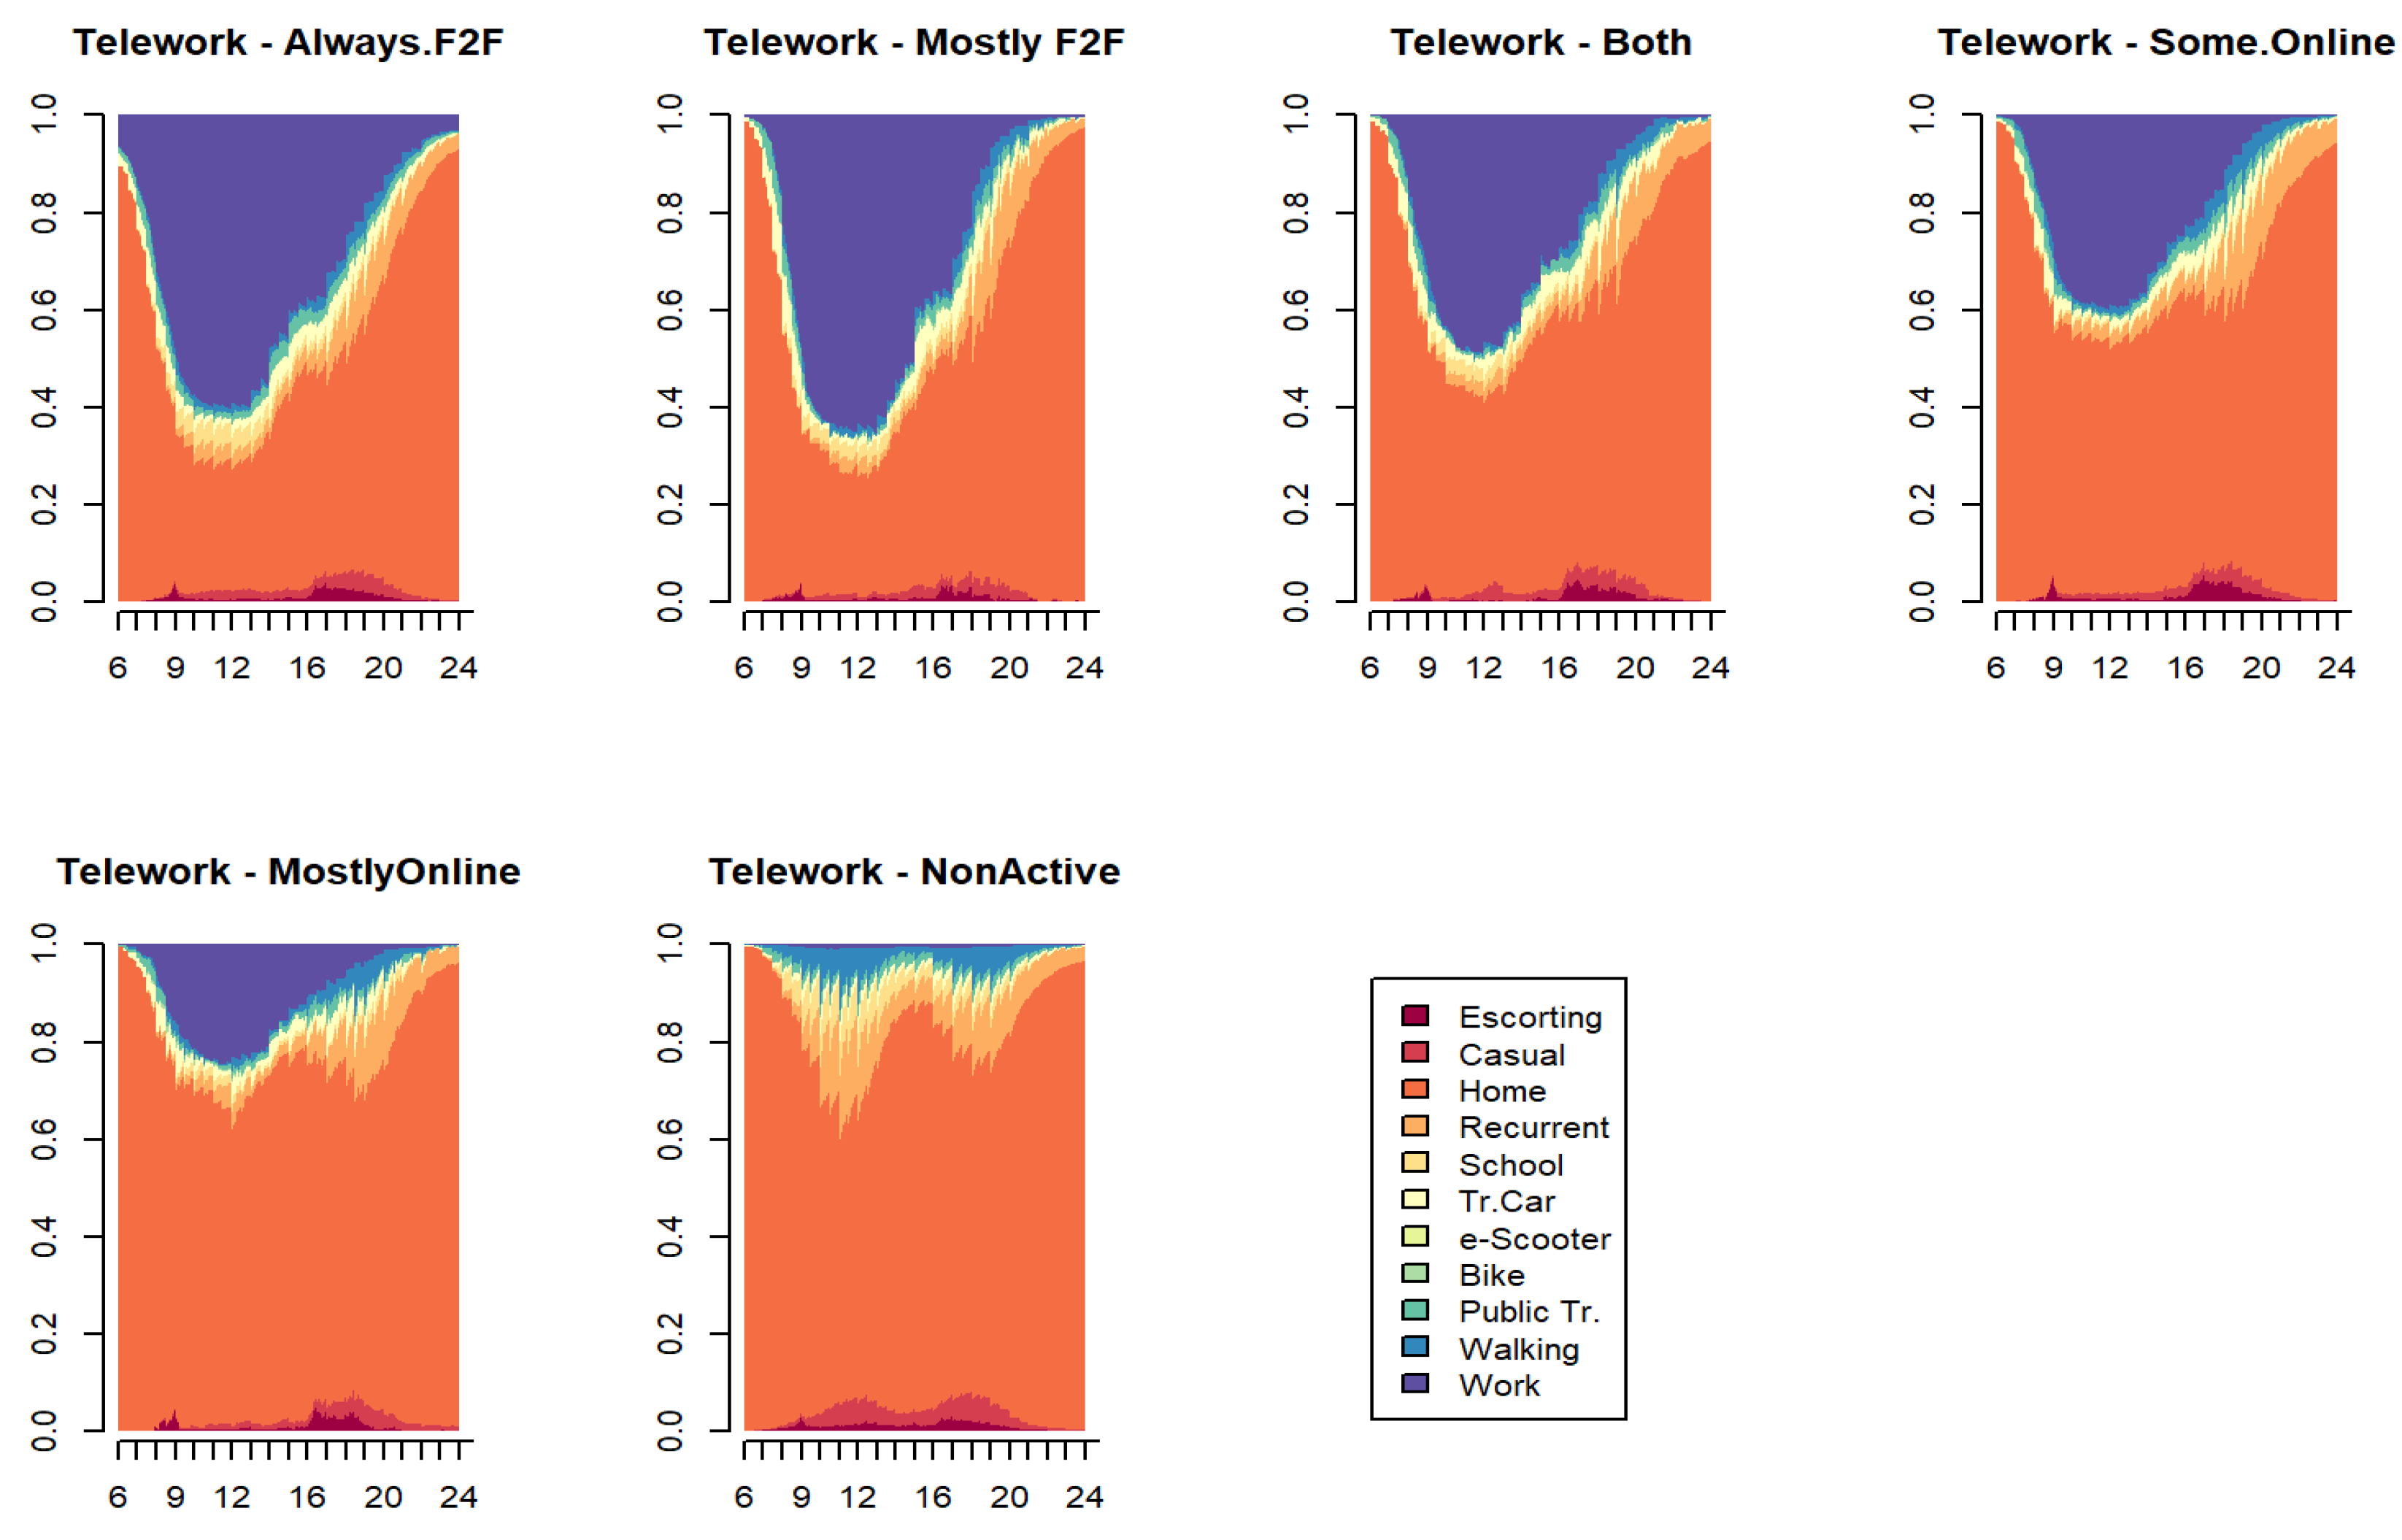
Figure 12.
Interaction terms according to gender and education in hybrid working arrangements.
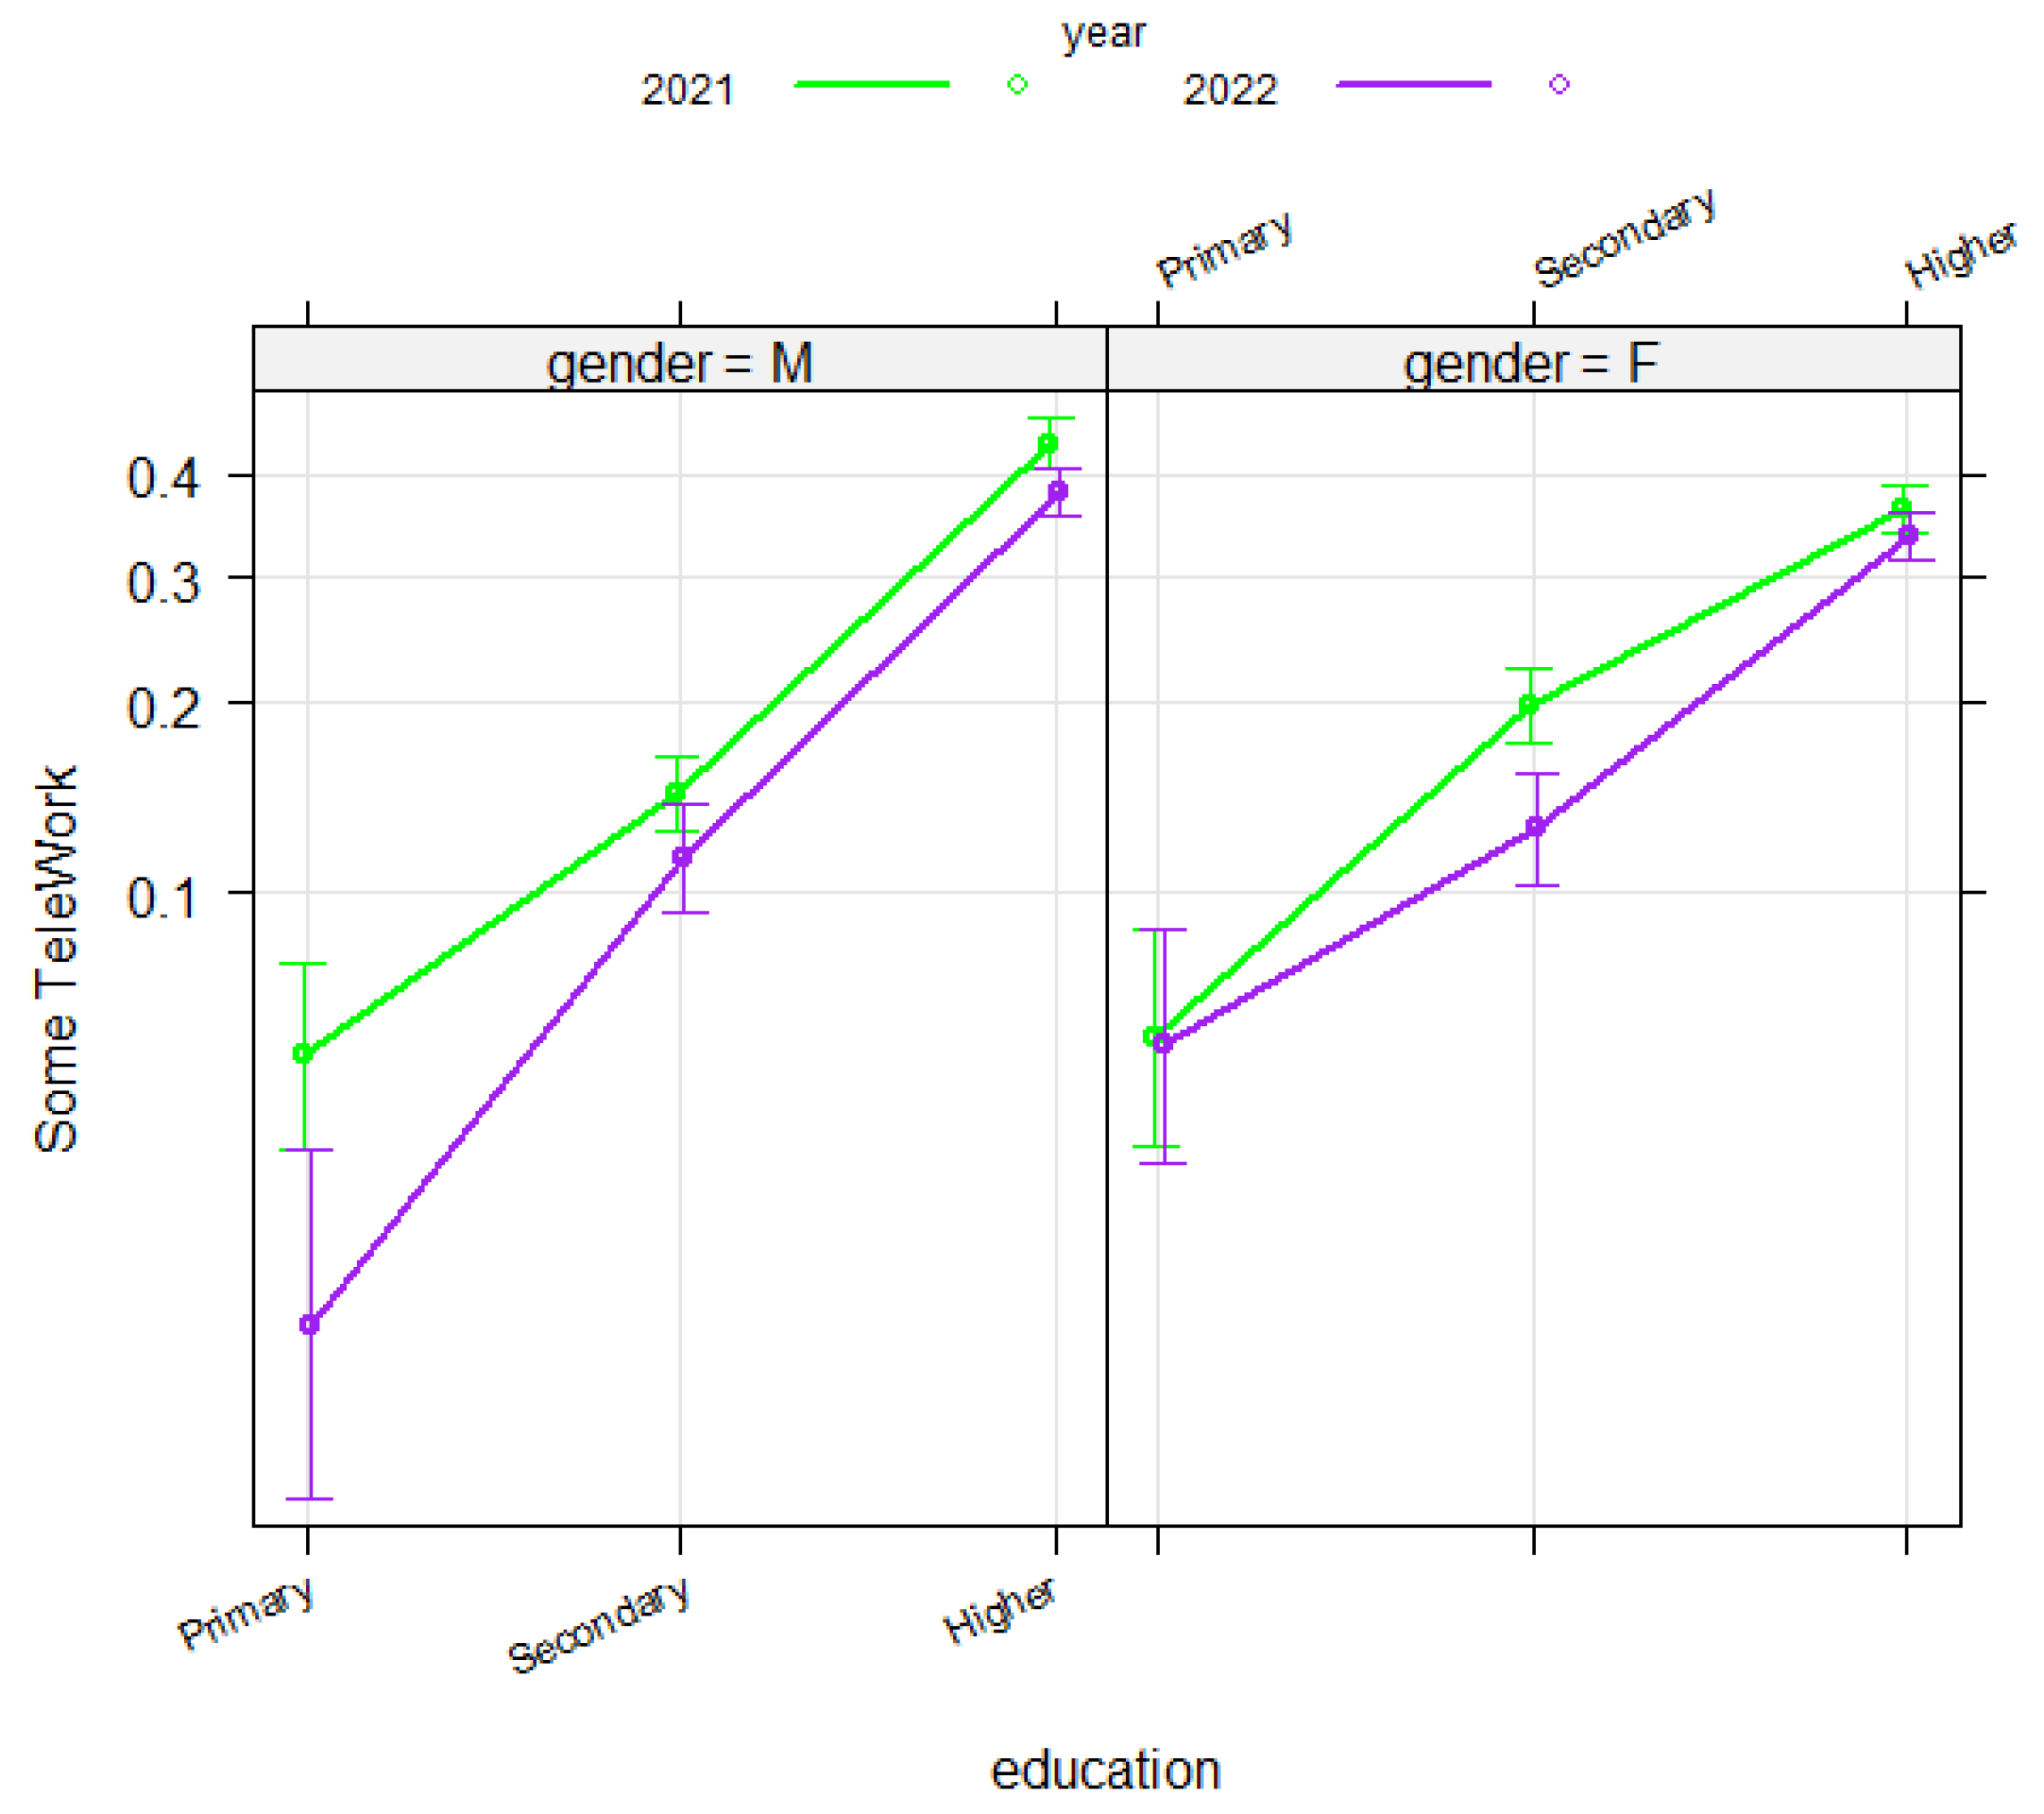
Figure 13.
Interaction terms family members under 13 years old with at least hybrid arrangements (non-significant gender effect).
Figure 13.
Interaction terms family members under 13 years old with at least hybrid arrangements (non-significant gender effect).
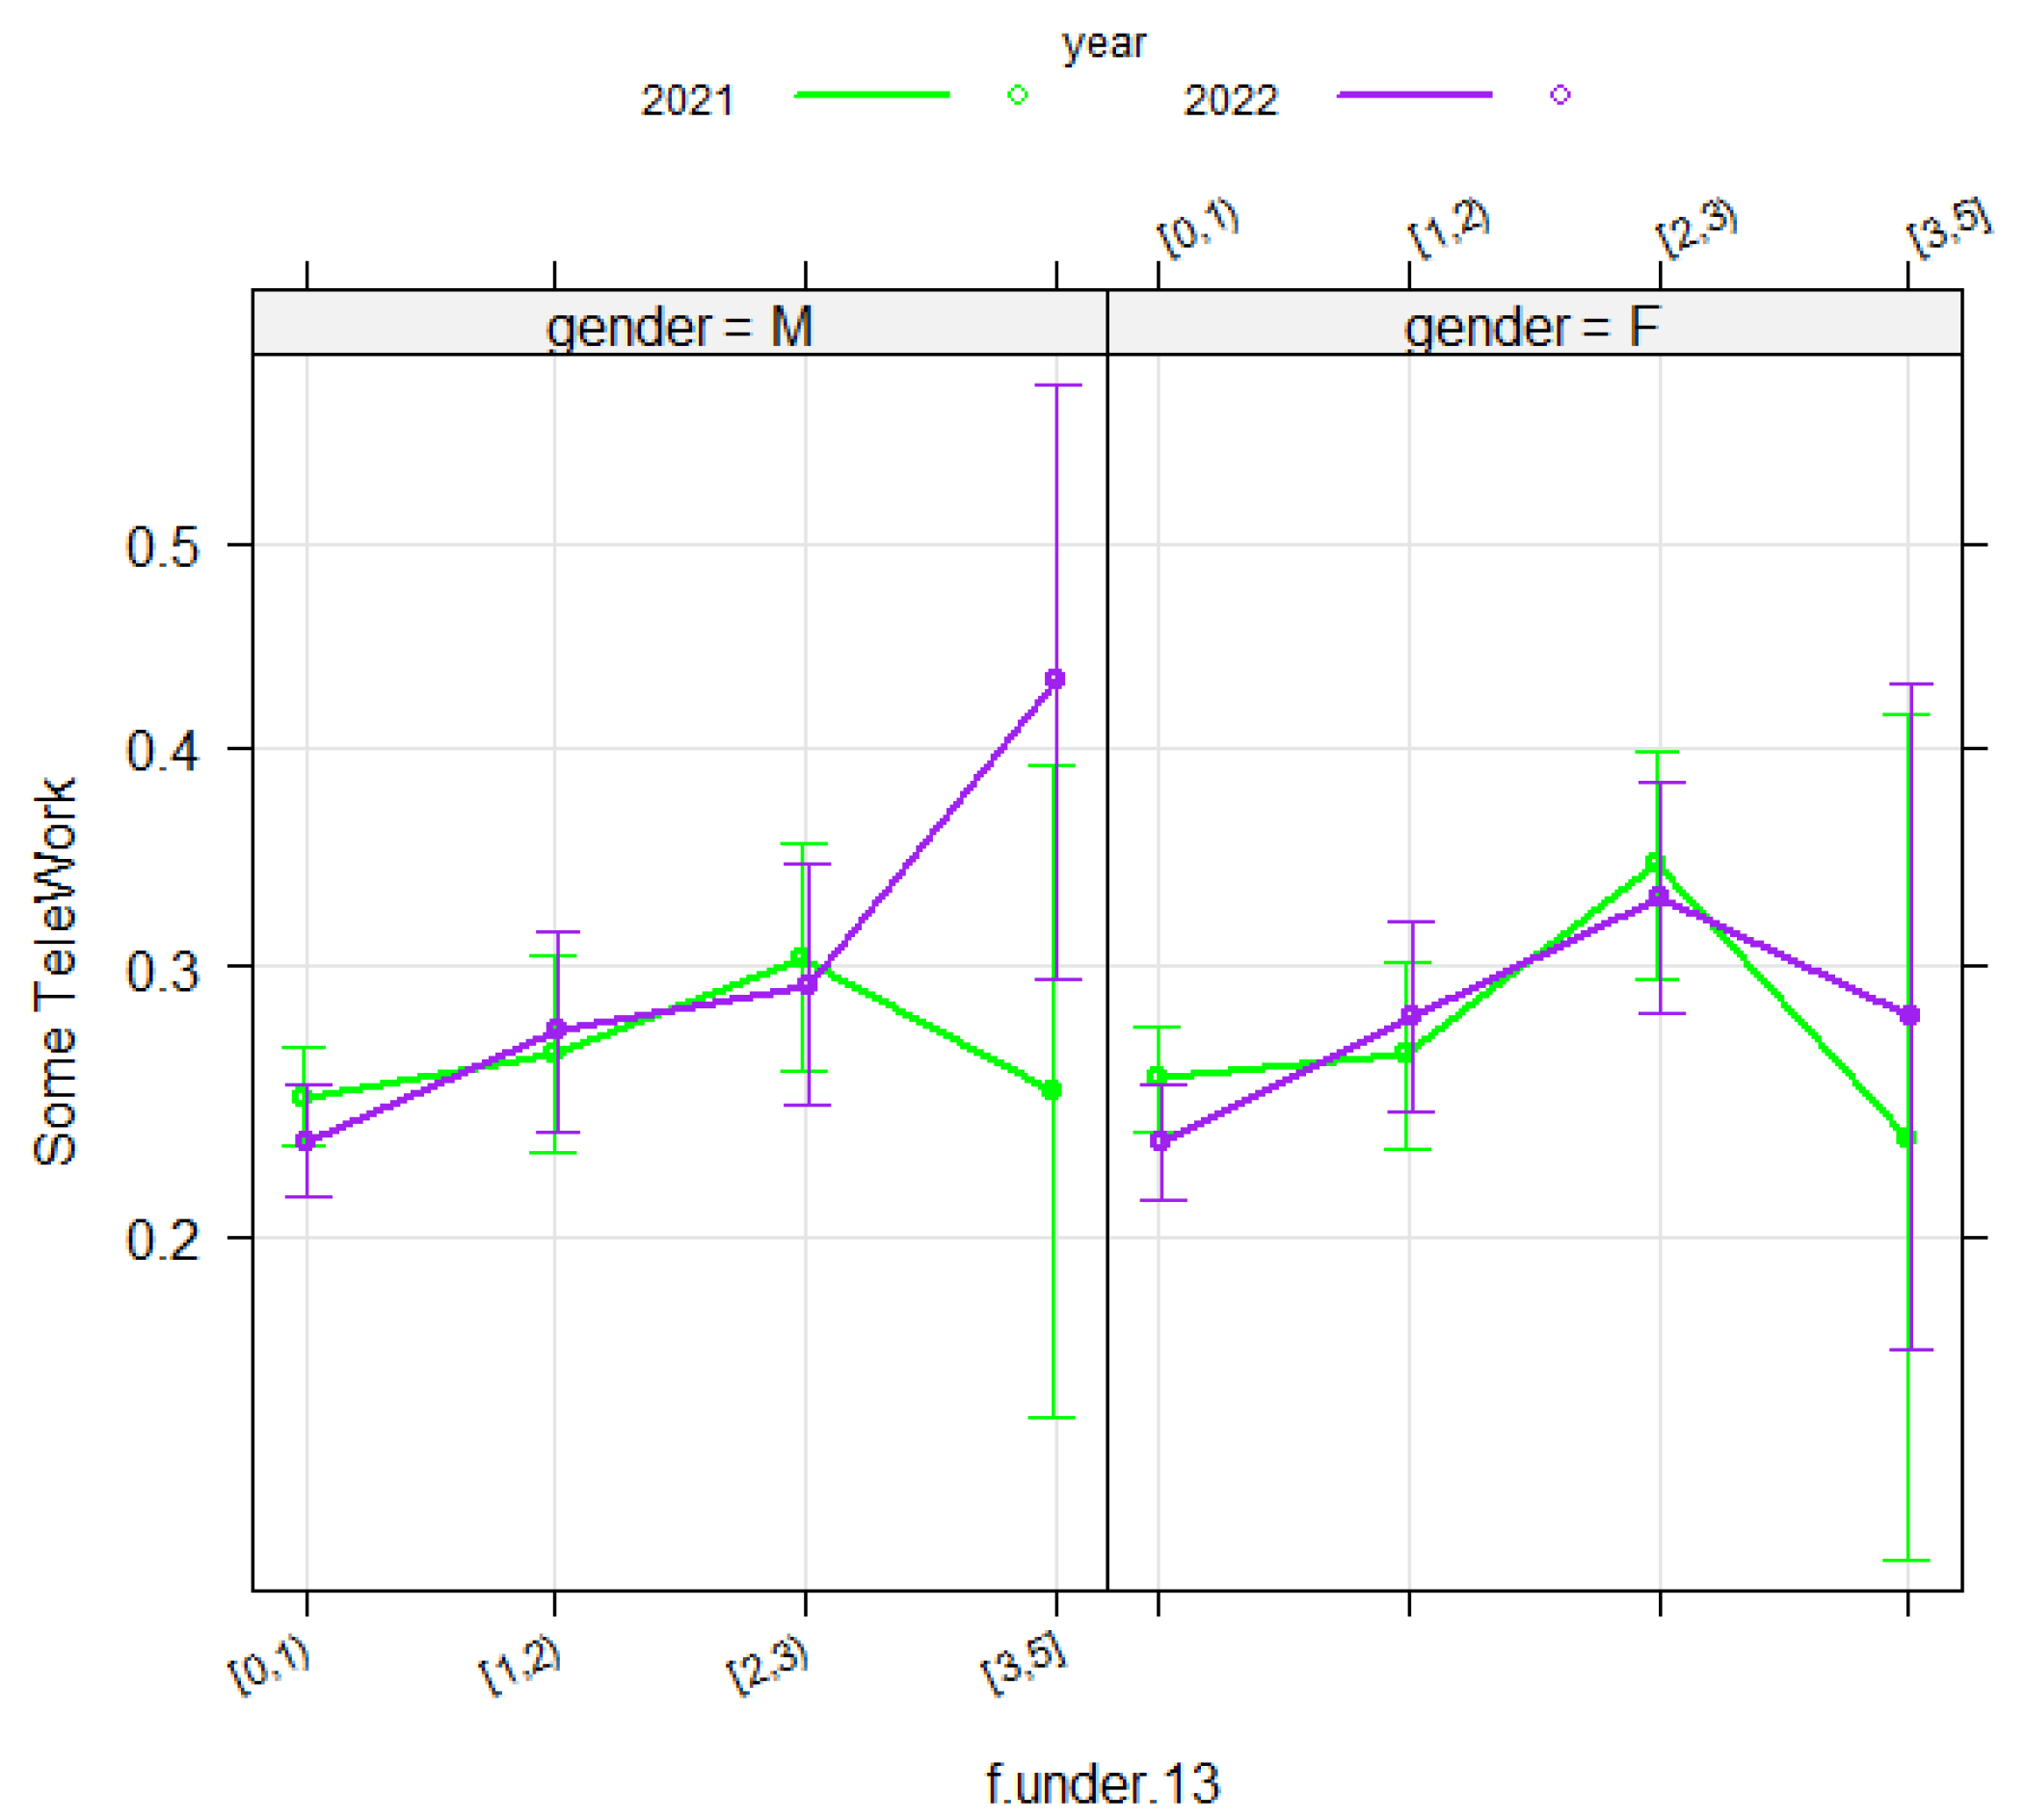
Figure 14.
Interaction terms for hybrid arrangements according to TAZ average income per macrozone (in thousand €) and education.
Figure 14.
Interaction terms for hybrid arrangements according to TAZ average income per macrozone (in thousand €) and education.
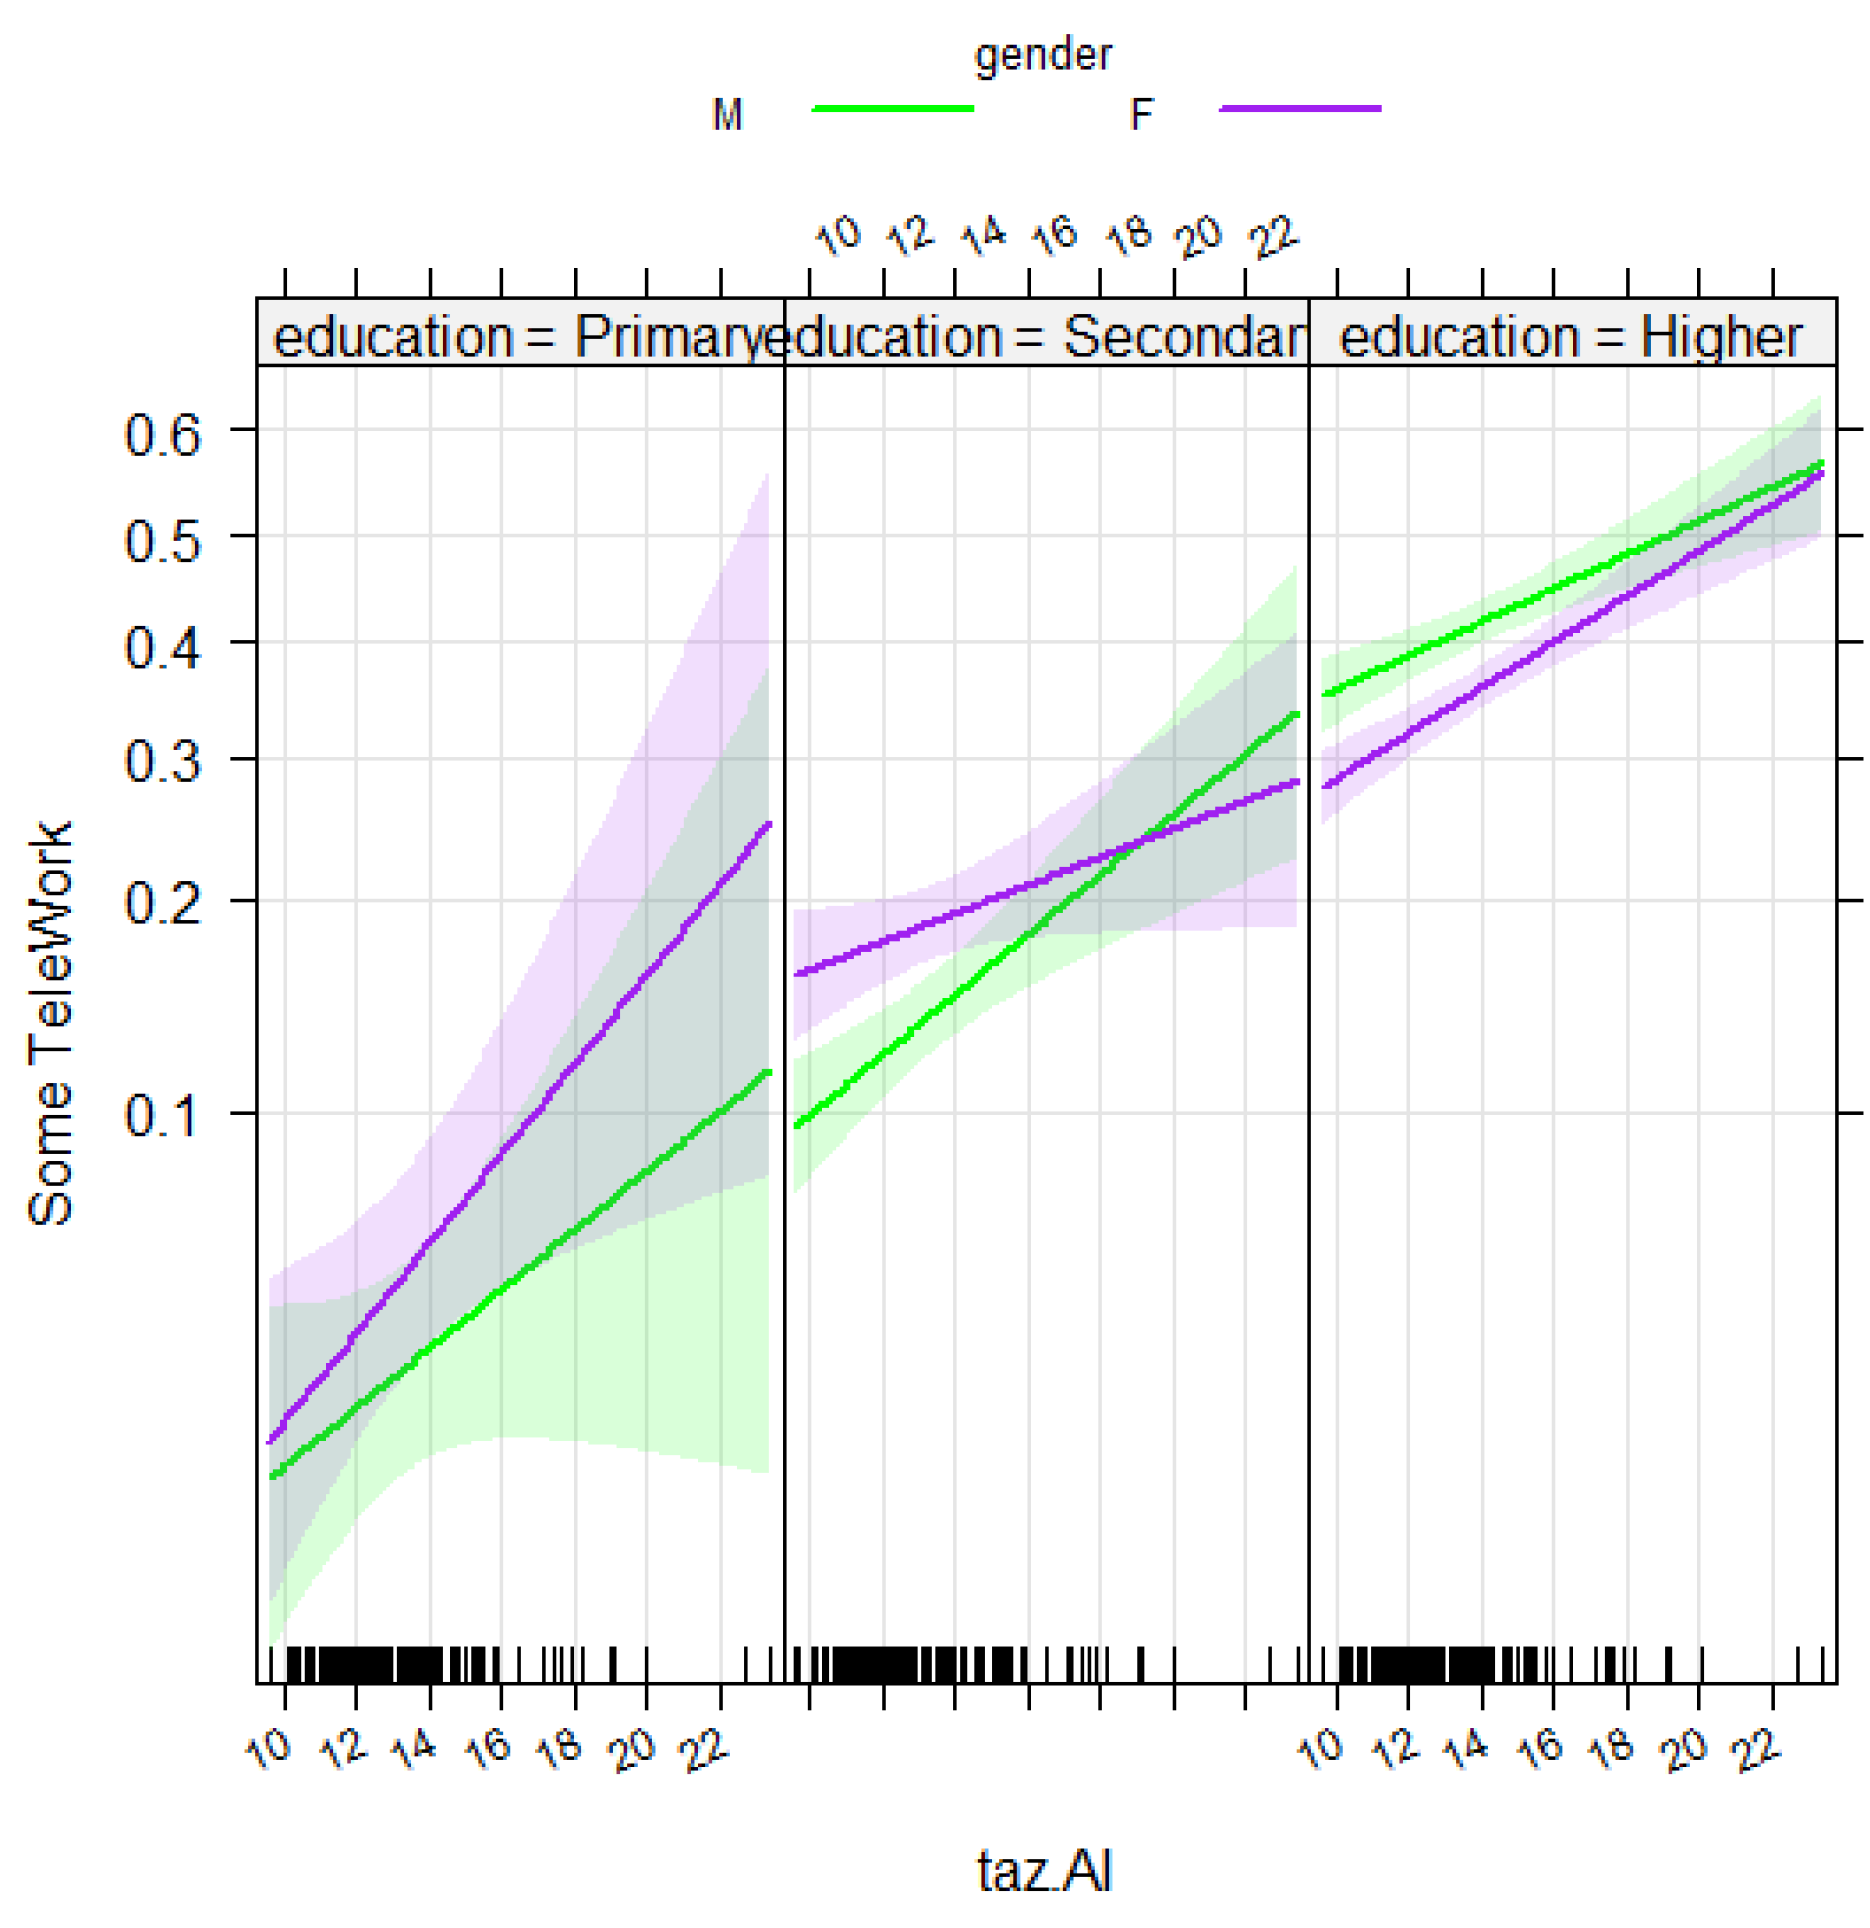

Table 1.
Sample and population size per year and mobility status (without multivariant outliers). Only representative municipalities are included.
Table 1.
Sample and population size per year and mobility status (without multivariant outliers). Only representative municipalities are included.
| Year | Sample Trip-makers |
Sample Non Trip-makers |
Sample size | Population Trip-makers | Population Non Trip-makers |
Population size |
|---|---|---|---|---|---|---|
| 2021 | 8544 | 999 | 9543 | 4,087,669 | 467,639 | 4,555,308 |
| 2022 | 8582 | 870 | 9452 | 4,147,998 | 404,595 | 4,552,593 |
| 17126 | 1869 | 18,995 | 8,235,667 | 872,234 | 9,107,901 |
Table 2.
Dataset of activities and transport modes per year by job type from 6:00 to 24:00.
| Activity /TrMode used | E | C | H | W | R | S | TC | TE | TK | TP | TW |
| job arrangements 2021 | |||||||||||
| Hybrid WfH | 0.86 | 1.38 | 69.75 | 16.15 | 4.48 | 1.2 | 2.91 | <0.01 | 0.2 | 1.33 | 1.73 |
| Always presence | 0.73 | 1.51 | 53.17 | 30.94 | 3.87 | 3.02 | 3.21 | <0.01 | 0.15 | 1.92 | 1.48 |
| Nonactive | 0.9 | 2.57 | 83.59 | 0.06 | 6.44 | 0.87 | 1.46 | <0.01 | 0.11 | 0.89 | 3.1 |
| job arrangements 2022 | |||||||||||
| Hybrid WfH | 1.19 | 1.5 | 60.61 | 22.5 | 5.82 | 0.37 | 3.75 | <0.01 | 0.17 | 2.15 | 1.94 |
| Always presence | 1.03 | 1.57 | 50.99 | 33.49 | 4.77 | 0.67 | 3.58 | <0.01 | 0.16 | 1.97 | 1.76 |
| Nonactive | 1.01 | 2.5 | 76.78 | 0.87 | 7.57 | 4.6 | 1.64 | 0.01 | 0.12 | 1.72 | 3.19 |
Table 3.
Sample mean and standard deviation for fragmentation indicators and year.
| year | entropy | turbulence | complexity | ttr |
|---|---|---|---|---|
| Mean | ||||
| 2021 | 0.560 | 9.675 | 0.027 | 0.587 |
| 2022 | 0.616 | 10.462 | 0.030 | 0.597 |
| Standard Deviation | ||||
| 2021 | 0.271 | 3.397 | 0.012 | 0.060 |
| 2022 | 0.281 | 3.637 | 0.012 | 0.063 |
Table 4.
Work arrangement distribution according to the RMB residence crown (EMEF 2021-22 subsample workers).
Table 4.
Work arrangement distribution according to the RMB residence crown (EMEF 2021-22 subsample workers).
| Crown | Always.F2F | Mostly F2F | SomeOnline | Both | MostlyOnline | All |
|---|---|---|---|---|---|---|
| BCN | 63.09% | 4.61% | 22.61% | 5.12% | 4.58% | 100 % |
| ETM | 74.50% | 3.21% | 15.03% | 3.91% | 3.36% | 100% |
| AMB | 72.96% | 4.01% | 16.58% | 3.53% | 2.92% | 100% |
| RMB | 74.36% | 3.37% | 15.06% | 3.83% | 3.37% | 100% |
Table 5.
WfH distribution according to EMEF 2021-2022 sample.
| AlwaysF2F | Hybrid | NonActive | n | |
|---|---|---|---|---|
| 2021 | 48.90% | 17.31% | 33.79% | 8,544 |
| 2022 | 44.55% | 15.03% | 40.31% | 8,582 |
Table 6.
Explanatory variables description (target WfH 2021-22).
| Variable | Description |
|---|---|
| education | Educational level into 4 groups – None – Primary – Secondary - Higher |
| dpmode | Daily principal mode obtained through the classification of the most relevant transport modes |
| cor.res | Residence crown, either BCN city, ETM (first crown), AMB (second crown) or RMB (rest) |
| PuTrTime | Whether individuals changed their public transport mobility habits to reduce travel time. Three levels: yes/no/don’t know (unknown) |
| PuTrMask | Whether individuals changed their public transport mobility habits due to wearing a face mask (which was mandatory in PuTr). Three levels: yes/no/don’t know (unknown) |
| age.segment | Age segment into 4 groups 16-29, 30-44, 45-64 and 65 or more |
| PuTrInfect | Whether individuals changed their public transport mobility habits due to fear of infection. Three levels: yes/no/don’t know (unknown) |
| PuTrDist | Whether individuals changed their public transport mobility habits due to maintain social distance. Three levels: yes/no/don’t know (unknown) |
| birth.region | Either Catalonia (Cat), the rest of Spain (Esp) or abroad (Other) |
| f.under.13 | Children under 13 years in the household, a categorical variable with 4 groups 0, 1, 2 or 3+ |
| taz.AI | TAZ residence average income, in thousands of euros,(numeric) |
| nr.trips | Number of trips per day (numeric) |
| fam.members | Number of family members (numeric variable) |
Table 7.
Independence test contingency table (target WfH 2021-22).
| 2021 | 2022 | |||||
|---|---|---|---|---|---|---|
| Variable | p-value | df | Variable | p-value | df | |
| education | 1.34E-127 | 3 | education | 1.63E-115 | 3 | |
| dpmode | 5.86E-40 | 6 | cor.res | 1.91E-23 | 4 | |
| cor.res | 7.48E-17 | 4 | dpmode | 2.75E-18 | 6 | |
| PuTrTime* | 2.93E-12 | 2 | age.segment | 1.12E-08 | 3 | |
| PuTrMask* | 9.08E-12 | 2 | f.under.13 | 6.12E-06 | 3 | |
| age.segment | 7.22E-11 | 3 | birth.region | 1.14E-02 | 2 | |
| PuTrInfect* | 1.48E-08 | 2 | PuTrMask* | 1.73E-02 | 2 | |
| PuTrDist* | 2.36E-08 | 2 | PuTrTime* | 2.41E-02 | 2 | |
| birth.region | 5.83E-04 | 2 | PuTrInfect* | 3.02E-02 | 2 | |
| f.under.13 | 3.64E-03 | 3 | PuTrDist* | 3.44E-02 | 2 | |
Table 8.
Always face-to-face Class working arrangements (2021).
| Target Class= Always Face-to-face – 2021 Modalities in explanatory factors by rows |
Class conditional to Modality percentage | Modality conditional to Class percentage | Global Modality percentage |
p-value |
|---|---|---|---|---|
| education=Primary | 9.52E+01 | 17.192 | 12.991 | 6.08E-64 |
| education=Secondary | 8.35E+01 | 39.776 | 34.254 | 1.22E-45 |
| dpmode2122=Bus and Metro | 7.66E+01 | 45.930 | 43.129 | 1.68E-11 |
| PuTrInfect=Unknown | 7.30E+01 | 93.362 | 91.986 | 6.32E-09 |
| PuTrTime=Unknown | 7.30E+01 | 93.285 | 91.948 | 1.76E-08 |
| PuTrDist=Unknown | 7.30E+01 | 93.311 | 91.985 | 2.16E-08 |
| PuTrMask=Unknown | 7.30E+01 | 93.311 | 91.985 | 2.16E-08 |
| cor.res=Other | 7.87E+01 | 20.600 | 18.828 | 4.39E-08 |
| dpmode2122=Other | 7.98E+01 | 12.563 | 11.326 | 2.07E-06 |
| age.segment=16-29 | 7.87E+01 | 15.412 | 14.089 | 4.28E-06 |
| education=None | 100 | 0.7126 | 0.512 | 9.66E-05 |
| birth.region=other | 76.604 | 18.819 | 17.676 | 3.24E-04 |
| age.segment=45-64 | 74.434 | 44.354 | 42.872 | 3.85E-04 |
| f.under.13=[0,1) | 72.878 | 67.929 | 67.063 | 2.95E-02 |
| activity=Unemployed | 85.365 | 0.890 | 0.750 | 4.80E-02 |
Table 9.
hybrid WfH arrangements 2021.
| Target Class= Hybrid WfH jobs – 2021 Modalities in explanatory factors by rows |
Class conditional to Modality percentage | Modality conditional to Class percentage | Global Modality percentage |
p-value |
|---|---|---|---|---|
| education=Higher | 4.17E+01 | 77.690 | 52.241 | 5.22E-128 |
| dpmode=None | 5.54E+01 | 12.654 | 6.404 | 1.02E-28 |
| cor.res=BCN | 3.77E+01 | 29.549 | 22.012 | 1.95E-16 |
| PuTrMask=No | 4.61E+01 | 8.936 | 5.434 | 9.65E-12 |
| PuTrTime=No | 5.02E+01 | 6.588 | 3.677 | 1.36E-11 |
| age.segment=30-44 | 3.28E+01 | 48.401 | 41.427 | 7.55E-11 |
| PuTrInfect=No | 4.03E+01 | 8.088 | 5.635 | 2.07E-06 |
| PuTrDist=No | 43.076 | 5.4792 | 3.568 | 5.01E-06 |
| dpmode2122=Train | 32.828 | 29.680 | 25.361 | 5.75E-06 |
| f.under.13=[2,3) | 33.913 | 15.264 | 12.625 | 3.08E-04 |
| PuTrDist=Yes | 37.448 | 5.936 | 4.446 | 1.17E-03 |
| PuTrInfect=Yes | 40.769 | 3.4573 | 2.378 | 1.64E-03 |
| birth.region=Esp | 31.792 | 11.219 | 9.899 | 4.33E-02 |
| dpmode=eScooter | 33.220 | 6.392 | 5.397 | 4.51E-02 |
Table 10.
Always face-to-face in 2022.
| Target Class= Always Face-to-face – 2022 Modalities in explanatory factors by rows |
Class conditional to Modality percentage | Modality conditional to Class percentage | Global Modality percentage |
p-value |
|---|---|---|---|---|
| education=Primary | 9.66E+01 | 17.969 | 13.67742 | 3.72E-71 |
| education=Secondary | 8.70E+01 | 29.849 | 25.23502 | 7.30E-43 |
| cor.res=Other | 8.14E+01 | 20.175 | 18.23041 | 2.00E-10 |
| dpmode=Bus and Metro | 7.75E+01 | 42.330 | 40.1659 | 4.91E-08 |
| age.segment=16-29 | 8.12E+01 | 15.137 | 13.71429 | 1.71E-07 |
| f.under.13=[0,1) | 7.55E+01 | 68.220 | 66.451 | 4.90E-06 |
| birth.region=other | 7.73E+01 | 18.997 | 18.064 | 2.61E-03 |
| cor.res=RMB | 7.63E+01 | 30.125 | 29.032 | 2.93E-03 |
| PuTrTime=Unknown | 7.40E+01 | 94.360 | 93.843 | 9.51E-03 |
| PuTrInfect=Unknown | 7.40E+01 | 94.360 | 93.843 | 9.51E-03 |
| dpmode=Other | 76.785 | 16.165 | 15.483 | 1.96E-02 |
| PuTrDist=Unknown | 73.901 | 94.385 | 93.935 | 2.27E-02 |
| PuTrMask=Unknown | 73.880 | 94.285 | 93.861 | 3.27E-02 |
Table 11.
Hybrid arrangements (2022).
| Target Class= Hybrid WfH jobs – 2022 Modalities in explanatory factors by rows |
Class conditional to Modality percentage | Modality conditional to Class percentage | Global Modality percentage |
p-value |
|---|---|---|---|---|
| education=Higher | 3.74E+01 | 85.365 | 60.350 | 2.36E-124 |
| cor.res=BCN | 3.70E+01 | 31.916 | 22.838 | 1.12E-20 |
| dpmode=None | 4.65E+01 | 10.104 | 5.751 | 5.28E-15 |
| age.segment=30-44 | 3.02E+01 | 46.341 | 40.553 | 2.15E-07 |
| f.under.13=[2,3) | 3.23E+01 | 14.982 | 12.276 | 3.46E-04 |
| PuTrMask=No | 3.47E+01 | 5.365 | 4.092 | 5.68E-03 |
| birth.region=Cat | 2.74E+01 | 75.749 | 73.253 | 1.23E-02 |
| PuTrDist=No | 3.44E+01 | 4.459 | 3.428 | 1.47E-02 |
| f.under.13=(3,5] | 3.78E+01 | 2.369 | 1.658 | 1.79E-02 |
| dpmode=Train | 2.96E+01 | 17.979 | 16.055 | 2.18E-02 |
| PuTrTime=No | 34.437 | 3.623 | 2.783 | 2.78E-02 |
| PuTrInfect=No | 32.530 | 5.644 | 4.589 | 2.89E-02 |
Table 12.
Fragmentation indicators for the category presence jobs and other characteristics. Overall indicates the whole sample (any work arrangement).
Table 12.
Fragmentation indicators for the category presence jobs and other characteristics. Overall indicates the whole sample (any work arrangement).
| Variable | Mean in category |
Overall mean |
Standard deviation in category |
Overall standard deviation |
p-value |
|---|---|---|---|---|---|
| ttr | 0.6178 | 0.6081 | 0.0574 | 0.0627 | 1.16E-160 |
| entropy | 0.6860 | 0.6415 | 0.2594 | 0.2933 | 8.17E-155 |
| complexity | 0.0312 | 0.0296 | 0.0128 | 0.0137 | 8.96E-94 |
| turbulence | 10.0882 | 9.8012 | 3.92518 | 4.0797 | 9.63E-35 |
| nr.trips | 3.9479 | 3.8385 | 2.2041 | 2.2369 | 1.20E-17 |
| fam.members | 3.1964 | 3.1585 | 1.2024 | 1.1922 | 2.62E-08 |
Table 13.
Face to Face against hybrid arrangements per year.
| Year | AlwaysF2F | Hybrid WfH | Sample size |
|---|---|---|---|
| 2021 | 4336 | 1707 | 6043 |
| 2022 | 3957 | 1428 | 5385 |
| 8293 | 3135 | 11428 |
Table 14.
Analysis of deviance (Type II – Errors): net-effect test of terms based on log-likelihood ratio test in RStudio [62].
Table 14.
Analysis of deviance (Type II – Errors): net-effect test of terms based on log-likelihood ratio test in RStudio [62].
| Response: btelework2122 | ||||
|---|---|---|---|---|
| Type II tests | LR Chisq | Df | Pr(>Chisq) | Signif. |
| f.under.13 | 8.44 | 3 | 0.0377153 | * |
| taz.AI | 88.61 | 1 | < 2.2e-16 | *** |
| year | 12.5 | 1 | 0.0004065 | *** |
| gender | 2.42 | 1 | 1.20E-01 | |
| age.segment | 23.72 | 3 | 2.86E-05 | *** |
| education | 764.5 | 2 | < 2.2e-16 | *** |
| birth.region | 6.52 | 2 | 3.84E-02 | * |
| gender:education | 31.28 | 2 | 1.61E-07 | *** |
| education:birth.region | 62.53 | 4 | 8.50E-13 | *** |
| Significance codes: 0 ‘***’ 0.001 ‘**’ 0.01 ‘*’ 0.05 ‘.’ 0.1 ‘ ’ 1 | ||||
Table 15.
GLM active people with presence jobs or hybrid job arrangements in 2021 and 2022. People stating that they did not go through formal education were removed from the data.
Table 15.
GLM active people with presence jobs or hybrid job arrangements in 2021 and 2022. People stating that they did not go through formal education were removed from the data.
| btelework 2122 | |||
|---|---|---|---|
| Predictors | Odds Ratios | CI | pvalue |
| (Intercept) | 0.01 | 0.01 – 0.02 | <0.001 |
| f under 13 [1-2) | 1.12 | 0.98 – 1.28 | 0.094 |
| f under 13 [2-3) | 1.23 | 1.05 – 1.44 | 0.011 |
| f under 13 [3,5] | 0.88 | 0.59 – 1.32 | 0.548 |
| taz.AI | 1.08 | 1.07 – 1.10 | <0.001 |
| year [2022] | 0.83 | 0.75 – 0.92 | <0.001 |
| gender [F] | 1.42 | 0.81 – 2.49 | 0.217 |
| age.segment30-44 | 1.46 | 1.25 – 1.72 | <0.001 |
| age.segment45-64 | 1.27 | 1.09 – 1.48 | 0.002 |
| age segment [65+] | 1.54 | 1.04 – 2.25 | 0.03 |
| education [Secondary] | 4.28 | 2.76 – 6.93 | <0.001 |
| education [Higher] | 14.6 | 9.61 – 23.25 | <0.001 |
| birth region [Esp] | 0.46 | 0.14 – 1.16 | 0.141 |
| birth region [other] | 1.14 | 0.56 – 2.17 | 0.708 |
| gender [F] × education [Secondary] | 1.06 | 0.58 – 1.92 | 0.855 |
| gender [F] × education [Higher] | 0.55 | 0.31 – 0.97 | 0.039 |
| education [Secondary] × birth region [Esp] | 2.35 | 0.86 – 8.27 | 0.129 |
| education [Higher] × birth region [Esp] | 2.51 | 0.97 – 8.60 | 0.09 |
| education [Secondary] × birth region [other] | 0.29 | 0.14 – 0.62 | 0.001 |
| education [Higher] × birth region [other] | 1.03 | 0.53 – 2.15 | 0.929 |
| Observations | 8844 | ||
| R2 McFadden | 0.1135 | ||
| BIC | 9205.456 | ||
Disclaimer/Publisher’s Note: The statements, opinions and data contained in all publications are solely those of the individual author(s) and contributor(s) and not of MDPI and/or the editor(s). MDPI and/or the editor(s) disclaim responsibility for any injury to people or property resulting from any ideas, methods, instructions or products referred to in the content. |
© 2024 by the authors. Licensee MDPI, Basel, Switzerland. This article is an open access article distributed under the terms and conditions of the Creative Commons Attribution (CC BY) license (http://creativecommons.org/licenses/by/4.0/).
Copyright: This open access article is published under a Creative Commons CC BY 4.0 license, which permit the free download, distribution, and reuse, provided that the author and preprint are cited in any reuse.


