
Submitted:
06 November 2024
Posted:
07 November 2024
You are already at the latest version
Abstract
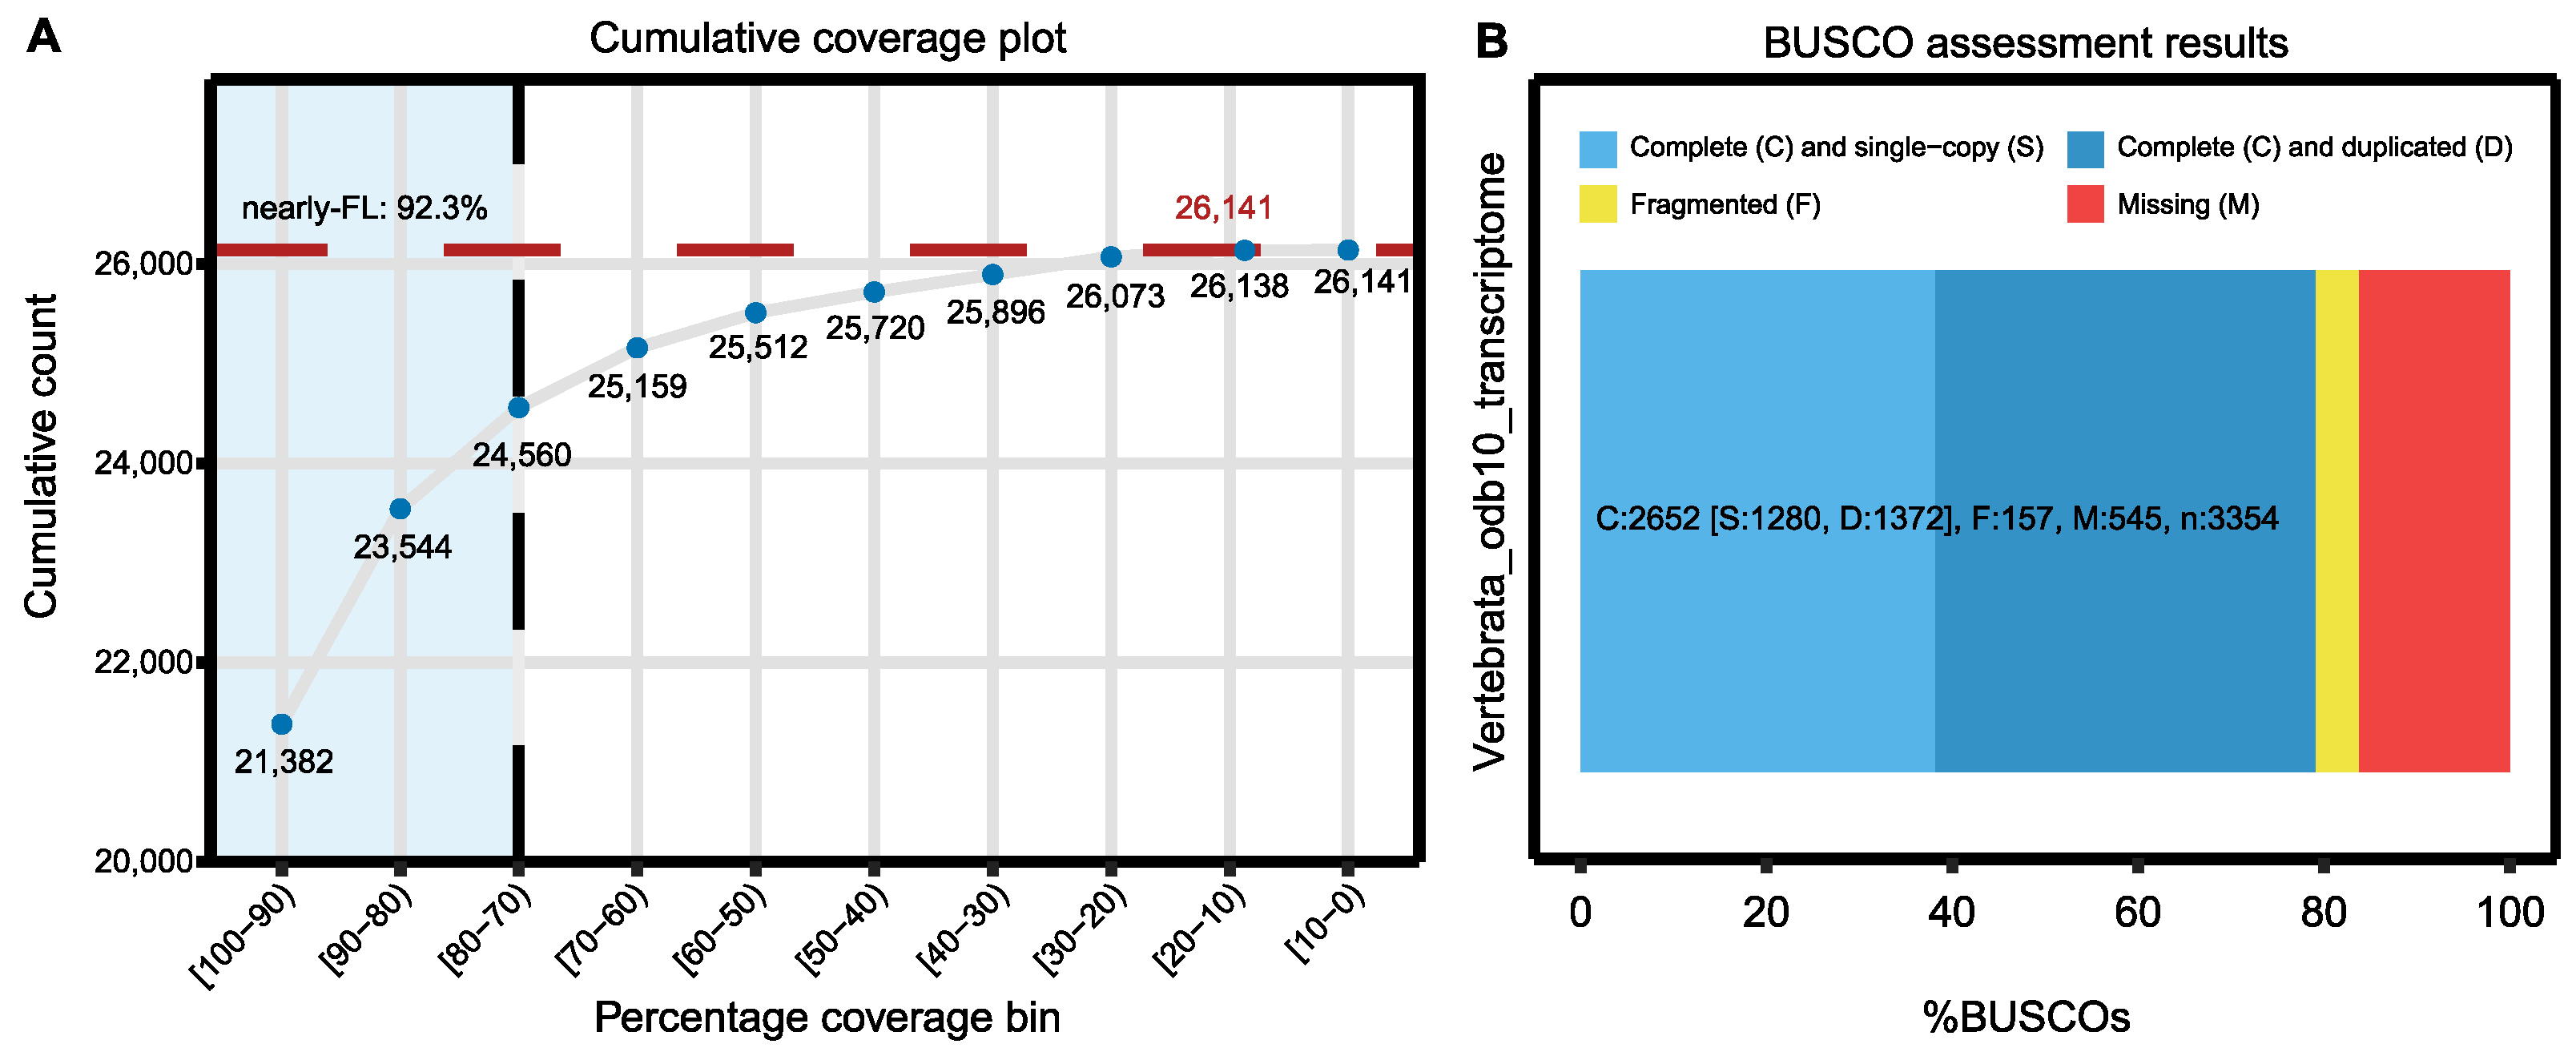
Transcriptome assembly and functional annotation are essential for understanding gene expression and biological function. Nevertheless, many existing tools lack the flexibility to integrate both short- and long-read sequencing data or fail to provide a complete, customizable workflow for transcriptome analysis. Here, we present TrAnnoScope, a comprehensive transcriptome analysis pipeline that provides a complete, customizable workflow capable of efficiently processing and integrating short- and long-read sequencing data to generate high-quality, full-length transcripts with detailed functional annotation. The pipeline encompasses steps from quality control to functional annotation, employing a range of tools and established databases, such as SwissProt, Pfam, Gene Ontology (GO), and Kyoto Encyclopedia of Genes and Genomes. As a case study, TrAnnoScope was applied to RNA-Seq data from zebra finch brain, ovary, and testis tissues. TrAnnoScope produced comprehensive transcriptome, demonstrating strong alignment with the reference genome (99.63%) and capturing a significant proportion of nearly complete protein sequences (92.7%). The functional annotation process yielded extensive matches to known protein databases and successfully assigned relevant functional terms to majority of the transcripts. As such, TrAnnoScope successfully integrates multiple sequencing technologies to generate comprehensive transcriptomes with minimal user input. Its modular design, flexibility, and ease of use make it a valuable tool for researchers working with complex datasets, particularly for non-model organisms.
Keywords:
1. Introduction
2. Materials and Methods
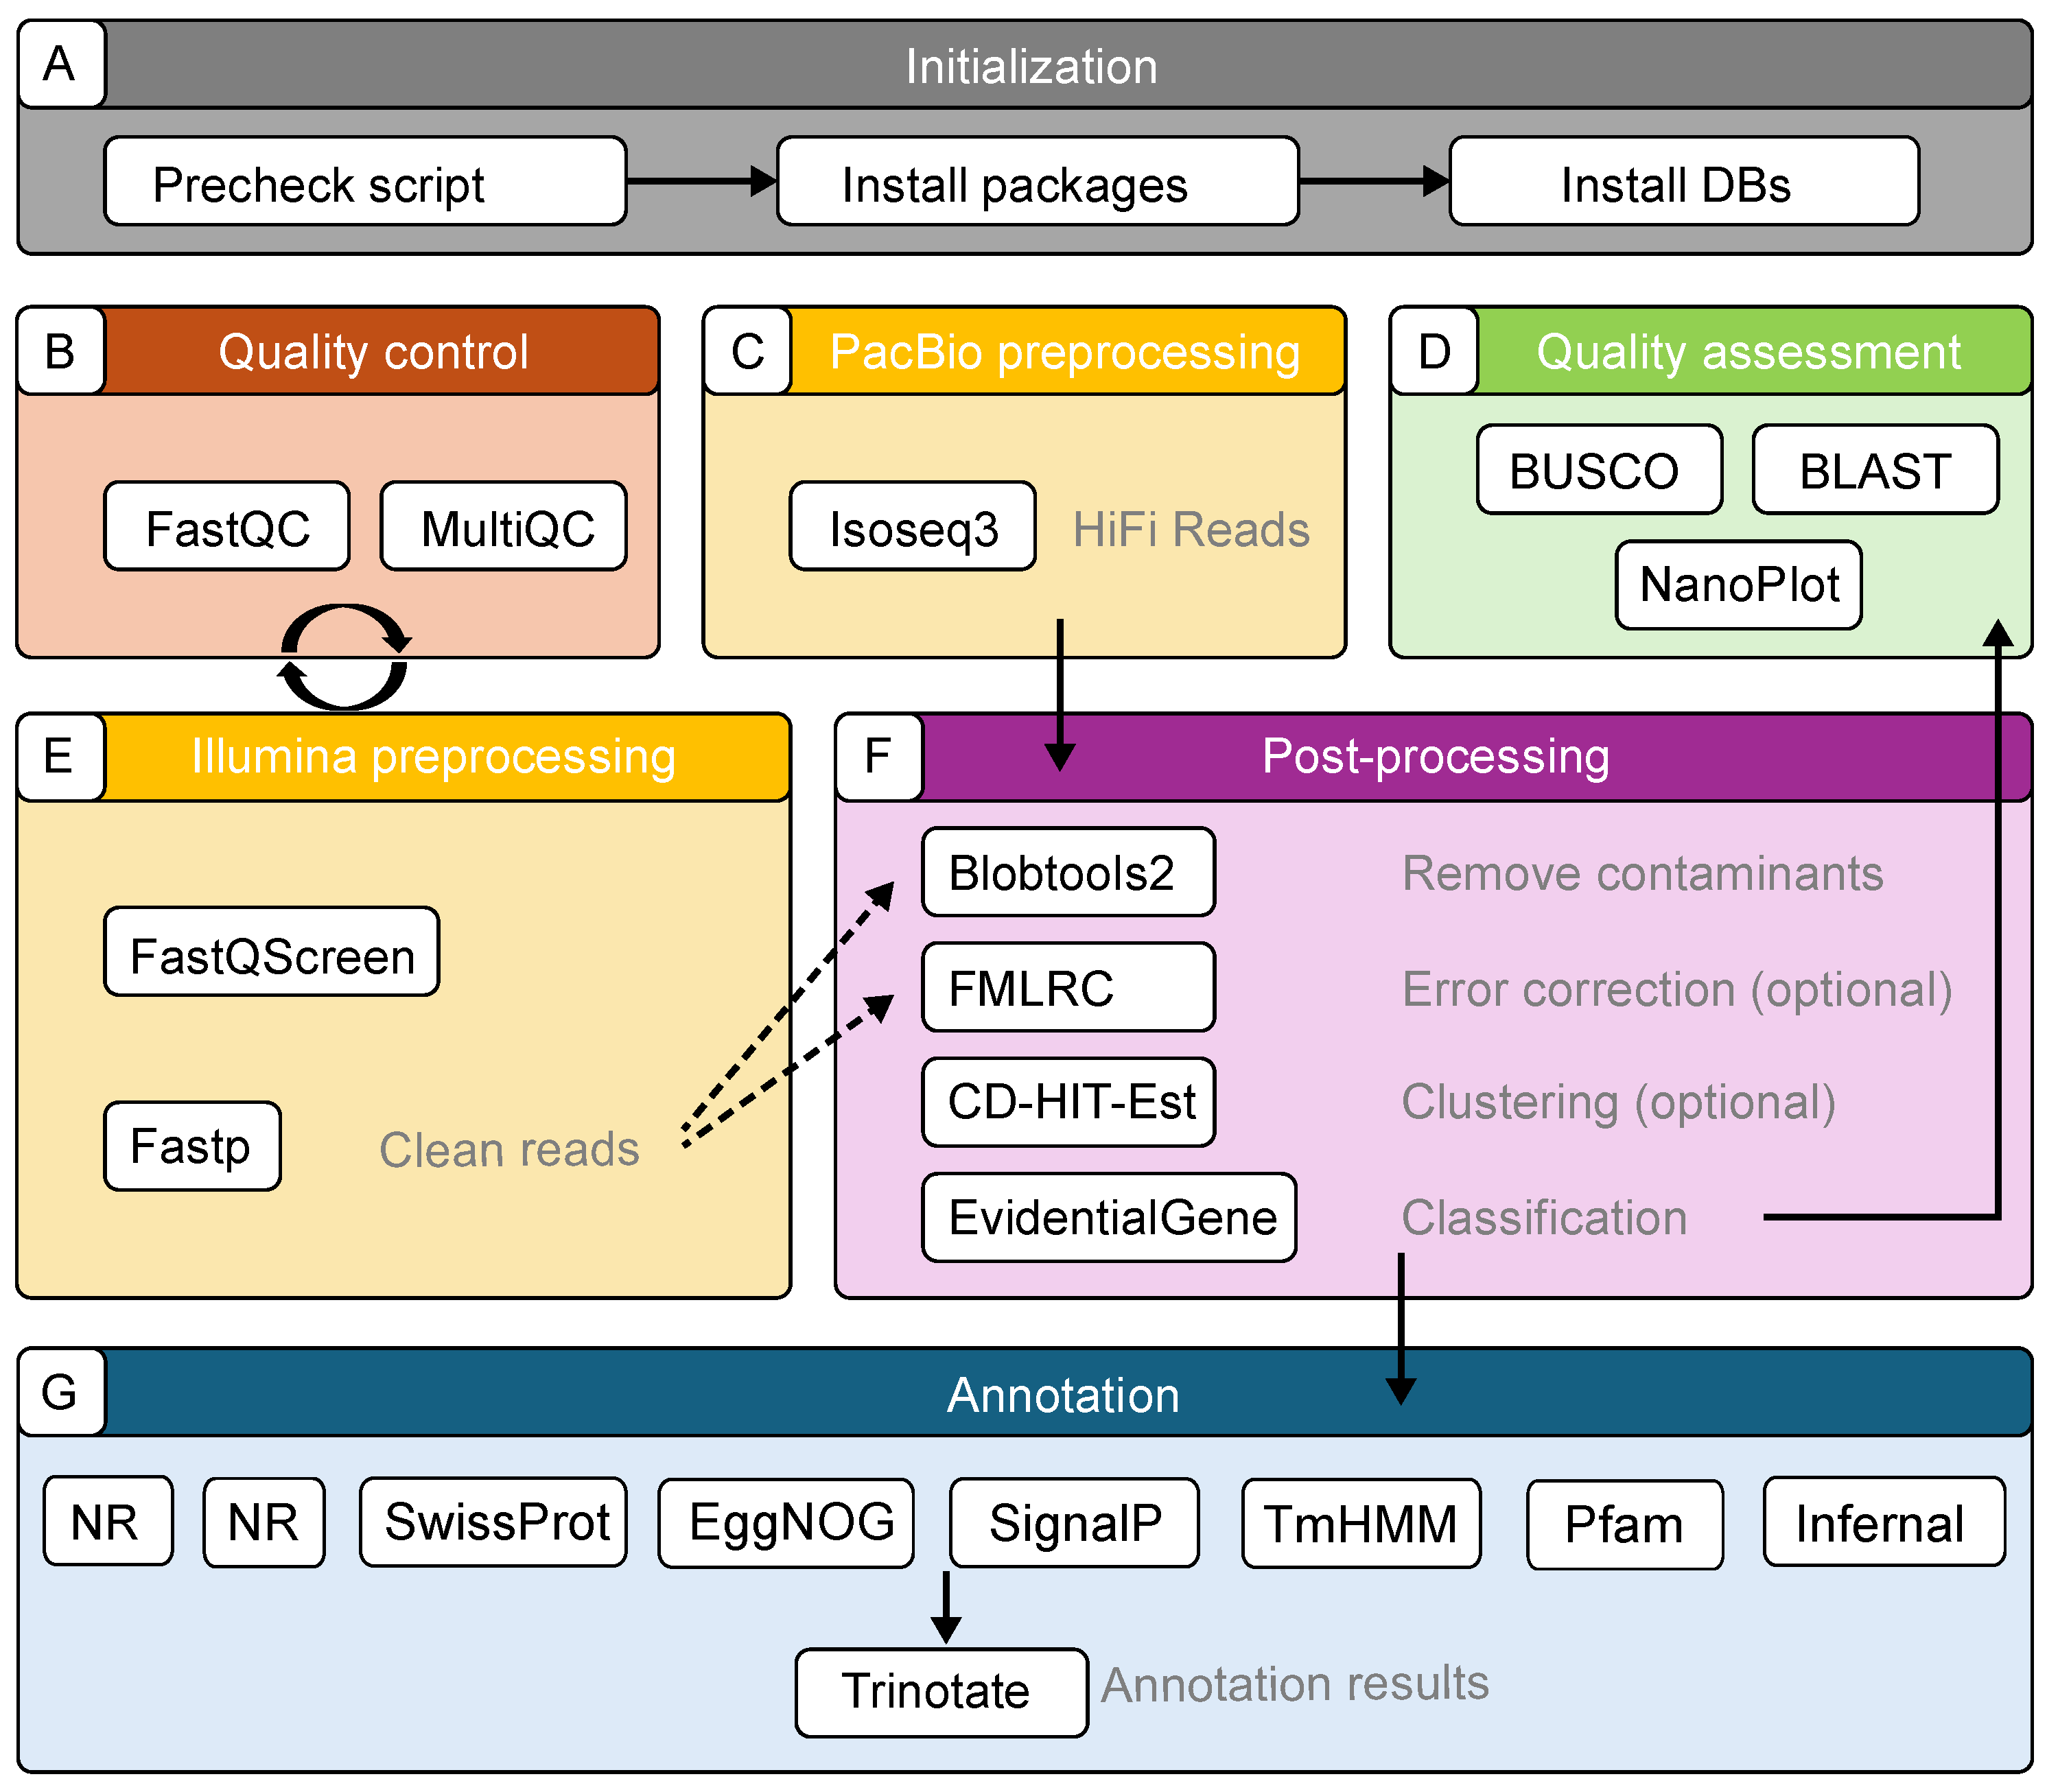
2.1. Components of the TrAnnoScope Pipeline
2.2. Pipeline Implementation
2.2.1. Quality and Preprocessing for Illumina Reads
2.2.2. Preprocessing of PacBio Reads
2.2.3. Contamination Removal
2.2.4. Error Correction
2.2.5. Clustering and Classification
2.2.6. Quality Assessment
2.2.7. Annotation
2.2.8. Data Selection
2.2.9. Mapping to the Zebra Finch Reference Genome
3. Results and Discussion
4. Conclusions
Supplementary Materials
Author Contributions
Funding
Data Availability Statement
Acknowledgments
Conflicts of Interest
References
- Chen, J.W.; Shrestha, L.; Green, G.; Leier, A.; Marquez-Lago, T.T. The hitchhikers’ guide to RNA sequencing and functional analysis. Brief. Bioinform. 2023, 24, bbac529. [Google Scholar] [CrossRef] [PubMed]
- Deshpande, D.; Chhugani, K.; Chang, Y.; Karlsberg, A.; Loeffler, C.; Zhang, J.; Muszynska, A.; Munteanu, V.; Yang, H.; Rotman, J.; et al. RNA-seq data science: From raw data to effective interpretation. Front. Genet. 2023, 14, 997383. [Google Scholar] [CrossRef] [PubMed]
- Raghavan, V.; Kraft, L.; Mesny, F.; Rigerte, L. A simple guide to de novo transcriptome assembly and annotation. Brief. Bioinform. 2022, 23, bbab563. [Google Scholar] [CrossRef] [PubMed]
- Esteve-Codina, A. RNA-Seq Data Analysis, Applications and Challenges. In Comprehensive Analytical Chemistry; Jaumot, J., Bedia, C., Tauler, R., Eds.; Elsevier: Amsterdam, The Netherlands, 2018; Volume 82, pp. 71–106. [Google Scholar]
- Garg, R.; Jain, M. RNA-Seq for transcriptome analysis in non-model plants. Methods Mol. Biol. 2013, 1069, 43–58. [Google Scholar] [CrossRef] [PubMed]
- Lataretu, M.; Holzer, M. RNAflow: An Effective and Simple RNA-Seq Differential Gene Expression Pipeline Using Nextflow. Genes 2020, 11, 1487. [Google Scholar] [CrossRef]
- Zhang, X.; Jonassen, I. RASflow: An RNA-Seq analysis workflow with Snakemake. BMC Bioinform. 2020, 21, 110. [Google Scholar] [CrossRef]
- Fallon, T.R.; Calounova, T.; Mokrejs, M.; Weng, J.K.; Pluskal, T. transXpress: A Snakemake pipeline for streamlined de novo transcriptome assembly and annotation. BMC Bioinform. 2023, 24, 133. [Google Scholar] [CrossRef]
- Rivera-Vicens, R.E.; Garcia-Escudero, C.A.; Conci, N.; Eitel, M.; Worheide, G. TransPi-a comprehensive TRanscriptome ANalysiS PIpeline for de novo transcriptome assembly. Mol. Ecol. Resour. 2022, 22, 2070–2086. [Google Scholar] [CrossRef]
- Ortiz, R.; Gera, P.; Rivera, C.; Santos, J.C. Pincho: A Modular Approach to High Quality De Novo Transcriptomics. Genes 2021, 12, 953. [Google Scholar] [CrossRef]
- FIT: Functional IsoTranscriptomics Analyses. Available online: https://tappas.org/ (accessed on 11 September 2024).
- Lienhard, M.; van den Beucken, T.; Timmermann, B.; Hochradel, M.; Borno, S.; Caiment, F.; Vingron, M.; Herwig, R. IsoTools: A flexible workflow for long-read transcriptome sequencing analysis. Bioinformatics 2023, 39, btad364. [Google Scholar] [CrossRef]
- Xia, Y.; Jin, Z.; Zhang, C.; Ouyang, L.; Dong, Y.; Li, J.; Guo, L.; Jing, B.; Shi, Y.; Miao, S.; et al. TAGET: A toolkit for analyzing full-length transcripts from long-read sequencing. Nat. Commun. 2023, 14, 5935. [Google Scholar] [CrossRef] [PubMed]
- Guizard, S.; Miedzinska, K.; Smith, J.; Smith, J.; Kuo, R.I.; Davey, M.; Archibald, A.; Watson, M. nf-core/isoseq: Simple gene and isoform annotation with PacBio Iso-Seq long-read sequencing. Bioinformatics 2023, 39, btad150. [Google Scholar] [CrossRef] [PubMed]
- Kasianova, A.M.; Penin, A.A.; Schelkunov, M.I.; Kasianov, A.S.; Logacheva, M.D.; Klepikova, A.V. Trans2express—De novo transcriptome assembly pipeline optimized for gene expression analysis. Plant Methods 2024, 20, 128. [Google Scholar] [CrossRef] [PubMed]
- Zhang, W.; Petegrosso, R.; Chang, J.W.; Sun, J.; Yong, J.; Chien, J.; Kuang, R. A large-scale comparative study of isoform expressions measured on four platforms. BMC Genom. 2020, 21, 272. [Google Scholar] [CrossRef]
- Molder, F.; Jablonski, K.P.; Letcher, B.; Hall, M.B.; Tomkins-Tinch, C.H.; Sochat, V.; Forster, J.; Lee, S.; Twardziok, S.O.; Kanitz, A.; et al. Sustainable data analysis with Snakemake. F1000Research 2021, 10, 33. [Google Scholar] [CrossRef]
- Babraham Bioinformatics. FastQC. Available online: https://www.bioinformatics.babraham.ac.uk/projects/fastqc (accessed on 8 August 2024).
- Ewels, P.; Magnusson, M.; Lundin, S.; Kaller, M. MultiQC: Summarize analysis results for multiple tools and samples in a single report. Bioinformatics 2016, 32, 3047–3048. [Google Scholar] [CrossRef]
- Wingett, S.W.; Andrews, S. FastQ Screen: A tool for multi-genome mapping and quality control. F1000Res 2018, 7, 1338. [Google Scholar] [CrossRef]
- Chen, S.; Zhou, Y.; Chen, Y.; Gu, J. fastp: An ultra-fast all-in-one FASTQ preprocessor. Bioinformatics 2018, 34, i884–i890. [Google Scholar] [CrossRef]
- Pacific Biosciences. Iso-Seq—Scalable De Novo Isoform Discovery from Pacbio HiFi Reads. Available online: https://isoseq.how/ (accessed on 8 August 2024).
- Mortezaei, Z. Computational methods for analyzing RNA-sequencing contaminated samples and its impact on cancer genome studies. Inform. Med. Unlocked 2022, 32, 101054. [Google Scholar]
- Gondane, A.; Itkonen, H.M. Revealing the History and Mystery of RNA-Seq. Curr. Issues Mol. Biol. 2023, 45, 1860–1874. [Google Scholar] [CrossRef]
- Laetsch, D.R.; Blaxter, M.L. BlobTools: Interrogation of genome assemblies. F1000Research 2017, 6, 1287. [Google Scholar] [CrossRef]
- Langmead, B.; Salzberg, S.L. Fast gapped-read alignment with Bowtie 2. Nat. Methods 2012, 9, 357–359. [Google Scholar] [CrossRef] [PubMed]
- Manni, M.; Berkeley, M.R.; Seppey, M.; Zdobnov, E.M. BUSCO: Assessing Genomic Data Quality and Beyond. Curr. Protoc. 2021, 1, e323. [Google Scholar] [CrossRef] [PubMed]
- Camacho, C.; Coulouris, G.; Avagyan, V.; Ma, N.; Papadopoulos, J.; Bealer, K.; Madden, T.L. BLAST+: Architecture and applications. BMC Bioinform. 2009, 10, 421. [Google Scholar] [CrossRef]
- Fu, S.; Wang, A.; Au, K.F. A comparative evaluation of hybrid error correction methods for error-prone long reads. Genome Biol. 2019, 20, 26. [Google Scholar] [CrossRef]
- Wang, J.R.; Holt, J.; McMillan, L.; Jones, C.D. FMLRC: Hybrid long read error correction using an FM-index. BMC Bioinform. 2018, 19, 50. [Google Scholar] [CrossRef]
- Li, W.; Godzik, A. Cd-hit: A fast program for clustering and comparing large sets of protein or nucleotide sequences. Bioinformatics 2006, 22, 1658–1659. [Google Scholar] [CrossRef]
- Gilbert, D. EvidentialGene: tr2aacds, mRNA Transcript Assembly Software. Available online: http://arthropods.eugenes.org/EvidentialGene/about/EvidentialGene_trassembly_pipe.html (accessed on 29 Oct 2024).
- De Coster, W.; D’Hert, S.; Schultz, D.T.; Cruts, M.; Van Broeckhoven, C. NanoPack: Visualizing and processing long-read sequencing data. Bioinformatics 2018, 34, 2666–2669. [Google Scholar] [CrossRef]
- Trinity. Counting Full Length Trinity Transcripts. Available online: https://github.com/trinityrnaseq/trinityrnaseq/wiki (accessed on 8 August 2024).
- Trinotate: Transcriptome Functional Annotation and Analysis. Available online: https://github.com/Trinotate/Trinotate/wiki (accessed on 21 October 2024).
- Mistry, J.; Chuguransky, S.; Williams, L.; Qureshi, M.; Salazar, G.A.; Sonnhammer, E.L.L.; Tosatto, S.C.E.; Paladin, L.; Raj, S.; Richardson, L.J.; et al. Pfam: The protein families database in 2021. Nucleic Acids Res. 2021, 49, D412–D419. [Google Scholar] [CrossRef]
- UniProt, C. UniProt: The universal protein knowledgebase in 2021. Nucleic Acids Res. 2021, 49, D480–D489. [Google Scholar] [CrossRef]
- Teufel, F.; Almagro Armenteros, J.J.; Johansen, A.R.; Gislason, M.H.; Pihl, S.I.; Tsirigos, K.D.; Winther, O.; Brunak, S.; von Heijne, G.; Nielsen, H. SignalP 6.0 predicts all five types of signal peptides using protein language models. Nat. Biotechnol. 2022, 40, 1023–1025. [Google Scholar] [CrossRef] [PubMed]
- Krogh, A.; Larsson, B.; von Heijne, G.; Sonnhammer, E.L. Predicting transmembrane protein topology with a hidden Markov model: Application to complete genomes. J. Mol. Biol. 2001, 305, 567–580. [Google Scholar] [CrossRef] [PubMed]
- Huerta-Cepas, J.; Szklarczyk, D.; Heller, D.; Hernandez-Plaza, A.; Forslund, S.K.; Cook, H.; Mende, D.R.; Letunic, I.; Rattei, T.; Jensen, L.J.; et al. eggNOG 5.0: A hierarchical, functionally and phylogenetically annotated orthology resource based on 5090 organisms and 2502 viruses. Nucleic Acids Res. 2019, 47, D309–D314. [Google Scholar] [CrossRef] [PubMed]
- Nawrocki, E.P.; Eddy, S.R. Infernal 1.1: 100-fold faster RNA homology searches. Bioinformatics 2013, 29, 2933–2935. [Google Scholar] [CrossRef]
- Gene Ontology, C.; Aleksander, S.A.; Balhoff, J.; Carbon, S.; Cherry, J.M.; Drabkin, H.J.; Ebert, D.; Feuermann, M.; Gaudet, P.; Harris, N.L.; et al. The Gene Ontology knowledgebase in 2023. Genetics 2023, 224, iyad031. [Google Scholar] [CrossRef]
- Kanehisa, M.; Goto, S. KEGG: Kyoto encyclopedia of genes and genomes. Nucleic Acids Res. 2000, 28, 27–30. [Google Scholar] [CrossRef]
- Tatusov, R.L.; Galperin, M.Y.; Natale, D.A.; Koonin, E.V. The COG database: A tool for genome-scale analysis of protein functions and evolution. Nucleic Acids Res. 2000, 28, 33–36. [Google Scholar] [CrossRef]
- Mello, C.V. The zebra finch, Taeniopygia guttata: An avian model for investigating the neurobiological basis of vocal learning. Cold Spring Harb. Protoc. 2014, 2014, 1237–1242. [Google Scholar] [CrossRef]
- Hauber, M.E.; Louder, M.I.; Griffith, S.C. The Natural History of Model Organisms: Neurogenomic insights into the behavioral and vocal development of the zebra finch. eLife 2021, 10, e61849. [Google Scholar] [CrossRef]
- Leinonen, R.; Sugawara, H.; Shumway, M. International Nucleotide Sequence Database Collaboration. The sequence read archive. Nucleic Acids Res. 2011, 39, D19–D21. [Google Scholar] [CrossRef]
- Quast, C.; Pruesse, E.; Yilmaz, P.; Gerken, J.; Schweer, T.; Yarza, P.; Peplies, J.; Glockner, F.O. The SILVA ribosomal RNA gene database project: Improved data processing and web-based tools. Nucleic Acids Res. 2013, 41, D590–D596. [Google Scholar] [CrossRef] [PubMed]
- Wang, Y.; Zhao, Y.; Bollas, A.; Wang, Y.; Au, K.F. Nanopore sequencing technology, bioinformatics and applications. Nat. Biotechnol. 2021, 39, 1348–1365. [Google Scholar] [CrossRef] [PubMed]
- Ferrarini, M.; Moretto, M.; Ward, J.A.; Surbanovski, N.; Stevanovic, V.; Giongo, L.; Viola, R.; Cavalieri, D.; Velasco, R.; Cestaro, A.; et al. An evaluation of the PacBio RS platform for sequencing and de novo assembly of a chloroplast genome. BMC Genom. 2013, 14, 670. [Google Scholar] [CrossRef] [PubMed]
- Tvedte, E.S.; Gasser, M.; Sparklin, B.C.; Michalski, J.; Hjelmen, C.E.; Johnston, J.S.; Zhao, X.; Bromley, R.; Tallon, L.J.; Sadzewicz, L.; et al. Comparison of long-read sequencing technologies in interrogating bacteria and fly genomes. G3 2021, 11, jkab083. [Google Scholar] [CrossRef]
- Sacristan-Horcajada, E.; Gonzalez-de la Fuente, S.; Peiro-Pastor, R.; Carrasco-Ramiro, F.; Amils, R.; Requena, J.M.; Berenguer, J.; Aguado, B. ARAMIS: From systematic errors of NGS long reads to accurate assemblies. Brief. Bioinform. 2021, 22, bbab170. [Google Scholar] [CrossRef]
- Pourmohammadi, R.; Abouei, J.; Anpalagan, A. Error analysis of the PacBio sequencing CCS reads. Int. J. Biostat. 2023, 19, 439–453. [Google Scholar] [CrossRef]
- Waterhouse, R.M.; Seppey, M.; Simao, F.A.; Manni, M.; Ioannidis, P.; Klioutchnikov, G.; Kriventseva, E.V.; Zdobnov, E.M. BUSCO Applications from Quality Assessments to Gene Prediction and Phylogenomics. Mol Biol Evol 2018, 35, 543–548. [Google Scholar] [CrossRef]

| Steps/Samples | Brain_2 | Brain_5 | Ovary_2 | Testis_5 |
|---|---|---|---|---|
| Raw | 32,217,548 | 29,323,820 | 33,201,568 | 28,474,620 |
| FastQScreen | 30,396,892 | 28,010,526 | 31,965,452 | 27,981,280 |
| fastp | 29,777,552 | 27,446,223 | 31,089,662 | 27,519,646 |
| Steps/Samples | Brain_2 | Brain_5 | Ovary_2 | Testis_5 |
|---|---|---|---|---|
| Raw | 444,968 | 717,758 | 483,419 | 729,821 |
| CCS | 124,615 | 56,773 | 198,608 | 42,832 |
| FL | 93,967 | 15,245 | 172,050 | 25,332 |
| FLNC | 89,017 | 15,103 | 168,336 | 25,095 |
| Clustered | 47,129 | 10,229 | 80,405 | 18,101 |
| Contamination | 46,769 | 9990 | 80,166 | 17,993 |
| Error-correction | 46,769 | 9990 | 80,166 | 17,993 |
| CD-Hit-Est | 23,636 | 6175 | 37,838 | 11,284 |
| Steps/Samples | Transcriptome |
|---|---|
| Total isoforms | 39,984 |
| mean, median, N50 transcripts | 3097.7|2794|4108 |
| Total proteins | 39,984 |
| mean, median, N50 proteins | 398.2|271|597 |
| Full-length proteins (EvidentialGene) | 86.7% |
| Transcriptome completeness | C: 79.1% [S: 38.2%, D: 40.9%], F: 4.7%, M: 16.2%, n: 3354 |
| Database | Hits (%) |
|---|---|
| UniProt/SwissProt Blastx | 28,274 (70.7%) |
| UniProt/SwissProt Blastp | 25,051 (62.7%) |
| Pfam Domains | 23,689 (59.2%) |
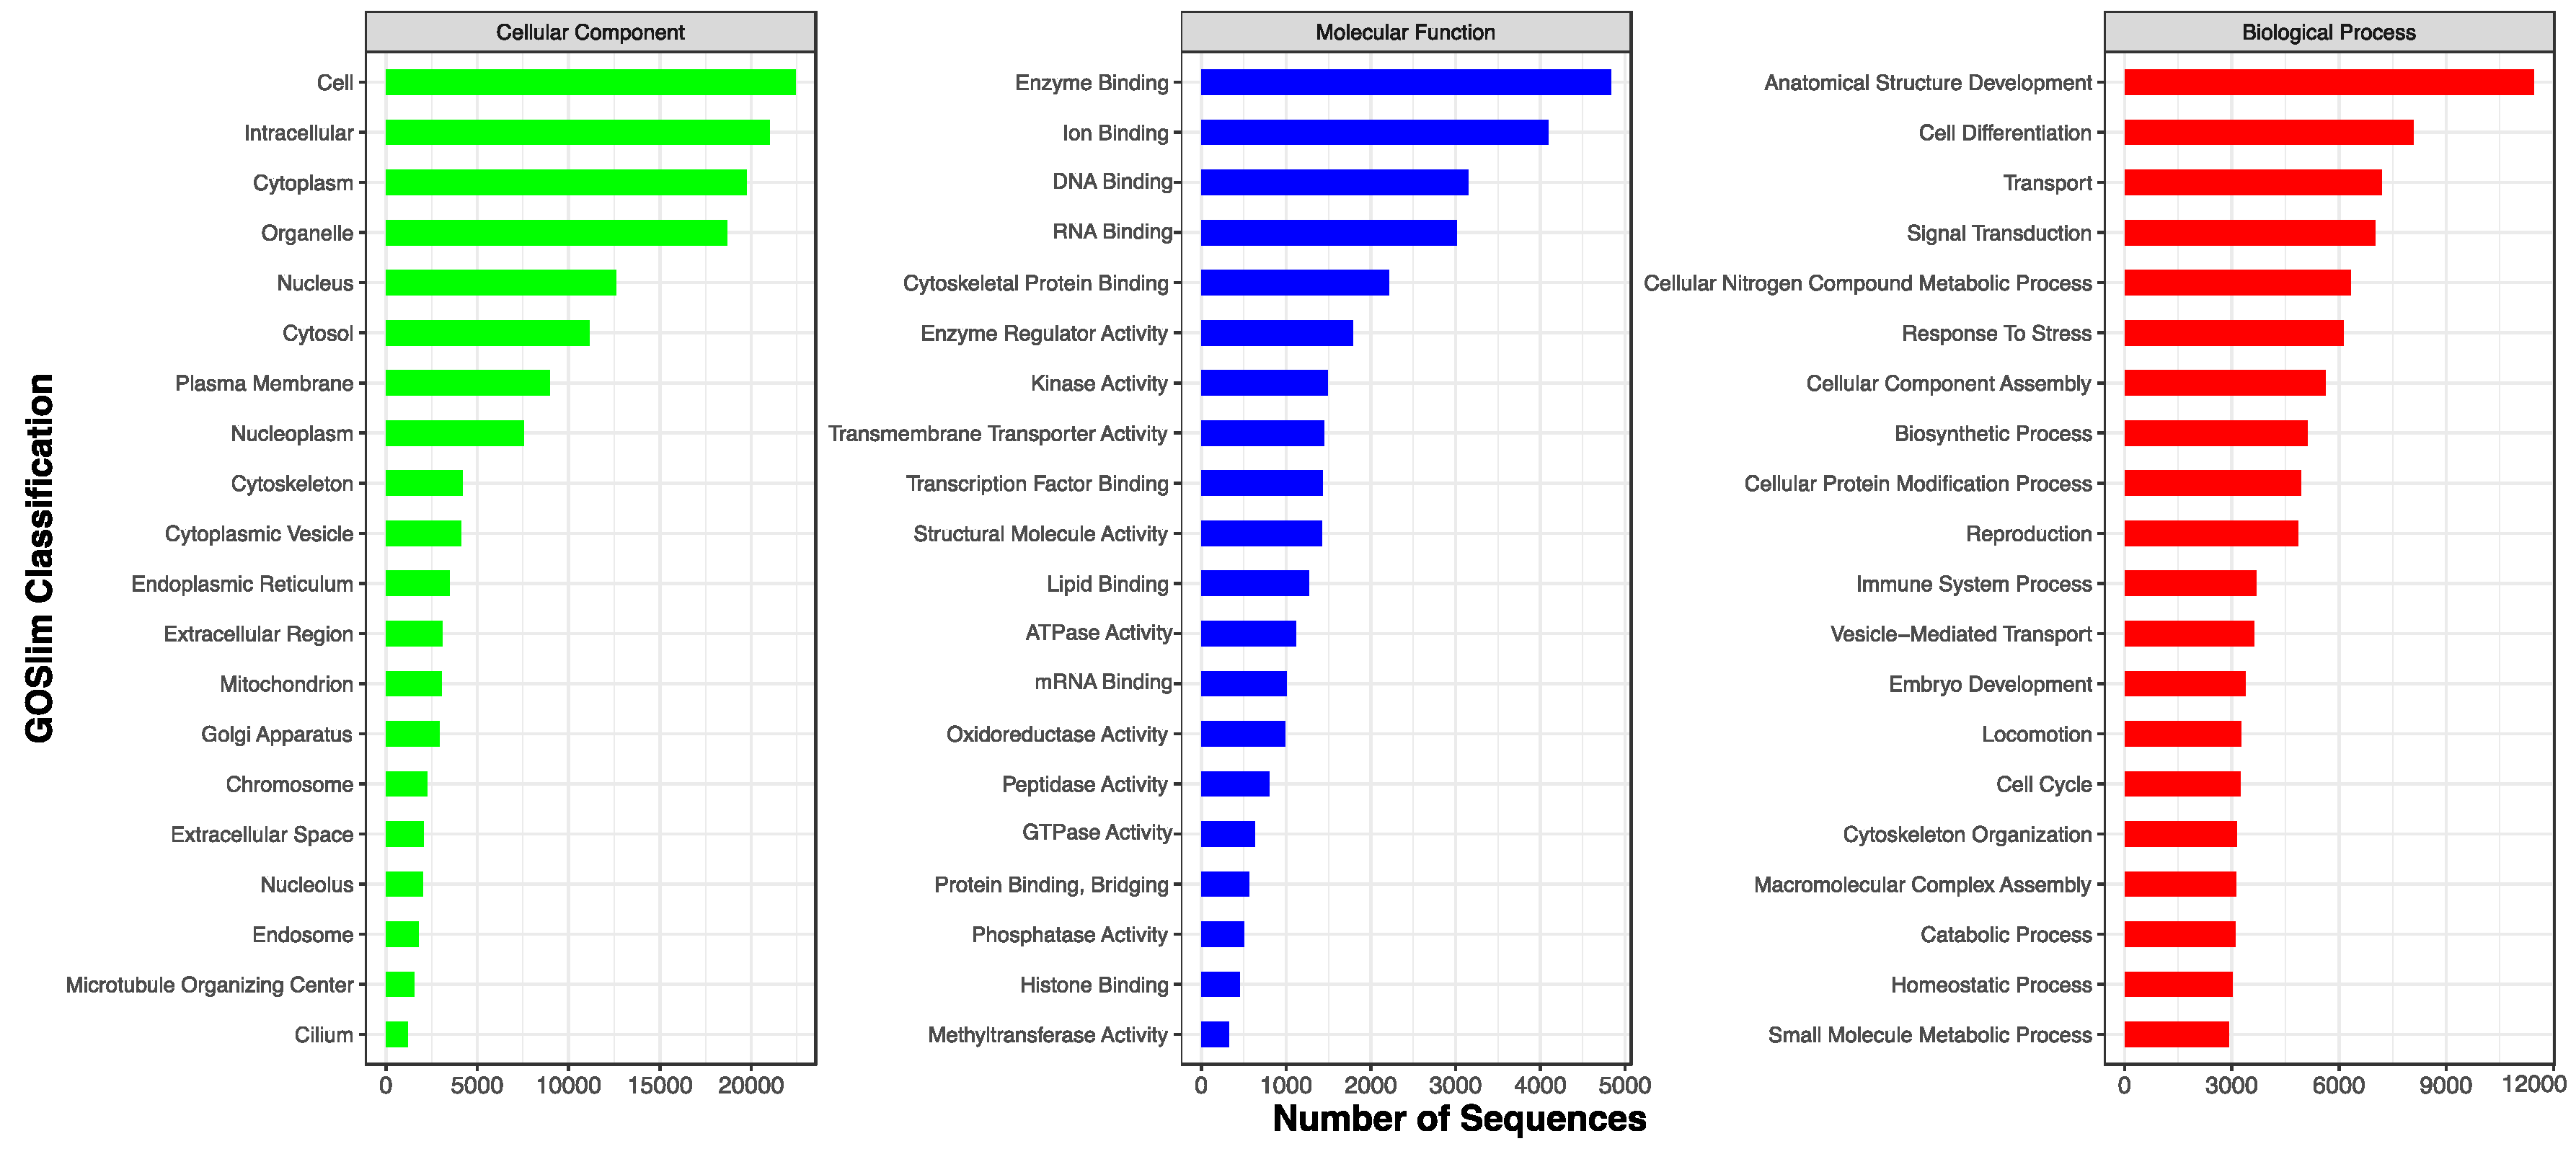
| GO | 28,399 (71.0%) |
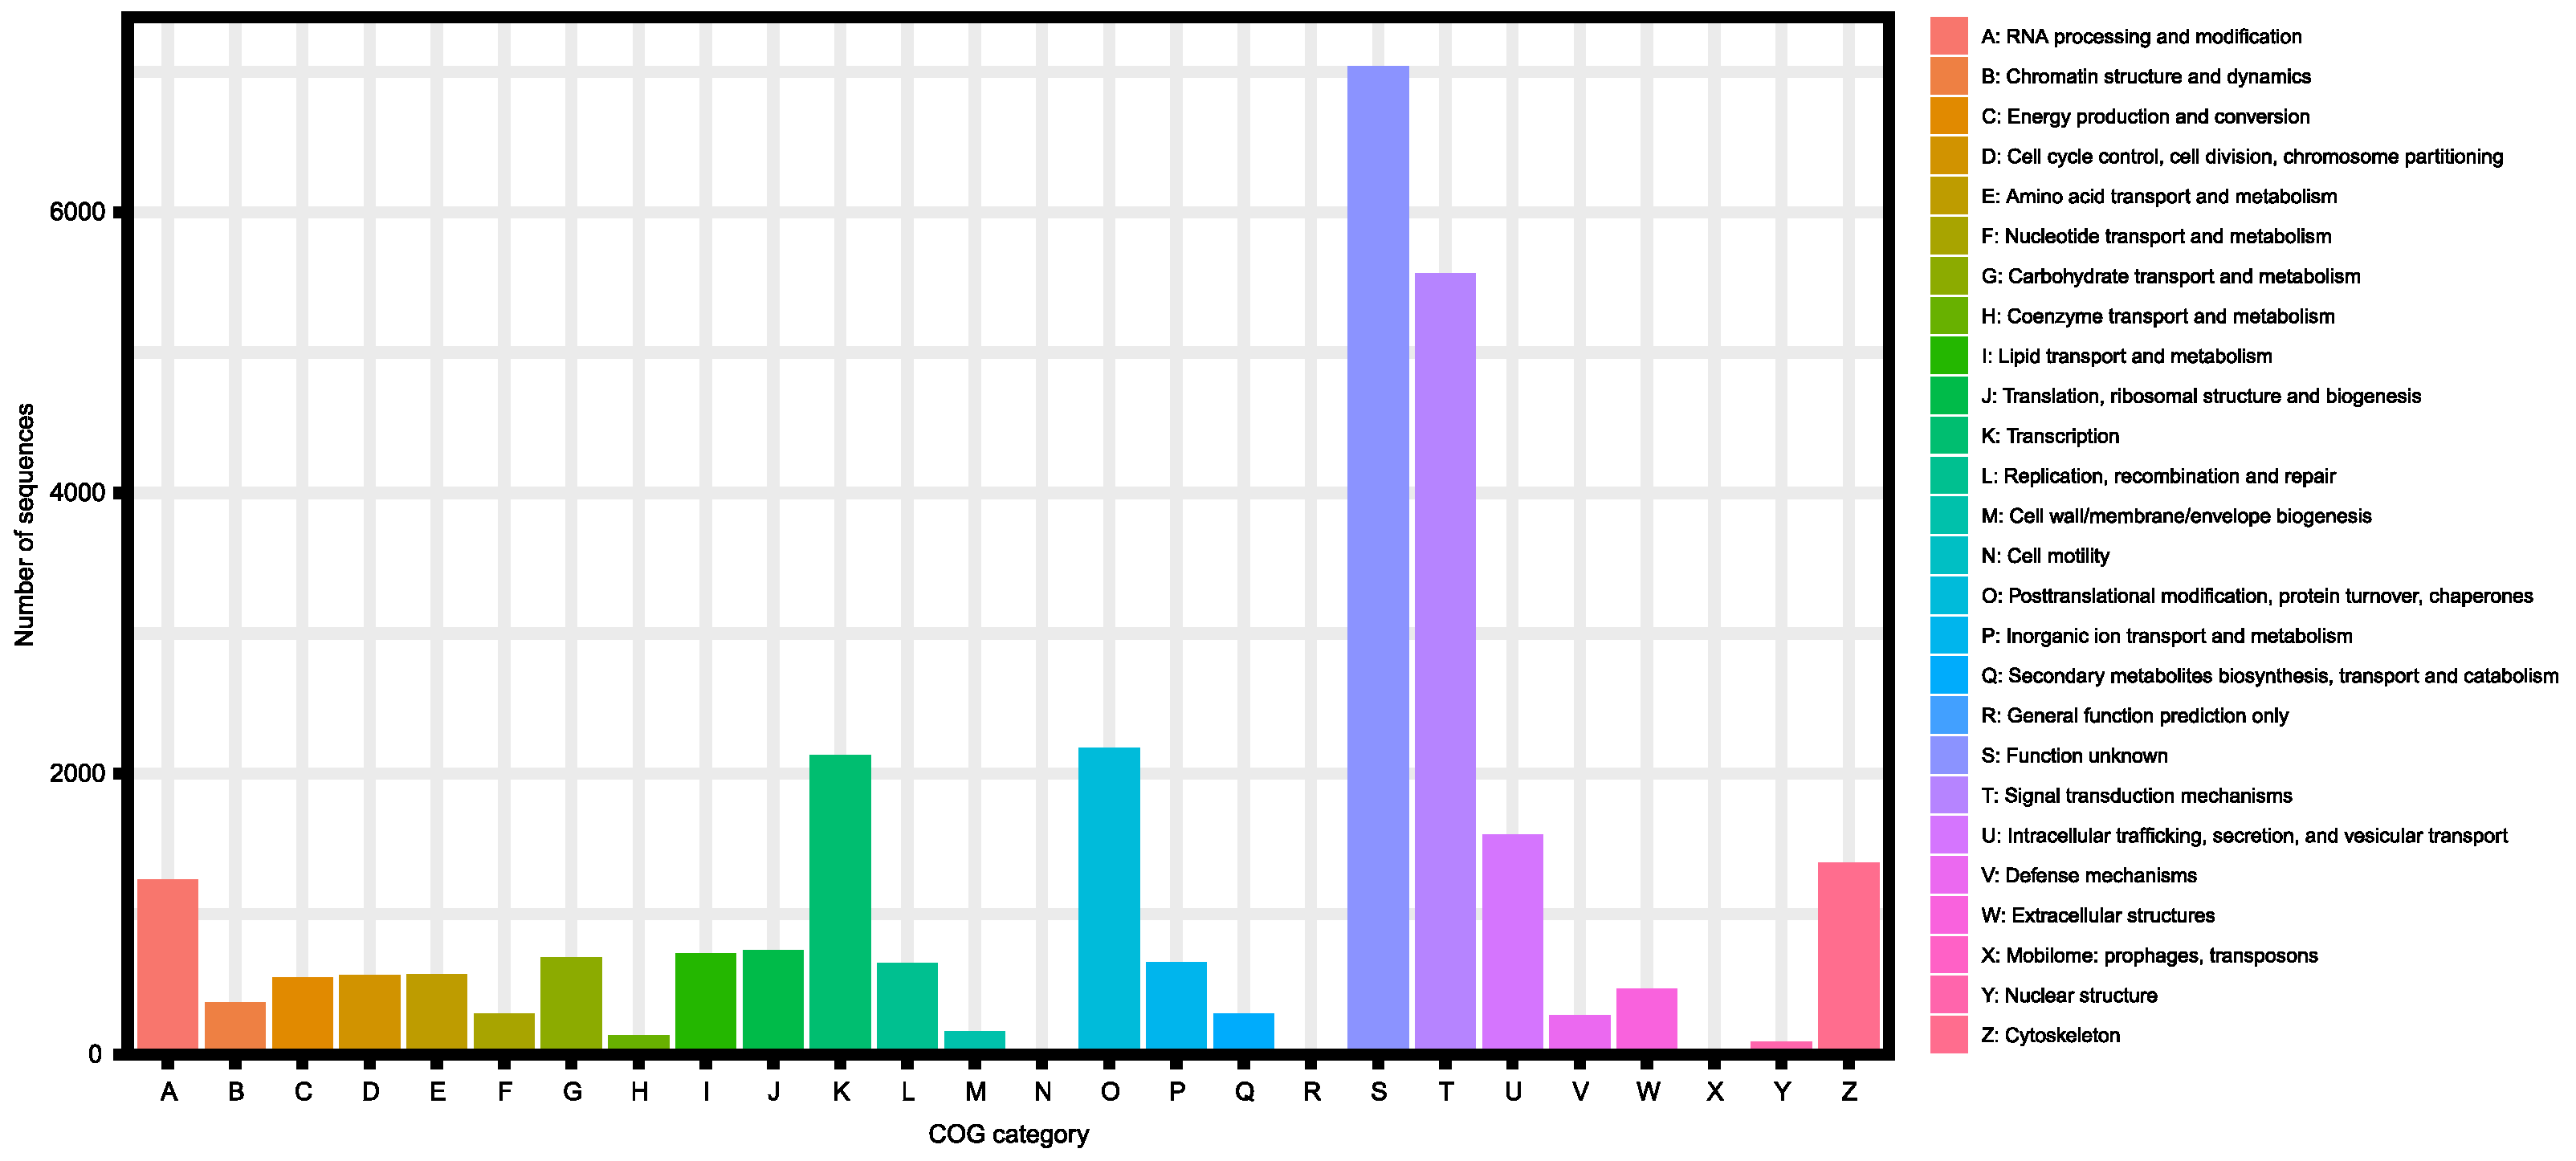
| KOG | 26,409 (66.0%) |
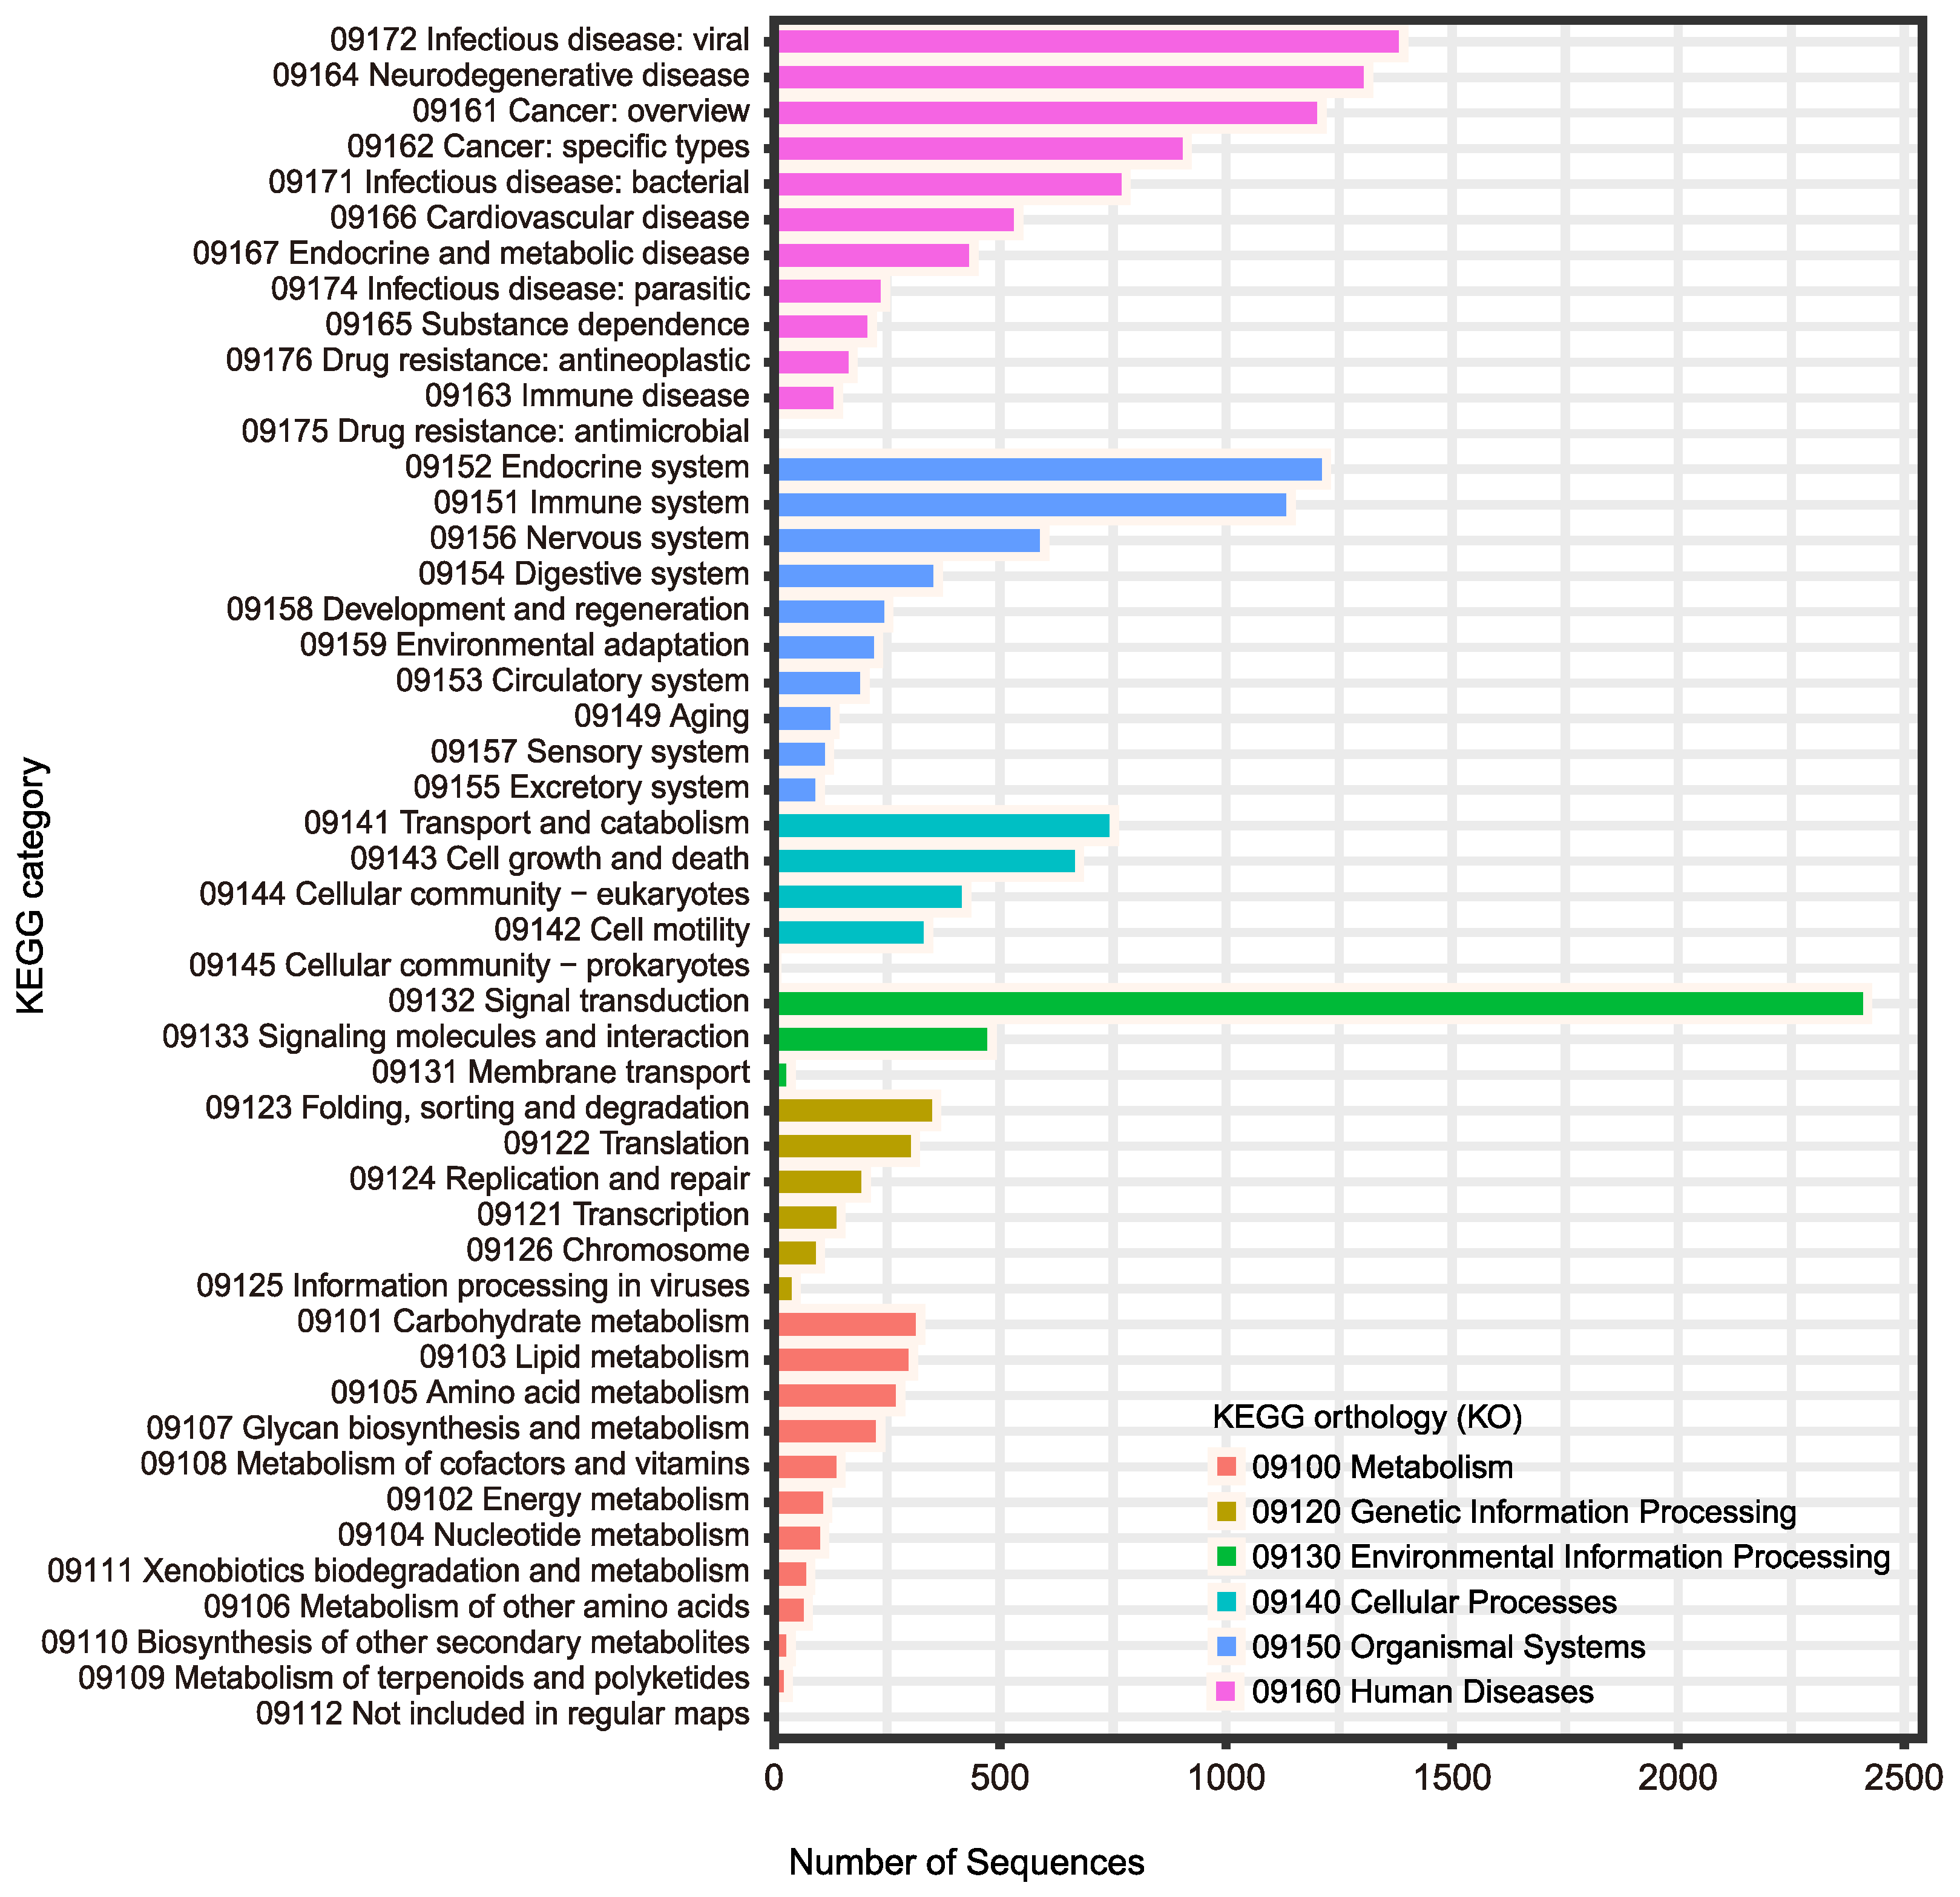
| KEGG | 26,097 (65.3%) |
| Transmembrane Domains (TmHMM) | 7155 (17.9%) |
| Signal Peptides (SignalP) | 2305 (5.8%) |
| Non-coding RNAs (Infernal) | 169 (0.4%) |
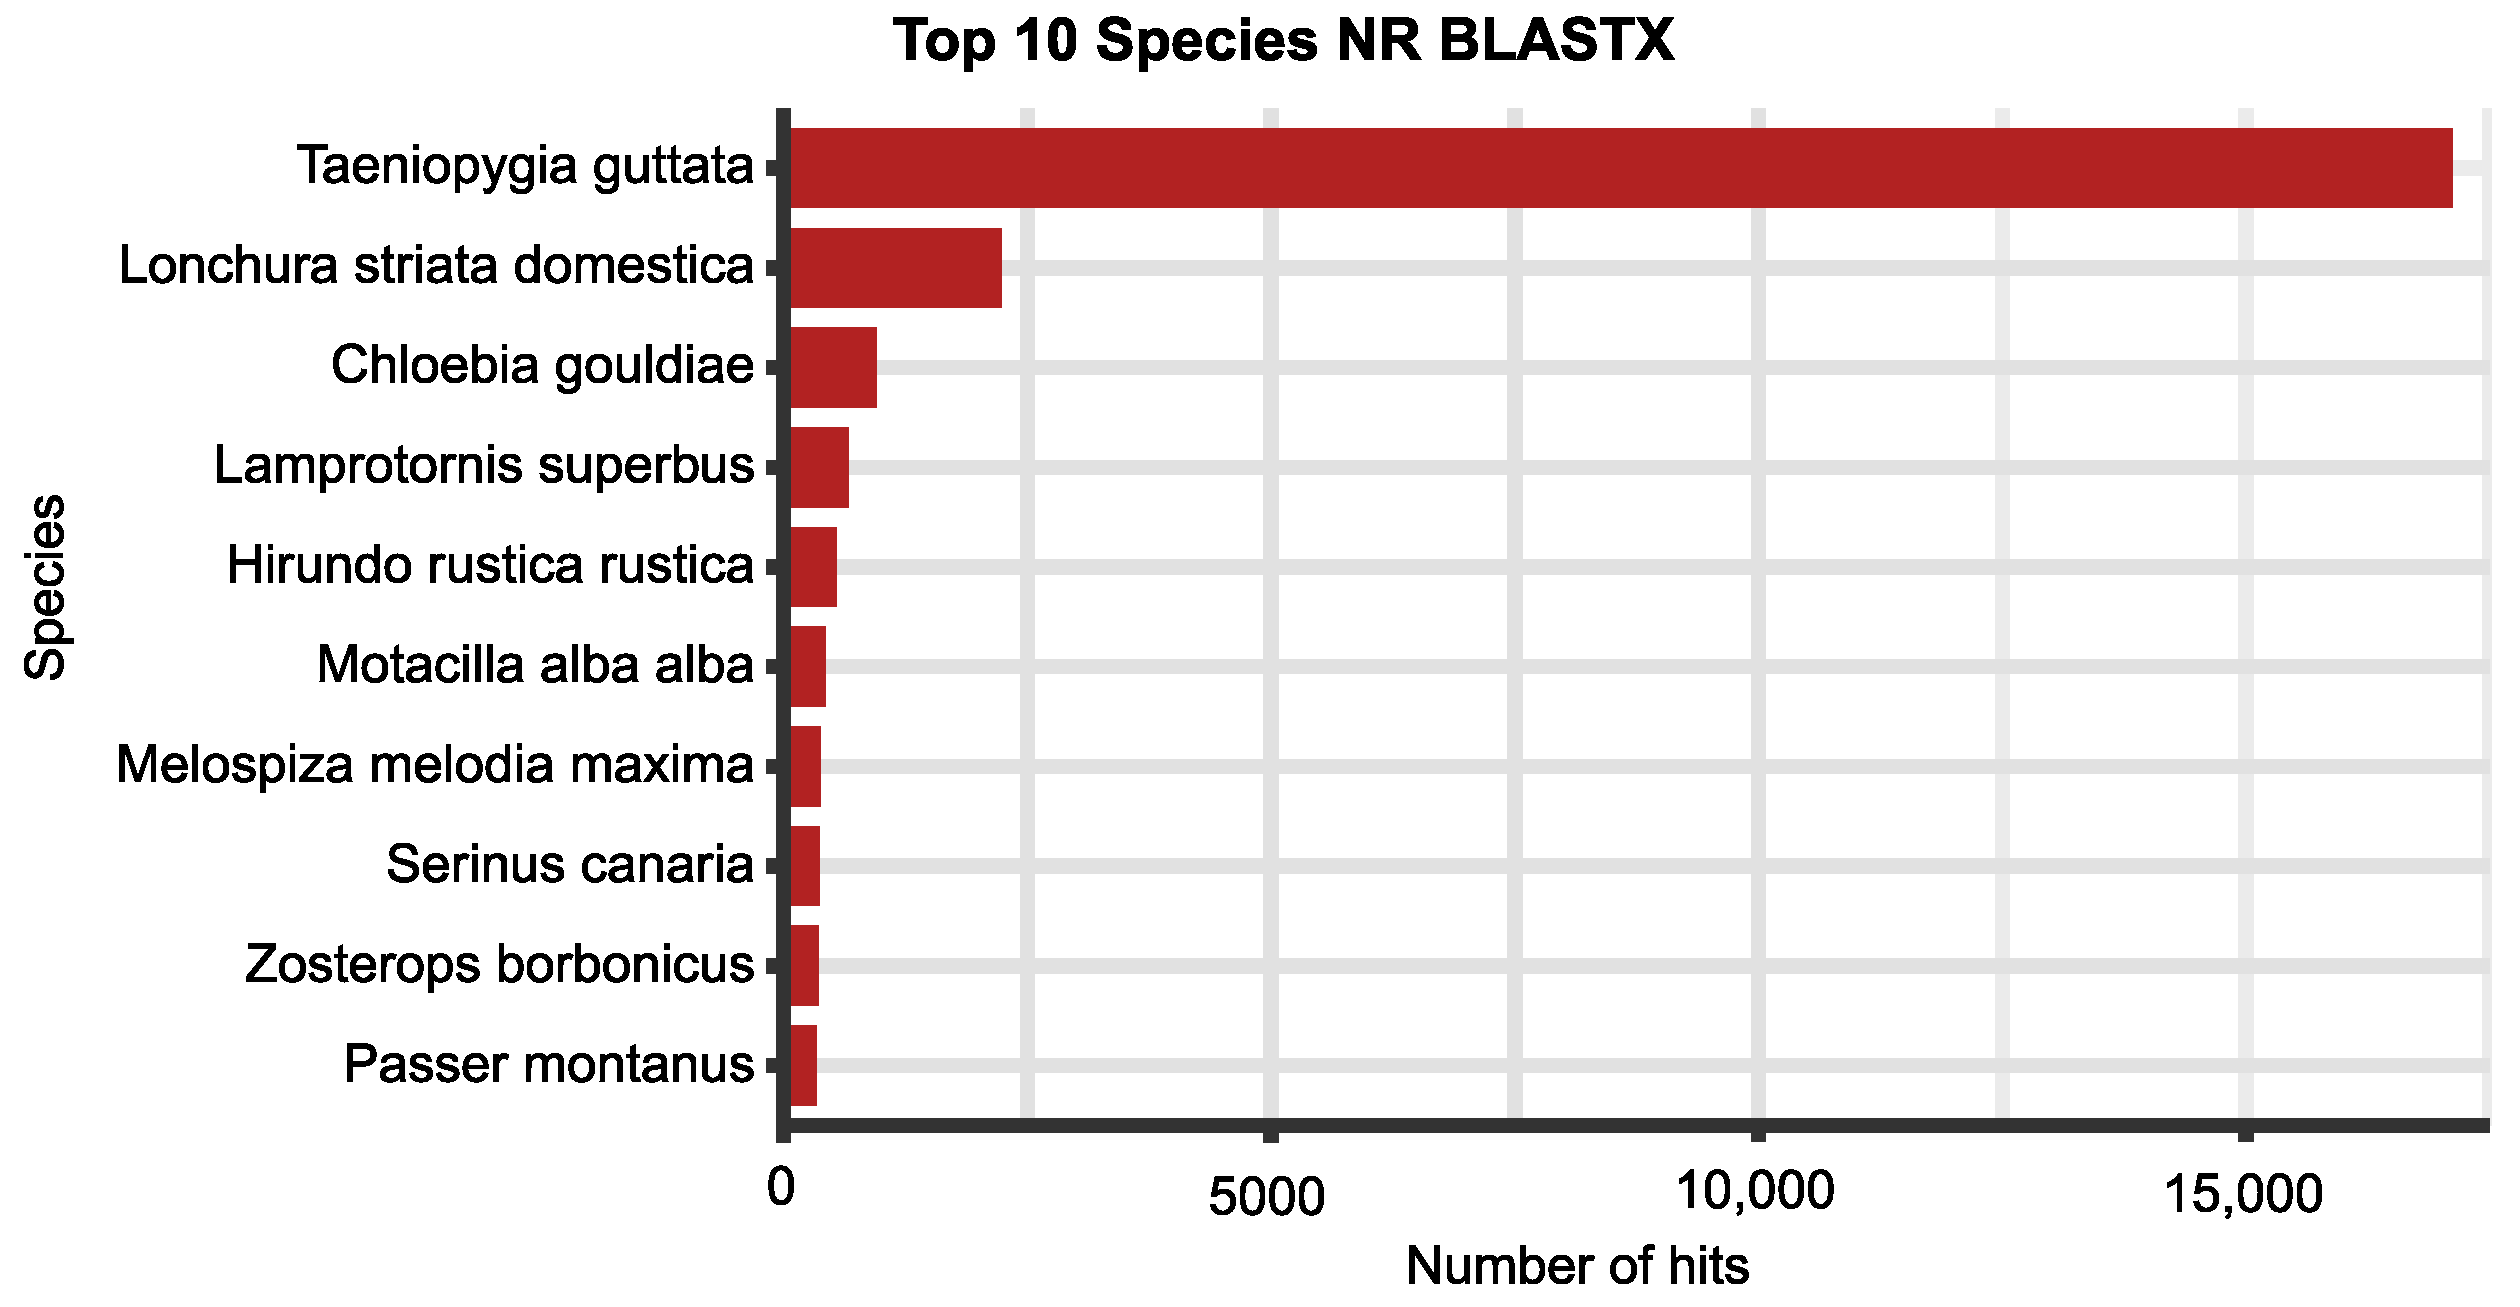
| Non-redundant protein DB (NR Blastx) | 33,049 (82.7%) |
| Non-redundant protein DB NR Blastp | 28,303 (70.8%) |
| Non-redundant nucleotide DB (NT Blastn) | 39,827 (99.6%) |
Disclaimer/Publisher’s Note: The statements, opinions and data contained in all publications are solely those of the individual author(s) and contributor(s) and not of MDPI and/or the editor(s). MDPI and/or the editor(s) disclaim responsibility for any injury to people or property resulting from any ideas, methods, instructions or products referred to in the content. |
© 2024 by the authors. Licensee MDPI, Basel, Switzerland. This article is an open access article distributed under the terms and conditions of the Creative Commons Attribution (CC BY) license (http://creativecommons.org/licenses/by/4.0/).


