
Submitted:
06 October 2025
Posted:
08 October 2025
You are already at the latest version
Abstract
Guar (Cyamopsis tetragonoloba), an industrially important crop, is valued for the galactomannan gum derived from its seeds. Recent advances in genomic and transcriptomic research have provided valuable resources such as the reference genome and several sets of gene expression profiles. However, these data are currently fragmented and therefore require bioinformatics expertise to access and analyze them. To address this challenge, we have developed CTGA, a comprehensive functional genomic database for guar that is accessible through a web interface. We have performed a de novo structural and functional annotation of the guar genome using the BRAKER2 software, predicting 57,019 protein-coding genes with UTRs. We have integrated expression data from 85 public RNA-seq libraries representing various tissues and conditions to create a normalized gene expression atlas. This atlas provides a comprehensive view of gene expression patterns across different tissues and conditions in guar, allowing for a better understanding of its biology and potential applications. Our resource features an intuitive web interface that uses the Flask framework to provide interactive tools, including a genome browser (IGV) and a BLAST for homology searching. It also includes detailed functional annotations from various sources (eggNOG, Mercator4, GO, and KEGG) and instant visualization of gene expression profiles. CTGA integrates genomic and transcriptomic data into a user-friendly platform, removing technical barriers and enabling researchers to accelerate gene discovery and molecular breeding in guar. The resource is freely accessible at https://guar.arriam.ru/.
Keywords:
Guar
; genomics
; transcriptomics
; gene expression
; gene annotation
; genome browser
1. Introduction
Guar (Cyamopsis tetragonoloba (L.) Taub.) is an important technical, feed, and food crop globally, primarily valued for its seed endosperm gum – a storage polysaccharide with extensive applications in food, oil, textile, pharmaceutical, and cosmetic industries [1].
While traditional guar breeding was based on phenotypic selection, with the advent of next-generation sequencing (NGS), genomic and transcriptomic approaches have emerged. Recent research has focused on elucidating the molecular mechanisms of galactomannan biosynthesis. One of the first studies, the work of Naoumkina and co-authors [2], made it possible to identify key candidate genes using cDNA libraries from developing seeds.
Subsequent RNA-seq studies comparing guar varieties with varying gum yields revealed that expression peaks for mannan synthase and sucrose synthase occur during the mid-stage of seed development, corresponding with gum accumulation [3]. Hu et al. (2019), using quantitative RNA-Seq, highlighted the role of cellulose synthase-like A (CsLA) gene family, including mannan synthase [4]. These findings were further supported by Sharma and coauthors, who provided spatio-temporal insights into galactomannan regulation [5].
A significant advancement was made with the first genome assembly by Gaikwad and coauthors [6]. This enabled the precise mapping of genes involved in galactomannan biosynthesis and their regulatory elements. In parallel, efforts have expanded genomic resources, including the development of transcriptome-derived single nucleotide polymorphism (SNP) markers [7,8]. Grigoreva and colleagues created an SNP panel for use in marker-assisted selection, utilizing a draft genome sequence[9].
Research has expanded to include traits other than gum production. Integrating transcriptome and metabolome analyses have identified genes and metabolites associated with flowering time [10,11]. Furthermore, the complete chloroplast genome has been sequenced, facilitating phylogenetic studies [12].
Collectively, these advances have transformed guar from a crop that has been understudied to one that has been molecularly characterized, with foundational resources such as a reference genome, expression profiles, and molecular markers. However, manipulating this data requires specialized skills for access and analysis. To streamline the research of guar, we have developed a user-friendly web-based resource that includes a interactive genome browser, a BLAST service [13], functional gene annotations, and expression profiles from all publicly available RNA-Seq data.
2. Results
The guar reference genome has been assembled at the chromosomal level and annotated in the year 2024 [14], but the annotation is not publicly available at the moment. To obtain a high-quality set of predicted genes for future work, we performed a de novo genome annotation.
2.1. Re-Annotation and Characterization of the Guar Genome
In this study, we performed a comprehensive de novo annotation of the published guar (Cyamopsis tetragonoloba) genome using the BRAKER2 pipeline [15,16,17]. This approach resulted in the prediction of 57,019 protein-coding genes encoding 82,042 proteins. A key advancement of our annotation over the existing one was the precise prediction of untranslated regions (UTRs) for the gene models, which are crucial for the regulation of gene expression, especially if the analysis is performed using technologies involving RNA capture by the polyA-tail and therefore sequencing only 3’end of transcripts (for example, the 3' MACE technology [18]).
To assess the quality of the structural annotations, the BUSCO program [19] was run on the predicted proteins using the embryophyta_odb10 database. As a result, a significant number of genes have been fully covered, and the low percentage of missing or fragmented data was obtained, indicating the high quality of the annotation process (Table 1).
The functional annotation of the predicted genes using EggNOG-mapper [20] successfully assigned putative functions to 36,998 genes (Table 2), providing Gene Ontology (GO) terms [21,22], KEGG pathways [23], and domain architectures.
Complementary analysis with Mercator4 [24,25] enabled the categorization of 28,443 genes into the hierarchical MapMan BIN system (Table 2), facilitating the functional exploration of biological pathways in guar. All the major biological processes and metabolic pathways encoded in MapMan bins were covered by the predicted genes (Figure 1A). In addition, galactomannan biosynthesis genes were also identified among the annotated ones (Figure 1B), which indicates the high quality of the annotation.
2.2. Construction of a Comprehensive Gene Expression Atlas
To capture the transcriptomic landscape of guar, we collected all publicly available RNA-seq datasets from NCBI SRA, comprising 96 libraries derived from a wide range of tissues and developmental stages (Table S1). However, not all the samples collected could be analyzed, as various technical errors were found that did not allow proper processing of the reads. Eventually, 85 samples were left for further analysis (Table 3).
After rigorous quality control and adapter trimming using BBDuk, high-quality reads were aligned to the annotated genome using the STAR aligner [26].
The resulting expression matrix was normalized using Counts Per Million (CPM) to enable cross-sample comparison. This comprehensive expression atlas reveals the transcript abundance of all predicted genes across the studied conditions. Principal Component Analysis (PCA) of the CPM matrix showed clear separation of samples by tissue type (Figure 2B) but not sequencing running or experiment (Figure 2A), demonstrating the biological consistency of the dataset and the quality of normalization.
From the 57,019 total genes annotated in the guar genome, 27823 genes (48.79%) showed significant expression (≥10 CPMs, Counts Per Million) in the sum of all samples.
2.3. Development of an Interactive Guar Genomic Resource
To make annotated genome, expression atlas, and functional data freely accessible and user-friendly, we developed a dedicated web resource using the Flask framework (Figure 3). The platform integrates several key functionalities.
First of all, the user can get information both by the identifier of a specific gene and by the nucleotide or amino acid sequence of a guar or a closely related organism by inserting it into the appropriate window and conducting a BLAST search (Figure 4A). The user can fine-tune a filter for the BLAST search by changing the E-value (Figure4A). On the results page, the user can select the best hits based on a number of parameters, such as the percentage of identity, alignment length, number of substitutions, and e-value (Figure 4B).
By clicking on the selected gene, the user is taken to the next page with detailed information about the gene. The platform provides instant access to comprehensive functional annotation (via EggNOG and Mercator4 databases) for each gene. In addition, KEGG and GO terms are assigned to each gene, along with a brief description, which facilitates subsequent analysis (Figure 4C).
An embedded IGV.js instance allows for intuitive visualization of the genomic context of any gene, including exon-intron structures and predicted UTRs (Figure 5c). The genomic browser is available for all genes, regardless of whether the user accesses it through the BLAST service or the ID search.
For any gene of interest, users can generate an interactive barplot and boxplot displaying its normalized expression (CPM) across all integrated RNA-seq samples, facilitating quick assessment of its expression pattern. Each box reflects the median, Q1 and Q2 values of the normalized expression for all available replications, except in cases where the data is publicly available only in a single replicate (Figure 5ab).
Integration of a BLAST server allows users to search for homologous sequences within the guar genome using nucleotide or protein queries, directly linking results to the genome browser and expression modules.
3. Discussion
In recent decades, due to the development of next-generation sequencing methods, guar has transformed from a poorly studied agriculture crop into a genetically well-studied species. Initial studies have successfully identified key genes associated with galactomannan biosynthesis [3,5,6], developed a comprehensive collection of molecular markers [9,11], and resulted in the chromosome-level genome assembly [6,14]. However, the full potential of these diverse genomic resources has yet to be fully realized, as their accessibility and integration necessitate significant bioinformatics expertise, posing a barrier for numerous researchers and breeders. Our research was aimed at solving this problem.
We presented a comprehensive genomic resource for C. tetragonoloba, which includes a structural and functional annotation with an extensive expression atlas and is available through a user-friendly web interface. High-quality de novo gene prediction performed using BRAKER2 and confirmed by BUSCO's high completeness score (97.5%) provides an accurate and reliable set of genes (Table 1). Accurate prediction of untranslated regions (UTRs) is essential for studying post-transcriptional regulation and research based on 3'-MACE sequencing technology [18]. The predicted genes ultimately covered all major functional categories of Mercator, indicating both successful gene prediction and high-quality annotation.
The value of genome annotation increases significantly when understanding the conditions and tissues in which genes are expressed.
The expression atlas we have built, based on 85 publicly available RNA-seq libraries covering various tissues and developmental conditions, provides an unprecedented overview of the guar transcriptome landscape. The clear separation of samples by experiment conditions, genotypes and tissue in Principal Component Analysis (PCA) highlights the high quality of this integrated dataset (Figure 2) and the ability to make comparisons of gene expression, disregarding factors such as the sequencing run and the origin of the data.
The service is designed to simplify the work of researchers and provides them with the opportunity to work effectively with data. By integrating IGV's interactive genomic browser, BLAST server, and instant visualization of expression profiles and functional annotations, the service allows researchers to opt out of using command-line tools and local data processing.
Using the service, researchers can perform several important tasks within minutes, such as finding a homologous gene of Arabidopsis or another species among guar genes using the BLAST algorithm; studying the genomic context of the found homologue; becoming familiar with the functional classification of the homologue in Mercator4; evaluating which metabolic pathways and biological processes the product of the gene of interest is involved in; analyzing the expression profile of the gene of interest in different guar tissues.
Thus, while previous works have provided important data for genomic and transcriptomic studies of guar, our study integrates previous experience and serves as a centralized database. We have combined a variety of data into a single powerful platform. By reducing the technical barrier, this resource will allow a wider range of scientists and breeders to contribute to improving the quality of guar research, which will eventually lead, hopefully, to the creation of high-yielding, disease-resistant varieties that meet global agricultural and industrial requirements.
4. Materials and Methods
4.1. Genomic Sequence Obtaining and Structural Reannotation
To reannotate the genes in the C. tetragonoloba genome [14], the reference assembly in FASTA format was downloaded from the National Center for Biotechnology Information (NCBI) database (available under BioProject ID: PRJNA1055737 or GenBank ID: GCA_037177725.1). De novo gene annotation was performed using the BRAKER2 tool (version 2.1.6) [15]. BRAKER2 performed automatic prediction of gene structure by combining ab initio evidence from GeneMark-EP+ [16] and AUGUSTUS [17], as well as RNA sequencing alignment data (85 samples, in total) (Supp. Table S1). The default parameters were used. To increase the completeness of the annotation, an additional step was performed to predict untranslated regions (UTR) using the capabilities built into pipeline BRAKER2/AUGUSTUS. As a result, a GFF3 file was generated containing the coordinates of the predicted genes, mRNA, exons, and UTRs, as well as their corresponding protein sequences. Aberrant CDS and UTR have been fixed or removed from the annotation using a custom Python script.
4.2. Protein Functional Annotation and Quality Assesment
An integrated approach was applied to assign a functional annotation to the predicted protein sequences. The primary functional annotation, including the prediction of Gene Ontology (GO) [21,22], metabolic pathways (KEGG) [23], and domain architecture, was performed using eggNOG-mapper (version 2.1.9) [20] against the eggNOG database (v5.0) using homology search mode (diamond). Additionally, for the categorization of genes in the context of biological pathways and comparison with other plant species, annotation was performed using Mercator4 [23,24]. This tool assigned each protein to one of 70 hierarchical MapMan BIN categories based on hidden Markov models.
The quality control of predicted genes was conducted using BUSCO [19] with “embryophyta_odb10” database.
4.3. Raw RNA-Seq Reads Processing
All publicly available RNA-seq datasets for C. tetragonoloba were obtained from the NCBI Sequence Read Archive (SRA) using the SRA Toolkit version 3.0.0 [26]. The search and selection were based on species-specific keywords, resulting in the loading of 89 libraries representing various tissue types and experimental conditions.
Initial processing of raw reads was carried out to ensure high-quality data for subsequent analysis. Adapter sequences, technical artifacts, and low-quality reads were filtered using BBDuk version 38.96. [27]. Parameters used included ktrim=r, k=23, mink=11, hdist=1, tbo, tpe, qtrim=rl, trimq=20, minlen=50.
4.4. Reads Mapping and Count Matrix Construction
The high-quality reads were mapped to the guar reference genome using the STAR tool version 2.7.10a [28] in two stages. At the first stage, splice events were detected, which were then used to improve genome annotation in the second stage. This improved the accuracy of the mapping.
Based on the BAM-formatted mapping results obtained using STAR, a count matrix was created using the featureCounts program [29]. This utility calculated the number of reads uniquely mapped to each BRAKER2 annotated gene for each library.
4.5. Data Normalization and Expression Atlas Construction
To compare the expression levels between the samples, which differ significantly in the total number of sequenced reads (library size), the counts matrix was normalized using the Counts Per Million (CPM) method. The normalized expression values for the *i* gene in the *j* library were calculated using the formula: CPM_ij = (count_ij / total_j) * 1,000,000, where count_ij is the initial number of reads for a gene, and total_j is the total number of reads mapped to all genes in a given library. The resulting normalized CPM matrix served as the basis for constructing the guar expression atlas.
4.6. The Implementation of A Web-Based Functional Genomics Resource For Guar
A specialized web service dedicated to Cyamopsis tetragonoloba has been developed to provide convenient and interactive access to the obtained genomic, transcriptomic and functional data.
The server part of the application is implemented in Python (version 3.11) using the Flask framework (version 2.3.2) [30]. The application provides routing, query processing, and programmatic access to data (annotated genome, pre-build BLAST database, expression matrix, and functional annotation) that is stored in a structured form on the server.
The client side is built using standard web technologies: HTML5, CSS3 and JavaScript. Bootstrap and Chart.js (version 4.3.0) libraries are used to create interactive and dynamic user interface elements.
The web service includes four main functional modules. For visual analysis of the annotated genome, the IGV.js component was integrated (Integrative Genomics Viewer [31], version 2.13.2), pre-generated reference genome (FASTA) and annotation (GFF3) files are uploaded on the client side, allowing users to navigate through chromosomes, scale the loci of interest, and visualize predicted gene structures, including exons, introns, and UTR regions. The gene expression analysis module allows the user to enter the gene identifier, after which the server application on Flask extracts the corresponding normalized expression values (CPM) for all samples from the prepared matrix. The data is transmitted to the client side, where an interactive boxplot chart is automatically generated using the Chart.js library, which visually displays the expression profile of the requested gene in various tissues and conditions. Searching by gene identifier also allows the user to obtain comprehensive functional information. On a separate page or as a pop-up window, data obtained from the EggNOG and Mercator tools are displayed, including protein function prediction, Gene Ontology (GO) terms, KEGG pathways, as well as Mercator4 detailed functional description. To enable the search for homologous genes in the guar genome by the sequence of nucleotides or amino acids, BLAST+ was integrated into the web service. A local BLAST database containing annotated coding sequences (CDS) and protein sequences was created on the server. The user interface includes a form for entering ID or uploading a sequence in FASTA format and configuring basic parameters. After sending the request, the server application on Flask runs the BLAST+ utility, processes the results and returns to the user an interactive HTML page with alignments, E-value and percentage of identity, providing direct links to homologous genes in other modules of the service (genome browser, gene expression, annotation).
The web service is available at https://guar.arriam.ru/ and it can be used by the scientific community for in-depth analysis of the guar genome.
5. Conclusions
This study presents CTGA, a comprehensive functional genomics resource that significantly advances research on C. tetragonoloba. By integrating high-quality de novo genome annotation and extensive expression data from 85 RNA-sequencing libraries, we have created a unified platform that addresses the fragmentation of existing genomic resources. The resource offers accurate gene models and functional annotations from the EggNOG and Mercator4 databases, as well as detailed expression profiles across various tissues and stages of development.
The user-friendly web interface features an interactive genome browser, BLAST search service, and intuitive visualization tools that facilitate access to complex datasets, eliminating the need for advanced bioinformatics expertise. CTGA acts as a central hub, enabling researchers to quickly identify homologous genes, analyze genomic contexts, get information about gene functions, and explore gene expression patterns within a single integrated platform. By bridging the gap between large-scale genomic data and its practical application, this resource has the potential to accelerate molecular breeding efforts and contribute to the development of superior guar varieties with improved agronomic characteristics and gum quality. Ultimately, this will support the growing importance of the crop in the industry.
Supplementary Materials
The following supporting information can be downloaded at the website of this paper posted on Preprints.org, Table S1: The list of publicly available guar RNA sequencing data used in this work.
Author Contributions
Conceptualization, V.A.Z., E.A.Z., M. A. V.; Methodology, E.A.Z.; Writing—Original Draft Preparation, V.A.Z., E.A.Z., M. A. V.; Investigation E.A.Z.; Writing—Review and Editing, V.A.Z., E.A.Z., M. A. V.; Funding Acquisition, M. A. V. All authors have read and agreed to the published version of the manuscript.
Funding
This research was funded by the Russian Science Foundation, project No. 23-16-804 00195 dated May 15, 2023.
Data Availability Statement
The datasets generated and analyzed during the current study are available from the corresponding author upon reasonable request.
Conflicts of Interest
The authors declare no conflicts of interest.
References
- Thombare, N.; Jha, U.; Mishra, S.; Siddiqui, M.Z. Guar Gum as a Promising Starting Material for Diverse Applications: A Review. Int. J. Biol. Macromol. 2016, 88, 361–372. [Google Scholar] [CrossRef] [PubMed]
- Naoumkina, M.; Torres-Jerez, I.; Allen, S.; He, J.; Zhao, P.X.; Dixon, R.A.; May, G.D. Analysis of cDNA Libraries from Developing Seeds of Guar (Cyamopsis Tetragonoloba (L.) Taub). BMC Plant Biol. 2007, 7, 62. [Google Scholar] [CrossRef] [PubMed]
- Chaudhury, A.; Kaila, T.; Gaikwad, K. Elucidation of Galactomannan Biosynthesis Pathway Genes through Transcriptome Sequencing of Seeds Collected at Different Developmental Stages of Commercially Important Indian Varieties of Cluster Bean (Cyamopsis Tetragonoloba L.). Sci. Rep. 2019, 9, 11539. [Google Scholar] [CrossRef]
- Hu, H.; Wang, H.; Zhang, Y.; Kan, B.; Ding, Y.; Huang, J. Characterization of Genes in Guar Gum Biosynthesis Based on Quantitative RNA-Sequencing in Guar Bean (Cyamopsis Tetragonoloba). Sci. Rep. 2019, 9, 10991. [Google Scholar] [CrossRef] [PubMed]
- Sharma, S.; Tyagi, A.; Srivastava, H.; Ramakrishna, G.; Sharma, P.; Sevanthi, A.M.; Solanke, A.U.; Sharma, R.; Singh, N.K.; Sharma, T.R.; et al. Exploring the Edible Gum (Galactomannan) Biosynthesis and Its Regulation during Pod Developmental Stages in Clusterbean Using Comparative Transcriptomic Approach. Sci. Rep. 2021, 11, 4000. [Google Scholar] [CrossRef]
- Gaikwad, K.; Ramakrishna, G.; Srivastava, H.; Saxena, S.; Kaila, T.; Tyagi, A.; Sharma, P.; Sharma, S.; Sharma, R.; Mahla, H.R.; et al. The Chromosome-Scale Genome Assembly of Cluster Bean Provides Molecular Insight into Edible Gum (Galactomannan) Biosynthesis Family Genes. Sci. Rep. 2023, 13, 9941. [Google Scholar] [CrossRef]
- Rawal, H.C.; Kumar, S.; Mithra S V, A.; Solanke, A.U.; Nigam, D.; Saxena, S.; Tyagi, A.; V, S.; Yadav, N.R.; Kalia, P.; et al. High Quality Unigenes and Microsatellite Markers from Tissue Specific Transcriptome and Development of a Database in Clusterbean (Cyamopsis Tetragonoloba, L. Taub). Genes 2017, 8, 313. [Google Scholar] [CrossRef]
- Thakur, O.; Randhawa, G.S. Identification and Characterization of SSR, SNP and InDel Molecular Markers from RNA-Seq Data of Guar (Cyamopsis Tetragonoloba, L. Taub.) Roots. BMC Genomics 2018, 19, 951. [Google Scholar] [CrossRef]
- Grigoreva, E.; Barbitoff, Y.; Changalidi, A.; Karzhaev, D.; Volkov, V.; Shadrina, V.; Safronycheva, E.; Ben, C.; Gentzbittel, L.; Potokina, E. Development of SNP Set for the Marker-Assisted Selection of Guar (Cyamopsis Tetragonoloba (L.) Taub.) Based on a Custom Reference Genome Assembly. Plants Basel Switz. 2021, 10, 2063. [Google Scholar] [CrossRef]
- Arkhimandritova, S.; Shavarda, A.; Potokina, E. Key Metabolites Associated with the Onset of Flowering of Guar Genotypes (Cyamopsis Tetragonoloba (L.) Taub). BMC Plant Biol. 2020, 20, 291. [Google Scholar] [CrossRef]
- Grigoreva, E.; Tkachenko, A.; Arkhimandritova, S.; Beatovic, A.; Ulianich, P.; Volkov, V.; Karzhaev, D.; Ben, C.; Gentzbittel, L.; Potokina, E. Identification of Key Metabolic Pathways and Biomarkers Underlying Flowering Time of Guar (Cyamopsis Tetragonoloba (L.) Taub.) via Integrated Transcriptome-Metabolome Analysis. Genes 2021, 12, 952. [Google Scholar] [CrossRef] [PubMed]
- Kaila, T.; Chaduvla, P.K.; Rawal, H.C.; Saxena, S.; Tyagi, A.; Mithra, S.V.A.; Solanke, A.U.; Kalia, P.; Sharma, T.R.; Singh, N.K.; et al. Chloroplast Genome Sequence of Clusterbean (Cyamopsis Tetragonoloba L.): Genome Structure and Comparative Analysis. Genes 2017, 8, 212. [Google Scholar] [CrossRef] [PubMed]
- Altschul, S.F.; Gish, W.; Miller, W.; Myers, E.W.; Lipman, D.J. Basic Local Alignment Search Tool. J. Mol. Biol. 1990, 215, 403–410. [Google Scholar] [CrossRef]
- Li, J.-H.; Li, M.-J.; Li, W.-L.; Li, X.-Y.; Ma, Y.-B.; Tan, X.; Wang, Y.; Li, C.-X.; Ma, X.-R. Leguminous Industrial Crop Guar (Cyamopsis Tetragonoloba): The Chromosome-Level Reference Genome de Novo Assembly. Ind. Crops Prod. 2024, 216, 118748. [Google Scholar] [CrossRef]
- Brůna, T.; Hoff, K.J.; Lomsadze, A.; Stanke, M.; Borodovsky, M. BRAKER2: Automatic Eukaryotic Genome Annotation with GeneMark-EP+ and AUGUSTUS Supported by a Protein Database. NAR Genomics Bioinforma. 2021, 3, lqaa108. [Google Scholar] [CrossRef]
- Brůna, T.; Lomsadze, A.; Borodovsky, M. GeneMark-EP+: Eukaryotic Gene Prediction with Self-Training in the Space of Genes and Proteins. NAR Genomics Bioinforma. 2020, 2, lqaa026. [Google Scholar] [CrossRef]
- Stanke, M.; Steinkamp, R.; Waack, S.; Morgenstern, B. AUGUSTUS: A Web Server for Gene Finding in Eukaryotes. Nucleic Acids Res. 2004, 32, W309–312. [Google Scholar] [CrossRef]
- Boneva, S.; Schlecht, A.; Böhringer, D.; Mittelviefhaus, H.; Reinhard, T.; Agostini, H.; Auw-Haedrich, C.; Schlunck, G.; Wolf, J.; Lange, C. 3′ MACE RNA-Sequencing Allows for Transcriptome Profiling in Human Tissue Samples after Long-Term Storage. Lab. Invest. 2020, 100, 1345–1355. [Google Scholar] [CrossRef]
- Manni, M.; Berkeley, M.R.; Seppey, M.; Simão, F.A.; Zdobnov, E.M. BUSCO Update: Novel and Streamlined Workflows along with Broader and Deeper Phylogenetic Coverage for Scoring of Eukaryotic, Prokaryotic, and Viral Genomes. Mol. Biol. Evol. 2021, 38, 4647–4654. [Google Scholar] [CrossRef]
- Cantalapiedra, C.P.; Hernández-Plaza, A.; Letunic, I.; Bork, P.; Huerta-Cepas, J. eggNOG-Mapper v2: Functional Annotation, Orthology Assignments, and Domain Prediction at the Metagenomic Scale. Mol. Biol. Evol. 2021, 38, 5825–5829. [Google Scholar] [CrossRef]
- Aleksander, S.A.; Balhoff, J.; Carbon, S.; Cherry, J.M.; Drabkin, H.J.; Ebert, D.; Feuermann, M.; Gaudet, P.; Harris, N.L.; et al.; The Gene Ontology Consortium The Gene Ontology Knowledgebase in 2023. GENETICS 2023, 224, iyad031. [Google Scholar] [CrossRef]
- Ashburner, M.; Ball, C.A.; Blake, J.A.; Botstein, D.; Butler, H.; Cherry, J.M.; Davis, A.P.; Dolinski, K.; Dwight, S.S.; Eppig, J.T.; et al. Gene Ontology: Tool for the Unification of Biology. Nat. Genet. 2000, 25, 25–29. [Google Scholar] [CrossRef] [PubMed]
- Kanehisa, M.; Goto, S. KEGG: Kyoto Encyclopedia of Genes and Genomes. Nucleic Acids Res. 2000, 28, 27–30. [Google Scholar] [CrossRef] [PubMed]
- Bolger, M.; Schwacke, R.; Usadel, B. MapMan Visualization of RNA-Seq Data Using Mercator4 Functional Annotations. In Solanum tuberosum; Dobnik, D., Gruden, K., Ramšak, Ž., Coll, A., Eds.; Methods in Molecular Biology; Springer US: New York, NY, 2021; ISBN 978-1-0716-1608-6. [Google Scholar]
- Schwacke, R.; Ponce-Soto, G.Y.; Krause, K.; Bolger, A.M.; Arsova, B.; Hallab, A.; Gruden, K.; Stitt, M.; Bolger, M.E.; Usadel, B. MapMan4: A Refined Protein Classification and Annotation Framework Applicable to Multi-Omics Data Analysis. Mol. Plant 2019, 12, 879–892. [Google Scholar] [CrossRef] [PubMed]
- SRA-toolkit. Available online: https://github.com/ncbi/sra-tools/wiki/01.-Downloading-SRA-Toolkit (accessed on 2 October 2025).
- BBMap. Available online: https://sourceforge.net/projects/bbmap/ (accessed on 2 October 2025).
- Dobin, A.; Davis, C.A.; Schlesinger, F.; Drenkow, J.; Zaleski, C.; Jha, S.; Batut, P.; Chaisson, M.; Gingeras, T.R. STAR: Ultrafast Universal RNA-Seq Aligner. Bioinforma. Oxf. Engl. 2013, 29, 15–21. [Google Scholar] [CrossRef]
- Liao, Y.; Smyth, G.K.; Shi, W. featureCounts: An Efficient General Purpose Program for Assigning Sequence Reads to Genomic Features. Bioinformatics 2014, 30, 923–930. [Google Scholar] [CrossRef]
- FLASK. Available online: https://flask.palletsprojects.com/en/stable/ (accessed on 2 October 2025).
- Thorvaldsdottir, H.; Robinson, J.T.; Mesirov, J.P. Integrative Genomics Viewer (IGV): High-Performance Genomics Data Visualization and Exploration. Brief. Bioinform. 2013, 14, 178–192. [Google Scholar] [CrossRef]
Figure 1.
(a) Distribution of annotated genes using Mercator4 by functional groups. (b) Distribution of galactomannan biosynthesis genes by functional groups.
Figure 1.
(a) Distribution of annotated genes using Mercator4 by functional groups. (b) Distribution of galactomannan biosynthesis genes by functional groups.
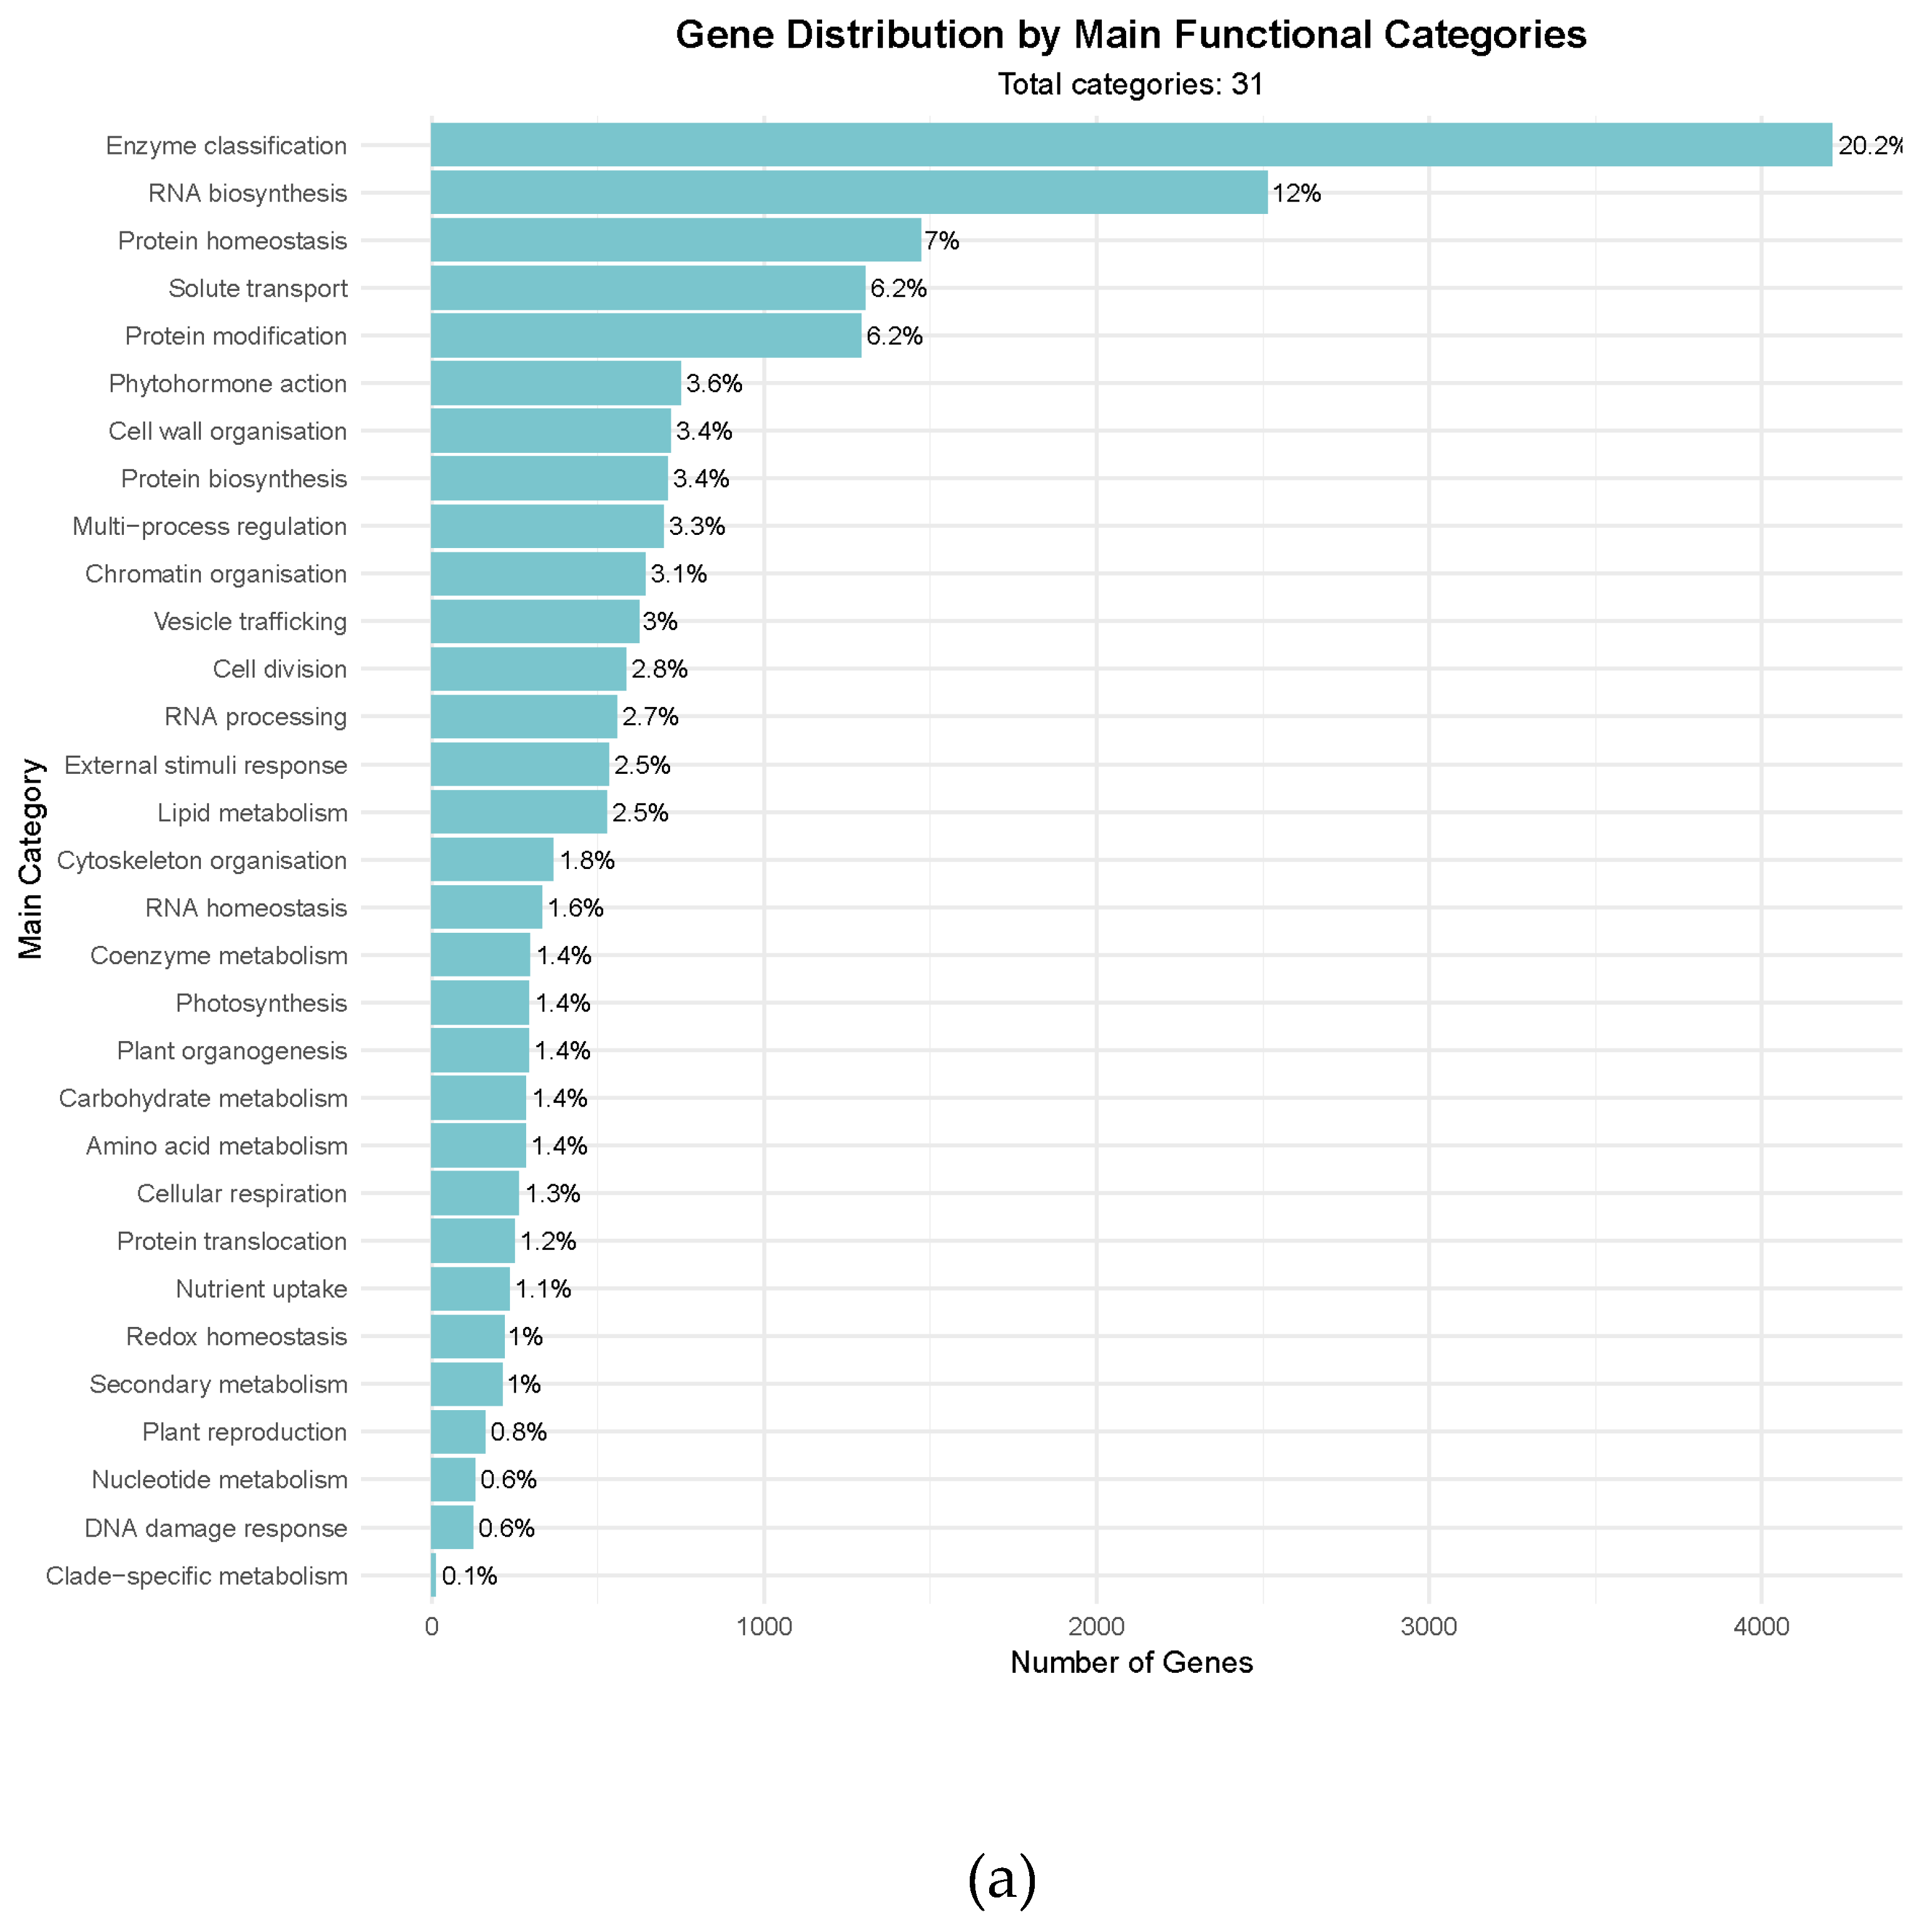
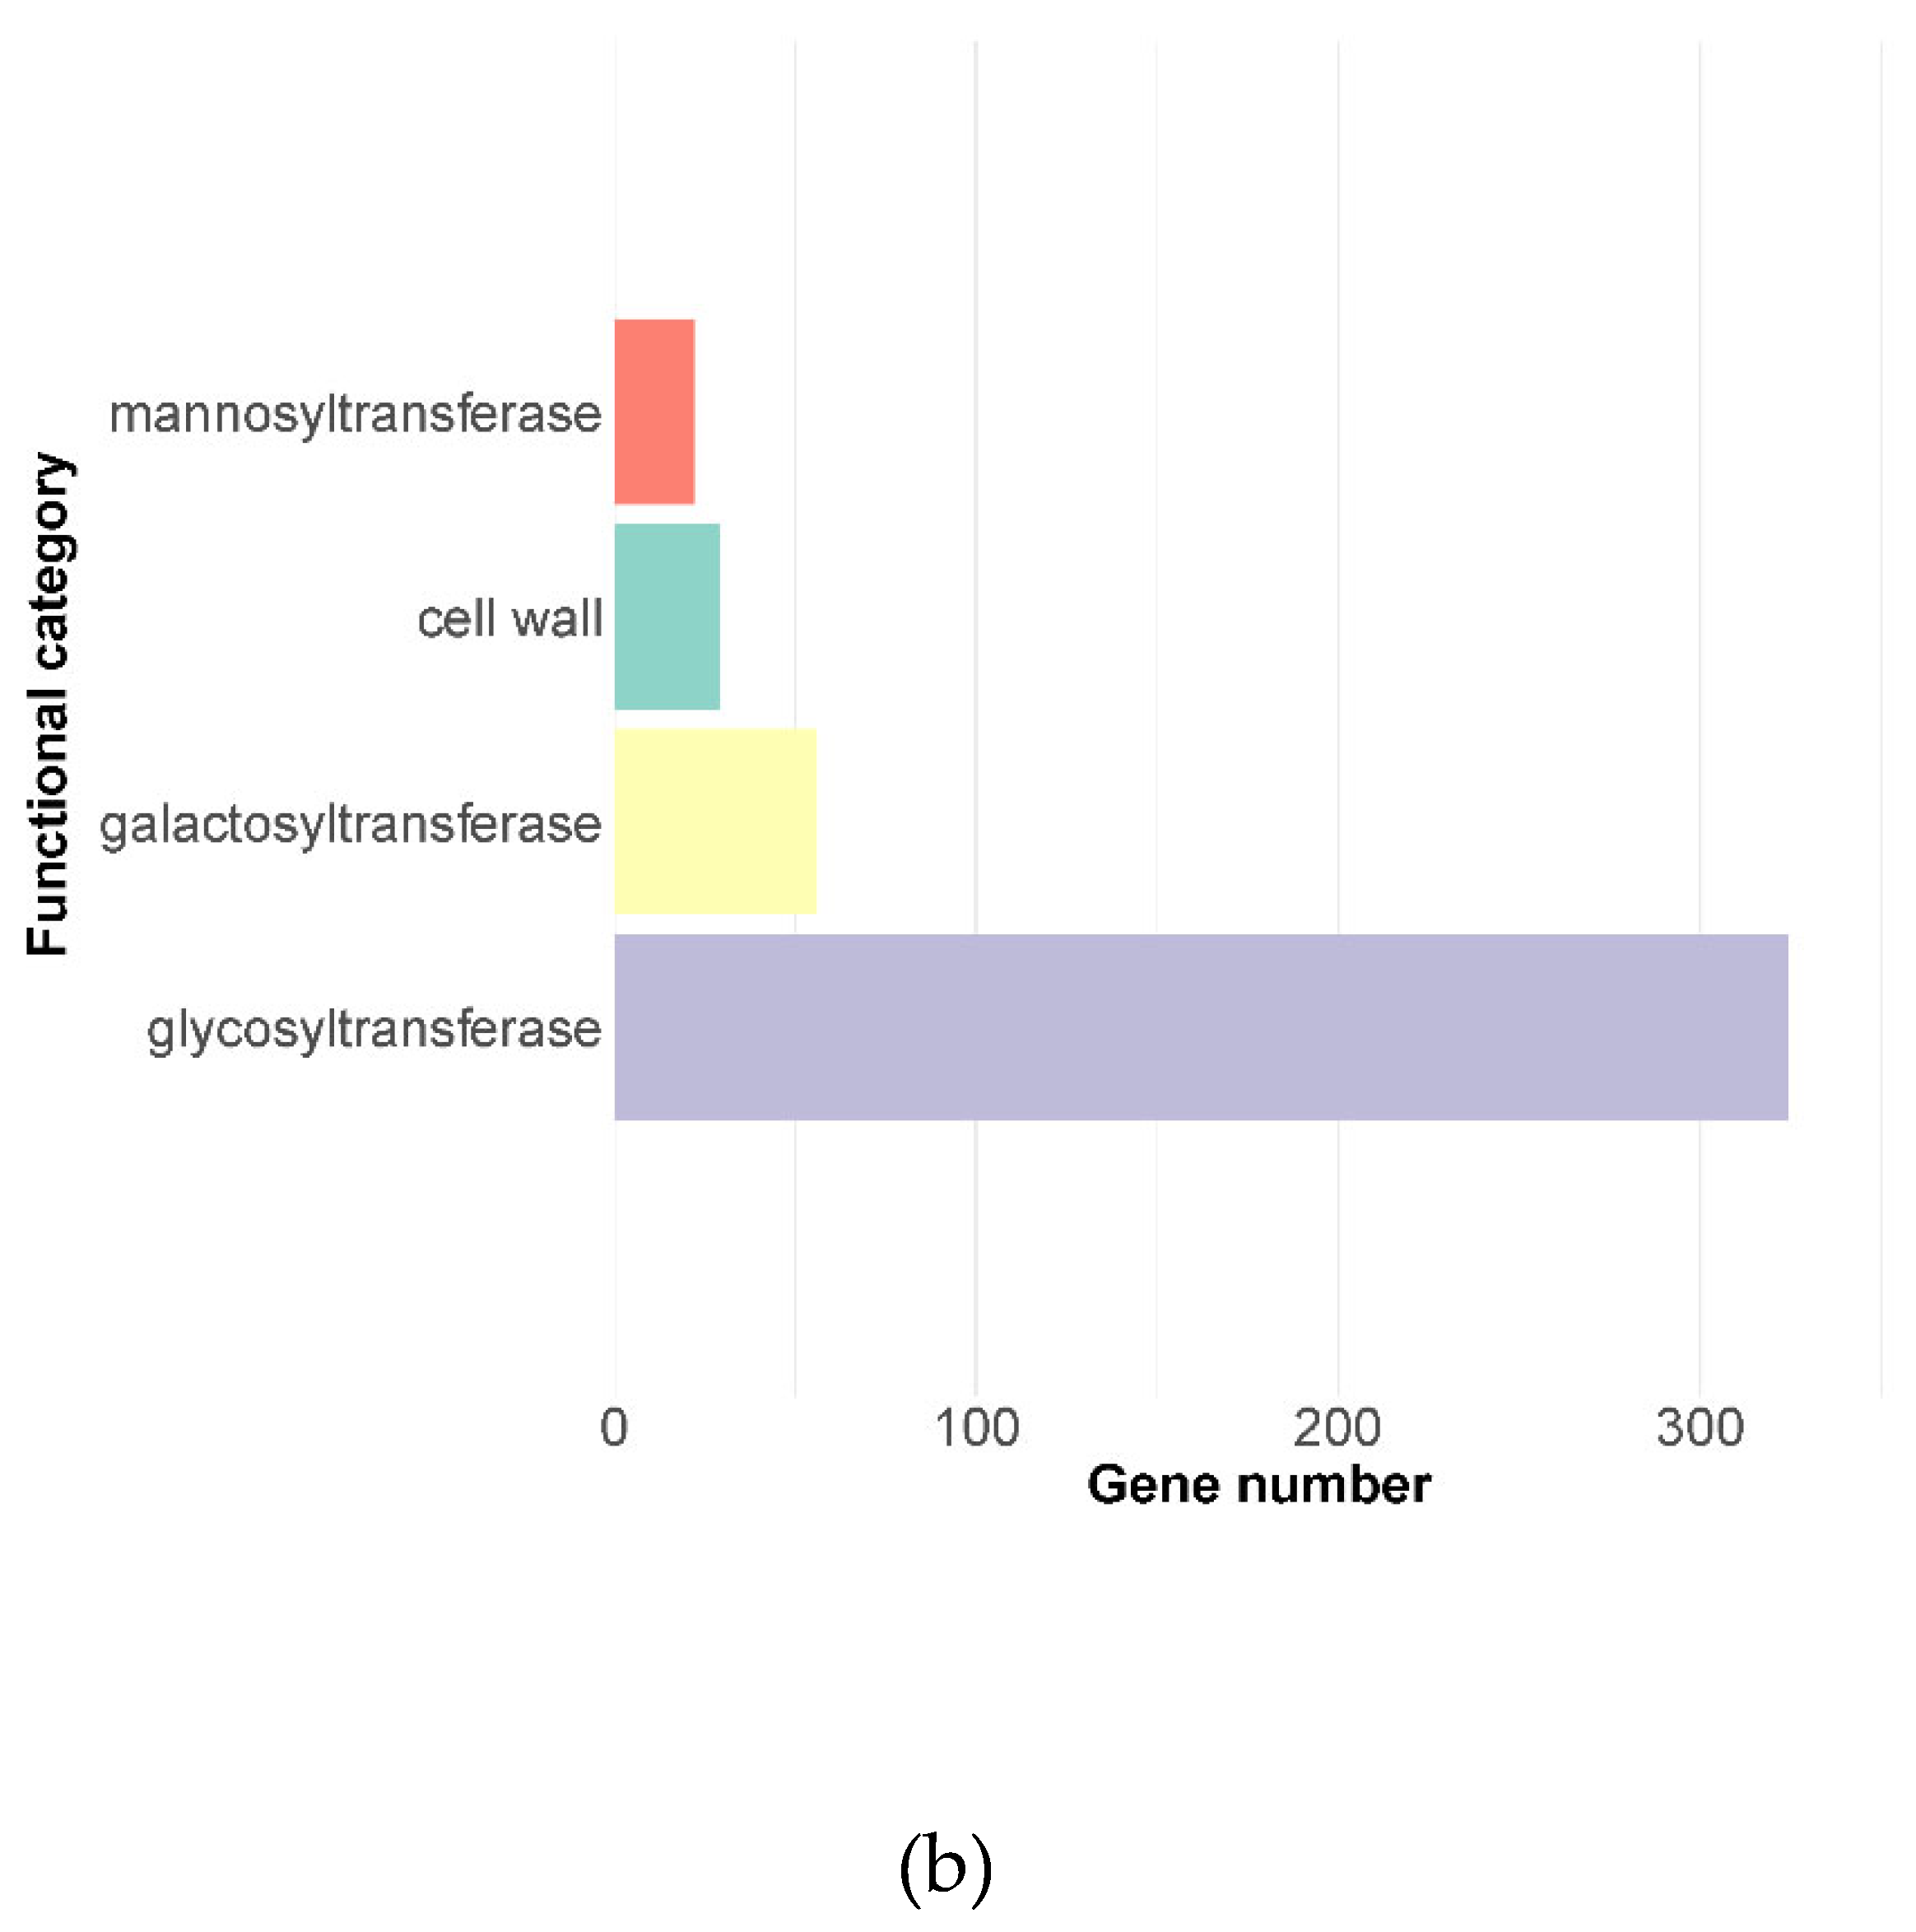
Figure 2.
Principal Component Analysis (PCA) plot of the RNA-seq samples included in the expression atlas, colored by (a) BioProject and (b) tissue.
Figure 2.
Principal Component Analysis (PCA) plot of the RNA-seq samples included in the expression atlas, colored by (a) BioProject and (b) tissue.
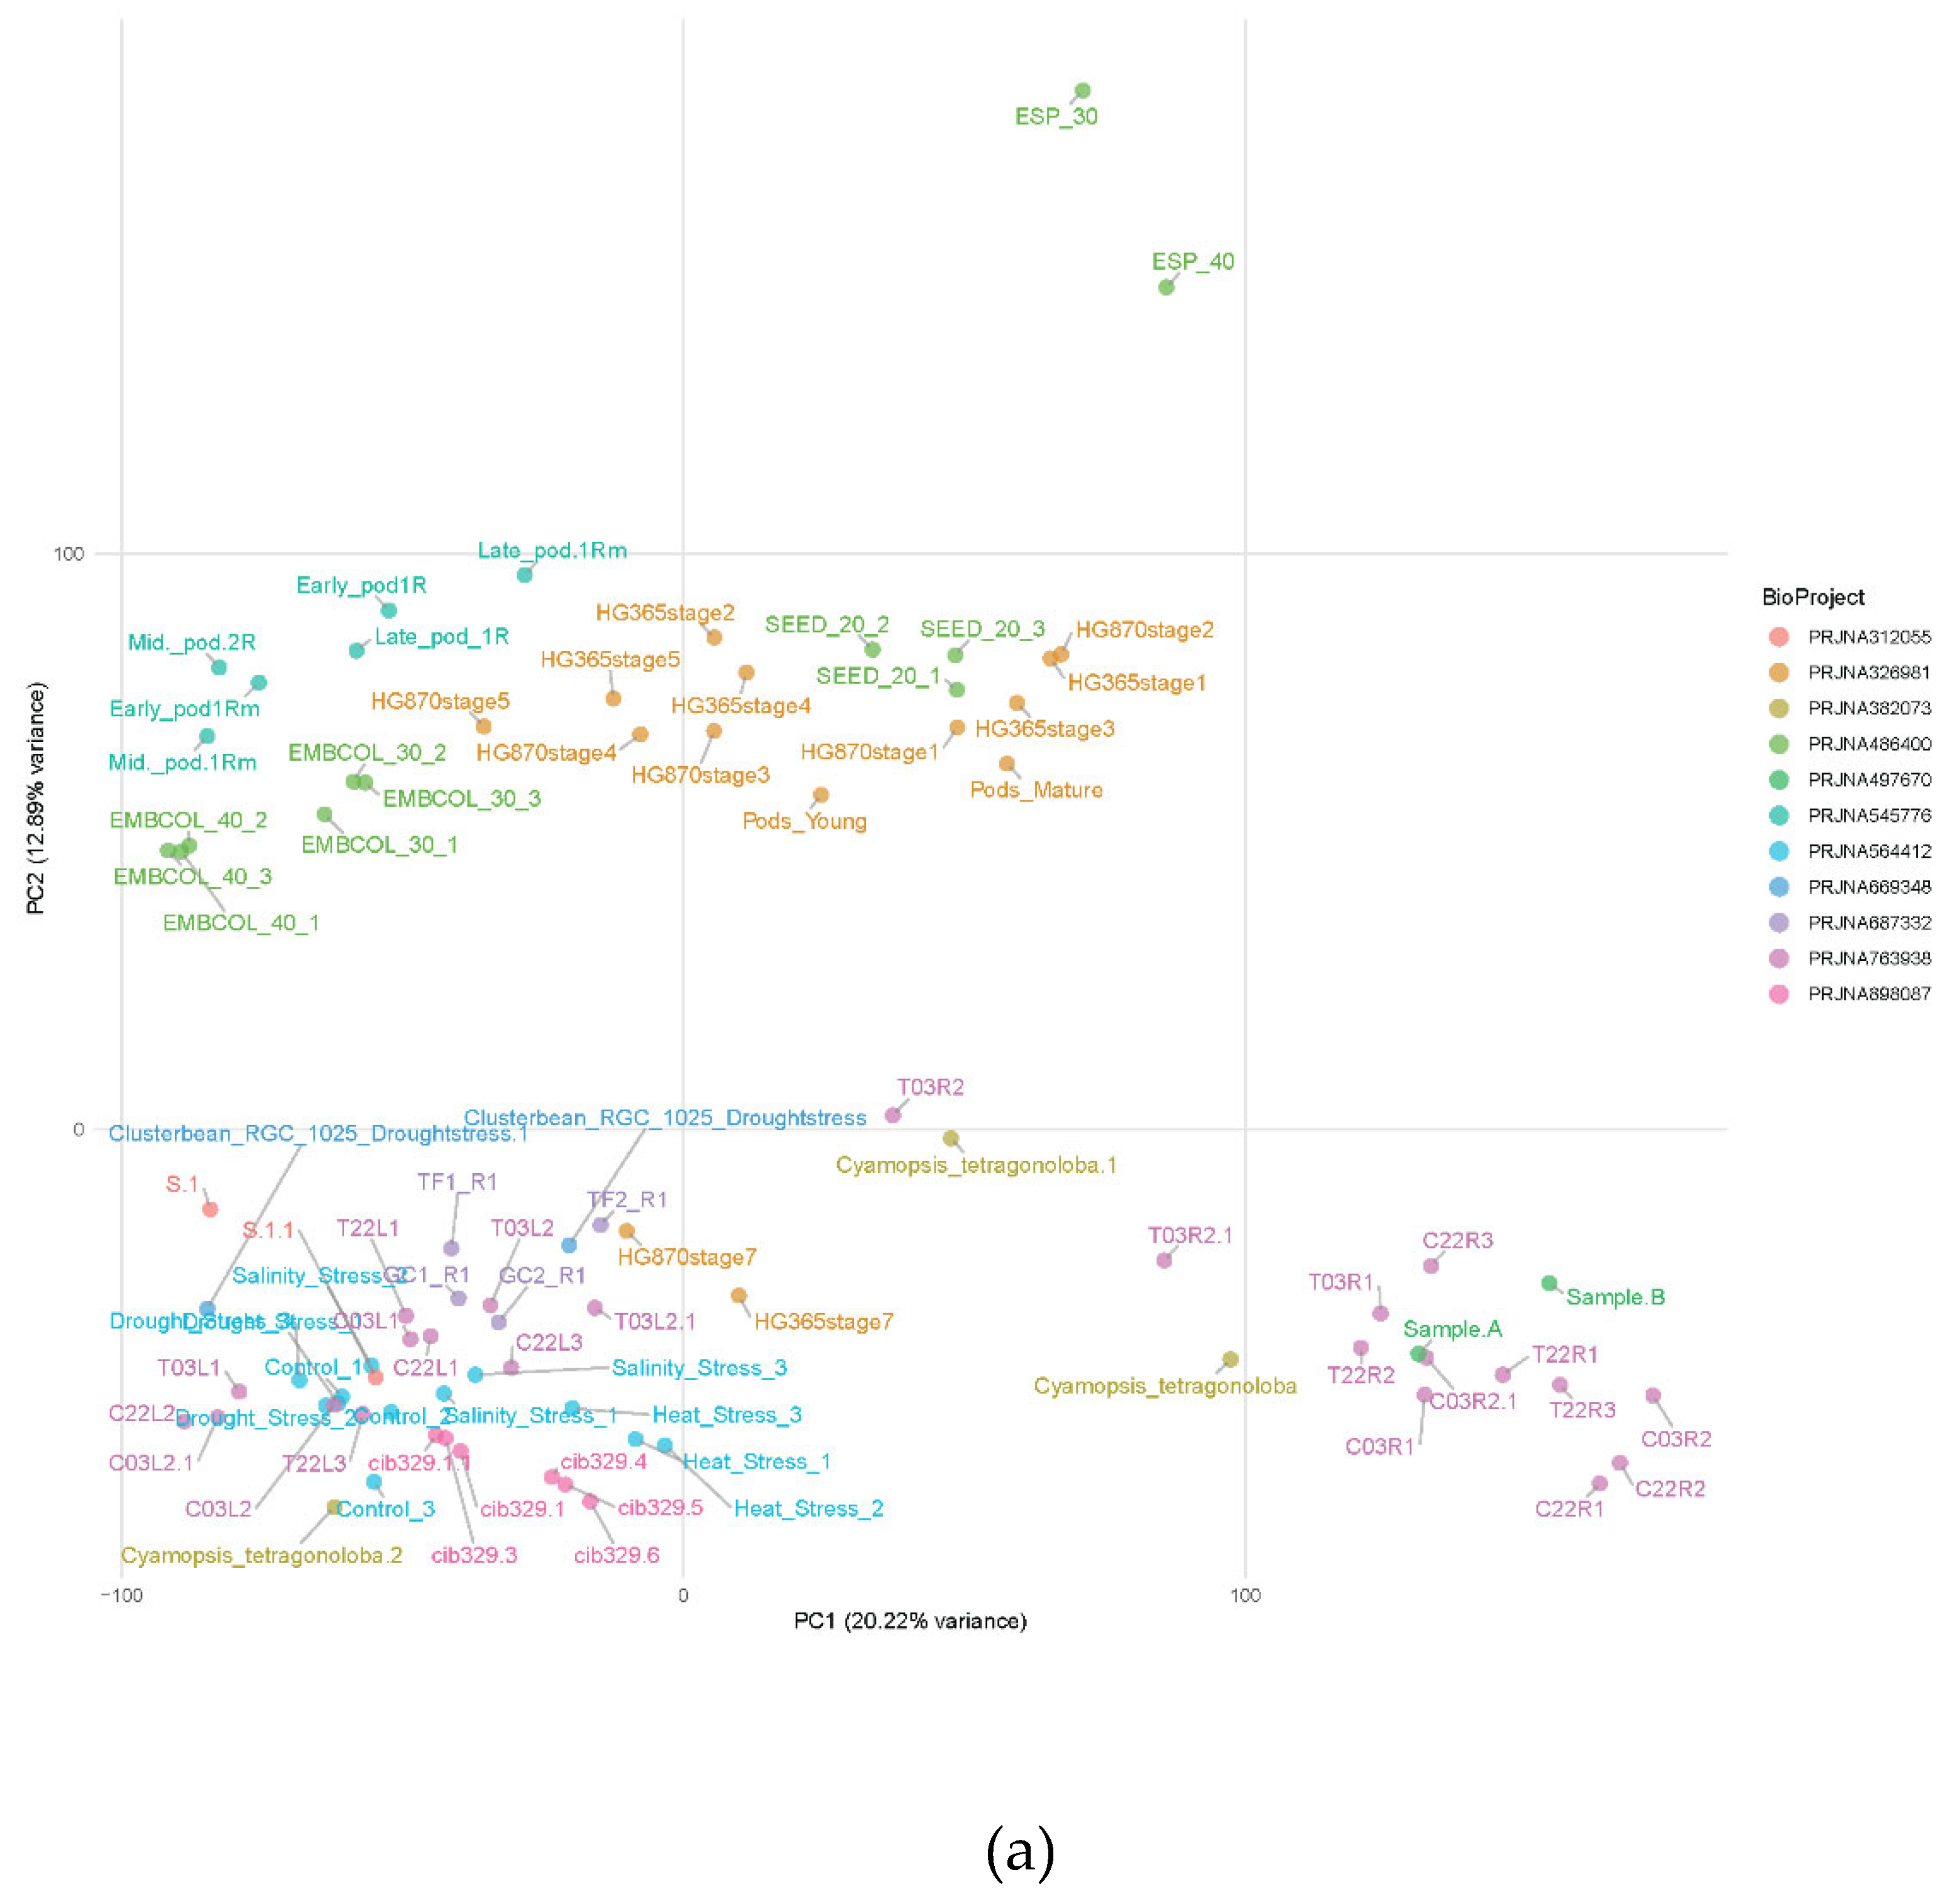
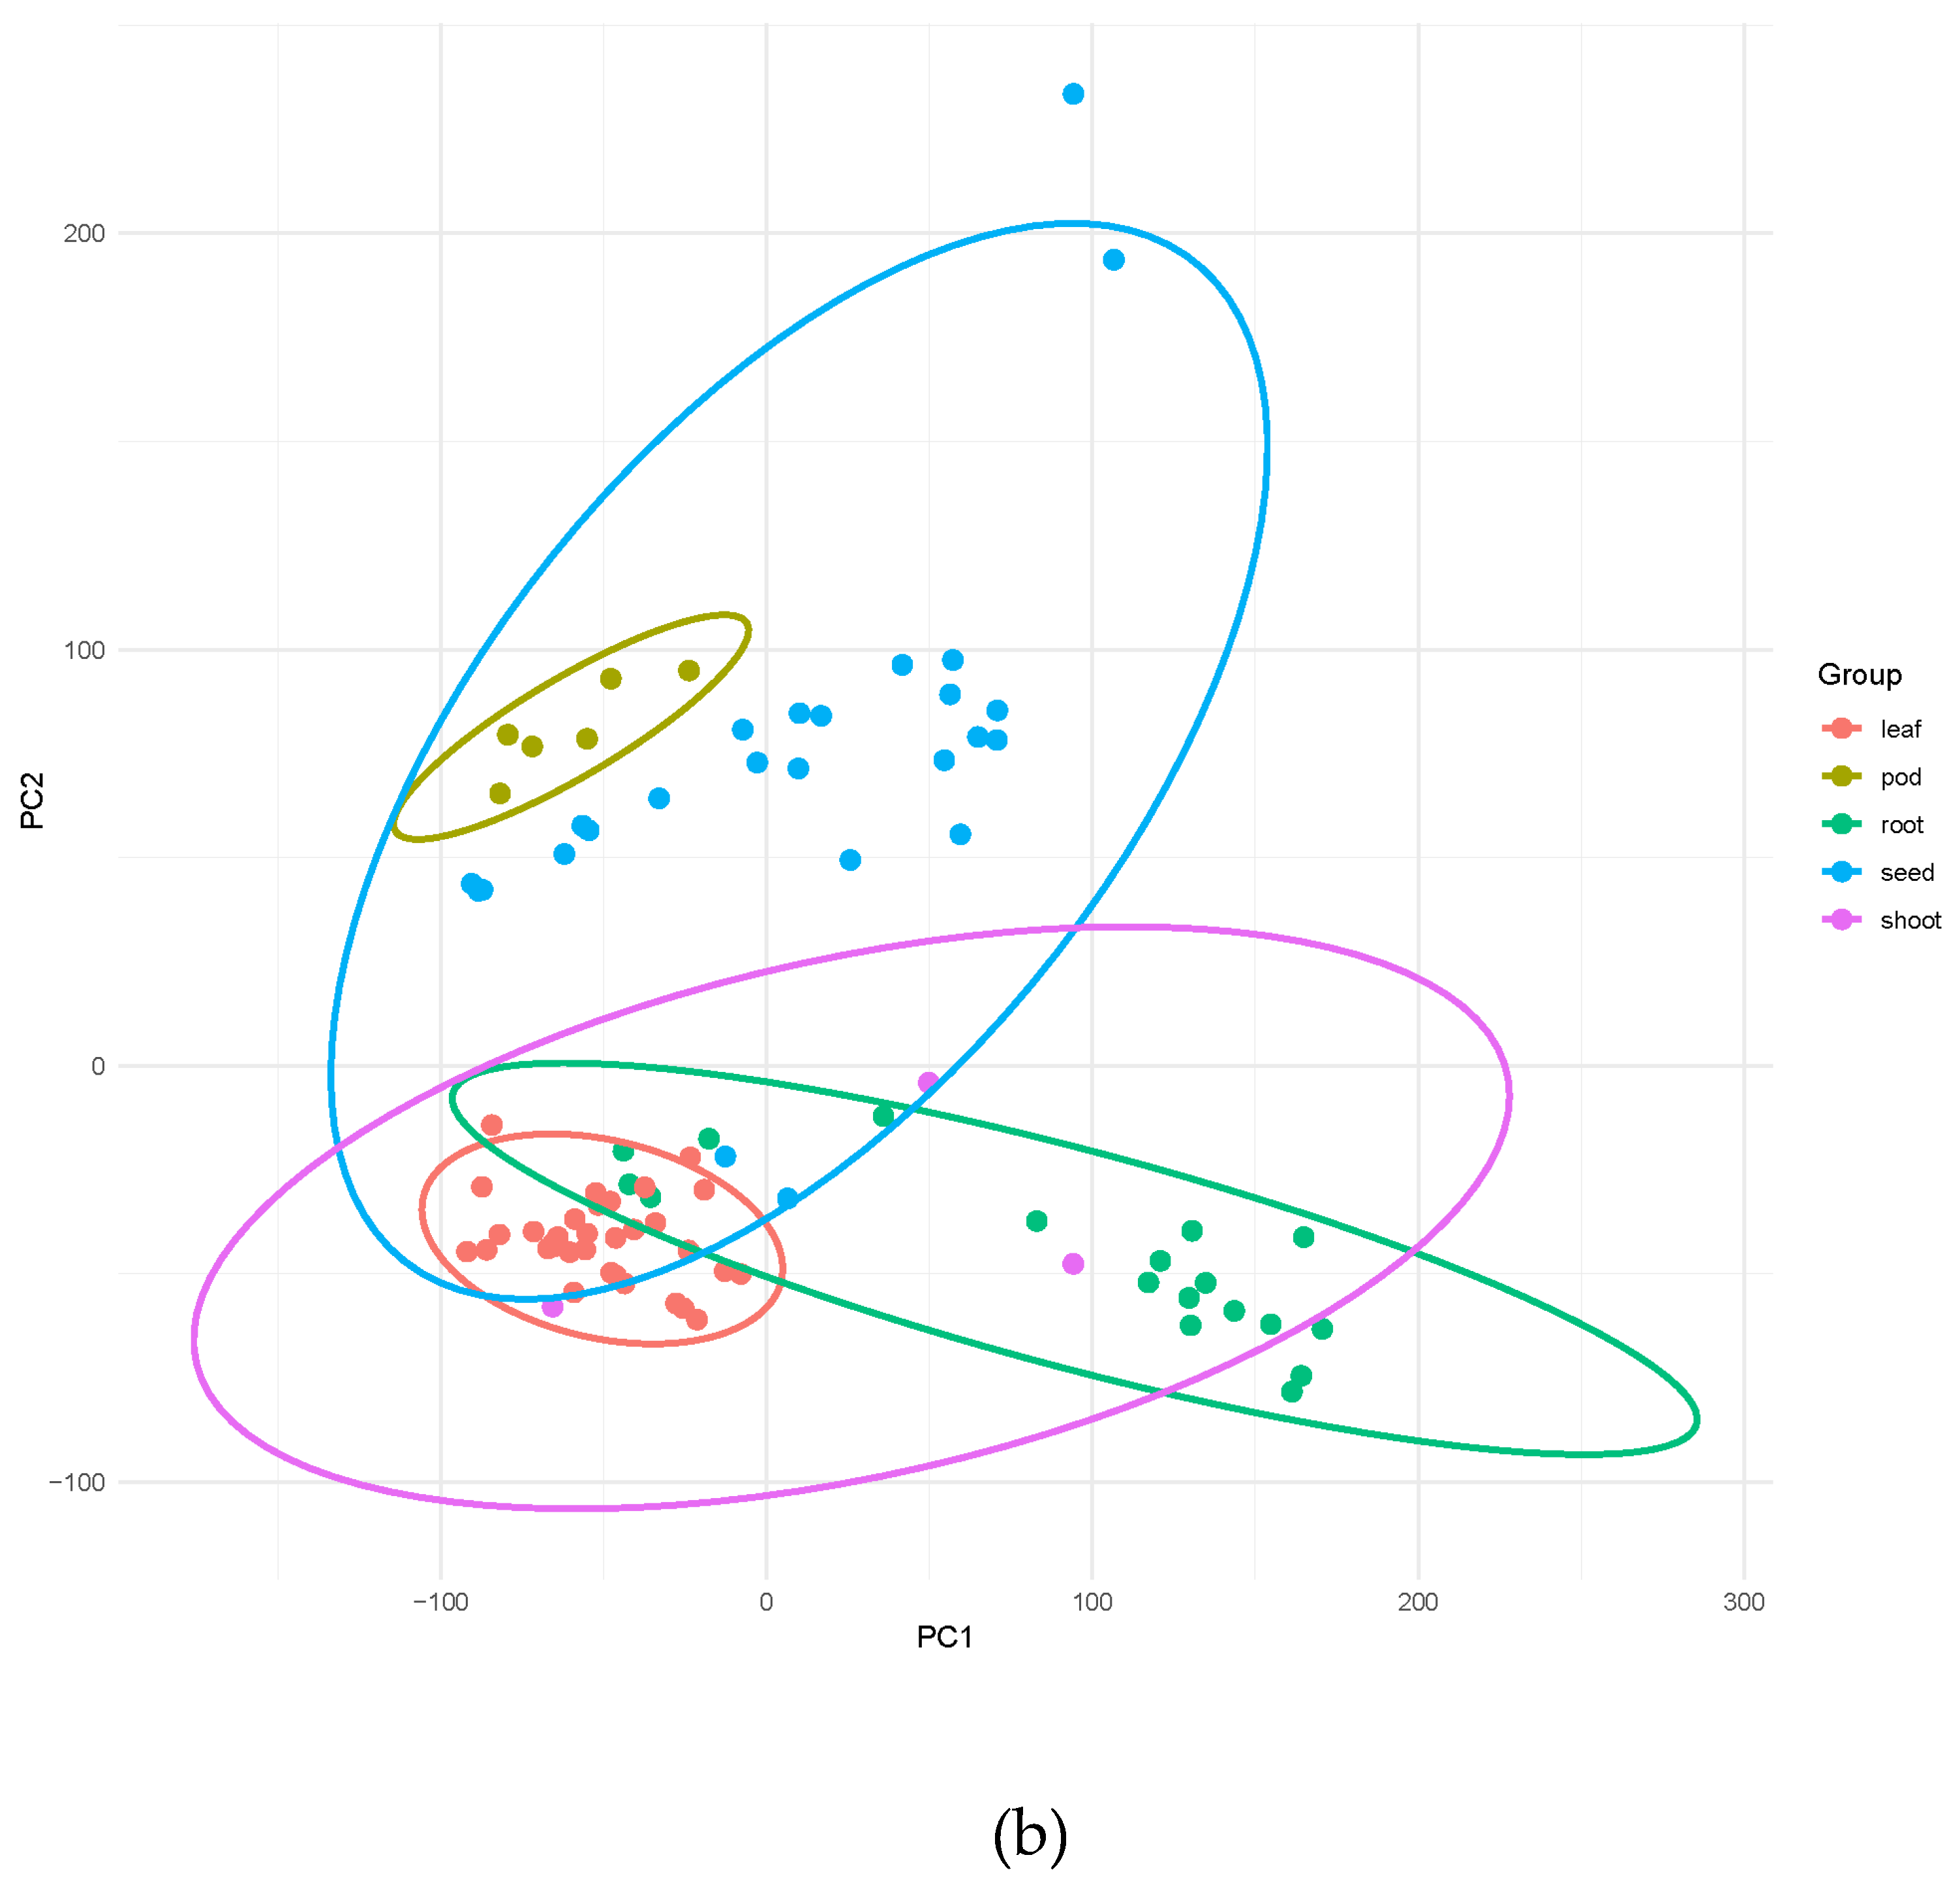
Figure 3.
A schematic representation of the key modules and data flow within the developed guar genomics web service.
Figure 3.
A schematic representation of the key modules and data flow within the developed guar genomics web service.
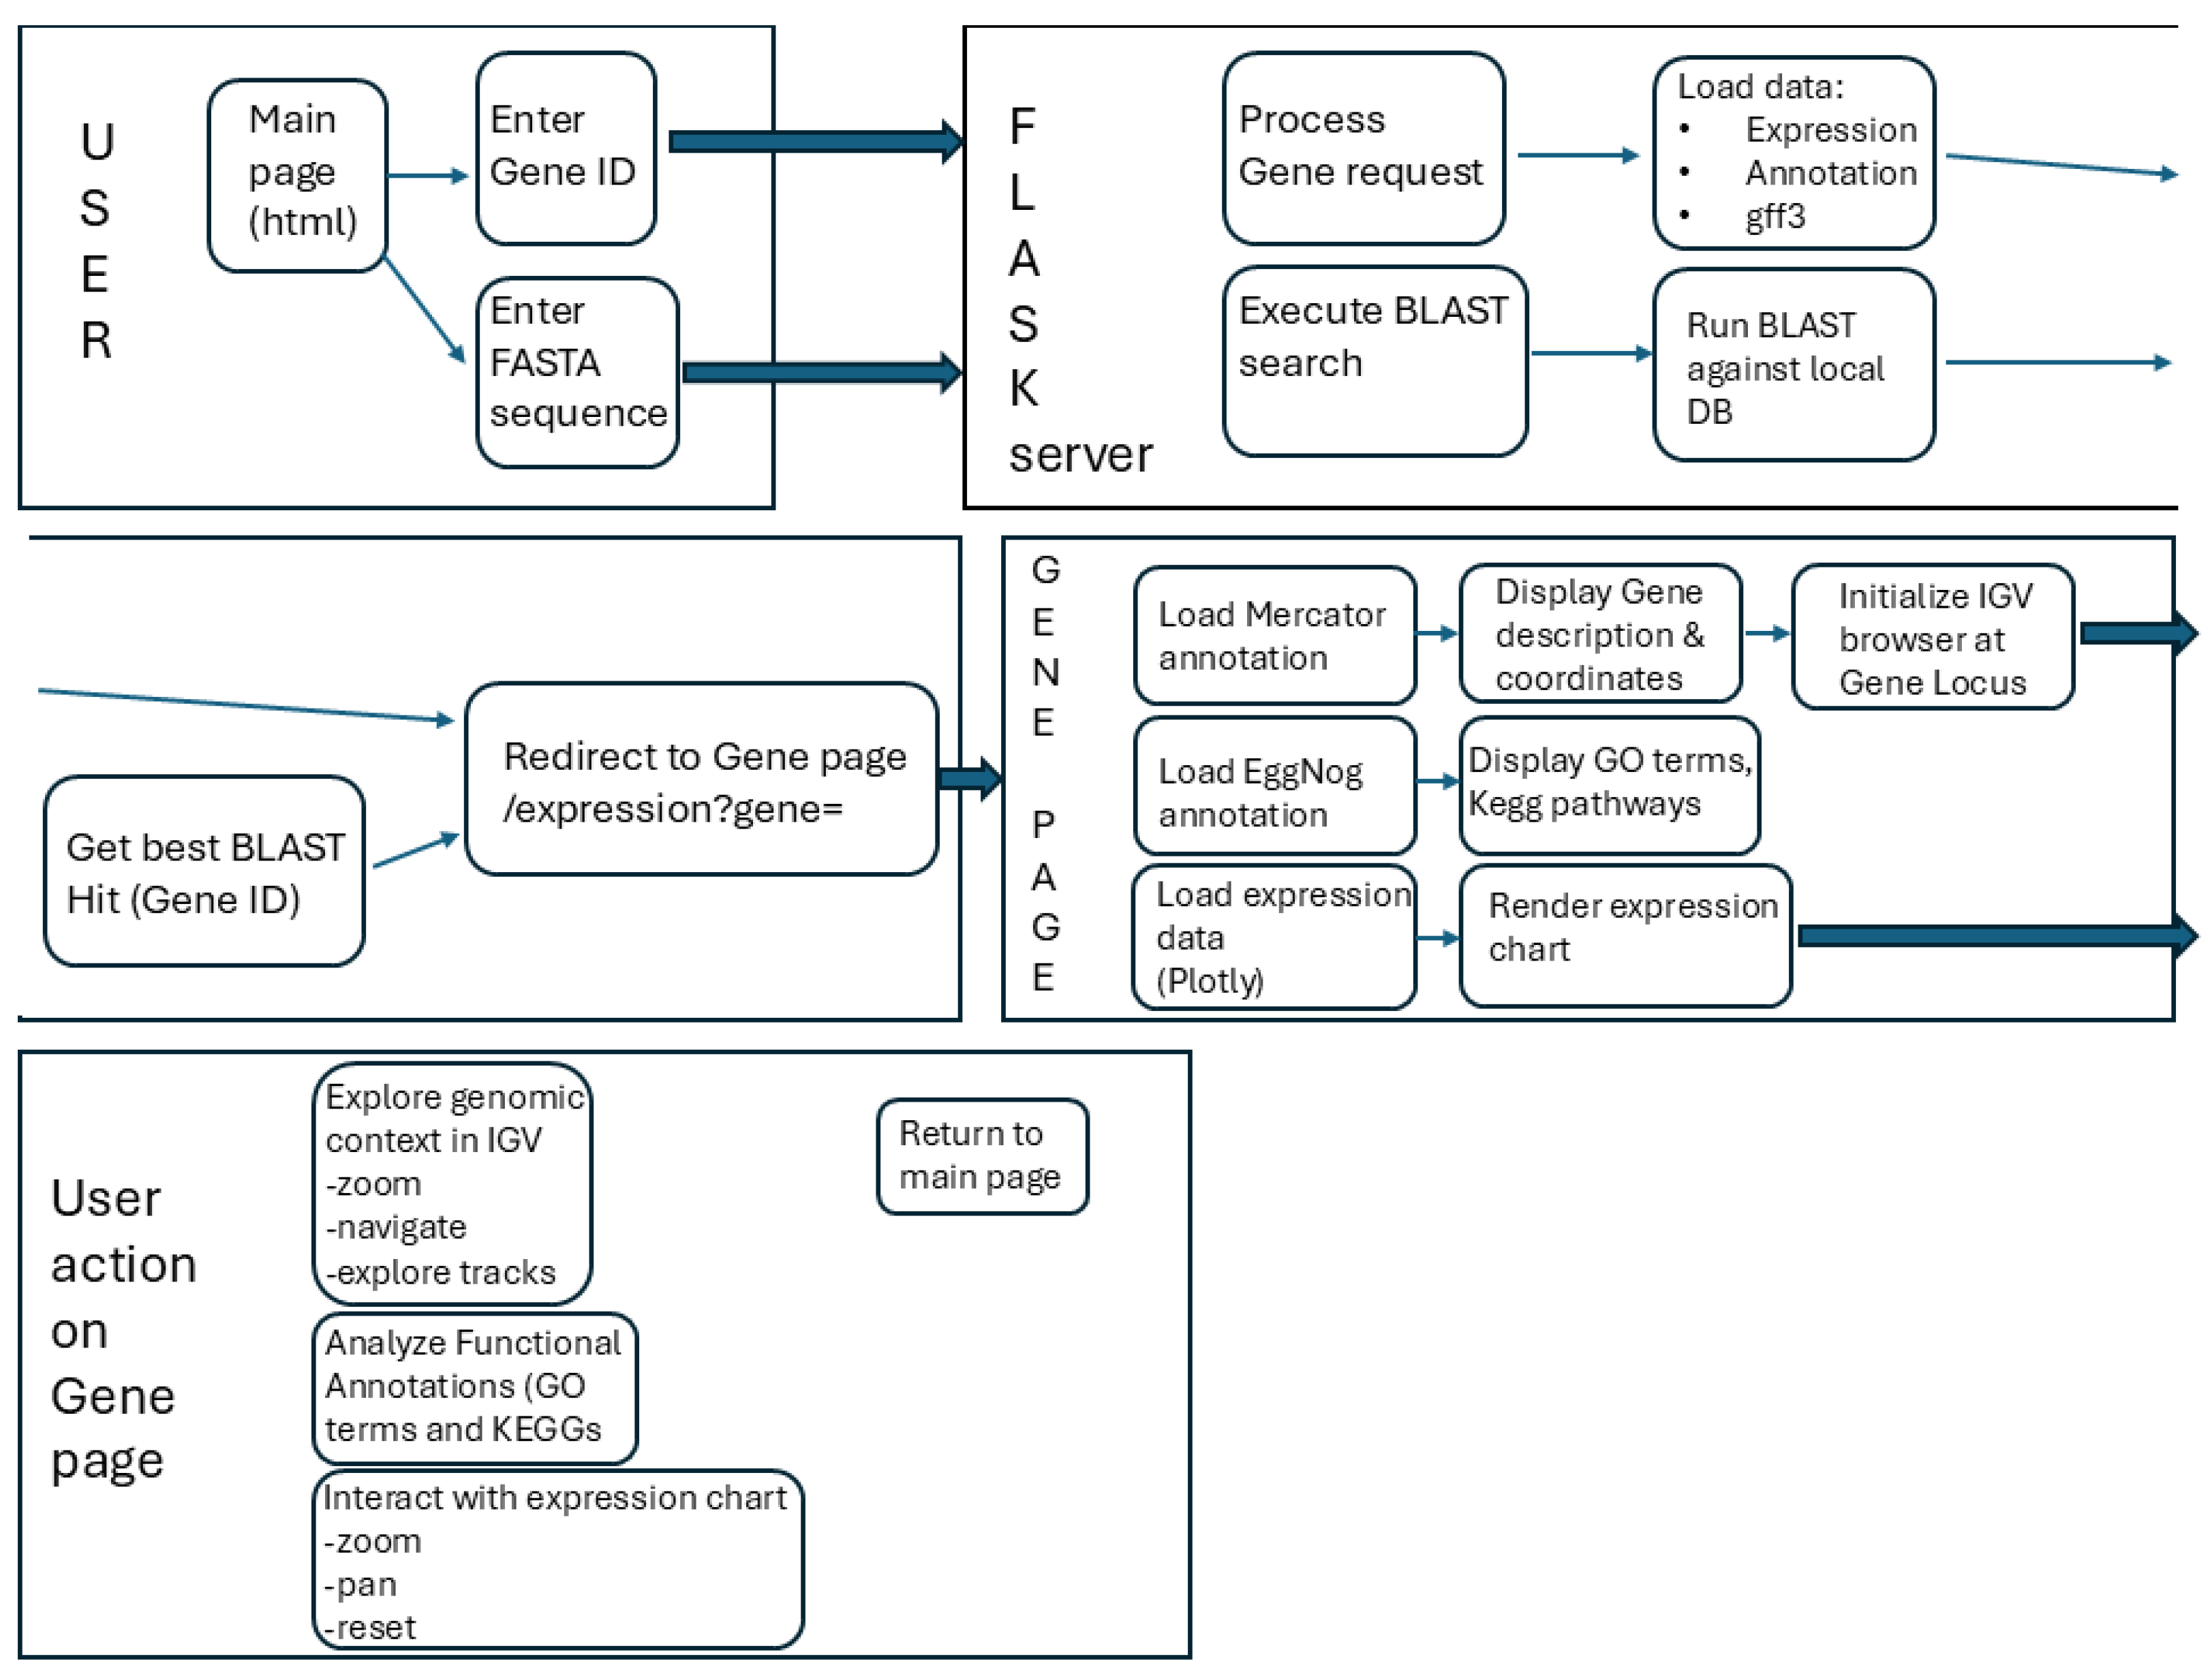
Figure 4.
(a) The start page of the resource and fields for searching for genes via identifiers or sequence. (b) Homology BLAST search results page. (c) A section with information about the functional annotation of a gene.
Figure 4.
(a) The start page of the resource and fields for searching for genes via identifiers or sequence. (b) Homology BLAST search results page. (c) A section with information about the functional annotation of a gene.
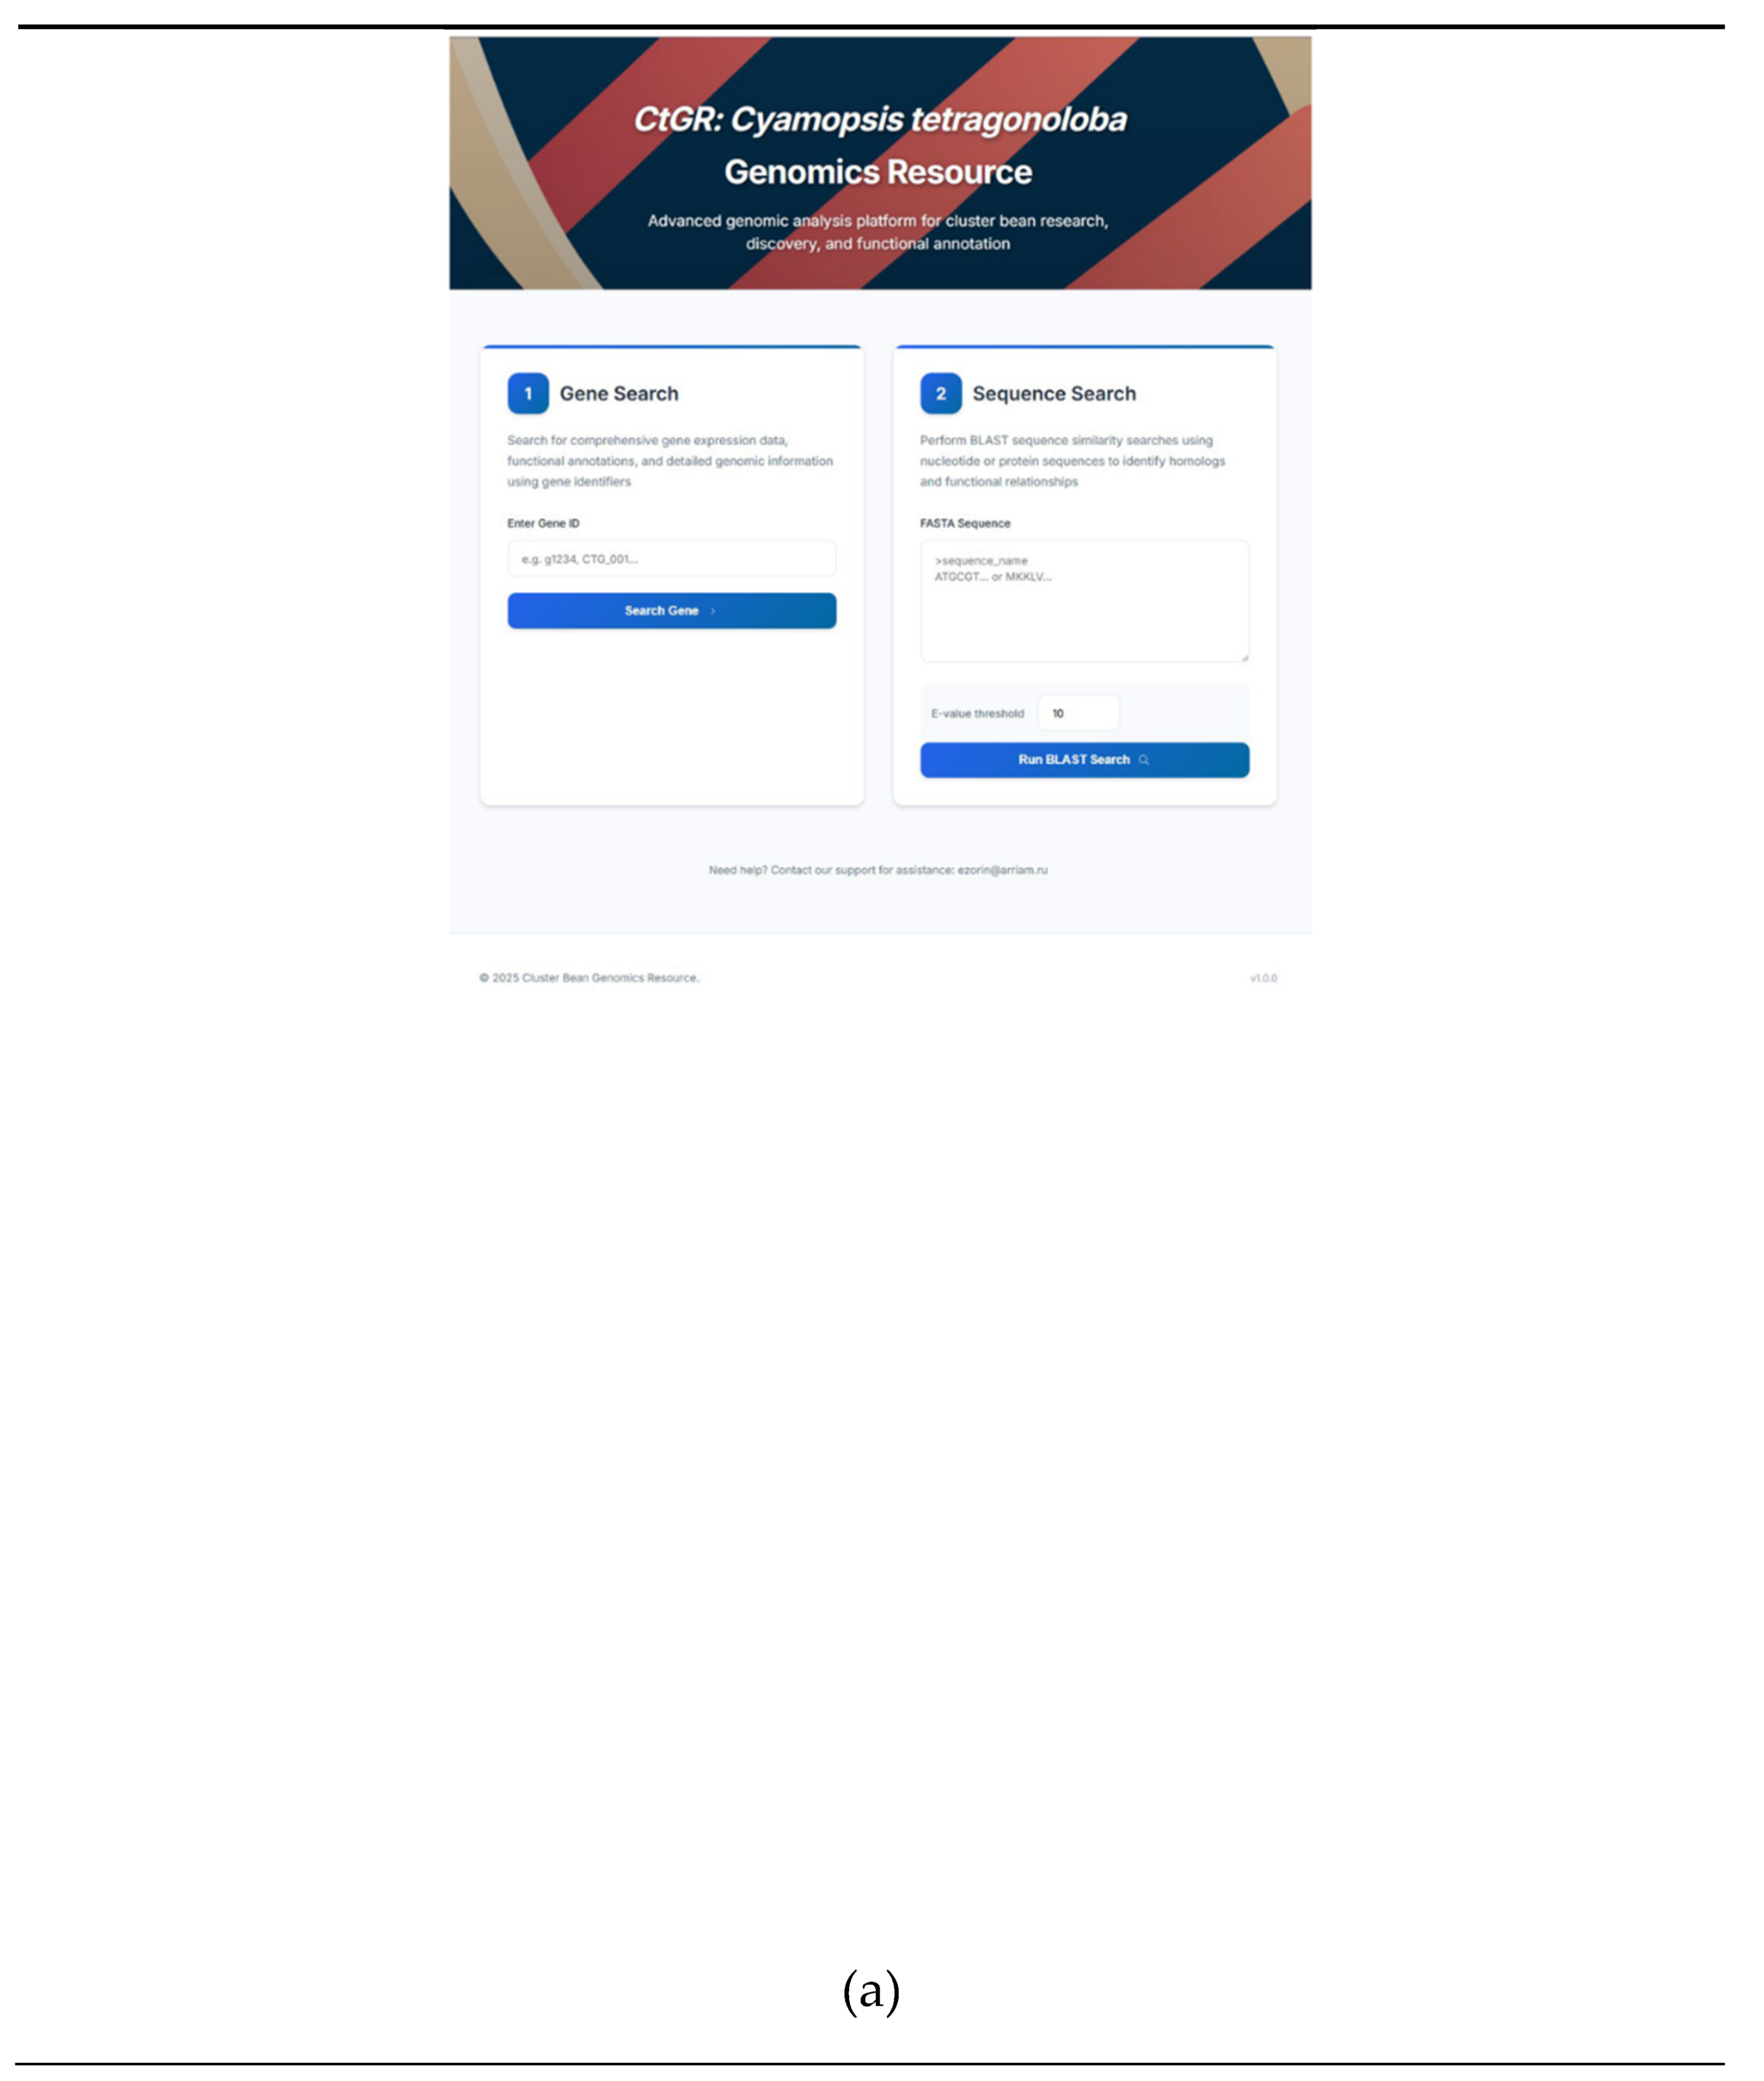
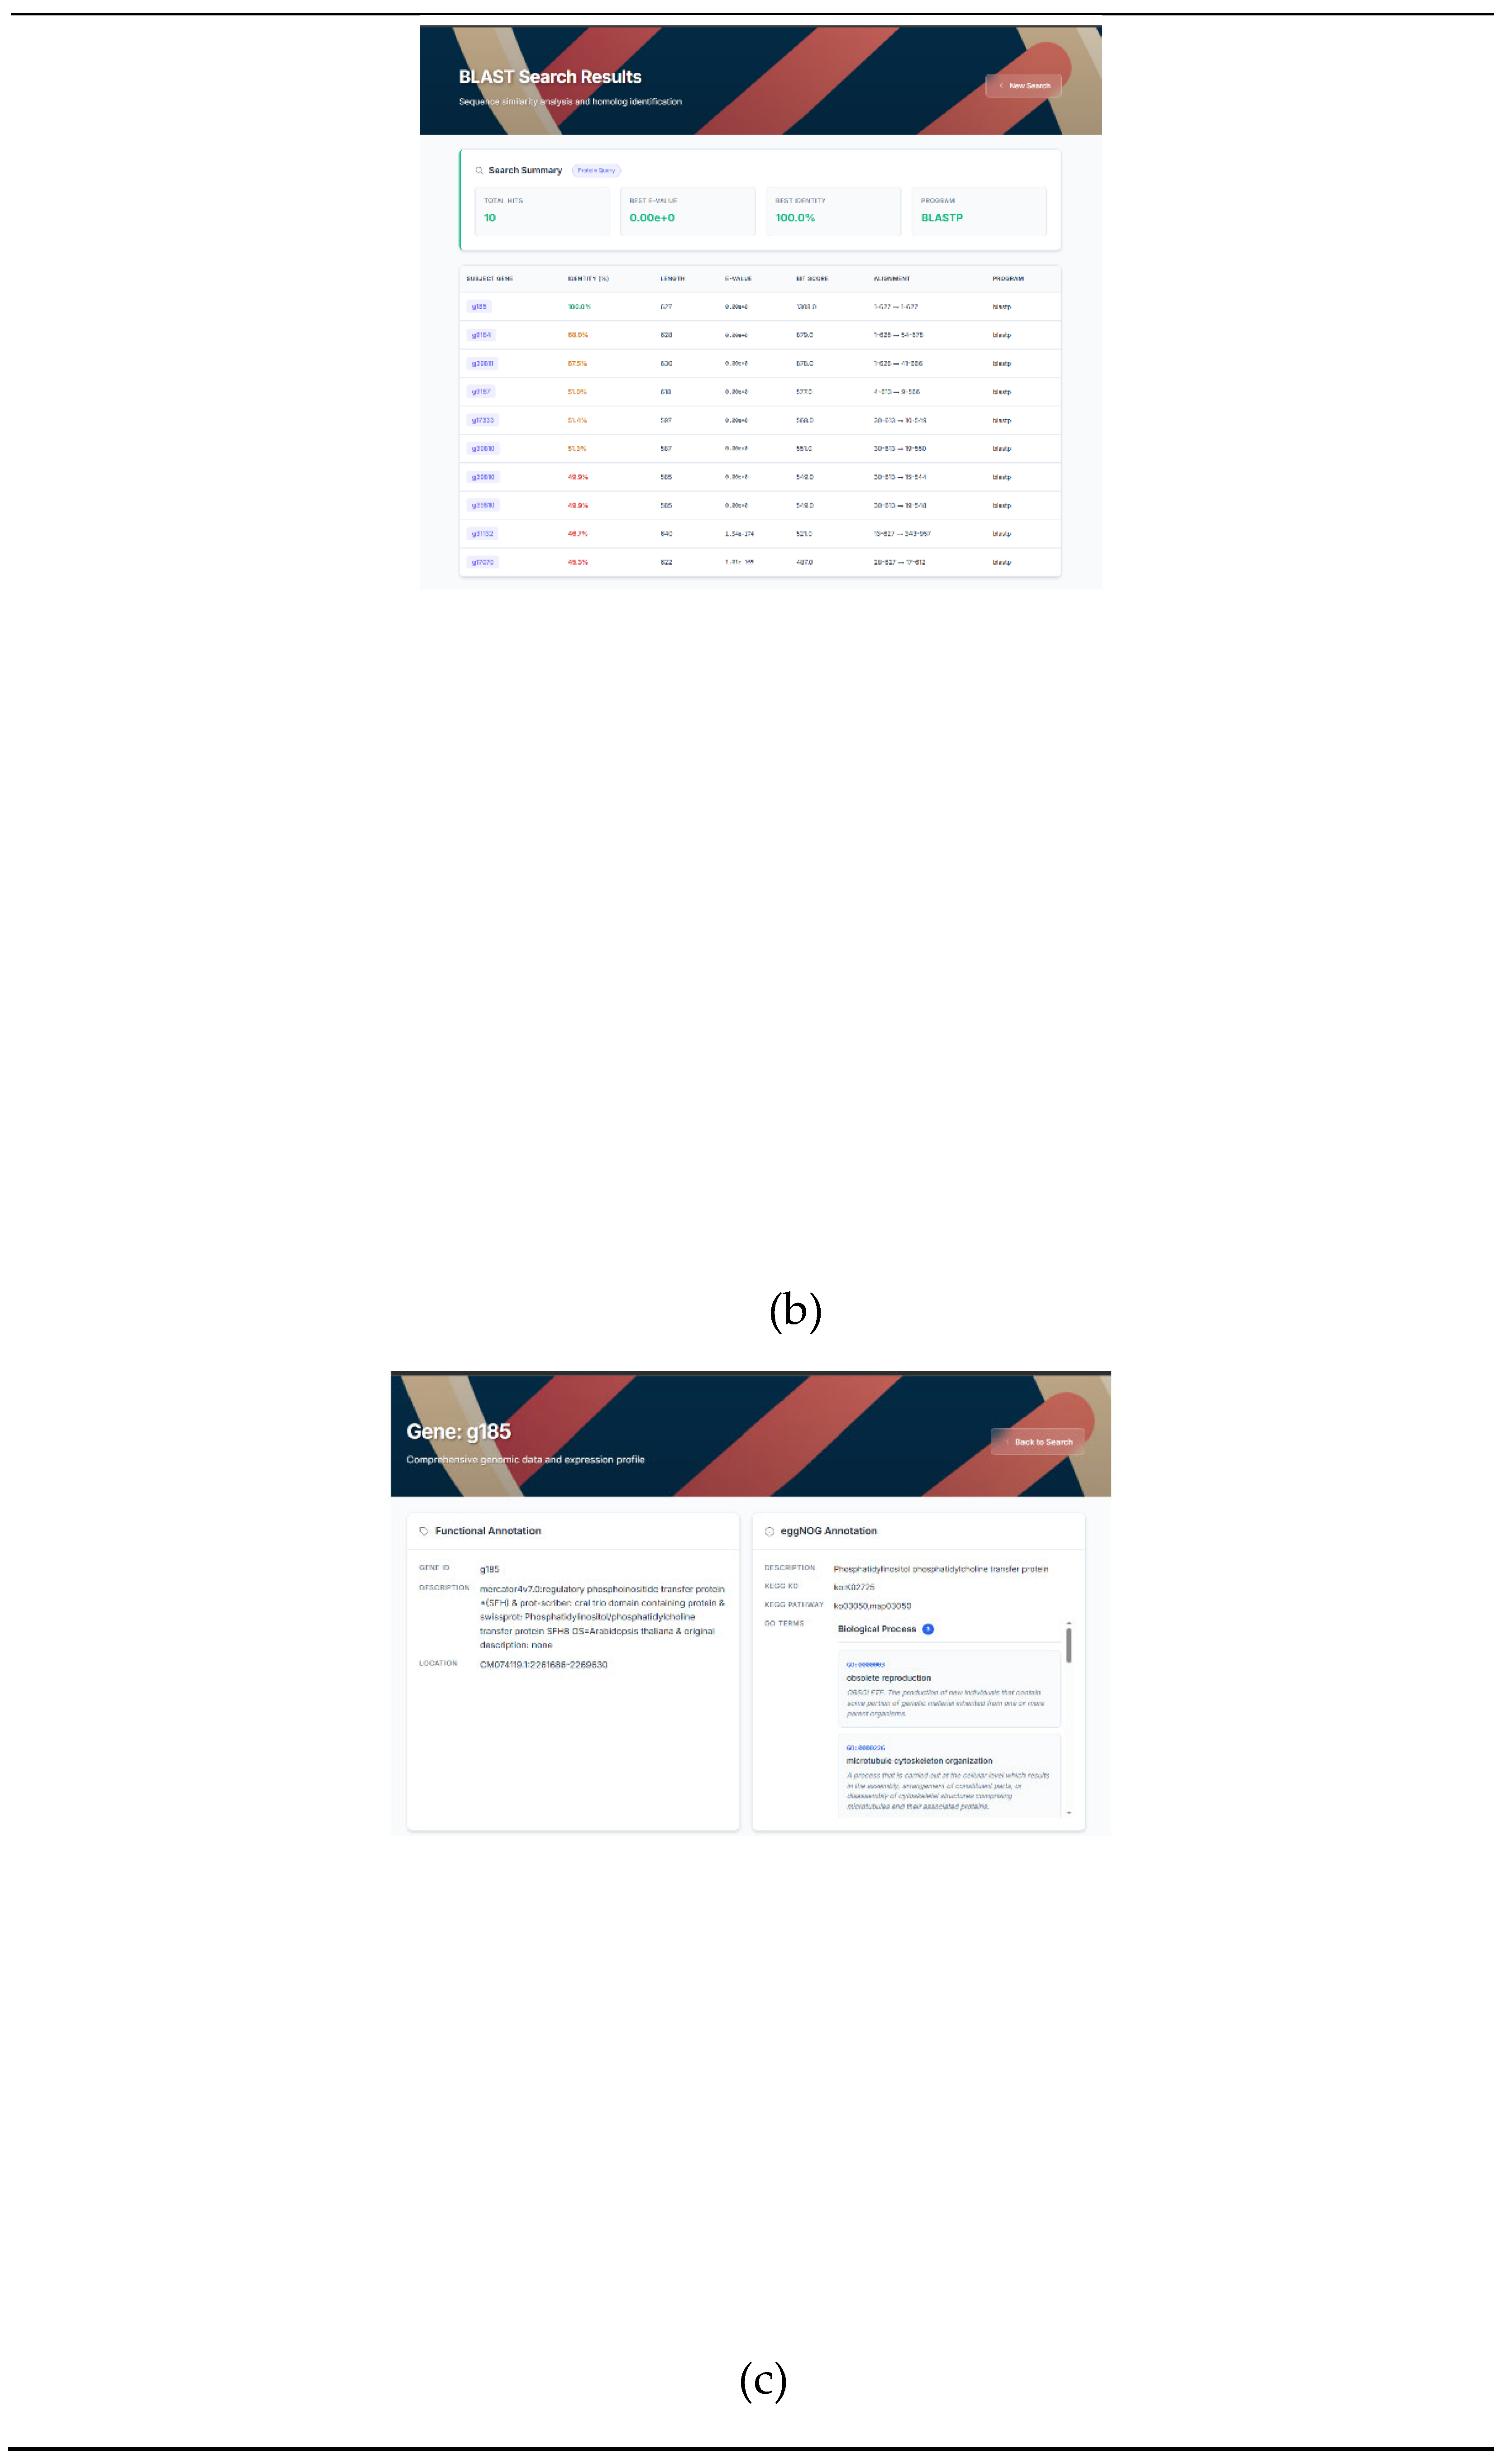
Figure 5.
Sections with the expression of a specific gene for all samples in the form of (a) barplot or (b) boxplots. (c) Representations of several genes via the IGV genomic browser on a developed genomic resource.
Figure 5.
Sections with the expression of a specific gene for all samples in the form of (a) barplot or (b) boxplots. (c) Representations of several genes via the IGV genomic browser on a developed genomic resource.
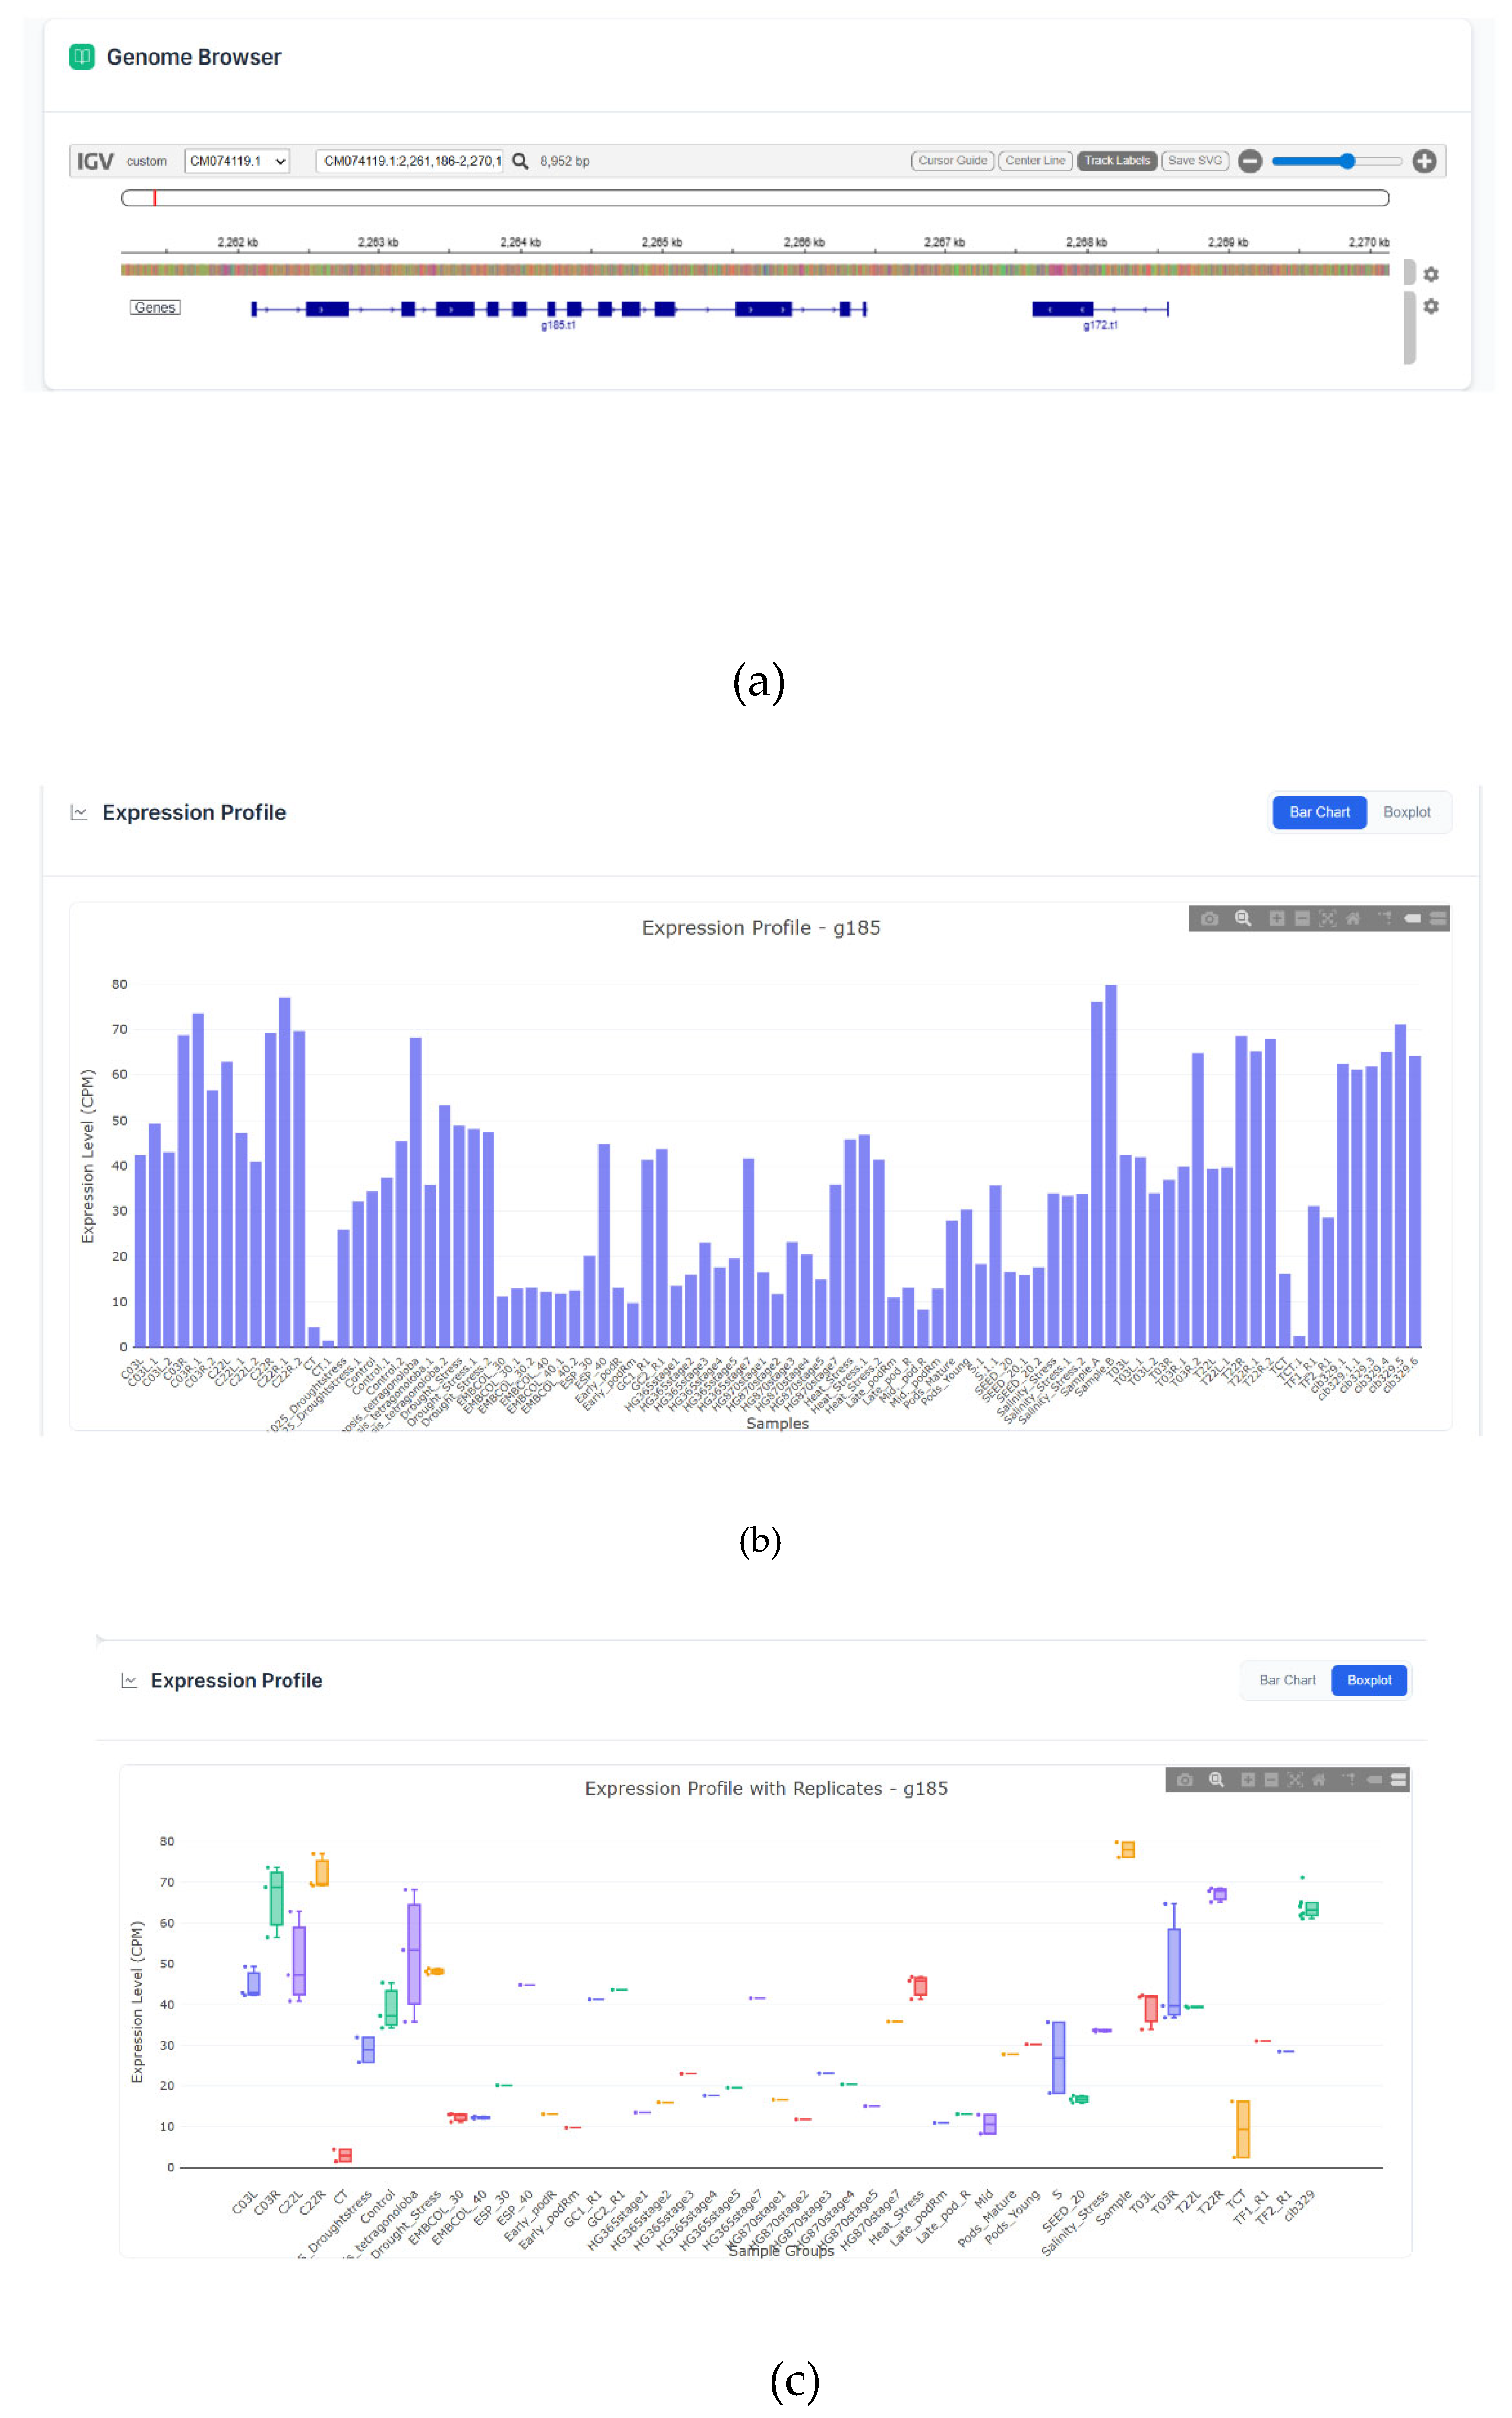

Table 1.
BUSCO based analysis of completeness of annotation.
| Protein categories | Number | Percentage |
| Complete BUSCOs (C) | 1574 | 97.5% |
| Complete and single-copy BUSCOs (S) | 1538 | 95.3% |
| Complete and duplicated BUSCOs (D) | 36 | 2.2% |
| Fragmented BUSCOs (F) | 21 | 1.3% |
| Missing BUSCOs (M) | 19 | 1.2% |
| Total BUSCO groups searched | 1614 | 100% |
Table 2.
Statistics of the genome annotation for Cyamopsis tetragonoloba.
| Feature | Count |
| Genes with functional annotation (EggNOG) | 36,998 (65%) |
| Genes assigned to MapMan BINs (Mercator4) | 28,443 (50%) |
| Average transcript length (bp) | 1,217.35 |
| Average exons per gene | 4.76 |
Table 3.
Collected samples for genome reannotation and an expression atlas construction.
| BioProject ID | Number of samples | Tissue |
| PRJNA312055 | 2 | leaf |
| PRJNA326981 | 14 | seed |
| PRJNA382073 | 3 | leaf, flower and shoot |
| PRJNA486400 | 11 | seed, embryo, endosperm |
| PRJNA497670 | 2 | root |
| PRJNA545776 | 6 | pod |
| PRJNA564412 | 12 | leaf |
| PRJNA669348 | 2 | leaf |
| PRJNA687332 | 4 | root |
| PRJNA763938 | 23 | root and leaf |
| PRJNA898087 | 6 | leaf |
Disclaimer/Publisher’s Note: The statements, opinions and data contained in all publications are solely those of the individual author(s) and contributor(s) and not of MDPI and/or the editor(s). MDPI and/or the editor(s) disclaim responsibility for any injury to people or property resulting from any ideas, methods, instructions or products referred to in the content. |
© 2025 by the authors. Licensee MDPI, Basel, Switzerland. This article is an open access article distributed under the terms and conditions of the Creative Commons Attribution (CC BY) license (http://creativecommons.org/licenses/by/4.0/).
Copyright: This open access article is published under a Creative Commons CC BY 4.0 license, which permit the free download, distribution, and reuse, provided that the author and preprint are cited in any reuse.


