
Submitted:
05 November 2024
Posted:
06 November 2024
You are already at the latest version
Abstract
Triticale is recognized worldwide due to its high protein and lysine content, high production capacity and adaptability to biotic and abiotic stress conditions, these qualities being taken over from wheat and rye. Triticale is widely used in various fields such as animal feed in various forms, in medicine, the bakery, beer, alcohol, cellulose, bioethanol industry and many others. Thus, the demand for triticale grains is increasing, and this has led to the research and improvement of culture technology to obtain superior products, both quantitatively and qualitatively. The purpose of this study was to identify the best varieties of triticale cultivated in the north-west of Romania, sown in different plots and fertilized on the ground or additionally, the study being carried out over a period of two years at the Livada Agricultural Research and Development Station, Satu Mare county. The study was located on an acidic soil with a pH between 5.19 and 6.65 and a humus content of 2.82%. The climatic conditions in the reference period were extremely variable, in the first year a deficit of more than 90 mm/m2 of precipitation was registered, and in the second year of the study, an increase of more than 34 mm/m2. The effects of additional fertilization were influenced by the level of precipitation, so in the experimental variants additionally fertilized, lower productions were obtained compared to the variants fertilized only on the soil. Compared to the Negoiu control, the Utrifun variety proved to be the most productive, but this will be proven in the following years of study, under different climatic conditions.
Keywords:
triticale
; technology
; fertilization
; production
; climate change
1. Introduction
Triticale (Triticosecale Wittmack) are the result of artificial crossing between wheat (Triticum aestivum) and rye (Secale cereale), taking over the essential characteristics from both parents. Triticale has a high production capacity and a high protein content, characters borrowed from wheat. From rye it borrowed the high content of lysine [1], higher than that of cereal grains, these being between 0.33 and 0.71% [2], the adaptability to unfavorable climatic conditions, the soils poor and acidic and a better resistance than wheat to diseases [3]. The protein content is close to that of wheat, being different depending on the variety, region and applied technology, as a rule it is between 11.4 and 14% [4]. In India, in a study of two triticale genotypes, they had a protein content of 13.1% [5]. Unfortunately, triticale does not have the same superior baking characteristics as wheat. Gluten, which is essential in baking, in triticale is difficult to wash, hard and less flexible [6,7]. For the most part, triticale grains are used in animal feed, especially in feeding pigs and birds, in different forms (grains, silage, straw, hay) [8]. Mixed with Lolium multiflorum, they can be used for grazing [9]. Recently, in addition to their use as animal feed, once with genetic progress, triticale has found numerous uses, for example in the production of bioethanol [10]. n a study that took place in Lativa, the lunasin peptide was discovered in triticale grains, which has a preventive role against cancer, an anti-inflammatory effect and in reducing cholesterol, a fact for which it can also be used in human medicine [11]. The phenolic acids found in the flour and bran of triticale grains have an antioxidant, anticancer and antibacterial role [12]. They are still used in the bakery industry, but due to the high alpha-amylase content and the low gluten content, 100% triticale flour cannot be used, but in a mixture with wheat flour [13]. It is used in the beer industry, in a ratio of 30% triticale malt and 70% barley malt [14]. Due to the high content of essential amino acids, mineral compounds and dietary fibers, triticale grains are valuable in human nutrition [15,16]. If Enterococcus faecium bacteria that have microbial activity against Listeria innocua are added to the triticale flour component, active films are obtained from triticale flour, these films have the ability to maintain anti-listerial activity for a period of up to 45 days, a fact for that triticale flour together with these bacteria can be used in the food packaging industry that can be used to soften cheese slices [17]. Having a high content of vegetable matter, triticale straws have a high content of lignin and hemicellulose, thus they are an alternative source in the cellulose industry [18,19]. Triticale grains are an important source for fish feed [20,21,22].
Due to the wide areas in which triticale can be used, this species occupies considerable areas worldwide. In 2022, according to FAOSTAT [23], the harvested area of triticale worldwide was over 3.6 millions hectares and a total production of over 14 millions tons with a yield of 3.9 tons/ha. Of the 3.6 millions hectares, over 3.1 millions hectares were cultivated in Europe alone, ensuring a total production of 13 millions tons and a yield of 4.1 tons/ha. Due to the arid climate conditions in Africa, triticale occupied an area of only 10 thousand hectares in 2022, harvesting over 23 thousand tons, ensuring a yield of 2.2 tons/ha (Table 1).
In 2022, the largest triticale grower in the world was Poland, with an area of 1.2 millions hectares and a total production of over 5 millions tons. The second place is occupied by Belarus with an area of 406 thousand hectares and a total production of 1.1 millions tons. The highest yield per hectare was recorded in Germany (5.948 kg), followed by Austria (5.686 kg).
In Romania in 2022, triticale occupied an area of 56.900 hectares, registering a total production of 192 thousand tons, and a yield of 3.376 kg/ha (Table 2).
The purpose of the research presented in this paper is to highlight the most productive varieties of triticale cultivated in the northwest of Romania and to highlight the role of applied technology (fertilization and plant selection) on production.
2. Materials and Methods
2.1. Experimental Sites, Soil and Climate
The study was carried out in Romania, in the north-west of the country, at the Agricultural Research and Development Station in the city of Livada, Satu-Mare county (lat. 47°51'; long. 23°08, altitude 120-130 m), during 2021/2022, and 2022/2023.
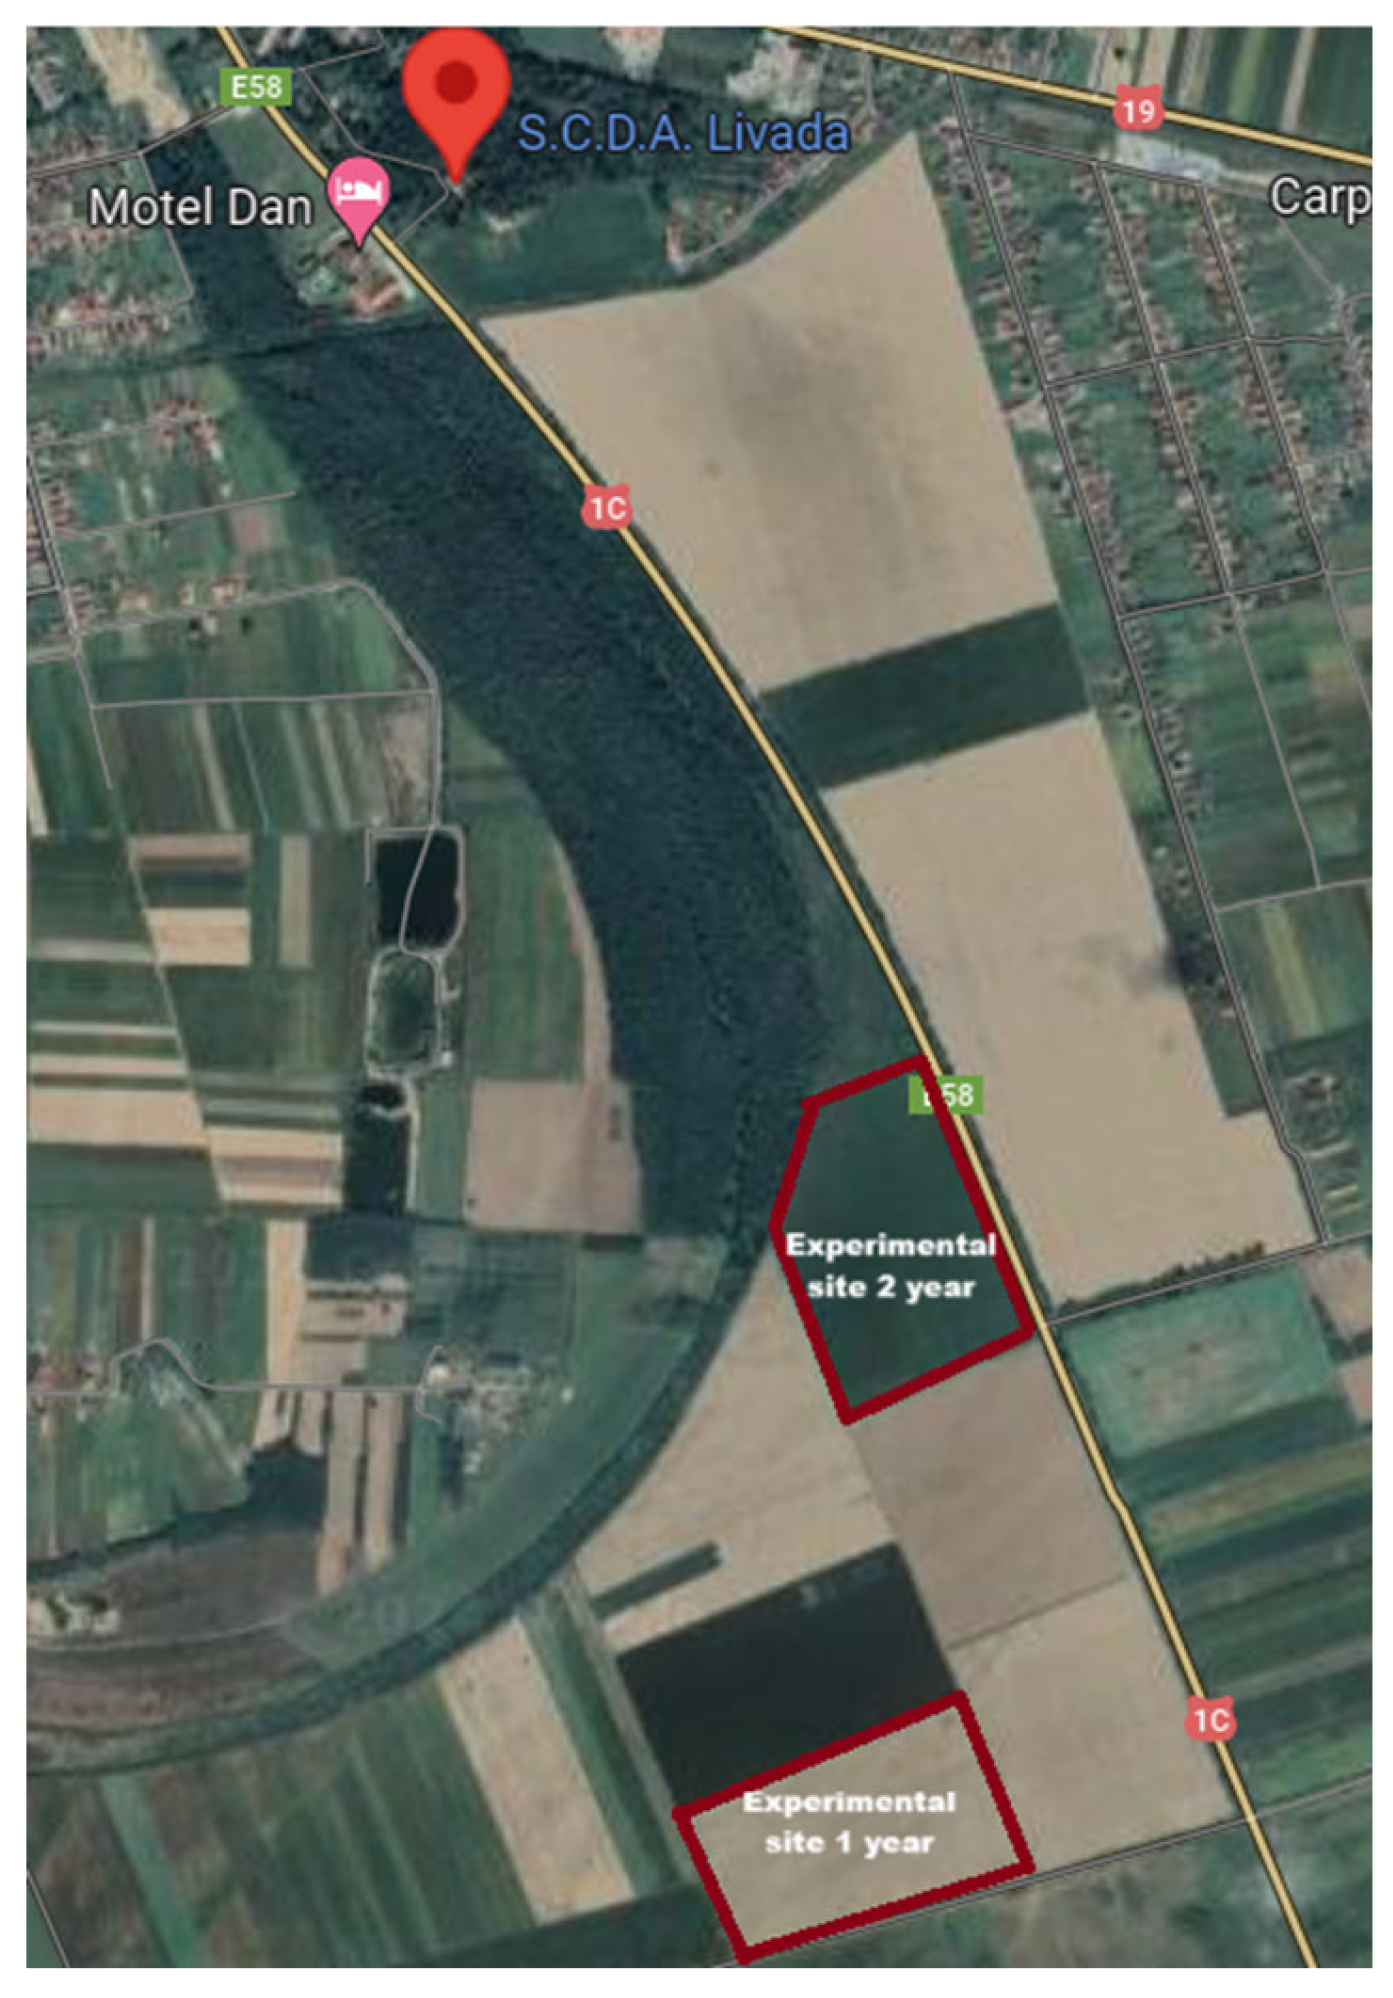
Figure 1.
The location of the Research Station and the experimental plots.
The type of soil on which the experiment was placed is a typical preluvosol (brown luvic soil) which is part of the class of Luvisols, which has an acidic reaction with a pH between 5.19 and 6.65, depending on the depth we are referring to. From the point of view of humus content, it is low, having only 2.82% in the arable layer (Table 3).
As can be seen in Table 4, the climatic conditions varied from one year to another, with an increase in average monthly temperatures from one year to another. The average temperature during the triticale vegetation period in the first year of the study was 7.6°C, 0.6°C higher than the multi-year average temperature, and the amount of precipitation was approximately 430 mm/m2, recording a deficit of over 90 mm/m2. The biggest precipitation deficit in 2021-2022 compared to multi-annual amounts was in the months of October (-41 mm/m2), March (-44 mm/m2), May (-59 mm/m2) and June (- 81 mm/m2). In the second year of the study, the average temperature during the vegetation period was 1.8°C higher than the average temperature in the first year, respectively 8.8°C. The biggest temperature difference between the monthly average and the multiannual average occurred in February 2023, +6.8°C. From the point of view of the precipitation level, it was approximately 563 mm/m2, registering an additional precipitation of 34.8 mm/m2. However, the rainfall was unevenly distributed during triticale vegetation periods, so in October 2022, when the sowing was carried out, a deficit of 25 mm/m2 was recorded. In May and June, when the phenophase of grain formation and filling takes place, the precipitation level was lower than the multiannual monthly amount, in May -55.8 mm/m2 and in June -20.6 mm/m2.
2.2. Biological Material
For the establishment of the experiment, four triticale varieties were used, created at NARDI Fundulea [24]: Negoiu, Utrifun, Zvelt and Tulnic, which are registered in the official catalog of varieties [25].
Negoiu is the longest-lived of the varieties tested, it was registered in 2012, and created through individual selection repeated annually from the combination of two lines. It has a height of 110-120 cm, the ears are large, white-matte, ridged. The mass of one thousand grains is between 48 and 54 g, and the hectoliter mass is 72-74 kg/hl. It has a good resistance to fusarium head blight and sepotroiosis and a medium resistance to brown rust. It can be used in the spirits and bioethanol industry and in the bakery industry in a ratio of 1 to 1 with wheat flour.
Utrifun is a variety registered in 2018, with a plant height of 85-95 cm, with large, white spikes, and the grains are large and red in color. The weight of one thousand grains is 45-50 g, and the hectoliter weight is 72-76 kg/hl. Compared to the Negoiu variety, it shows better resistance to falling due to the smaller plant size. It has good resistance to brown rust and fusarium wilt, medium resistance to yellow rust and spike fusarium wilt. The protein content of the grains is 12.4%. The usage domains of this variety are similar to those of the Negoiu variety.
Zvelt, is a variety of triticale registered in 2020, which has a plant height of 110-120 cm, with medium spikes. The mass of one thousand grains is between 45-54 g, and the hectoliter mass between 75 and 77 kg/hl. It has an average resistance to yellow and brown rust. It presents an essential resistance to sprouting in the ear. The protein content is located at 12.5%. It is used in animal feed in different forms, in the alcohol, bioethanol and bakery industries.
The Tulnic variety was registered in 2017, and is classified as a semi-early variety, which has a plant height of 110-118 cm, semi-dense, large and pointed ears. The mass of one thousand grains is between 45 and 58 g, and the hectoliter mass between 73 and 75 kg. It is resistant to fall, fusarium head blight, dwarf virus and septoriosis. All 4 varieties show a resistance to the toxicity of aluminum ions. Tulnic, it is used in animal feed, the spirits industry, bioethanol and the bakery industry.
2.3. Experimental Design
The experiment was placed under the method of subdivided plots, being of the 4 x 3 x 3 type, having 3 experimental factors.
Factor A is represented by variety;
✓ A1- Negoiu
✓ A2- Utrifun
✓ A3- Zvelt
✓ A4- Tulnic
Factor B represented fertilization
✓ B1:- chemical fertilization in autumn and spring
✓ B2- chemical fertilization + foliar fertilization
✓ B3 - chemical fertilization + foliar fertilization + biostimulator
Factor C was represented by the seeding rate of the 4 varieties of triticale (Figure 2):
✓ C1- 450 seeds/m2
✓ C2- 550 seeds/m2
✓ C3- 650 seeds/m2
2.4. Technology and Materials Used
The preceding plant: in the two years of study, it was fodder pea (Magistra Liv variety). Soil work: after the pea harvest, in July a disc harrow work was carried out, in September plowing was carried out at a depth of 23-25 cm, two passes with a disc harrow were carried out.
Basic fertilization: with complex fertilizer of the type DAP 18:46:0 in a dose of 150 kg/ha, this is a chemical fertilizer that contains the 2 essential macro-elements in plant life. It has a content of 18% active substance in ammoniacal nitrogen (NH4) and 46% phosphorus petaxoid (P2O5). This type of fertilizer rich in phosphorus is applied because lands in the reference area are poorly supplied with phosphorus [26].
Preparation of the germination bed: with the combiner, through which the fertilizer was incorporated into the soil.
The sowing: of the 4 varieties of triticale was carried out in experimental plots, in 3 repetitions, which had an area of 12 m2, respectively 10 m/2 harvested with Wintersteiger seeders (Figure 3).
Additional fertilization, spring: Ammonium nitrate 27% nitrogen, in a dose of 300 kg/ha, all experimental variants. It contains 13.5% nitric nitrogen and 13.5% ammoniacal nitrogen, besides this macroelement, it also contains microelements: calcium 7% and magnesium 5% [27].
Fighting weeds: Sekator Progress OD herbicide in a dose of 0.15 l/ha, all experimental variants. This is a systemic herbicide used to control weeds in straw cereal crops. It contains three active substances: 100 g/l amidosulfuron, 25 g/l iodosulfuron-methyl-Na and 250 g/l mefenpyr-diethyl. Used in a dose of 0.15 l/ha to fight weeds such as: Cirsium arvense, Ambrosia artemisiifolia, Sonchus arvensis, Capsella bursa-pastoris, Matricaria chamomilla, Atriplex patula, Chenopodiumm album, Raphanus raphanistrum, Sinapsis arvense, etc.[28].
Fighting diseases: Nativo Pro in a dose of 0.6 l/ha, all experimental variants, in the month of May before planting the plants. This is a systemic fungicide that fights foliar and ear diseases in cereal crops. It contains two active substances: 175 g/l prothioconazole and 150 g/l trifloxystrobin. This fungicide fights: Septoria tritici, Erysiphe graminis, Pyrenophora tritici-repentis, Puccinia striiformis, Pucinia recondita and Fusarium spp.[29].
Before planting the plants, in May:
✓ the B2 variants of each variety were foliarly fertilized with the product Solar 10-10-10 + Me in a dose of 3 l/ha; The product used has a nitrogen content of 10%, phosphorus 10%, potassium 10% and trace elements such as: zinc 0.15%, copper 0.03%, manganese 0.025% and boron 0.02%. It ensures the necessary nutrients for the plants, controlling the imbalances produced especially in the phenophases such as twinning, before flowering, formation of the grain [30].
✓ the B3 variants of each variety were foliarly fertilized with the Solar 10-10-10 + Me product at a dose of 3 l/ha and with the Cropmax biostimulator at a dose of 0.5 l/ha. The biostimulator is also approved for use in organic farming, it contains growth stimulants such as auxins, cytokinins, gibberellins, organic amino acids, vitamins and vegetable enzymes. Besides these, it also contains macro and microelements: 0.2% nitrogen, 0.4% phosphorus, 0.02% potassium, iron 220 mg/l, magnesium 550 mg/l, manganese 54 mg/l, zinc 49 mg/l, cuprin 35 mg/ l, boron 70 mg/l, etc. [31].
Harvesting: it was done in July during the two years of testing with the Wintersteiger experimental combine (Figure 4).
2.5. Data Statistics and Analysis
The statistical processing of the data was carried out with the help of the analysis of variance (ANOVA) in order to highlight the production differences between the control variant and the variants that were fertilized with foliar fertilizer and bio-stimulator and at the same time to observe the influence of the factors and the interaction between them on the production of triticale.
3. Results
3.1. Influence of Factor A (Variety) on Production
From the point of view of the variety's influence on production, the most productive variety was Utrifun in 2023, registering very significantly positive differences, this having a production increase of 3410 kg/ha compared to the control (Negoiu). This was followed by the Zvelt variety also in 2023 registering significantly positive production differences compared to the control variety, ensuring a production increase of 1169 kg/ha. The lowest production was recorded by the Tulnic variety in 2022, with a distinctly significant negative difference (-642 kg/ha). No significant production differences were recorded in 2022 by Utrifun and Zvelt, and by Tulnic in 2023 (Table 5).
3.2. Influence of Factor B (Fertilization) on Production
In 2022, due to the extreme climatic conditions, high temperatures and lack of precipitation, foliar and biostimulator fertilization did not increase production, but on the contrary, the foliar and biostimulator fertilized variants recorded significantly negative differences in production (-169 kg /ha) in the foliar fertilized variants, and -212 kg/ha in the foliar fertilized varinates and with biostimulator.
On the other hand, in 2023 when the average temperatures were close to normal and the precipitation level was above the multi-year amount, the foliar fertilized and biostimulator variants recorded increases in production. The foliar fertilized variants registered very significantly positive differences compared to the variants fertilized only on the soil (884 kg/ha). The foliar and biostimulant fertilized variants registered very significantly positive differences ensuring a production increase of over 800 kg/ha (Table 6).
3.3. Influence of Factor C (Density) on Production
In North-West Romania, in the triticale cultivation technology, sowing is practiced at a density of 500 seeds/m2. In 2022 and 2023, the sowing density did not register significant production differences. Also, the control variant recorded the highest productions, with the exception of the variants sown at 450 seeds/m2, which in 2023 brought a production increase of 125 kg/ha. The biggest negative difference in production was in 2023 for the variants sown at 650 seeds/m2 (Table 7).
3.4. Influence of Factors A x B (Variety x Fertilization) on Production
In the case of the interaction between the variety and fertilization, the biggest production difference was obtained by the Utrifun variety fertilized on the ground, foliar and with biosimulator, registering very significantly positive differences compared to the control, ensuring a production increase of 4137 kg/ha in 2023 Utrifun fertilized on the ground and with foliar had very significant positive differences, ensuring an increase of 4058 kg/ha in 2023. Utrifun, fertilized only on the ground, recorded significantly positive differences in production in 2023, ensuring a production increase of over 2000 kg /Ha. The Tulnic variety fertilized with the three fertilization schemes had distinctly significantly positive differences, ensuring a production increase of over 1500 kg/ha. The Zvelt variety in 2023 registered distinctly significantly positive differences ensuring a production increase of over 1500 kg/ha when it was fertilized both on the soil and foliar. In the climatic conditions of 2022, Utrifun fertilized on the ground recorded significantly positive production differences, surpassing the control version by 836 kg/ha. The lowest production was obtained by the Tulnic variety fertilized only on the ground, foliar fertilized and with biostimulator, registering a very significant negative difference in production (Table 8).
3.5. Influence of Factors A x C (Variety x Density) on Production
The highest productions were obtained by Utrifun in 2023 for all three sowing schemes, registering very significantly positive differences compared to the control. It brought increases of over 3700 kg/ha sown at 550 seeds/m2, 3400 kg/ha at 650 seeds/m2 and over 3100 kg/ha sown at 450 seeds/m2. Distinctly significantly positive differences were recorded by Zvelt in 2023, signed at 550 seeds/m2 (+1488 kg/ha), and significantly positive differences sown at 450 seeds/m2 (+1231 kg/ha). Distinctly significantly negative differences were registered by Tulnic in 2022 sown at 650 seeds/m2 (-726 kg/ha), and significantly negative differences in production, sown at 550 seeds/m2 obtaining a lower production by 620 kg/ha compared to witness (Table 9).
3.6. Influence of Factors B x C (Fertilization x Density) on Production
In the case of the interaction between the experimental factors fertilization and sowing, the different climatic conditions in the two years of the study played an essential role, so that in 2023 all the variants recorded positive production differences compared to the control variant. Very significantly positive production differences were obtained by the variants sown at 650 seeds/m2 and fertilized chemically, with foliar and with biostimulator (+1071 kg/ha), the variants sown at 550 seeds/m2 and fertilized on the ground, with foliar fertilizer (+1026 kg/ha), the variants sown at 650 seeds/m2 and fertilized on the ground and foliar fertilizer (+940 kg/ha) and by the variants sown at 550 seeds/m2 and fertilized on the ground, with foliar fertilizer and biostimulator (+729 kg/ha). Distinctly significantly positive production differences were obtained in the variants that were sown at 450 seeds/m2 and had all three levels of fertilization (+714 kg/ha). The variants sown at 450 seeds/m2, fertilized on the ground and with foliar fertilizer in 2023 registered distinctly significantly positive production differences (+687 kg/ha).
In 2022, due to the climatic conditions, the agreement to be signed did not favorably influence the increase in production. Distinctly significantly negative differences in production were recorded for the variants sown at 650 seeds/m2 that were fertilized with chemical soil fertilizer, foliar fertilizer and biostimulator (-586 kg/ha). Significantly negative production differences were recorded for the variants sown at 650 seeds/m2 fertilized on the ground and with foliar fertilizer, these having a lower production than the control by over 450 kg/ha (Table 10).
3.7. Influnence of Factors A x B x C (Variaty x Fertilization x Density) on Production
In the case of the interaction of the three experimental factors, the highest productions were obtained in 2023, the production differences being very significantly positive. These productions were obtained by the Utrifun variety at different sowing plots and fertilization schemes. The highest production was obtained when it was sown at 550 seeds/m2 and fertilized on the ground, with foliar fertilizer, fertilized with biosimulator, 11913 kg/ha, over 4500 kg/ha more than the control variant. Also, the production of the Utrifun variety decreases with the number of fertilizations. Utrifun sown at 650 seeds/m2 and fertilized on the ground and with foliar fertilizer obtained 11343 kg/ha, ensuring a production increase of 4378 kg/ha. Utrifun sown at 550 seeds/m2, fertilized on the ground and with foliar fertilizer recorded productions of 11400 kg/ha. The high plot to be signed at Utrifun did not bring production increases, the variants sown at a plot of 650 seeds/m2 and fertilized on the ground, foliar and with biostimulator, brought a production increase compared to the control of over 3900 kg/ha. Utrifun sown at 450 seeds/m2 and fertilized with chemical fertilizer on the ground, foliar fertilized and with biostimulator recorded an increase in production compared to the control of over 3800 kg/ha. At a plot of 450 seeds/m2, only fertilized on the ground and with foliar fertilizer managed to obtain a production of over 10900 kg/ha, the difference in production compared to the control being very significantly positive.
Distinctly significantly positive production differences were registered in 2023 by the Utrifun, Zvelt and Tulnic varieties, the productions being over 8800 kg/ha. The Utrifun variety sown at 550 seeds/m2 and fertilized on the ground obtained a production of 9718 kg/ha, having an increase of over 2200 kg/ha compared to the control, and signed at 450 seeds/m2 managed to register a production of 9645 kg/ha. The increase in the number of plants per square meter has a negative influence on production in the case of Utrifun, thus sown at 650 seeds/m2 and fertilized on the ground, it recorded a production of 9409 kg/ha. Slender sown at 450 seeds/m2 and fertilized on the ground recorded a production of over 9500 kg/ha, and at 550 seeds/m2 it recorded only 9188 kg/ha, the increase in the number of plants per square meter negatively influencing production, but the interaction between Zvelt signed at 550 seeds/m2, fertilized on the ground, with foliar fertilizer recorded a production of 9206 kg/ha, 2119 kg/ha higher than the control. The lowest production that presented distinctly significantly positive production differences was of the Tulnic variety that was sown at 550 seeds/m2 and received two fertilization options (+1719 kg/ha).
In 2022, significantly positive production differences were registered by Utrifun sown at 450 seeds/m2 and fertilized on the ground (+1048 kg/ha), and signed at 550 seeds/m2 (+ 902 kg/ha), thus the increase in sowing thickness at Utrifun negatively influences production capacity. In 2023 the varieties Zvelt and Tulnic recorded significantly positive differences in production, thus Zvelt sown at 450 seeds/m2, fertilized on the ground and with foliar fertilizer, obtained over 1260 kg/ha more than the control variant, and Tulnic fertilized and signed in the same way as Zvelt obtained an increase of 1332 kg/ha compared to the control variant. Zvelt sown at 650 seeds/m2 and fertilized on the ground and with foliar fertilizer obtained 8235 kg/ha, with more than 1200 kg/ha compared to the control, also Tulnic sown at 650 seeds/m2 and fertilized on the ground and with foliar fertilizer recorded a production of over 8600 kg/ha, 1683 kg/ha more than the control.
In the two years of the experimental study, statistically ensured negative production differences were recorded by the Tulnic variety. In 2022, sown at 650 seeds/m2 and fertilized on the soil, foliar, biostimulator recorded very significantly negative differences in production, obtaining 6689 kg/ha and a negative difference in production of 1571 kg/ha. Distinctly significant negative differences were recorded when it was sown at 550 seeds/m2 (-1440 kg/ha) and at 450 seeds/m2 (-1140 kg/ha), and when it received all three levels of fertilization, thus can deduce that in 2022 the production of Tulnic decreased once with the increase of the sowing area. In 2023, it registered significantly negative production differences, the biggest difference being when it was sown at 650 seeds/m2 and only chemically fertilized (-1621 kg/ha). Sown at 550 seeds/m2 and fertilized on the ground, it obtained 6009 kg/ha, 1467 kg/ha less than the control. Tulnic sown at 650 seeds/m2 fertilized on the ground and with foliar fertilizer obtained 7345 kg/ha and a negative difference in production of 1039 kg/ha, the difference being significantly negative (Table 11).
4. Discussion
Obtaining high yields is due to their cultivation technology. In addition to choosing the most productive varieties, it is necessary to ensure the plants' nutrient requirements during the growing season and establish the optimal sowing density so that the triticale plants have enough space for development. In this case, studies were carried out at the global level regarding the growth of the stock through interventions in the cultivation scheme. Triticale responds very well to fertilization, especially nitrogen fertilization. The yield of these is given by the dose of fertilizer and environmental factors. Mainly the protein content is given by the amount of nitrogen that is available to the plants, where it is possible to intervene with foliar fertilizer to supplement the necessary nutrients needed by the plants. The accumulation of most amino acids in grains depends on fertilization, most being accumulated at a quantity of 120 kg/ha of nitrogen. Fertilization is the factor that most influences production growth and foliar fertilization can stimulate production growth [32].
In Estonia, a study was carried out on the influence of nitrogen fertilization in different vegetation phenophases on grain yield and quality, and it was found that nitrogen fertilization in the development stage of EC47 plants led to a reduction in plant fall and an increase in protein content [33].
And the area where the triticale is located has an important influence in terms of production. In Poland, this was demonstrated through a study that consisted in the testing of 11 triticale cultivations that were evaluated in 58 localities in which two culture managements were used, moderate and conventional and a high management [34]. Thanks to the genetic progress of the last decades, spring triticale were also created, which were tested together with 55 genotypes of winter triticale in Poland, it was found that the spring forms signed earlier, having a longer vegetation period , and on more fertile soils they can ensure productions of 8000 kg/ha [35].
In a study from Bulgaria regarding the application of foliar fertilizers to the triticale crop, an increase in yield was found, but this increase was not statistically significant, so it was concluded that foliar fertilization cannot replace mineral fertilization or be used alone [36]. Studies were carried out in which the fertilization took place with green organic fertilizer (Lumbricus rubellus) and in which the plant preceding the triticale crop was also taken into account. The highest yield was in the case of fertilization with 1750 kg/ka Lumbrical, having durum wheat as the precursor plant [37]. In a study from Turkey, it was found that zinc-based foliar fertilizers were effective especially in drought conditions, and that the application of foliar fertilizers had a positive effect on the yield, the number of grains/ear and the weight of 1000 grains [38].
In Romania, 2 genotypes were tested, having, like the preceding plant, different soil works and several doses and times of application, the yield being influenced by all these factors, responding favorably especially to a limitation of soil preparation [39].Also in Romania, studies were done on the impact of fertilization and weed control with the help of herbicides, in the Lapus depression, in the north-west of the country, where productions of over 7400 kg/ha up to 9000 kg/ha were obtained [40].
And sowing rate is an essential technological factor in increasing yield and decreasing sowing expenses. In a study in Poland from the beginning of 2000, several batches of triticale were established that were signed at different densities and it was found that at the density of 200 grains/m2, the plants recorded an optimal number of shoots and leaves recording the highest yield [41]. In Turkey, the optimal density that was established following a study was 550 grains/m2 and a nitrogen dose of 12 kg/day [42]. In Mediterranean countries, the optimal sowing density is between 100 and 300 plants/m2 and the sowing season should be as early as possible [43].
5. Conclusions
The current study was carried out over a period of 2 years, in North-West Romania on a typical preluvosol with an acid pH. Following this study, we can note that the climatic factors are the ones that influence the production capacity the most, especially the lack of precipitation. In a year with a moisture deficit, the application of foliar fertilizers and the biostimulator does not increase production. But in a favorable year, foliar fertilization and biostimulator brings significant increases in production. The Utrifun variety reacted best to the fertilization factor, ensuring increases of over 4500 kg/ha sown at 550 seeds/m2, this being the most productive variety, if the fertilization scheme was reduced and the rate of sowing increased, it obtained an increase over 4000 kg/ha. It was followed by Zvelt and Tulnic in the year with more precipitation. In 2022, in the absence of precipitation, the least productive was Tulnic, which sown at 650 seeds/m2 fertilized chemically, foliarly and with biostimulator obtained only 6689 kg/ha. In the future, studies will be conducted to confirm that the increase in triticale production through the use of high seeding rates and the use of additional fertilizers is influenced by climatic conditions.
References
- Fraś, A., Gołębiewska, K., Gołębiewski, D., Wiśniewska, M., Gzowska, M., Mańkowski, D. R. Utilisation of triticale (X Triticosecale Wittmack) and residual oat flour in breadmaking. Czech Journal of Food Sciences 2021, 39, (3) : 226–233. [CrossRef]
- Fraś, A., Gołębiewska, K., Gołębiewski, D., Mańkowski, D.R., Boros, D., Szecówka P. Variability in the chemical composition of triticale grain, flour and bread. Journal of Cereal Science 2016, 71, 66–72. [CrossRef]
- Hulse, Joseph H., Spurgeon, D. “TRITICALE.” Scientific American. 1974, 231, no. 2, 72–81.
- Heger, J., Eggum, B.O. The nutritional values of some high-yielding cultivars of triticale. Journal of Cereal Science 1991, 14, 63–71. [CrossRef]
- Sehgal, K. L., Bajaj, S., Dr. Sekhon, K. S. Studies on the composition, quality and processing of triticale Part I. Physico-chemical characteristics. Molecular Nutrition Food Research. 1983, 27(1):31-37. [CrossRef]
- Peña, R.J. Food uses of triticale, Triticale improvement and production, FAO Plant Production and Protection Paper 179, 2004, ISBN 92-5-105182-8, 37-48.
- Martinek, P., Vinterová, M., Burešová, I., Vyhnánek, T., Agronomic and quality characteristics of triticale (X Triticosecale Wittmack) with HMW glutenin subunits 5+10. Journal of Cereal Science 2008, 47, Issue 1, 68–78. [CrossRef]
- Glamočlija, N., Starčević, M, Ćirić, J., Šefer, D., Glišić, M., Baltić, M.Z., Marković, R., Spasić, M., Glamočlija, D. The importance of triticale in animal nutrition. Veterinary Journal of Republic of Srpska 2018, 18, No.1, 73–94. [CrossRef]
- Baron, V. S., Juskiw, P. E., Aljarrah, M. Triticale as a Forage. Triticale. 2015, 189-212. [CrossRef]
- Mupondwa, E., Li, X., Tabil, L. Integrated bioethanol production from triticale grain and lignocellulosic straw in Western Canada, Industrial Crops and Products. 2018, 117, 75–87. [CrossRef]
- Nakurte, I., Klavins, K., Kirhnere, I., Namniece, J., Adlere, L., Matvejevs, J., Kronberga, A., Kokare, A., Strazdina, V., Legzdina, L., Muceniece, R. Discovery of lunasin peptide in triticale (X Triticosecale Wittmack). Journal of Cereal Science. 2012, 56(2):510-514. [CrossRef]
- Jańczak-Pieniążek, M., Horvat, D., Viljevac Vuletić M., Kovačević Babić M., Buczek J., Szpunar-Krok E. Antioxidant Potential and Phenolic Acid Profiles in Triticale Grain under Integrated and Conventional Cropping Systems. Agriculture 2023, 13, 1078. [CrossRef]
- Galoburda, R., Straumite, E., Sabovics, M., Kruma, Z. Dynamics of Volatile Compounds in Triticale Bread with Sourdough: From Flour to Bread, Foods, 2020, 9(12). [CrossRef]
- Ambriz-Vidal, T. N., Mariezcurrena-Berasain, M. D., Heredia-Olea, E., Martinez, D. L. P., Gutierrez-Ibañez, A. T. Potential of Triticale (X Triticosecale Wittmack) Malts for Beer Wort Production, The Science of Beer, 2019, 77(4). [CrossRef]
- Biel, W., Kazimierska, K., Bashutska, U. Nutritional value of wheat, triticale, barley and oat grains. Acta Scientiarum Polonorum Zootechnica. 2020, 19(2):19- 28. [CrossRef]
- Cionca, I., Lupuț,, I., Rusu T. Triticale review: navigating past achievements, current realities and future horizons in agricultural innovation. Agricultura, no. 1 - 2 (129-130)/2024.
- Salvucci, E., Rossi, M., Colombo, A., Pérez, G., Borneo, R., Aguirre, A. Triticale flour films added with bacteriocin-like substance (BLIS) for active food packaging applications. Food Packaging and Shelf Life. 2019, 19:193-199. [CrossRef]
- Bates, I., Plazonić, I., Seleš, V. R., Barbarić-Mikočević, Ž. Determining the quality of paper substrates containing triticale pulp for printing industry. Nordic Pulp & Paper Research Journal. 2020, 35(2):272-278. [CrossRef]
- Tarrés, Q., Ehman, N. V., Vallejos, M. E., Area, M. C., Delgado-Aguilar, M., Mutjé, P. Lignocellulosic nanofibers from triticale straw: The influence of hemicelluloses and lignin in their production and properties. Carbohydrate Polymers. 2017, 163:20-27. [CrossRef]
- Dawood, M. A. O., Amer,A. A., Elbialy, Z. I., Gouda, A. H. Effects of including triticale on growth performance, digestive enzyme activity, and growthrelated genes of Nile tilapia (Oreochromis niloticus). Aquaculture. 2020, 528. [CrossRef]
- Marković, G., Ćirković, M., Lujić, J., Pantović, J. Comparison of the Nutritive Value of Wheat and Triticale in Fish Diet. VI International conference “water & fish” Faculty of Agriculture. 2013, Belgrade-Zemun, Serbia, June 12 – 14, 233-237.
- Hughes, S. G., Use of triticale as a replacement for wheat middlings in diets for Atlantic salmon. Aquaculture. 1990, 90(2):173-178. [CrossRef]
- https://www.fao.org/faostat/en/#data/QCL (acccessed date on 11th August 2024).
- https://www.incda-fundulea.ro/index_en.html (acceseed date on 11th August 2024).
- https://istis.ro/catalog-oficial/(accessed date on 11th August 2024).
- https://www.agromaxgrains.ro/produse/ingrasaminte/dap-18-46-0 (acccessed date on 21th August 2024).
- https://edepo-construct.ro/produs/nitrocalcar-50kg (acccessed date on 21th August 2024).
- https://www.cropscience.bayer.ro/cpd/erbicide-bcs-sekator-progress-od-ro-ro (acccessed date on 21th August 2024).
- https://www.cropscience.bayer.ro/cpd/fungicide-bcs-nativo-pro-325-sc-ro-ro (acccessed date on 21th August 2024).
- https://www.plantmaster.ro/ingrasamant-solar-10-10-10me-3l/?srsltid=AfmBOoqT8kJzbwnoReVj46VlQxkmHZ3-NEzyGOxBKmdSnGAyHLqHPbqlzaI (acccessed date on 21th August 2024).
- https://www.pesticid.ro/biostimulator-cropmax?srsltid=AfmBOoqoGDYFGGcL06iSSmtnPB0YoNBxeZxDQ_uAqoP5yVg7ZFnyp8Bf (acccessed date on 21th August 2024).
- Dobreva, S. Triticale - past and future. Agricultural Science and Technology. 2016, 8, No. 4, pages 271–275. [Google Scholar] [CrossRef]
- Alaru, M., Mǿller, B., Hansen, Ă. Triticale yield formation and quality influenced by different N fertilisation regimes. Agronomy Research 2004, 2(1), 3–12.
- Derejko, A., Studnicki, M. Effect of cultivar, crop management, location and growing season on the grain yield of triticale. Biometrical Letters 2019, 56, No. 2, 239–252. [CrossRef]
- Wójcik-Gront,E., Studnicki, M. Long-Term Yield Variability of Triticale (×Triticosecale Wittmack) Tested Using a CART Model. Agriculture. 2021, 11(2), 92. [CrossRef]
- Dobreva, S., Kirchev, H., Muhova, A. Grain yield of triticale varieties depending on the foliar fertilization in the conditions of increasing norms of fertilization of the soil with nitrogen. Research Journal of Agricultural Science. 2018, 50, No. 4, 122–126.
- Muhova, A., Kirchev, H. Agronomic performance of triticale varieties (x Triticosecale Wittm.) grown under fertilization with organic manure from red Californian worms. Agronomy 2020, 63, No. 1, 428–436.
- Kinaci, E., Gulmezoglu, N. Grain yield and yield components of triticale upon application of different foliar fertilizers. Interciencia 2007, 32, No 9.
- Dumbravă, M., Ion, V., Epure, L. I., Bășa, A. G., Ion, N., Dușa, E. M. Grain Yield and Yield Components at Triticale under Different Technological Conditions. Agriculture and Agricultural Science Procedia 2016, 10, 94–103. [CrossRef]
- Cionca, I., Lupuț, I., Rusu, T., Exploring the pretability potential of triticale cultivation in the Lăpuș depression, Romania: a scientific analysis. Agricultura no. 1 - 2 (129-130)/2024. [CrossRef]
- Jaśkiewicz, B. The influence of sowing density and nitrogen application method on yielding and morphological characters of winter triticale cv. Woltario. Biuletyn Instytutu Hodowli i Aklimatyzacji Roślin. 2009, No.252, 169-177 ref.
- Saglam, N., Ustunalp, G. Efectul diferitelor densități de semănat și al dozelor de azot asupra randamentului și componentelor randamentului în Triticale ( X Triticosecale Wittmack). APCBEE Procedia. 2014, 8, 354–358.
- Bassu, S., Asseng, S., Giunta, F., Motzo, R. Optimizing triticale sowing densities across the Mediterranean Basin. Filed Crops Research 2013, 144, 167–178. [CrossRef]
Figure 2.
Layout of the experience.
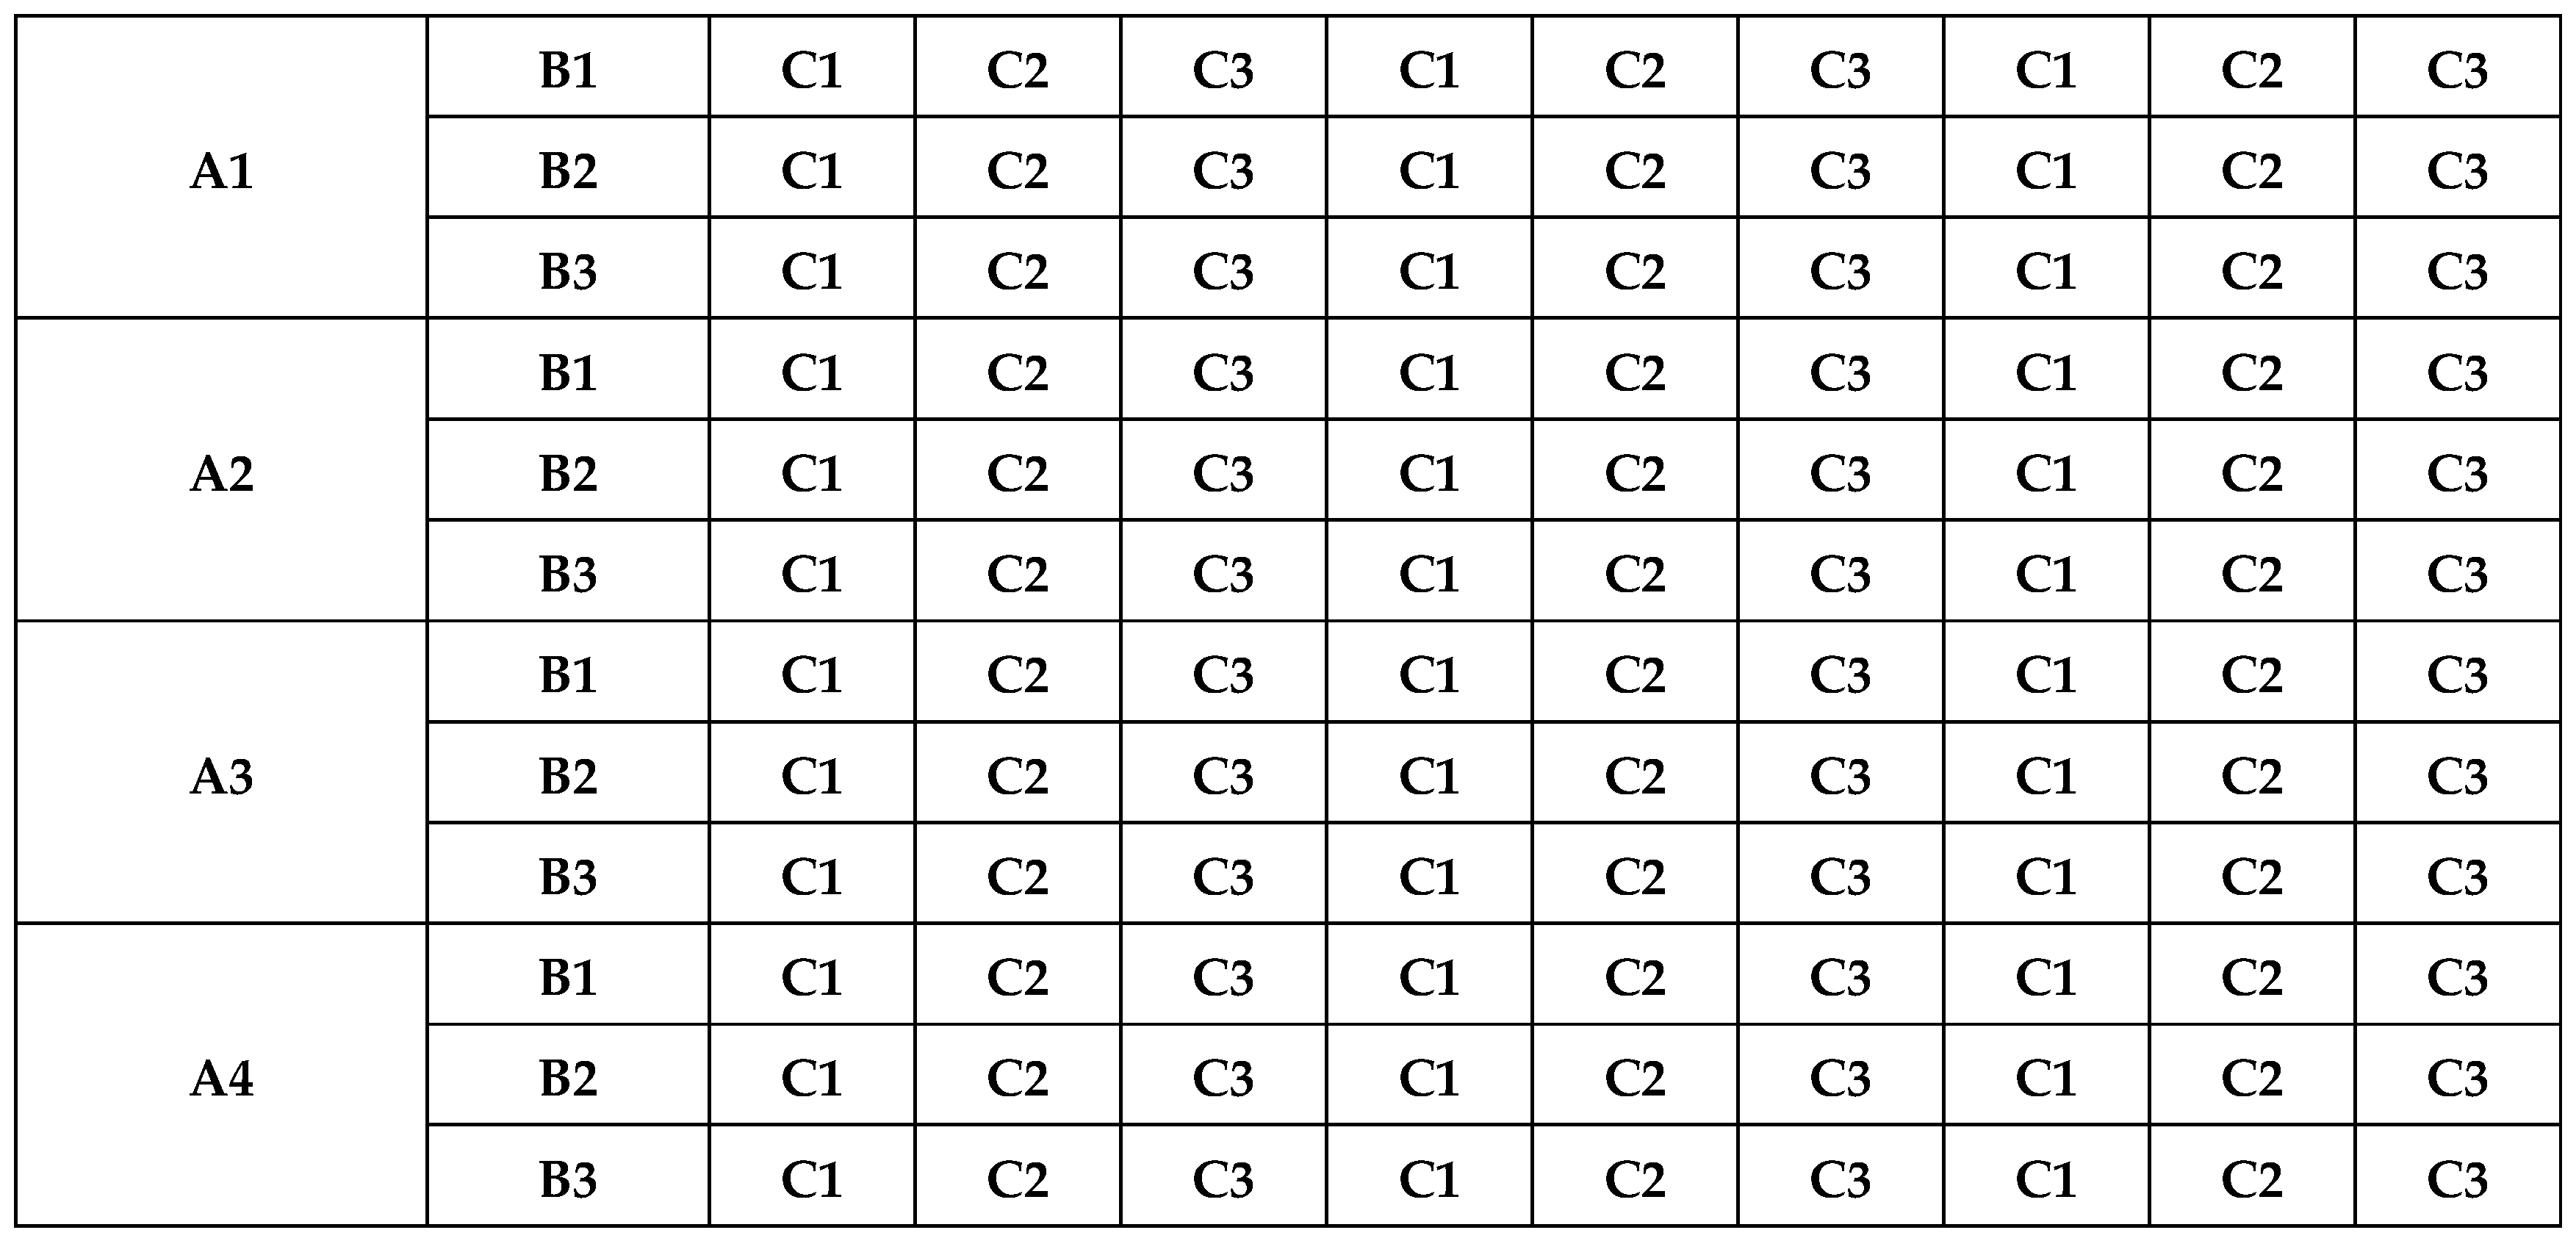
Figure 3.
Sowing experiences with the Wintersteiger seeder.
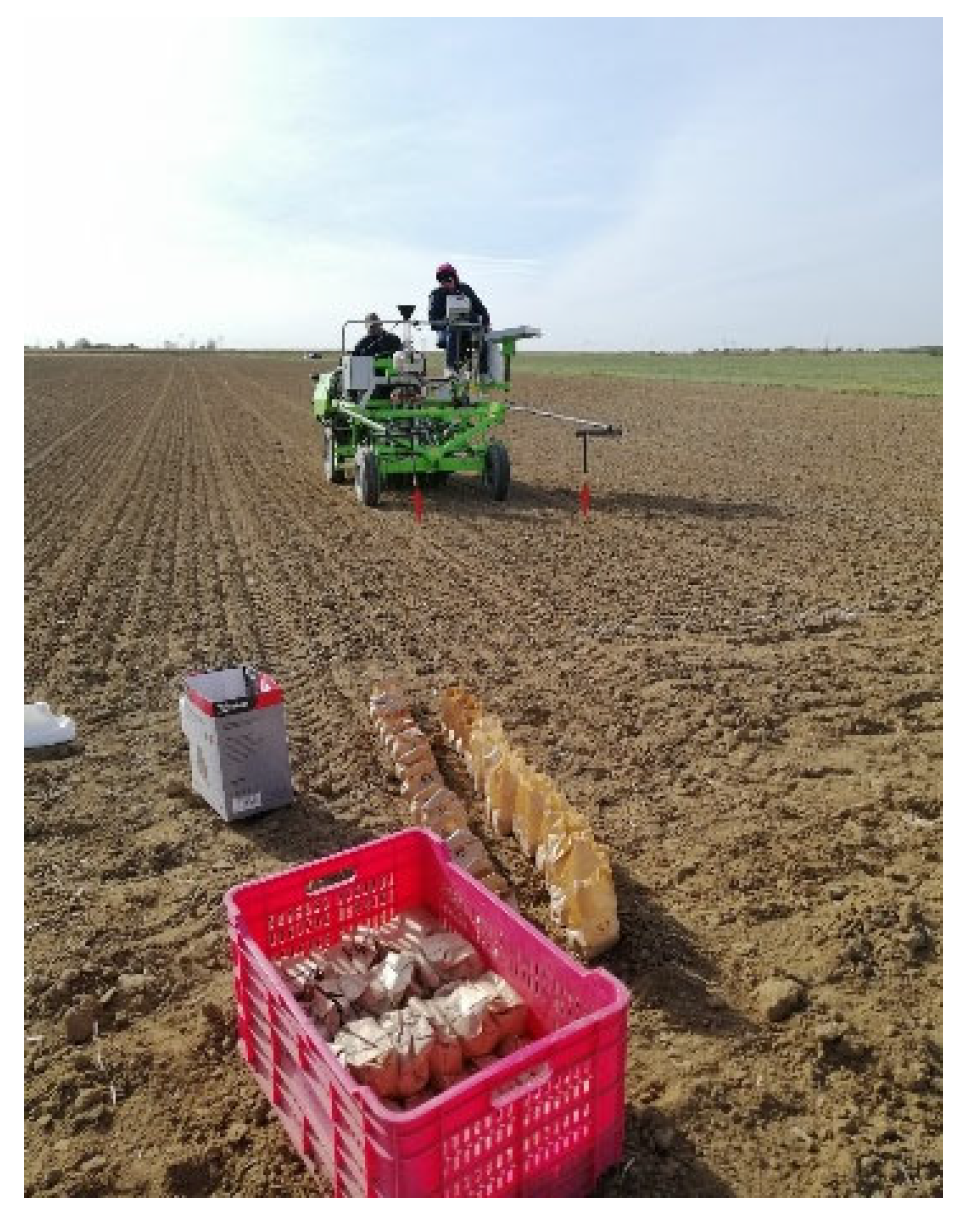
Figure 4.
Harvesting experiences with the Wintersteiger combine.
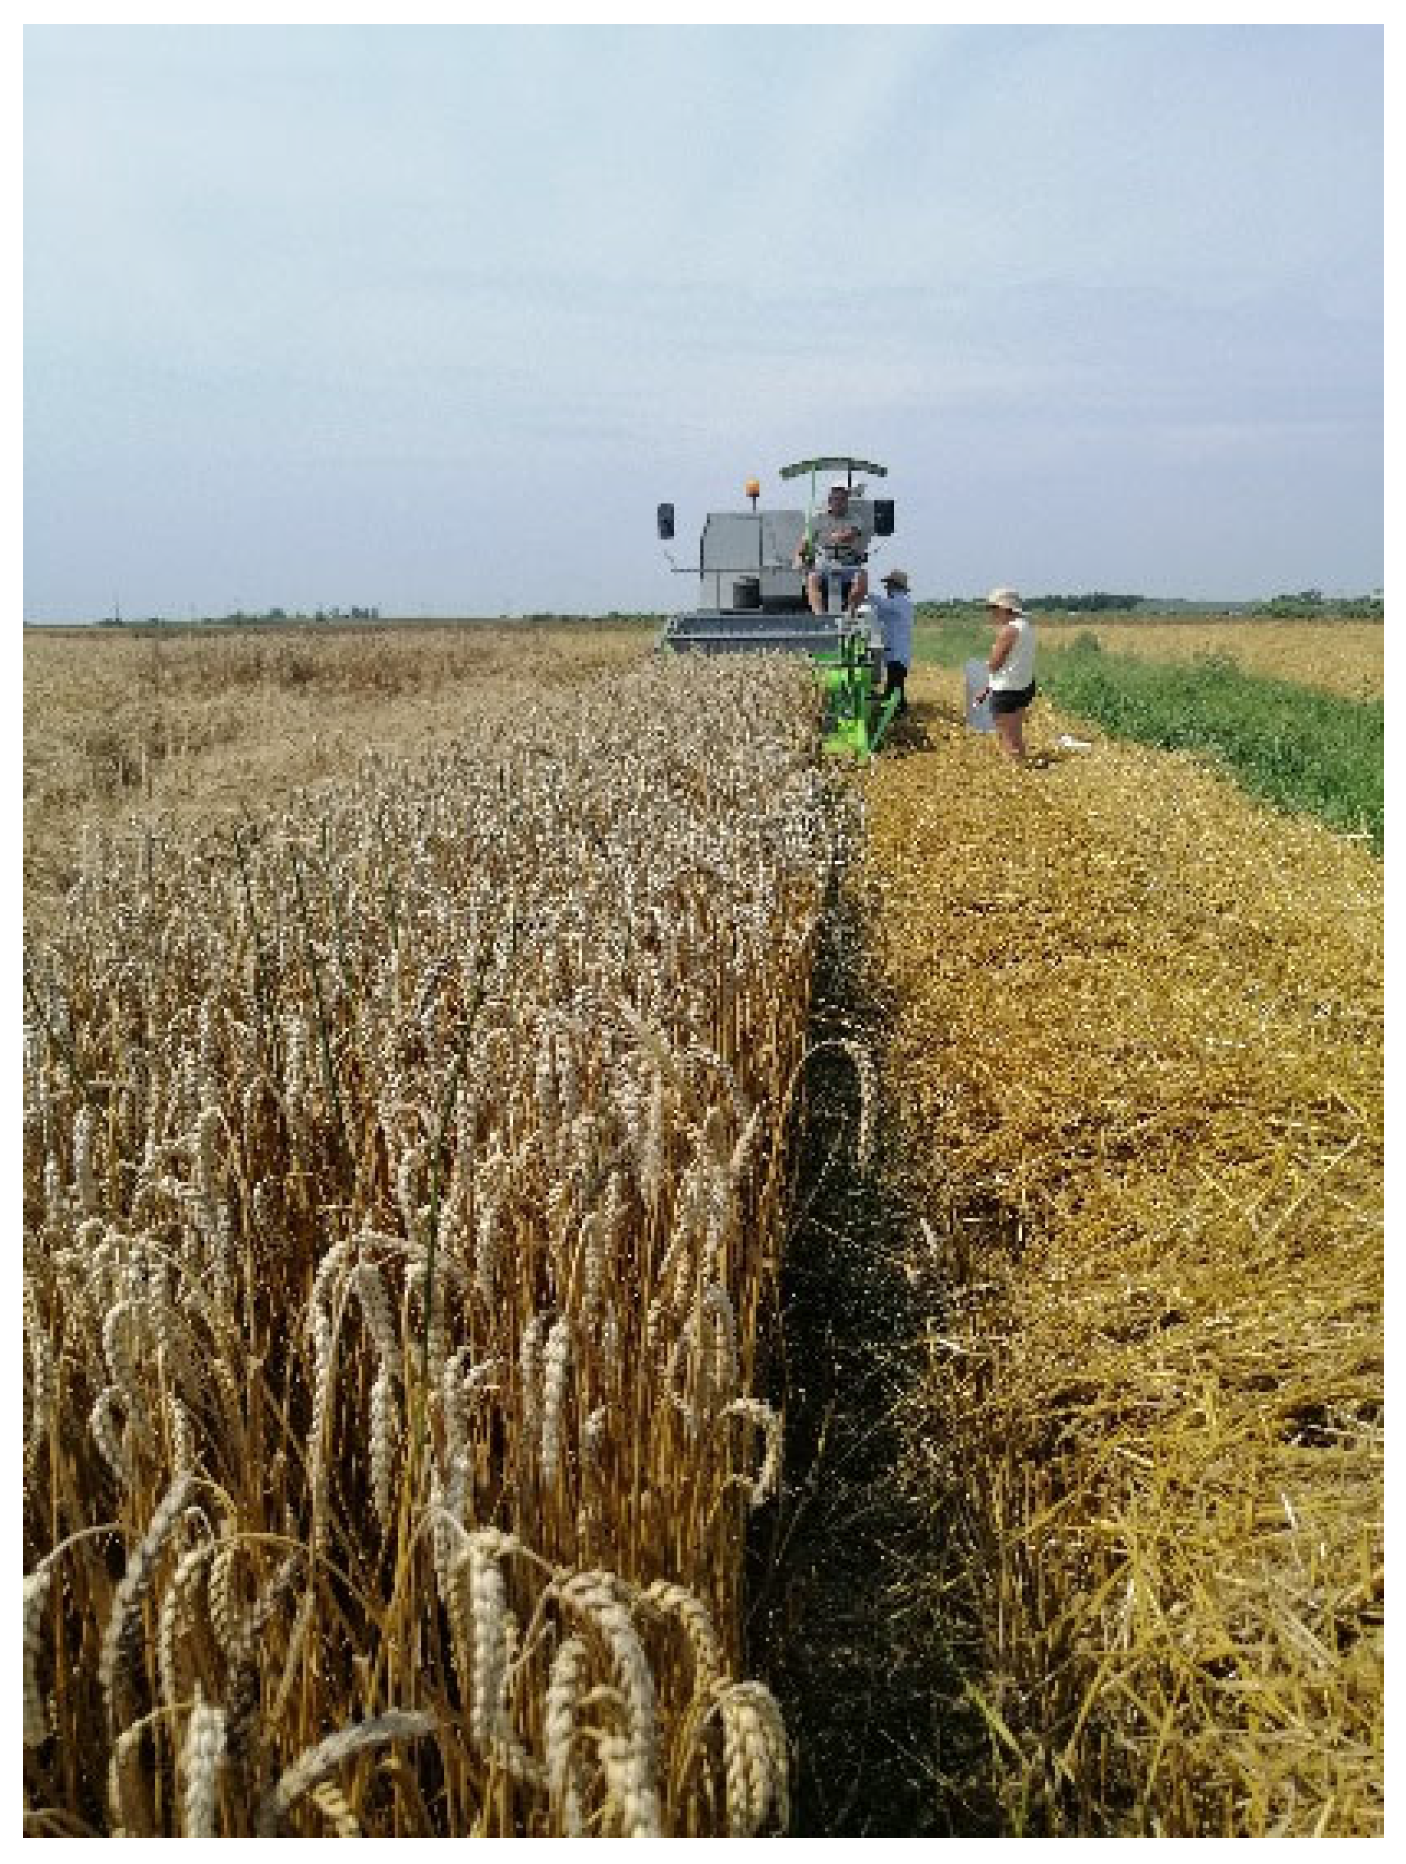

Table 1.
Cultivated areas and production of triticale worldwide in 2022 (FAO, 2022).
| Crt. No. | The region | Area (ha) | Total production (t) | Yield (kg/ha) |
|---|---|---|---|---|
| 1 | Mondial | 3.616.655 | 14.157.880 | 3.914 |
| 2 | Europa | 3.152.094 | 13.008.741 | 4.127 |
| 3 | Asia | 300.155 | 707.688.63 | 2.357 |
| 4 | Oceania | 61.900 | 117.200 | 1.893 |
| 5 | Americas | 92.183 | 300.690 | 3.261 |
| 6 | Africa | 10.323 | 23.560 | 2.282 |
Table 2.
Largest growers of triticale (Triticosecale Wittmatck), 2022 (FAO, 2022).
| Crt. No. | Country | Area (ha) | Total production (to) | Yield (kg/ha) |
|---|---|---|---|---|
| 1 | Poland | 1.232.710 | 5.440.270 | 4.413 |
| 2 | Belarus | 406.000 | 1.192.880 | 2.938 |
| 3 | France | 339.700 | 1.613.730 | 4.750 |
| 4 | Germany | 324.400 | 1.929.700 | 5.948 |
| 5 | Spain | 280.350 | 634.890 | 2.264 |
| 6 | China | 199.671 | 386.071 | 1.933 |
| 7 | Russian Federation | 108.810 | 306.874 | 2.820 |
| 8 | Turkiye | 99.930 | 320.000 | 3.211 |
| 9 | Lithuania | 63.100 | 204.560 | 3.241 |
| 10 | Australia | 61.900 | 117.200 | 1.893 |
| 11 | Romania | 56.900 | 192.410 | 3.376 |
| 12 | Hungary | 55.340 | 186.480 | 3.369 |
| 13 | Austria | 51.500 | 292.870 | 5.686 |
| 14 | Czechia | 40.570 | 207.620 | 5117 |
Table 3.
Soil characteristics from the experimental field in Livada.
| MU cm cm |
Ap 0-18 0.15 |
Ao 18-40 |
AB 40-55 40-55 |
Bt1w 55-70 55-70 |
Bt2w 70-110 80-95 |
||
| 20-30 | 30-40 | ||||||
| Humus (Cx1.72) | % | 2.82 | 1.44 | 0.90 | 0.90 | 0.84 | 3.24 |
| N total | % | 0.168 | 0.102 | 0.072 | 0.068 | 0.064 | - |
| C:N | - | 8.21 | 9.15 | 10.14 | 10.34 | 10.57 | - |
| pH in water | - | 5.19 | 6.24 | 6.65 | 6.53 | 5.62 | 5.28 |
| Clay (<0.002 mm) | %g/g | 20.9 | 21.1 | 23.1 | 27.0 | 32.4 | 33.1 |
| Apparent density | g/cm3 | 1.35 | 1.54 | 1.49 | 1.48 | - | 1.48 |
| Hydraulic Conductivity | mm/h | 31.27 | 5.87 | 3.11 | 0.35 | - | 1.04 |
Table 4.
Monthly and mean temperature and monthly and the amount rainfall during the two cropping seasons (2021/2022 and 2022/2023).
Table 4.
Monthly and mean temperature and monthly and the amount rainfall during the two cropping seasons (2021/2022 and 2022/2023).
| Year | Climatic factor | Month | Mean temp. (°C) | The amount (mm/m2) | ||||||||
| Oct. | Nov. | Dec. | Jan. | Feb. | Mar. | Apr. | May | Jun. | ||||
| 2021/ 2022 |
Temp. (°C) | 9.0 | 5.3 | 1.1 | -1.8 | 2.8 | 4.4 | 8.9 | 16.3 | 22.1 | 7.6 | |
| Multi-year average | 9.8 | 4.8 | 0.1 | -2.1 | 0.1 | 4.7 | 10.5 | 15.8 | 19.0 | 7.0 | ||
| Difference ± | -0.8 | 0.5 | 1.0 | 0.3 | 2.7 | -0.3 | -1.6 | 0.5 | 3.1 | 0.6 | ||
| Rainfall (mm/m2) | 13.5 | 65.4 | 119.3 | 76.6 | 46.1 | 1.3 | 86.9 | 17.9 | 10.3 | 437.3 | ||
| Multi-year sum | 54.6 | 55.8 | 61.0 | 49.0 | 43.9 | 45.7 | 50.5 | 76.4 | 91.1 | 528.0 | ||
| Difference ± | -41.0 | 9.6 | 58.3 | 27.6 | 2.2 | -44.0 | 36.4 | -59.0 | -81.0 | -90.7 | ||
| 2022 /2023 |
Temp. (°C) | 11.8 | 6.2 | 3.1 | 4.8 | 1.5 | 6.4 | 9.6 | 16.3 | 19.7 | 8.8 | |
| Multi-year average | 9.8 | 4.8 | 0.1 | -2.0 | 0.1 | 4.7 | 10.5 | 15.8 | 19.0 | 7.0 | ||
| Difference ± | 2 | 1.4 | 3 | 6.8 | 1.4 | 1.7 | -0.9 | 0.5 | 0.7 | 1.8 | ||
| Rainfall (mm/m2) | 29.2 | 78.8 | 111.3 | 69.1 | 66.0 | 45.8 | 73.3 | 19.7 | 70.2 | 563.4 | ||
| Multi-year sum | 54.2 | 56.2 | 61.8 | 49.3 | 44.2 | 45.7 | 50.9 | 75.5 | 90.8 | 528.6 | ||
| Difference ± | -25 | 22.6 | 49.5 | 19.8 | 21.8 | 0.1 | 22.4 | -55.8 | -20.6 | 34.8 | ||
Table 5.
The influence of the variety on triticale production, 2022-2023.
| Year | Variant | Symbol | Production (kg/ha) | % | The difference | Significance |
|---|---|---|---|---|---|---|
| 2022 | Negoiu | A1 (Ct) | 8202.07 | 100.0 | 0.00 | Ct |
| 2023 | Negoiu | A1 (Ct) | 7434.41 | 100.0 | 0.00 | Ct |
| 2022 | Utrifun | A2 | 8386.30 | 102.2 | 184.22 | Ns |
| 2023 | Utrifun | A2 | 10845.07 | 145.9 | 3410.67 | *** |
| 2022 | Zvelt | A3 | 8130.89 | 99.1 | -71.19 | Ns |
| 2023 | Zvelt | A3 | 8604.00 | 115.7 | 1169.59 | * |
| 2022 | Tulnic | A4 | 7559.93 | 92.2 | -642.15 | 00 |
| 2023 | Tulnic | A4 | 7810.37 | 105.1 | 375.96 | Ns |
2022: LSD (p 5%) 385.26 kg/ha; LSD (p 1%) 583.40 kg/ha; LSD (p 0.1%) 937.21 kg/ha. 2023: LSD (p 5%) 925.65 kg/ha; LSD (p 1%) 1401.69 kg/ha; LSD (p 0.1%) 2251.78 kg/ha. Ct – control, Ns – non-significant ,* - significantly positive, *** - very significantly positive, Lsd – Least Significant Difference.
Table 6.
The influence of fertilization on triticale production, 2022-2023.
| Year | Variant | Symbol | Production (kg/ha) | % | The difference | Significance |
|---|---|---|---|---|---|---|
| 2022 | Chemical fertilization | B1 (Ct) | 8197.42 | 100.0 | 0.00 | Ct |
| 2023 | Chemical fertilization | B1 (Ct) | 8099.03 | 100.0 | 0.00 | Ct |
| 2022 | Chemical fertilization + foliar fertilization | B2 | 8027.44 | 97.9 | -169,97 | 0 |
| 2023 | Chemical fertilization + foliar fertilization | B2 | 8983.75 | 110.9 | 884.72 | *** |
| 2022 | Chemical fertilization + foliar fertilization + biostimulator | B3 | 7984.53 | 97.4 | -212,89 | 0 |
| 2023 | Chemical fertilization + foliar fertilization + biostimulator | B3 | 8937.61 | 110.4 | 838.58 | *** |
2022: LSD (p 5%) 166.98 kg/ha; LSD (p 1%) 222.98 kg/ha; LSD (p 0.1%) 290.93 kg/ha. 2023: LSD (p 5%) 266.42 kg/ha; LSD (p 1%) 366.96 kg/ha; LSD (p 0.1%) 505.20 kg/ha. Ct – control, 0 –- significantly negative, *** - very significantly positive , Lsd – Least Significant Difference.
Table 7.
The influence of sowing rate on triticale production, 2022-2023.
| Year | Variant (seeds/m²) |
Symbol | Production (kg/ha) | % | The difference | Significance |
|---|---|---|---|---|---|---|
| 2022 | 550 | C2 (Mt) | 8128,22 | 100.0 | 0.00 | Ct |
| 2023 | 550 | C2 (Mt) | 8683.53 | 100.0 | 0.00 | Ct |
| 2022 | 450 | C1 | 8071.42 | 99.3 | -56,81 | Ns |
| 2023 | 450 | C1 | 8809.39 | 101.4 | 125.86 | Ns |
| 2022 | 650 | C3 | 8009.75 | 95,5 | -118,47 | Ns |
| 2023 | 650 | C3 | 8527.47 | 98.2 | -156.05 | Ns |
2022: LSD (p 5%) 264.73 kg/ha; LSD (p 1%) 364.63 kg/ha;LSD (p 0.1%) 501.99 kg/ha. 2023: LSD (p 5%) 207.88 kg/ha; LSD (p 1%) 277.59 kg/ha; LSD (p 0.1%) 362.19 kg/ha. Ct – control, Ns – non-significant, Lsd – Least Significant Difference.
Table 8.
The influence of variaty and fertilization on triticale production, 2022-2023.
| Year | Variant | Symbol | Production (kg/ha) | % | The difference | Significance |
|---|---|---|---|---|---|---|
| 2022 | Negoiu x Chemical fertilization | A1 x B1 | 7943.00 | 100.0 | 0.00 | Ct |
| 2023 | Negoiu x Chemical fertilization | A1 x B1 | 7555.11 | 100.0 | 0.00 | Ct |
| 2022 | Utrifun x Chemical fertilization | A2 x B1 | 8779.44 | 110.5 | 836.44 | * |
| 2023 | Utrifun x Chemical fertilization | A2 x B1 | 9590.89 | 126.9 | 2035.78 | ** |
| 2022 | Zvelt x Chemical fertilization | A3 x B1 | 8156.44 | 102.7 | 213.44 | Ns |
| 2023 | Zvelt x Chemical fertilization | A3 x B1 | 9114.44 | 120.6 | 1559.33 | ** |
| 2022 | Tulnic x Chemical fertilization | A4 x B1 | 8244.11 | 103.8 | 301.11 | Ns |
| 2023 | Tulnic x Chemical fertilization | A4 x B1 | 6135.67 | 81.2 | -1419.45 | 0 |
| 2022 | Negoiu x Chemical fertilization + foliar fertilization | A1 x B2 | 8244.67 | 100.00 | 0.00 | Ct |
| 2023 | Negoiu x Chemical fertilization + foliar fertilization | A1 x B2 | 7186.44 | 100.0 | 0.00 | Ct |
| 2022 | Utrifun x Chemical fertilization + foliar fertilization | A2 x B2 | 7997.22 | 97.0 | -247.44 | Ns |
| 2023 | Utrifun x Chemical fertilization + foliar fertilization | A2 x B2 | 11244.78 | 156.5 | 4058.33 | *** |
| 2022 | Zvelt x Chemical fertilization + foliar fertilization | A3 x B2 | 8136.00 | 98.7 | -108.67 | Ns |
| 2023 | Zvelt x Chemical fertilization + foliar fertilization | A3 x B2 | 8739.11 | 121.6 | 1552.67 | ** |
| 2022 | Tulnic x Chemical fertilization + foliar fertilization | A4 x B2 | 7728.89 | 93.7 | -515.78 | Ns |
| 2023 | Tulnic x Chemical fertilization + foliar fertilization | A4 x B2 | 8764.67 | 122.0 | 1578.22 | ** |
| 2022 | Negoiu x Chemical fertilization + foliar fertilization + biostimulator | A1 x B3 | 8418.56 | 100.0 | 0.00 | Ct |
| 2023 | Negoiu x Chemical fertilization + foliar fertilization + biostimulator | A1 x B3 | 7561.67 | 100.0 | 0.00 | Ct |
| 2022 | Utrifun x Chemical fertilization + foliar fertilization + biostimulator | A2 x B3 | 8379.22 | 99.5 | -39.33 | Ns |
| 2023 | Utrifun x Chemical fertilization + foliar fertilization + biostimulator | A2 x B3 | 11699.56 | 154.7 | 4137.89 | *** |
| 2022 | Zvelt x Chemical fertilization + foliar fertilization + biostimulator | A3 x B3 | 8100.22 | 96.2 | -318.33 | Ns |
| 2023 | Zvelt x Chemical fertilization + foliar fertilization + biostimulator | A3 x B3 | 7958.44 | 105.2 | 396.78 | Ns |
| 2022 | Tulnic x Chemical fertilization + foliar fertilization + biostimulator | A4 x B3 | 7034.56 | 83.6 | -1384.00 | 000 |
| 2023 | Tulnic x Chemical fertilization + foliar fertilization + biostimulator | A4 x B3 | 8530.78 | 112.8 | 969.11 | Ns |
2022: LSD (p 5%) 618.89 kg/ha; LSD (p 1%) 881.62 kg/ha; LSD (p 0.1%) 1287.89 kg/ha. 2023: LSD (p 5%) 1021.06 kg/ha; LSD (p 1%) 1517.74 kg/ha; LSD (p 0.1%) 2372.49 kg/ha. Ct – control, Ns – non-significant , * - significantly positive, ** - distinctly significant positive *** - very significantly positive , 0 - significantly negative, 000 - very significantly negative, Lsd – Least Significant Difference.
Table 9.
The influence of the variaty and the sowing thickness on triticale production, 2022-2023.
| Year | Variant | Symbol | Production (kg/ha) | % | The difference | Significance |
|---|---|---|---|---|---|---|
| 2022 | Negoiu x 450 seeds/m2 | A1 x C1 | 8095.89 | 100.0 | 0.00 | Ct |
| 2023 | Negoiu x 450 seeds/m2 | A1 x C1 | 7624.89 | 100.0 | 0.00 | Ct |
| 2022 | Utrifun x 450 seeds/m2 | A2 x C1 | 8385.67 | 103.6 | 289.78 | Ns |
| 2023 | Utrifun x 450 seeds/m2 | A2 x C1 | 10728.56 | 140.7 | 3103.67 | *** |
| 2022 | Zvelt x 450 seeds/m2 | A3 x C1 | 7960.11 | 98.3 | -135.78 | Ns |
| 2023 | Zvelt x 450 seeds/m2 | A3 x C1 | 8856.44 | 116.2 | 1231.56 | * |
| 2022 | Tulnic x 450 seeds/m2 | A4 x C1 | 7844.00 | 96.9 | -251.89 | Ns |
| 2023 | Tulnic x 450 seeds/m2 | A4 x C1 | 8027.67 | 105.3 | 402.78 | Ns |
| 2022 | Negoiu x 550 seeds/m2 | A1 x C2 | 8213.33 | 100.0 | 0.00 | Ct |
| 2023 | Negoiu x 550 seeds/m2 | A1 x C2 | 7300.22 | 100.0 | 0.00 | Ct |
| 2022 | Utrifun x 550 seeds/m2 | A2 x C2 | 8408.89 | 102.4 | 195.56 | Ns |
| 2023 | Utrifun x 550 seeds/m2 | A2 x C2 | 11010.44 | 150.8 | 3710.22 | *** |
| 2022 | Zvelt x 550 seeds/m2 | A3 x C2 | 8292.56 | 101.0 | 79.22 | Ns |
| 2023 | Zvelt x 550 seeds/m2 | A3 x C2 | 8788.56 | 120.4 | 1488.33 | ** |
| 2022 | Tulnic x 550 seeds/m2 | A4 x C2 | 7592.56 | 92.4 | -620.78 | 0 |
| 2023 | Tulnic x 550 seeds/m2 | A4 x C2 | 7634.89 | 104.6 | 334.67 | Ns |
| 2022 | Negoiu x 650 seeds/m2 | A1 x C3 | 8297.00 | 100.0 | 0.00 | Ct |
| 2023 | Negoiu x 650 seeds/m2 | A1 x C3 | 7378.11 | 100.0 | 0.00 | Ct |
| 2022 | Utrifun x 650 seeds/m2 | A2 x C3 | 8361.33 | 100.8 | 64.33 | Ns |
| 2023 | Utrifun x 650 seeds/m2 | A2 x C3 | 10796.22 | 146.3 | 3418.11 | *** |
| 2022 | Zvelt x 650 seeds/m2 | A3 x C3 | 8140.00 | 98.1 | -157.00 | Ns |
| 2023 | Zvelt x 650 seeds/m2 | A3 x C3 | 8167.00 | 110.7 | 788.89 | Ns |
| 2022 | Tulnic x 650 seeds/m2 | A4 x C3 | 7571.00 | 91.2 | -726.00 | 00 |
| 2023 | Tulnic x 650 seeds/m2 | A4 x C3 | 7768.56 | 105.3 | 390.44 | Ns |
2022: LSD (p 5%) 466.05 kg/ha; LSD (p 1%) 673.84 kg/ha; LSD (p 0.1%) 1010.69 kg/ha. 2023: LSD (p 5%) 983.59 kg/ha; LSD (p 1%) 1464.65 kg/ha; LSD (p 0.1%) 2297.10 kg/ha. Ct – control, Ns – non-significant, * - significantly positive, *** - very significantly positive , 0 - significantly negative, 00 - distinctly significantly negative, Lsd – Least Significant Difference.
Table 10.
The influence of the fertilization and the sowing thickness on triticale production, 2022-2023.
Table 10.
The influence of the fertilization and the sowing thickness on triticale production, 2022-2023.
| Year | Variant | Symbol | Production (kg/ha) | % | The difference | Significance |
|---|---|---|---|---|---|---|
| 2022 | Chemical fertilization x 450 seeds/m2 | B1 x C1 | 8176.42 | 100.0 | 0.00 | Ct |
| 2023 | Chemical fertilization x 450 seeds/m2 | B1 x C1 | 8342.08 | 100.0 | 0.00 | Ct |
| 2022 | Chemical fertilization + foliar fertilization x 450 seeds/m2 | B2 x C1 | 7983.58 | 97.6 | -192.83 | Ns |
| 2023 | Chemical fertilization + foliar fertilization x 450 seeds/m2 | B2 x C1 | 9029.17 | 108.2 | 687.08 | ** |
| 2022 | Chemical fertilization + foliar fertilization + biostimulator x 450 seeds/m2 | B3 x C1 | 8054.25 | 98.5 | -122.17 | Ns |
| 2023 | Chemical fertilization + foliar fertilization + biostimulator x 450 seeds/m2 | B3 x C1 | 9056.92 | 108.6 | 714.83 | ** |
| 2022 | Chemical fertilization x 550 seeds/m2 | B1 x C2 | 8227.17 | 100.0 | 0.00 | Ct |
| 2023 | Chemical fertilization x 550 seeds/m2 | B1 x C2 | 8098.08 | 100.0 | 0.00 | Ct |
| 2022 | Chemical fertilization + foliar fertilization x 550 seeds/m2 | B2 x C2 | 8109.92 | 98.6 | -117.25 | Ns |
| 2023 | Chemical fertilization + foliar fertilization x 550 seeds/m2 | B2 x C2 | 9124.67 | 112.7 | 1026.58 | *** |
| 2022 | Chemical fertilization + foliar fertilization + biostimulator x 550 seeds/m2 | B3 x C2 | 8043.42 | 97.8 | -183.75 | Ns |
| 2023 | Chemical fertilization + foliar fertilization + biostimulator x 550 seeds/m2 | B3 x C2 | 8827.83 | 109.0 | 729.75 | *** |
| 2022 | Chemical fertilization x 650 seeds/m2 | B1 x C3 | 8438.67 | 100.0 | 0.00 | Ct |
| 2023 | Chemical fertilization x 650 seeds/m2 | B1 x C3 | 7859.92 | 100.0 | 0.00 | Ct |
| 2022 | Chemical fertilization + foliar fertilization x 650 seeds/m2 | B2 x C3 | 7986.58 | 94.6 | -452.08 | 0 |
| 2023 | Chemical fertilization + foliar fertilization x 650 seeds/m2 | B2 x C3 | 8797.42 | 112.0 | 940.50 | *** |
| 2022 | Chemical fertilization + foliar fertilization + biostimulator x 650 seeds/m2 | B3 x C3 | 7851.75 | 93.0 | -586.92 | 00 |
| 2023 | Chemical fertilization + foliar fertilization + biostimulator x 650 seeds/m2 | B3 x C3 | 8928.08 | 113.6 | 1071.17 | *** |
2022: LSD (p 5%) 380.91 kg/ha; LSD (p 1%) 518.34 kg/ha; LSD (p 0.1%) 699.19 kg/ha. 2023: LSD (p 5%) 396.61 kg/ha; LSD (p 1%) 536.90 kg/ha; LSD (p 0.1%) 717.74 Kg/ha. Ct – control,Ns – non-significant, ** - distinctly significantly positive, *** - very significantly positive , 0 - significantly negative, 00 - distinctly significantly negative, Lsd – Least Significant Difference.
Table 11.
The influence of variety, fertilization and the sowing thickness on triticale production, 2022-2023.
Table 11.
The influence of variety, fertilization and the sowing thickness on triticale production, 2022-2023.
| Year | Variant | Symbol | Production (kg/ha) | % | The difference | Significance |
|---|---|---|---|---|---|---|
| 2022 | Negoiu x Chemical fertilization x 450 seeds/m2 | A1 x B1x C1 | 7746.33 | 100.0 | 0.00 | Ct |
| 2023 | Negoiu x Chemical fertilization x 450 seeds/m2 | A1 x B1 x C1 | 7693.33 | 100.0 | 0.00 | Ct |
| 2022 | Utrifun x Chemical fertilization x 450 seeds/m2 | A2 x B1 x C1 | 8794.33 | 113.5 | 1048.00 | * |
| 2023 | Utrifun x Chemical fertilization x 450 seeds/m2 | A2 x B1 x C1 | 9645.00 | 125.4 | 1951.67 | ** |
| 2022 | Zvelt x Chemical fertilization x 450 seeds/m2 | A3 x B1 x C1 | 7980.33 | 103.0 | 234.00 | Ns |
| 2023 | Zvelt x Chemical fertilization x 450 seeds/m2 | A3 x B1 x C1 | 9506.67 | 123.6 | 1813.33 | ** |
| 2022 | Tulnic x Chemical fertilization x 450 seeds/m2 | A4 x B1 x C1 | 8148.67 | 105.7 | 438.33 | Ns |
| 2023 | Tulnic x Chemical fertilization x 450 seeds/m2 | A4 x B1 x C1 | 6523.33 | 84.8 | -1170.00 | Ns |
| 2022 | Negoiu x Chemical fertilization x 550 seeds/m2 | A1 x B1 x C2 | 7840.33 | 100.0 | 0.00 | Ct |
| 2023 | Negoiu x Chemical fertilization x 550 seeds/m2 | A1 x B1 x C2 | 7476.33 | 100.0 | 0.00 | Ct |
| 2022 | Utrifun x Chemical fertilization x 550 seeds/m2 | A2 x B1 x C2 | 8742.67 | 111.5 | 902.33 | * |
| 2023 | Utrifun x Chemical fertilization x 550 seeds/m2 | A2 x B1 x C2 | 9718.00 | 130.0 | 2241.67 | ** |
| 2022 | Zvelt x Chemical fertilization x 550 seeds/m2 | A3 x B1 x C2 | 8453.00 | 107.8 | 612.67 | Ns |
| 2023 | Zvelt x Chemical fertilization x 550 seeds/m2 | A3 x B1 x C2 | 9188.00 | 122.9 | 1712.33 | ** |
| 2022 | Tulnic x Chemical fertilization x 550 seeds/m2 | A4 x B1 x C2 | 7872.67 | 100.4 | 32.33 | Ns |
| 2023 | Tulnic x Chemical fertilization x 550 seeds/m2 | A4 x B1 x C2 | 6009.33 | 80.4 | -1467.00 | 0 |
| 2022 | Negoiu x Chemical fertilization x 650 seeds/m2 | A1 x B1 x C3 | 8242.33 | 100.0 | 0.00 | Ct |
| 2023 | Negoiu x Chemical fertilization x 650 seeds/m2 | A1 x B1 x C3 | 7495.67 | 100.0 | 0.00 | Ct |
| 2022 | Utrifun x Chemical fertilization x 650 seeds/m2 | A2 x B1 x C3 | 8801.33 | 106.8 | 559.00 | Ns |
| 2023 | Utrifun x Chemical fertilization x 650 seeds/m2 | A2 x B1 x C3 | 9409.67 | 125.5 | 1914.00 | ** |
| 2022 | Zvelt x Chemical fertilization x 650 seeds/m2 | A3 x B1 x C3 | 8036.00 | 97.5 | -206.33 | Ns |
| 2023 | Zvelt x Chemical fertilization x 650 seeds/m2 | A3 x B1 x C3 | 8648.00 | 115.4 | 1152.33 | Ns |
| 2022 | Tulnic x Chemical fertilization x 650 seeds/m2 | A4 x B1 x C3 | 8675.00 | 105.2 | 432.67 | Ns |
| 2023 | Tulnic x Chemical fertilization x 650 seeds/m2 | A4 x B1 x C3 | 5874.33 | 78.4 | -1621.33 | 0 |
| 2022 | Negoiu x Chemical fertilization + foliar fertilization x 450 seeds/m2 | A1 x B2 x C1 | 8044.67 | 100.0 | 0.00 | Ct |
| 2023 | Negoiu x Chemical fertilization + foliar fertilization x 450 seeds/m2 | A1 x B2 x C1 | 7508.33 | 100.0 | 0.00 | Ct |
| 2022 | Utrifun x Chemical fertilization + foliar fertilization x 450 seeds/m2 | A2 x B2 x C1 | 7951.67 | 98.8 | -93.00 | Ns |
| 2023 | Utrifun x Chemical fertilization + foliar fertilization x 450 seeds/m2 | A2 x B2 x C1 | 10991.00 | 146.4 | 3482.67 | *** |
| 2022 | Zvelt x Chemical fertilization + foliar fertilization x 450 seeds/m2 | A3 x B2 x C1 | 7947.33 | 98.8 | -97.33 | Ns |
| 2023 | Zvelt x Chemical fertilization + foliar fertilization x 450 seeds/m2 | A3 x B2 x C1 | 8776.33 | 116.9 | 1268.0 | * |
| 2022 | Tulnic x Chemical fertilization + foliar fertilization x 450 seeds/m2 | A4 x B2 x C1 | 7990.67 | 99.3 | -54.00 | Ns |
| 2023 | Tulnic x Chemical fertilization + foliar fertilization x 450 seeds/m2 | A4 x B2 x C1 | 8841.00 | 117.1 | 1332.67 | * |
| 2022 | Negoiu x Chemical fertilization + foliar fertilization x 550 seeds/m2 | A1 x B2 x C2 | 8301.33 | 100.0 | 0.00 | Ct |
| 2023 | Negoiu x Chemical fertilization + foliar fertilization x 550 seeds/m2 | A1 x B2 x C2 | 7086.67 | 100.0 | 0.00 | Ct |
| 2022 | Utrifun x Chemical fertilization + foliar fertilization x 550 seeds/m2 | A2 x B2 x C2 | 8080.33 | 97.3 | -221.00 | Ns |
| 2023 | Utrifun x Chemical fertilization + foliar fertilization x 550 seeds/m2 | A2 x B2 x C2 | 11400.33 | 160.9 | 4313.67 | *** |
| 2022 | Zvelt x Chemical fertilization + foliar fertilization x 550 seeds/m2 | A3 x B2 x C2 | 8211.00 | 98.9 | -90.33 | Ns |
| 2023 | Zvelt x Chemical fertilization + foliar fertilization x 550 seeds/m2 | A3 x B2 x C2 | 9206.00 | 129.9 | 2119.33 | ** |
| 2022 | Tulnic x Chemical fertilization + foliar fertilization x 550 seeds/m2 | A4 x B2 x C2 | 7847.00 | 94.5 | -454.33 | Ns |
| 2023 | Tulnic x Chemical fertilization + foliar fertilization x 550 seeds/m2 | A4 x B2 x C2 | 8805.67 | 124.3 | 1719.00 | ** |
| 2022 | Negoiu x Chemical fertilization + foliar fertilization x 650 seeds/m2 | A1 x B2 x C3 | 8388.00 | 100.0 | 0.00 | Ct |
| 2023 | Negoiu x Chemical fertilization + foliar fertilization x 650 seeds/m2 | A1 x B2 x C3 | 6967.33 | 100.0 | 0.00 | Ct |
| 2022 | Utrifun x Chemical fertilization + foliar fertilization x 650 seeds/m2 | A2 x B2 x C3 | 7959.67 | 94.9 | -428.33 | Ns |
| 2023 | Utrifun x Chemical fertilization + foliar fertilization x 650 seeds/m2 | A2 x B2 x C3 | 11343.00 | 162.9 | 4378.67 | *** |
| 2022 | Zvelt x Chemical fertilization + foliar fertilization x 650 seeds/m2 | A3 x B2 x C3 | 8249.67 | 94.9 | -138.33 | Ns |
| 2023 | Zvelt x Chemical fertilization + foliar fertilization x 650 seeds/m2 | A3 x B2 x C3 | 8235.00 | 118.2 | 1270.67 | * |
| 2022 | Tulnic x Chemical fertilization + foliar fertilization x 650 seeds/m2 | A4 x B2 x C3 | 7349.00 | 87.6 | -1039.00 | 0 |
| 2023 | Tulnic x Chemical fertilization + foliar fertilization x 650 seeds/m2 | A4 x B2 x C3 | 8647.33 | 124.2 | 1683.0 | * |
| 2022 | Negoiu x Chemical fertilization + foliar fertilization + biostimulator x 450 seeds/m2 | A1 x B3 x C1 | 8496.67 | 100.0 | 0.00 | Ct |
| 2023 | Negoiu x Chemical fertilization + foliar fertilization + biostimulator x 450 seeds/m2 | A1 x B3 x C1 | 7673.0 | 100.0 | 0.00 | Ct |
| 2022 | Utrifun x Chemical fertilization + foliar fertilization + biostimulator x 450 seeds/m2 | A2 x B3 x C1 | 8411.00 | 99.0 | -85.67 | Ns |
| 2023 | Utrifun x Chemical fertilization + foliar fertilization + biostimulator x 450 seeds/m2 | A2 x B3 xC1 | 11549.67 | 150.5 | 3876.67 | *** |
| 2022 | Zvelt x Chemical fertilization + foliar fertilization + biostimulator x 450 seeds/m2 | A3 x B3 x C1 | 7952.67 | 93.6 | -544.00 | Ns |
| 2023 | Zvelt x Chemical fertilization + foliar fertilization + biostimulator x 450 seeds/m2 | A3 x B3 xC1 | 8286.33 | 108.0 | 613.33 | Ns |
| 2022 | Tulnic x Chemical fertilization + foliar fertilization + biostimulator x 450 seeds/m2 | A4 x B3 x C1 | 7356.67 | 86.6 | -1140.00 | 00 |
| 2023 | Tulnic x Chemical fertilization + foliar fertilization + biostimulator x 450 seeds/m2 | A4 x B3 x C1 | 8718.67 | 113.6 | 1045.67 | Ns |
| 2022 | Negoiu x Chemical fertilization + foliar fertilization + biostimulator x 550 seeds/m2 | A1 x B3 x C2 | 8498.33 | 100.0 | 0.00 | Ct |
| 2023 | Negoiu x Chemical fertilization + foliar fertilization + biostimulator x 550 seeds/m2 | A1 x B3 x C2 | 7337.67 | 100.0 | 0.00 | Ct |
| 2022 | Utrifun x Chemical fertilization + foliar fertilization + biostimulator x 550 seeds/m2 | A2 x B3 x C2 | 8403.67 | 98.9 | -94.67 | Ns |
| 2023 | Utrifun x Chemical fertilization + foliar fertilization + biostimulator x 550 seeds/m2 | A2 x B3 x C2 | 11913.00 | 162.4 | 4575.33 | *** |
| 2022 | Zvelt x Chemical fertilization + foliar fertilization + biostimulator x 550 seeds/m2 | A3 x B3 x C2 | 8213.67 | 96.7 | -284.67 | Ns |
| 2023 | Zvelt x Chemical fertilization + foliar fertilization + biostimulator x 550 seeds/m2 | A3 x B3 x C2 | 7917.00 | 108.6 | 633.33 | Ns |
| 2022 | Tulnic x Chemical fertilization + foliar fertilization + biostimulator x 550 seeds/m2 | A4 x B3 x C2 | 7058.00 | 83.1 | -1440.33 | 00 |
| 2023 | Tulnic x Chemical fertilization + foliar fertilization + biostimulator x 550 seeds/m2 | A4 x B3 x C2 | 8089.67 | 110.2 | 752.00 | Ns |
| 2022 | Negoiu x Chemical fertilization + foliar fertilization + biostimulator x 650 seeds/m2 | A1 x B3 x C3 | 8260.67 | 100.0 | 0.00 | Ct |
| 2023 | Negoiu x Chemical fertilization + foliar fertilization + biostimulator x 650 seeds/m2 | A1 x B3 x C3 | 7674.33 | 100.0 | 0.00 | Ct |
| 2022 | Utrifun x Chemical fertilization + foliar fertilization + biostimulator x 650 seeds/m2 | A2 x B3 x C3 | 8323.00 | 100.8 | 62.33 | Ns |
| 2023 | Utrifun x Chemical fertilization + foliar fertilization + biostimulator x 650 seeds/m2 | A2 x B3 x C3 | 11636.00 | 151.6 | 3961.67 | *** |
| 2022 | Zvelt x Chemical fertilization + foliar fertilization + biostimulator x 650 seeds/m2 | A3 x B3 x C3 | 8134.33 | 98.5 | -126.33 | Ns |
| 2023 | Zvelt x Chemical fertilization + foliar fertilization + biostimulator x 650 seeds/m2 | A3 x B3 x C3 | 7618.00 | 99.3 | -56.33 | Ns |
| 2022 | Tulnic x Chemical fertilization + foliar fertilization + biostimulator x 650 seeds/m2 | A4 x B3 x C3 | 6689.00 | 81.0 | -1571.67 | 000 |
| 2023 | Tulnic x Chemical fertilization + foliar fertilization + biostimulator x 650 seeds/m2 | A4 x B3 x C3 | 8784.00 | 114.5 | 1109.67 | Ns |
2022: LSD (p 5%) 776.62 kg/ha; LSD (p 1%) 1079.28 kg/ha; LSD (p 0.1%) 1513.49 kg/ha. 2023: LSD (p 5%) 1174.94 kg/ha; LSD (p 1%) 1696.50 kg/ha; LSD (p 0.1%) 2537.79 Kg/ha. Ct – control, Ns – non-significant, * - significantly positive, ** - distinctly significantly positive, *** - very significantly positive , 0 - significantly negative, 00 - distinctly significantly negative, 000 - very significantly negative, Lsd – Least Significant Difference.
Disclaimer/Publisher’s Note: The statements, opinions and data contained in all publications are solely those of the individual author(s) and contributor(s) and not of MDPI and/or the editor(s). MDPI and/or the editor(s) disclaim responsibility for any injury to people or property resulting from any ideas, methods, instructions or products referred to in the content. |
© 2024 by the authors. Licensee MDPI, Basel, Switzerland. This article is an open access article distributed under the terms and conditions of the Creative Commons Attribution (CC BY) license (http://creativecommons.org/licenses/by/4.0/).
Copyright: This open access article is published under a Creative Commons CC BY 4.0 license, which permit the free download, distribution, and reuse, provided that the author and preprint are cited in any reuse.


