
Submitted:
04 November 2024
Posted:
05 November 2024
You are already at the latest version
Abstract
Dominant mutations in COL3A1 are known to cause vascular Ehlers-Danlos syndrome (vEDS) by impairing extracellular matrix (ECM) homeostasis. This disruption leads to the fragility of soft connective tissues and a significantly increased risk of life-threatening arterial and organ ruptures. Currently, treatments for vEDS are primarily symptomatic, largely due to a limited understanding of its underlying pathobiology and molecular mechanisms. In this study, we conducted a com-prehensive analysis of the intracellular proteome of vEDS fibroblasts, integrating these findings with our previous transcriptome results to identify key molecular pathways that drive the disease. Additionally, we explored the therapeutic potential of inhibiting miR-29b-3p as a proof of concept. Our integrative multi-omics analysis revealed complex pathological networks, emphasizing the critical role of miRNAs, particularly miR-29b-3p, in impairing ECM organization, autophagy, and cellular stress responses, all of which contribute to the pathogenesis of vEDS. Notably. the inhi-bition of miR-29b-3p in vEDS fibroblasts resulted in the upregulation of several differentially expressed target genes involved in these critical processes, as well as increased protein expression of essential ECM components, such as collagen types V and I. These changes suggest potential therapeutic benefits aimed at improving ECM integrity and restoring intracellular homeostasis. Overall, these insights not only enhance our understanding of the complex biological mechanisms underlying vEDS but also provide a solid foundation for future research focused on developing targeted treatment strategies to address this life-threatening disorder effectively.
Keywords:
extracellular matrix
; collagen type I
; collagen type V
; miR-29b
; multi-omics approach
; proteome
; transcriptome
; vascular Ehlers-Danlos syndrome
1. Introduction
Vascular Ehlers-Danlos syndrome (vEDS) is a severe connective tissue disorder caused by dominant mutations in the COL3A1 gene, which encodes the α1 chain of type III collagen (COLLIII). COLLIII is the major collagen in blood vessels and hollow organs, playing a crucial role in conferring strength and flexibility to these structures. A deficiency in COLLIII leads to soft connective tissues fragility, resulting in increased bruising, and heightened risk of arterial and bowel ruptures, as well as fragility in the uterus, cervix, and vagina during pregnancy and delivery.
The diagnosis of vEDS involves evaluating major and minor clinical criteria defined in 2017, alongside confirming the presence of a pathogenetic COL3A1 variant through molecular testing [1]. Ruptures of hollow organs, such as arteries, uterus, and intestines, can unpredictably occur in youth, with arterial ruptures being the foremost cause of mortality [2,3,4]. Currently, there are no approved therapies for treating vEDS patients, and the outcomes of endovascular and surgical treatment are poor, making prevention essential [5]. In 2010, the Beta Blocker in Ehlers-Danlos Syndrome Trial (BBEST) demonstrated a 64% reduction of the risk of arterial rupture or dissection among patients treated with celiprolol compared to controls [6]. Celiprolol, a β1 cardio-selective blocker with a β2-agonist vasodilator effect, is currently used off-label in Europe, but evidence regarding its true benefits, potential mechanisms, and overall efficacy remains limited and is still a matter of debate. Indeed, it has been recently shown that despite celiprolol therapy, vEDS patients continue to experience persistently high rates of serious vascular complications [7]. Furthermore, after clinical trials in the USA [8], celiprolol was declined FDA approval due to poor tolerance in one-third of patients. Following BBEST, no other medication has been clearly proven effective in preventing vascular complications in vEDS patients, though ongoing trials are investigating other cardiovascular drugs, such as angiotensin receptor blockers, which have yielded positive results in mouse models [9]. Additionally, targeting specific signaling pathways such as PKC/MEK/ERK (e.g., with cobimetinib, a MEK inhibitor) has been shown to improve survival in some but not all Col3a1 mouse models [10]. Considering the multisystemic nature of vEDS affecting diverse cell types, the effectiveness of targeting individual downstream pathways may be limited to specific cell types and/or mutations, as observed with celiprolol treatment in mice [9]. This underscores the need for new treatment strategies directly targeting common upstream molecular insults of COL3A1 mutations. Recently, the FDA-approved chemical chaperone 4-phenylbutyric acid has shown promise in addressing endoplasmic reticulum (ER) stress and protein folding defects in patient fibroblasts with glycine substitutions. As glycine substitutions are the most common pathogenetic variants [11], this highlights a potential therapeutic approach for addressing specific disease mechanisms associated with these prevalent alleles [12].
Albeit research has made significant strides in recent years, substantial progress remains ahead. From a biological perspective, there is still a limited understanding of the exact functional effects of COLLIII defect within the extracellular matrix (ECM) and how alterations in the ECM influence the underlying mechanisms of disease. In this regard, we recently conducted a comprehensive transcriptome and miRNome survey on a large cohort of patient and control dermal fibroblasts, providing an in-depth view of the molecular alterations in vEDS. The transcriptome analysis identified 3,189 differentially expressed genes (DEGs) involved in a complex pathological network, including disrupted ECM organization, altered proteostasis, ER stress response failure, and defective autophagy, all of which are likely key drivers of the disease mechanisms. miRNome analysis suggested that a subset of DEGs could potentially be regulated by specific differentially expressed miRNAs (DE-miRNAs), including miR-15b-5p, miR-16-5p, miR-21-3p, miR-24b-3p, miR-29a-3p, miR-29b-3p, and others. Among these, the upregulation of the miR-29 family members, particularly miR-29a-3p and miR-29b-3p, appears to significantly disrupt ECM turnover and cell survival processes, including ER proteostasis and the autophagy-lysosome pathway, both of which are crucial for maintaining vascular integrity [13]. Elevated expression of miR-29a/b has already been shown to negatively affect key genes involved in vascular ECM structure and turnover, such as collagens (COLLs), elastin (ELN), and ECM-modifying enzymes, contributing to aortic damage and aneurysm development [14]. These miRNAs may thus represent promising molecular targets for vEDS, with a significant impact on vascular pathogenesis [11].
In the present study, we aimed to integrate the transcriptome findings by conducting a comprehensive proteomic analysis of vEDS patient fibroblasts. Additionally, we performed preliminary functional studies to explore the therapeutic potential of modulating miR-29b-3p activity. These investigations could lay the groundwork for developing alternative, tailored therapies aimed at alleviating the burden of vEDS and enhancing patient management strategies.
2. Materials and Methods
2.1. Patients
This study was approved by the local Institutional Review Board (ASST degli Spedali Civili, Brescia, Italy, registration number NP5328) and included 9 adult vEDS patients (P1-P9, 6 females, 3 males) and 9 unrelated age-matched healthy individuals (C1-C9, 7 females, 2 males) who were previously recruited for our transcriptome and miRNome study [13] providing written informed consent for participation and skin biopsy in accordance with the Italian bioethical standards. All patients underwent evaluation at the specialized outpatient clinic for Ehlers-Danlos syndromes and related connective tissue disorders at the University Hospital Spedali Civili of Brescia. Diagnoses were made following the 2017 EDS nosology [1], and patients were molecularly characterized in our laboratory for a pathogenic dominant negative COL3A1 variant [2].
2.2. Cell Culture Conditions
Fibroblast cultures were established in our lab according to standard protocols from skin biopsies obtained from the same site in the upper arms of vEDS patients and healthy donors [13]. Fibroblasts were grown in vitro at 37 °C in a 5% CO2 atmosphere in Earle’s Modified Eagle Medium supplemented with 2 mM L-glutamine, 10% FBS, 100 μg/ml penicillin and streptomycin (Thermofisher Scientific). Cells were expanded until full confluency and then harvested by 0.25% trypsin/0.02% EDTA treatment at the same passage number (from 3rd to 5th).
Before conducting proteome analysis, we performed immunofluorescence analyses (IF) that verified the typical ECM component disorganization and integrin expression alteration in all analyzed patient fibroblast cell strains, consistent with our previous findings [15,16]. The disassembled ECM components included type I, III, and V COLLs (COLLI, COLLIII, COLLV), ELN, fibrillins (FBNs), fibronectin (FN), glycosaminoglycan chains (GAGs), and the core proteoglycans (PGs) perlecan, versican, and decorin. Furthermore, integrin expression analysis confirmed the absence of the α2β1 and α5β1 receptors and the presence of the αvβ3 integrin.
2.3. Label-Free Liquid Chromatography with Tandem Mass Spectrometry (LC-MS/MS)
For the proteomic experiment, 9 vEDS and 9 control cell strains were cultured in six-well plates with complete medium until reaching full confluency. Subsequently, cells were washed twice with PBS and incubated for 20 minutes in RIPA lysis buffer [20 mM Tris (pH 8.0), 150 mM NaCl, 0.1% SDS, 1% NP-40, and 0.5% sodium deoxycholate], supplemented with PhosSTOP and EDTA-free protease inhibitor tablets. Cell lysates were then centrifuged at 15,000 rpm for 20 minutes at 4 °C. The soluble fraction was collected, and protein concentration was measured using the colorimetric BCA protein assay kit (Pierce Chemical).
Protein extracts (30 µg) were precipitated in acetone and then reduced and alkylated in a solution of 6 M guanidine-HCl, 5 mM TCEP, and 20 mM chloroacetamide. Peptides were obtained digesting proteins with Lys-C for 3 h at 37 °C and with the endopeptidase sequencing-grade trypsin (Promega) overnight at 37 °C. Collected peptide mixtures were concentrated and desalted using the Stop and Go Extraction (STAGE) technique [17]. All the experiments were performed in label-free settings. Instruments for LC-MS/MS analysis consisted of a NanoLC 1200 coupled via a nano-electrospray ionization source to the quadrupole-based Q Exactive HF benchtop mass spectrometer [18].
For the chromatographic separation, a binary buffer system was used, consisting of solution A (0.1% formic acid) and solution B (80% acetonitrile and 0.1% formic acid). The peptides were separated based on their hydrophobicity using an analytical column (75 μm) packed in-house with C18-AQ 1.9 μm C18 resin. The separation process involved a gradient of 7-32% solvent B over 45 minutes, 32-45% B over 5 minutes, 45-95% B over 3 minutes, and finally 95-5% B over 5 minutes, with a flow rate of 300 nl/min.
MS data acquisition was performed in Data Independent Acquisition (DIA) mode using 32 variable windows, covering a mass range of 300–1650 m/z. The resolution was set to 60,000 for MS1 and 30,000 for MS2. The AGC target was 3e6 for both MS1 and MS2, with maximum injection times of 60 ms for MS1 and 54 ms for MS2. The normalized collision energies (NCE) were set to 25%, 27.5%, and 30%.
2.4. MS Data Processing and Analysis
Raw mass spectrometry data were processed using Spectronaut Software (2023 update). Protein assignment was performed by correlating spectra with the UniProt Homo sapiens database (v. 2024). Searches were conducted with tryptic specifications and default settings for mass tolerances for both MS and MS/MS spectra. Carbamidomethylation was set as a fixed modification, while oxidation and N-terminal acetylation were defined as variable modifications. The minimum and maximum peptide masses were set respectively to 7 and 470 Da, and the false discovery rate (FDR) for proteins and peptide-spectrum matches to 1%. Perseus software (1.6.2.3) was used to algorithmize, group, and filter protein abundances. Student’s t-test was performed with an FDR ≤ 0.05. Differentially expressed proteins (DEPs) with a log2 difference ≥ ±1 and a -log10 q-value <0.05 were considered significantly enriched. DEPs were further analyzed using Volcano plot and hierarchical clustering (HCA).
2.5. Bioinformatic Analyses
The biological interpretation of proteome changes was performed using Gene Ontology (GO) and Kyoto Encyclopedia of Genes and Genomes (KEGG) terms using the Enrich database. Fisher’s exact test was used to calculate enrichments in categorical terms, with a Benjamini-Hochberg FDR <0.05 set as threshold. Clustering analysis was conducted with STRING functional protein association networks software (version 12.0) to evaluate significant protein-protein interaction networks related to the identified DEPs. Biological network construction was carried out using the ClueGO and CluePedia plugins of the Cytoscape platform (version 3.10.2), clustering dysregulated proteins based on their association with GO terms, WikiPathways, KEGG, and REACTOME pathway annotation terms. To predict target genes of miR-29b-3p, the PicTar, DIANA, TargetScan, and miRanda algorithms were used via the miRNAtap R package. Data visualization was performed in the R statistical environment (version 4.4.0) using the following packages: readxl, ggplot2, pheatmap, ropls, scales, dplyr, and gridExtra.
2.6. Cells Transfection
Dermal fibroblasts from 3 vEDS patients were seeded in complete culture medium at a density of 2.5 × 10⁵ cells/ml per well in a 6-well plate. The cells were transfected after 24 hours using the HiPerFect transfection reagent, following the manufacturer’s instructions (Qiagen), with the following miRNAs at the final concentration of 150 pmol: anti-miRNA LNA inhibitor of hsa-miR-29b-3p (#YI04101843-DDA, inhibitor sequence: ACTGATTTCAAATGGTGCT), or negative control (NC) miRNA (#YI00199006-DDA, scrambled sequence: TAACACGTCTATACGCCCA). The culture medium was replaced 24 hours after transfection and cells were harvested at 48 and 72 hours after transfection for RNA and protein purification. Transfection efficiency was assessed using the hsa-miR-1-3p miRCURY LNA miRNA Mimic (#YM00472818-ADA, mimic sequence: UGGAAUGUAAAGAAGUAUGUAU), as this miRNA is not expressed in dermal fibroblasts, and its inhibitory effect was verified by quantifying the expression levels of the HDAC4 target gene.
2.7. mRNA and miRNA Expression Analyses
Total RNA, including miRNAs, was extracted from control and vEDS fibroblasts using the miRNeasy Mini Kit, according to the manufacturer’s instructions (Qiagen). To quantify the blood levels of hsa-miR-29b-3p, whole blood was collected in PAXgene Blood RNA Tubes (PreAnalytix), and RNA was isolated using the PAXgene Blood microRNA Kit, following the manufacturer’s instructions (Qiagen). RNA quality and concentration were assessed with the Agilent 2100 Bioanalyzer (Agilent Technology) and the Qubit fluorometer (Thermofisher Scientific).
The relative expression levels of a subset of hsa-miR-29b-3p target genes were confirmed through qPCR as previously reported [13]. Briefly, RNA samples were reverse transcribed with random primers, and qPCR was performed with SYBR Green dye and standard thermal cycling conditions on the QuantStudio 3 Real-Time PCR System (Thermofisher Scientific). ATP5B, CYC1, and RPLP0, were used for normalization. Primer sequences of target and housekeeping genes are reported in Supplementary Table 1.
To quantify the hsa-miR-29b-3p expression levels, 20 ng of total RNA was reverse transcribed using the miRCURY LNA RT kit, following the manufacturer’s instructions (Qiagen). qPCR was carried out with the miRCURY LNA miRNA SYBR Green PCR kit and miRCURY LNA miRNA PCR assay specific for hsa-miR-29b-3p (assay ID: YP00204679). SNORD48 (assay ID: YP00203903), U6 snRNA (assay ID: YP00203907), SNORA66 (assay ID: YP00203905), SNORD44 (assay ID: YP00203902), and SNORD38B (assay ID: YP00203901) reference miRNAs were amplified for normalization. Each sample was measured in technical triplicates. Relative mRNA and miRNA expression levels were normalized to the geometric mean of reference genes and analyzed using the 2^−(ΔΔCt) method. Statistical data were obtained with GraphPad Prism 8.0 by applying the unpaired Student’s t-test, with p <0.05 considered statistically significant.
2.8. Protein Quantification by Immunoblotting
The expression levels of COLLI and COLLV(α1) were evaluated by Western blotting (WB) on pooled extracts from untransfected, miR-29b inhibitor-transfected, and NC-transfected fibroblasts from 3 vEDS patients, as well as untransfected cells from 3 age- and sex-matched healthy donors. Control and patient cells were lysed with RIPA buffer (50 mM Tris HCl pH 7.4, 150 mM NaCl, 0.25% Na-DOC, 1% NP-40, 1 mM EDTA, 0.02 UI/ml aprotinin, 5 μg/ml leupeptin, 1 μg/ml pepstatin, 10 mM NaF, 5 mM Na3VO4, 1 mM PMSF) and centrifuged at 13,000 rpm at 4 °C for 10 minutes. The protein concentration of each pool was determined using the detergent compatible Bio-Rad Dc Protein Assay (Sigma Aldrich, #1001-491004), and each pool was loaded in triplicate.
To analyze COLLI, 35 μg of proteins were separated under reducing conditions by 8% SDS-PAGE electrophoresis. After nitrocellulose membranes transfer, the membranes were blocked overnight at 37 °C in 5% non-fat dry milk/TBS-0.1% (v/v) Tween 20 (TBS-T) and then immunoreacted for 3 hours at room temperature (RT) with 1:500 goat anti-human COLLI antibody (Merck-Millipore, #AB758) diluted in 5% non-fat dry milk/TBS-T. For COLLV(α1), 70 μg of proteins were resolved by 8% SDS-PAGE electrophoresis. The membranes were blocked for 3 hours at RT in 5% non-fat dry milk/TBS-T and immunoreacted overnight at +4 °C with 1:1,000 rabbit anti-human COL5A1 antibody (US Biological Life Science, #221804) diluted in 5% non-fat dry milk/TBS-T. After washing in TBS-T, membranes were incubated for 3 hours at RT with HRP-conjugated anti-goat IgGs (EMD Millipore-Merck Life Science, #401515) and anti-rabbit IgGs (Sigma Aldrich-Merck Life Science, #A8275), respectively, diluted 1:1,000 in 5% non-fat dry milk/TBS-T. Chemiluminescent signals were developed using the ECL method (Thermo Fisher Scientific, #34580).
Band quantification was performed using the Image Pro Plus software (Media Cybernetics), and the integrated optic density values were normalized against the total amount of proteins transferred on the membrane in the same lane, stained by Sypro Ruby Protein Blot Stain (Thermofisher Scientific, #S-11791).
Data analyses were performed with GraphPad Prism 8.0 software. Data are reported as means ± SEM. Differences were tested using Student’s t-test and results with p <0.05 were considered statistically significant.
3. Results
3.1. Exploring the Proteomic Landscape of vEDS Patient Fibroblasts and Its Integration with Transcriptomic Insights
Building on our previous transcriptomic study of vEDS fibroblasts [13], this research aimed to explore the proteomic landscape to identify altered protein networks and regulatory mechanisms potentially involved in the disease pathogenesis, while also integrating these findings with the transcriptomic data to provide a more comprehensive view of the molecular mechanisms driving vEDS.
Using a label-free LC-MS/MS approach, we analyzed the intracellular proteome of 9 patient-derived fibroblast samples and 9 control samples, both subsets selected from the 18 vEDS and 36 control samples used in the original transcriptomic study. This proteomic analysis identified a total of 5,485 proteins. After filtering for those present in at least 70% of samples per group, 5,058 proteins remained. Differential expression analysis between vEDS and control fibroblasts revealed 181 DEPs, with 164 downregulated and 17 upregulated (Supplementary Table 2). Principal component analysis (PCA) distinctly differentiated vEDS patients from healthy individuals, as illustrated in Figure 1A. Consistent with the PCA results, the heatmap showed two distinct clusters clearly separating patients from healthy donors (Figure 1B). Proteins with high and low fold changes, along with significant p-values, are represented as red and green dots, respectively, in the Volcano plot (Figure 1C).
PANTHER functional enrichment analysis of the 181 DEPs showed significant changes across various protein classes, with the most notable being metabolite interconversion enzymes (24%) and RNA metabolism proteins (16%). Other affected categories included protein binding activity modulators (9%), protein modifying enzymes (7%), scaffold/adaptor proteins (7%), transporters (7%), cytoskeletal proteins (5%), translational proteins (3%), ECM proteins (3%), and several others, each accounting for 1–2% (Supplementary Figure 1, Supplementary Table 3).
To integrate the proteomics results with the transcriptomics data of GSE239914 [13], both a Venn analysis and a dispersion plot comparison were performed. When matching the 3,189 DEGs from transcriptomics (2,618 downregulated and 571 upregulated) to the 181 DEPs from proteomics, we identified 67 shared genes and proteins (Figure 1D). Dispersion plots further revealed that most (54) of these 67 overlapping molecules were consistently downregulated at both the transcriptional and translational levels, while 13 showed opposite expression changes (Figure 1E, Supplementary Table 4).
Overall, despite differences in sample sizes and sensitivities between the two omics approaches, this integrative analysis revealed a significant overlap in expression patterns, underscoring the biological relevance of both data sets and offering a clearer perspective on the underlying mechanisms driving vEDS pathogenesis by uncovering 114 DEPs not detected at the transcriptional level (Supplementary Table 4).
To elucidate the biological significance of the proteome changes, we performed functional enrichment analysis on both the 54 overlapping genes/proteins and the 114 unique DEPs.
As illustrated in Figure 2A, GO analysis of the common downregulated DEPs/DEGs revealed enrichments in various biological processes and molecular functions mainly involved in protein transport/binding (e.g., NPM1, SNX2, SNX9, FUS, NADK2, GARS1, SMARCA4), RNA processing/splicing/binding (e.g., MBNL2, GTPBP4, PNO1, KMT2C, YARS1, GNL2, MTO1, WDR43, GTPBP4, LARP6, ERI3, TRA2A, RNPS1, RPL37, HNRNPH3, PQBP1, SRSF9), regulation of autophagy (e.g., CHMP1B, EI24, GABARAP, MTMR9, PIK3CA), and mitochondrial functions, including the assembly of the respiratory chain complex (e.g., COA3, SCO1, TIMM21, TTC19). The most enriched cellular components were intracellular non-membrane-bound organelles, nuclear lumen, and mitochondrial membrane. Spliceosome, endocytosis, autophagy, ribosome biogenesis, FoxO signaling pathway, mRNA surveillance pathway, aminoacyl-tRNA biosynthesis, and nicotinate and nicotinamide metabolism were the most enriched KEGG pathways.
The 114 proteins exclusively identified in the proteome were primarily associated with biological processes related to the regulation of the apoptosis and autophagy (BNIP3L, BNIP3, APBB1, CALHM2, CYP1B1, FAM162A, KCNMA1, SLIT2, SMPD1, ANGPTL4, DKK1, WDR45), as well as ECM organization, collagen fibril organization, and GAG metabolic process (COL1A1, COL1A2, ELN, SERPINF1, FBLN2, CYP1B1, LCP1, B4GALT7, EXT2, GALNT5, GALNT10). Among the molecular function categories, RNA binding (e.g., SRP19, SLC4A1AP, POP4, SAMD4A, DDX41, CHD2, RPP25L, ANKHD1, SMG5, RRP9, TRA2B, HABP4, HMGN2, LYAR, SRSF10, NOP10) was the most represented, with protein homodimerization activity (e.g., GSTM3, EXT2, SMAD4, BLTP3B, S100A1, RABL3, ENPP1), GTP(ase) binding (e.g., RAP2A, ARL6, RABL3, RAB22A, AKT3, RIGI, XPO5, CDC42EP2, HPS6), and metalloendopeptidase inhibitor activity (e.g., LXN, TIMP1) also being prominent. In terms of cellular compartments, the most enriched terms were those involved in vesicular trafficking from the ER to the Golgi, such as the TRAPPIII protein complex and the early endosome, followed by the collagen-containing ECM. According to the KEGG database, the most enriched pathways included focal adhesion and ECM-receptor interactions, fluid shear stress and atherosclerosis, FoxO signaling pathway, ribosome biogenesis, complement and coagulation cascades, protein digestion and absorption, and nicotinate and nicotinamide metabolism (Figure 2B).
To achieve a comprehensive understanding of the protein interaction network involving all the 181 DEPs, including the 13 with expression patterns opposite to the transcriptomic analysis (Figure 1E), we employed an integrative approach using both STRING analysis and ClueGO enrichment. The analysis of central nodes from biological networks, generated via the STRING database using all the 164 downregulated DEPs, confirmed that key impaired biological processes in vEDS cells include RNA binding and processing, ribosome biogenesis, and ECM organization, all linked to mechanisms of cell survival and growth. Additionally, processes such as autophagy and mitophagy, membrane trafficking, cell redox balance, hemostasis, and the metabolism of glycerophospholipid, GAG, and nicotinate/nicotinamide were also identified within the biological networks. Regarding the 17 upregulated proteins, the only high-confidence network formed primarily comprised proteins associated with calcium signaling (Figure 3A).
To delve deeper into the biological terms and pathways associated with the changes in protein expression, we used ClueGO, a Cytoscape plugin that integrates GO and KEGG pathway enrichment to visualize non-redundant biological terms in a network format, providing a comprehensive overview of the most significant pathways and their interrelationships (Figure 3B, Supplementary Table 6). This analysis revealed that the most interconnected biological network was primarily linked to the maintenance of ECM homeostasis, the disruption of which may lead to connective tissues fragility, a hallmark of the disease. Within this network, molecular functions and pathways related to collagen biosynthesis, modification, fibril assembly, and degradation were indeed prominently represented. Other key terms in this network included ECM PGs and syndecan interactions, which mediate cell-matrix adhesion and modulate several signaling cascades involved in ECM organization. Integrin-mediated and non-integrin membrane-ECM interactions were also enriched, suggesting impairments in cell-ECM adhesion and associated signaling pathways. These include both direct and indirect regulators, such as GPVI- and AGE-RAGE-mediated pathways, along with signaling by MET, NRP1, and the angiotensin II receptor type 1 pathway. These signaling cascades collectively regulate numerous cellular responses to stress and injury, including mechanical stress, a critical factor considering vascular fragility in vEDS patients. Further expanding on this network, enriched groups were identified involving proteins implicated in platelet activation and aggregation, as well as in the VEGFA-VEGFR2 signaling pathway, which regulates endothelial cell proliferation, migration, survival, and angiogenesis. This suggests a potential dysregulation in vascular development and repair, reflecting possible connections to vascular function abnormalities seen in vEDS patients. In this context, an enriched cluster was also identified involving proteins implicated in elastic fiber formation, which are essential for the flexibility and resilience of tissues, particularly within the vasculature.
Beyond ECM- and vascular-related processes, the analysis revealed several clusters related to cellular energy balance and metabolism of amino acids, vitamins, and cofactors. This encompassed pathways such as metal ion homeostasis, terpenoid backbone biosynthesis, nicotinate and nicotinamide metabolism, and mitochondrial functions crucial for respiratory chain assembly and cytochrome complex formation, all of which are essential for sustaining cellular energy homeostasis. Furthermore, processes linked to selective autophagy of mitochondria (e.g., mitophagy) and cell death were identified, underscoring a role for energy dysregulation and cellular stress in the pathogenesis of vEDS. Moreover, significant enrichment was observed in biological clusters associated with RNA polymerase I-mediated transcription, mRNA splicing, miRNA transcription, rRNA modification, and ribosome biogenesis, suggesting that vEDS fibroblasts undergo alterations in gene expression regulation at multiple levels, contributing to disease’s complexity. A final notable cluster involved the cellular response to increased oxygen levels, a critical adaptive mechanism in the face of oxidative stress. This response might be particularly relevant in vEDS, where oxidative stress may play a significant role in disease pathology.
3.2. Exploring the Role of miR-29b-3p in Disease Mechanisms and Its Therapeutic Potential
Our previous miRNomic analysis (GSE239908) revealed 137 DE-miRNAs in fibroblasts from vEDS patients compared to controls, with 66 upregulated and 71 downregulated. Targetome analysis on a subset of DE-miRNAs, i.e., miR-15b-5p, miR-16-5p, miR-21-3p, miR-24-3p, miR-29a-3p, miR-29b-3p, miR-138-5p, miR-145-5p, and miR-195-5p, suggested that these DE-miRNAs, among others, may play a significant role in regulating differential gene expression in the transcriptome. Specifically, upregulated miRNAs were associated with the downregulation of several target DEGs, likely due to mRNA degradation, whereas downregulated miRNAs correlated with the upregulation of target DEGs, possibly by reducing mRNA degradation. Among these DE-miRNAs, the elevated expression of miR-29a-3p and miR-29b-3p correlated with decreased levels of a group of putative target DEGs principally involved in ECM organization, ER homeostasis, and autophagy [13].
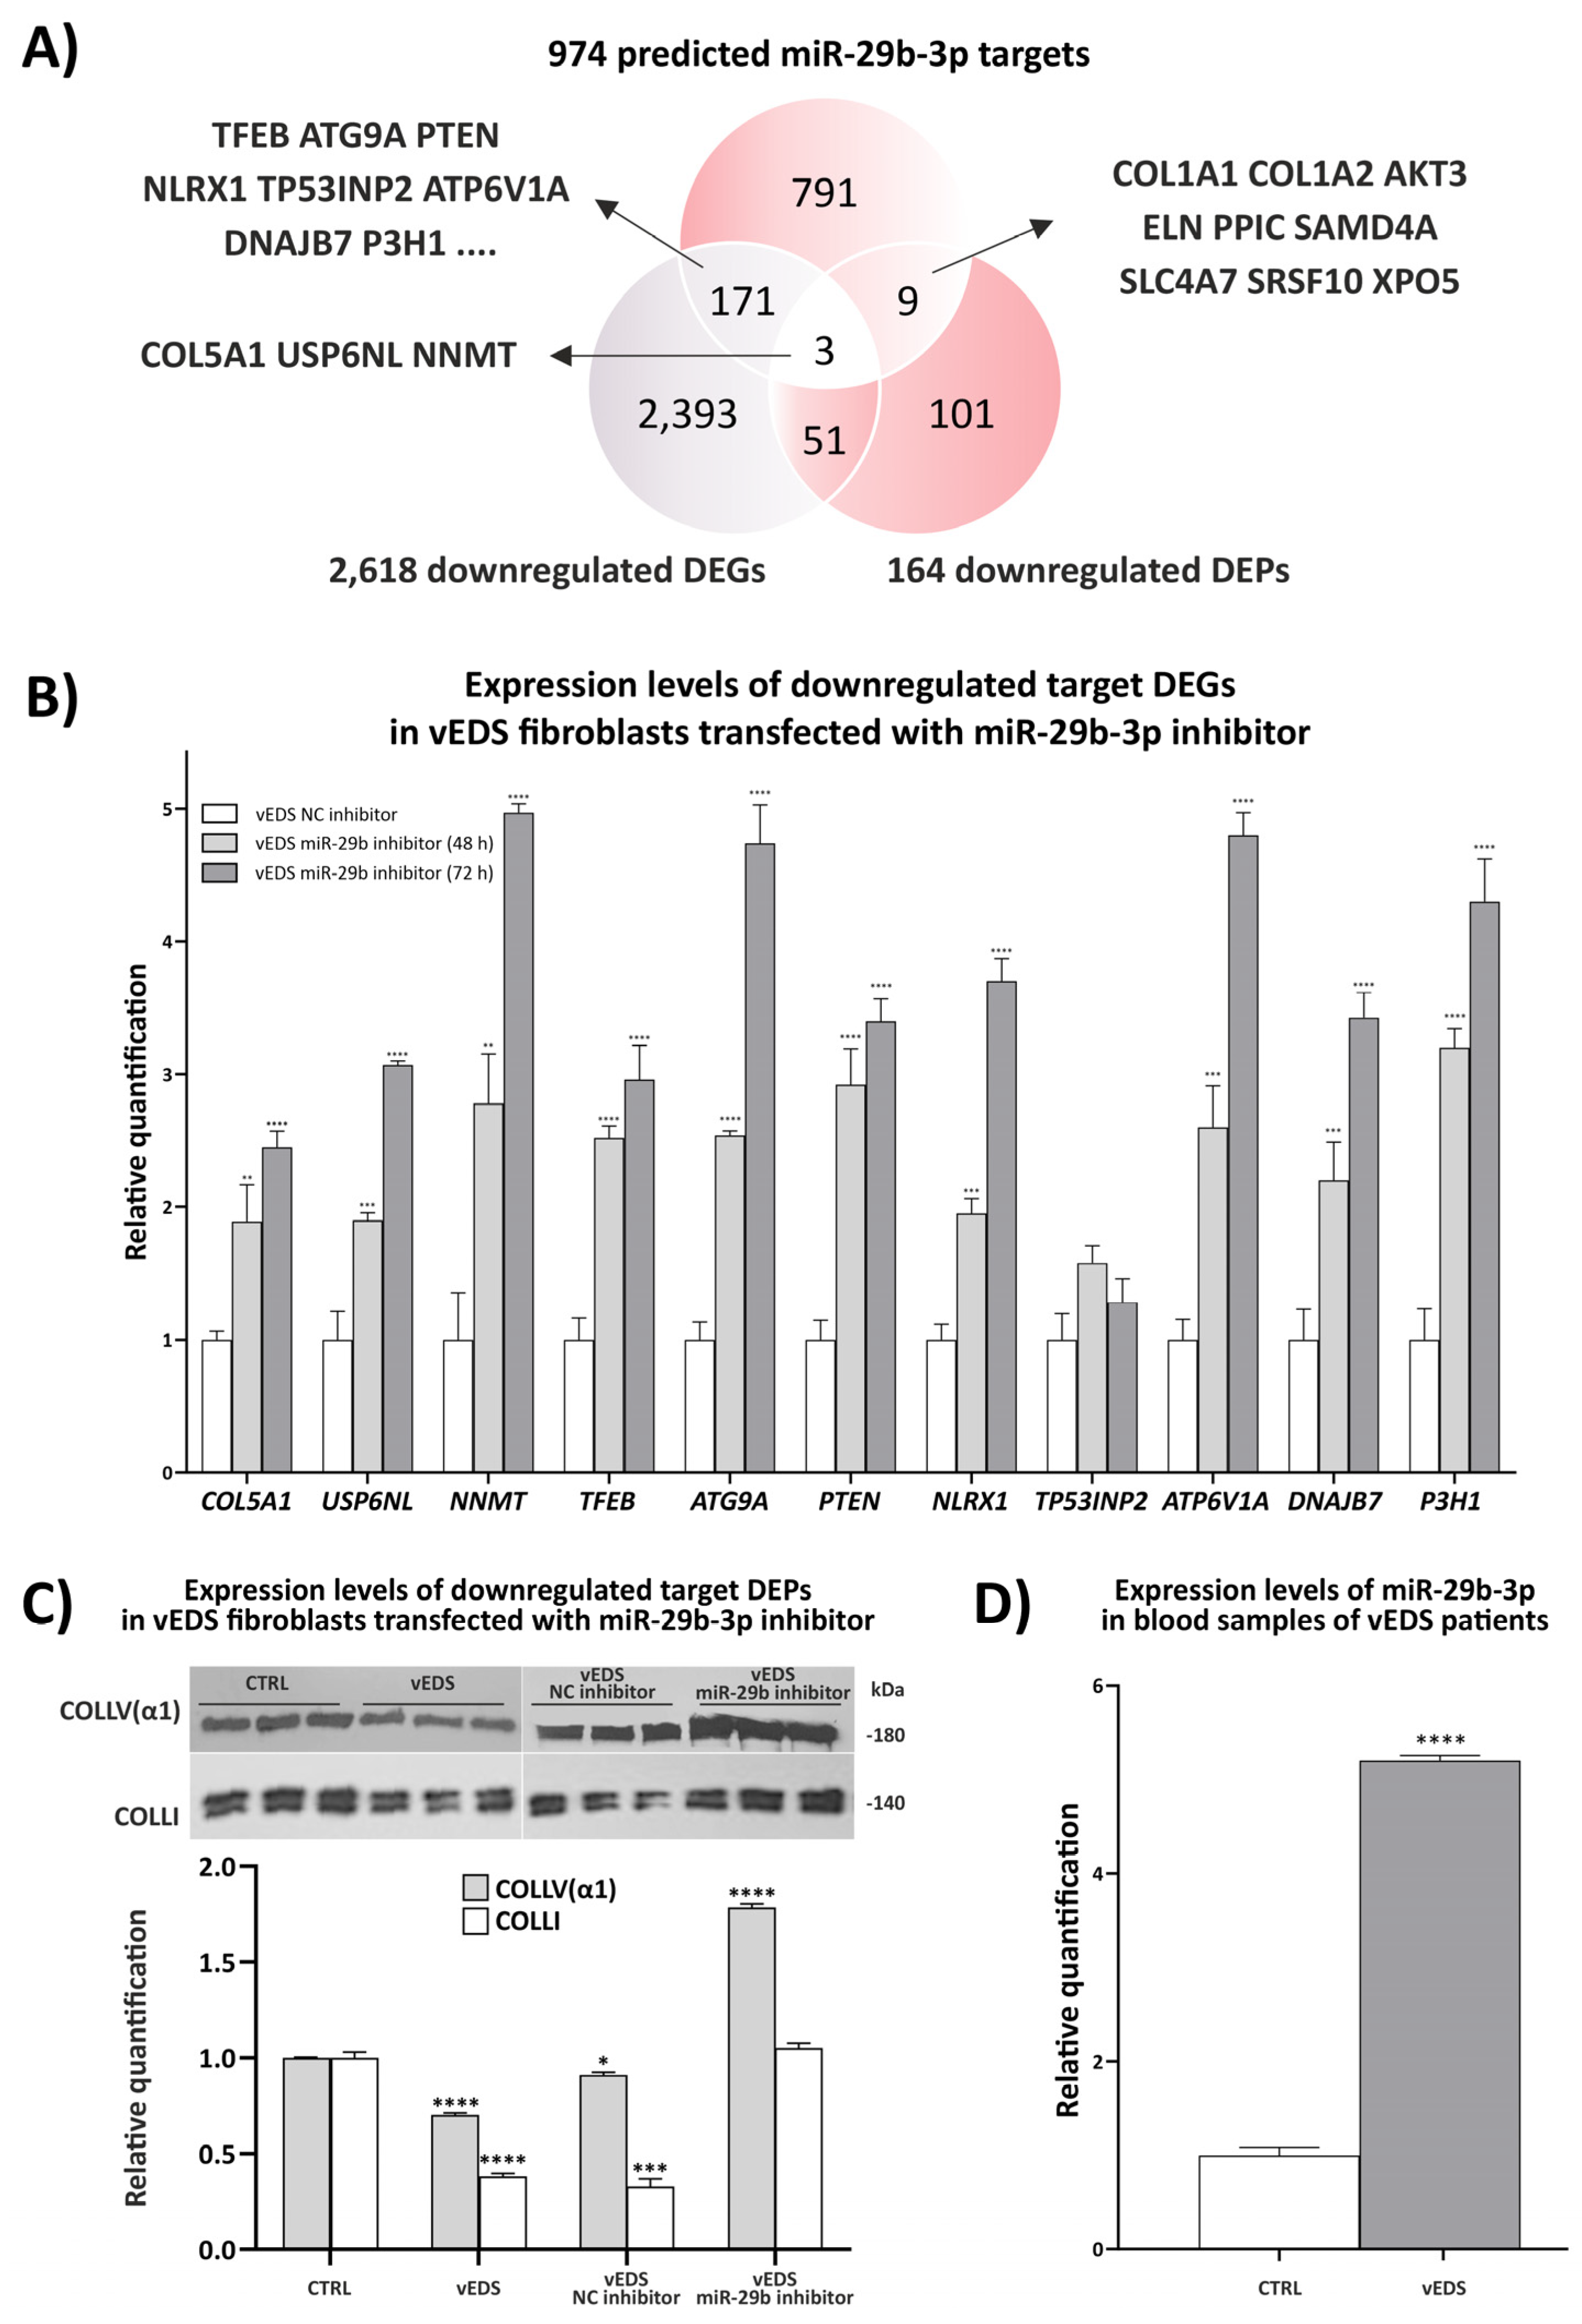
Given the multifaceted roles of miRNAs in regulating gene expression, including their ability to inhibit protein translation without necessarily altering mRNA abundance [19], we aimed to investigate how specific miRNAs, particularly miR-29b-3p, influence the proteomic landscape of vEDS fibroblasts. By exploring the relationship not only between miRNA expression and target DEGs levels but also between miRNA expression and target protein levels, we sought to better elucidate the mechanisms by which miR-29b-3p may impact cellular processes relevant to ECM homeostasis and cell survival and stress responses. This proof-of-concept investigation, centered on miR-29b-3p but potentially extendable to other DE-miRNAs such as miR-29a-3p, aimed to demonstrate the therapeutic potential of inhibiting upregulated miRNAs to modulate gene expression and restore impaired cellular functions contributing to the disease pathogenesis. To achieve this, we first queried various up-to-date miRNA-target databases, identifying a total of 974 potential target genes for miR-29b-3p (Supplementary Table 7). Next, as miRNAs primarily exert post-transcriptional repression, we performed a Venn analysis comparing these 974 predicted targets of miR-29b-3p with both the previously identified 2,618 downregulated DEGs and the 164 downregulated DEPs from the present study. As shown in Figure 4A, this analysis revealed that three mir-29b-3p putative target genes showed reduced expression at both the RNA and protein levels, 9 that were downregulated only at the protein level, and 171 that exhibited reduced mRNA levels only. The three genes downregulated at both levels were COL5A1, NNMT, and USP6NL, which encode, respectively, the α1 chain of type V collagen essential for the structure and integrity of the ECM, nicotinamide N-methyltransferase involved in the metabolism of nicotinamide and various cellular processes such as proliferation and differentiation, and ubiquitin-specific protease 6 N-terminal-like, which regulates autophagy, cell cycle progression, and apoptosis.
Among the 9 downregulated target DEPs, for which miR-29b-3p likely inhibits translation without altering mRNA levels, there were key ECM components such as COL1A1, COL1A2, and ELN. Other downregulated targets included PPIC (involved in protein folding), AKT3 (a serine/threonine protein kinase), SAMD4A (involved in RNA metabolism), SLC4A7 (a sodium bicarbonate transporter), SRSF10 (a splicing factor), and XPO5 (responsible for pre-miRNA nuclear export). Finally, among the 171 downregulated target DEGs, several were involved in autophagosome formation, the mTOR-autophagy-lysosomal signaling pathway, collagen biosynthesis, protein folding, and ER quality control. Notable examples, among others, include TFEB (a master regulator of autophagy), ATG9A (essential for autophagosome formation), PTEN (a key regulator of cell growth), NLRX1 (an autophagy and inflammation modulator), TP53INP2 (involved in stress responses), ATP6V1A1 (important for pH regulation), DNAJB7 (a chaperone for protein folding) and P3H1 (involved in collagen biosynthesis). The absence of corresponding protein downregulation for these transcripts may result from the lower sensitivity of the proteomic analysis, which also involved fewer samples than the transcriptomic study. Additionally, compensatory mechanisms, such as increased translation efficiency, protein stability, or delayed translation responses, could also maintain protein levels despite reduced mRNA levels.
In view of these findings, we aimed to determine whether inhibiting miR-29b-3p in vEDS cells could influence the transcriptional levels of the downregulated putative target DEGs by transfecting patient fibroblasts with a specific miR-29b-3p inhibitor and quantifying the relative mRNA levels using qPCR. We first optimized the experimental conditions by transfecting vEDS cells with a control mimic (hsa-miR-1-3p) at concentrations ranging from 15 to 150 pmol. The qPCR results confirmed a dose-dependent decrease in the mRNA levels of its target gene, HDAC4, with the most significant reduction observed at the 150 pmol concentration (Supplementary Figure 2). Consequently, vEDS fibroblasts were then transfected with an inhibitor specifically targeting miRNA-29b-3p for 48 and 72 hours at this concentration, alongside negative control (NC, scrambled miRNA) experiments. The qPCR confirmed a significant reduction in miRNA-29b-3p levels when treated with the inhibitor compared to NC (Supplementary Figure 3), demonstrating that the inhibitor successfully reduced miR-29b-3p activity, thus setting the stage for assessing its downstream effects on target gene expression. Indeed, we then investigated the expression levels of the three genes downregulated at both the RNA and protein levels (COL5A1, USP6NL, NNMT), as well as the abovementioned target DEGs downregulated only at mRNA level and principally involved in ECM organization, autophagy, and ER homeostasis (TFEB, ATG9A, PTEN, NRLX1, TP53INP2, ATP6V1A, DNAJB7, and P3H1). As illustrated in Figure 4B, the inhibition of miR-29b-3p led to a significant increase in the expression levels of all DEGs, except for TP53INP2, with a more marked effect generally observed at 72 hours. These findings demonstrate that miR-29b-3p effectively targets these specific mRNAs, inducing their degradation, and underscore its potential as a therapeutic target for modulating gene expression and restoring impaired cellular functions.
Finally, we validated through WB the protein levels of 3 representative miR-29b-3p targets, namely COL5A1, COL1A1, and COL1A2 in untransfected control and vEDS fibroblasts, as well as in patient cells transfected with 150 pmol of either miR-29b-3p inhibitor or NC inhibitor for 72 hours. To accomplish this, we selected an antibody specifically recognizing the α1 chain of collagen type V [COLLV(α1)], which was found to be downregulated at both the RNA and protein level, and an antibody recognizing both the α1 and α2 chain of collagen type I (COLLI), which were found to be downregulated at the protein level only (Figure 4A). As shown in Figure 4C, WB validation confirmed that the levels of both COLLV(α1) and COLLI were significantly lower in patients’ fibroblasts compared to control cells.
Most notably, in contrast to cells transfected with the NC inhibitor, vEDS fibroblasts transfected with the miR-29b-3p inhibitor showed increased levels of both ECM components. Specifically, following miR-29b-3p inhibition, COLLI levels were comparable to those observed in untransfected control fibroblasts, while COLLV(α1) levels were even higher than those in control cells. These results provide the first evidence that miR-29b-3p regulates the protein levels of critical structural components essential for maintaining ECM integrity in vEDS patient fibroblasts via mechanisms of mRNA degradation and/or translational inhibition.
Building on these promising in vitro findings, we next sought to verify the expression levels of miR-29b-3p in blood samples from a small cohort of vEDS patients (n=12), all of whom were molecularly characterized in our lab for a pathogenic dominant negative COL3A1 variant [2]. As shown in Figure 4D, qPCR analysis revealed a significant upregulation of miR-29b-3p in the blood of vEDS individuals compared to healthy donors. Overall, these findings underscore the critical role of miR-29b-3p in the pathophysiology of vEDS, particularly in regulating ECM integrity and cell survival processes. In a translational context, our findings provide compelling proof of concept for further functional investigations aimed at assessing whether targeting miR-29b-3p in vEDS patients could be a viable therapeutic strategy for improving ECM homeostasis and critical intracellular functions, both of which are essential for maintaining connective tissue integrity, especially in the vasculature.
4. Discussion
Current treatments for vEDS are primarily symptomatic, reflecting our incomplete understanding of the underlying disease mechanisms. Detailed studies at the molecular and cellular levels are essential to identify biological targets and causative mechanisms driving the disease. Investigating how mutations in COL3A1 affect the structure and function of the ECM, as well as critical biological processes to maintain intracellular homeostasis, is pivotal for developing effective therapies and improving patient management.
In this study, we adopted an integrative approach by constructing a comprehensive proteomic map of patient fibroblasts and integrating it with previously collected transcriptome and miRNome profiles. This multi-level perspective of the molecular landscape aimed to reveal a potential disease signature with translational relevance. By combining these datasets with proof-of-concept functional data, our goal was to gain deeper insights into deregulated pathomolecular mechanisms and explore the impact of the miR-29b-3p in vEDS pathogenesis. Integrated multi-omics strategies can indeed bolster translational research efforts by providing biological insights into the functional impacts of potential disease-associated biomolecules, as demonstrated in the context of other vasculopathies [20,21,22,23]. Additionally, the exploration of epigenetic alterations, including miRNA dysregulation, offers valuable clues for developing therapeutic strategies aimed at mitigating vascular diseases [20,24]. Thorough investigation by multi-omics and epigenetic analyses is crucial for unraveling the intricate regulatory networks underlying vEDS development, aiding in the identification of biomarkers for disease progression. Despite advances in understanding other vasculopathies [22], a notable gap remains in omics and epigenetic studies specifically focusing on vEDS. This gap limits our biological understanding of disease processes and hinders the discovery of novel therapeutic targets. Addressing this gap, and identifying key biomarkers and therapeutic targets, would significantly enhance efforts to manage vEDS in clinical practice [11].
Consistent with our previous transcriptome results [13,15], the present proteome investigation reinforces our proposed disease model regarding the impact of dominant negative COL3A1 variants on vEDS pathobiology [13]. Our current findings highlight that ECM structure and stability, autophagy/mitophagy, mitochondrial function, cellular redox balance, and apoptotic processes are key deregulated biological processes driving the underlying molecular pathophysiology. This is supported by enrichment analysis results indicating decreased expression of numerous proteins involved in these biological networks. Reduced protein levels of fundamental connective tissue components, prominently expressed in skin and blood vessels, such as COLLs (COL1A1, COL1A2, COL5A1), elastic fiber components (ELN, FBLN2), ECM interactors and regulators like integrins (ITGA1, ITGB3) and matrix metalloprotease inhibitors (TIMP1), as well as intracellular signal transducers (e.g., SMAD4, PIK3CA, AKT3), underscore the substantial impact of altered assembly or availability of key ECM molecules and consequent ECM homeostasis perturbation on the development of connective tissue abnormalities, particularly within the vascular system. These deficiencies in critical ECM proteins may contribute to major vascular complications observed in affected individuals, including arterial rupture, thrombosis, dissection, or aneurysm, and abnormalities in elastin structure and function [2,4,7]. Additionally, key autophagy-related proteins (BNIP3, BNIP3L, GABARAP, NRBF2, PIK3CA), along with proteins involved in mitochondrial function and cellular redox balance (NADK2, BST1, NNMT, ENPP1), and apoptotic regulators (APBB1, BNIP3, CALHM2, CYP1B1, FAM162A, KCNMA1), further illustrate the complexities of these dysfunctions. Indeed, pathological turnover of the ECM, coupled with altered autophagy, mitochondrial dysfunction, and activation of cell death programs, has been identified as significant drivers in various cardiovascular conditions [25], including multiple thoracic aortic aneurysm diseases such as Marfan (MFS) and Loeys-Dietz syndromes (LDS) [21,26]. Notably, integrative analyses combining transcriptomic and proteomic approaches on aortic samples from MFS patients and fibulin-4 mutant mice revealed mitochondrial dysfunction and impaired oxidative phosphorylation as significantly affected biological functions, including downregulation of genes and proteins associated with mitochondrial respiration and metabolism [21,26]. While the precise contribution of mitochondria dysfunction to aortic aneurysm formation and vasculopathies is still being clarified, there is supporting evidence. For instance, our previous research on dermal fibroblasts from patients with arterial tortuosity syndrome demonstrated that the loss of function of the GLUT10 glucose transporter leads to reduced recycling of dehydroascorbic acid into the endomembrane systems, increased oxidative damage, and cellular energy imbalance [27,28]. Furthermore, fibroblasts from MFS and LDS patients carrying mutations in the FBN1, TGFBR2, and SMAD3 genes show decreased oxygen consumption rates. These findings reinforce the idea that disrupted mitochondrial biogenesis and function could contribute to aneurysmal diseases [22,26]. Additionally, transcriptomic and metabolomic analyses of aortic samples from a murine model of MFS identified mitochondrial dysfunction as a significant contributor to the pathogenesis of aortic disease [29]. In accordance with this evidence, our proteomic results further support the view that perturbed mitochondrial metabolism might play a role in the pathogenesis of vascular connective tissue disorders. Moreover, impaired proteostasis, disrupted ER homeostasis, and dysregulated adaptive cellular mechanisms, such as the unfolded protein response [13], may contribute to the fragility and instability of blood vessels in vEDS, resulting in complications like arterial ruptures and other vascular abnormalities. Understanding how vEDS fibroblasts respond to intracellular alterations leading to ER stress and other downstream consequences, such as disturbed autophagic pathways, oxidative imbalance, and increased apoptosis, may provide important insights into potential druggable targets for enhancing cellular resilience and improving vascular health in vEDS patients. A recent study demonstrated the induction of selective autophagy of the ER (ER-phagy) in fibroblasts from kyphoscoliotic EDS patients as a cellular response to misfolded collagen accumulation, reinforcing the involvement of autophagy in EDS [30].
An essential question to consider is how a deficiency in a protein crucial for the structural integrity of the vascular ECM can result in changes in mitochondrial function and metabolism. The potential interaction among COLLIII deficiency, along with the reduced bioavailability of other ECM structural constituents (i.e., other fibrillar COLLs, FN, and ELN) [13,15], and mitochondrial dysfunction can be explained by the disturbance of ECM homeostasis. These alterations in ECM architecture and remodeling may induce changes in mechanotransduction, subsequently affecting the functional connections between the ECM and the organization of the cytoskeleton [31]. These altered ECM-to-cell signaling may be influenced by changes in cellular dynamics, including alterations in the adhesion properties of integrin receptors and cell adhesion complexes, as already described in vEDS patient fibroblasts [16,32]. Given that mitochondria depend on the cytoskeleton for their mobility and proper activities [31], disruptions in both ECM structural integrity and cytoskeletal organization could affect mitochondrial distribution, structure, and function [26]. Further studies should therefore focus on metabolomic analysis in vEDS patients to further explore and validate these initial findings, shedding light on diverse pathobiological aspects of the disease.
Our integrative multi-omics investigation revealed a complex interaction network, identifying several compromised molecular mechanisms and emphasizing the critical roles of miRNAs, particularly miR-29b-3p, in regulating key extracellular and intracellular biological processes, including ECM homeostasis, autophagy, and the ER stress response, all of which are likely implicated in the pathogenesis of vEDS [13,16,33]. While the exact functional role of miR-29b in the context of vEDS remains largely unexplored, our findings suggest it may be a critical player in disease progression and could inform targeted therapy development. Consistent with evidence from other vascular disorders [14,20,34,35], miR-29b-3p likely holds significant pathological relevance in vEDS as well. Indeed, our in vitro functional data and preliminary in vivo results suggest that miR-29b-3p acts as a negative regulator of the ECM homeostasis and related cellular pathways. The inhibition of miR-29b-3p in patient fibroblasts correlated with the upregulation of several target DEGs, including genes encoding ECM structural components and those involved in adaptive cellular responses, alongside increased protein levels of COLLV(α1) and COLLI. These in vitro findings, together with our pilot in vivo results showing higher miR-29b-3p levels in patients compared to healthy donors, position this miRNA as a promising target for enhancing ECM integrity and intracellular homeostasis. Inhibiting miR-29b-3p could have therapeutic potential by addressing these alterations, especially given its well-documented pathological role in vascular ECM remodeling across various conditions. Indeed, previous studies on human thoracic aortic aneurysm samples have shown a strong association between increased miR-29-3p expression and the downregulation of several ECM components, including COLLs and ELN. This downregulation contributes to the weakening of the aortic structure, ultimately facilitating aneurysm development [36]. In murine models of abdominal aortic aneurysms, miR-29b-3p upregulation accelerated aneurysm expansion and increased rupture rates, accompanied by decreased expression of key ECM targets (e.g., Col1a1, Col3a1, Col5a1, Eln), while inhibition of miR-29b-3p reduced aortic aneurysm progression [37]. Similarly, in MFS mice models, miR-29b-3p upregulation in the ascending aorta led to ECM degradation through increased matrix metalloproteinase activity [38]. These findings highlight the importance of miR-29b-3p in pathological vascular ECM remodeling, further suggesting it may be a key molecular driver of vEDS pathogenesis.
Importantly, emerging therapeutic strategies for miRNA inhibition are showing great promise in several preclinical studies [39]. Specifically, miRNAs can be effectively targeted in vivo using advanced delivery systems such as lipid nanoparticles (LNAs), which ensure stability in the bloodstream, demonstrating efficacy in reducing miRNA levels and modulating disease pathways in several conditions including cardiovascular disorders [40,41,42]. Additionally, further strategies including peptide-conjugated phosphorodiamidate morpholino oligomers (PMOs), antisense oligonucleotides (ASOs), and locked nucleic acids (LNAs), are being explored for therapeutic applications in various diseases [39,42]. By addressing miR-29b’s role in ECM dysregulation, these innovative strategies offer promising therapeutic avenues that could improve vascular integrity and mitigate disease progression in vEDS.
Taken together, while our in vitro and in vivo findings are promising, further validation and research is mandatory to confirm clinical relevance and therapeutic potential. Moreover, a deeper understanding of the deregulated pathways will likely reveal further potential therapeutic targets and aid in the development of more effective treatment strategies. In conclusion, our research may serve as a foundation for future studies focused on creating targeted treatments to meet the urgent need for improved interventions in this life-threatening disorder.
Supplementary Materials
The following supporting information can be downloaded at the website of this paper posted on Preprints.org. Figure S1: Altered protein classes in vEDS fibroblasts according to the PANTHER protein classification database. Figure S2: Optimization of transfection conditions in vEDS patient and control fibroblasts. Figure S3: Validation of miR-29b-3p inhibition. Table S1: Primers sequences of miR-29b-3p target genes. Table S2: Proteomics results of vEDS fibroblasts. Table S3: GO classification of the DEPs according to PANTHER database. Table S4: Integrative analysis of transcriptomic and proteomic results. Table S5: GO classification according to the Enrich database. Table S6: Network enrichment according to ClueGO. Table S7: Target analyses of miR-29b-3p.
Author Contributions
Conceptualization, formal analysis, investigation, data curation, writing—original draft preparation, writing—review & editing, visualization, supervision, project administration, funding acquisition, N.C. and M.R; software, validation, formal analysis, investigation, data curation, writing—review & editing, visualization, V.C.; investigation, writing—review & editing, N.Z.; investigation, validation, V.B.; software, formal analysis, data curation, investigation, writing—review & editing, M.M. and C.d.L.; formal analysis, data curation, writing—review & editing, supervision, funding acquisition, C.S.; resources, writing—review & editing M.V.; conceptualization, writing—review & editing, resources, supervision, M.C. All authors have read and agreed to the published version of the manuscript.
Funding
This work was funded by Fondazione Telethon and the “Associazione con Giacomo contro vEDS” (Grant numbers: GSA21F001, GSA21F005, and GSA23J001, Seed Grant Fall 2021 vEDS and vEDS Renewal 2023).
Institutional Review Board Statement
The study was conducted in accordance with the Declaration of Helsinki and approved by the local Institutional Review Board (ASST degli Spedali Civili, Brescia, Italy, registration number NP5328).
Informed Consent Statement
Informed consent was obtained from all subjects involved in the study.
Data Availability Statement
Most data generated or analyzed during this study are included in this published article and its Supplementary files. Additional data and materials are available from the corresponding authors on reasonable request, subject to compliance with our obligations under human research ethics.
Acknowledgments
All authors express their sincere gratitude to the patients and their families, as well as to the healthy donors, for their kind availability for this study. N.C., V.C., N.Z., V.B., M.C., and M.R extend sincere thanks to the Fazzo Cusan family for its generous support and to Ms. Jelena Skripac for her skilled technical assistance.
Conflicts of Interest
The authors declare no conflict of interest.
References
- Byers, P.H.; Belmont, J.; Black, J.; De Backer, J.; Frank, M.; Jeunemaitre, X.; Johnson, D.; Pepin, M.; Robert, L.; Sanders, L.; et al. Diagnosis, Natural History, and Management in Vascular Ehlers–Danlos Syndrome. Am. J. Med. Genet. Part C Semin. Med. Genet. 2017, 175, 40–47. [CrossRef]
- Ritelli, M.; Rovati, C.; Venturini, M.; Chiarelli, N.; Cinquina, V.; Castori, M.; Colombi, M. Application of the 2017 Criteria for Vascular Ehlers-Danlos Syndrome in 50 Patients Ascertained According to the Villefranche Nosology. Clin. Genet. 2020, 97, 287–295. [CrossRef]
- Bowen, J.M.; Hernandez, M.; Johnson, D.S.; Green, C.; Kammin, T.; Baker, D.; Keigwin, S.; Makino, S.; Taylor, N.; Watson, O.; et al. Diagnosis and Management of Vascular Ehlers-Danlos Syndrome: Experience of the UK National Diagnostic Service, Sheffield. Eur. J. Hum. Genet. 2023, 31, 749–760. [CrossRef]
- Frank, M.; Adham, S.; Seigle, S.; Legrand, A.; Mirault, T.; Henneton, P.; Albuisson, J.; Denarié, N.; Mazzella, J.M.; Mousseaux, E.; et al. Vascular Ehlers-Danlos Syndrome: Long-Term Observational Study. J. Am. Coll. Cardiol. 2019, 73, 1948–1957. [CrossRef]
- Eagleton, M.J. Arterial Complications of Vascular Ehlers-Danlos Syndrome. J. Vasc. Surg. 2016, 64, 1869–1880. [CrossRef]
- Ong, K.T.; Perdu, J.; De Backer, J.; Bozec, E.; Collignon, P.; Emmerich, J.; Fauret, A.L.; Fiessinger, J.N.; Germain, D.P.; Georgesco, G.; et al. Effect of Celiprolol on Prevention of Cardiovascular Events in Vascular Ehlers-Danlos Syndrome: A Prospective Randomised, Open, Blinded-Endpoints Trial. Lancet (London, England) 2010, 376, 1476–1484. [CrossRef]
- Buso, G.; Paini, A.; Agabiti-Rosei, C.; De Ciuceis, C.; Bertacchini, F.; Stassaldi, D.; Salvetti, M.; Ritelli, M.; Venturini, M.; Colombi, M.; et al. Despite Celiprolol Therapy, Patients with Vascular Ehlers-Danlos Syndrome Remain at Risk of Vascular Events: A 12-Year Experience in an Italian Referral Center. Vasc. Med. 2023. [CrossRef]
- Baderkhan, H.; Wanhainen, A.; Stenborg, A.; Stattin, E.L.; Björck, M. Celiprolol Treatment in Patients with Vascular Ehlers‐Danlos Syndrome. Eur. J. Vasc. Endovasc. Surg. 2021, 61, 326–331. [CrossRef]
- Legrand Id, A.; Guery, C.; Faugeroux, J.; Fontaine Id, E.; Beugnon, C.; Lie Gianfermi, A.; Loisel-Ferreiraid, I.; Verpont, M.-C.; Adhamid, S.; Miraultid, T.; et al. Comparative Therapeutic Strategies for Preventing Aortic Rupture in a Mouse Model of Vascular Ehlers-Danlos Syndrome. PLoS Genet. 2022 Mar 4;18(3):e1010059. [CrossRef]
- Bowen, C.J.; Giadrosic, J.F.C.; Burger, Z.; Rykiel, G.; Davis, E.C.; Helmers, M.R.; Benke, K.; MacFarlane, E.G.; Dietz, H.C. Targetable Cellular Signaling Events Mediate Vascular Pathology in Vascular Ehlers-Danlos Syndrome. J. Clin. Invest. 2020, 130, 686–698. [CrossRef]
- Buso, G.; Corvini, F.; Fusco, E.M.; Messina, M.; Cherubini, F.; Laera, N.; Paini, A.; Salvetti, M.; Ciuceis, C. De; Ritelli, M.; et al. Current Evidence and Future Perspectives in the Medical Management of Vascular Ehlers—Danlos Syndrome : Focus on Vascular Prevention. J. Clin. Med. 2024, 13(14), 4255; [CrossRef]
- Omar, R.; Lee, M.; Gonzalez-Trueba, L.; Lianos, S.; Hazarika, S.; Ammar, M.A.; Cassels, J.; Michie, A.M.; Bulleid, N.J.; Malfait, F.; et al. The Chemical Chaperone 4-Phenylbutyric Acid Rescues Molecular Cell Defects of COL3A1 Mutations That Cause Vascular Ehlers Danlos Syndrome. bioRxiv 2024, 2024.06.20.599980. [CrossRef]
- Chiarelli, N.; Cinquina, V.; Martini, P.; Bertini, V.; Zoppi, N.; Venturini, M.; Ritelli, M.; Colombi, M. Deciphering Disease Signatures and Molecular Targets in Vascular Ehlers-Danlos Syndrome through Transcriptome and MiRNome Sequencing of Dermal Fibroblasts. Biochim. Biophys. acta. Mol. basis Dis. 2024, 1870. [CrossRef]
- Terriaca, S.; Monastero, R.; Orlandi, A.; Balistreri, C.R. The Key Role of MiRNA in Syndromic and Sporadic Forms of Ascending Aortic Aneurysms as Biomarkers and Targets of Novel Therapeutic Strategies. Front Genet. 2024 Feb 21:15:1365711. [CrossRef]
- Chiarelli, N.; Carini, G.; Zoppi, N.; Ritelli, M.; Colombi, M. Transcriptome Analysis of Skin Fibroblasts with Dominant Negative COL3A1 Mutations Provides Molecular Insights into the Etiopathology of Vascular Ehlers-Danlos Syndrome. PLoS One 2018, 13. [CrossRef]
- Zoppi, N.; Chiarelli, N.; Ritelli, M.; Colombi, M. Multifaced Roles of the αvβ3 Integrin in Ehlers-Danlos and Arterial Tortuosity Syndromes’ Dermal Fibroblasts. Int. J. Mol. Sci. 2018, 19. [CrossRef]
- Reggio, A.; Buonomo, V.; Berkane, R.; Bhaskara, R.M.; Tellechea, M.; Peluso, I.; Polishchuk, E.; Lorenzo, G. Di; Cirillo, C.; Esposito, M.; et al. Role of FAM134 Paralogues in Endoplasmic Reticulum Remodeling, ER-phagy, and Collagen Quality Control. EMBO Rep. 2021, 22. [CrossRef]
- Michalski, A.; Damoc, E.; Hauschild, J.P.; Lange, O.; Wieghaus, A.; Makarov, A.; Nagaraj, N.; Cox, J.; Mann, M.; Horning, S. Mass Spectrometry-Based Proteomics Using Q Exactive, a High-Performance Benchtop Quadrupole Orbitrap Mass Spectrometer. Mol. Cell. Proteomics 2011, 10. [CrossRef]
- Welten, S.M.J.; Goossens, E.A.C.; Quax, P.H.A.; Nossent, A.Y. The Multifactorial Nature of MicroRNAs in Vascular Remodelling. Cardiovasc. Res. 2016, 110, 6–22. [CrossRef]
- Rega, S.; Farina, F.; Bouhuis, S.; de Donato, S.; Chiesa, M.; Poggio, P.; Cavallotti, L.; Bonalumi, G.; Giambuzzi, I.; Pompilio, G.; et al. Multi-Omics in Thoracic Aortic Aneurysm: The Complex Road to the Simplification. Cell Biosci. 2023, 13, 1–27. [CrossRef]
- Verhagen, J.M.A.; Burger, J.; Bekkers, J.A.; Den Dekker, A.T.; von der Thüsen, J.H.; Zajec, M.; Brüggenwirth, H.T.; van der Sterre, M.L.T.; van den Born, M.; Luider, T.M.; et al. Multi-Omics Profiling in Marfan Syndrome: Further Insights into the Molecular Mechanisms Involved in Aortic Disease. Int. J. Mol. Sci. 2022, 23, 438. [CrossRef]
- Udugampolage, N.S.; Frolova, S.; Taurino, J.; Pini, A.; Martelli, F.; Voellenkle, C. Coding and Non-Coding Transcriptomic Landscape of Aortic Complications in Marfan Syndrome. Int J Mol Sci. 2024, Jul 5;25(13):7367. [CrossRef]
- Lei, J.; Qiu, P.; Wu, Z.; Ding, A.; Hu, J.; Hou, J.; Jiang, Y.; Pu, H.; Huang, Q.; Zhang, X.; et al. Integrative Multi-Omics Analyses Reveal Vesicle Transport as a Potential Target for Thoracic Aortic Aneurysm. Comput. Biol. Med. 2024, 170, 108071. [CrossRef]
- Stratton, M.S.; Farina, F.M.; Elia, L. Epigenetics and Vascular Diseases. J. Mol. Cell. Cardiol. 2019, 133, 148. [CrossRef]
- Chistiakov, D.A.; Shkurat, T.P.; Melnichenko, A.A.; Grechko, A. V.; Orekhov, A.N. The Role of Mitochondrial Dysfunction in Cardiovascular Disease: A Brief Review. Ann. Med. 2018, 50, 121–127. [CrossRef]
- Van Der Pluijm, I.; Burger, J.; Van Heijningen, P.M.; IJpma, A.; Van Vliet, N.; Milanese, C.; Schoonderwoerd, K.; Sluiter, W.; Ringuette, L.J.; Dekkers, D.H.W.; et al. Decreased Mitochondrial Respiration in Aneurysmal Aortas of Fibulin-4 Mutant Mice Is Linked to PGC1A Regulation. Cardiovasc. Res. 2018, 114, 1776–1793. [CrossRef]
- Németh, C.E.; Marcolongo, P.; Gamberucci, A.; Fulceri, R.; Benedetti, A.; Zoppi, N.; Ritelli, M.; Chiarelli, N.; Colombi, M.; Willaert, A.; et al. Glucose Transporter Type 10-Lacking in Arterial Tortuosity Syndrome-Facilitates Dehydroascorbic Acid Transport. FEBS Lett. 2016, 590, 1630–1640. [CrossRef]
- Zoppi, N.; Chiarelli, N.; Cinquina, V.; Ritelli, M.; Colombi, M. GLUT10 Deficiency Leads to Oxidative Stress and Non-Canonical Avβ3 Integrin-Mediated TGFβ Signalling Associated with Extracellular Matrix Disarray in Arterial Tortuosity Syndrome Skin Fibroblasts. Hum. Mol. Genet. 2015, 24, 6769–6787. [CrossRef]
- Oller, J.; Gabandé-Rodríguez, E.; Ruiz-Rodríguez, M.J.; Desdín-Micó, G.; Aranda, J.F.; Rodrigues-Diez, R.; Ballesteros-Martínez, C.; Blanco, E.M.; Roldan-Montero, R.; Acuña, P.; et al. Extracellular Tuning of Mitochondrial Respiration Leads to Aortic Aneurysm. Circulation 2021, 143, 2091–2109. [CrossRef]
- De Leonibus, C.; Maddaluno, M.; Ferriero, R.; Besio, R.; Cinque, L.; Lim, P.J.; Palma, A.; De Cegli, R.; Gagliotta, S.; Montefusco, S.; et al. Sestrin2 Drives ER-Phagy in Response to Protein Misfolding. Dev. Cell 2024, 59, 2035-2052.e10. [CrossRef]
- De Cavanagh, E.M.; Ferder, M.; Inserra, F.; Ferder, L. Angiotensin II, Mitochondria, Cytoskeletal, and Extracellular Matrix Connections: An Integrating Viewpoint. Am. J. Physiol.—Hear. Circ. Physiol. 2009, Mar;296(3):H550-8. [CrossRef]
- Zoppi, N.; Barlati, S.; Colombi, M. FAK-Independent Alphavbeta3 Integrin-EGFR Complexes Rescue from Anoikis Matrix-Defective Fibroblasts. Biochim. Biophys. Acta 2008, 1783, 1177–1188. [CrossRef]
- Chiarelli, N.; Ritelli, M.; Zoppi, N.; Colombi, M. Cellular and Molecular Mechanisms in the Pathogenesis of Classical, Vascular, and Hypermobile Ehlers‒Danlos Syndromes. Genes (Basel). 2019, 10. [CrossRef]
- Nappi, F. Non-Coding RNA-Targeted Therapy: A State-of-the-Art Review. Int. J. Mol. Sci. 2024, 25. [CrossRef]
- Hibender, S.; Franken, R.; Van Roomen, C.; Ter Braake, A.; Van Der Made, I.; Schermer, E.E.; Gunst, Q.; Van Den Hoff, M.J.; Lutgens, E.; Pinto, Y.M.; et al. Resveratrol Inhibits Aortic Root Dilatation in the Fbn1C1039G/+ Marfan Mouse Model. Arterioscler. Thromb. Vasc. Biol. 2016, 36, 1618–1626. [CrossRef]
- Boon, R.A.; Dimmeler, S. MicroRNAs and Aneurysm Formation. Trends Cardiovasc. Med. 2011, 21, 172–177. [CrossRef]
- Maegdefessel, L.; Azuma, J.; Toh, R.; Merk, D.R.; Deng, A.; Chin, J.T.; Raaz, U.; Schoelmerich, A.M.; Raiesdana, A.; Leeper, N.J.; et al. Inhibition of MicroRNA-29b Reduces Murine Abdominal Aortic Aneurysm Development. J. Clin. Invest. 2012, 122, 497–506. [CrossRef]
- Merk, D.R.; Chin, J.T.; Dake, B.A.; Maegdefessel, L.; Miller, M.O.; Kimura, N.; Tsao, P.S.; Iosef, C.; Berry, G.J.; Mohr, F.W.; et al. MiR-29b Participates in Early Aneurysm Development in Marfan Syndrome. Circ. Res. 2012, 110, 312–324. [CrossRef]
- Chakraborty, C.; Sharma, A.R.; Sharma, G.; Lee, S.S. Therapeutic Advances of MiRNAs: A Preclinical and Clinical Update. J. Adv. Res. 2020, 28, 127–138. [CrossRef]
- Moraes, F.C.; Pichon, C.; Letourneur, D.; Chaubet, F. MiRNA Delivery by Nanosystems: State of the Art and Perspectives. Pharmaceutics 2021, 13. [CrossRef]
- Roberts, T.C.; Langer, R.; Wood, M.J.A. Advances in Oligonucleotide Drug Delivery. Nat. Rev. Drug Discov. 2020, 19, 673–694. [CrossRef]
- Hanna, J.; Hossain, G.S.; Kocerha, J. The Potential for MicroRNA Therapeutics and Clinical Research. Front. Genet. 2019, 10. [CrossRef]
Figure 1.
Differential protein expression analysis and integration with transcriptome data. A) A 2D PCA plot showing the distribution of control (blue dots) and vEDS (red dots) samples in two distinct clusters. B) HCA of the 181 DEPs identified in vEDS (P1-P9) vs. control (C1-C9) fibroblasts. Proteins with high expression values are shown in red, while those with low expression values are in blue. Each column of the heatmap represents a patient and control sample, while rows correspond to identified DEPs (Student’s t-test and FDR p < 0.05). C) A Volcano plot displaying the distribution of the 164 downregulated (green) and the 17 upregulated (red) DEPs. The plots represent expression values as fold change (log2, x-axis) plotted against the -log10 FDR-adjusted p-value (y-axis). Protein symbols for a selection of DEPs are indicated. D) A Venn diagram comparing the 3,189 DEGs from the previous transcriptome study [13] with the 181 DEPs identified in the current proteomic study, which identified 67 shared genes/proteins. E) A dispersion plot showing the differential expression of these 67 DEGs/DEPs, with red indicating opposite expression trend between the two omics approaches.
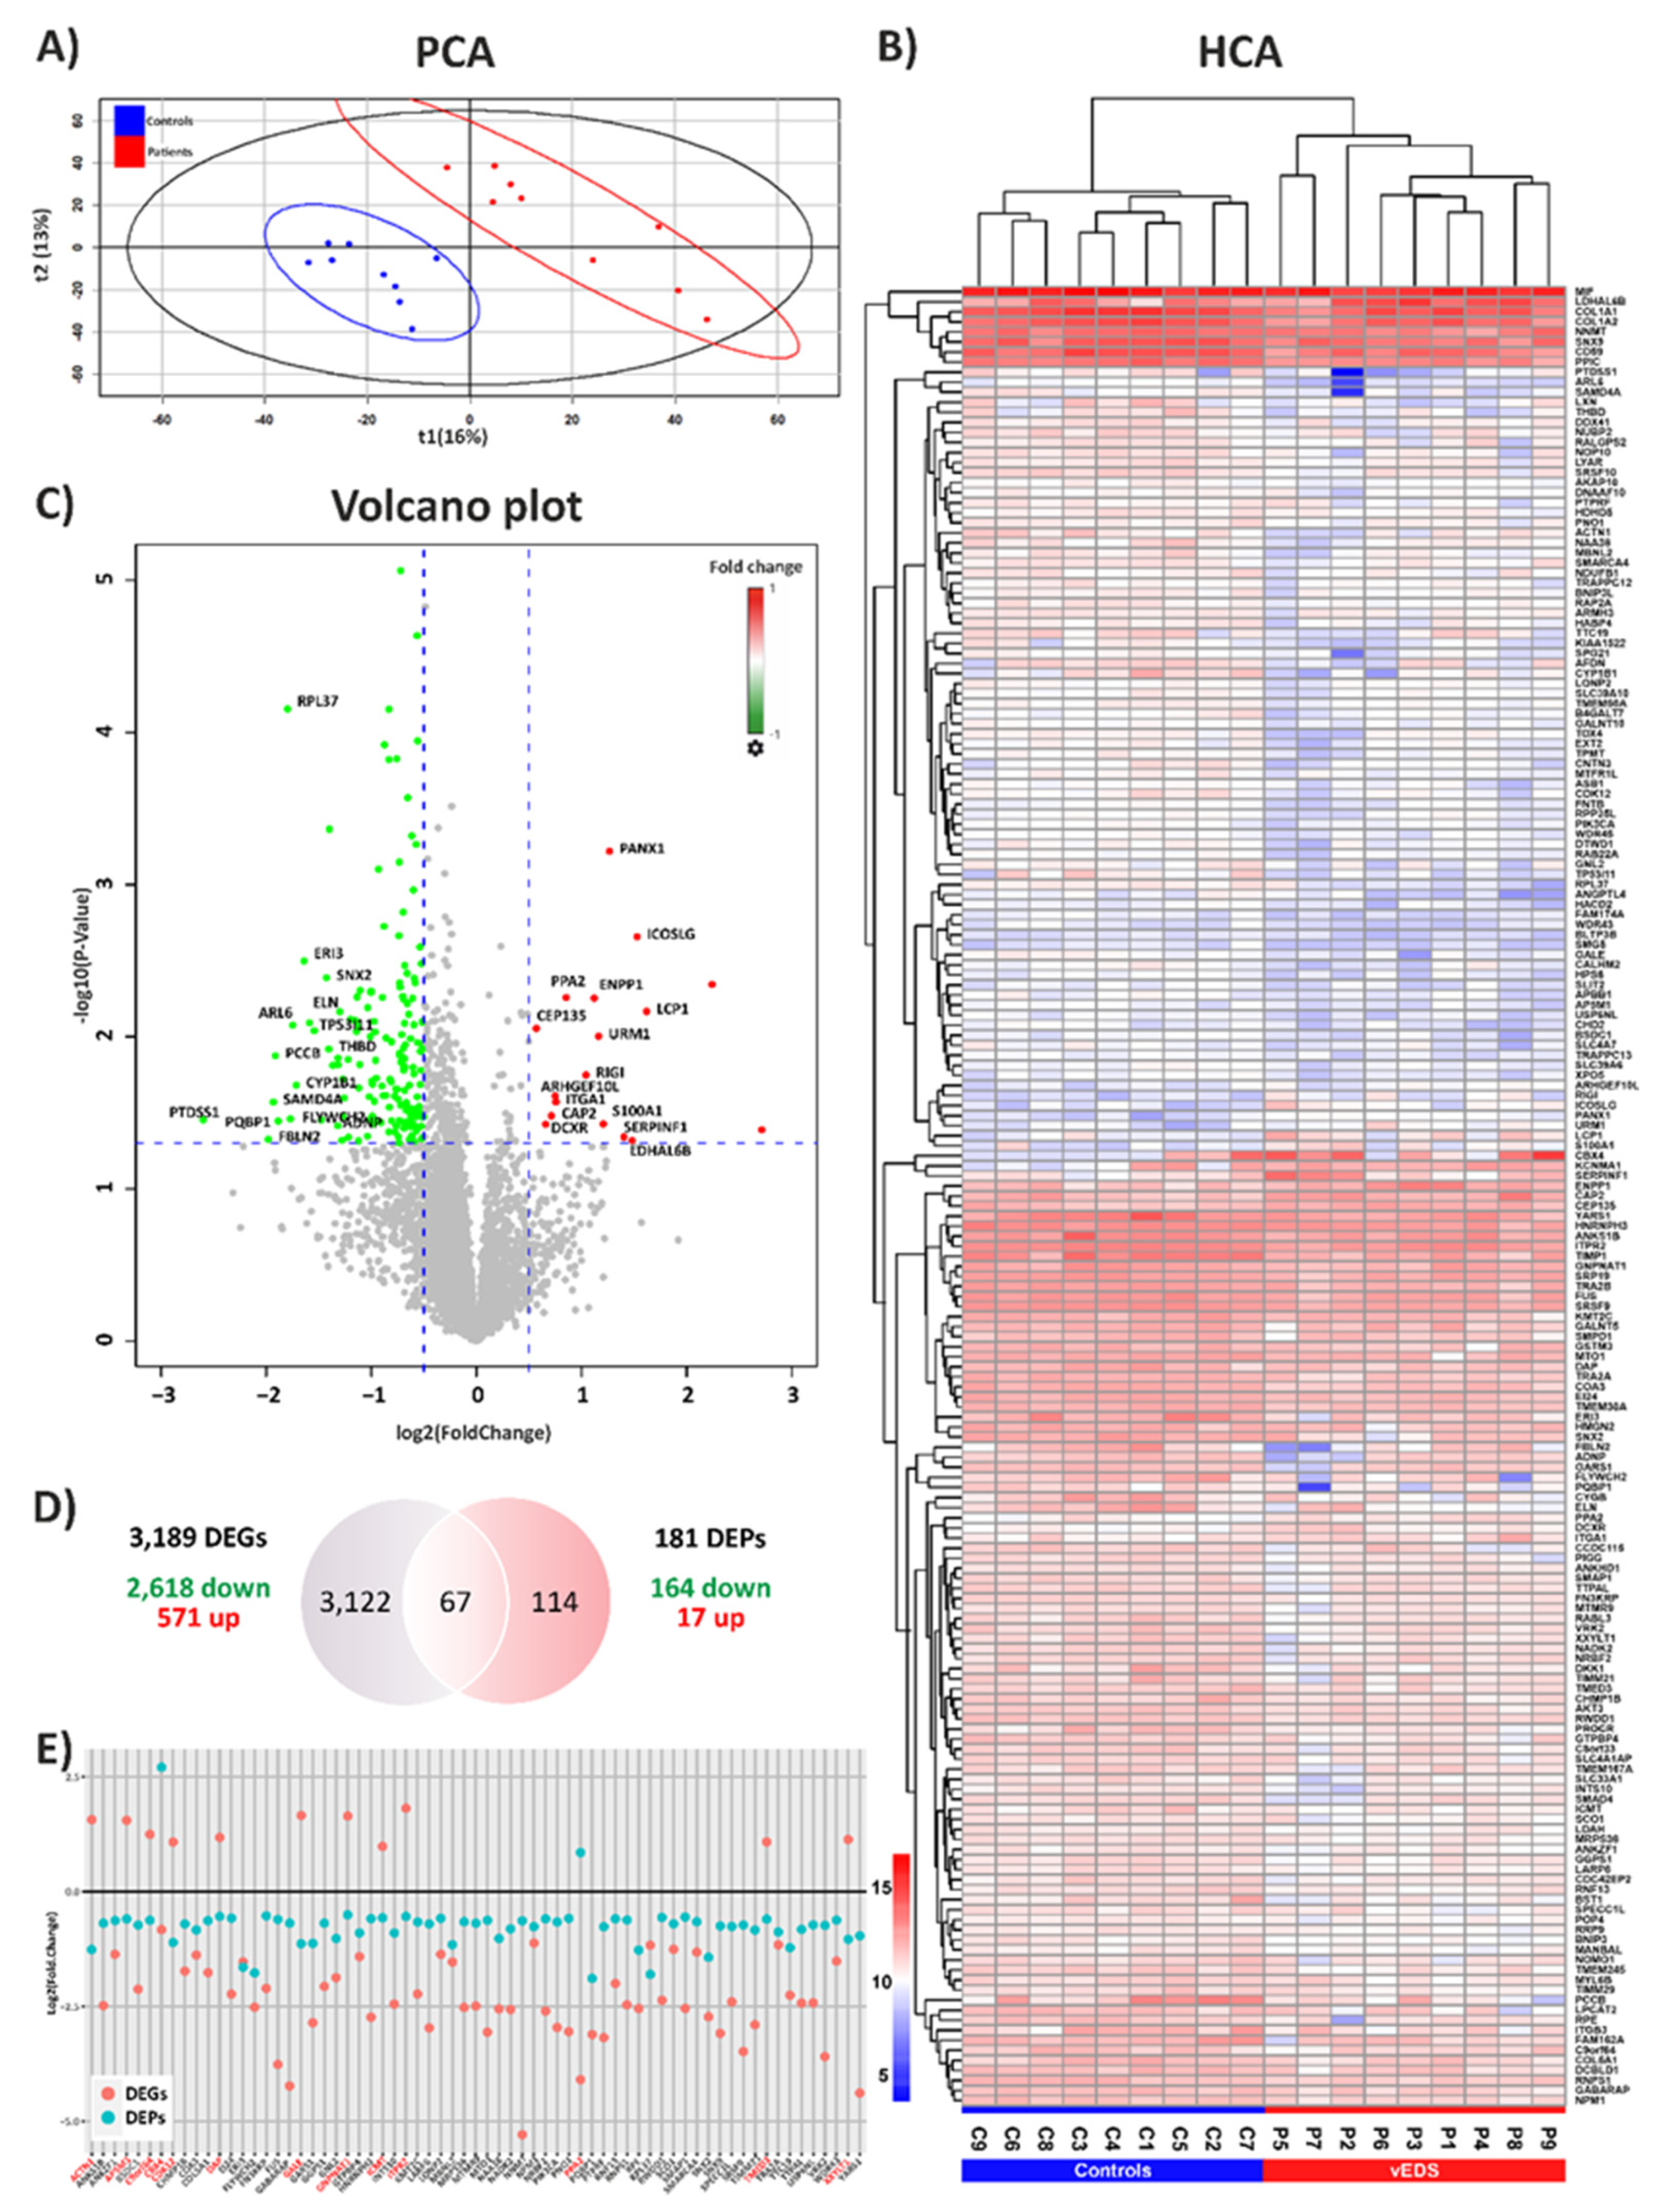
Figure 2.
Functional enrichment analysis. Panel A displays the GO terms and KEGG pathways associated with the 54 overlapping downregulated genes/proteins, while panel B highlights those for the 114 DEPs identified exclusively in the vEDS proteome. The size of the dots reflects the number of proteins enriched in each annotation term, and the color represents statistical significance (-log10 p-value). The complete list of GO categories and KEGG pathways is provided in Supplementary Table 5.
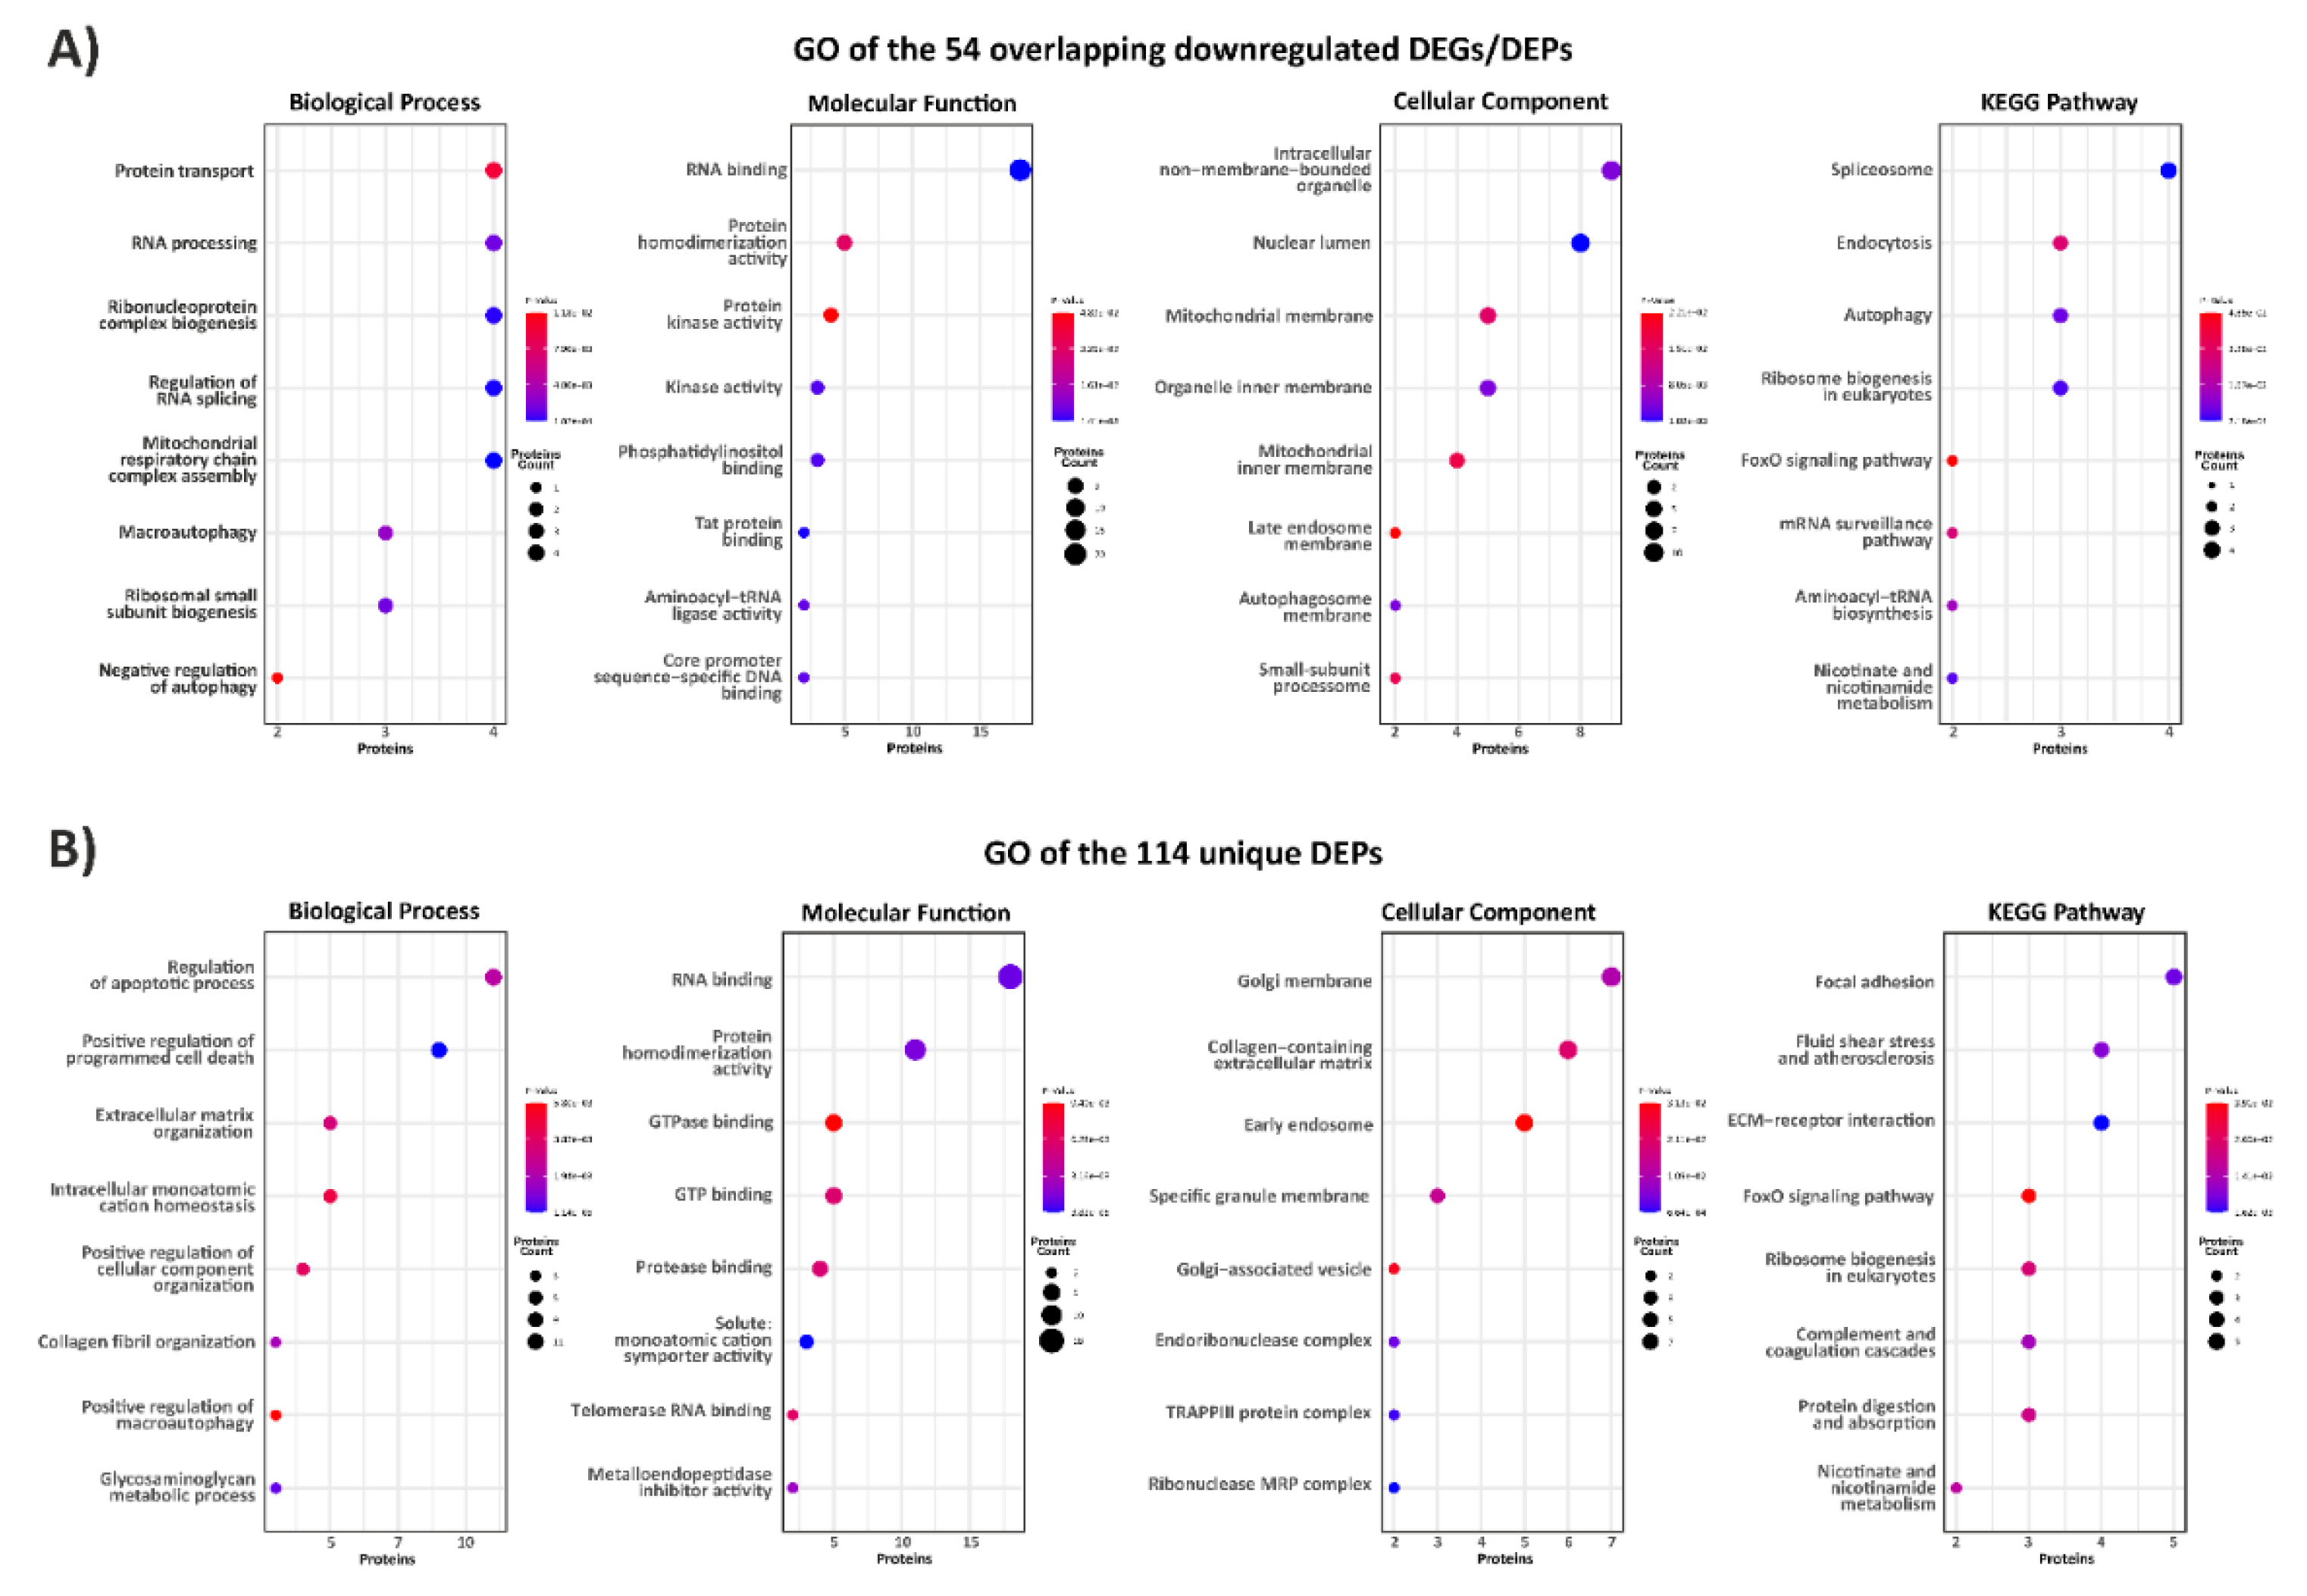
Figure 3.
High-confidence protein-protein interactions and biological network enrichment of all DEPs. A) STRING functional protein interaction networks of down- and upregulated proteins. Each node represents a protein, and each edge represents an interaction, including both physical and functional associations. Only interactions with high confidence score (0.7) are shown. B) Enriched biological networks, integrating GO terms with pathways from WikiPathways, KEGG, and REACTOME, using the ClueGO plugin in Cytoscape. Nodes represent enriched terms, connected by edges based on their κ score (≥ 0.7), reflecting term-term interactions and grouping into functional clusters based on shared genes. Node size indicates statistical significance, with only terms meeting a Benjamini-Hochberg-adjusted p-value threshold of ≤ 0.05 included.
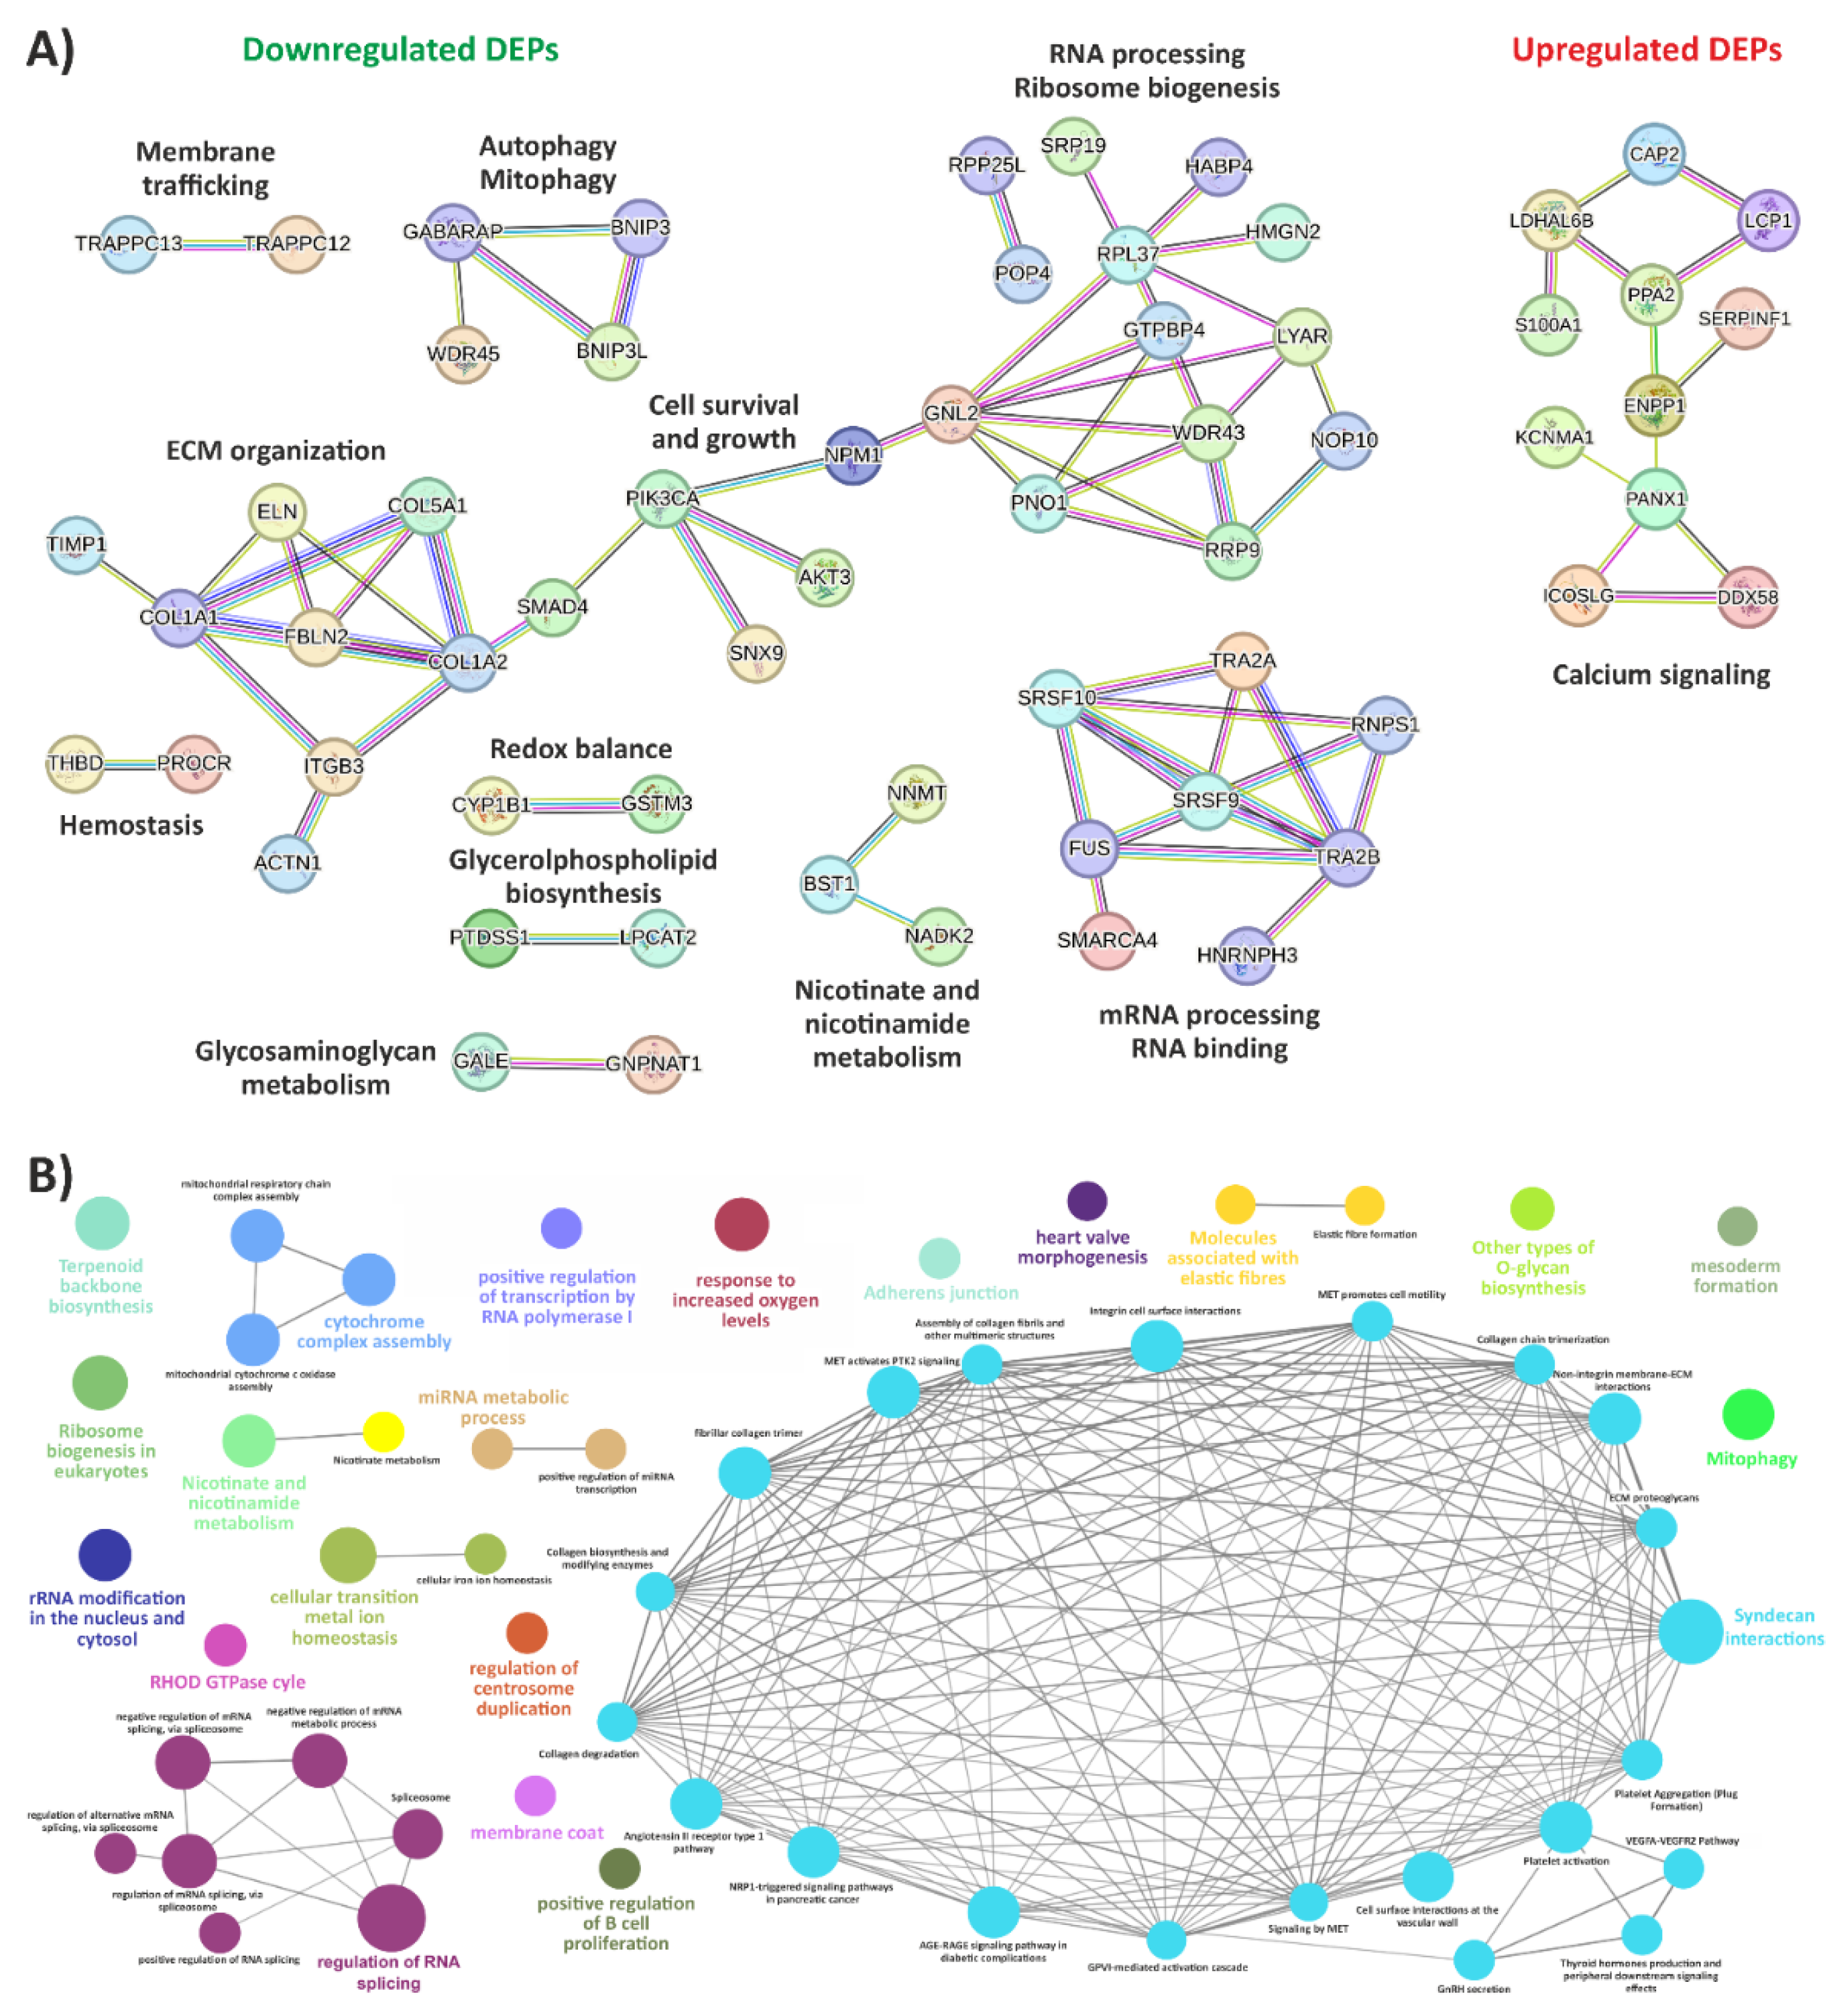
Figure 4.
Deciphering the impact of miR-29b-3p on vEDS pathobiology. A) A bioinformatics survey was conducted to predict the target genes of miR-29b-3p using the PicTar, DIANA, TargetScan, miRanda, and MiRDB algorithms. This analysis identified 974 non-redundant putative target genes for miR-29b-3p. A Venn diagram summarizes the integration of these 974 miR-29b-3p target genes with the 2,618 downregulated DEGs and the 164 downregulated DEPs. B) Expression levels of downregulated target DEGs were measured in vEDS fibroblasts transfected with a miR-29b-3p inhibitor. Patient cells were transfected with 150 pmol of a specific miR-29b-3p inhibitor or corresponding negative control (NC) for 48 and 72 hours. The relative mRNA expression levels of these miR-29b-3p target DEGs were determined using the 2^-(ΔΔCt) method normalized with the geometric mean of ATP5B, CYC1, RPLP0, and YWHAZ reference genes. Bars represent the mean expression ratios from pooled RNA samples of 3 vEDS and 3 control cells transfected with either the specific miR-29b-3p inhibitor or the corresponding NC. All qPCR analyses were carried out in quadruplicate in two independent experiments. Statistical significance between groups were determined using an unpaired Student’s t-test and data are expressed as mean ± SEM (** p < 0.01, *** p < 0.001, ****p < 0.0001). C) Representative WB images and quantitative protein analyses of COLLV(α1) and COLLI in untransfected control (n=3) and vEDS fibroblast (n=3), as well as in vEDS cells (n=3) transfected with 150 pmol of miR-29b inhibitor or NC for 72 hours. Graphical results are presented as mean ± SEM of technical triplicates. Statistical significance compared to untransfected control cells was assessed using Student’s t-test, (* p < 0.05, *** p < 0.001, **** p < 0.0001). D) Expression levels of miR-29b-3p in blood samples of vEDS patients (n=12) and healthy individuals (n=24) were quantified by qPCR using the 2^-(ΔΔCt) method. SNORD48, U6 snRNA, SNORA66, SNORD44, and SNORD38B reference miRNAs were used as endogenous controls for template normalization. Bars represent the mean expression ratios from pooled RNA of 12 vEDS and 24 control blood samples. All qPCR analyses were carried out in quadruplicate in two independent experiments. Statistical significance between groups were determined using an unpaired Student’s test and data are expressed as mean ± SEM (****p < 0.0001).
Disclaimer/Publisher’s Note: The statements, opinions and data contained in all publications are solely those of the individual author(s) and contributor(s) and not of MDPI and/or the editor(s). MDPI and/or the editor(s) disclaim responsibility for any injury to people or property resulting from any ideas, methods, instructions or products referred to in the content. |
© 2024 by the authors. Licensee MDPI, Basel, Switzerland. This article is an open access article distributed under the terms and conditions of the Creative Commons Attribution (CC BY) license (http://creativecommons.org/licenses/by/4.0/).
Copyright: This open access article is published under a Creative Commons CC BY 4.0 license, which permit the free download, distribution, and reuse, provided that the author and preprint are cited in any reuse.


