
Submitted:
15 September 2025
Posted:
17 September 2025
You are already at the latest version
Abstract
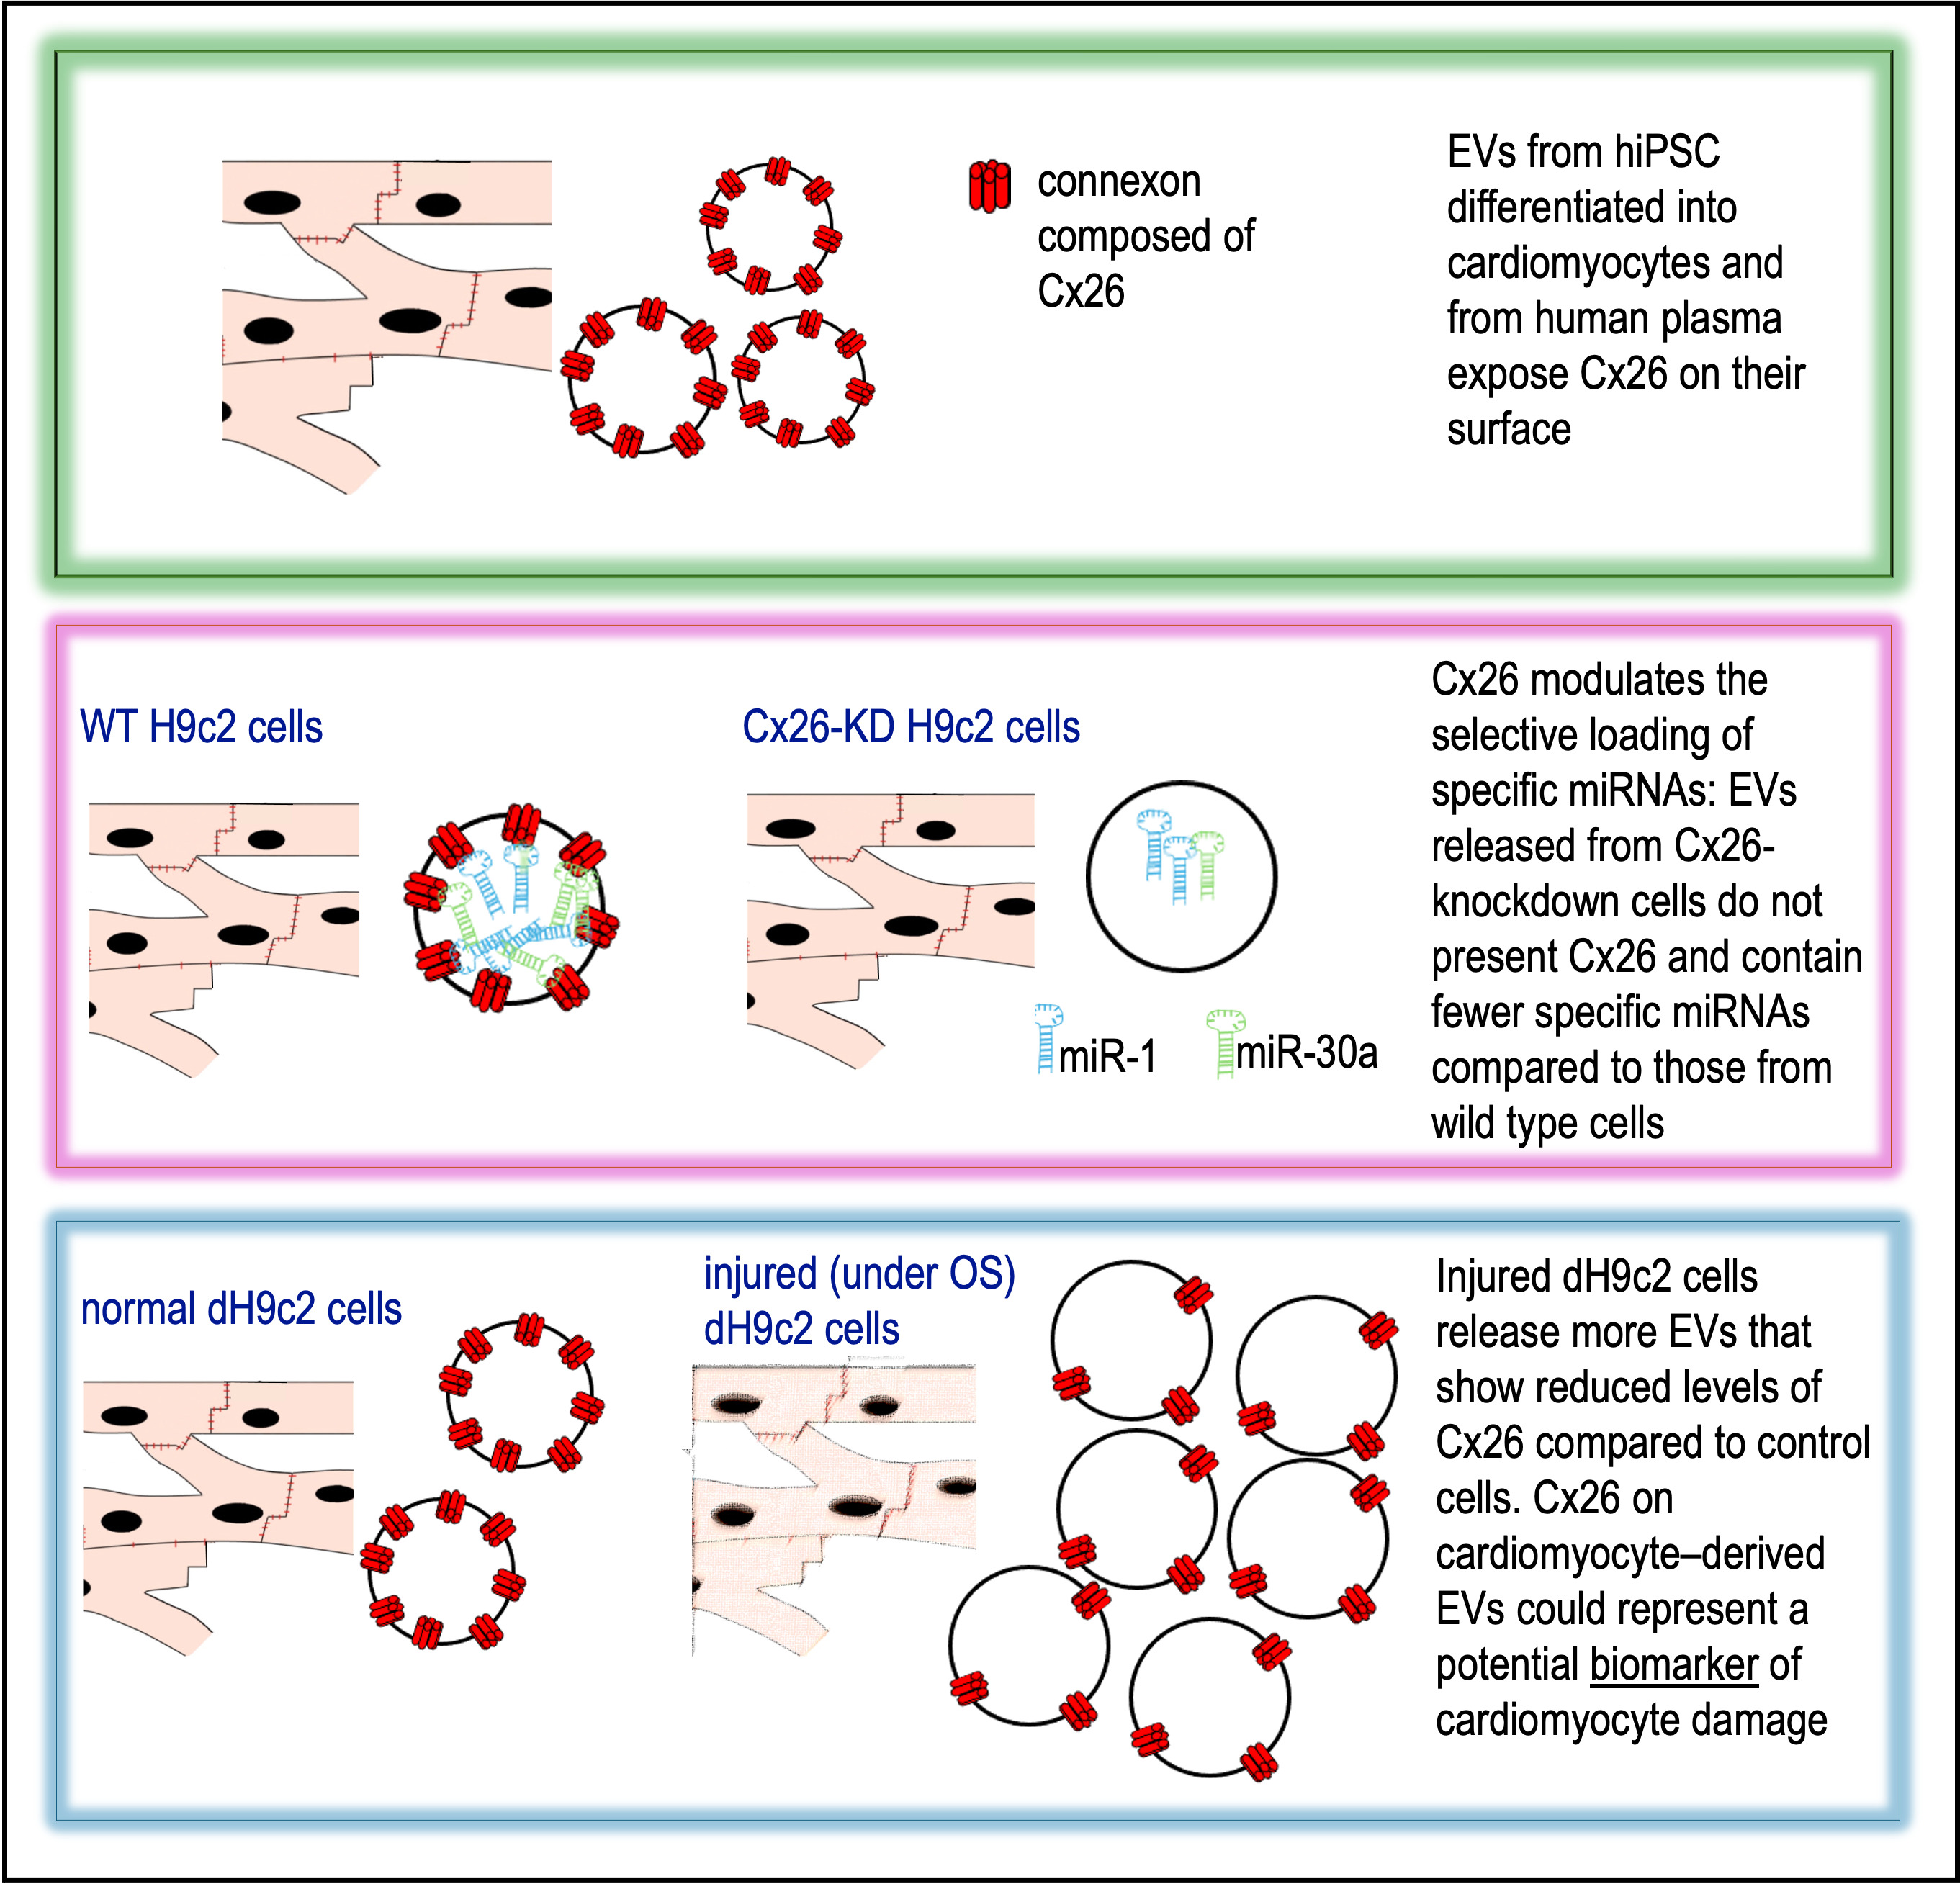
Connexin 26 (Cx26), a gap junction protein, is poorly understood in the context of cardiac milieu, including extracellular vesicles (EVs). Here, we report for the first time the presence of Cx26 on EVs obtained from human induced pluripotent stem cell-derived cardiomyo-cytes and human plasma. Using an in vitro model of oxidative stress (OS) and apoptosis in dH9c2 cardiomyocytes, modeling some key molecular and cellular aspects of ischemic heart disease (IHD) and heart failure (HF), we observed a significant decrease in Cx26 lev-els in EVs released by injured cells, accompanied by changes in EV concentration, partic-ularly in exosomes. Our findings revealed that Cx26 modulates the selective loading of specific microRNAs, namely miR-1 and miR-30a, into EVs, suggesting a novel non-canonical, gap junction-independent role of Cx26 in EV-mediated cardiac signaling. Analysis of plasma EVs from healthy donors confirmed the presence of Cx26-positive EVs of cardiomyocyte origin, indicated by co-staining with cardiac troponin T. These results highlight circulating EV-associated Cx26 as a potential biomarker of cardiomyocyte damage in cardiomyopathies characterized by oxidative stress and apoptosis, such as IHD and HF.
Keywords:
connexin26
; extracellular vesicles
; miRNA
; cardiomyocytes
; oxidative stress
; intercellular communication
1. Introduction
Intercellular communication is essential for tissue coordination and homeostasis, particularly in complex multicellular systems like the heart. In addition to direct cell-cell contact through gap junctions (GJs), emerging evidence highlights the role of long-range signaling mechanisms, including communication mediated by extracellular vesicles (EVs). EVs are vesicles ranging in size from 30 nm to 4 μm that carry molecular cargo, including proteins, lipids, and microRNAs (miRNAs), to recipient cells, often at distant sites [1]. This form of communication is now recognized as a key regulator of physiological processes and pathophysiological responses within the cardiovascular system, including cardiac development, injury, and repair [2,3]. In this context, connexins (Cxs), traditionally known to form GJ channels, have more recently been implicated in the EV function as well. GJs are plaques containing hundreds to thousands of intercellular channels. Each channel is formed by the oligomerization of six Cxs at the cell surface creating a connexon (hemichannel) that docks with a connexon on a neighboring cell. This structure establishes direct intercellular communication, allowing the exchange of 1–1.8 kDa molecules, such as electrical signals, small metabolites, and second messengers. Gap junctions among heart cells, including endothelial cells, stromal cells, and cardiomyocytes, are essential for cardiac function by allowing the exchange of chemical signals. In particular, GJs between cardiomyocytes are predominantly localized at intercalated discs (IDs) where they mediate electrical cell–cell coupling and thus support the propagation of electrical signals throughout the heart. Among the 21 known human Cxs, Cx26 and Cx43 are expressed throughout the myocardium, whereas Cx40, Cx45 and Cx46 are selectively expressed in specific regions of the heart. Cx43, extensively investigated, is mainly localized at intercalated IDs where it forms GJ channels between cardiomyocytes, enabling both electrical impulse propagation and signal transduction [4,5,6,7,8]. More recently, Cx43 has been implicated in cardiac development, fibrosis, and tissue repair, via formation of hemichannels on the EV surface [9,10,11]. Conversely, the role of Cx26, which has only recently been identified in cardiomyocytes [12], remains largely unexplored. Cx26 is absent from IDs and does not appear to contribute to canonical GJ formation in cardiomyocytes; instead, its subcellular distribution suggests a potential non-canonical GJ-independent function [13]. Notably, Cx26 has been identified within intracellular compartments such as multivesicular bodies (MVBs), precursors of extracellular vesicles EVs, and on the surface of EVs released from rat cardiomyocytes. These observations suggest that cardiac Cx26 may participate in EV-mediated intercellular signaling rather than direct cell-cell coupling.
To test this hypothesis, we first investigated the presence of Cx26 in EVs derived from human plasma and cardiomyocytes from human induced pluripotent stem cells (hiPSCs). Then, using an in vitro model of cardiac injury involving oxidative stress (OS) and apoptosis, we assessed the potential role of Cx26 in modulating EV cargo composition, with particular focus on miRNA loading. This was motivated by the presence of multiple predicted RNA-binding motifs within the Cx26 protein sequence [14] and previous evidence of a similar role for Cx43 [11]. We have for the first time revealed a novel non-canonical GJ-independent role of Cx26 in EV-mediated cardiac signaling involved in intercellular communications underlying oxidative stress cardiac injury. Thus, circulating vesicular Cx26 may serve as a biomarker of cellular damage in cardiomyopathies characterized by oxidative stress and apoptosis such as ischemic heart disease (IHD) and heart failure (HF).
2. Results
2.1. Human Cardiomyocytes, As Well As Cardiac Extracellular Vesicles from hiPSC-CM and Human Plasma Display Cx26 Under Normal Conditions
Cultured hiPSC-CMs were characterized by their cardiac phenotype as described in Materials and Methods (Figure 1A-C). Here, Cx26 was expressed at both the cytoplasm and plasma membrane levels, as demonstrated by the positive red fluorescent signal (Figure 1C). TEM-immunogold analysis further revealed the expression of Cx26 on the surface of some EVs isolated from the culture supernatant of hiPSC-CMs (Figure 1D). In particular, Cx26 was observed on EVs smaller than 100 nm in size.
EVs isolated from the plasma of four donors were analyzed for Cx26 expression using TEM immunogold labeling, western blotting, or both (Figure 2). Cx26 could be detected on plasma EVs using either immunogold labeling or western blotting. TEM-immunogold labeling enabled the precise visualization and confirmation of Cx26 localization on EVs with a diameter smaller than 100 nm, thereby substantiating their classification as exosomes. Moreover, as shown in the representative TEM images of Figure 2A, EVs extracted from fresh, unfrozen plasma (identified as ‘bis’) appeared to maintain their morphology and individuality better than those derived from frozen plasma, which appeared less well-defined and more prone to aggregation. Nevertheless, pre-freezing the plasma did not alter Cx26 expression, as demonstrated by immunoblotting analysis, which showed the band reactivity at 26 kDa. Flotillin 2, used as an exosome-specific marker [15], was present in all samples (Figure 2B). Given that our primary interest was qualitative, specifically, the presence or absence of Cx26 on plasma-derived EVs, an equal volume of EV eluate was loaded for each sample in the western blot analysis. However, due to notable differences in band intensity at ~26 kDa between samples, a semi-quantitative assessment of Cx26 expression was subsequently performed on two out of the four samples, normalized to the total protein content as visualized by the stain-free blot. The different intensities of the 26 kDa bands displayed in the blotting by the two samples were confirmed by the semi-quantitative analysis (Figure 2C).
To identify the presence of plasma EVs derived specifically from cardiomyocytes rather than from other tissues, we investigated the presence of cardiac troponin T (cTNT) as a cardiomyocyte-specific marker. Immunoblotting and immunogold labeling confirmed the presence of cTNT in plasma-derived EVs (Figure 2B-D). In particular, TEM analysis (Figure 2D) revealed double immunostaining for Cx26 and cTNT in various EVs, demonstrating that a large subset of Cx26-positive plasma EVs originated from cardiomyocytes.
Interestingly, in the immunoblotting of plasma EV lysates, the mouse anti-cTNT antibody reacted differently than in immunoblotting of murine cardiac tissue lysates, which showed the expected band at 39 kDa (Figure 2B). Specifically, in EV immunoblotting, the anti-cTNT antibody showed multiple bands with a molecular weight slightly above 50 kDa (Figure 2B).
2.2. Oxidative Stress Increases the Production of EV-Derived Exosomes in Cardiomyocytes
The analysis of EV concentration using the NanoSight LM10 technology (Figure 3A) demonstrated that the number of total EVs in the supernatant from control cells or cells under OS did not change (Figure 3B). However, we also focused on exosomes, the EVs with a smaller diameter. Considering the exosomes, it was observed that their concentration increased when they originated from cells under OS compared to those from control cells (Figure 3C). Moreover, as shown in Figure 3D-E, NanoSight analysis of size distribution revealed that the mean size of EVs derived from H₂O₂-treated cells was larger than that of EVs from control cells (207 ± 6.5 nm vs. 183.3 ± 11 nm). Additionally, only 10% of EVs (OD10) had a size smaller than 127 nm or 95 nm. These results contrast with our previous findings, obtained with TEM analysis of EVs from dH9c2 control cells [13], which showed that the majority of EVs had a size of 30 to 50 nm. This apparent contradiction could be explained by assuming that in our present samples, EVs tended to form aggregates of five or six elements, which were instead recognized by the NanoSight as single vesicles. This hypothesis was supported by TEM analysis of the same samples, albeit collected in a separate experiment, which showed a certain degree of EV aggregation (Figure 3F) and by the absence of DNase pretreatment, a step employed to eliminate extracellular DNA that can induce aggregation of exosomes [16]. Nevertheless, although some uncertainty may persist regarding the precise quantification of EVs, potentially underestimated in this case by NanoSight analysis, there is greater confidence that the number of exosomes from the treated samples increased compared to those from controls.
2.3. Oxidative Stress Modulates the Expression of Cx26 and miRNA Cargo in Cardiomyocytes-Derived Extracellular Vesicles
We hypothesized that Cx26 might constitute connexons/hemichannels on EVs and could be involved in the modulation of the EV cargo, namely in terms of miRNAs, due to the presence of several predicted RNA-binding motifs in the Cx26 sequence [14] and to the previous study of Martins-Marques on Cx43 [11]. To address this issue, we first selected the following miRNAs, miR-1, miR-208a, miR-30 a, as they were previously found to be expressed in H9c2 cells and in their EVs [17,18,19]. As we used H9c2 cells differentiated into cardiomyocytes instead of undifferentiated cells, we had to confirm the presence of these miRNAs in EVs derived from the differentiated cells. We then evaluated whether the expression of Cx26, as well as the miRNA cargo, changed in EVs derived from dH9c2 cells under oxidative stress (OS). OS plays a key role in several cardiovascular diseases, also altering the production of many miRNAs, including miR-1 [20,21]. The presence of cell injury was confirmed by the appearance of OS and apoptosis as demonstrated by the positivity to the reaction for 4HNE and CASP-3, respectively (see Materials ad Methods).
Western blotting analysis of EV lysates demonstrated for the first time that Cx26 decreased in EVs derived from injured cardiomyocytes. Specifically, the amount of Cx26 in EVs from injured cells was reduced more than threefold compared to EVs from control cells (p=0,04, n=6, Figure 4A). The EV marker CD63 remained unchanged in EVs from both control and treated cells. TEM images confirmed the immunoblotting results and further showed that 1) the number of EV presenting Cx26 was lower when EVs derived from OS cells than when derived from control cells and 2) each observed EVs had fewer gold particles than those derived from control cells, as demonstrated by the number of colloidal gold/EV area and by the number of colloidal gold /EVs, respectively (Figure 4B). According to the results obtained in this study with EVs from hiPSC (Figure 1D) and in a previous study with EVs from dH9c2 [13], the EVs with higher Cx26 content are those with a diameter typical of exosomes (Figure 4B).
The results obtained from profiling the expression levels of three miRNAs in EV lysates derived from control or H₂O₂-treated dH9c2 cells indicated for the first time that miR-1, miR-208a, and miR-30a were expressed by H9c2 cells even after differentiation into cardiomyocytes, and that they are present in the EVs released by these cells. Moreover, the results showed a trend toward changes in the expression of miR-1 and miR-280a that can be observed in the EVs from cells under OS compared to those from control cells. In particular, miR-1 decreased, while miR-280a increased in EVs from cells under OS (mean ± SEM: 0.855±0.305, for miR-1; 2.812±2.704, for miR-280a; 1.929±1.342, for miR-30a) compared to EVs from control cells (2.482±1.276, for miR-1; 0.794 ± 0.317, for miR-280a; 1.480 ± 0.722, for miR-30a), although in a not significant manner.
2.4. Cx26 Modulates the Selective Sorting of miR-1 and miR-30a Into EVs from H9c2 Cells
To examine whether Cx26 is mechanistically involved in the EV-miRNA expression under normal conditions, we used RNA interference (siRNA) technology to knock down (KD) gene expression of Cx26 in H9c2 cardiomyoblasts, as detailed in Materials and Methods. Cx26 siRNA did not affect cell morphology or cell proliferation (Figure 5A) but triggered a substantial (90%) reduction in Cx26 protein and mRNA expression in KD-H9c2 cells (Figure 5A,B) compared to control cells. By contrast, serving as a sequence-unrelated control, scrambled siRNA did not exert any detectable effect (Figure 5A). The reliability of the result was ensured by the silencing of GAPDH mRNA achieved in the same experiments as well. (Figure 5A). We analyzed the abundance of miR-1, miR-208a and miR-30a on EVs derived from both Cx26-KD H9c2 cells and Cx26-expressing H9c2 scrambled cells. miR208a expression in EVs from H9c2 was substantially increased after transfection with siRNA against Cx26 compared to scrambled siRNA, while the expressions of miR1 and miR30a were substantially suppressed (Figure 5C). Importantly, EVs from Cx26-KD cells contained a very low amount of Cx26 (Figure 5D), as expected from the successful silencing of Cx26 in the H9c2 cells (Figure 5A,B) that released these EVs.
3. Discussion
Our study provides novel insights into the role of Cx26 in EV-mediated cardiac signaling involved in intercellular communication during cardiac injury caused by oxidative stress.
Cx26 on EV membranes could potentially form hemichannels, influencing cargo loading or facilitating the transfer of various cargo molecules (e.g., ions, nucleotides, amino acids, sugars, mRNA, and miRNA) into target cells. Since at cardiac level Cx26 is absent from intercalated discs (IDs), this EV-associate role may represent its primary mode of action in cardiomyocytes, distinct from the GJ-dependent functions typically attributed to the other cardiac Cxs predominantly localized at IDs. Furthermore, circulating vesicular Cx26 may serve as a biomarker of oxidative stress cardiac injury. In the present research work, we propose that plasma EVs expressing Cx26 predominantly originate from cardiomyocytes. Although Cx26 is found in other tissues, such as gut smooth muscle cells [22] or supporting epithelial cells in the ear [23], its function in these cells is mainly canonical GJ-dependent. We employed an antibody against cardiac-specific troponin T (cTNT), which is well-established as a marker of cardiac-derived EVs [10,24]. TEM analysis confirmed the co-expression of Cx26 and cTNT in circulating EVs, supporting their cardiac origin. Notably, we detected cTNT on the EV surface, as immunogold labeling was performed on intact, non-permeabilized vesicles, indicating that the anti-cTNT antibody recognizes an epitope accessible on the EV exterior. This is noteworthy because it implies that this antibody could be used to isolate cardiomyocyte-derived EVs from plasma, addressing the current lack of truly cardiomyocyte-specific EV surface markers. Recent studies have proposed CD172a and Ldb3 as candidate cardiomyocyte EV markers [24,25]. However, CD172a is also expressed by certain leukocyte subsets, requiring complex multicolor flow cytometry with a back-gating strategy to distinguish cardiac EVs from contaminants. Ldb3 is enriched in cardiomyocyte-derived EVs, but its precise localization on or within EVs remains to be validated before it can be reliably used for isolating cardiomyocyte-derived EV. Immunoblotting analyses revealed multiple immunoreactive bands at molecular weights exceeding that of the expected free cTNT. This suggests that cTNT in EVs exists not only as a free protein but may also be complexed with other molecular assemblies. This finding aligns with recent report that cardiomyocytes release troponin in association with sarcomeric proteins via autophagy-derived “exospheres” (large extracellular vesicles) as part of cellular homeostasis [26]. In the same report, it is suggested that the incorporation of cTNT into molecular complexes within EVs may reflect specific cargo packaging or sorting mechanisms, influenced by the physiological or pathological status of the parent cells.
Alterations in Cx26 levels on cardiomyocyte-derived EVs could reflect cardiomyocyte injury or dysfunction as previously proposed for Cx43. Specifically, previous work demonstrated that myocardial infarction alters Cx43 content in cardiomyocyte-derived EVs [10]. To investigate the effect of OS and apoptosis on Cx26 abundance in cardiomyocyte-derived EVs, we employed an in vitro model using dH9c2 cells treated with H2O2. Our data showed that injured cells released EVs with significantly reduced levels of Cx26 compared to controls, suggesting the involvement of EV-associated Cx26 in cardiomyocyte injury. Our analysis of plasma EVs from healthy human donors were primarily qualitative, aiming to assess the presence of Cx26 on plasma EVs. However, western blot results revealed that the four examined samples exhibited variability in EV-Cx26 levels despite donors having no known acute or chronic diseases, including cardiac dysfunction. This variability may be attributed to the sensitivity of plasma EV-Cx26 levels to subclinical or preclinical cellular alterations, as well as to individual characteristics such as age, sex, weight, and lifestyle factors. Therefore, it will be crucial to study larger cohorts, including patients with established cardiac pathologies, to evaluate whether plasma EV-Cx26 variations may have prognostic value on disease progression. Martins-Marques et al., based on their previous findings that Cx43 facilitates EV communication with recipient cells [9] and mediates miRNA sorting in EVs derived from human embryonic kidney or cervix epithelial cells [11], proposed that decreased Cx43 levels on plasma EVs could impair intercellular transfer of metabolites, signaling molecules, and miRNAs, consequently modulating secreted miRNA profiles and potentially acting as a cardioprotective mechanism. Our findings raise the possibility that analogous mechanisms involving Cx26 may exist, which warrants further investigation. Our data in Cx26 silenced H9c2 cardiomyoblasts clearly demonstrate that Cx26 is involved in miRNA recruitment. Indeed, among the three miRNAs analyzed, levels of miR-1 and miR-30a were significantly reduced in EVs derived from cells silenced for Cx26, whereas levels of miR-280a were increased. Although the cells utilized for silencing experiments are not fully differentiated cardiomyocytes, they remain widely used as a cardiomyocyte cellular model [27,28,29]. Contrary to what we expected, considering the role of Cx26 on EVs, miRNA expression analysis after ossidative injury showed only a trend toward decreased miR-1 in EVs from OS-treated cells. The lack of statistical significance could be attributable to the low number of experimental replicates or to the experimental conditions used, such as H₂O₂ incubation time or concentration, which, although sufficient to induce oxidative stress and apoptosis, may not have been adequate to significantly alter miRNA cargo.
Interestingly, despite the reduced Cx26 levels on EVs from damaged cells without changes in cellular Cx26 protein levels (data not shown), cellular injury induced increased production of EVs, specifically exosomes. The increased production of EVs following cellular injury is consistent with previous studies reporting elevated EV shedding under inflammation and hypoxia [30,31]. These data suggest that Cx26’s role on EVs is specific and operates independently of both the overall number of EVs produced and the amount of Cx26 present in the donor cells.
Our findings expand the current understanding of connexin biology; particularly for Cx26, whose cardiac function has remained largely unexplored. In addition, our work highlights important methodological advances. We have observed that for accurate EV characterization by TEM, the use of pre-frozen plasma or cell culture supernatant should be avoided. We adopted a differentiated EV isolation protocol, tailoring the method to the specific sample type and downstream analyses. This approach ensured the optimal analysis of EVs and their cargo composition for each experimental application, including immunoblotting, TEM immunogold, and RT-PCR. Such methodological rigor is essential to minimize variability and potential artifacts, thereby strengthening the reliability of EV analyses
This “proof-of-concept” study offers novel perspectives on the function of Cx26 in the heart, highlighting its significant role in EV-mediated signaling.
In summary, we have provided new insights on a novel non-canonical, gap junction-independent role of Cx26 in EV-mediated cardiac signaling in an in vitro model of oxida- tive stress and apoptosis. This”proof-of-concept” study suggests that circulating EV-asso- ciated Cx26 may be an attractive biomarker of cardiomyocyte damage in cardiomyopa- thies characterized by oxidative stress and apoptosis, such as IHD and HF. Further in vivo preclinical studies in HF animal models together with clinical trials are needed to explore the functional effects of Cx26-containing EVs and their relevance in patients with HF. Such research will be crucial to better elucidate their involvement in cardiac physiology and pathology.
4. Materials and Methods
4.1. Cell Cultures
Human induced pluripotent stem cells (hiPSCs, Gibco® Episomal hiPSC Line, Thermo Fisher Scientific, Waltham, MA, USA) were cultured and differentiated in cardiomyocytes on Vitronectin (VTN-N, Gibco A14700)-coated flasks with Essential 8® Flex basal medium (Gibco, A28583-01) + Supplement (Gibco, A28584-01) + 1% Penicillin/Streptomycin (P/S) (referred to as Complete Flex). Revita (Gibco A2644501-01) was added to Complete Flex (5 μl of Revita/ml of medium) just for the thawing and passaging of cells for 24 hours. Medium was refreshed every 2 days, and at 70-80% confluence, cells were gently expanded using Versene (Gibco, 15040-033) without destroying cell clusters. The cell seeding density was 20.000 cells/cm2. To start the differentiation protocol, clusters of hiPSCs (70-80% of confluence) were rinsed twice with Dulbecco’s phosphate-buffered saline (DPBS) without calcium and magnesium (DPBS -/-), then detached and singularized with TrypLE (Gibco, A12177-01, diluted in Versene or DPBS -/-). Cells were seeded in VTN-N-coated flasks (seeding density of 20.000 cells/cm2), and the medium was replaced every 2 days until 50-60% confluence. Then, the differentiation protocol started and continued for 12 days using the PSC Cardiomyocyte Differentiation Kit (Gibco, A29212-01). Day 0: Complete Flex was removed, and Medium A (Gibco, A29209-01) + 1% P/S was added. Day 2: Medium A was removed, and Medium B (Gibco, A29210-01) + 1% P/S was added. Day 4: Medium B was replaced with Cardiomyocyte Maintenance Medium (Gibco, A29208-01) and 1% P/S (referred to as Maintenance medium). The medium was refreshed on days 6, 8, and 10 till cells started to beat. On day 12, the cells were incubated with ROCK inhibitor (ROCKi, Y-27632) (Merck, Darmstadt, Germany, SCM075) (final concentration 10 μM in Maintenance medium) for 1 hour at 37 °C. Cells were then detached using TrypLE, and after centrifugation at 300xg for 5 minutes, the pellet was resuspended in Cryopreservation medium (Gibco, A26444-01) or Fetal Bovine Serum (FBS) supplemented with 10% dimethyl sulfoxide (DMSO) and stocked in liquid nitrogen. HiPSC differentiated into cardiomyocytes (hiPSC-CM) were characterized by the presence of beat, expression of specific cardiac markers as c-αactinin and Cx43, and by the absence of expression of non-cardiac specific marker such as Cx32 (Figure 1A-C).
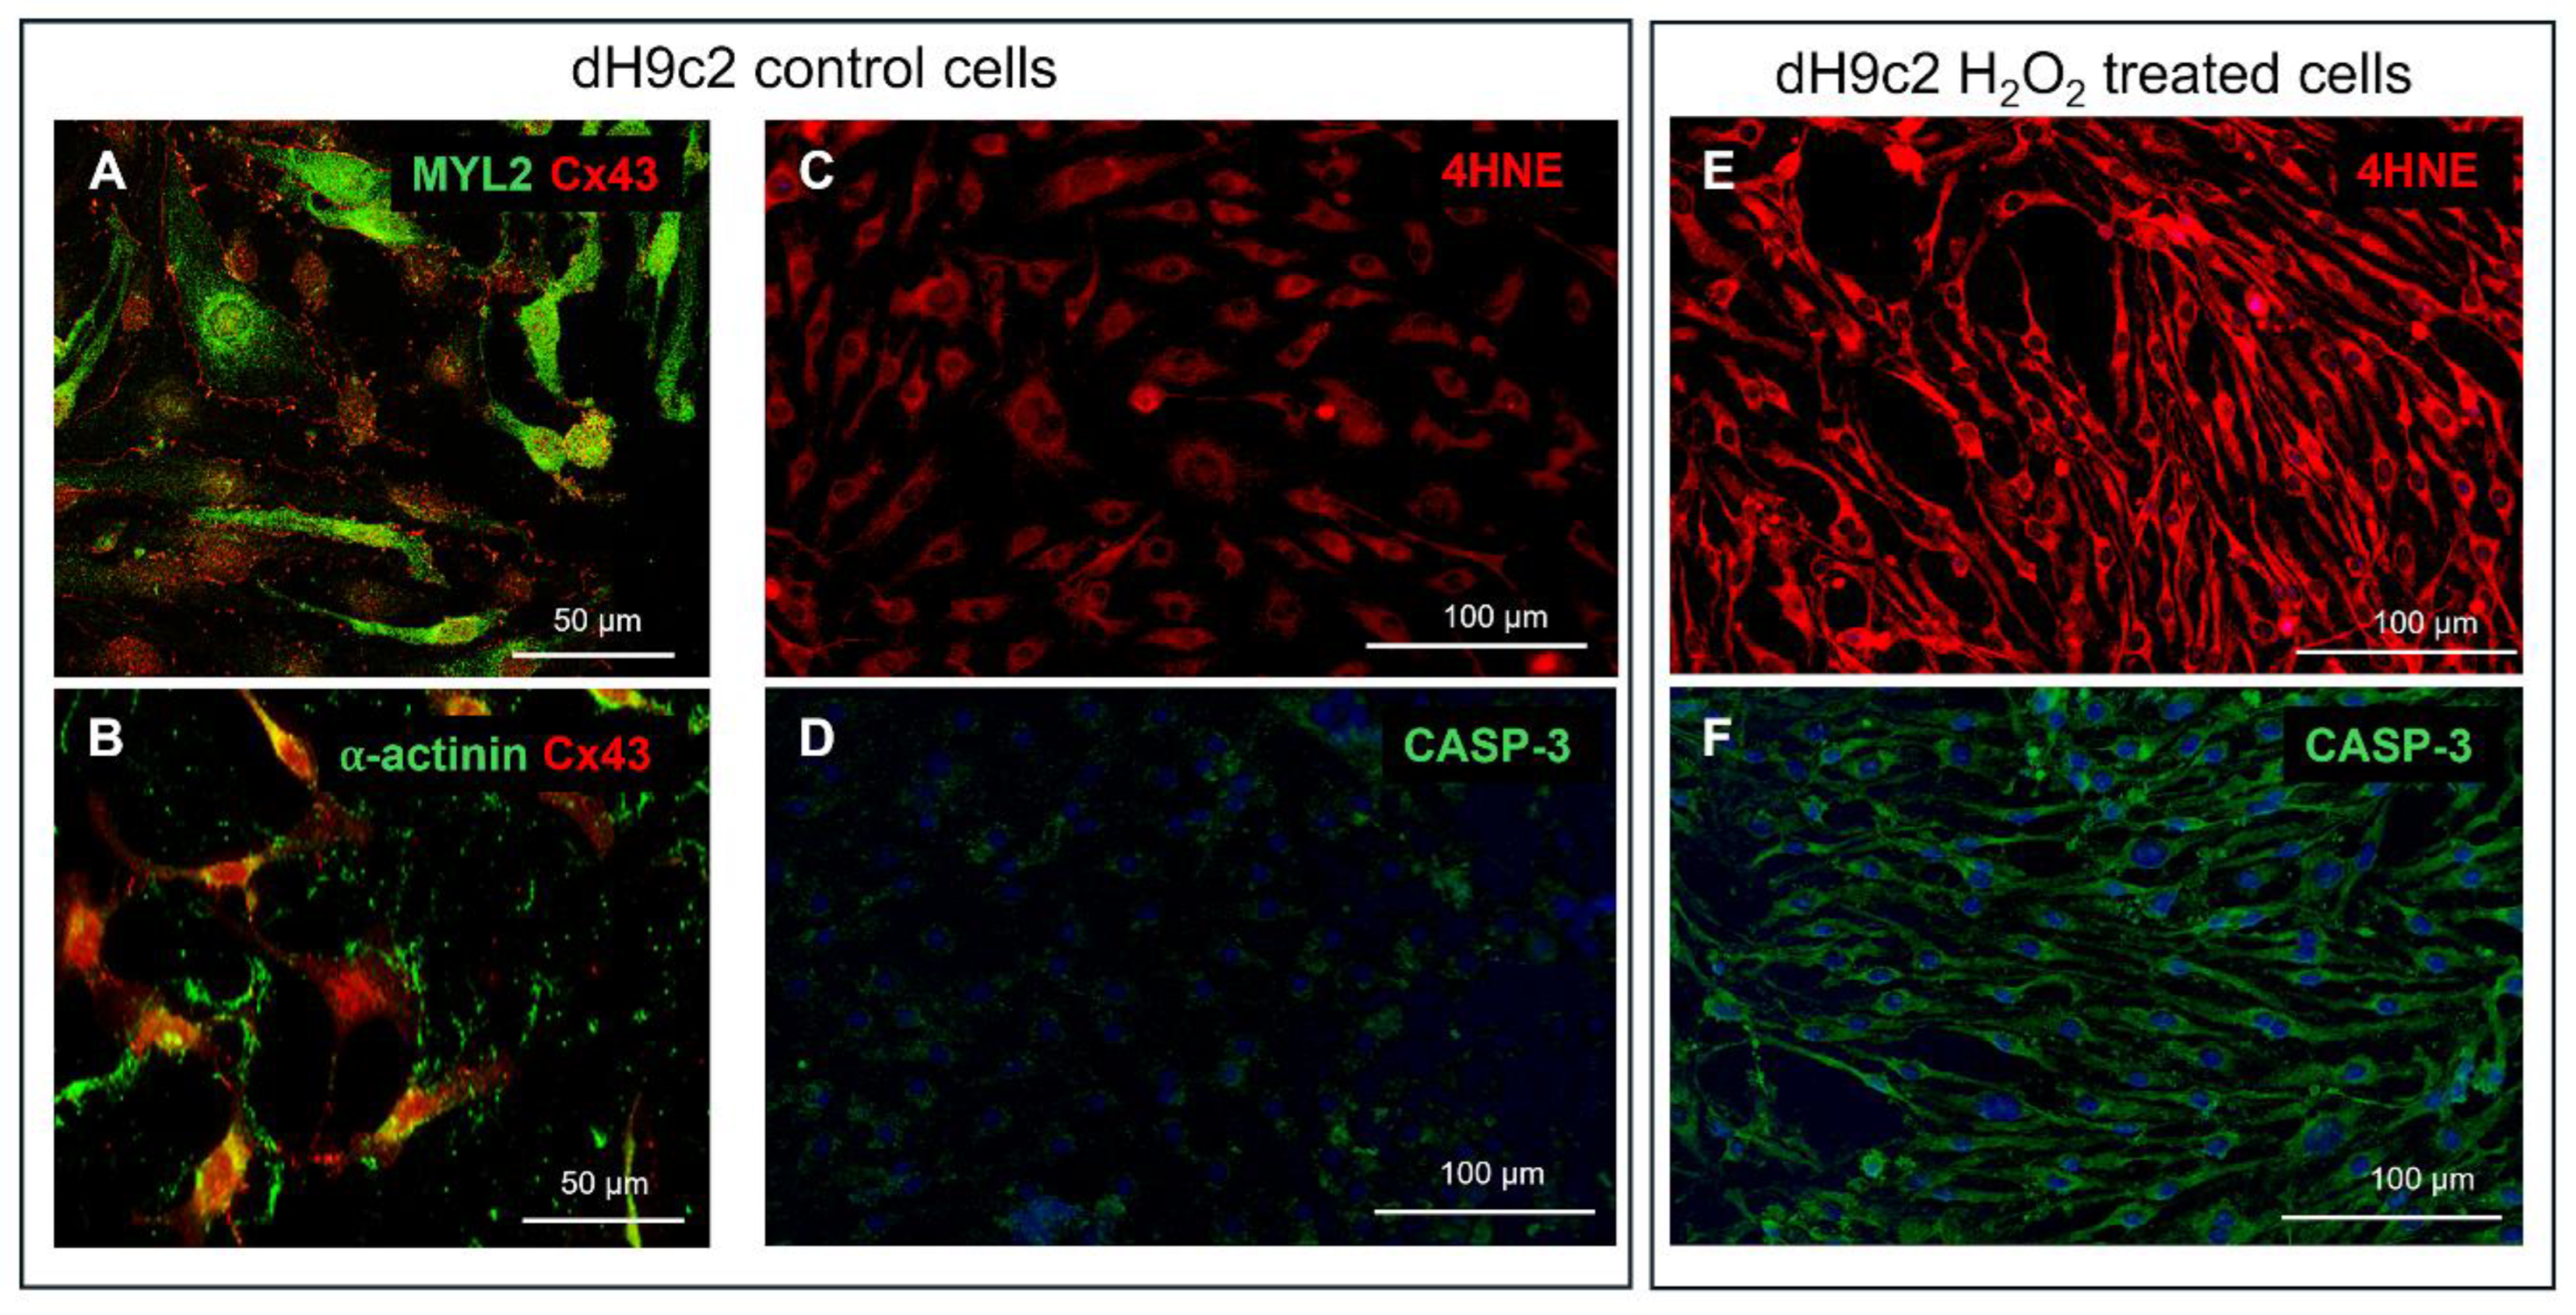
H9c2 myoblasts, purchased from American Type Culture (ATCC, Rockville, MD) and differentiated into cardiomyocytes (dH9c2), were used to build the in vitro model of cardiac injury. H9c2 cells were cultured in high glucose Dulbecco’s modified Eagle’s medium (DMEM, ATCC) supplemented with 10% heat-inactivated fetal bovine serum (FBS) and 1% penicillin-streptomicin (Sigma-Merck) under 95% air and 5% CO2 at 37°C. Differentiation into cardiomyocytes was performed in DMEM containing 1% FBS and all trans-retinoic acid (RA; Sigma-Merck) supplementation (50 nM) for 10 days, as previously described [12], and confirmed by immunofluorescence positivity for c-αactinin, MYL2 and Cx43 (Figure 6A-B). dH9c2 injured model was obtained inducing oxidative stress (OS) by H2O2 treatment as previously described for H9c2 cells [32,33] with some adjustments, namely, dH9c2 cells were treated with 300 μM of H2O2 for 24 hours. This treatment, according to MTT assay, showed approximately 50% toxicity for control dH9c2 cells (data not shown). Then the cell injuries induced by H2O2 treatment, such as OS and apoptosis, were verified by both the expression of 4-hydroxy-2-nonenal (4HNE), considered a specific sensitive oxidative stress marker and the expression of caspase 3 (CASP-3) (Figure 6C-F).
For immunofluorescence analysis, dH9c2 cells cultured in chamber slides, were fixed in 1% formaldehyde /PBS for 10 min at 4°C and stored at 4°C. All experiments were performed on the cells at 70-80% subconfluence.
For studying EVs, in the model of cardiac injury, a culture medium containing a FBS previously ultracentrifuged at 100,000× g for 2 h, to eliminate serum EVs, was used at the last medium change. Then supernatants of cell cultures were harvested, centrifuged at 200 g to remove cell debris and further centrifuged at 2000× g for 30 min at 4◦C or filtered through 0.8 µm pore size syringe filters (Millex®-AA, Merck) to remove apoptotic bodies. Then, the supernatants were immediately treated for EV extraction or frozen in aliquots at -80°C, until further processing, according with previous procedures [34,35,36,37].
4.2. Human Samples
The use of human samples was conformed to the principles outlined in the Declaration of Helsinki and was approved by the Bioethics Committee of the University of Pisa (Rev 40/2023). Five to ten ml of venous blood samples were taken from healthy volunteers without any known acute or chronic diseases (n=4, 3 women-1 man; age=50-67) and collected into EDTA or sodium citrate. Plasma samples, obtained by 10 minutes at 3000 rpm centrifugation at 4°C, were filtered using 0.8 µm filters, to remove remaining platelets and apoptotic bodies, and immediately treated for EV extraction or frozen in aliquots at -80°C, until further processing.
4.3. Immunofluorescence (IF) Staining of Cultured Cell Lines
Fixed hiPSC-CM, dH9c2 and H9c2 cells were hydrated in water, washed in PBS, and then incubated with 0.2% triton-X100/PBS for antigen retrieval. Successively, samples were incubated with blocking solution (BS: 0.1% Tween 20, 0.25% BSA in PBS) for 1 h and then, overnight at 4° C, with the following primary antibodies diluted in BS: mouse monoclonal anti-cαactinin (Sigma Aldrich, Merck, A7732, 1:100), rabbit polyclonal anti-Cx26 (Novus Biologicals, Centennial, CO, USA, NBP2-41304, 1:200), mouse monoclonal anti-Cx43 (Santa Cruz Biotechnologies, Dallas, TX, USA, SC-271837 1:50), rabbit polyclonal anti-Cx32 (Invitrogen, Thermo Fisher Scientific, 710600, 1:50), rabbit polyclonal anti- GAPDH (SIGMA, Merck, G9545, 1:20.000), rabbit polyclonal anti-4HNE (BIOSS Antibodies, Woburn, MA, USA, bs-6313R, 1:100), mouse monoclonal anti-caspase 3 (BIOSS Antibodies, bsm-33199M, 1:100), mouse anti-MYL2 (Santa Cruz Biotechnologies, sc-517414, 1:50). After washing in BS, samples were incubated for 90 min at RT in the dark with fluorescent goat anti-mouse (Alexa FluorTM 488, Invitrogen, Thermo Fisher Scientific, A11001, 1:250) or donkey anti-rabbit (Alexa FluorTM 568, Invitrogen, Thermo Fisher Scientific, A10042, 1:250) secondary antibodies. For double immunofluorescence analyses, the samples were incubated in the mixture of two primary antibodies (anti-cαactinin and anti-Cx32 or anti-Cx43 and anti-Cx26 or anti MYL2 and anti Cx43 or anti-cαactinin and anti-Cx43) and then in the mixture of two secondary antibodies. Finally, samples were mounted with mounting medium (ProlongTM Diamond Antifade Mountant with or without DAPI, Invitrogen, Thermo Fisher Scientific). The entire procedure was performed at room temperature unless specified. The negative controls for the specificity of the secondary antibodies were performed by omitting primary antibodies that were replaced by the BS solution. Immunofluorescent reactions were observed by a standard light microscope (BX43, Olympus, Hamburg, Germany) or by a confocal laser scanning microscope (TC SP8 Leica Microsystems, Mannheim, Germany) at 200x-400x magnification.
4.4. EV Isolation and Count
EVs were extracted from 10 ml cell supernatant or 1 ml plasma per sample using a membrane-based affinity binding step assay (EM, exoEasyMaxi kit, Qiagen GmbH, Hilden, Germany) and/or ultracentrifugation (UC), according to the manufacturer’s instructions and with previous procedures [34,35,36,37], depending on the analyzes to be performed on the collected EVs, as optimized and specified below. EV extraction using the EM kit was performed according to the manufacturer’s protocol. Briefly, plasma samples or cell supernatants were diluted with binding buffer (XBP) in a 1:1 ratio. The samples were then transferred into an ExoEasy spin column and centrifuged sequentially at 500xg for 2 min and at 4200xg for 1 min. After discarding the flow-through, 5-10 ml of wash buffer (XWP) was added to the column, followed by centrifugation at 4200xg for 5 min. Next, 400 µl of elution buffer (XE) was added to the column, which had been transferred to a fresh collection tube. After 1 min of incubation, the sample was centrifuged at 500xg for 5 min. The eluate was then re-applied to the column, incubated for 1 min, and centrifuged again at 4200xg for 5 min. The eluate containing EVs in XE buffer was frozen at -80°C until further processing for western blot or RT-PCR For transmission electron microscopy analysis, different procedures were applied depending on the source of the EVs. The EM procedure was essential for extracting EVs from plasma and hiPSC-CM supernatants, as it effectively removed most contaminating proteins that caused significant background signal in TEM observations. Subsequent ultracentrifugation was performed to eliminate the XE buffer, which also contributed to background noise. Specifically, for isolating EVs from plasma and hiPSC-CM supernatants, the eluate obtained through EM was diluted in PBS and ultracentrifuged at 100,000 × g for 2 hours at 4°C to pellet the EVs. In contrast, ultracentrifugation alone was used for isolating EVs from H9c2 and dH9c2 cell supernatants. The EV pellet was then fixed in 2% paraformaldehyde (PFA) and processed for immunocytochemistry and negative staining at transmission electron microscope (TEM). All the reactions were performed at room temperature (RT) unless otherwise specified.
EVs from the dH9c2 injury model were also analyzed for size and concentration using the NanoSight LM10 particle tracking analysis (NTA) device (NanoSight Ltd, Amesbury, Wiltshire, UK) in accordance with previous procedures [38]. Briefly, a 50 µl aliquot of eluate containing EVs derived from the supernatant of 75 culture flasks of control (C 1000) and H₂O₂-treated (T 1000) cells was diluted 1:1000 in PBS. Each sample was then subjected to three 60-second counts. The averages (of three counts) of the EVs as well as the particles with sizes in the range of 39.5 nm to 159.5 nm (the typical range for exosomes) were calculated, and control versus treated samples were compared.
4.5. EV Immunogold and Negative Staining for Transmission Electron Microscope (TEM)
EVs from human plasma and cell lines were processed following a modified protocol based on Soares et al. [9]. Briefly, 10 μl of EV-containing sample, previously fixed in 2% paraformaldehyde in 0.1 M PBS, was applied to 200-mesh formvar/carbon-coated nickel grids and incubated overnight at 4 °C in a humidified chamber. After washing with PBS, the grids were left to settle for 3 minutes at RT. To quench free aldehyde groups, the grids were incubated with 50 μL of glycine for 10 minutes, followed by blocking with PBS containing 0.1% BSA for 30 minutes. Primary antibody incubation was performed using rabbit anti-Cx26 (1:50 in PBS/0.1% BSA) alone or together with mouse anti-cTNT (Santa Cruz Biotechnology, sc-20025, 1:50) for double immunogold labeling, overnight at 4 °C in a humidified environment. After PBS washes, grids were incubated with 10 nm gold-conjugated anti-rabbit secondary antibody (Cytodiagnostics, Burlington, ON, Canada, AC-10-17-05) and/or 20 nm gold-conjugated anti-mouse secondary antibody (Abcam, Cambridge, UK, ab27242), both diluted 1:20 in PBS/0.1% BSA, for 1 hour at room temperature. Following a final rinse in distilled water, grids underwent negative staining by applying 20 μL of 2% (w/v) uranyl acetate for 30 seconds.
The uranyl acetate solution was filtered through 0.45 μm polycarbonate filters before use. Excess stains were removed using filter paper, and grids were air-dried for 15 minutes before examination with a JEOL 100SX transmission electron microscope operating at 80 kV. Images were captured at magnifications ranging from 20,000× to 40,000× using an ATMxR80b Camera System. EV diameters were measured using ImageJ software (version 1.53v, NIH, USA).
For experiments involving EVs from the dH9c2 injury model, Cx26-immunogold positive EVs were semi-quantitatively evaluated. The number of gold particles per EV was quantified from electron micrographs taken at magnifications between 15,000x and 25,000x. The EV area was measured in nm² using ImageJ software. Additionally, 50 EVs immunolabeled for Cx26 were counted for each group.
4.6. EV Western Blot Analysis
Western blot analysis was performed on EVs derived from human plasma and from the dH9c2 injury model. Total proteins were isolated in an ice-cold lysis buffer (50 mM Tris, 2 mM EDTA, 100 mM NaCl 1% NP40) added of a protease inhibitor cocktail 1× (S8830, Sigma-Merck). Samples were homogenized with a probe-tip ultrasonicator (SONOPLUS mini20, Bandelin) (applying three 10 s pulses at 4,0 W) in an ice-bath. Lysates were centrifuged at 15000 rpm for 20 min at 4°C, and supernatants protein concentration was determined by the bicinchoninic acid assay (BCA) (Pierce™, Thermo Fisher Scientific) microplate method.
Due to their low concentration, proteins in EVs from human plasma and from dH9c2 supernatant were precipitated using Trichloroacetic Acid method (TCA). Briefly, samples were diluted in an equal volume of 20% TCA solution for 1 h in an ice-bath, vortexing 4 times during the incubation. Then samples were centrifuged at 15000 rpm at 4° C for 15 min and supernatant were discarded. Pellets were twice washed with acetone and centrifuged at 15000 rpm at 4° C for 15 min to remove TCA residues. After pellets suspension in Laemmli Buffer 4X containing beta-mercaptoethanol, equal volumes of samples were separated on a 4–20% polyacrylamide gel (BioRad, Hercules, CA, USA) and electroblotted onto nitrocellulose membrane by the Trans Turbo Blot system (BioRad). After blocking in EveryBlot buffer (BioRad) for 5 min, the membranes were incubated overnight at 4°C with the following primary antibodies singularly: rabbit polyclonal anti-Cx26 (Novus Biological, 1:500), mouse monoclonal anti-cTNT (Santa Cruz Biotech, 1:200), mouse monoclonal anti-CD63 (Abnova, Taipei City, Taiwan, MAB15170, 1:500), mouse monoclonal anti-flotillin 2 (Santa Cruz Biotech, SC-28320, 1:200), rabbit polyclonal anti GAPDH (Sigma-Merck, 1:10000). Anti-rabbit (BioRad, 170-6515) or anti-mouse (BioRad, 170-6516) HRP-conjugated antibodies (1:2000 in 5% dry fat milk in T-TBS, 1 h) were used as secondary antibodies. Immunoblots were visualized by means of a chemiluminescence reaction (Clarity Western ECL Substrate, BioRad) by ImageLabSoftware (BioRad) under a luminescent image analyzer (Chemidoc XSR+, Bio-Rad). Only bands below the saturation limit were analyzed. Semiquantitative evaluation of EV western blotting was performed by normalizing the protein band intensity to the relative lane total protein staining on blotted membrane obtained after TGX-stain free gel activation with Chemidoc XRS+, BioRad.
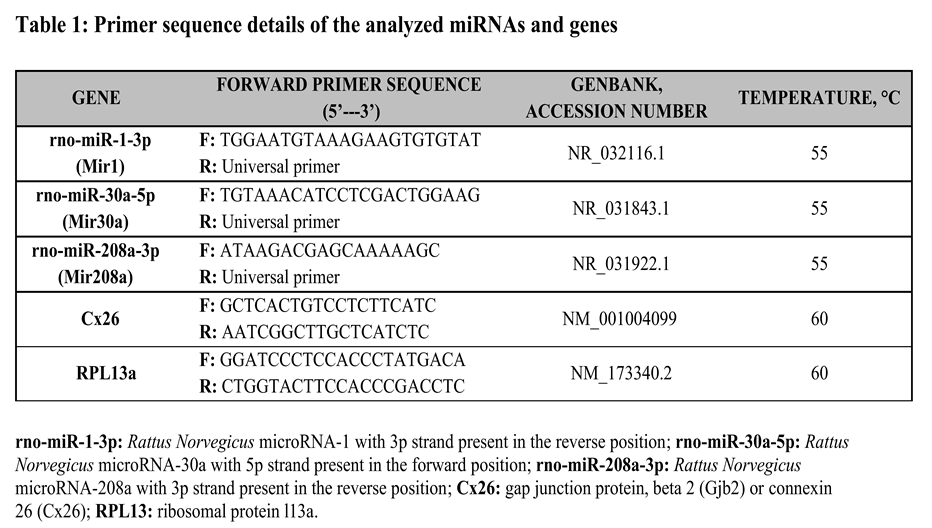
4.7. Extraction, Reverse Transcription and Real-Time PCR for EV miRNAs Expression
EVs derived from control and under oxidative stress dH9c2 cells were collected in XE buffer and treated for the quantification of their content in miR-1, miR-208a, miR-30a by means of Real-Time PCR as previously described [39]. Briefly, the extraction of miRNAs was conducted by using the miRNeasySerum/PlasmaKit (Qiagen srl, Milano,Italy) following manufacturer instructions; RNA integrity, purity, and concentration were assessed by measuring absorbance at 260, and 280 nm (NanoDrop Thermo Fisher Scientific) and applying the Beer–Lambert law (expected values between 1.8 and 2.1, for protein contamination). The EVs miRNA reverse transcription was carried out using the miScript II RT kit (Qiagen srl), starting from a 0.5/1μg/sample in 20 μL of final reaction volume (60 min at 37°C, 5min at 95°C, and 4°C for ∞). cDNA samples were diluted (1:5) and stored, as appropriate, at +4° C. Real-time PCR reactions were carried out in duplicate using a Bio-Rad C1000™ thermal cycler system (CFX-96 Real-Time detection system, Bio-Rad). To monitor cDNA amplification, a fluorogenic DNA binding dye, EvaGreen (SsoFAST EvaGreen Supermix, Bio-Rad Laboratories Inc., Hercules, CA, USA), was used. The miR-1, miR-208a, and miR-30a primer sequences were synthesized by Sigma -Merck (Milan, Italy). In particular, the GenBank accession number and the forward primer sequence (5-3) were reported in Table 1. To normalize miRNA data a common reference gene, snRNA U6 was used. All experiments were carried out according to the MIQE (Minimum Information for publication of Quantitative Real-Time PCR Experiments) guidelines [40].
4.8. Cx26 Knockdown in H9c2 Cells
Due to poor cell viability following Cx26 silencing in differentiated H9c2 (dH9c2) cells, we were unable to optimize the KD protocol in this cell type. Therefore, all silencing experiments were conducted in undifferentiated H9c2 cells, where the protocol was successfully optimized according to the manufacturer’s instructions and previous procedures [41,42]. In brief, H9c2 cells (2.5 × 10³ cells/well) were seeded in bovine gelatin precoated (Fluka-Merck, 1 % in dH2O) chamber slides with their culture medium and cultured at 37 °C in a humidified atmosphere containing 5% CO₂ until reaching approximately 30% confluency. After 24 hours, the culture medium was replaced with antibiotic-free medium supplemented with 10% exosome-depleted fetal bovine serum (FBS; A2720803, GIBCO, Thermo Fisher Scientific). Cells were then transfected with 50 nM Cx26-specific siRNA targeting Gjb2 (Gene ID: 394266, Rattus norvegicus; Ambion, Thermo Fisher Scientific) using Lipofectamine™ RNAiMAX Transfection Reagent (Thermo Fisher Scientific, 13778030) at a final concentration of 0.25% (0.6 µl in 240 µl of transfection medium), according to the manufacturer’s instructions. Control groups included cells transfected with siRNA targeting GAPDH (4390849, Thermo Fisher Scientific) and a scrambled siRNA negative control (Negative Control No. 1 siRNA, 4390843, Thermo Fisher Scientific). KD efficiency was assessed by quantifying Cx26 mRNA levels via RT-qPCR and evaluating Cx26 and GAPDH protein expression by IF.
H9c2 cells silenced for Cx26 were used for EV experiments. Specifically, 48 hours post-transfection, the culture medium was collected for EV isolation. EVs from both Cx26-KD and control H9c2 cells were analyzed for the presence of miRNAs and Cx26 protein.
4.9. Extraction, Reverse Transcription and Real-Time PCR in H9c2 Cells
Wild-type (WT) and Cx26-knockdown (KD) H9c2 cells were extracted using the RNeasy Plus Micro Kit (Qiagen srl), which is specifically designed to purify RNA from small cell quantities (<5*10^5), as detailed in our previous studies [43]. In brief, after re-suspensions, the cells were lysed in a highly denaturing guanidine-isothiocyanate–containing buffer, which immediately rapidly inactivates RNases to preserve RNA integrity ensure isolation of intact RNA. The lysates were then passed through a gDNA Eliminator spin column to remove genomic DNA. Ethanol was added to the flow-through to provide appropriate binding conditions for RNA, and then the samples were applied to a silica-based membrane (RNeasy MinElute spin column) and speeded on microcentrifuge at 12000 RPM for 30 seconds; specific buffers were used to bind the RNA to the silica membrane, and contaminants were thoroughly washed away. High-quality RNA was then eluted in RNAse-free water. The total RNA sample concentration, reverse transcription and Real-time PCR reactions were performed as reported in the previous paragraph. The primer sequences of CX26 and RPL13a (used as positive control) by Sigma-Merck (Milan, Italy) were reported in Table 1.
4.10. Statistical Analysis
For miRNA expression the Relative quantification was performed by the Ct method using Bio-Rad’s CFX96 manager software v.3.1 (CFX-96 Real-Time PCR detection systems, Bio-Rad Laboratories Inc., Hercules, CA, USA). Statistical analysis was performed using Statview 5.0.1 Software for Windows (SAS Institute, Inc., Cary, NC, USA). Skewed variables were log-transformed before statistical analysis. Differences between more than two independent groups were analyzed by Fisher’s test after ANOVA, and relations between variables were assessed by linear regression analysis. The results were expressed as mean ± S.E.M., and a p-value < 0.05 was considered significant.
For additional statistical analyses, GraphPad Prism 5 software was used. A Mann-Whitney U test was performed to compare data between groups (including Cx26 expression on EVs from human plasma samples and Cx26 or CD63 expression in dH9c2 control versus H2O2-treated cells). Results were expressed as mean ± S.E.M., and p-values < 0.05 were considered statistically significant.
Author Contributions
LM conceived and designed the study. AF, EP, AC, ARS, MC, SDR, VC, SM performed the experiments and analyzed the data. LM wrote the first draft of the manuscript. RM critically revised the manuscript. RM, VL, AF, FV supervised the manuscript. All authors had full access to all data used in this study. All authors approved the final version for submission.
Funding
This work is supported by the European Union—Next-Generation EU through the Italian Ministry of University and Research under PNRR—M4C2-I1.3 Project PE_00000019 “HEAL ITALIA”, CUP I53C22001440006, PNRR-MR1-2022-12376879 and PRIN-PNRR 2022S74XWB, Missione 4 Componente 2 CUP I53D23005240006 (to RM); 539901_2023_Ateneo (to LM); 549901_2023_Ateneo (to ARS); “PRIN-PNRR 2022 “EXTREMEHEART” Founded by European Union- Next Generation EU, Missione 4 Componente 1 - CUP J53D23003350006 (to VL)
Institutional Review Board Statement
All procedures involving human participants were approved by the Bioethics Committee of the University of Pisa (Rev 40/2023) on 14 September 2025 and were conducted in accordance with the ethical standards laid down in the 1964 Declaration of Helsinki and its later amendments.
Informed Consent Statement
Written informed consent has been obtained from all individual participants included in the study to publish this paper.
Data Availability Statement
The data presented in this study are available on request from the corresponding author due to ethical reasons.
Conflicts of Interest
The authors declare no conflicts of interest.
References
- Ribeiro-Rodrigues, T.M.; Martins-Marques, T.; Morel, S.; Kwak, B.R.; Girão, H. Role of connexin 43 in different forms of intercellular communication - gap junctions, extracellular vesicles and tunnelling nanotubes. J. Cell Sci. 2017, 130, 3619–3630. [Google Scholar] [CrossRef] [PubMed]
- Sluijter, J.P.G.; Davidson, S.M.; Boulanger, C.M.; Buzás, E.I.; de Kleijn, D.P.V.; Engel, F.B.; Giricz, Z.; Hausenloy, D.J.; Kishore, R.; Lecour, S.; et al. Extracellular vesicles in diagnostics and therapy of the ischaemic heart: Position Paper from the Working Group on Cellular Biology of the Heart of the European Society of Cardiology. Cardiovasc. Res. 2018, 114, 19–34. [Google Scholar] [CrossRef] [PubMed]
- Martins-Marques, T.; Girão, H. The good, the bad and the ugly: the impact of extracellular vesicles on the cardiovascular system. J. Physiol. 2023, 601, 4837–4852. [Google Scholar] [CrossRef] [PubMed]
- Lucaciu, S.A.; Leighton, S.E.; Hauser, A.; Yee, R.; Laird, D.W. Diversity in connexin biology. J. Biol. Chem. 2023, 299, 105263. [Google Scholar] [CrossRef] [PubMed]
- Madonna, R.; Moscato, S.; Cufaro, M.C.; Pieragostino, D.; Mattii, L.; Del Boccio, P.; Ghelardoni, S.; Zucchi, R.; De Caterina, R. Empagliflozin inhibits excessive autophagy through the AMPK/GSK3β signalling pathway in diabetic cardiomyopathy. Cardiovasc. Res. 2023, 119, 1175–1189. [Google Scholar] [CrossRef]
- Mattii, L.; Moscato, S.; Ippolito, C.; Polizzi, E.; Novo, G.; Zucchi, R.; De Caterina, R.; Ghelardoni, S.; Madonna, R. Empagliflozin mitigates ponatinib-induced cardiotoxicity by restoring the connexin 43-autophagy pathway. Biomed. Pharmacother. 2024, 178, 117278. [Google Scholar] [CrossRef]
- Madonna, R.; Pieragostino, D.; Cufaro, M.C.; Del Boccio, P.; Pucci, A.; Mattii, L.; Doria, V.; Cadeddu Dessalvi, C.; Zucchi, R.; Mercuro, G.; et al. Sex-related differential susceptibility to ponatinib cardiotoxicity and differential modulation of the Notch1 signalling pathway in a murine model. J. Cell. Mol. Med. 2022, 26, 1380–1391. [Google Scholar] [CrossRef]
- Madonna, R.; Moscato, S.; Polizzi, E.; Pieragostino, D.; Cufaro, M.C.; Del Boccio, P.; Bianchi, F.; De Caterina, R.; Mattii, L. Connexin 43 and Connexin 26 Involvement in the Ponatinib-Induced Cardiomyopathy: Sex-Related Differences in a Murine Model. Int. J. Mol. Sci. 2021, 22, 5815. [Google Scholar] [CrossRef]
- Soares, A.R.; Martins-Marques, T.; Ribeiro-Rodrigues, T.; Ferreira, J.V.; Catarino, S.; Pinho, M.J.; Zuzarte, M.; Isabel Anjo, S.; Manadas, B. P. G.; Sluijter, J.; Pereira, P.; Girao, H. Gap junctional protein Cx43 is involved in the communication between extracellular vesicles and mammalian cells. Sci Rep 2015, 5, 13243. [Google Scholar] [CrossRef]
- Martins-Marques, T.; Ribeiro-Rodrigues, T.; de Jager, S.C.; Zuzarte, M.; Ferreira, C.; Cruz, P.; Reis, L.; Baptista, R.; Gonçalves, L.; Sluijter, J.P.; et al. Myocardial infarction affects Cx43 content of extracellular vesicles secreted by cardiomyocytes. Life Sci. Alliance 2020, 3, e202000821. [Google Scholar] [CrossRef]
- Martins-Marques, T.; Costa, M.C.; Catarino, S.; Simoes, I.; Aasen, T.; Enguita, F.J.; Girao, H. Cx43-mediated sorting of miRNAs into extracellular vesicles. EMBO Rep. 2022, 23, e54312. [Google Scholar] [CrossRef] [PubMed]
- Moscato, S.; Cabiati, M.; Bianchi, F.; Vaglini, F.; Morales, M.A.; Burchielli, S.; Botta, L.; Sabbatini, A.R.M.; Falleni, A.; Del Ry, S.; et al. Connexin 26 Expression in Mammalian Cardiomyocytes. Sci. Rep. 2018, 8, 13975. [Google Scholar] [CrossRef]
- Falleni, A.; Moscato, S.; Sabbatini, A.R.M.; Bernardeschi, M.; Bianchi, F.; Cecchettini, A.; Mattii, L. Subcellular Localization of Connexin 26 in Cardiomyocytes and in Cardiomyocyte-Derived Extracellular Vesicles. Molecules 2021, 26, 6726. [Google Scholar] [CrossRef]
- Varela-Eirin, M.; Varela-Vazquez, A.; Rodríguez-Candela Mateos, M.; Vila-Sanjurjo, A.; Fonseca, E.; Mascareñas, J.L.; Eugenio Vázquez, M.; Mayan, M.D. Recruitment of RNA molecules by connexin RNA-binding motifs: Implication in RNA and DNA transport through microvesicles and exosomes. Biochim. Biophys. Acta Mol. Cell. Res. 2017, 1864, 728–736. [Google Scholar] [CrossRef]
- Sedgwick, A.E.; D’Souza-Schorey, C. The biology of extracellular microvesicles. Traffic 2018, 19, 319–327. [Google Scholar] [CrossRef]
- Wang, Z.Y.; Wang, R.X.; Ding, X.Q.; Zhang, X.; Pan, X.R.; Tong, J.H. A Protocol for Cancer-Related Mutation Detection on Exosomal DNA in Clinical Application. Front. Oncol. 2020, 10, 558106. [Google Scholar] [CrossRef]
- Chen, T.; Ding, G.; Jin, Z.; Wagner, M.B.; Yuan, Z. Insulin ameliorates miR-1-induced injury in H9c2 cells under oxidative stress via Akt activation. Mol. Cell. Biochem. 2012, 369, 167–174. [Google Scholar] [CrossRef]
- Wang, F.; Yuan, Y.; Yang, P.; Li, X. Extracellular vesicles-mediated transfer of miR-208a/b exaggerate hypoxia/reoxygenation injury in cardiomyocytes by reducing QKI expression. Mol. Cell. Biochem. 2017, 431, 187–195. [Google Scholar] [CrossRef] [PubMed]
- Yang, Y.; Li, Y.; Chen, X.; Cheng, X.; Liao, Y.; Yu, X. Exosomal transfer of miR-30a between cardiomyocytes regulates autophagy after hypoxia. J. Mol. Med. 2016, 94, 711–724. [Google Scholar] [CrossRef] [PubMed]
- Wang, L.; Yuan, Y.; Li, J.; Ren, H.; Cai, Q.; Chen, X.; Liang, H.; Shan, H.; Fu, Z.D.; Gao, X.; et al. MicroRNA-1 aggravates cardiac oxidative stress by post-transcriptional modification of the antioxidant network. Cell Stress Chaperones 2015, 20, 411–420. [Google Scholar] [CrossRef]
- Kura, B.; Szeiffova Bacova, B.; Kalocayova, B.; Sykora, M.; Slezak, J. Oxidative Stress-Responsive MicroRNAs in Heart Injury. Int. J. Mol. Sci. 2020, 21, 358. [Google Scholar] [CrossRef]
- Mattii, L.; Ippolito, C.; Segnani, C.; Battolla, B.; Colucci, R.; Dolfi, A.; Bassotti, G.; Blandizzi, C.; Bernardini, N. Altered expression pattern of molecular factors involved in colonic smooth muscle functions: an immunohistochemical study in patients with diverticular disease. PLoS One 2013, 8, e57023. [Google Scholar] [CrossRef]
- Defourny, J.; Thiry, M. Recent insights into gap junction biogenesis in the cochlea. Dev. Dyn. 2023, 252, 239–246. [CrossRef]
- Anselmo, A.; Frank, D.; Papa, L.; Viviani Anselmi, C.; Di Pasquale, E.; Mazzola, M.; Panico, C.; Clemente, F.; Soldani, C.; Pagiatakis, C.; et al. Myocardial hypoxic stress mediates functional cardiac extracellular vesicle release. Eur. Heart J. 2021, 42, 2780–2792. [Google Scholar] [CrossRef]
- Abou Zeid, F.; Charrier, H.; Beseme, O.; Michel, J.B.; Mulder, P.; Amouyel, P.; Pinet, F.; Turkieh, A. Lim Domain Binding 3 (Ldb3) Identified as a Potential Marker of Cardiac Extracellular Vesicles. Int. J. Mol. Sci. 2022, 23, 7374. [Google Scholar] [CrossRef]
- Hammarsten, O.; Wernbom, M.; Mills, N.L.; Mueller, C. How is cardiac troponin released from cardiomyocytes? Eur. Heart. J. Acute Cardiovasc. Care 2022, 11, 718–720. [Google Scholar] [CrossRef] [PubMed]
- Zhang, L.; Liu, X.; Wang, J.; Li, Z.; Wang, S.; Yang, W.; Hai, Y.; Liu, D. Kaempferol protects against doxorubicin-induced myocardial damage by inhibiting mitochondrial ROS-dependent ferroptosis. Redox Rep. 2025, 30, 2503130. [Google Scholar] [CrossRef]
- Chen, F.; Chen, R.; Yang, L.; Shen, B.; Wang, Y.; Gao, Y.; Tan, R.; Zhao, X. Magnesium-assisted hydrogen improves isoproterenol-induced heart failure. Med. Gas Res. 2025, 15, 459–470. [Google Scholar] [CrossRef] [PubMed]
- Qi, J.; Gao, X.; Han, Y.; Yang, M.; Wei, C.; Zhang, L.; Chu, J. Qing-Xin-Jie-Yu Granule attenuates myocardial infarction-induced inflammatory response by regulating the MK2/TTP pathway. Pharm. Biol. 2025, 63, 128–140. [Google Scholar] [CrossRef] [PubMed]
- Sanwlani, R.; Gangoda, L. Role of Extracellular Vesicles in Cell Death and Inflammation. Cells 2021, 10, 2663. [Google Scholar] [CrossRef]
- Bister, N.; Pistono, C.; Huremagic, B.; Jolkkonen, J; Giugno, R.; Malm, T. Hypoxia and extracellular vesicles: A review on methods, vesicular cargo and functions. J. Extracell. Vesicles 2020, 10, e12002. [CrossRef]
- Tian, Y.; Du, Y.Y.; Shang, H.; Wang, M.; Sun, Z.H.; Wang, B.Q.; Deng, D.; Wang, S.; Xu, X.D.; Sun, G.B.; et al. Calenduloside E Analogues Protecting H9c2 Cardiomyocytes Against H2O2-Induced Apoptosis: Design, Synthesis and Biological Evaluation. Front. Pharmacol. 2017, 8, 862. [Google Scholar] [CrossRef]
- Xue, W.; Liu, J.; Xu, X.; Chen, C.; Wei, B.; Zhao, Y. Cardioprotective effect of Cinnamamide derivative compound 10 against myocardial ischemia-reperfusion through regulating cardiac autophagy via Sirt1. Biomed. Pharmacothe.r 2024, 176, 116819. [Google Scholar] [CrossRef] [PubMed]
- Madonna, R.; Angelucci, S.; Di Giuseppe, F.; Doria, V.; Giricz, Z.; Görbe, A.; Ferdinandy, P.; De Caterina, R. Proteomic analysis of the secretome of adipose tissue-derived murine mesenchymal cells overexpressing telomerase and myocardin. J. Mol. Cell. Cardiol. 2019, 131, 171–186. [Google Scholar] [CrossRef]
- Madonna, R.; Guarnieri, S.; Kovácsházi, C.; Görbe, A.; Giricz, Z.; Geng, Y.J.; Mariggiò, M.A.; Ferdinandy, P.; De Caterina, R. Telomerase/myocardin expressing mesenchymal cells induce survival and cardiovascular markers in cardiac stromal cells undergoing ischaemia/reperfusion. J. Cell. Mol. Med. 2021, 25, 5381–5390. [Google Scholar] [CrossRef]
- Davidson, S.M.; Andreadou, I.; Antoniades, C.; Bartunek, J.; Basso, C.; Brundel, B.J.J.M.; Byrne, R.A.; Chiva-Blanch, G.; da Costa Martins, P.; Evans, P.C.; et al. Opportunities and challenges for the use of human samples in translational cardiovascular research: a scientific statement of the ESC Working Group on Cellular Biology of the Heart, the ESC Working Group on Cardiovascular Surgery, the ESC Council on Basic Cardiovascular Science, the ESC Scientists of Tomorrow, the European Association of Percutaneous Cardiovascular Interventions of the ESC, and the Heart Failure Association of the ESC. Cardiovasc. Res. 2025, 121, 702–729. [Google Scholar] [CrossRef]
- Madonna, R.; Pieragostino, D.; Rossi, C.; Guarnieri, S.; Nagy, C.T.; Giricz, Z.; Ferdinandy, P.; Del Boccio, P.; Mariggiò, M.A.; Geng, Y.J.; et al. Transplantation of telomerase/myocardin-co-expressing mesenchymal cells in the mouse promotes myocardial revascularization and tissue repair. Vascul. Pharmacol. 2020, 135, 106807. [Google Scholar] [CrossRef] [PubMed]
- Casieri, V.; Matteucci, M.; Pasanisi, E.M.; Papa, A.; Barile, L.; Fritsche-Danielson, R.; Lionetti, V. Ticagrelor Enhances Release of Anti-Hypoxic Cardiac Progenitor Cell-Derived Exosomes Through Increasing Cell Proliferation In Vitro. Sci. Rep. 2020, 10, 2494. [Google Scholar] [CrossRef] [PubMed]
- Cabiati, M.; Randazzo, E.; Guiducci, L.; Falleni, A.; Cecchettini, A.; Casieri, V.; Federico, G.; Del Ry, S. Evaluation of exosomal coding and non-coding RNA signature in obese adolescents. Int. J. Mol. Sci. 2022, 24, 139. [Google Scholar] [CrossRef]
- Bustin, S.A.; Benes, V.; Garson, J.A.; Hellemans, J.; Huggett, J.; Kubista, M.; Mueller, R.; Nolan, T.; Pfaffl, M.W.; Shipley, G.L.; et al. The MIQE guidelines: Minimum information for publication of quantitative real-time PCR experiments. Clin. Chem. 2009, 55, 611–622. [Google Scholar] [CrossRef]
- Madonna, R.; Geng, Y.J.; Shelat, H.; Ferdinandy, P.; De Caterina, R. High glucose-induced hyperosmolarity impacts proliferation, cytoskeleton remodeling and migration of human induced pluripotent stem cells via aquaporin-1. Biochim. Biophys. Acta 2014, 1842, 2266–2275. [Google Scholar] [CrossRef] [PubMed]
- Madonna, R.; Giovannelli, G.; Confalone, P.; Renna, F.V.; Geng, Y.J.; De Caterina, R. High glucose-induced hyperosmolarity contributes to COX-2 expression and angiogenesis: implications for diabetic retinopathy. Cardiovasc. Diabetol. 2016, 15, 18. [Google Scholar] [CrossRef] [PubMed]
- Cabiati, M.; Giacomarra, M.; Fontanini, M.; Cecchettini, A.; Pelosi, G.; Vozzi, F.; Del Ry, S. Bone morphogenetic protein-4 system expression in human coronary artery endothelial and smooth muscle cells under dynamic flow: effect of medicated bioresorbable vascular scaffolds at low and normal shear stress. Heart Vessels 2022, 37, 2137–2149. [Google Scholar] [CrossRef] [PubMed]
Figure 1.
Characterization of hiPSC-CMs and Cx26 expression in hiPSC-CM derived EVs. (A) hiPSC-CMs at light inverted microscopy. (B-C) Representative confocal images of cardiomyocytes derived from hiPSCs cultured in chamber slides and subjected to double immunofluorescences: (B) green immunopositive reaction for sarcomeric ⍺-actinin and red immunonegative reaction for Cx32, (C) green immunopositive reaction for Cx43 and red immunopositive reaction for Cx26; nucleus (DAPI, blue). Image in C was acquired in one Z-plane (8th of 30). (D) Representative TEM image of Cx26 immunogold analysis on EVs from hiPSC-CMs, performed with 10 nm gold particles conjugated anti-rabbit secondary antibody. Arrows point to Cx26 immunopositive EVs.
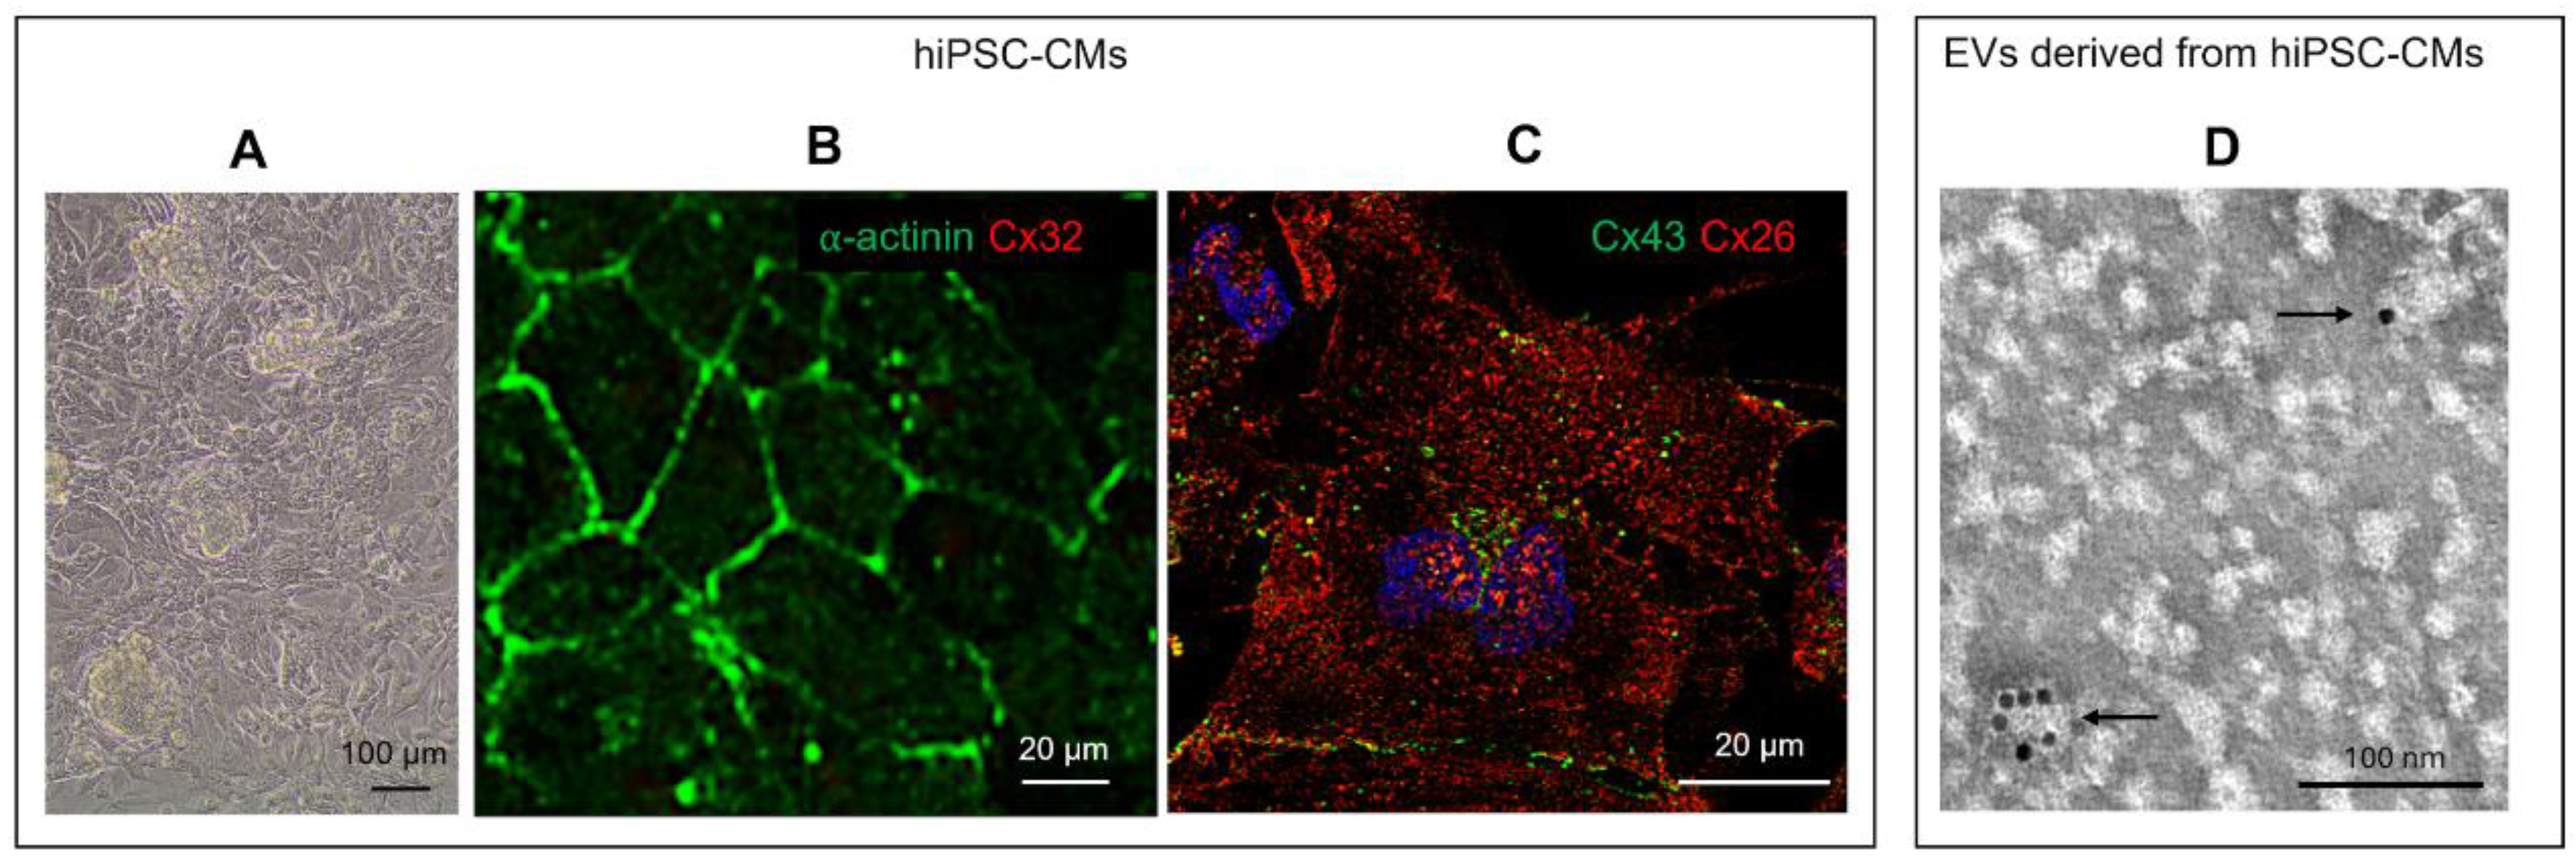
Figure 2.
Cx26 expression in human cardiac-derived plasma EVs. (A) Representative TEM images of Cx26 immunogold analysis on EVs from human plasma performed with 10 nm gold particles-conjugated anti-rabbit secondary antibody. The EVs of samples #1, #2, and #3 were extracted from the frozen plasma of donors 1, 2, and 3, while the EVs from sample #1bis were extracted from the unfrozen plasma of donor 1. (B) Representative western blotting of EVs derived from human plasma of donors 1, 2, 3 and 4; n=2. Flotillin 2 was used as a marker of EVs while cTNT (cardiac T troponin) as a marker of cardiomyocytes. Note that the anti-cTNT antibody reacted with the predicted band at approximately 39 kDa in the cardiac tissue lysate, while it displayed reactivity with higher molecular weight bands in plasma-derived EVs. These bands were not due to secondary antibody nonspecificity, as demonstrated by immunonegative blotting of negative controls with anti-rabbit (left) or anti-mouse (right) secondary antibodies. (C) Graph showing semi-quantitative analysis of Cx26 presence in EVs from #2 and #3 plasma samples; n=2; *p<0,05. (D) Representative TEM images of Cx26-cTNT double immunogold analysis on EVs from #1 plasma sample performed with 10 nm gold particles-conjugated anti-rabbit secondary antibody and 20 nm gold particles-conjugated anti-mouse secondary antibody. Arrows point to EVs that were immunoreactive for both Cx26 and cTNT. The black arrowhead points to positive EVs only for Cx26 while the red ones point to positive EVs only for cTNT.
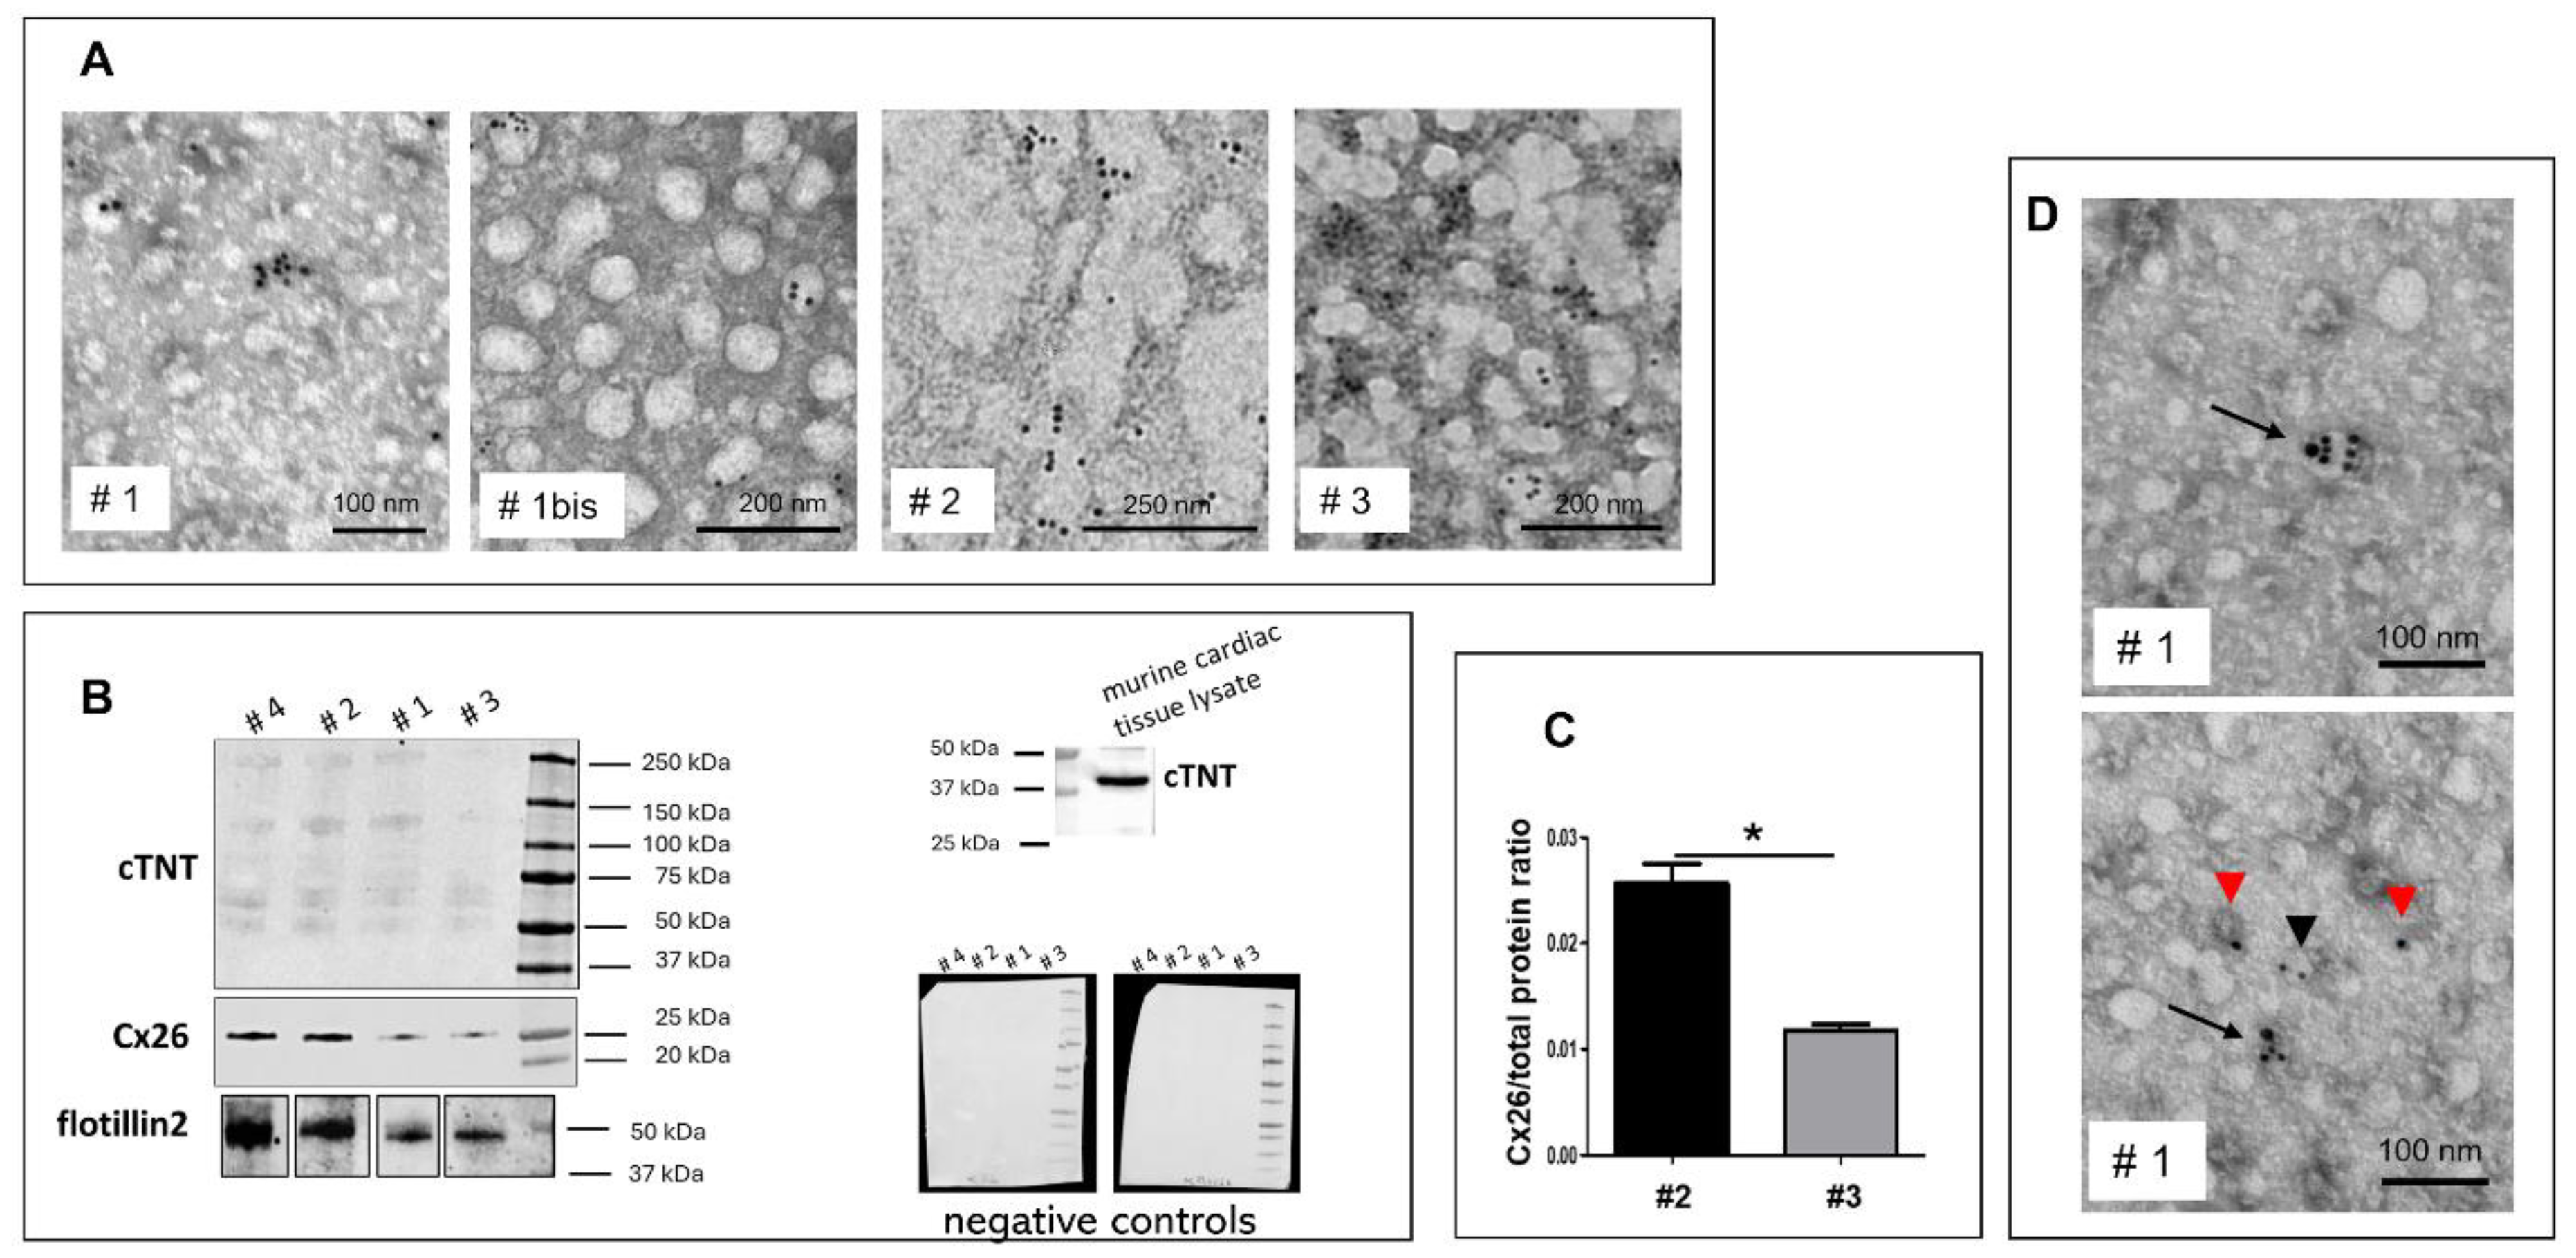
Figure 3.
Characterization and sizing of EVs derived from dH9c2 cardiomyocytes. (A) a screen shot of video from NanoSight LM10 showing EVs. (B-C) Concentration of EVs derived from control or H2O2 treated cells: total EVs (B) or exosomes (C). (D-E) Characterization for the size and the number of EVs derived from control (D) and H2O2-treated (E) cells. (F) Representative TEM images of EVs from treated cells. Arrows point to aggregates of four or more EVs.
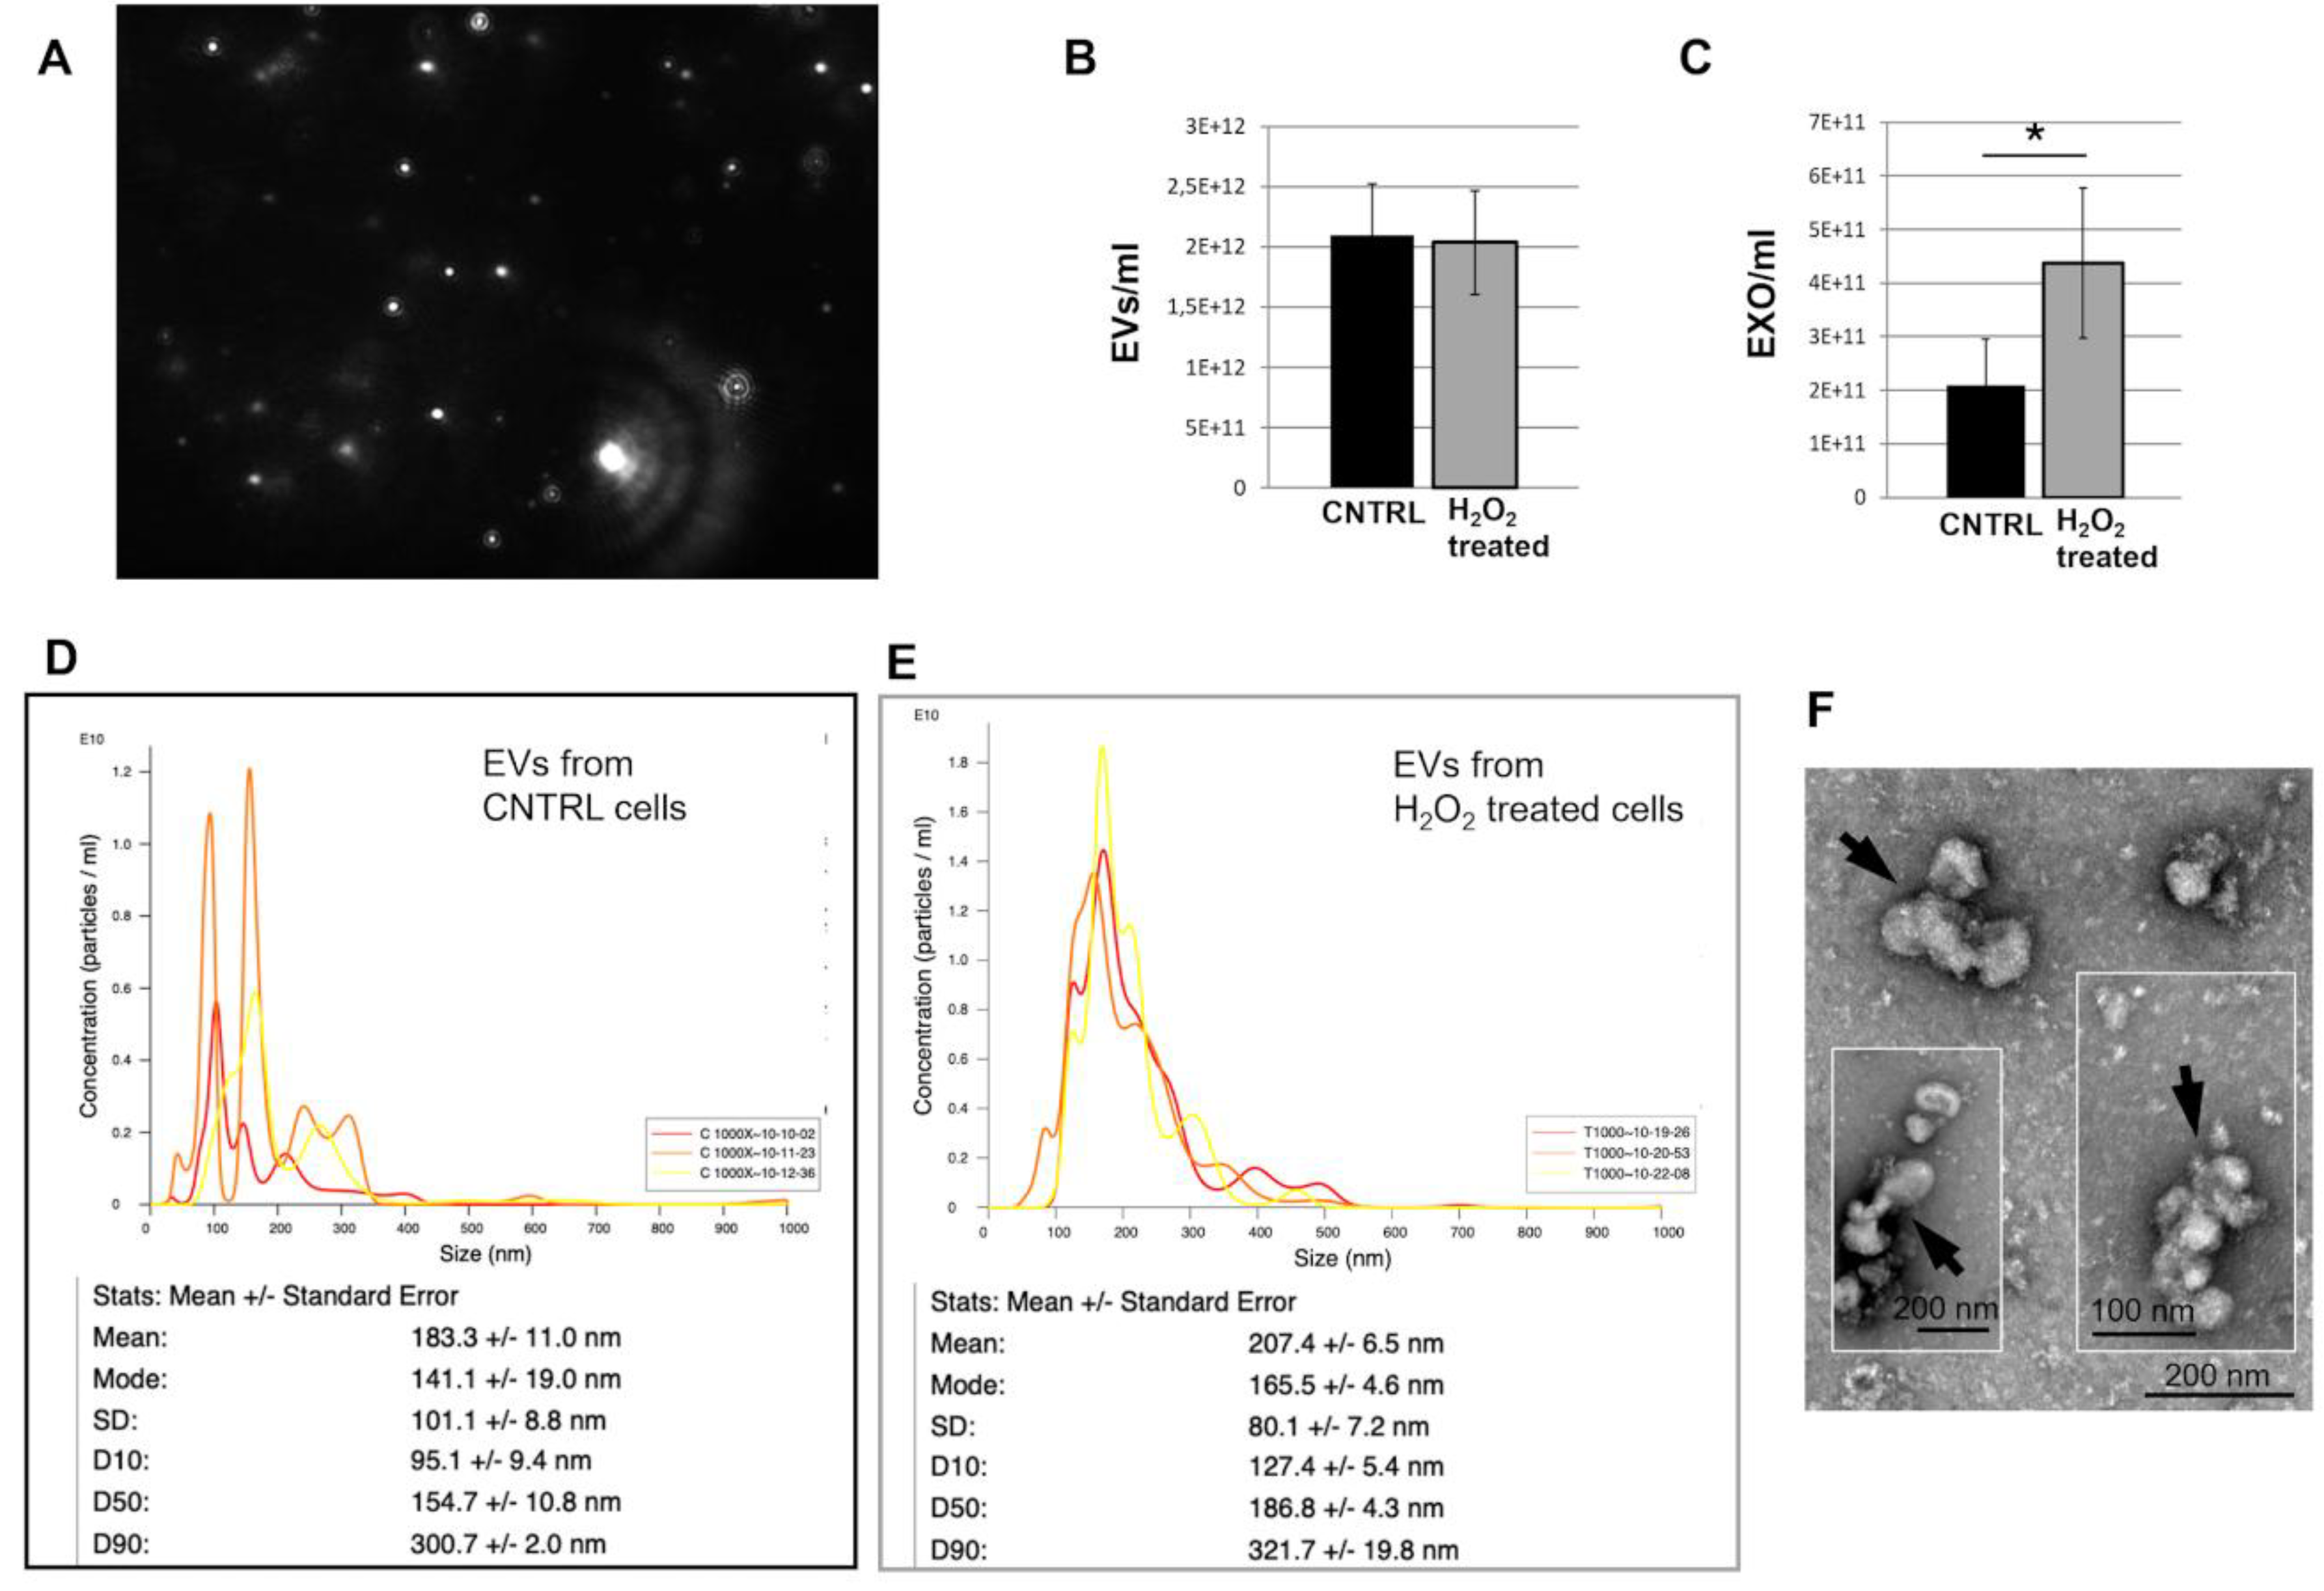
Figure 4.
Cx26 expression in EVs derived from dH9c2 cardiomyocytes under normal and oxidative stress conditions. (A) Western blotting for Cx26 and CD63 of EVs from not treated (CNTRL) or H2O2-treated (T) under OS cells. The upper panel shows a representative immunoblotting of EV lysates, while the lower panel shows the semi-quantitative analysis from six independent blotting experiments. *p<0.05 vs control. (B) TEM-Immunogold analysis of EVs from CNTRL and T cells. The upper panel shows representative images of EVs immunopositive for Cx26, where the aggregation state of the EVs, which frequently occurs, is particularly evident in the images of the control group. The lower panel presents the relative semi-quantitative analysis expressed as the number of colloidal gold particles for EV or for EV area. ****p < 0.0001 vs control.
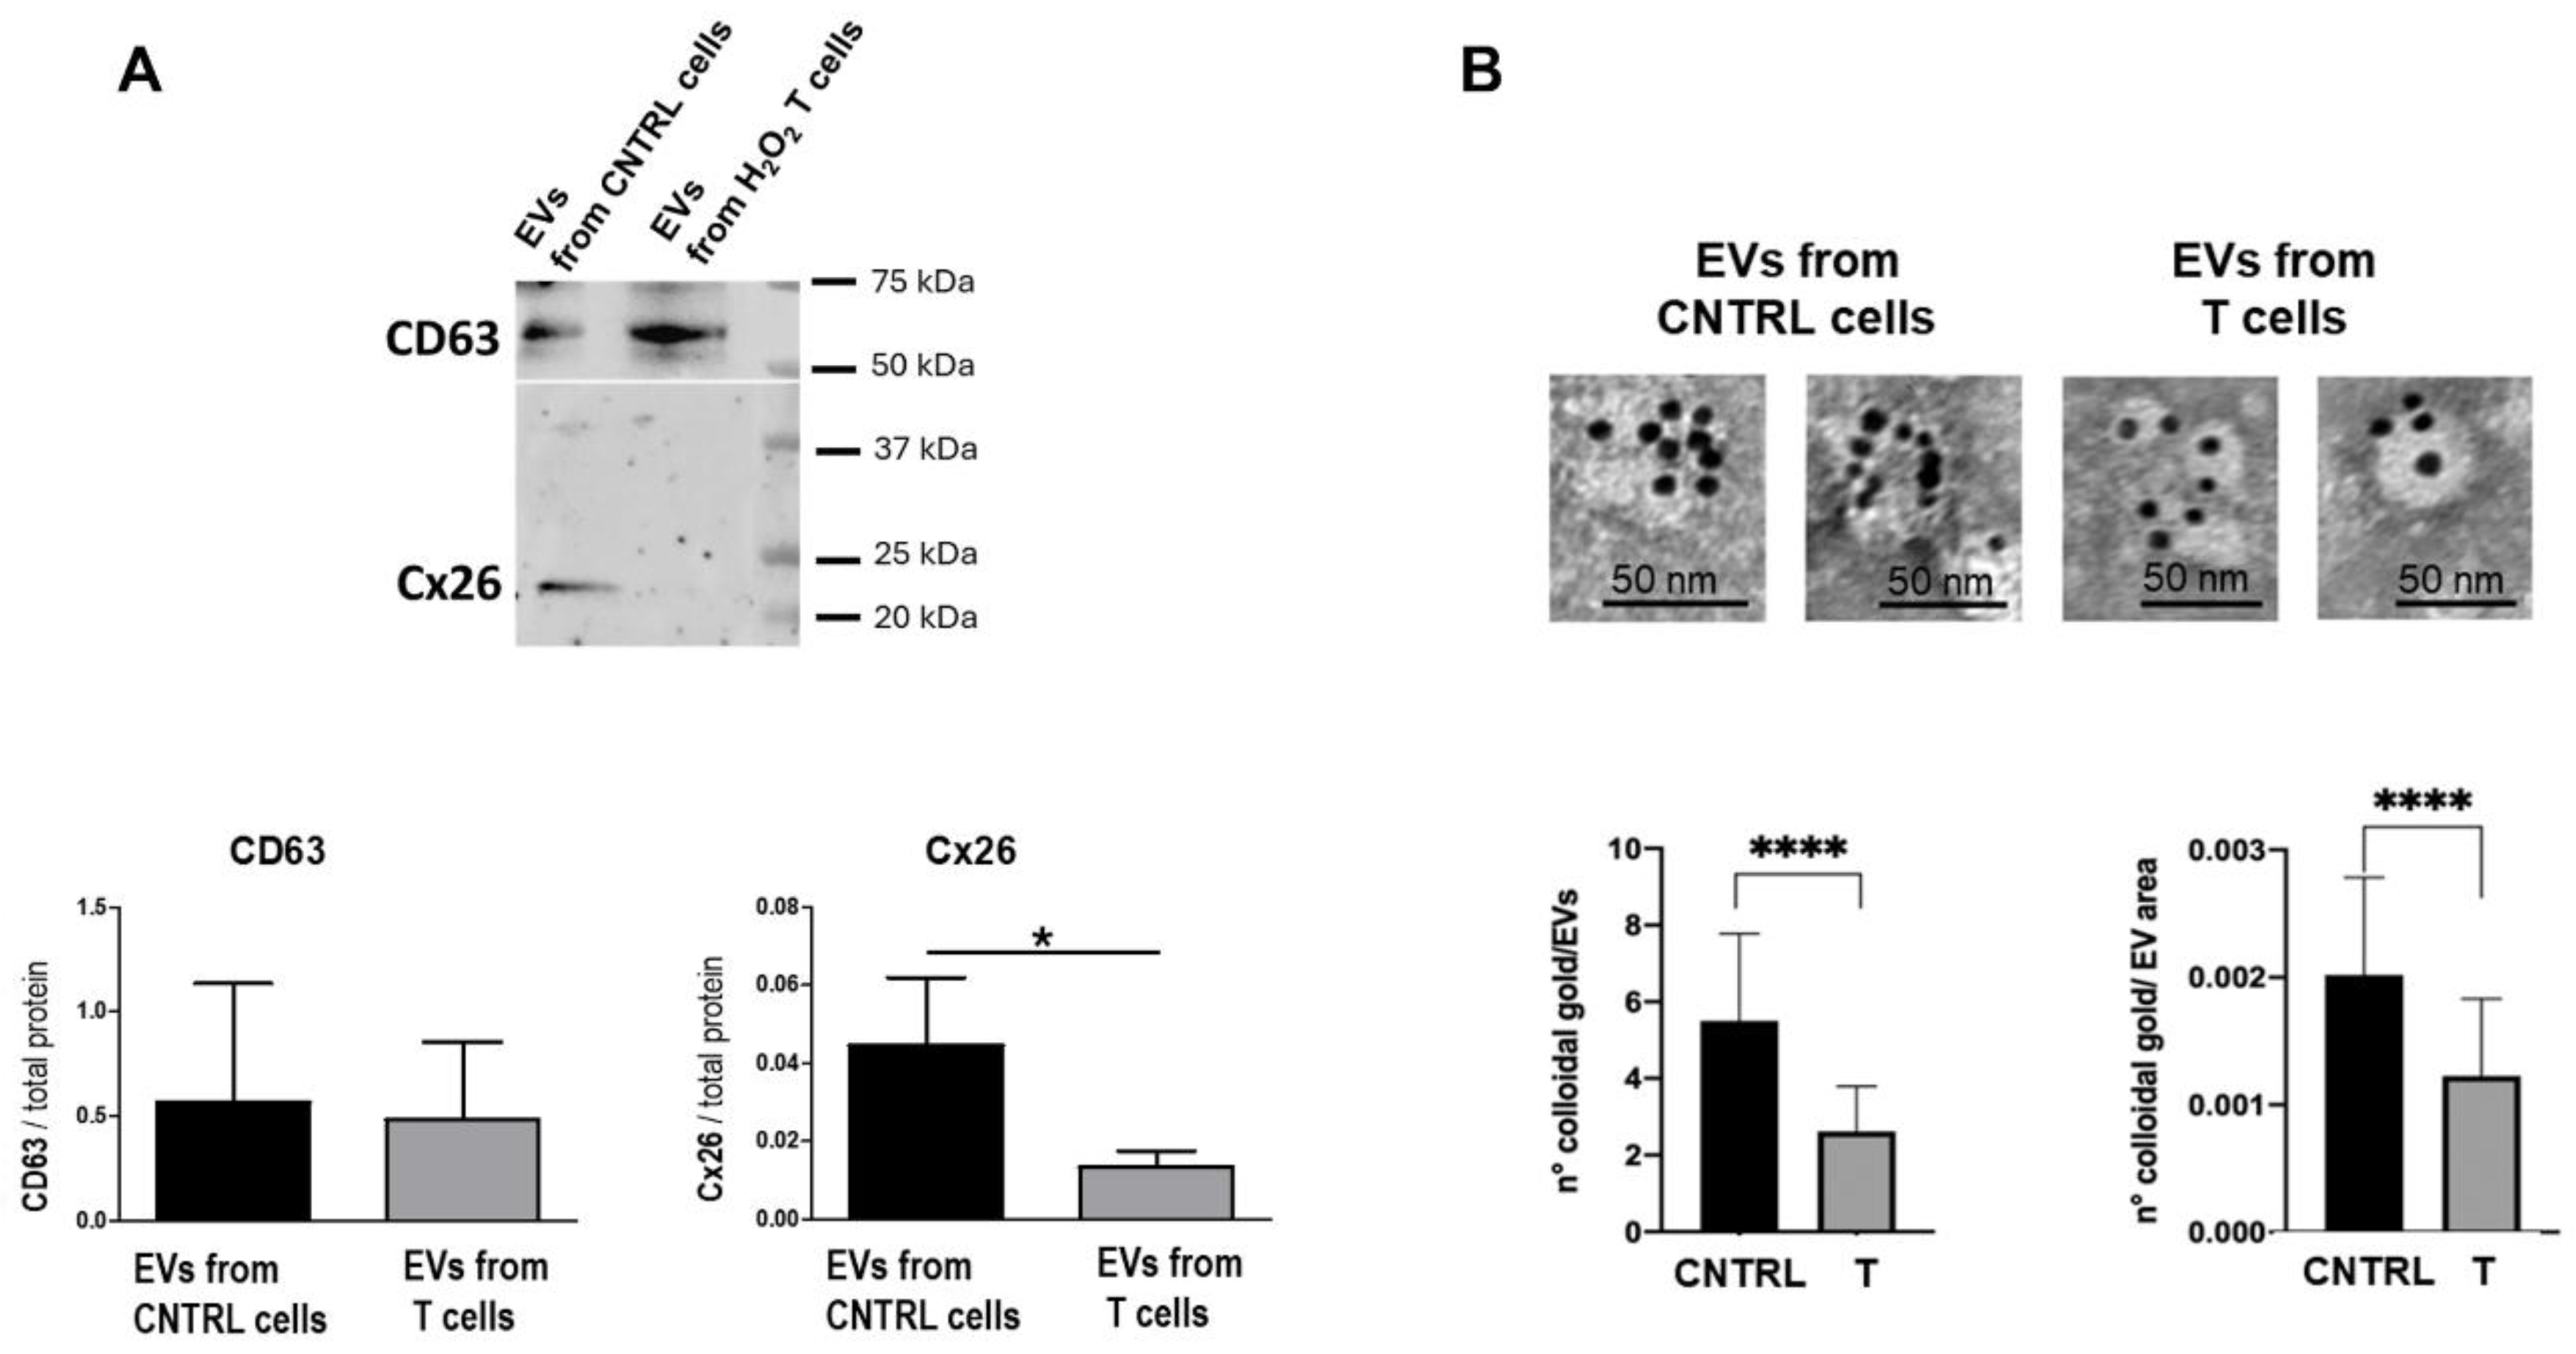
Figure 5.
Scrambled siRNA and Cx26-silenced H9c2 cells release EVs with different miRNAs cargo. (A) Representative images showing Cx26 and GAPDH red immunopositive staining in scrambled siRNA-silenced cells (WT, top), and immunonegative staining in cells treated with related siRNA (KD, bottom). (B) RT-PCR analysis. Real-time PCR results for Cx26 mRNA (threshold cycles, Ct values, and corresponding melting peaks [upper panels]) and RPL13a mRNA (threshold cycles, Ct values, and corresponding melting peaks [lower panels]) in WT and Cx26-KD cells. (C) Relative expression levels of miR-1, miR-30a, and miR-280a carried by EVs released by WT cells (n=3, black bar) or Cx26-KD cells (n=8, white bar). (D) Representative micrographs of immunogold for Cx26 in EVs from WT and Cx26-KD cells. Red arrows point to gold particles on single or grouped EVs from WT cells. Arrowhead points to unspecific gold particles non-bound to EVs from Cx26-KD cells.
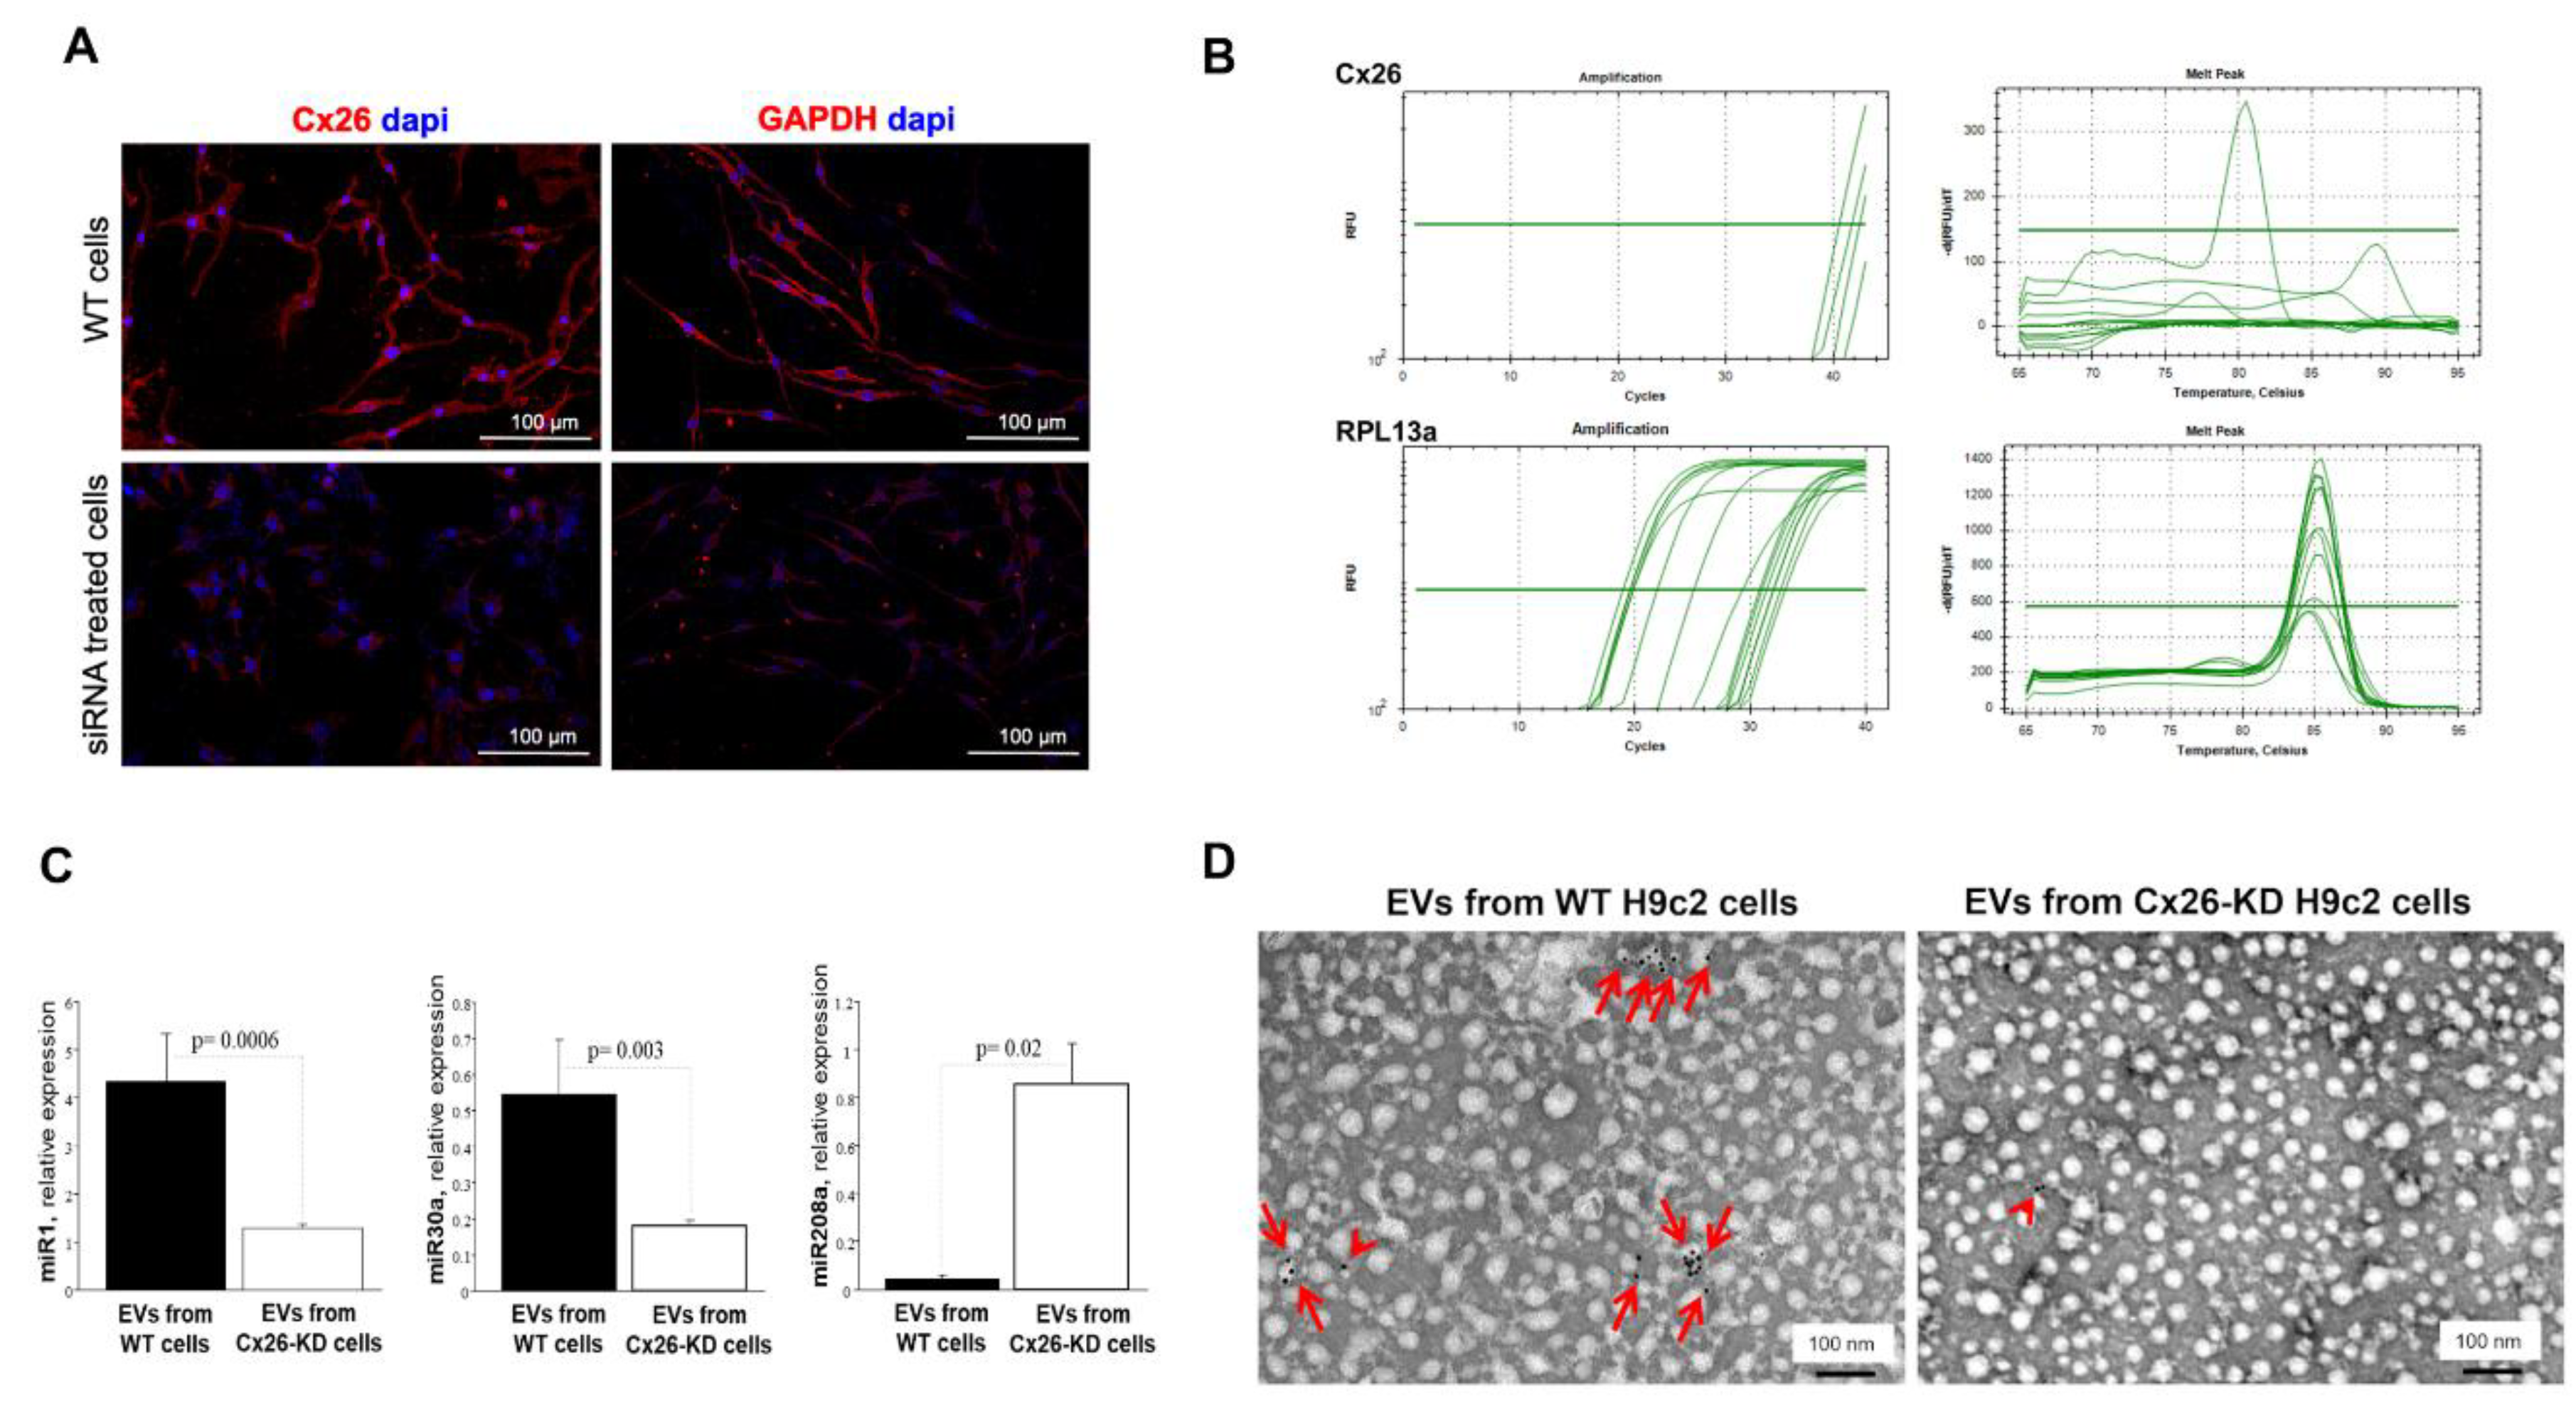
Figure 6.
Characterization of dH9c2 cardiomyocytes under normal and oxidative stress conditions. Representative images of double immunofluorescence for cardiac muscle isoform of MYL2 (A, green), sarcomeric α-actinin (B, green) and Cx43 (A-B, red). (C-F) Cell injury evaluation induced by H2O2 treatment. Representative images of immunofluorescence for 4HNE in control (C, red) and H2O2 treated cells (E, red), and CASP-3 in control (D, green) and H2O2 treated cells (F, green).
Disclaimer/Publisher’s Note: The statements, opinions and data contained in all publications are solely those of the individual author(s) and contributor(s) and not of MDPI and/or the editor(s). MDPI and/or the editor(s) disclaim responsibility for any injury to people or property resulting from any ideas, methods, instructions or products referred to in the content. |
© 2025 by the authors. Licensee MDPI, Basel, Switzerland. This article is an open access article distributed under the terms and conditions of the Creative Commons Attribution (CC BY) license (http://creativecommons.org/licenses/by/4.0/).
Copyright: This open access article is published under a Creative Commons CC BY 4.0 license, which permit the free download, distribution, and reuse, provided that the author and preprint are cited in any reuse.


