
Submitted:
04 November 2024
Posted:
05 November 2024
You are already at the latest version
Abstract
This study introduces a new approach to monitoring avian diversity and vocal behavior, as well as assessing their responses to environmental factors using IoT-based sensors. We utilized BirdNet, a deep learning model for identifying bird species by their vocalizations, to data from our MINTS-AI environmental sensors deployed across Dallas, Texas. The study investigates how ambient temperature, humidity, light intensity, and particulate matter concentrations affect bird behavior. The results show a positive correlation between bird diversity and temperature during winter, with a Pearson coefficients of 0.65 (2023) and 0.80 (2024), and R2 values of 0.43 and 0.64, respectively. In contrast, during summer, a negative correlation was found with Pearson coefficients of -0.63 (2023) and -0.34 (2024), with corresponding R2 values of 0.40 and 0.11. Machine learning models further highlighted species such as the Northern Mockingbird and Mississippi Kite as particularly sensitive to temperature changes. Humidity analysis revealed significant correlations of vocal activity for species like the Canada Goose and House Finch, indicating that vocal activity may depend on moisture levels. Light intensity also showed strong influences on species such as the Northern Mockingbird and Scissor-tailed Flycatcher, linking variations in light to vocal behavior. However, no significant relationship was found between particulate matter (PM2.5) concentrations and bird behavior. This methodology offers a new way to explore the effects of climate change on bird behavior over time, given adequate long-term data. These findings emphasize the important role of environmental changes in shaping bird populations and their ecological interactions.
Keywords:
IoT sensors
; climate change
; machine learning
; ambient environment
; avian behavior
1. Introduction
Earth has gone through many climate patterns throughout history, but the rapid climate change caused by human activities in the Anthropocene is unparalleled [1]. Climate change has numerous negative impacts on the environment, including rising temperatures, rising sea levels, altered precipitation, and an increase in the frequency of extreme weather events. These environmental transformations directly impact living species and lead to changes in the ecosystem [2]. Birds, as a crucial component of biodiversity, serve as excellent indicators of ecological change. Their behaviors, distribution, migration patterns, and populations reflect changes in climate and the overall ecosystem, making them valuable predictors.
Numerous studies investigated the impacts of climate change on bird behavior. For example, analysis of data covering a 90-year timeframe from the Christmas Bird Count [3] demonstrates that specific bird species, such as woodpeckers and hawks, exhibit a higher likelihood of being sighted in northern regions compared to several decades ago [4]. Another research investigation used data from the breeding bird survey [5] to quantify the results in terms of latitude variations over time. The findings revealed an increase in the mean distribution latitude for certain Neotropical migrants, Temperate migrants, and Permanent residents [6]. Climate change is also causing changes in bird migration behaviors. A study published in Nature Climate Change suggests that rising temperatures are causing birds to start their migrations earlier each spring [7]. Although there is a large body of evidence that indicates changes in bird behavior patterns due to climate change over the past few decades [4,6,7,8,9,10,11,12]. Far fewer studies focus on how the ambient environment and air quality affect different species of birds.
Objectives
Most studies assessing the impacts of climate change on avian behavior predominantly utilize data from the North American Breeding Bird Survey (BBS) [5] or the Christmas Bird Count (CBC) [3]. While these data sources are invaluable for evaluating long-term trends, they are constrained by their annual frequency of data collection. This limitation renders them insufficient for analyzing shifts in bird behavior resulting from the rapid changes associated with climate change. In response to these limitations, the present study proposes a novel methodology to enhance the monitoring of avian diversity, vocal activity, and population dynamics. By employing low-cost Internet of Things (IoT) based sensors in areas of interest, we can facilitate continuous data collection on avian species alongside relevant environmental variables. This approach significantly increases the volume and resolution of data available for analysis, thereby enabling a more nuanced understanding of the correlations between global environmental changes and avian behavior. Such advancements represent a substantial contribution to the field of ecological science.
Additionally, through this work, we investigate how the surrounding environment impacts avian species by examining the relationship of ambient environmental conditions, including temperature, humidity, intensities of different wavelengths of light, and air quality with bird species richness and their vocal activity. Furthermore, this research presents a case study analyzing the number of bird calls before, during, and after a total solar eclipse that occurred on April 8, 2024, providing insights into how drastic changes in light conditions affect avian behavior. These analyses utilize data from IoT-based sensors built by Multiscale Multiuse Multimodal Integrated Interactive Intelligent Sensing for Actionable Insights (MINTS-AI) [13,14,15,16,17,18,19,20] deployed across Dallas, Texas.
2. Materials and Methods
2.1. MINTS-AI Sensors
The Multiscale Multiuse Multimodal Integrated Interactive Intelligent Sensing for Actionable Insights (MINTS-AI) platform represents a collaborative open-data initiative led by the UT Dallas Physics Department. The main objective of the MINTS-AI platform is to provide a comprehensive understanding of various situations by enabling data accessibility for individuals, environmental experts, and decision-makers. These data have the potential to inform both public policies and individual actions. The influence of the platform goes beyond the scientific community, as it enables evidence-based decision-making that can greatly affect the overall well-being of society [13]. MINTS-AI employs machine learning techniques to cross-calibrate sensors, resulting in the strategic deployment of nearly one hundred low-cost environmental sensors. The real-time data collected from these sensors is readily accessible via online dashboards [21]. MINTS-AI collects data from sensors across eight distinct categories, the data used in this study is sourced from the 24/7 Streaming Distributed Sentinels.
Central Nodes are one of the primary components of the MINTS advanced stationary sensing system, pivotal in facilitating the collection of environmental data through IoT sensors. These sensor modules are equipped with various environmental sensors capable of measuring a range of variables, including different size fractions of Particulate Matter (PM), ambient light intensity, ambient climate conditions, and more. To monitor air quality, the IPS1700 sensor is employed. The IPS1700 has the capability to measure airborne particulate matter ranging from to ultrafine , as well as particle count of various size fractions using laser scattering [22]. The light sensors are designed to detect light intensity within specific wavelengths, ranging from 300 to 1,100 nanometers. To measure temperature, pressure, and humidity, the BME280 sensor is employed, thereby facilitating climate analysis. Moreover, the system integrates low-cost gas sensors such as the SCD30 to assess levels and the MICS6814 to measure concentrations of CO, , , , , , , and C2H6OH. The central node is also equipped with an ozone monitoring module that utilizes Optical Absorption Spectroscopy to accurately measure ozone levels. There is a total of six Central Nodes deployed across Dallas, Texas. The comprehensive description of the various components of the Central Nodes and the methodologies employed for collecting and storing data is detailed in [23].
Another sensor module utilized in this study is the Powered LoRa (PoLo) Nodes. Unlike the Central Nodes, which require both a power grid and internet access for it to be operational, the PoLo Nodes require only a power grid. They are designed in such a way that it can communicate data with a Central Node or a Gateway via Message Queuing Telemetry Transport (MQTT). Both the Central Node and the PoLo Node are equipped with microphones capable of recording and storing avian sounds from the surrounding environment. These audio files are subsequently analyzed using the BirdNET bird classification machine-learning model developed by the Cornell Lab of Ornithology [24].
2.2. Integrating IoT Sensors with BirdNET for Avian Species Monitoring
BirdNET is a machine learning-based tool and mobile application specifically designed for the identification of bird sounds. Developed collaboratively by the Cornell Lab of Ornithology and the Chemnitz University of Technology, BirdNET employs deep neural networks (DNNs) to analyze audio recordings of bird sounds [24]. This sophisticated analysis facilitates the identification of bird species present in the recordings, thereby can contribute to our understanding of avian biodiversity and ecology.
To assess the influence of ambient environmental conditions on avian diversity and to investigate the effects of climate change on bird populations, distribution, and migration over time, we implemented the BirdNet [24] for Central Nodes and PoLo Nodes. These sensors Nodes includes a microphones, which are capable of recording and storing audio files of surrounding bird vocalizations. The recording process occurs in nine-second intervals, facilitating the capture of a broad range of bird calls within the designated areas of interest.
Once recorded, these audio files are stored on the primary computer associated with each sensor node (Central Node, Polo Node). To identify the bird species based on the vocalizations in the audio clips, we utilize BirdNET. This model is specifically designed to process audio clips of three seconds in duration. Consequently, we segment the recorded nine-second audio files into three-second clips to meet the input requirements of BirdNET.
Each three-second audio segment is subjected to analysis by BirdNET. If a bird’s song or call is detected within the clip, the system classifies the bird, providing both the species name and a confidence level associated with the identification. In addition to the species classification, we also record the date and time of each bird vocalization detection to furhter facilitate the analysis of different environmental conditions on birds vocal behavior. This data is then transmitted via the Message Queuing Telemetry Transport (MQTT) protocol to the University of Texas at Dallas (UT Dallas) server for further processing and analysis.
In instances where no bird sounds are detected in a given audio clip, the recorded file is promptly deleted without transmitting any data to the UT Dallas server. The classification process occurs locally on the main computer within the Central Node an PoLo Node to mitigate the challenges associated with transmitting large audio files via the MQTT protocol. As a result, only relevant classification data, along with the associated timestamps, are transmitted to the server.
The entire analytical process is illustrated in Figure 1, which delineates the workflow from audio recording to data transmission. This methodological approach not only enhances our understanding of avian diversity in relation to environmental variables but also facilitates long-term monitoring of climate change impacts on bird populations and their migratory patterns.
2.3. Environmental Variables
This study investigates the correlation between ambient environmental variables and bird vocal behavior, as well as bird diversity. The environmental variables examined include temperature, humidity, light intensity across different wavelengths, and particulate matter concentration.
3. Results
3.1. Ambient Temperature-Driven Behavioral Changes in Birds
This section examines how variations in ambient temperature influence avian behavior, specifically focusing on avian diversity, vocal activity, distribution of bird calls with temperature, and the timing of dawn choruses.
3.1.1. Avian Diversity
The bird and ambient temperature data for one of the Central Nodes at Paul Quinn College in Dallas, Texas (latitude 32.6798975, longitude -96.74573), are used for this analysis. This sensor has been chosen because the bird data spans over more than two years. To examine the correlation between avian diversity (species richness) and temperature, the two-year dataset has been divided into two separate datasets for winter and summer seasons, as birds respond differently to temperature in these two seasons. The winter dataset ranges from December 2022 to April 2023 and from December 2023 to April 2024, allowing for the analysis of two winter seasons. Similarly, the summer dataset ranges from May 2023 to August 2023 and from May 2024 to August 2024, allowing for the analysis of two summer seasons. To comprehensively examine the relationship between bird diversity and temperature, the analysis is performed using daily averages, exploring the correlation between the average daily temperature and the total number of different bird species.
Figure 2a shows the plot of the number of different bird species versus average daily temperature for the winter season. We observe a positive correlation between the two, with a Pearson Correlation Coefficient of 0.65 for winter 2022 December to April 2023 (indicated by red color in the figure) and 0.798 for winter 2023 December to April 2024 (indicated by blue color in the graph), both with p-values less than 0.001, indicating statistically significant correlations. The value for winter 2022-2023 is 0.43, while the value for winter 2023-2024 is 0.64. The shade denoted by the light blue shading and the light red shading corresponds to the 95% confidence interval. This suggests that in the winter season, as temperatures rise, birds tend to be more vocally active and explore wider ranges, which is reflected in greater species richness at the Central Node location.
Figure 2b shows the scatter plot for the summer seasons. The red line represents the summer of 2023 (May to August), and the blue line represents the summer of 2024 (May to August). Interestingly, we observe a negative correlation between temperature and avian diversity during the summer season. The Pearson correlation coefficient for the summer of 2023 is -0.630, with a p-value less than 0.001, while the Pearson correlation coefficient for the summer of 2024 is -0.336, with a p-value of 0.002. The regression line for the summer of 2023 has an value of 0.40, and the summer of 2024 has an value of 0.11. For both seasons, the Pearson correlation coefficient and p-values indicate a statistically significant relationship.
Based on these results, we can conclude that during the summer months, higher temperatures correlate with reduced avian vocal activity and restricted flight ranges in hot weather. Overall, these findings highlight the importance of temperature as a key factor influencing avian diversity, suggesting that climate variations could have significant implications for bird populations and their ecological dynamics in the region. These results are summarized in Table 1
3.1.2. Vocal Activity
A parallel analysis was conducted to examine overall vocal activity, specifically the total number of bird calls across all species, in relation to daily average temperatures. Consistent with the analysis of avian diversity, the data pertaining to vocal activity were also divided into two distinct datasets corresponding to the winter and summer seasons.
The Figure 3a illustrates a scatter plot depicting the relationship between the number of bird calls and average daily temperature for the two winter seasons. The blue line represents the winter season from December 2022 to April 2023, yielding a Pearson correlation coefficient of 0.550, with a p-value of less than 0.001 and an value of 0.30. The red line corresponds to the winter season from December 2023 to April 2024, demonstrating a Pearson correlation coefficient of 0.700, with a p-value of less than 0.001 and an value of 0.49. The shade denoted by the light blue shading and the light red shading corresponds to 95% confidence interval
These results indicate a statistically significant positive correlation between vocal activity and temperature during the winter months. This suggests that as temperatures increase in the winter season, vocal activity among bird species tends to rise, potentially reflecting greater engagement in communication behaviors during warmer conditions.
The Figure 3b illustrates a scatter plot depicting the relationship between the number of bird calls and average daily temperature for the two summer seasons. The blue line represents the summer season from May 2023 to August 2023, yielding a Pearson correlation coefficient of -0.553, with a p-value of less than 0.001 and an value of 0.31. The red line corresponds to the summer season from May 2024 to August 2024, demonstrating a Pearson correlation coefficient of -0.120, with a p-value equal to 0.263 and an value of 0.01. The shade denoted by the light blue shading and the light red shading corresponds to 95% confidence interval.
These first result indicate a statistically significant negative correlation between vocal activity and temperature during the winter months. This suggests that as temperatures increase in the summer season, vocal activity among bird species tends to decrease, potentially reflecting lesser engagement in communication behaviors and restricted flight ranges during warmer conditions. These results are summarized in Table 2.
3.1.3. Machine Learning Approach
The connection between temperature and bird vocalization can be influenced by various factors, and these relationships are frequently non-linear. Linear regression assume a straight-line relationship, which may not capture the true dynamics between the number of bird calls and temperature. Machine learning algorithms can effectively model these complex, non-linear relationships, providing a more accurate understanding of how bird calls relate to temperature. Each species may contribute differently to the overall pattern of bird calls, and a machine learning approach is well-suited to handle this complexity.
To further explore the correlation between the number of bird calls and temperature, and to investigate how different species contribute to the overall number of birdcallls with changes in temperature a machine learning model has been employed. In this model, the input variables are the number of bird calls per day from different species, while the output variable is the daily average temperature. These algorithms can identify which species’ calls are most important for predicting temperature, thereby revealing which bird species are more sensitive to changes in temperature and, consequently, to overall global climate change.
The dataset utilized in this analysis comprises 621 observations and 14 predictor variables. The predictors include the number of bird calls from the most frequently observed species at the sensor location, Paul Quinn College in Dallas, Texas. While various machine learning models were evaluated during this study, only the model demonstrating the highest performance is presented here.
Correlations between the predictor variables and the target variable are visualized in a color-filled correlation plot presented in the Figure 4. Strong positive correlations are indicated by dark red squares, while strong negative correlations are represented by dark blue squares. The plot reveals that the Northern Mockingbird exhibits a significant positive correlation with temperature, suggesting that the number of bird calls increases during warmer seasons. Conversely, the Canada Goose and Carolina Chickadee show a negative correlation with temperature, indicating that their bird calls are more frequent in colder seasons when temperatures are lower.
Figure 5a Shows the best performing Random Forest Model using the number of bird calls from the top 14 bird species. In this Figure 5a, the predicted values and true values for both the training (blue circles) and test dataset(red plus) are closely following the perfect fit (blue) line.
The predictor importance ranking graph Figure 5b is generated to illustrate the significance of each variable in the model. Variables with a higher importance score have a greater impact on the model prediction than those with a lower importance score. According to the feature importance figure (Figure 5b), the top three most important variables are the number of bird calls from Mississippi Kite, Chimney Swift, and House Sparrow.
The Mississippi Kite is known for its distinctive calls, particularly during the warmer months (indicated by the red box in correlation plot). Being ranked as a top predictor suggests that the number of bird calls from this species serves as a reliable indicator of temperature changes. This could also imply that the Mississippi Kite is sensitive to temperature changes, serving as a potential bioindicator for environmental conditions. Similarly, the Chimney Swift’s calls are also indicative of temperature shifts. Its high ranking in the feature importance indicates that changes in its vocalizations can provide valuable insights into temperature fluctuations, suggesting that this species is attuned to the seasonal dynamics associated with temperature. The House Sparrow, known for its adaptability to various environments, is another key predictor in this analysis. Its position among the top three variables suggests that its calling patterns are significantly related to temperature changes, highlighting its sensitivity to environmental conditions.
The relationship between ambient temperature and bird vocalization frequency has been explored in various studies, revealing species-specific responses. For the Mississippi Kite (Ictinia mississippiensis), Chimney Swift (Chaetura pelagica), House Sparrow (Passer domesticus), Blue Jay (Cyanocitta cristata), and Northern Mockingbird (Mimus polyglottos), the following mechanistic reasons have been observed:
- Thermoregulation and Metabolic Constraints: Elevated temperatures can increase metabolic rates, leading to higher energy expenditure. Birds may reduce vocal activity during peak heat to conserve energy and avoid overheating. This behavior has been observed in various species, suggesting a general trend across avian taxa [25].
- Behavioral Adaptations to Environmental Stress: High temperatures can induce stress, prompting birds to modify their behavior. Some species may decrease vocalizations during warmer periods to minimize energy loss and reduce exposure to predators when they are less vigilant due to heat stress [26].
- Influence on Prey and Food Availability: Temperature fluctuations can affect the abundance and activity of prey species. For insectivorous birds such as the chimney swift, higher temperatures can reduce prey availability during certain times of the day, leading to adjustments in foraging and associated vocal behaviors.
- Impact on Acoustic Signal Transmission: Temperature affects air density and consequently sound propagation. In warmer conditions, the sound can attenuate more rapidly, potentially influencing the effectiveness of vocal communication. Birds may alter their calling patterns to compensate for these changes in signal transmission [27].
Although these mechanisms provide a framework for understanding how temperature influences bird vocalizations, specific studies focusing on the mentioned species are necessary to draw definitive conclusions.
3.1.4. Distribution of bird calls Across Temperature Ranges
The histogram plot (Figure 6) illustrates the distribution of the number of bird calls from all observed bird species across varying temperature levels, using data collected from multiple MINTS-AI sensor modules at multiple locations. The dataset comprises 35,989 observations, with the x-axis representing temperature in degrees Celsius and each bin corresponding to a 1-degree interval. The distribution approximates a normal curve, indicating a central tendency in vocal activity around specific temperature ranges. Notably, the histogram shows a pronounced peak, with the number of bird calls reaching more than 35,000 between 20 and 30 degrees Celsius. This peak suggests that the most favorable temperature range for avian vocal activity occurs within this interval.
In addition to the histogram, an analysis of the number of hours spent at each degree temperature throughout the dataset reveals a peak around 27 degrees Celsius. This finding indicates that while the temperature was predominantly recorded at 27 degrees Celsius during the data collection period, the highest frequency of bird calls occurs at 22 degrees Celsius. This discrepancy suggests that although birds may experience more hours at slightly higher temperatures, their vocal activity peaks at a lower temperature, highlighting a nuanced relationship between temperature and avian vocalization. Overall, these patterns underscore the sensitivity of birdcall frequency to temperature fluctuations, providing valuable insights into how environmental conditions influence avian vocal behavior across diverse habitats.
3.1.5. The Starting Time of Dawn Chorus in Relation to Temperature
The investigation into the correlation between the start time of the dawn chorus and temperature utilized avian and temperature datasets obtained from a specific Central Node sensor. Two avian species, namely the House Sparrow and Carolina Chickadee, were selected for correlation analysis due to their consistent presence in the dawn chorus during the breeding season at the sensor location.
Figure 7a illustrates the relationship between the start time of the dawn chorus for House Sparrows and temperature. Notably, as temperatures decrease, the dawn chorus of House Sparrows tends to shift towards later singing, while an increase in temperature corresponds to an earlier start of singing.
During specific temperature peaks, such as on February 21 and 22, the dawn chorus does not show a tendency toward earlier singing, which can be attributed to rainfall during the morning hours on these particular days. Figure 7b illustrates a similar outcome for the Carolina Chickadee. The pronounced transition of the dawn chorus from an early to a later singing is notably apparent in the Carolina Chickadee as temperatures decrease.
Figure 8, shows the relationship between the two species ( House Sparrow and Caroline Chikcadee) with Temperature via scatter plot. The Carolina Chickadee is represented by orange squares, while the House Sparrow is denoted by blue circles along with the regression lines. The values of 0.61 for the Carolina Chickadee and 0.25 for the House Sparrow, with respect to temperature, indicate the extent to which fluctuations in the start time of dawn chorus are explicable by temperature variations. A higher value, as evidenced by the Carolina Chickadee’s 0.61 coefficient, signifies a more pronounced association between temperature and the start of the dawn chorus. Conversely, the House Sparrow’s value of 0.25 suggests a less robust correlation, indicating that factors other than temperature may exert a considerable influence on the start time of the dawn chorus.
We have seen that the initiation time of the avian dawn chorus is influenced by various environmental factors, with temperature playing a significant role. Several mechanistic explanations have been proposed in the literature to elucidate this relationship.
- Energy Storage Stochasticity Hypothesis: This hypothesis suggests that birds accumulate energy reserves to survive unpredictable overnight conditions. Warmer nights reduce the energy required for thermoregulation, allowing birds to start singing earlier in the morning due to surplus energy [28].
- Thermoregulatory Constraints: Lower temperatures can increase metabolic demands, necessitating more energy for maintaining body heat. Consequently, birds may delay the onset of singing to prioritize foraging and energy acquisition when temperatures are low [29].
- Acoustic Transmission Efficiency: Temperature affects air density, which, in turn, influences sound propagation. Cooler temperatures at dawn can enhance sound transmission, potentially encouraging birds to sing earlier to maximize the range and clarity of their calls [30].
- Prey Activity Levels: For insectivorous birds, prey availability is temperature-dependent. Warmer temperatures may increase insect activity earlier in the day, prompting birds to adjust their singing schedules to align with optimal foraging times [31].
These mechanisms underscore the complex interplay between temperature and the timing of the initiation of the dawn chorus, reflecting adaptive strategies to optimize energy expenditure, communication effectiveness, and foraging success.
3.2. Ambient Humidity
Similar to the machine learning approach used for temperature prediction, the correlation between humidity and bird calls has also been examined using machine learning techniques. This analysis utilizes data collected from a LoRa sensor deployed at the University of Texas at Dallas, comprising a total of 581 observations. In this context, humidity serves as the target variable, while the number of bird calls from the 17 species most frequently observed at the location are considered as predictor variables.
The correlations between the predictor variables and the target variable are visualized in a color-filled correlation plot presented in Figure 9. Strong positive correlations are indicated by dark red squares, while strong negative correlations are represented by dark blue squares. The plot reveals that the Canada Goose exhibits a significant positive correlation with humidity, suggesting that the frequency of its bird calls increases with rising humidity levels. Conversely, the Common Yellowthroat and Song Sparrow show negative correlations with humidity, indicating that their vocalizations are more frequent during drier conditions.
The Figure 10a Shows the best performing Random Forest Model using the number of bird calls from the top 17 bird species. In this Figure, the predicted values and true values for both the training (blue circles) and test dataset(red plus) are following the 1:1 line with an value of 0.545 for test dataset. Although this value is not particularly high, it suggests a moderate level of correlation between humidity and number of bird calls. Moreover, as more data are collected from the sensors over time, this correlation can be further explored with greater accuracy.
The feature importance ranking (Figure 10b) for the correlation between humidity and the number of bird calls from different species reveals key insights into the vocal behavior of birds. The House Finch emerges as the most significant predictor, suggesting that its vocal activity is sensitive to changes in humidity levels. Following the House Finch, the Blue Jay ranks second, indicating that its vocalizations also correlate with humidity. This relationship may be related to the behavior of the Blue Jay, as it is known to communicate actively in humid conditions. The Canada Goose, ranked third in the ranking, also shows a significant correlation with humidity, although its vocalizations may be more prominent during specific migratory and breeding seasons when humidity levels are higher.
The relationship between bird vocalization frequency and environmental humidity is not well understood. Various studies have explored how atmospheric conditions influence avian communication. Although specific research directly linking the number of calls from House Finches (Haemorhous mexicanus), Blue Jays (Cyanocitta cristata), Canada Geese (Branta canadensis), and American Robins (Turdus migratorius) to humidity levels is limited, general mechanisms have been identified that can affect bird vocal behavior in relation to humidity:
- Sound Transmission Efficiency: Humidity affects sound absorption in the atmosphere. Higher humidity levels can reduce sound attenuation, allowing calls to travel further. Birds may adjust their calling behavior based on these conditions to optimize communication efficiency [32].
- Ambient Noise Levels: Humidity can influence the activity of insects and other animals, thereby altering ambient noise levels. Birds might modify their calling rates to avoid acoustic masking by background noise [33].
- Thermoregulation and Metabolic Constraints: High humidity can impact thermoregulation and energy expenditure in birds. Increased humidity may lead to higher body temperatures, potentially reducing the energy available for activities like calling.
- Behavioral Adaptations: Birds may alter their calling behavior in response to environmental cues associated with humidity, such as changes in vegetation density or prey availability, which can indirectly influence vocalization patterns.
While these mechanisms provide a framework for understanding potential links between humidity and bird calling behavior, further studies specific to House Finches, Blue Jays, Canada Geese, and American Robins are clearly necessary to draw definitive conclusions.
3.3. Light Intensity
In this section, the correlation between two wavelengths of visible light—blue light and red light—has been examined in relation to the number of bird calls. This analysis employs data collected from a LoRa sensor deployed at the University of Texas at Dallas, encompassing a total of 581 observations. In this context, the intensities of blue and red wavelengths serve as the target variables, while the number of bird calls from the 19 most frequently observed species at the location are treated as predictor variables.
The correlations between the predictor variables and the target variable are visualized in a colorfilled correlation plot presented in Figure 11. Strong positive correlations are indicated by dark red squares, while strong negative correlations are represented by dark blue squares. The plot reveals that the American Robin and Red-winged Blackbird exhibits a s positive correlation with the intensity of red and blue light, suggesting that the frequency of its bird calls increases with increase in the intensity of red and blue light. Conversely, the Common Yellowthroat and show negative correlations with red and blue wavelength.
The Figure 12a,b present the performance of the Random Forest model, which employs the number of bird calls from the top 19 bird species as predictor variables.
In these figures, the predicted values and true values for both the training dataset (represented by blue circles) and the test dataset (indicated by red plus signs) align closely with the 1:1 line. The R² value for blue wavelength intensities is 0.612, while the R² value for red wavelength intensities is 0.575 in the test datasets. These results suggest that blue wavelength intensities exhibit a slightly stronger correlation with the number of bird calls compared to red wavelength intensities. As more data is collected from the sensors over time, this correlation can be further investigated with enhanced accuracy.
Figure 13a,b represent the ranking of predictors for bluew wavelength intensities estimation and red wavelength intensities estimation respectively. In the context of blue light intensity estimation, the Northern Mockingbird, Scissor-tailed Flycatcher, and Clay-colored Sparrow rank as the top three predictor species. For the estimation of red wavelength intensities, the first and second species remain the same; however, the Canada Goose emerges as the third predictor. The strong presence of the Northern Mockingbird and Scissor-tailed Flycatcher in both rankings suggests that these species are particularly responsive to changes in light conditions, potentially influencing their vocal behavior. The addition of the Canada Goose in the red wavelength prediction highlights its sensitivity to different environmental factors, indicating that variations in red light may affect its calling patterns as well. These correlations underscore the importance of understanding how specific bird species interact with varying light conditions and how these interactions may reflect broader ecological responses.
The influence of light intensity and wavelength on avian vocal behavior has been a subject of scientific investigation. While specific studies on the Northern Mockingbird (Mimus polyglottos), Scissor-tailed Flycatcher (Tyrannus forficatus), Clay-colored Sparrow (Spizella pallida), and House Finch (Haemorhous mexicanus) are limited, general mechanisms have been identified that may relate the intensity of red and blue light to the frequency of bird calls:
- Photoperiod and Circadian Rhythms: Birds rely on photoperiod signals to regulate circadian rhythms, which influence behaviors such as singing. Exposure to artificial light, particularly in the blue spectrum, can disrupt these rhythms, potentially altering the timing and frequency of vocalizations [34].
- Melatonin Suppression: Blue light has been shown to suppress melatonin production more effectively than red light. Reduced melatonin levels can lead to increased nocturnal activity, including singing, as observed in some species of passerines [35].
- Visual Perception and Mate Attraction: The intensity and spectrum of light can affect visual signaling. Under certain lighting conditions, birds can increase vocalizations to compensate for reduced visibility, enhancing mate attraction and territorial defense [36].
- Predation Risk Assessment: Artificial lighting, especially in the red spectrum, can alter the perceived risk of predation. Birds may adjust their singing behavior in response to changes in ambient light to minimize detection by predators
These mechanisms suggest that the intensity and wavelength of light, particularly red and blue, can influence avian vocal behavior through physiological and ecological pathways. More research is needed to elucidate species-specific responses, especially for the Northern Mockingbird, Scissor-tailed Flycatcher, Clay-colored Sparrow, and House Finch.
3.4. Particulate Matter ()
Figure 14 presents a scatter plot that illustrates the relationship between concentration, avian diversity, and vocal activity. Specifically, Figure 14a and 14b depict avian diversity during the winter and summer seasons, respectively, while Figure 14c and 14d illustrate vocal activity during the same seasons. The data reveal that, although the slopes of the regression lines are slightly positive, they are close to zero. This indicates a lack of significant correlation—either positive or negative—between avian diversity, vocal activity, and concentration.
A summary of the Pearson correlation coefficient, value, and p-value for avian diversity vs is provided in Table 3.
A summary of the Pearson correlation coefficient, value, and p-value for vocal activity vs is provided in Table 4.
Although no significant correlation was observed between avian behavior and particulate matter concentration, this finding highlights the necessity for further investigation as additional data becomes available.
4. Conclusions
This study provides a comprehensive examination of avian diversity, vocal behavior, and the influences of ambient environmental factors through the application of Internet of Things (IoT) technology and machine learning. Utilizing the BirdNet deep learning model in conjunction with MINTS-AI environmental sensors, significant relationships between avian behavior and key environmental variables—namely ambient temperature, humidity, and light intensity—have been elucidated. This novel methodology holds promise for investigating the effects of climate change on avian populations, distribution, and migration contingent upon the accumulation of sufficient longitudinal data.
The findings indicate a positive correlation between avian diversity and vocal activity during the winter season, suggesting that warmer temperatures enable birds to explore broader areas and engage in more vocal interactions. Conversely, during the summer months, the maximum avian diversity and vocal activity occur at lower temperatures. These consistent results across two winter and two summer seasons emphasize the critical role that temperature plays in shaping avian behavior.
Furthermore, the analysis demonstrated that from the number of bird calls from various species, the ambient humidity can be estimated (test dataset = 0.545). This suggests that there is a potential underlying correlation between humidity levels and avian vocalizations, which could be further refined with additional data. Notably, the machine learning model identified the House Finch, Blue Jay, and Canada Goose as the top three predictors, highlighting their heightened sensitivity to changes in ambient humidity.
The investigation into ambient light conditions reveals different responses among avian species to varying wavelengths of light, as indicated by the differing values for test datasets for red and blue wavelengths. The predictors ranking plot identified the Northern Mockingbird and Scissor-tailed Flycatcher as the most sensitive species to ambient light conditions, suggesting their vocal behavior is significantly influenced by light intensity.
Although no significant correlations were found with PM2.5 levels, this area warrants further exploration as additional data becomes available. Overall, the investigation of various environmental conditions illustrates that birds are acutely sensitive to ambient environmental fluctuations, particularly temperature. Abrupt changes in these climatic conditions due to climate change could profoundly alter avian behavior and disrupt ecological dynamics, with broader implications for global ecosystems and human communities.
In conclusion, this research not only enhances our understanding of avian responses to environmental factors but also emphasizes the necessity for continued monitoring and study of these dynamics in the context of ongoing climate change. Such efforts will be crucial for developing effective conservation strategies and mitigating potential impacts on biodiversity.
Author Contributions
Conceptualization, D.J.L.; Methodology, M.I., L.O.H.W., J.W., P.M.H.D., G.B. and D.J.L.; Supervision, D.J.L.; Project administration, D.J.L.; Funding acquisition, D.J.L. All authors have read and agreed to the published version of the manuscript.
Funding
This research was funded by the following grants: the Texas National Security Network Excellence Fund award for Environmental Sensing Security Sentinels; the SOFWERX award for Machine Learning for Robotic Teams and NSF Award OAC-2115094; support from the University of Texas at Dallas Office of Sponsored Programs, Dean of Natural Sciences and Mathematics, and Chair of the Physics Department is gratefully acknowledged; TRECIS CC* Cyberteam (NSF #2019135); NSF OAC-2115094 Award; and EPA P3 grant number 84057001-0.
Institutional Review Board Statement
Not applicable
Informed Consent Statement
Not applicable
Data Availability Statement
The raw data supporting the conclusions of this article will be made available by the authors on request.
Conflicts of Interest
The authors declare no conflicts of interest
References
- Steffen, W.; Grinevald, J.; Crutzen, P.; McNeill, J. The Anthropocene: conceptual and historical perspectives. Philosophical Transactions of the Royal Society A: Mathematical, Physical and Engineering Sciences 2011, 369, 842–867. [Google Scholar] [CrossRef] [PubMed]
- Harris, G.M.; Sesnie, S.E.; Stewart, D.R. Climate change and ecosystem shifts in the southwestern United States. Scientific Reports 2023, 13, 19964. [Google Scholar] [CrossRef]
- Audubon Christmas Bird Count. https://www.audubon.org/conservation/science/christmas-bird-count.
- Saunders, S.P.; Meehan, T.D.; Michel, N.L.; Bateman, B.L.; DeLuca, W.; Deppe, J.L.; Grand, J.; LeBaron, G.S.; Taylor, L.; Westerkam, H.; et al. Unraveling a century of global change impacts on winter bird distributions in the eastern United States. Global Change Biology 2022, 28, 2221–2235. [Google Scholar] [CrossRef] [PubMed]
- North American Breeding Bird Survey. https://www.usgs.gov/centers/eesc/science/north-american-breeding-bird-survey.
- Rushing, C.S.; Royle, J.A.; Ziolkowski, D.J.; Pardieck, K.L. Migratory behavior and winter geography drive differential range shifts of eastern birds in response to recent climate change. Proceedings of the National Academy of Sciences 2020, 117, 12897–12903. [Google Scholar] [CrossRef]
- Horton, K.; La Sorte, F.; Sheldon, D.; Lin, T.Y.; Winner, K.; Bernstein, G.; Maji, S.; Hochachka, W.; Farnsworth, A. Phenology of nocturnal avian migration has shifted at the continental scale. Nature Climate Change 2020, 10, 1–6. [Google Scholar] [CrossRef]
- Neate-Clegg, M.H.C.; Jones, S.E.I.; Tobias, J.A.; Newmark, W.D.; Şekercioǧlu, Ç.H. Ecological Correlates of Elevational Range Shifts in Tropical Birds. Frontiers in Ecology and Evolution 2021, 9. [Google Scholar] [CrossRef]
- Yaremych, S.A.; Warner, R.E.; Mankin, P.C.; Brawn, J.D.; Raim, A.; Novak, R. West Nile virus and high death rate in American crows. Emerg Infect Dis 2004, 10, 709–711. [Google Scholar] [CrossRef]
- Fortini, L.B.; Vorsino, A.E.; Amidon, F.A.; Paxton, E.H.; Jacobi, J.D. Large-Scale Range Collapse of Hawaiian Forest Birds under Climate Change and the Need 21st Century Conservation Options. PLOS ONE 2015, 10, 1–22. [Google Scholar] [CrossRef]
- Mayor, S.; Guralnick, R.; Tingley, M.; Otegui, J.; Withey, J.; Elmendorf, S.; Andrew, M.; Leyk, S.; Pearse, I.; Schneider, D. Increasing phenological asynchrony between spring green-up and arrival of migratory birds. Scientific reports 2017, 7. [Google Scholar] [CrossRef]
- Wiens, J.J. Climate-Related Local Extinctions Are Already Widespread among Plant and Animal Species. PLOS Biology 2016, 14, 1–18. [Google Scholar] [CrossRef]
- Lary, D.J. The Multi-Scale Integrated Intelligent Interactive Sensing Consortium (MINTS) 2018.
- Wijeratne, L.O.; Kiv, D.R.; Aker, A.R.; Talebi, S.; Lary, D.J. Using Machine Learning for the Calibration of Airborne Particulate Sensors. Sensors 2020, 20, 99. [Google Scholar] [CrossRef] [PubMed]
- Lary, D.J.; Schaefer, D.; Waczak, J.; Aker, A.; Barbosa, A.; Wijeratne, L.O.; Talebi, S.; Fernando, B.; Sadler, J.; Lary, T.; et al. Autonomous Learning of New Environments with a Robotic Team Employing Hyper-Spectral Remote Sensing, Comprehensive In-Situ Sensing and Machine Learning. Sensors 2021, 21, 2240. [Google Scholar] [CrossRef] [PubMed]
- Zhang, Y.; Wijeratne, L.O.; Talebi, S.; Lary, D.J. Machine Learning for Light Sensor Calibration. Sensors 2021, 21, 6259. [Google Scholar] [CrossRef] [PubMed]
- Lary, D.J.; Wijerante, L.O.H.; Zewdie, G.K.; Kiv, D.; Wu, D.; Faruque, F.S.; Talebi, S.; Yu, X.; Zhang, Y.; Levetin, E.; et al. Machine Learning, Big Data, and Spatial Tools: A Combination to Reveal Complex Facts That Impact Environmental Health. In Geospatial Technology for Human Well-Being and Health; Springer, 2021.
- Fernando, B.A.; Talebi, S.; Wijeratne, L.; Waczak, J.; Sooriyaarachchi, V.; Ruwali, S.; Hathurusinghe, P.; Lary, D.J.; Sadler, J.; Lary, T.; et al. Data-driven environmental health: Unraveling particulate matter trends with biometric signals. Medical Research Archives 2024, 12. [Google Scholar]
- Ruwali, S.; Talebi, S.; Fernando, B.; Wijeratne, L.O.; Waczak, J.; Dewage, P.M.H.; Lary, D.J.; Sadler, J.; Lary, T.; Lary, M.; et al. Quantifying Inhaled Concentrations of Particulate Matter, Carbon Dioxide, Nitrogen Dioxide, and Nitric Oxide Using Observed Biometric Responses with Machine Learning. BioMedInformatics 2024, 4, 1019–1046. [Google Scholar] [CrossRef]
- Dewage, P.M.; Wijeratne, L.O.; Yu, X.; Iqbal, M.; Balagopal, G.; Waczak, J.; Fernando, A.; Lary, M.D.; Ruwali, S.; Lary, D.J. Providing fine temporal and spatial resolution analyses of airborne particulate matter utilizing complimentary in situ IoT sensor network and remote sensing approaches. Remote Sensing 2024, 16, 2454. [Google Scholar] [CrossRef]
- MINTS-AI Dashboards. http://mdash.circ.utdallas.edu:3000/dashboards.
- Piera Systems. IPS Series Sensor. Piera Systems Inc, 2022.
- Wijeratne, L.O.H. Coupling Physical Measurement With Machine Learning for Holistic Environmental Sensing. PhD thesis, The University of Texas at Dallas, 2021.
- Kahl, S.; Wood, C.M.; Eibl, M.; Klinck, H. BirdNET: A deep learning solution for avian diversity monitoring. Ecological Informatics 2021, 61, 101236. [Google Scholar] [CrossRef]
- Puswal, S.M.; Mei, J.; Liu, F. Effects of temperature and season on birds’ dawn singing behavior in a forest of eastern China. Journal of Ornithology 2021, 162, 447–459. [Google Scholar] [CrossRef]
- Author(s). The impact of high temperatures on bird responses to alarm calls. Behavioral Ecology and Sociobiology 2023. [Google Scholar]
- Møller, A.P. When climate change affects where birds sing. Behavioral Ecology 2011, 22, 212–217. [Google Scholar] [CrossRef]
- Bruni, A.; Mennill, D.J.; Foote, J.R. Dawn chorus start time variation in a temperate bird community: relationships with seasonality, weather, and ambient light. Journal of Ornithology 2014, 155, 877–890. [Google Scholar] [CrossRef]
- Puswal, S.M.; Mei, J.; Liu, F. Effects of temperature and season on birds’ dawn singing behavior in a forest of eastern China. Journal of Ornithology 2021, 162, 447–459. [Google Scholar] [CrossRef]
- Kneipp, T. The effect of elevation on the timing of the dawn chorus. Field Studies in Ecology 2023, 4. [Google Scholar]
- Kneipp, T. The effect of elevation on the timing of the dawn chorus. Field Studies in Ecology 2023, 4. [Google Scholar]
- Group, A.R. The effect of climate on acoustic signals: Does humidity influence sound transmission in bird calls? Journal of the Acoustical Society of America 2021, 131, 1650–1656. [Google Scholar]
- Team, B.E. Ambient noise levels and their impact on bird communication: The role of humidity and temperature. Behavioral Ecology 2015, 20, 1089–1095. [Google Scholar]
- Longcore, T.; Rich, C. Artificial night lighting and protected lands: ecological effects and management approaches. Natural Resource Report NPS/NRSS/NSNS/NRR—2013/632.
- Dominoni, D.M.; Goymann, W.; Helm, B.; Partecke, J. Artificial light at night advances avian reproductive physiology. Proceedings of the Royal Society B: Biological Sciences 2013, 280, 20123017. [Google Scholar] [CrossRef] [PubMed]
- Kempenaers, B.; Borgström, P.; Loës, P.; Schlicht, E.; Valcu, M. Artificial night lighting affects dawn song, extra-pair siring success, and lay date in songbirds. Current Biology 2010, 20, 1735–1739. [Google Scholar] [CrossRef]
Figure 1.
Flowchart for utilizing BirdNet for the Central Nodes and PoLo Nodes.
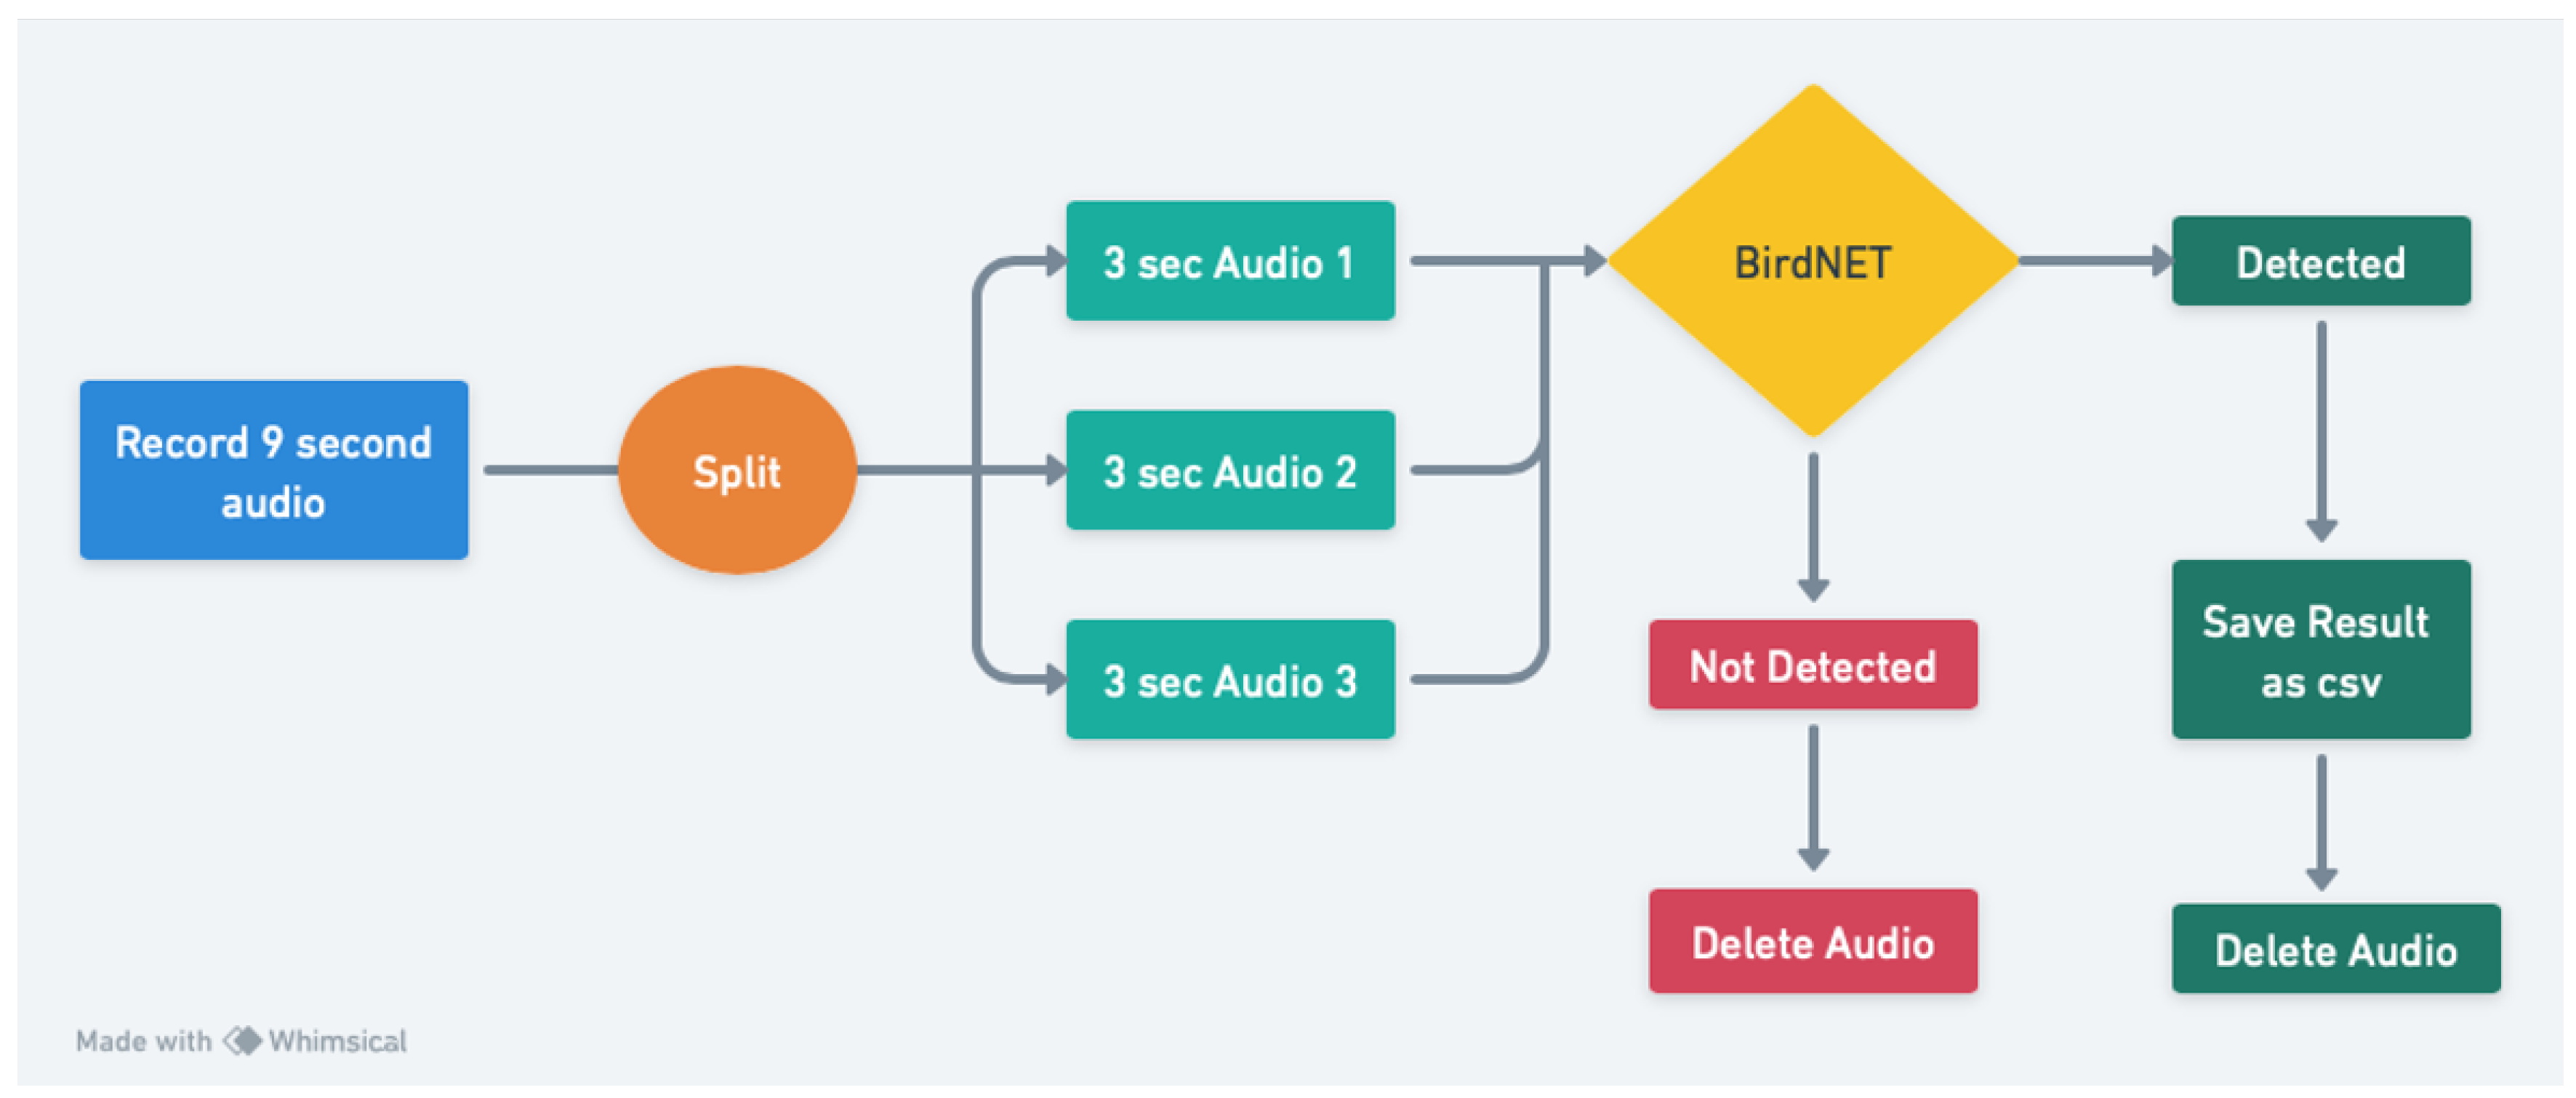
Figure 2.
Illustration of the correlation between temperature and avian diversity(Count of unique birds per day). The two lines show two seasons. The shade denoted by the light blue shading and the light red shading corresponds to the 95% confidence interval. (a) The red line represent the winter from December 2022 to April 2023 and the blue line represent the winter from December 2023 to April 2024. Both lines have positive slops indicating a direct relation between the Avian Diversity and temperature in the Winter season. (b) The red line represent the summer of the year 2023 (May - Aug) and the blue line represent the summer of the year 2024 (May - Aug). Both lines have negative slops indicating an inverse relation between the Avian Diversity and Temperature in the summer season.
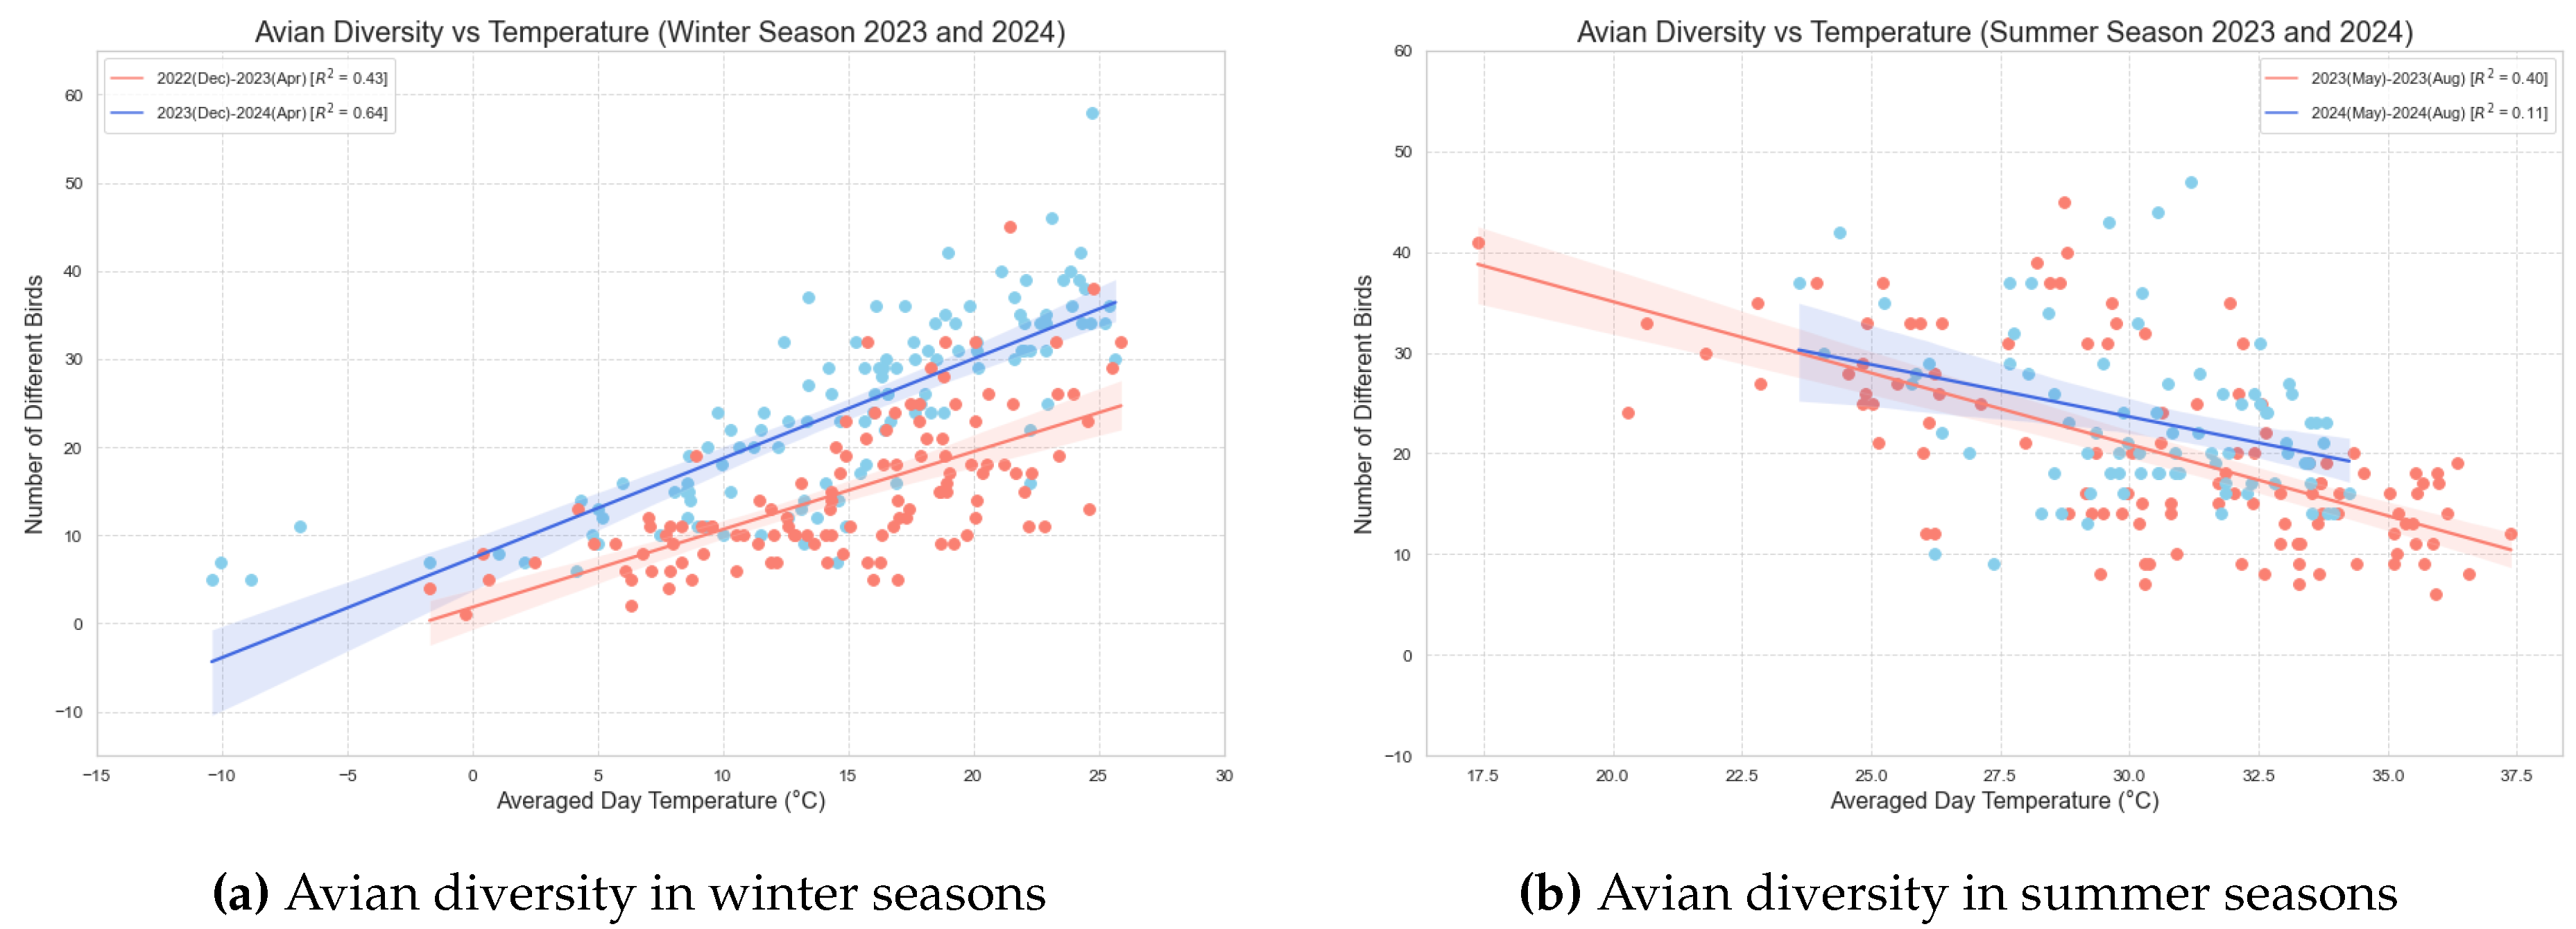
Figure 3.
Illustration of the correlation between temperature and Vocal Activity(Number of bird calls per day). The two lines show two seasons. The shade denoted by the light blue shading and the light red shading corresponds to the 95% confidence interval. (a) The red line represent the winter from December 2022 to April 2023 and the blue line represent the winter from December 2023 to April 2024. Both lines have positive slops indicating a direct relation between the Vocal Activity and temperature in the Winter season. (b) The red line represent the summer of the year 2023 (May - Aug) and the blue line represent the summer of the year 2024 (May - Aug). Both lines have negative slops indicating an inverse relation between the Vocal Activity and Temperature in the summer season.
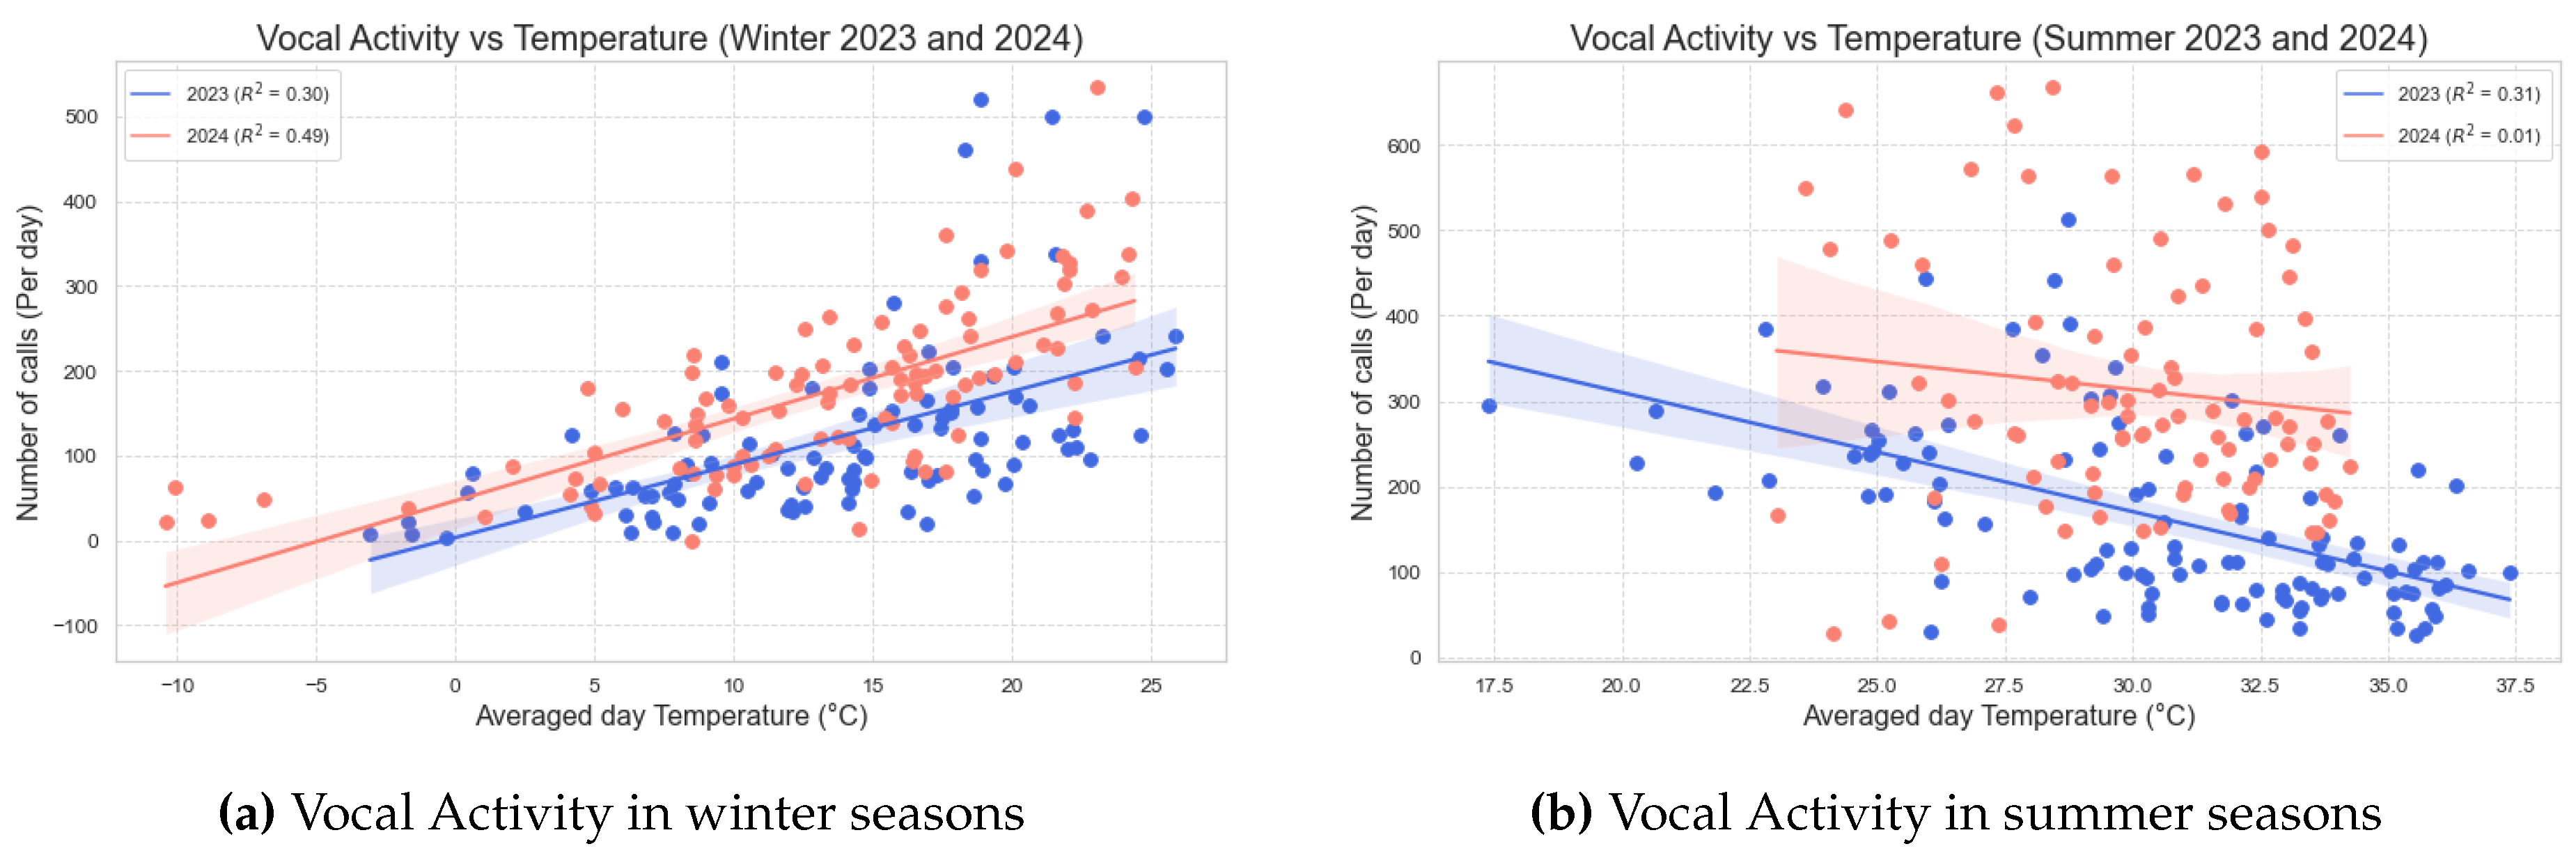
Figure 4.
Correlation plot of the number of bird calls from top 14 bird species as the predictor variables, along with the temperature as the target variable. Positively correlated variable are indicated by a red box, negatively correlated variables are indicated by blue box.
Figure 4.
Correlation plot of the number of bird calls from top 14 bird species as the predictor variables, along with the temperature as the target variable. Positively correlated variable are indicated by a red box, negatively correlated variables are indicated by blue box.
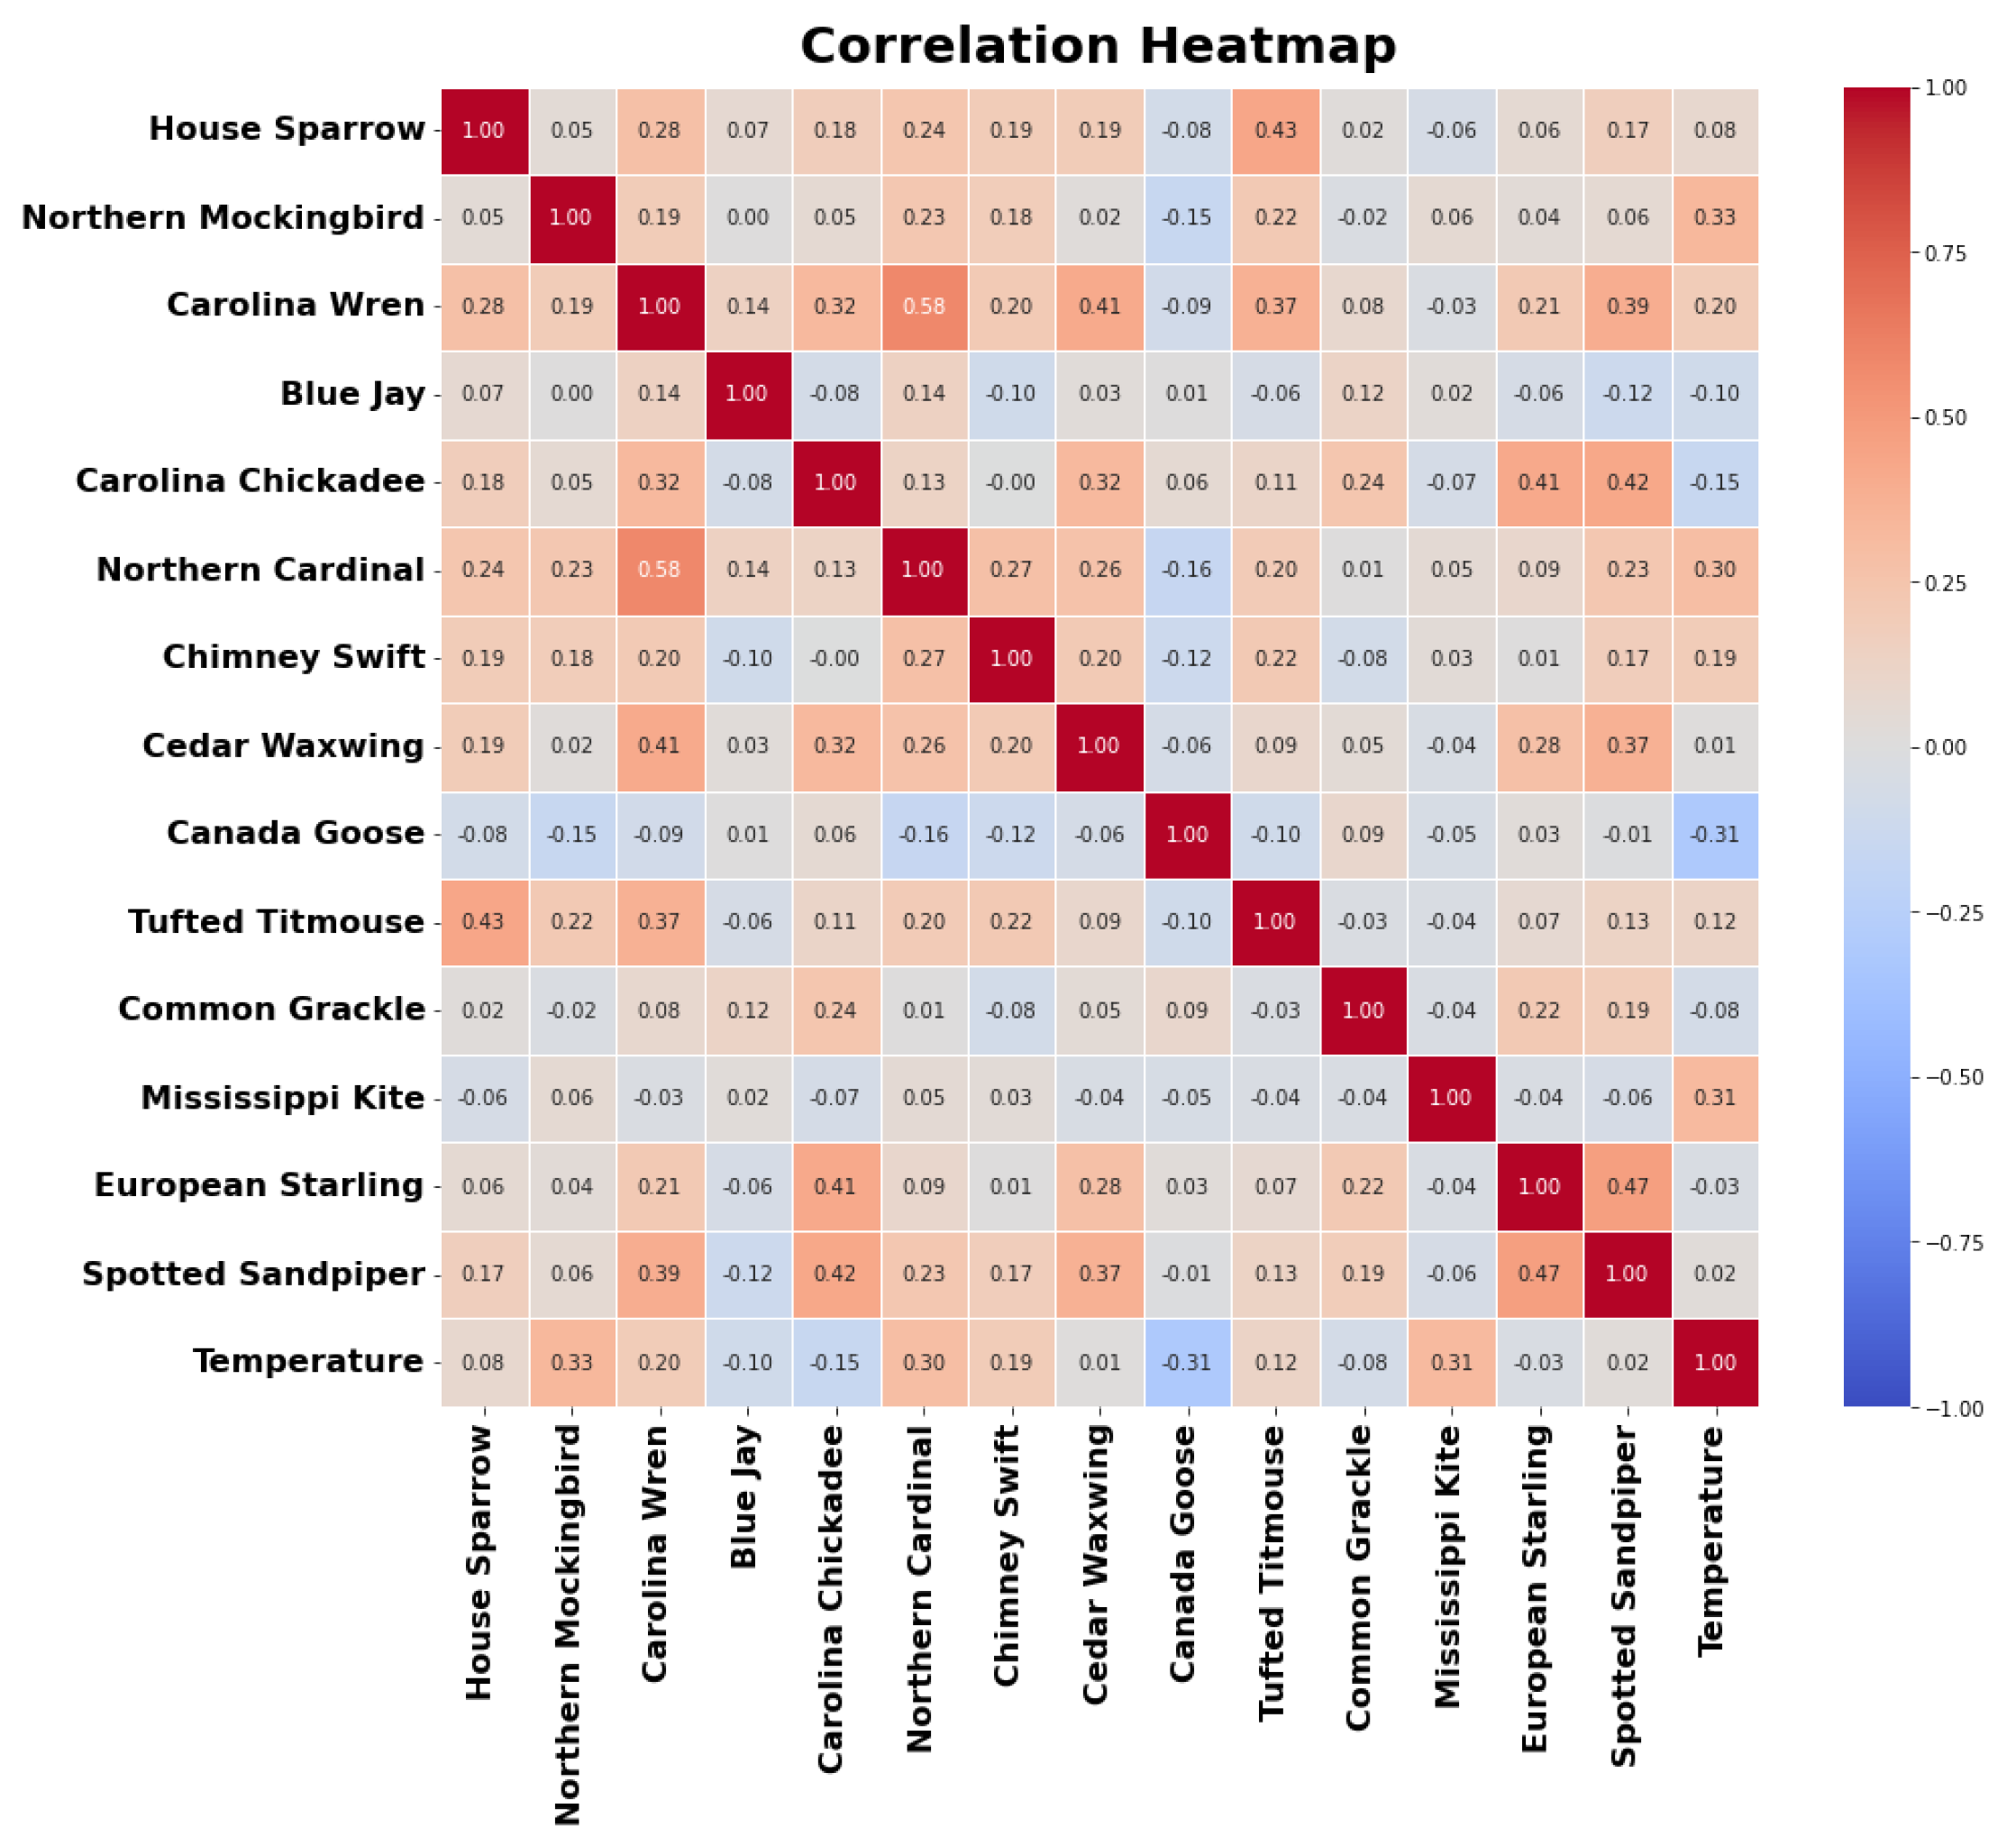
Figure 5.
(a) Scatter plot of predicted vs true temperature values. A perfect fit is indicated by the 1:1 line shown in blue. Training data are shown as blue circles and test data are plotted as red pluses (b) Feature importance ranking for the Random Forest Model (Predicting temperature)
Figure 5.
(a) Scatter plot of predicted vs true temperature values. A perfect fit is indicated by the 1:1 line shown in blue. Training data are shown as blue circles and test data are plotted as red pluses (b) Feature importance ranking for the Random Forest Model (Predicting temperature)
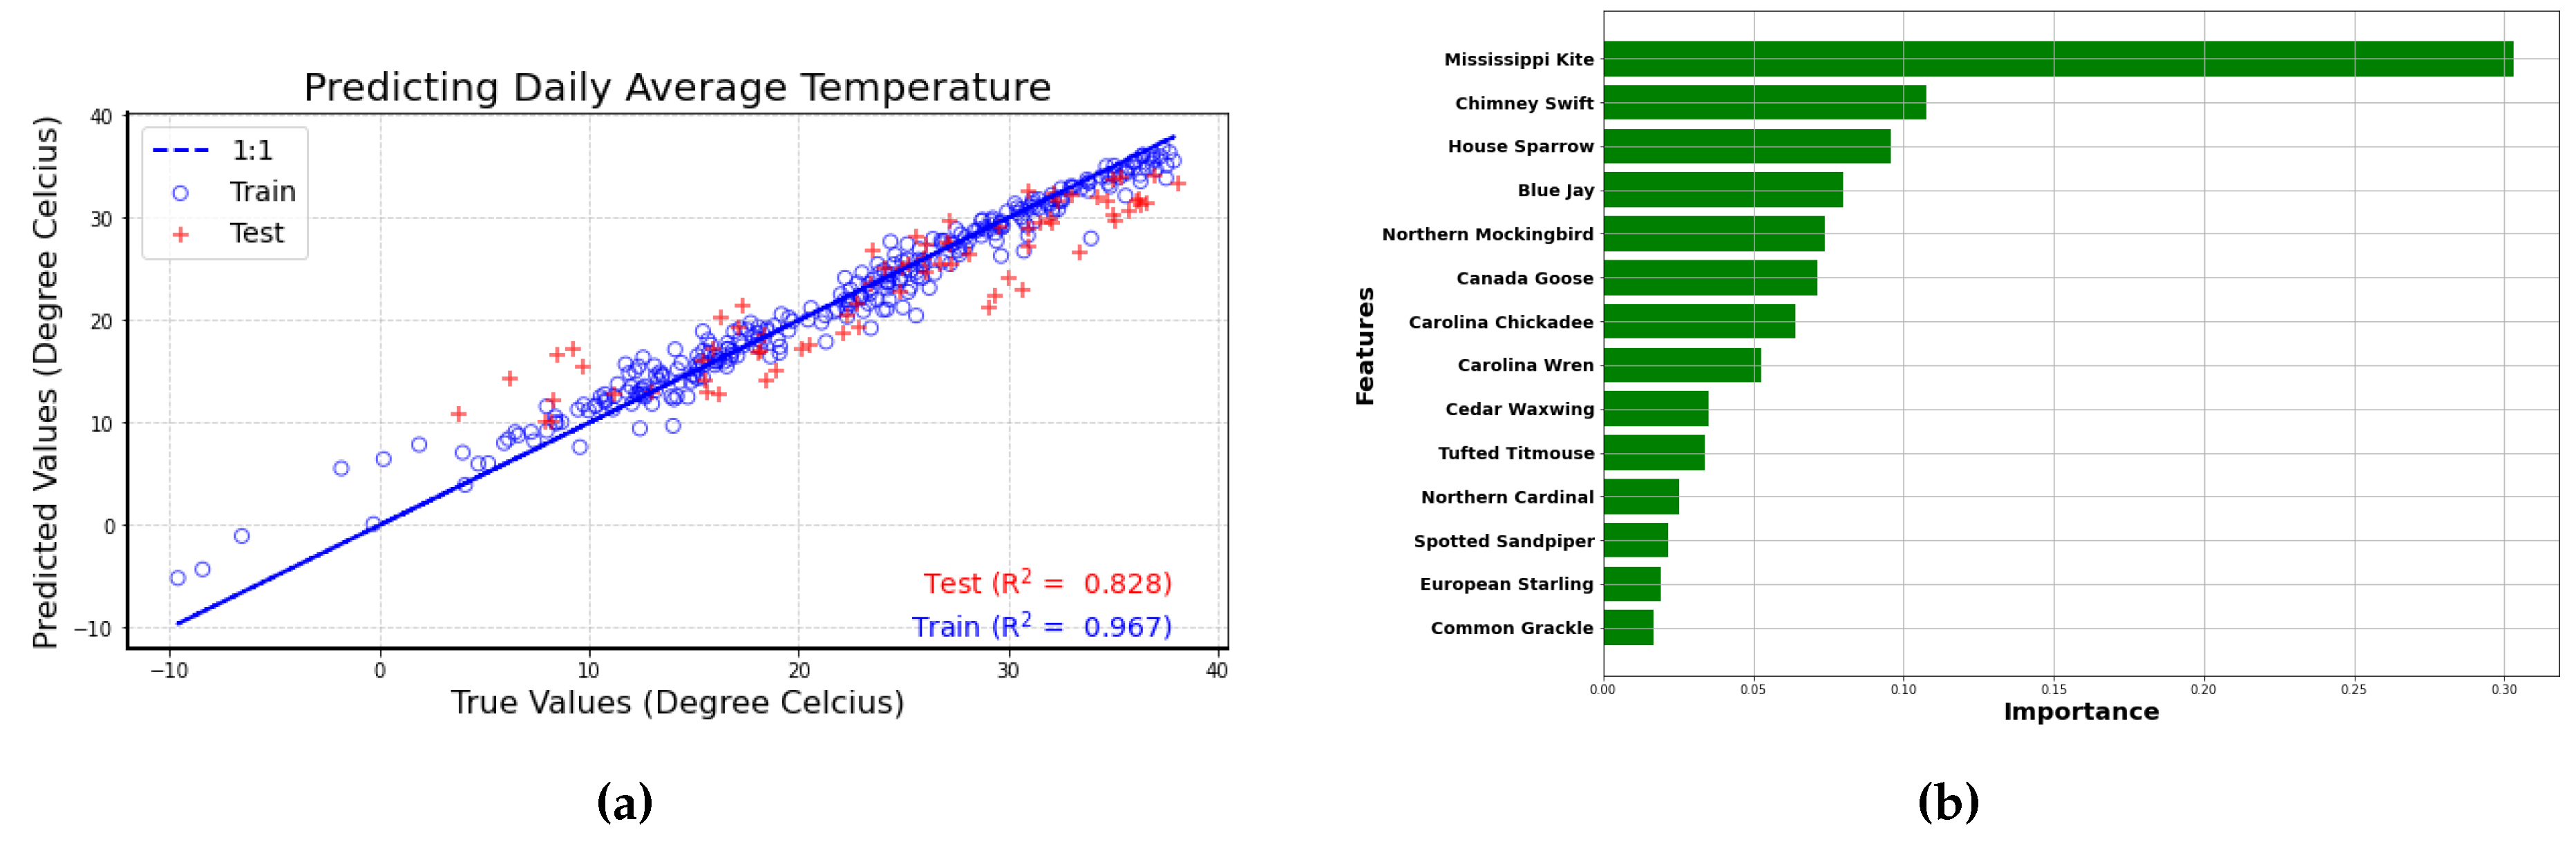
Figure 6.
The histogram displays the distribution of bird calls across temperature ranges, with blue bars representing the number of bird calls on the left y-axis. The line plot, shown in red, indicates the number of hours spent at each temperature, represented on the right y-axis. The data is sourced from multiple MINTS-AI sensor modules, encompassing a total of 35,989 observations. The peak in bird calls occurs at approximately 22 degrees Celsius, while the temperature with the highest number of hours spent is around 27 degrees Celsius, illustrating the relationship between temperature and avian vocalization.
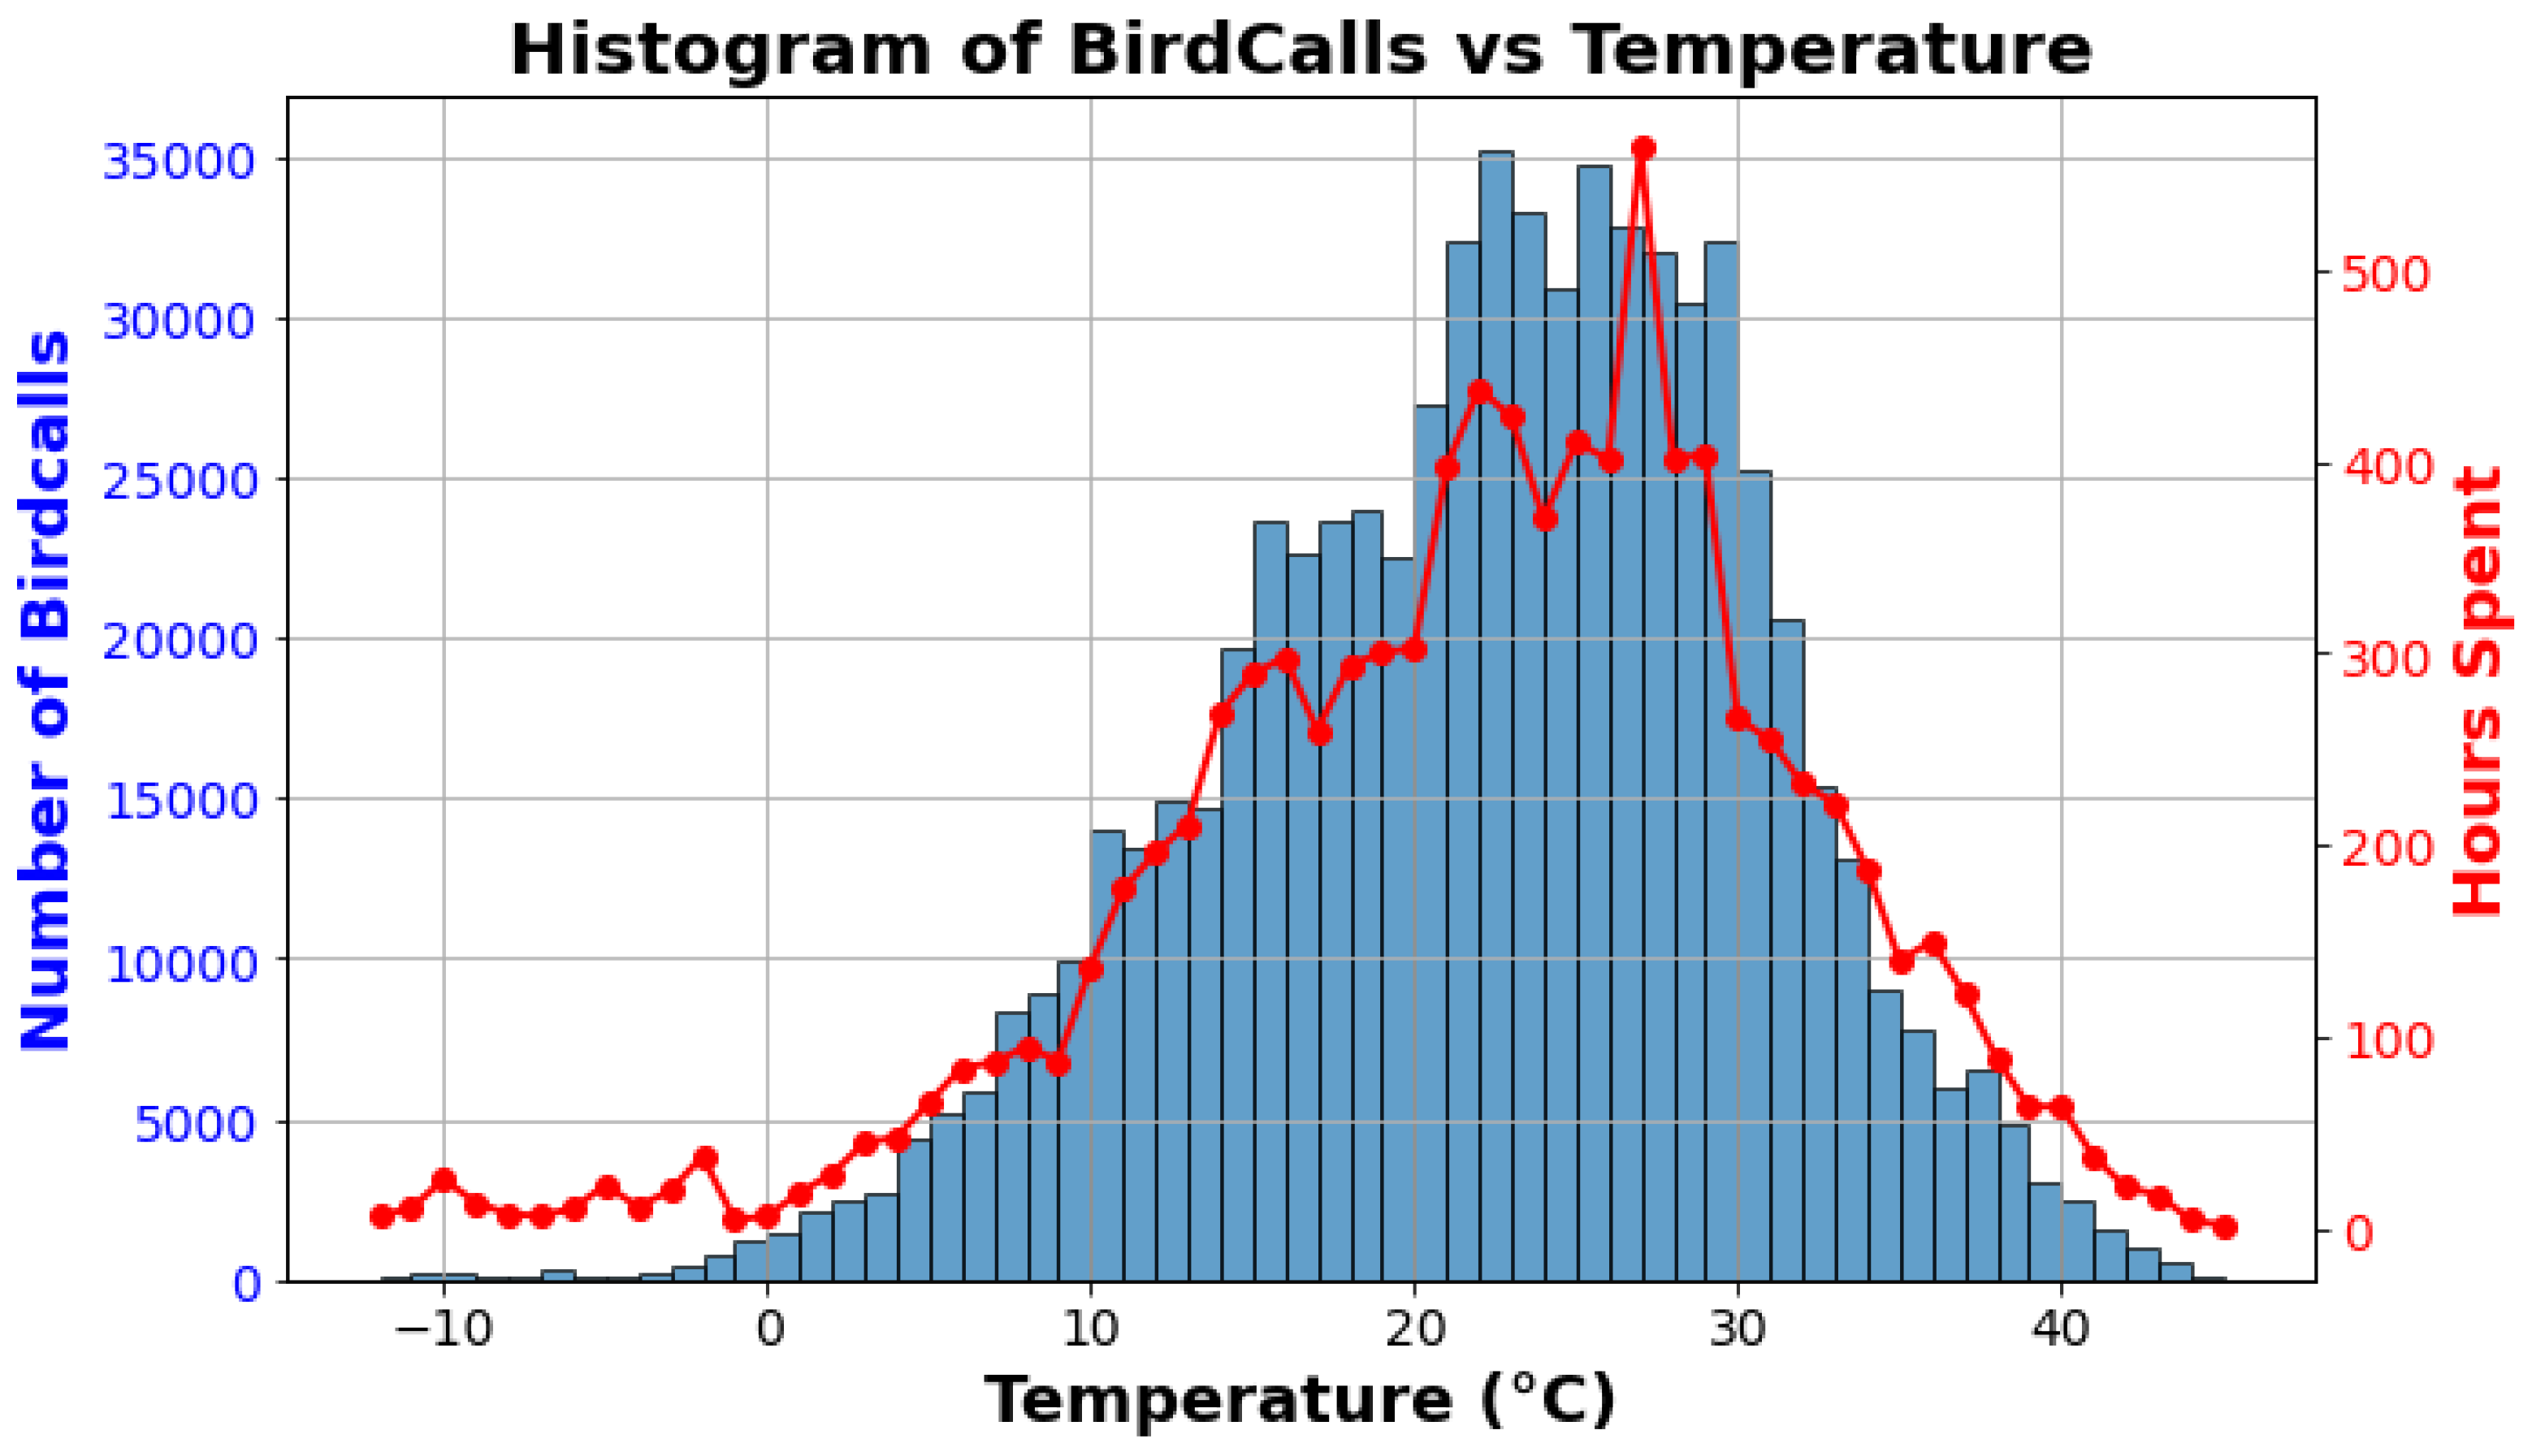
Figure 7.
(a) The start time of dawn chorus in relation to temperature for House Sparrow (b) The start time of dawn chorus in relation to temperature for Carolina Chickadee
Figure 7.
(a) The start time of dawn chorus in relation to temperature for House Sparrow (b) The start time of dawn chorus in relation to temperature for Carolina Chickadee
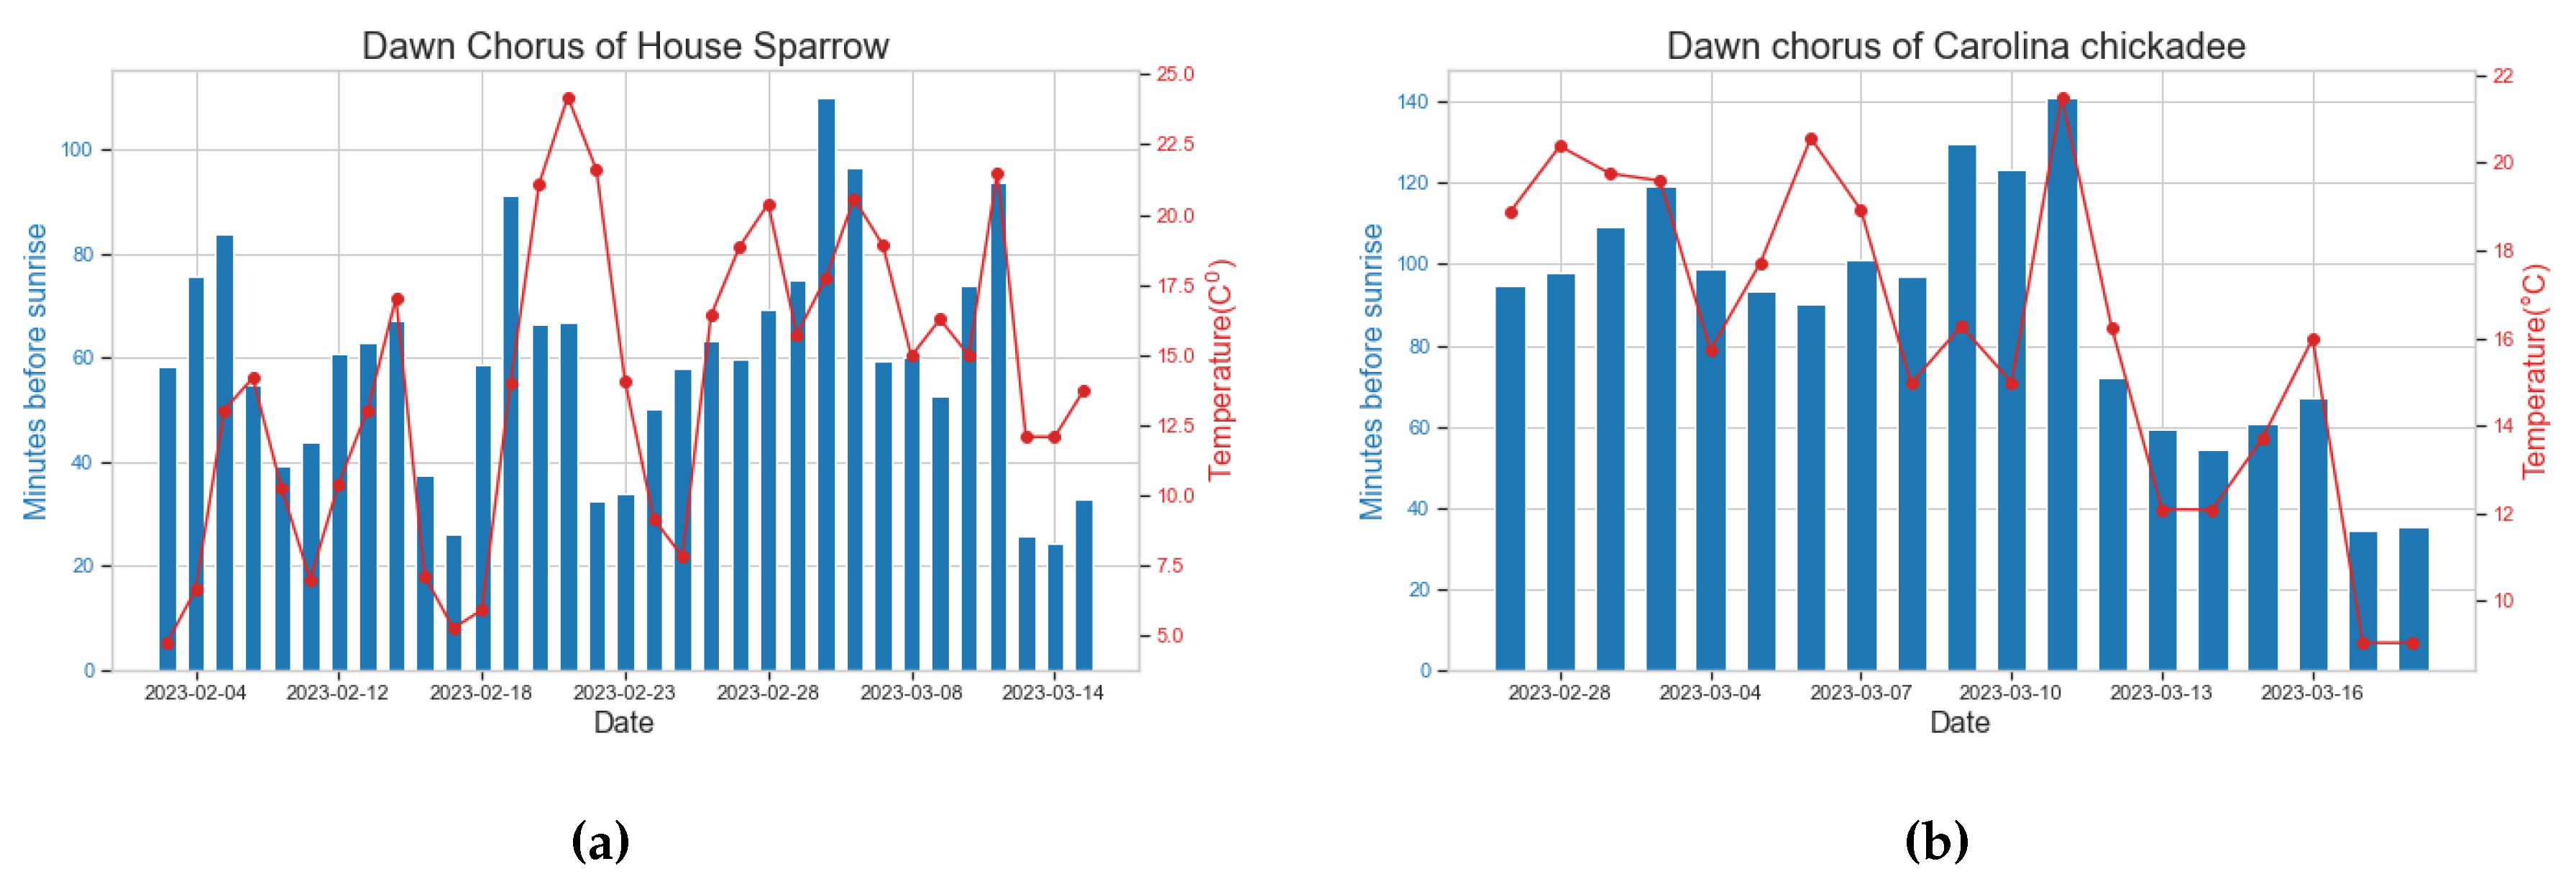
Figure 8.
Minutes before Sunrise vs Temperature. The blue circles represent House Sparrow and the orange squares represent Carolina Chickadee
Figure 8.
Minutes before Sunrise vs Temperature. The blue circles represent House Sparrow and the orange squares represent Carolina Chickadee
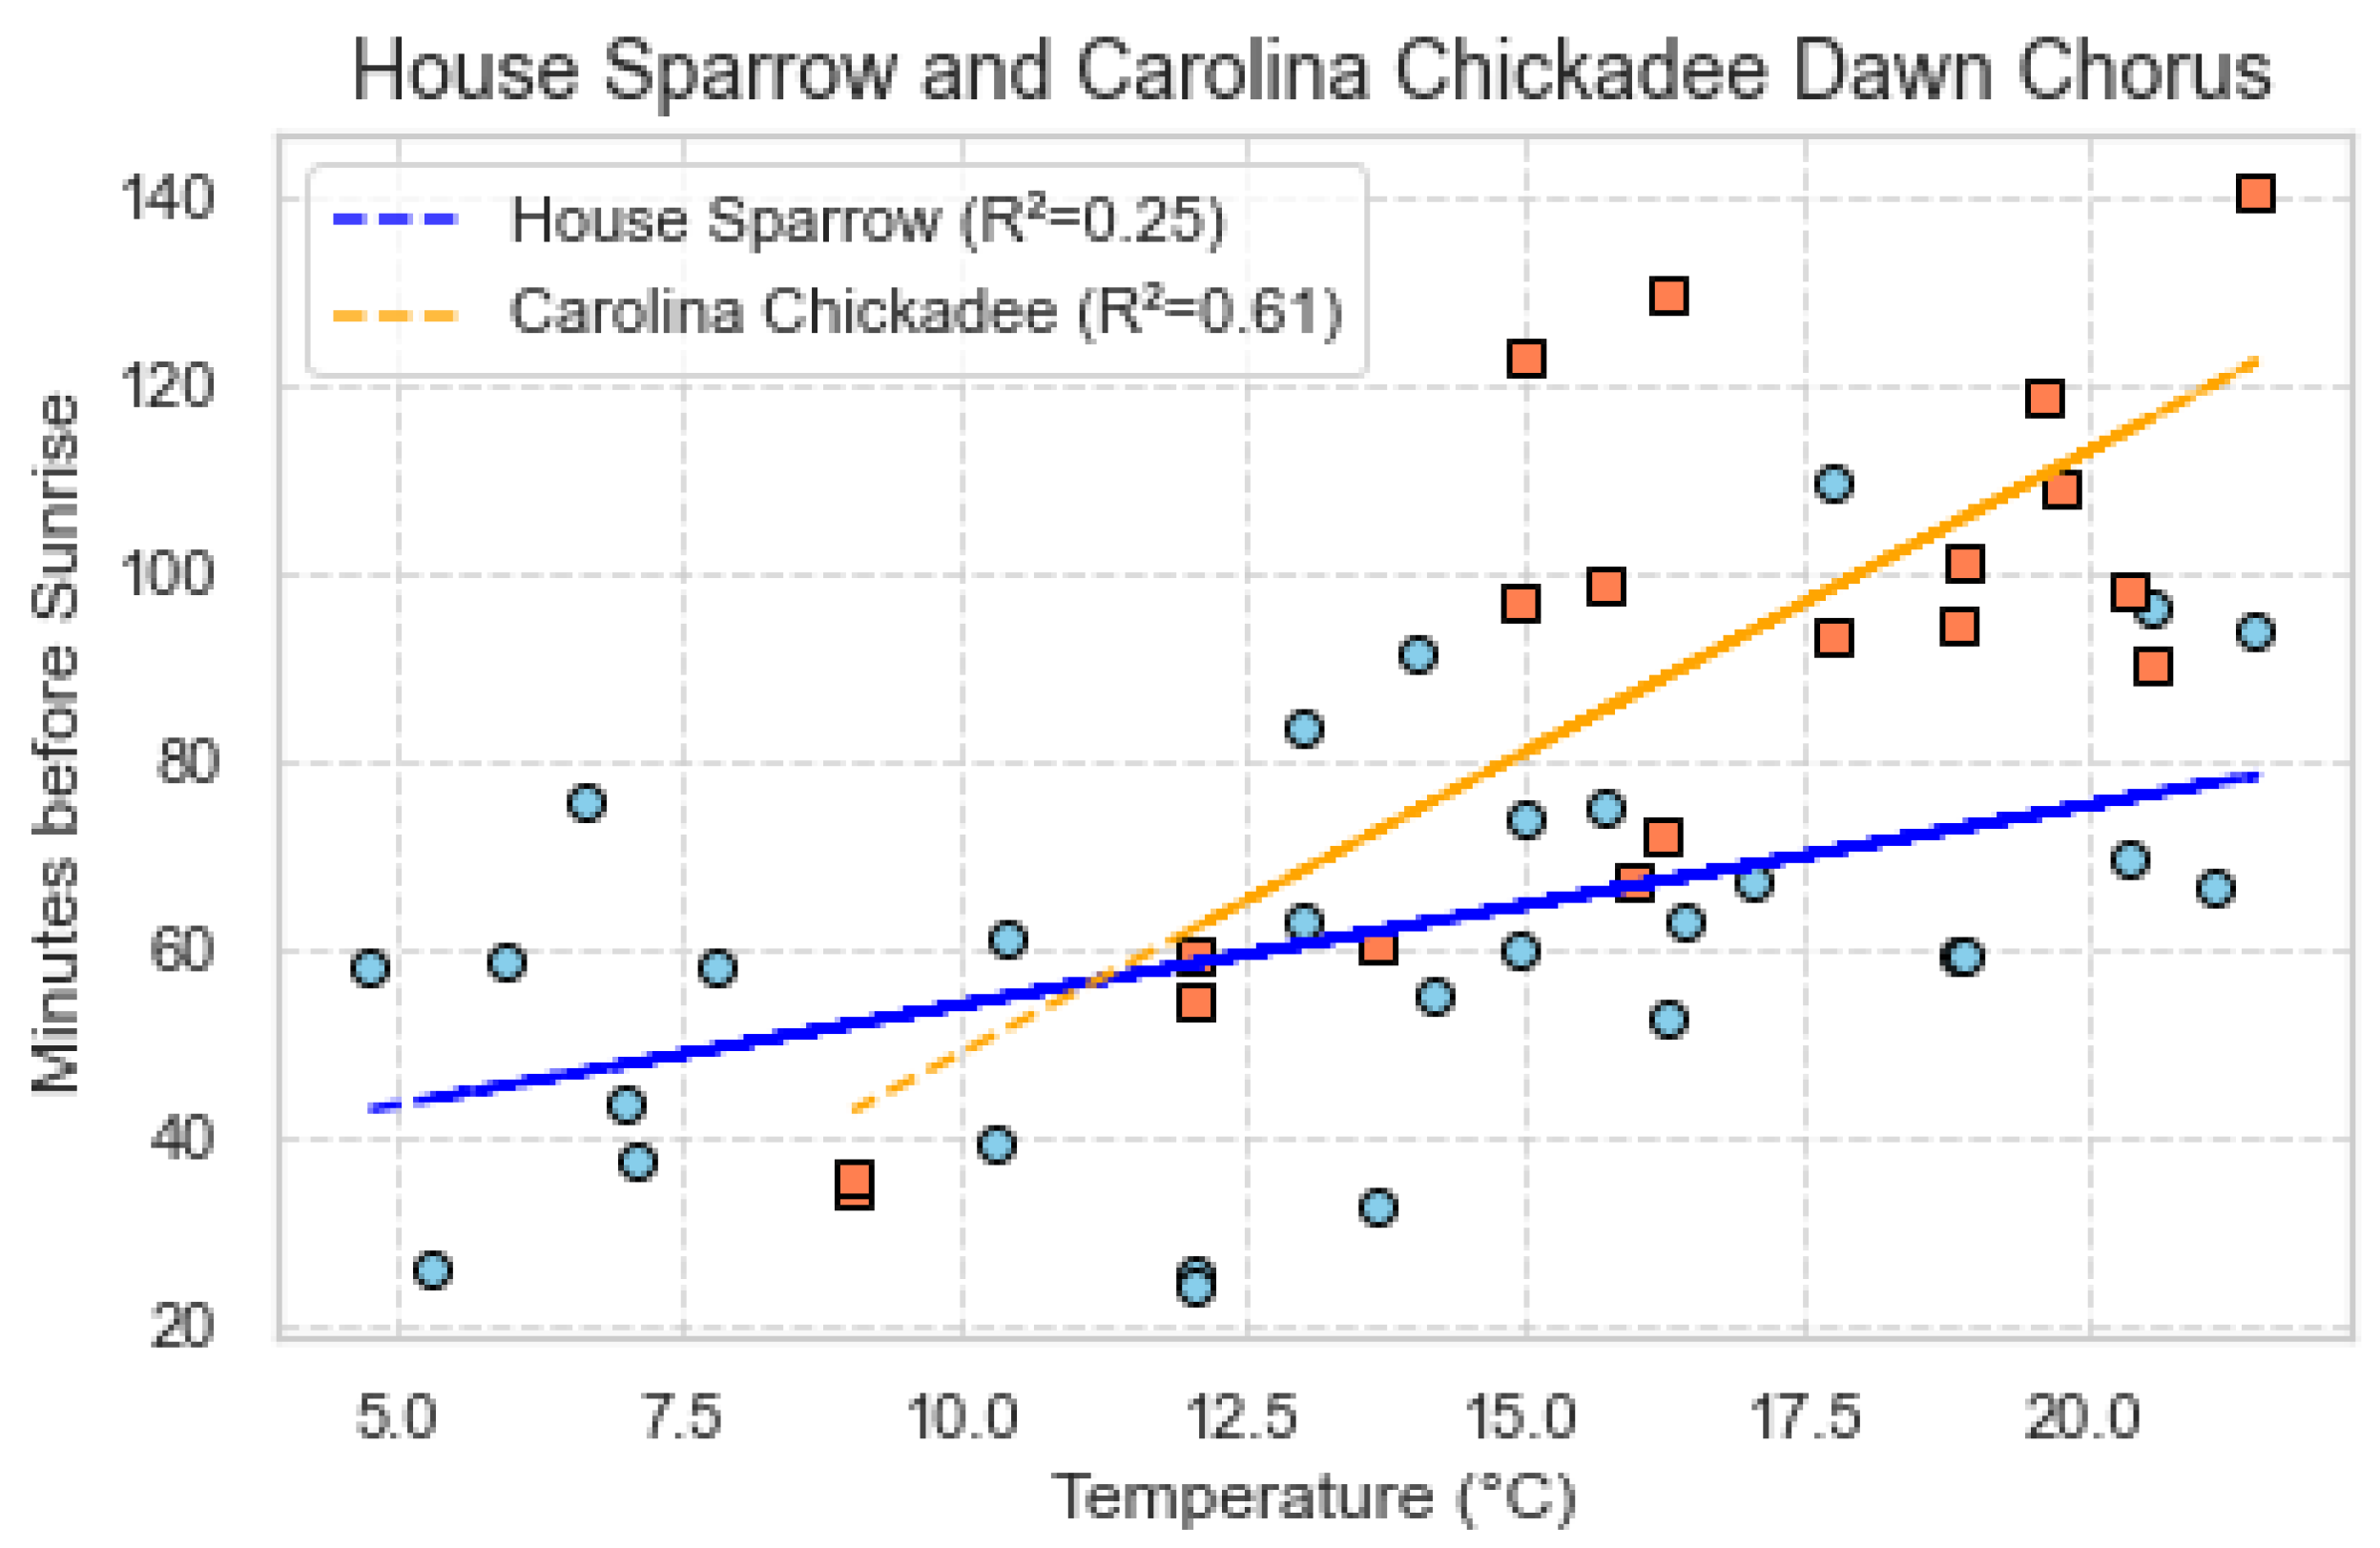
Figure 9.
Correlation plot of the number of bird calls from top 17 bird species as the predictor variables, along with the humidity as the target variable. Positively correlated variable are indicated by a red box, negatively correlated variables are indicated by blue box
Figure 9.
Correlation plot of the number of bird calls from top 17 bird species as the predictor variables, along with the humidity as the target variable. Positively correlated variable are indicated by a red box, negatively correlated variables are indicated by blue box
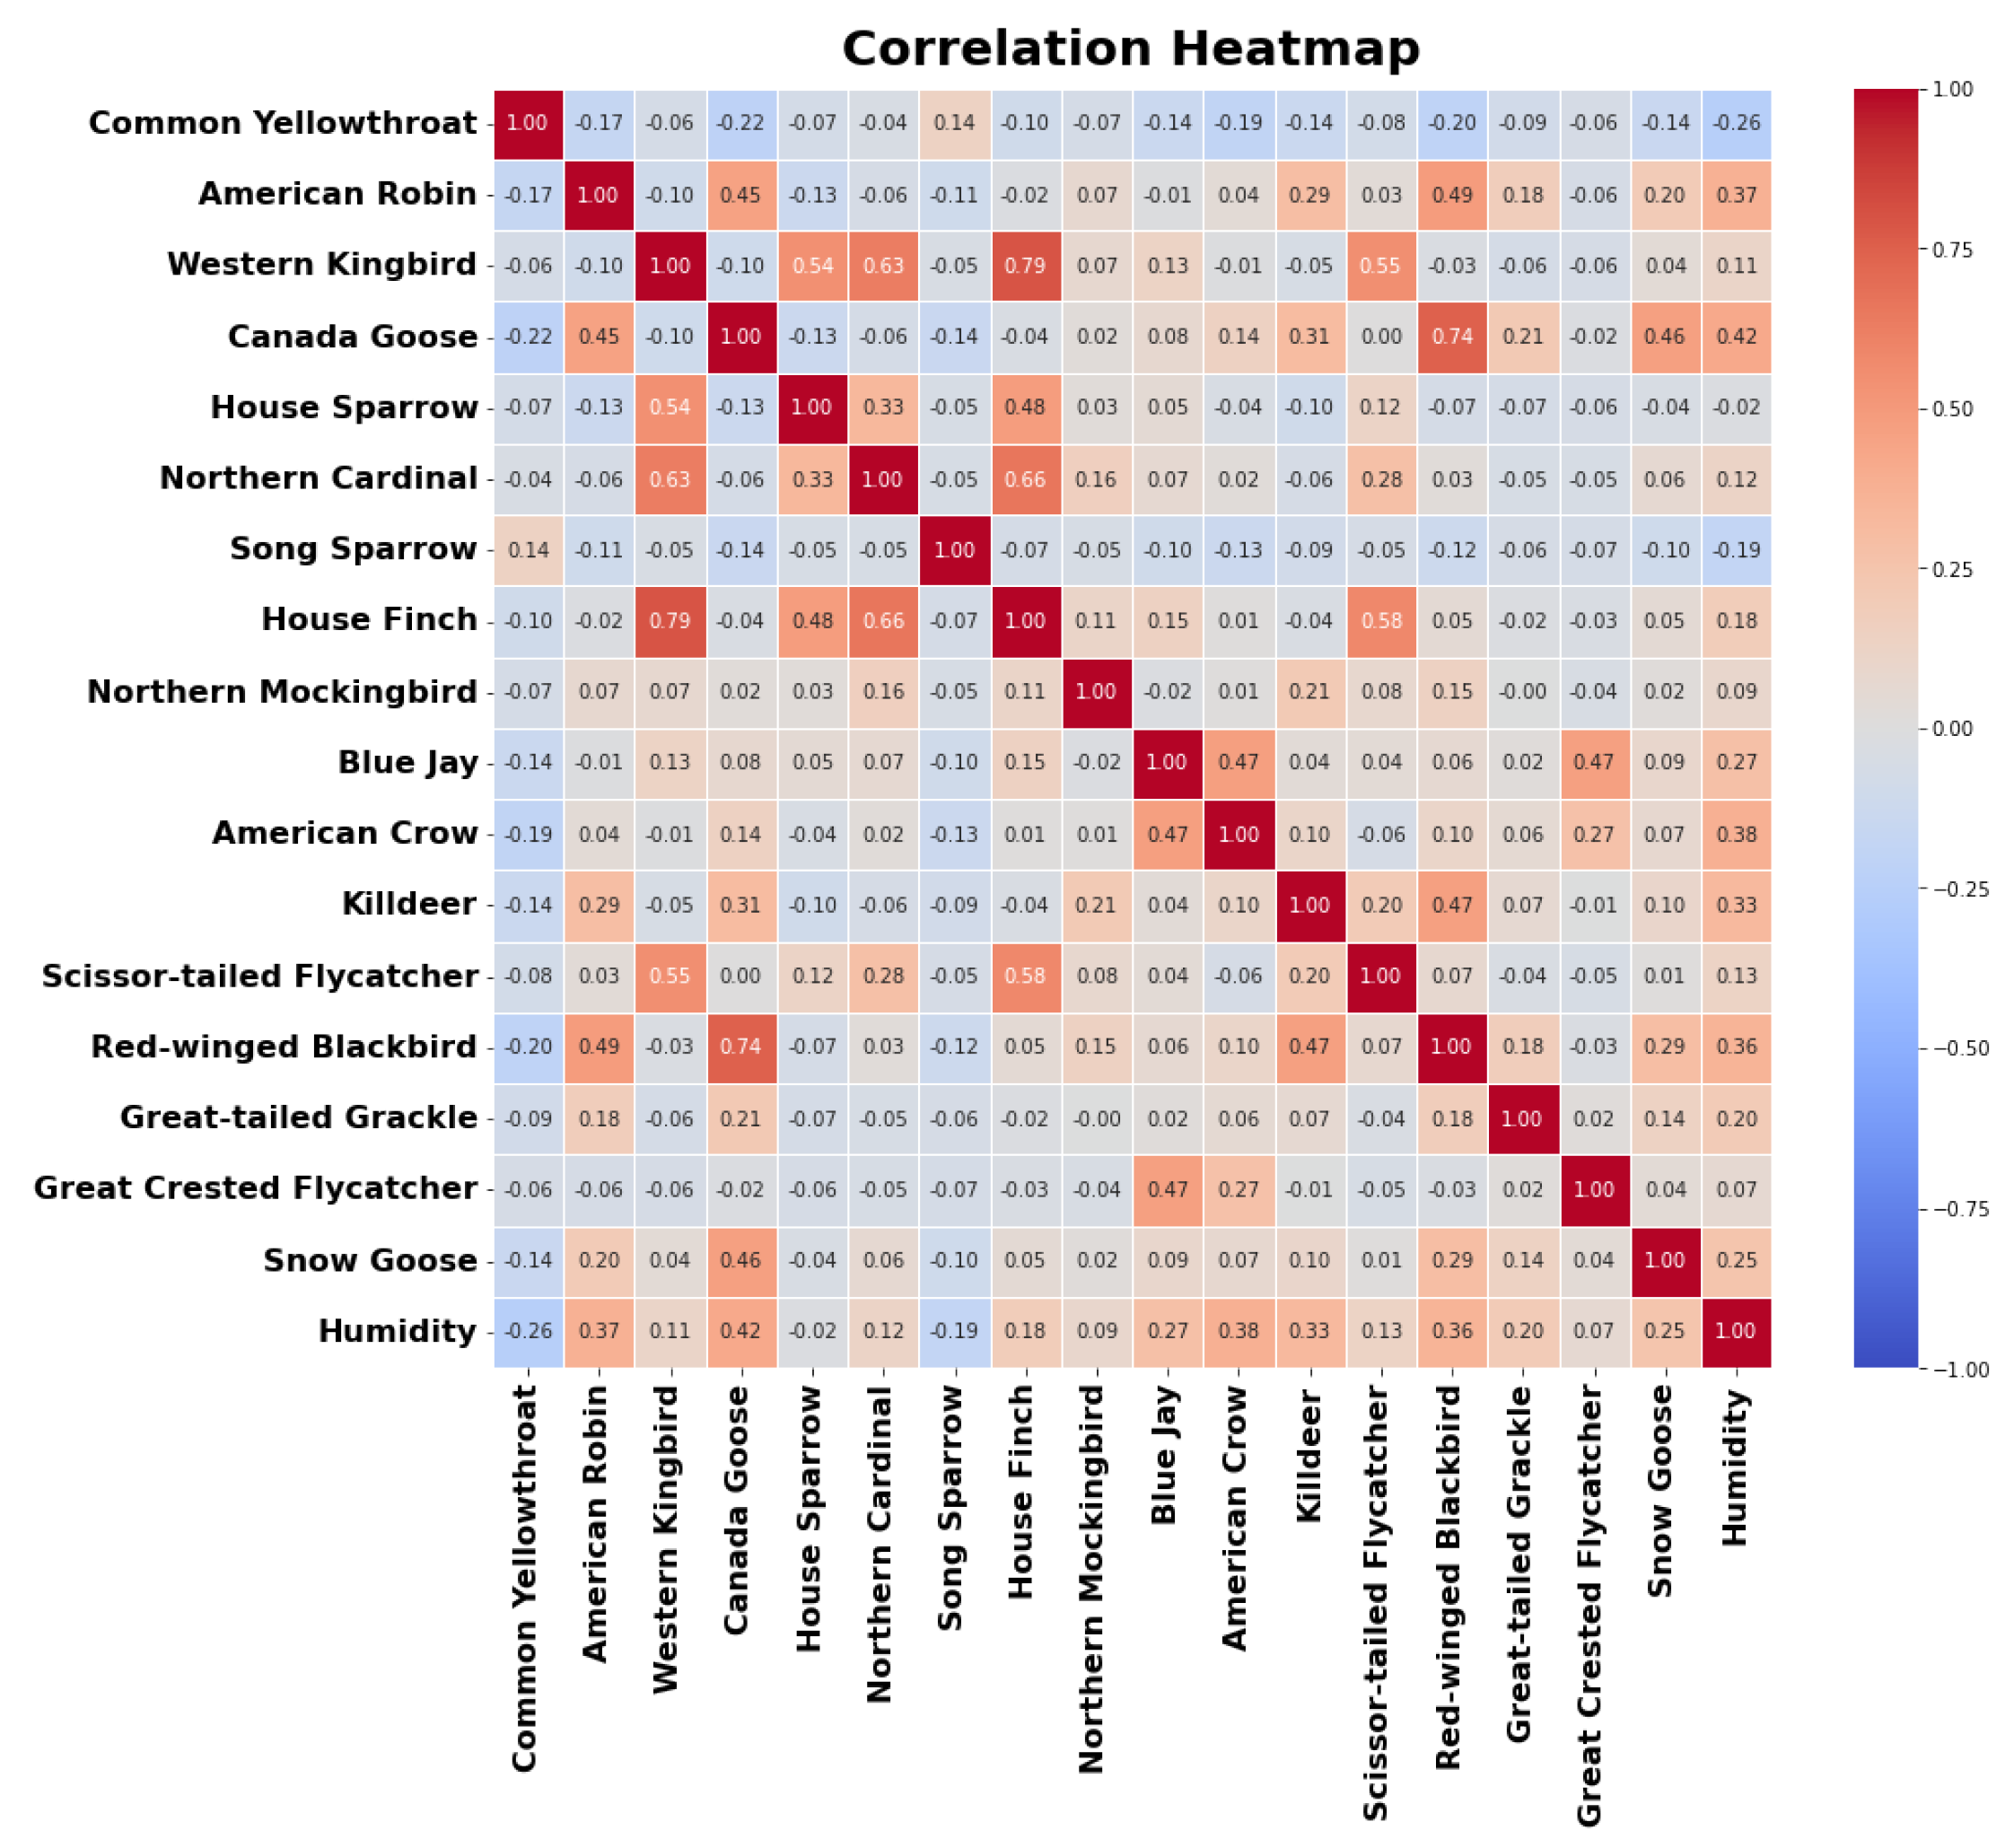
Figure 10.
(a) Scatter plot of predicted vs true humidity values. A perfect fit is indicated by the 1:1 line shown in blue. Training data are shown as blue circles and test data are plotted as red plues (b) Feature importance ranking for the Random Forest Model (estimating humidity)
Figure 10.
(a) Scatter plot of predicted vs true humidity values. A perfect fit is indicated by the 1:1 line shown in blue. Training data are shown as blue circles and test data are plotted as red plues (b) Feature importance ranking for the Random Forest Model (estimating humidity)
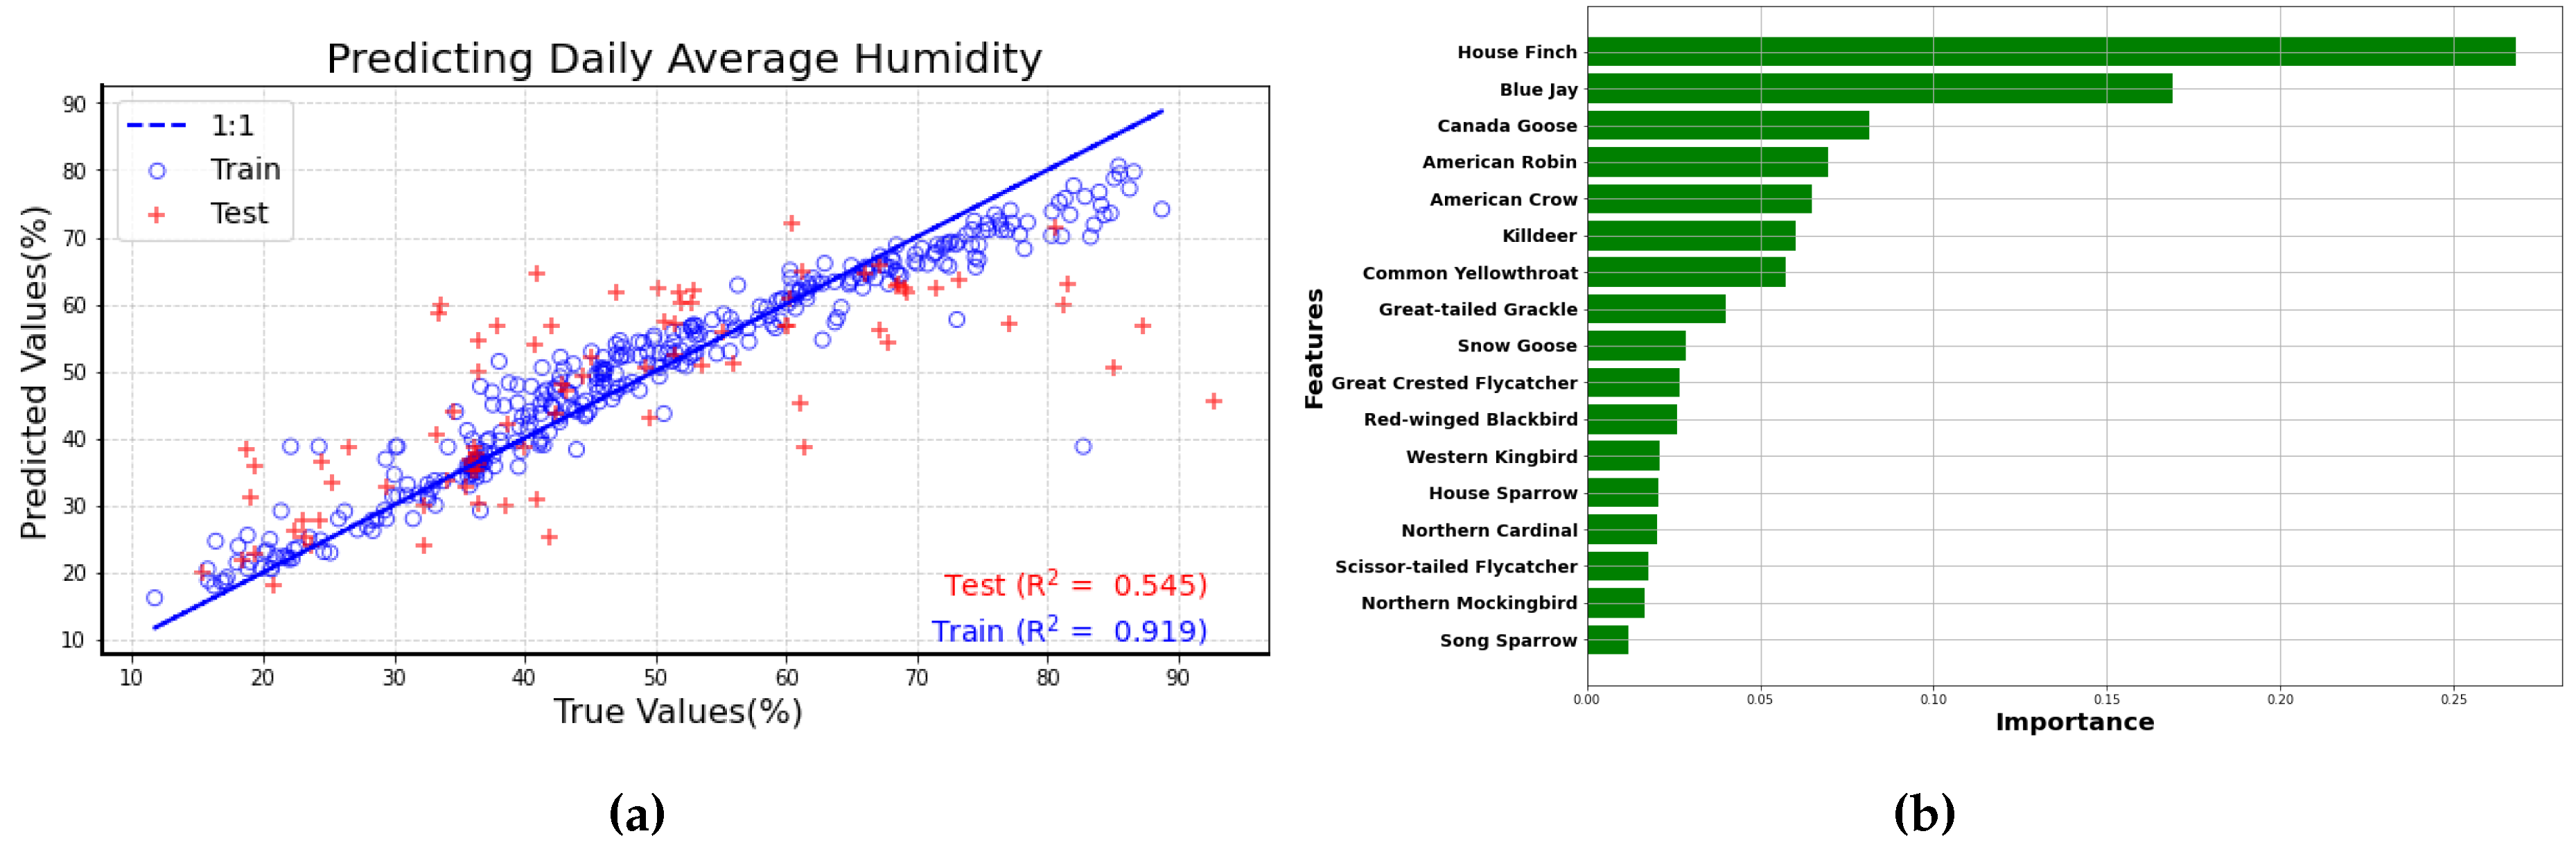
Figure 11.
Correlation plot of the number of bird calls from top 97 bird species as the predictor variables, along with the blue light intensity and red light intensity as the target variables. Positively correlated variable are indicated by a red box, negatively correlated variables are indicated by blue box)
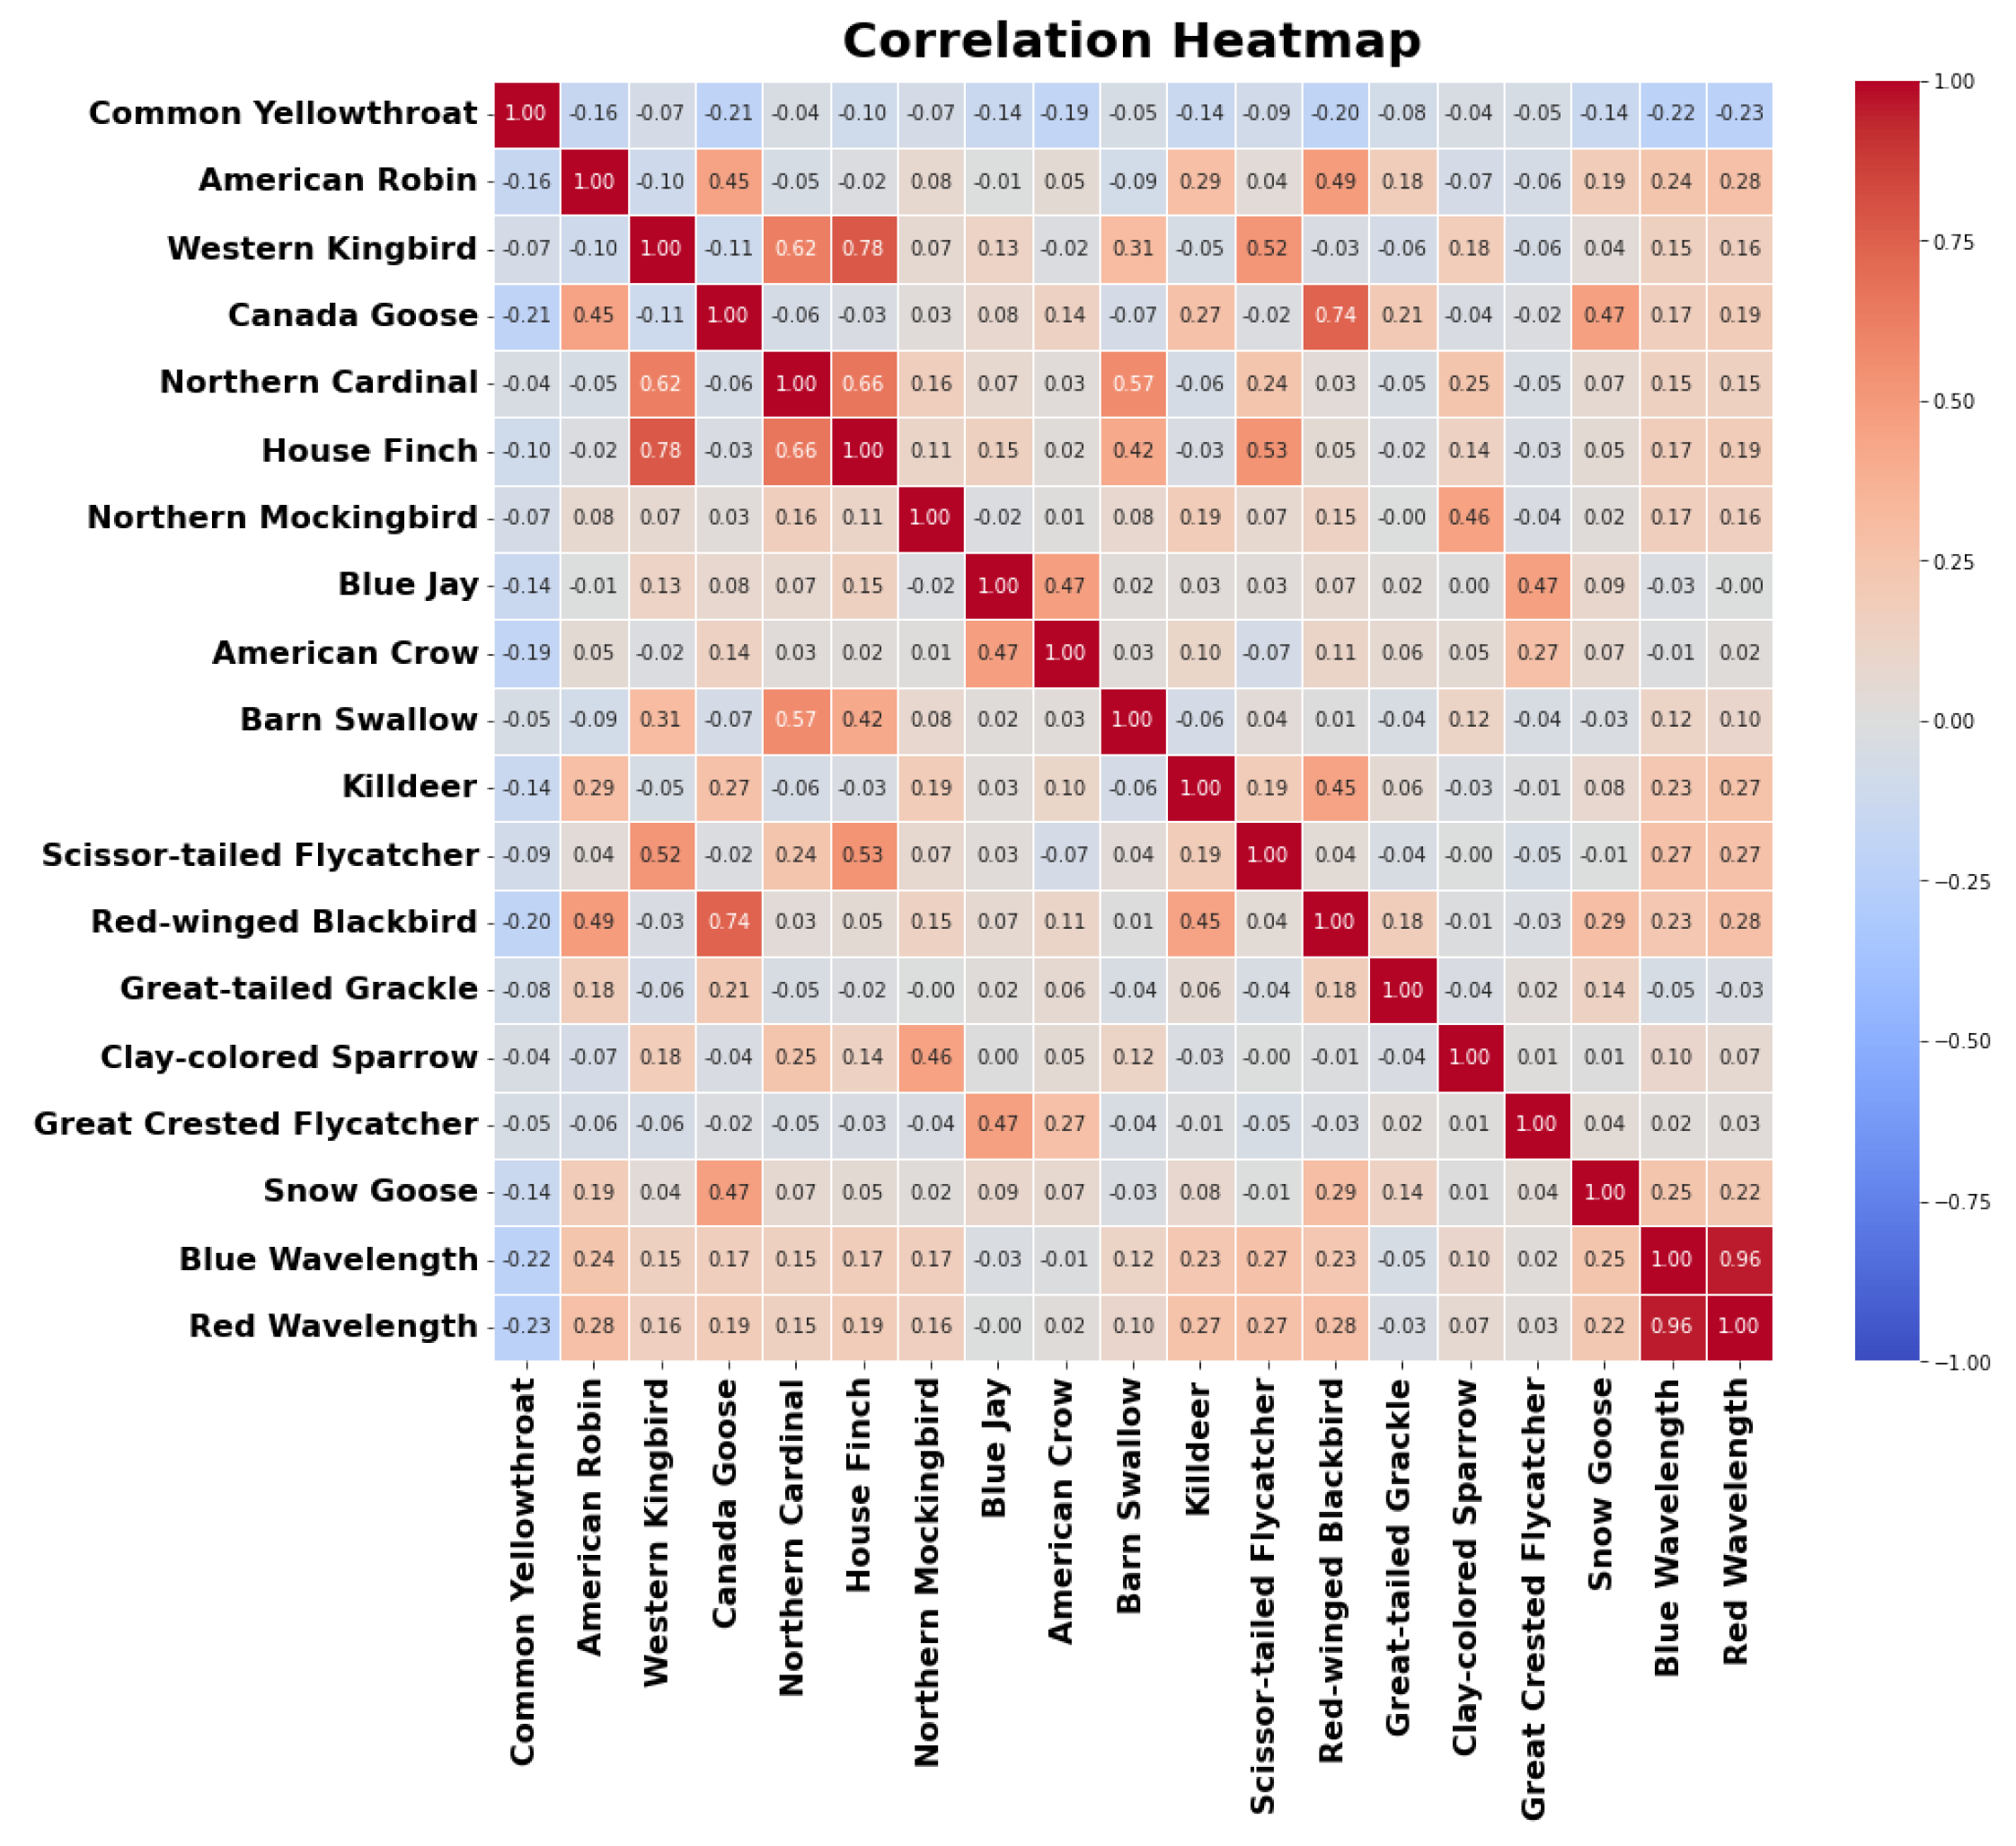
Figure 12.
(a) Scatter plot of predicted vs true blue wavelength intensities values. A perfect fit is indicated by the 1:1 line shown in blue. Training data are shown as blue circles and test data are plotted (b) Scatter plot of predicted vs true red wavelength intensities values. A perfect fit is indicated by the 1:1 line shown in blue. Training data are shown as blue circles and test data are plotted
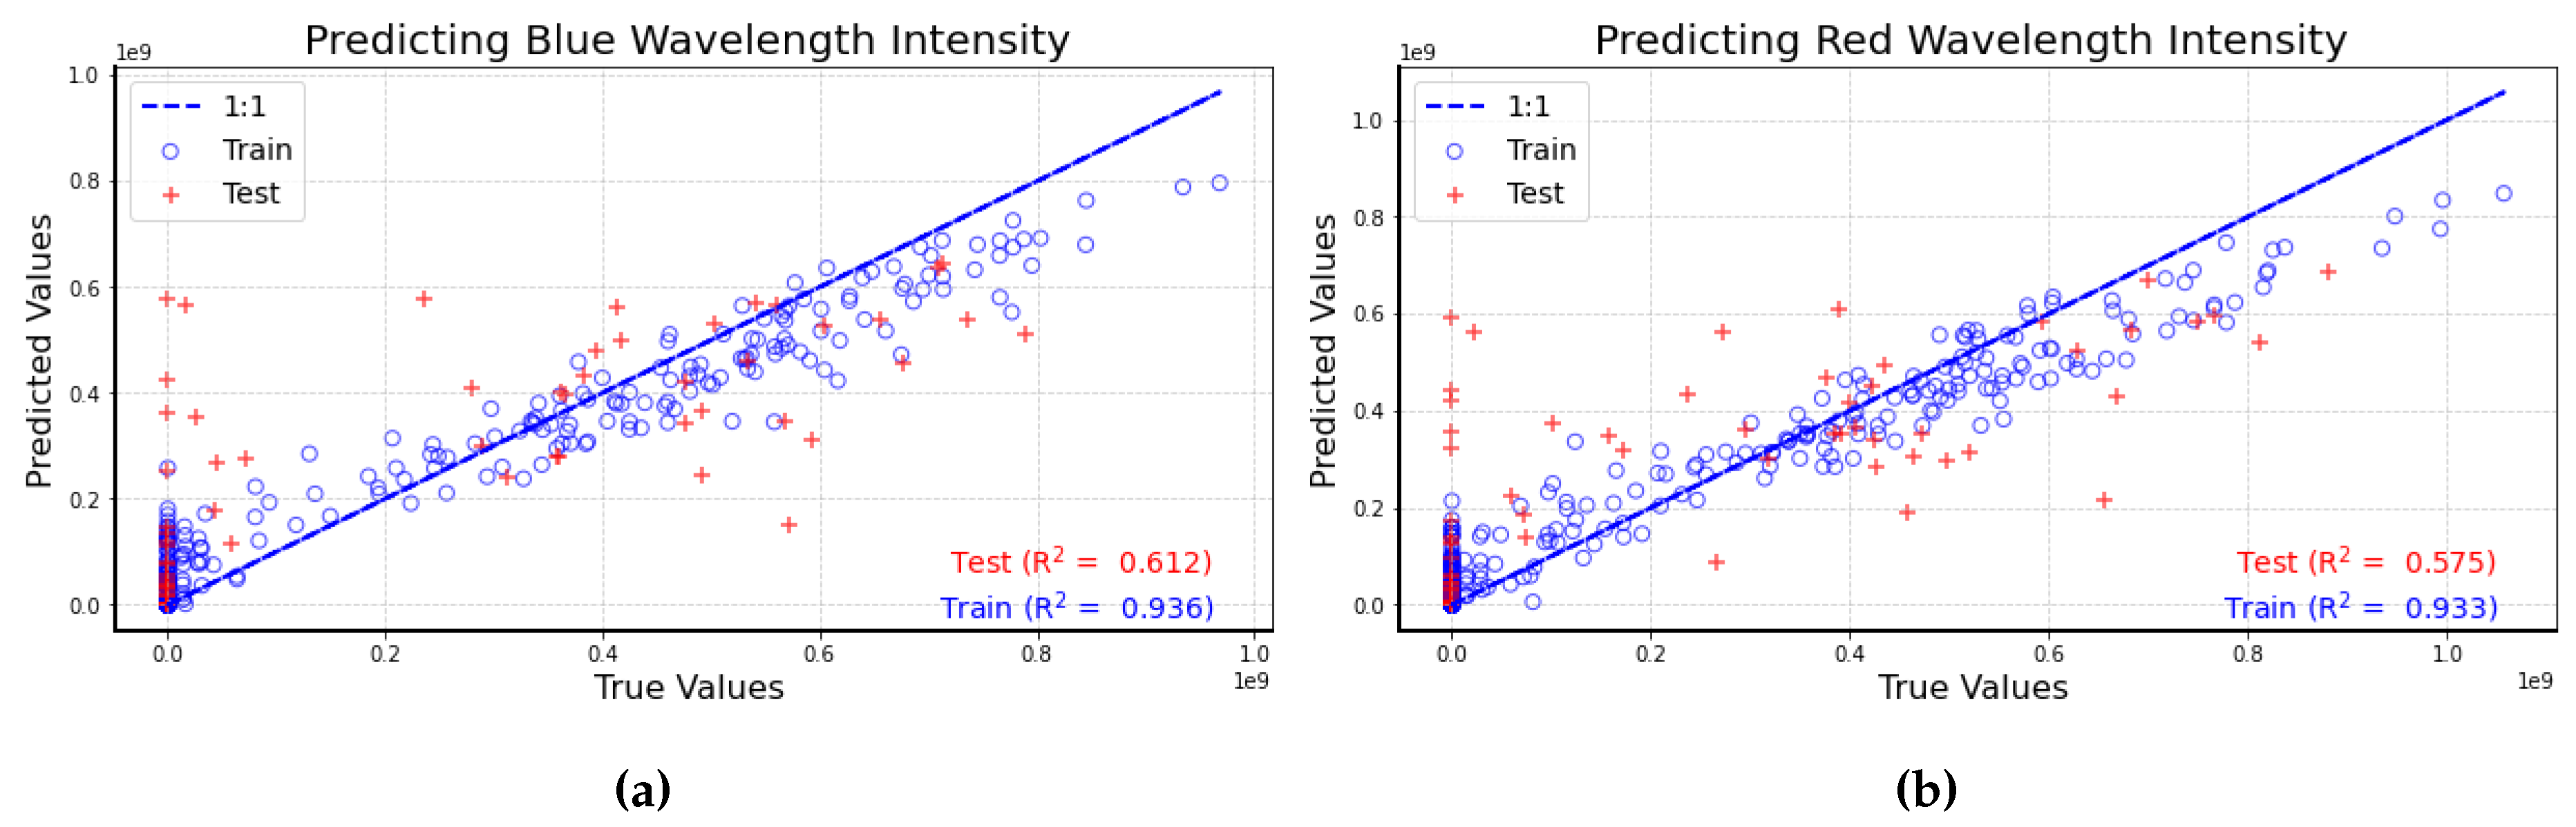
Figure 13.
Feature importance ranking for the Random Forest Model (a) estimating blue wavelength intensity (b) estimating red wavelength intensity
Figure 13.
Feature importance ranking for the Random Forest Model (a) estimating blue wavelength intensity (b) estimating red wavelength intensity
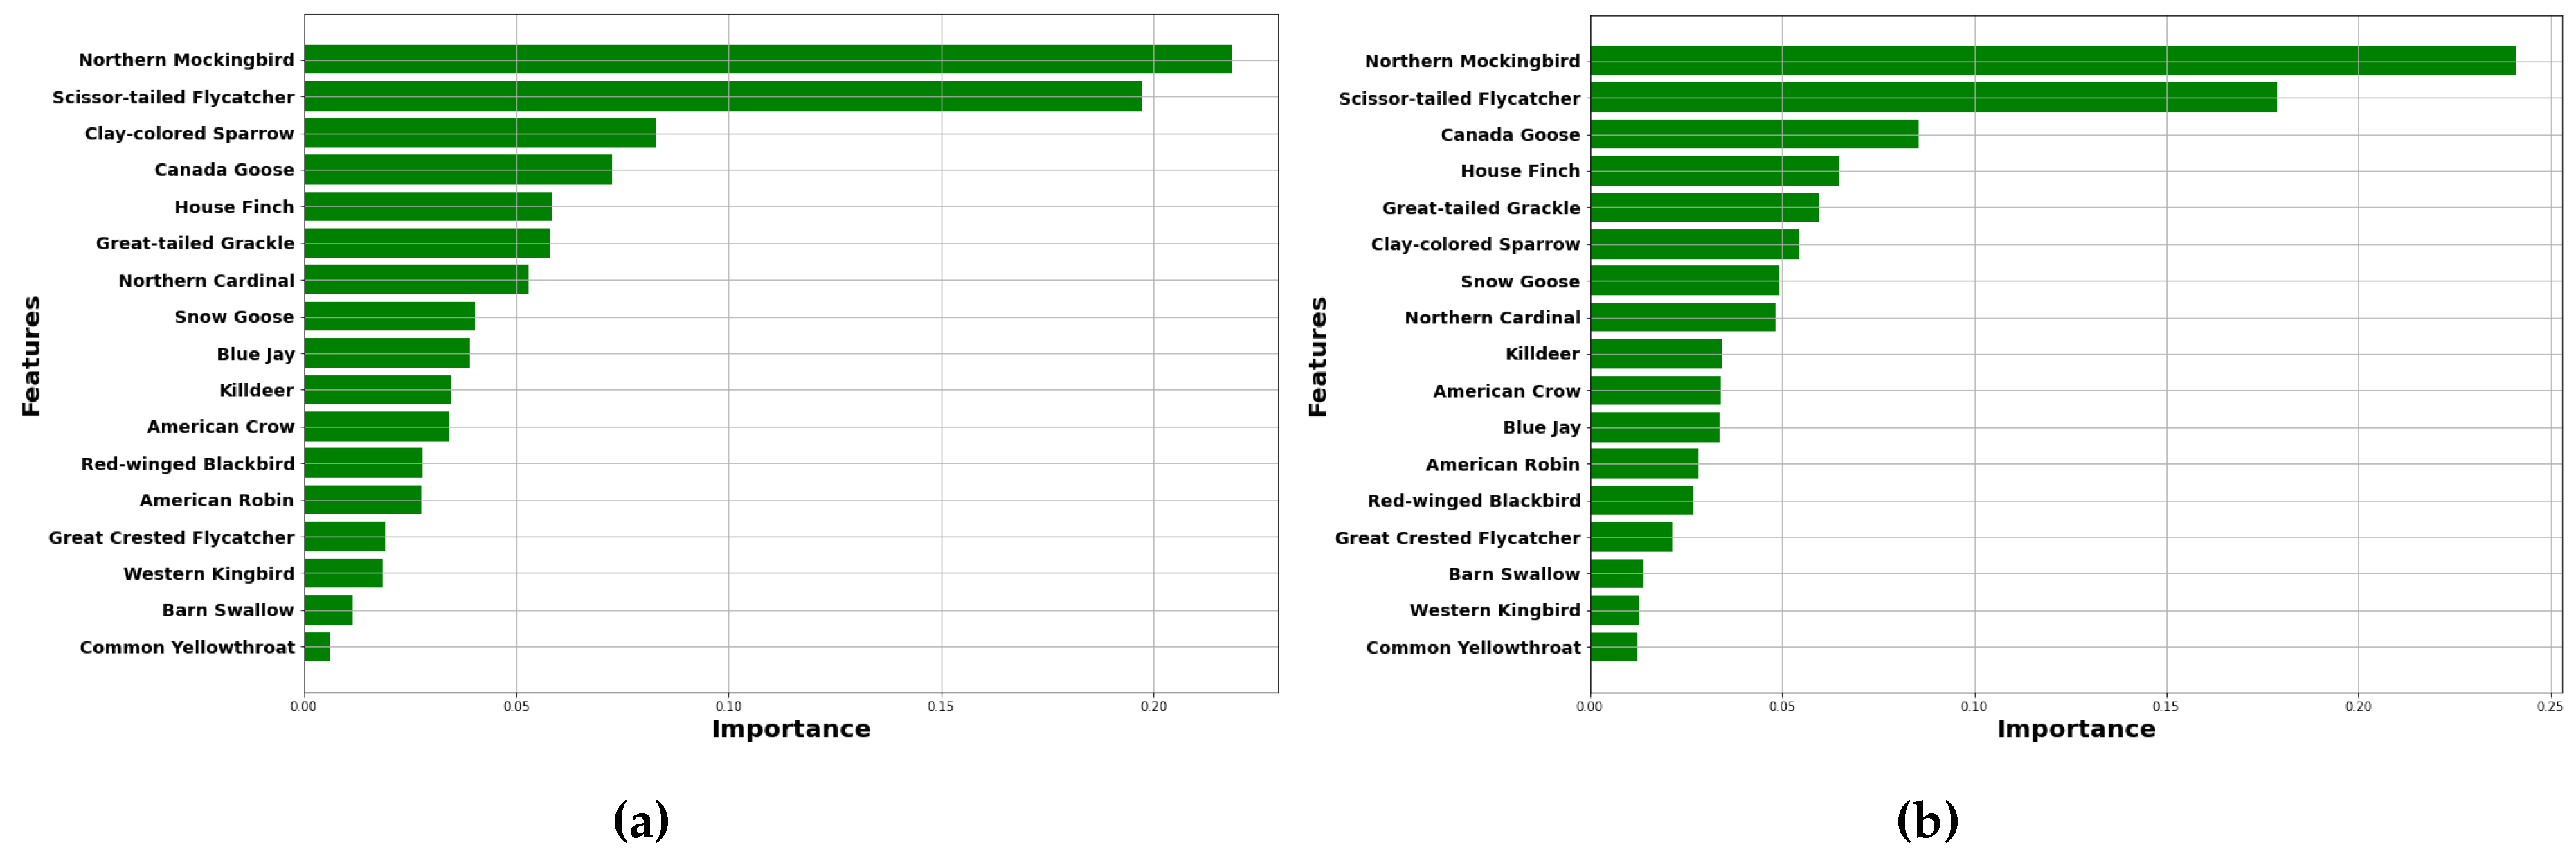
Figure 14.
Overall caption for all figures
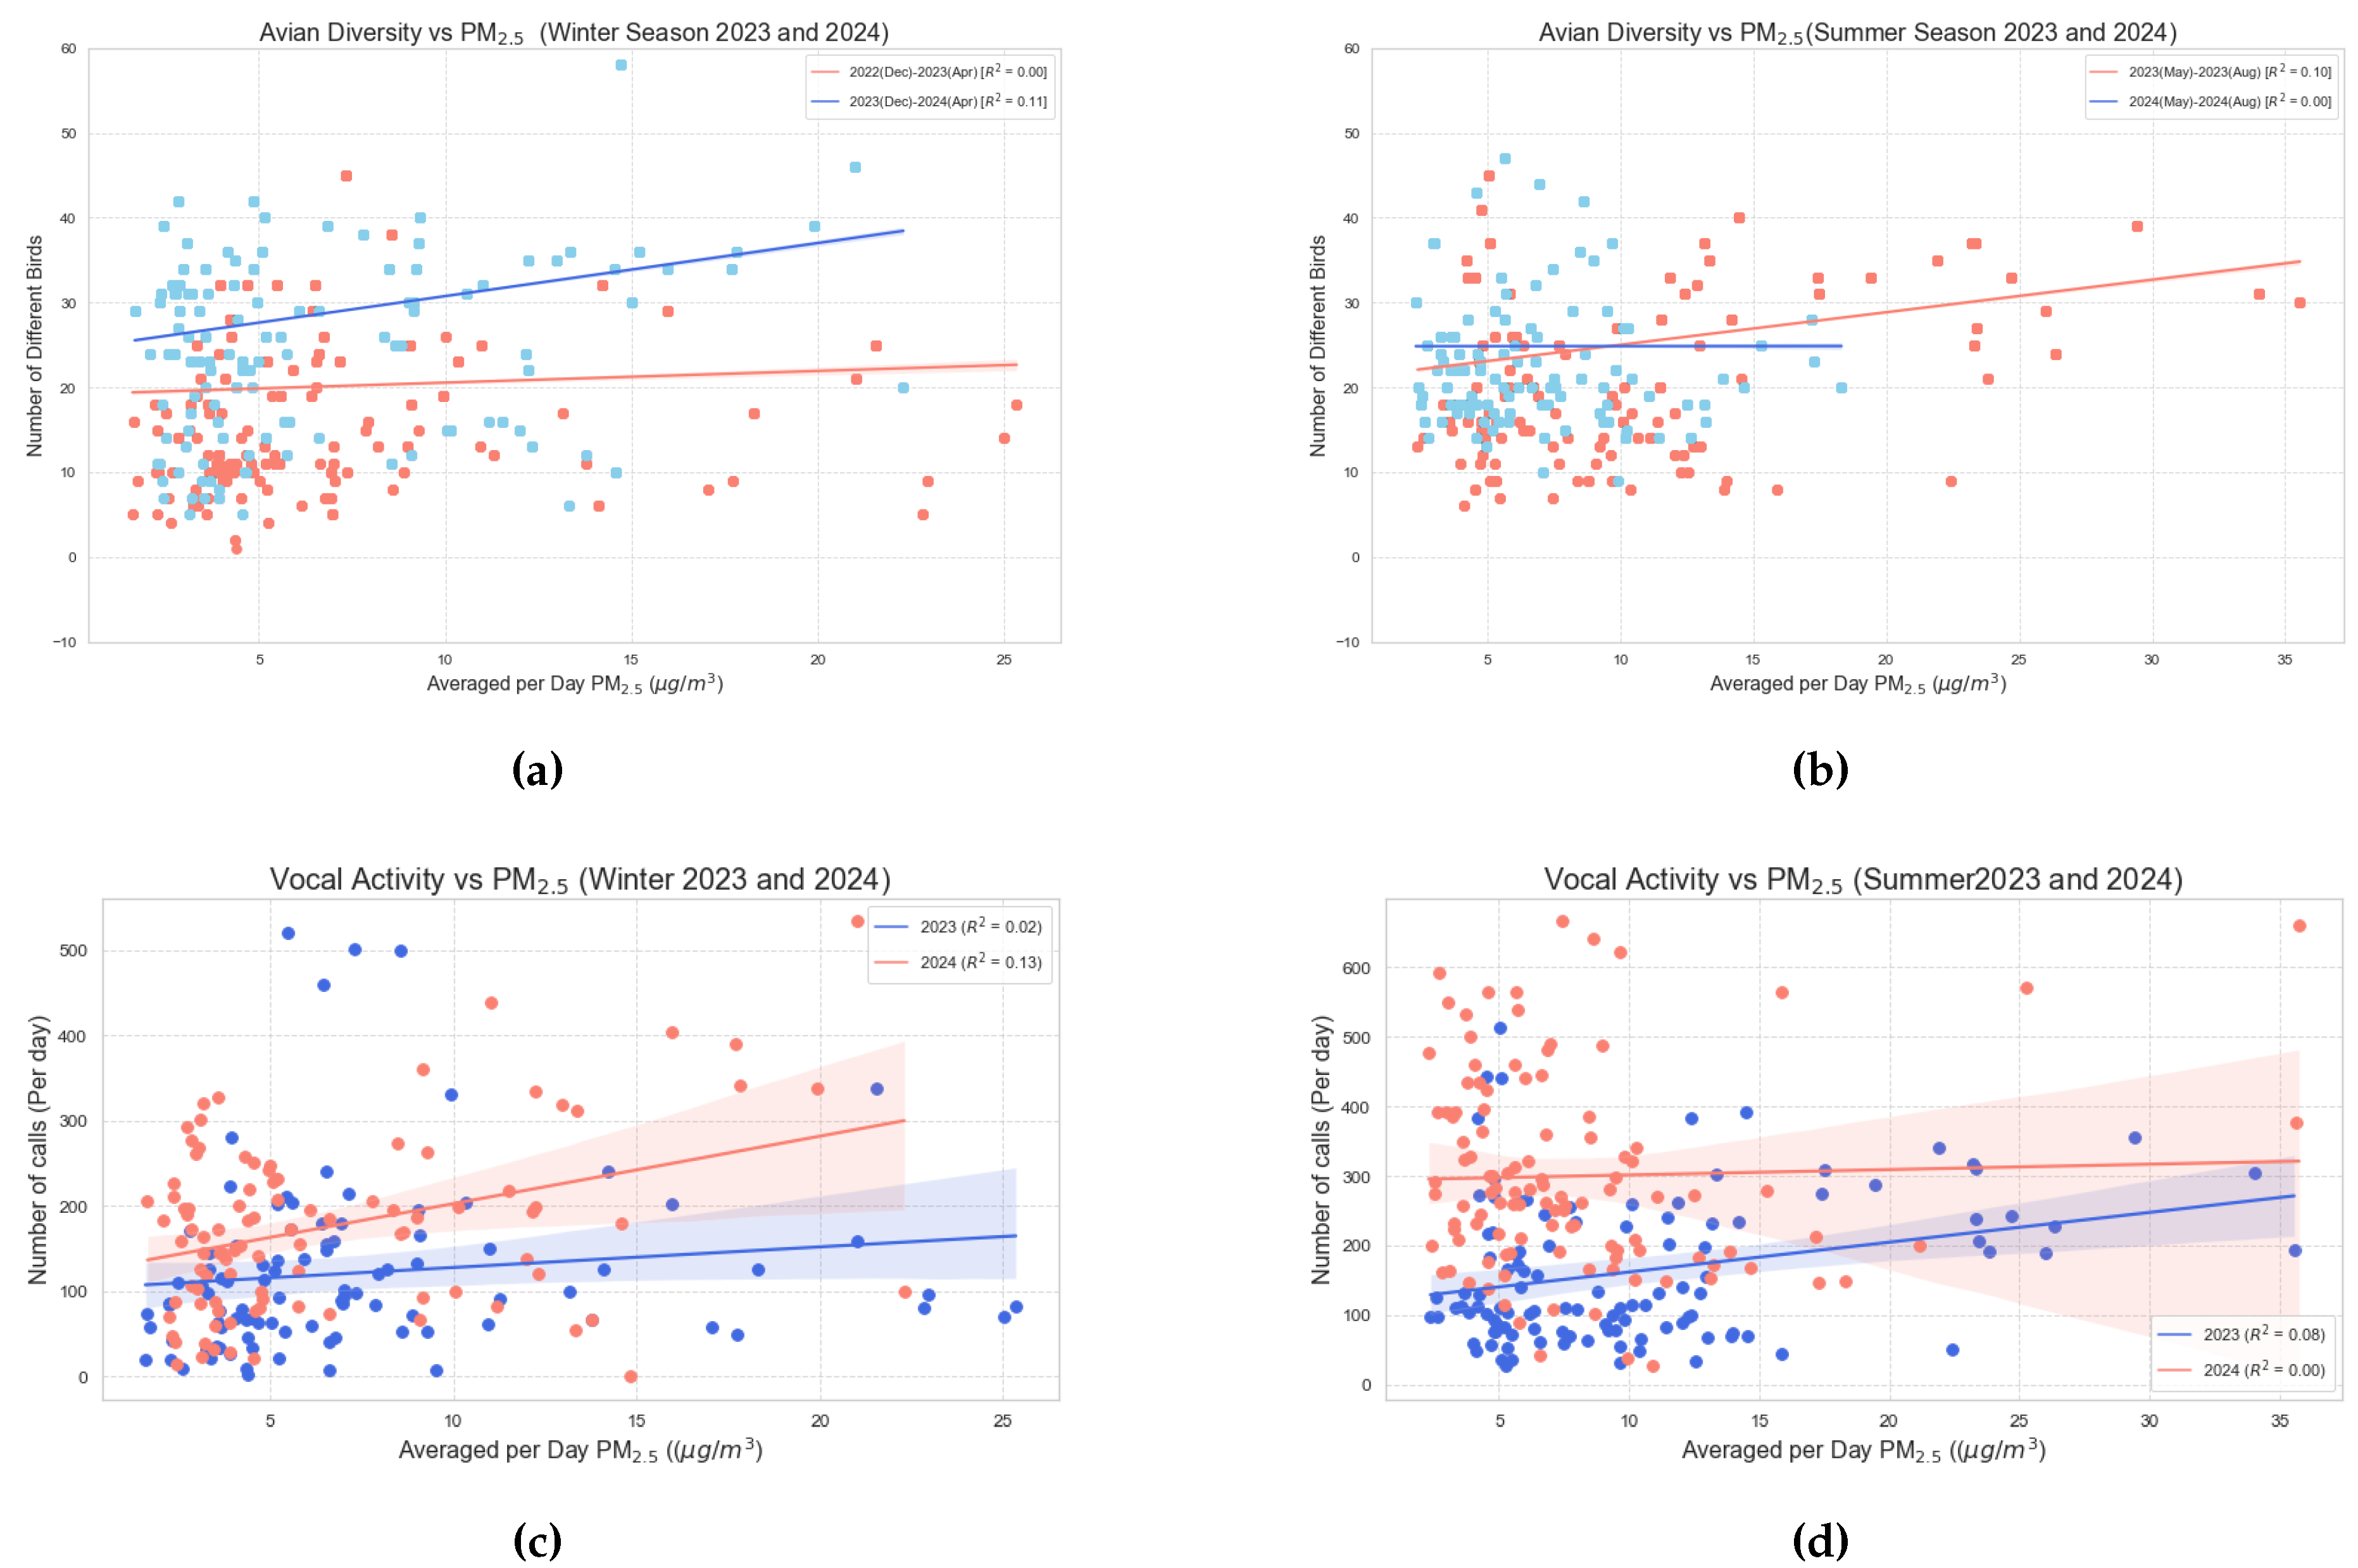

Table 1.
Correlation Analysis of Avian Diversity with Temperature.
| Season | Pearson Correlation Coefficient | p-value< | |
| Winter[Dec(2022) - April(2023)] | 0.654 | 0.43 | 0.001 |
| Winter[Dec(2023) - April(2024)] | 0.798 | 0.64 | 0.001 |
| Summer[May(2023) - Aug(2023)] | -0.630 | 0.40 | 0.001 |
| Summer[May(2024) - Aug(2024)] | -0.336 | 0.11 | 0.002 |
Table 2.
Correlation Analysis of Vocal Activity with Temperature.
| Season | Pearson Correlation Coefficient | p-value< | |
| Winter[Dec(2022) - April(2023)] | 0.55 | 0.30 | 0.001 |
| Winter[Dec(2023) - April(2024)] | 0.700 | 0.49 | 0.001 |
| Summer[May(2023) - Aug(2023)] | -0.553 | 0.31 | 0.001 |
| Summer[May(2024) - Aug(2024)] | -0.120 | 0.01 | 0.002 |
Table 3.
Correlation Analysis of Avian Diversity with .
| Season | Pearson Correlation Coefficient | p-value< | |
| Winter[Dec(2022) - April(2023)] | 0.069 | 0.00 | 0.001 |
| Winter[Dec(2023) - April(2024)] | 0.332 | 0.11 | 0.001 |
| Summer[May(2023) - Aug(2023)] | 0.315 | 0.10 | 0.001 |
| Summer[May(2024) - Aug(2024)] | 0.050 | 0.00 | 0.001 |
Table 4.
Correlation Analysis of Vocal Activity with .
| Season | Pearson Correlation Coefficient | p-value< | |
| Winter[Dec(2022) - April(2023)] | 0.125 | 0.02 | 0.218 |
| Winter[Dec(2023) - April(2024)] | 0.365 | 0.13 | 0.001 |
| Summer[May(2023) - Aug(2023)] | 0.284 | 0.08 | 0.003 |
| Summer[May(2024) - Aug(2024)] | 0.030 | 0.00 | 0.753 |
Disclaimer/Publisher’s Note: The statements, opinions and data contained in all publications are solely those of the individual author(s) and contributor(s) and not of MDPI and/or the editor(s). MDPI and/or the editor(s) disclaim responsibility for any injury to people or property resulting from any ideas, methods, instructions or products referred to in the content. |
© 2024 by the authors. Licensee MDPI, Basel, Switzerland. This article is an open access article distributed under the terms and conditions of the Creative Commons Attribution (CC BY) license (http://creativecommons.org/licenses/by/4.0/).
Copyright: This open access article is published under a Creative Commons CC BY 4.0 license, which permit the free download, distribution, and reuse, provided that the author and preprint are cited in any reuse.


