
Submitted:
03 November 2024
Posted:
04 November 2024
You are already at the latest version
Abstract
Cereals are essential for global food consumption, providing half of the world’s calorie intake and ranking as the top traded agricultural commodity. By 2032, 41% of cereals are expected to be consumed directly by humans, with 37% used as animal feed. As key sources of carbohydrates, protein, minerals, vitamins, and fiber, cereals deliver balanced nutrients for humans and livestock. Rice and wheat are the most widely consumed, yet over 3 billion people still suffer from micronutrient deficiencies, particularly iron, zinc, and vitamin A, leading to widespread malnutrition affecting over 2 billion globally. Nutrient deficiencies contribute significantly to childhood mortality, with undernutrition causing 45% of deaths in children under five. Cereals naturally contain essential micronutrients, including iron, zinc, and B vitamins, along with fiber that supports cardiovascular health and reduces cancer risks. While the growth rate of cereal consumption is slowing, it remains steady, especially in developing countries, where cereals provide 56% of daily caloric intake. To address malnutrition, biofortifying cereals to enhance iron, zinc, and vitamin A content could be transformative. This review highlights the nutritional importance of cereals, the need for balanced diets, and how biofortification and genetic editing can combat global malnutrition.
Keywords:
Cereals
; Dietary fiber
; Malnutrition
; micronutrients
; Nutritional values
; Minerals
; Vitamins
1. Introduction
Grains, either directly or indirectly, are the foundation of most of the food we consume. The three major cereal grains-rice, wheat, and maize-serve as staple foods, providing a primary source of carbohydrate-based energy, protein, vitamins, minerals, fiber, etc. Besides, they are essential for cattle, fish, and poultry feed production and have a wide range of other applications, including the creation of bioethanol for fuel. Further, other grains particularly, durum, triticale, maize, barley, foxtail millet, oats, etc. also play important roles in meeting the growing global population’s food demand. Wheat, also mostly known as bread wheat, is grown all over the world and contains higher calories, protein, fiber, vitamins, and minerals than other cereals. Wheat and maize are the most traded cereal crops in the international agricultural food market. They are considered a good source of nutritional value [1]. Rice is the second staple food of the world’s people. Rice is also the first staple food of many middle- and low-income countries in Asia. Over 3.0 billion individuals suffer from micronutrient deficiencies, particularly iron, zinc, vitamin B complex, and vitamin A [2]. Moreover, malnutrition is a critical problem in the world, and even in Bangladesh because of feeding mostly rice, there is almost no food habit variation. Worldwide, malnutrition, encompassing obesity, overweight, and underweight, affects over 2 billion people [3]. Undernutrition is linked to 45% of all deaths among children under the age of five. In 2020, approximately 150 million children under the age of five worldwide were affected by stunting [4]. In 2019, vitamin A deficiency and zinc deficiency caused around 23800 deaths [5] and 2810 deaths [6] (IHME, 2024) of children under five years of age, respectively.
In Bangladesh, 35% of the population continues to experience food insecurity [7]. Severe acute malnutrition impacts 600,000 children [8]. Anemia impacts 43% of children aged six months to five years, indicating a significant prevalence of this condition in a crucial developmental stage. This deficiency can hinder physical growth, cognitive development, and overall health, underscoring the need for targeted nutritional interventions to address the underlying causes and improve the well-being of young children [9] (WBG, 2024). Twenty-eight percent of children under the age of five are affected by stunting [10] (USAID. 2024). Ten percent of children under the age of five are classified as wasted. Twenty-three percent of children under the age of five are underweight. One-third of ever-married women are underweight, and approximately 13% have short stature. These conditions heighten the risk of difficult childbirth and contribute to low-birth-weight infants [11]. Approximately half of all women experience anemia, with most cases stemming from nutritional deficiencies [12]. Malnutrition is estimated to cost Bangladesh over US$1.0 billion each year in lost productivity [13].
The deaths of diabetes patients have increased by 3% between 2000 and 2019 in the world and 537 million people worldwide are suffering from diabetes [14,15]; and in 2021 6.7 million people died with diabetes [15] (IDF, 2024). Bangladesh is not beyond it. A study showed that in the country between 1994 and 2013, 4.5% to 35% of people were attacked with diabetes [16] (Biswas et al. 2013), and it will reach 22.3 million in 2045 [17] (Cho et al., 2018). Further, in Bangladesh, nearly 13.1 million people are suffering from diabetes which is the 8th position in the world, and by 2045, it will project to 22.3 million and stand in the 7th position in the world [18] (NGDM, 2023). In addition, the total number of diabetes-related deaths was about 76 thousand in the country in 2021. Yearly 273 kg of rice per capita of Bangladesh is fed, and insufficient fruits and vegetables pose a serious risk to the country's people with diabetes since people feed less than five servings (400g) of fruits and vegetables [13,19,20]. The pooled prevalence of pre-diabetes in the country is slightly higher than that of diabetes. One possible reason for this is the shift of the Bangladeshi labor force from agriculture to manufacturing, services, and industry, leading to a significant decline in people's energy expenditure, and developed also transport, and communication in the rural and urban areas. This reduction in energy output, combined with increased energy intake due to sedentary lifestyles, results in increased obesity and insulin resistance, thereby elevating the risk of pre-diabetes [21]. Urbanization in Bangladesh has been ongoing, with an increment from 29% in 2008 to 36.6% in 2018. The pooled prevalence of diabetes in urban populations is significantly higher (11.5%) compared to rural populations (6.2%) [22]. This urbanization is associated with changes in eating habits, physical activity, exercise, smoking, and alcohol consumption, all of which are risk factors for obesity and diabetes. The results also indicate that the pooled prevalence of diabetes is slightly higher among men (7.34%) than among women (6.70%). Over the last two decades, the prevalence of diabetes has increased 2.5 times, from 4.0% in 1995-2000 to 10.4% in 2010-2019 [23]. The results alarm us that massive programs have to be taken to increase wheat, triticale. Durum, maize, barley, foxtail millet, oats, sorghum, etc. production and popularize their products for the whole country's people, and also among the world. Bangladesh is the smallest country in the world and stands 90th in the area, oppositely occupying 8th position in population density (approximately 1700 million people live there) [24]. The large farm areas possess the BADC for seed production [25]. The target of seed production of cereal crops must be revised as the seed requirement of their cultivators. Further, cereal crop production technology and their management packages need to be extended to farmers. For this, farmers, extension workers, personnel of seed companies, and the representatives of NGOs relating to cereal crop cultivation and seed production are trained in cereal crop production technologies, seed production, processing, storing, etc. The farmers have to discourage rice cultivation since it contains higher CHO (12-14%), lower protein (6-7%), vitamins, minerals, and fiber than other cereals. Conversely, rice is the main factor to causes diabetes since it contains higher CHO than other cereals, and releases sugar in the blood faster than other cereals.
The seeds of wheat are used to make flour and semolina, the main ingredients in bread and other baked goods. Wheat contains protein, minerals, fiber, phenol, flavonoid, anthocyanin, vitamin C, and antioxidants that are beneficial for human and animal health [26]. As phenolic acids can be absorbed and digested by the large and small intestines, the risk of colorectal cancer can be reduced, providing health benefits [27]. Vitamin C reduces the risk of scurvy, and flavonoids promote the consumption of products. As anthocyanins and carotenoids have antioxidant activity, these phytochemicals could be valuable products for human health [28].
Various treatments are used to enhance the content of antioxidants and bioactive compounds, especially phenolics, flavonoids, carotenoids, and anthocyanins in wheat [28]. Different treatments, especially salt [29], selenium [30], salicylic acid [31], temperature [32], and water-deficit conditions increased bioactive compounds and antioxidant activity in wheatgrass and microgreens due to the phenylalanine biosynthesis pathway [32]. As the global population is increasing, food demand is also increasing. To fulfill the demand for additional people, cereals’ production should increase as land is not increasing. In this aspect, high-yielding cereal species should be introduced. To develop the high-yielding variety along with its high nutritional values, the researchers should focus on responsible gene variation, and health-friendly genetically modified organisms (GMOs), biofortified crops, and be extended to the doors of the farmers, Therefore, this review was essayed to focus on the nutritional values of cereal crops, their compositions, functions, and recommended daily allowance (RDA) for health.
2. Nutritional Values of Wheat Grain
Wheat is more nutritious than rice. It is the staple food worldwide after rice and maize. It is a cereal crop that has a major role in the world economy due to its production and technological worth. Common wheat species (Triticum aestivum L.) serve as the main source of nutrition for humans, animals, poultry, etc. Global wheat production in 2021 was 775.4 million tons [33]. In Bangladesh, around 612 million people are suffering from malnutrition [34]. Premature deaths, poor labor productivity, and excessive healthcare expenditures have increased because of mineral deficiencies. Macro-minerals calcium (Ca), magnesium (Mg), phosphorus (P), potassium (K), sodium (Na), chloride (Cl), and sulfur (S) which are needed in significant amounts every day, and micro-minerals, such as zinc (Zn), iron (Fe), fluoride (F), chromium (Cr), selenium (Se), boron (B), manganese (Mn), molybdenum (Mo) and copper (Cu), etc. are also recognized as trace elements, which are required in low quantities, but important for living organism for metabolic activities, biological process, enzymatic activities, and molecular functions, etc. (Table 1) [35,36]. Minerals are necessary for a variety of metabolic processes in the body, including enzyme activities. Micronutrient deficits, such as those in vitamins and minerals might be responsible for similar chronic disorders [35].
3. Uses of Wheat
There are endless uses of wheat flour in farming, medicine, cooking, and baking [Figure 1]. Wheat is a leading cereal crop, mainly utilized for human consumption and livestock feed. All kinds of flour products made of wheat flour have established themselves as the staple food on people's dining tables. Whole wheat flour provides a richer, more nuanced flavor than white flour because it retains the wheat bran and germ [37]. Excessive processing and milling in wheat flour production cause losses of nutrients such as vitamins, minerals, and dietary fibers [38]. The production of whole-grain wheat flour requires far less technological processing than separately isolating wheat bran from the grain during the production of refined flour. Instead of leaving white bran to waste, it is currently used in the food industry because of its beneficial components [38].
3.1. Uses of Different Types of Wheat Flour
Flour is produced from grinding and milling wheat kernels. However, different kinds of flour are produced for specific purposes. Even though they're all made from grinding wheat, these different types of flour vary significantly depending on protein content, fineness, and more. All the different kinds of flour are described as follows:
3.1.1. All-Purpose Flour
The finely ground wheat kernel, which was separated from the bran and germ during milling, is known as all-purpose flour [39]. All-purpose flour is made from hard wheat or a mixture of soft and hard wheat. This flour can be used to bake various products and prepare yeast bread, cookies, cakes, noodles, and pastries [40].
3.1.2. Whole Wheat Flour
Whole wheat flour is prepared from the entire wheat kernel and thus contains the bran, germ, and endosperm. Most commercial whole wheat flour is prepared by reintroducing the germ and bran back into refined white flour rather than milling entire wheat grains [39]. As a result, whole wheat flour baked goods are denser and heavier than white flour baked goods.
3.1.3. Bleached Flour
Flour that has been treated with a bleaching chemical, such as benzoyl peroxide. Some flour is also given a maturing agent treatment, which alters the starch content of the flour itself, typically by oxidizing it. This enables the wheat to absorb more liquid and change into a thicker dough, either dampening or enhancing the production of gluten. For baking pastries, cakes, and cookies, bleached flour is preferable [41].
3.1.4. Unbleached Flour
Unbleached flour is any flour that has not undergone the bleaching process and does not contain any trace preservative chemicals. Unbleached flour is desirable when making yeast dough [41].
3.1.5. Bread Flour
Bread flour is flour with a particularly high gluten protein content, up to about 14 percent. Bread is a widely consumed food made from highly refined wheat flour. Bread flour, from the endosperm of the wheat kernel, is milled primarily for commercial bakers but is also available at retail outlets [39]. While yeast ferments during the early stages of baking bread, carbon dioxide gets trapped by the protein-bonded flour, resulting in stretchy dough with air pockets in the crumb. Although it is similar to all-purpose flour, bread flour has greater gluten strength and is generally used for yeast bread [41]. Flatbreads are produced in more than 60 varieties and have been traditional dishes for many years. Pita is a particular type of flatbread (Arabic bread). Different countries have names for similar bread varieties, such as baladi in Egypt, bouri in Saudi Arabia, or source in Libya and North Africa [41]. Pita bread has a rounded shape, a pocket that forms while baking, and a crust that is a deep golden hue.
3.1.6. Cake Flour
Cake flour is milled from soft wheat and is especially suitable for cakes, cookies, crackers, and pastries that are low in protein and gluten. To mimic the effects of cake flour with all-purpose flour, remove two tablespoons of flour and replace them with two tablespoons of corn starch, which will prevent the formation of gluten to a similar effect [39].
3.1.7. Pastry Flour
Pastry flour is milled from soft, low-gluten wheat. These are low-protein, and the high-gluten formula has a superfine consistency comparable in protein but lower in starch than cake flour. Whole wheat pastry flour contains wheat germ, bran, and endosperm, ground super fine [39].
3.1.8. Self-Rising Flour
Self-rising flour is like all-purpose flour combined with leavening agents (salt and baking powder), which adds airiness by releasing gas bubbles in the dough. For baked items like scones, biscuits, and muffins self-rising flour is often utilized [39].
3.1.9. Durum Flour
3.1.10. Semolina Flour
Coarsely ground endosperm of durum wheat high in protein. Used in high-quality pasta products, it contains more proteins [41].
3.1.11. Gluten Flour
3.1.12. Farina Flour
Hard wheat endosperm that has been coarsely ground. The prime ingredient in many U.S. breakfast portions of cereal is also used in the production of low-cost pasta with very little saturated fat. There is no cholesterol, low sodium, very little sugar, a lot of fiber, a lot of manganese, and a lot of phosphorus [39].
4. The Uses of Wheat in Farming
4.1. Ruminant Animal Production
For animals with several stomachs, such as ruminants, wheat is a great source of animal nutrition. Wheat has high protein values, up to 18%, depending on species, cultivation, and growth conditions. It can be used to feed ruminants instead of grass because it has more protein and more energy than it does [43].
4.2. Swine Production
In swine, wheat bran is used for its nutritional properties and digestion. Wheat bran is supplemented in the diet of pigs because it improves the intestinal flora and promotes intestinal health [44]. Additionally, the fiber in wheat bran can be fermented by the bacteria in pigs' large intestines to create volatile fatty acids that the animals can use as a source of energy [43]. Nevertheless, it is advised to add enzymatic products, such as Alquerzim, to the wheat bran to increase its digestibility.
4.3. Poultry Farming
In poultry farming, wheat is common in Asia, Australia, Canada, and Europe due to the shortage of corn during some seasons. Although wheat provides less energy than maize, it does contain more crude protein and amino acids like lysine and tryptophan [45]. Additionally, compared to corn, wheat has lower levels of biotin and vitamin A. Therefore, it is not advised to include a significant amount or for extended periods due to these reasons [43]. However, wheat is a great substitute for chicken feed since it promotes the production of pellets due to the presence of gluten, negating the need for binders [43].
4.4. Ethanol Production
The majority of wheat consists of carbohydrates. Therefore, it can be used for ethanol production and brewing wheat beer [39].
5. Chemical Compositions and Nutritional Values of Wheat
5.1. Proximate Composition
Protein is one of the most important nutrients for both people and animals. Its name, which comes from the Greek word for "primary," shows how important it is. Gluten makes up 80% of total wheat protein and is responsible for the elasticity and stickiness of bread dough [46]. The fat content in wheat flour was low, at 0.84% [20]. Wheat flour is rich in CHO. The CHO content of wheat flour was 72.73% [47]. Wheat flour had 84.5% carbohydrate content, but 58% starch content [48]. Wheat grains store energy in the form of starch, which can be as much as 75% of the dry weight of the grain or more. The amount of starch contained in a wheat grain may vary between 60% and 75%, depending on the type of grain [49,50]. Whole-grain wheat contains 7.0-22% of the dry-weight fiber [47,50,51], but refined wheat contains almost none, as the fiber is concentrated in the bran [46]. The main types of fiber in wheat bran are hemicellulose (70%) and cellulose [46]. Wheat contains high amounts of insoluble fiber and small amounts of soluble fiber (fructans) [52]. High-fiber diets have led to an increase in the demand for whole-grain and bran breads.
5.2. Vitamins
Whole-grain flours have considerably higher vitamin content than white flour due to the refining process [37,39,53]. As a result, wheat grains are naturally high in vitamins such as vitamin E (tocopherol or alpha-tocopherol) and B complex. The vitamin B complex consists of riboflavin (B2), thiamine (B1), niacin (B3), pyridoxine (B6), pantothenic acid (B5), biotin (B7), and folate (B9) [54]. The amount of vitamins in 100 mg of whole wheat grain is presented in Table 1. The following are the functions of various vitamins:
5.3. Vitamin E (Tocopherol or Alpha-Tocopherol)
5.4. Thiamine (B1)
Thiamine is present in whole wheat flour and maintains many cellular activities. Thiamine pyrophosphate is a coenzyme that plays an essential role in the metabolism of carbohydrates and amino acids [57].
5.5. Riboflavin (B2)
Vitamin B2 in whole wheat flour enables the production of red blood cells (RBCs). The greater the number of RBCs, the greater their contribution to energy generation in the body [58].
5.6. Niacin (B3)
Niacin, included in whole wheat flour, helps the brain and mental health [58]. Niacin deficiency leads to pellagra, historically associated with diets based mainly on maize flour.
5.7. Pantothenic Acid (B5)
Whole wheat flour contains pantothenic acid, an essential nutrient [32,33,34,35,36,37,38,39,40,41,42,43,44,45,46,47,48,49,50,51,52,53,54,55,56,57,58,59]. Pantoic acid and alanine are combined to form pantothenic acid. All animals need pantothenic acid to produce coenzyme A (CoA), which is essential for fatty acid metabolism to synthesize and metabolize carbohydrates, proteins, and fats [59].
5.8. Pyridoxine (B6)
Pyridoxine in whole wheat grain involves numerous aspects of cellular activities, such as neurotransmitter synthesis, macronutrient metabolism, histamine synthesis, and hemoglobin synthesis. pyridoxal 5'-phosphate (PLP) is usually a coenzyme (cofactor) for many reactions, including decarboxylation [60].
5.9. Biotin (B7)
Biotin in whole wheat is engaged in various metabolic functions in people and other living things, primarily those that require using carbohydrates, lipids, and amino acids [61].
5.10. Folates (B9)
Folate in whole wheat helps to produce and maintain new cells, especially red blood cells, in the body. It also helps prevent DNA changes that might cause cancer [40]. In addition, it's essential during pregnancy [62].

Table 1.
Nutritional value per 100g (3.5 oz) of wheat, rice and maize.
| Elements | Quantity (mg) | Elements | Quantity (mg) | ||||
|---|---|---|---|---|---|---|---|
| Wheat | Rice | Maize | Wheat | Rice | Maize | ||
| Energy (kJ/kcal) | 1368/327 | 544/130 | 362 | Minerals | |||
| Carbohydrates (g) | 71.18 | 77-79 | 75.48 | Calcium | 29 | 3.0 | 10.68 |
| Sugars (g) | 0.41 | 0.24 | 3.66 | Magnesium | 126 | 13.0 | 126.12 |
| Protein (g) | 12.61 | 7.3 | 9.8 | Manganese | 3.985 | 0.38 | 1.36 |
| Lipids (g) | 2.4 | 0.2 | 4.18 | Phosphorus | 288 | 37 .0 | 284.68 |
| Choline | 106 | 2.0 | 61.7 | Potassium | 363 | 310 | 276.17 |
| Dietary fiber (g) | 12.2 | 3.5 | 6.69 | Sodium | 2.0 | 28 | 3.74 |
| Ash | 0.65 | 0.6 | 1.1 | Iron | 3.19 | 0.2 | 2.92 |
| Phenolic acids | 136.59 | 56.95 | 173.70 | Zinc | 2.65 | 0.4 | 0.83 |
| Flavonoids | 4.76 | 64.76 | 5.07 | Copper | 1.03 | 2.3 | 0.14 |
| Oxalates | 14.5 | 12 | 116.40 | Iodine (µg) | 5.9 | 3.0 | 10 |
| Phytates | 12.01 | 16.0 | 17.93 | Selenium (µg) | 70.7 | 20 | 10 |
| Water (g) | 13.1 | 69.0 | 11.51 | ||||
| Vitamins | |||||||
| Carotene/Vit A (IU) | 0.02 | 0 | 0.37 | Folate (B9) (µg) | 38 | 30 | 30 |
| Thiamine (B1) | 0.383 | 0.02 | 0.30 | Vitamin 12 | 0 | 0 | 0 |
| Riboflavin (B2) | 0.115 | 0.02 | 0.08 | Vitamin D | 0 | 0 | 0 |
| Niacin (B3) | 5.464 | 0.4 | 1.9 | Vitamin E | 1.4 | 0.98 | 1.98 |
| Pantothenic acid (B5) | 0.954 | 0.41 | 0.27 | Vitamin K (µg) | 1.9 | 2.0 | 40 |
| Vitamin B6 | 0.3 | 0.05 | 0.28 | Vitamin C | 0 | 0 | 0 |
| Biotin/ Vit B7 (µg) | 10 | 10 | 7.0 | Choline | 31.2 | 53.2 | |
6. Minerals
6.1. Wheat Mineral Composition and Its Functions and Deficiencies in the Human Body
Wheat is the world's most stable food. It is a cereal crop that has a major role in the world economy due to its production capacity and technological worth. Common wheat species (Triticum aestivum L.) serve as the main source of nutrition for humans, animals, and poultry arena. Global wheat production in 2021 was 775.4 million tons [61]. Regrettably, in the quest for efficiency and production, wheat has lost many important nutritional features (protein, carbohydrates, fiber, minerals, and vitamins) (Table 1) and flavor characteristics. As a result, there has been a recent rise in interest in the old variety, which is less productive but produces grain with higher nutritional content [62,63]. Additionally, older species like emmer, einkorn, and spelled are environment-friendly and require fewer pesticides and fertilizers for their cultivation [40].
Table 2.
Comparison of gross composition of various cereal grains per 100g edible portion at 14% moisture.
Table 2.
Comparison of gross composition of various cereal grains per 100g edible portion at 14% moisture.
| Nutrient per 100 g | Brown rice | Barley grain | Corn white | Oat grain | Oat grain | Rye grain | Sorghum grain | Triticale grain | Wheat flour |
|---|---|---|---|---|---|---|---|---|---|
| Water (g) | 14.0 | 14.0 | 14.0 | 14.0 | 14.0 | 14.0 | 14.0 | 14.0 | 14.0 |
| Energy (kJ) | 1497 | 1412 | 1465 | 1542 | 1542 | 1360 | 1352 | 1405 | 1372 |
| Energy (kcal) | 358 | 338 | 350 | 368 | 368 | 325 | 323 | 323 | 328 |
| Crude protein (g) | 7.4 | 10.3 | 9.0 | 16.0 | 16.0 | 10.0 | 10.4 | 13.0 | 12.7 |
| Total lipids (g) | 3.1 | 1.6 | 4.6 | 6.5 | 6.5 | 1.6 | 3.4 | 2.1 | 2.4 |
| Ash (g) | 1.2 | 1.2 | 1.2 | 1.6 | 1.6 | 1.5 | 1.4 | 2.2 | 1.5 |
| Carbohydrates by difference (g) | 1.2 | 1.2 | 1.2 | 1.6 | 1.6 | 1.5 | 1.4 | 2.2 | 1.5 |
| Total dietary fiber (g) | 3.5 | 72.9 | 71.2 | 62.8 | 62.8 | 73.0 | 70.8 | 72.1 | 69.3 |
| Sugars (g) | 0.6 | 0.8 | - | 2.0 | 2.0 | 0.9 | 2.5 | 2.0 | 0.4 |
Table 3.
Contents of macro- and microelements in wheat grains of Triticum sp. (per 100 g).
| Wheat species | Macroelements (mg g-1) | Microelements (µg g-1) | ||||||
|---|---|---|---|---|---|---|---|---|
| Ca | P | Mg | K | Cu | Fe | Mn | Zn | |
| Common wheat (Triticum aestivum) | 0.11 | 5.16 | 1.04 | 4.74 | 2.35 | 60.8 | 44.8 | 28.8 |
| Spelt wheat (Triticum spelta) | 0.10 | 3.71 | 1.25 | 5.49 | 0.71 | 94.7 | 62.2 | 21.9 |
| Emmer wheat (Triticum dicoccon) | 0.15 | 4.73 | 1.34 | 5.84 | 0.66 | 77.6 | 47.1 | 17.8 |
| Einkorn wheat (Triticum monococcum) | 0.17 | 4.74 | 1.74 | 6.45 | 1.40 | 58.8 | 32.9 | 17.8 |
Today, the world faces the biggest problem of mineral insufficiency in their bodies. Worldwide, mineral deficiency is affecting over 3 billion people [75]. Premature deaths, poor labor productivity, and excessive healthcare expenditures have increased because of mineral deficiencies. Minerals are regarded as vital minerals that humans require in their everyday diets for healthy human growth [76]. Minerals are divided into two major groups: Macro-minerals, such as calcium (Ca), magnesium (Mg), phosphorus (P), potassium (K), sodium (Na), chloride (Cl), and sulfur (S), are needed in significant amounts every day, and micro-minerals, such as zinc (Zn), iron (Fe), fluoride (F), chromium (Cr), selenium (Se), boron (B), manganese (Mn), molybdenum (Mo) and copper (Cu), are also recognized as trace elements, which are required in smaller quantities, but important for living organism for metabolic activities, biological process, enzymatic activates, and molecular function (Table 1, Table 2) [73,74,75].
7. Daily Requirements, Functions, and Deficiency of Minerals in the Human Body
7.1. Recommended Daily Allowance (RDA)
The RDA of macro- and microelements for sound human health is described in Table 4 [76]. Minerals are necessary for a variety of metabolic processes in the body, including enzyme activity. Micronutrient deficiencies, such as those in vitamins and minerals, might be responsible for similar chronic disorders [76].
The contents of minerals in wheat grains and wheat flour are shown in Table 1 and Table 2. The contents of macro- and micro-minerals in wheat grains may be mainly controlled by genetic and environmental factors. Mineral compositions in wheat grain vary from species to species (Table 3) [82]. Due to their nutritional value as well as their technological benefits, the elements beneficial for health are found in significant amounts in cereal grains. Crude ash and total protein were significantly higher in einkorn and emmer grains than in common wheat. Additionally, it demonstrates that compared to bread wheat, einkorn, and emmer may have a more varied mineral composition or a higher concentration of minerals (Table 3) [83,84]. The RDA per adult (19-65 years) as CHO, protein, fat, vitamins and minerals requirement per adult are shown in Table 4.
7.2. Phosphorus
The RDA is 800-1300 mg per day. Phosphorus is linked to Ca homeostasis, bone and tooth development, and the most metabolic functions in the body, including kidney function, cell proliferation, and heart muscle contraction (Table 4) [83]. This element deficiency is uncommon, but symptoms include sore bones, erratic breathing, weariness, anxiety, numbness, skin sensitivity, and weight fluctuations. Because there are higher risks of colon cancer and high blood pressure if the calcium supply is also inadequate, the problem could get worse. P intakes over 3-4 g/day are potentially dangerous since they may prevent the body from absorbing calcium [84].
7.3. Calcium
The RDA for calcium (Ca) in the human body is 800-1300 mg/day [76]. The biological processes of several tissues depend on calcium, making it a crucial mineral for human health (parathyroid gland, nervous and cardiac systems, musculoskeletal system, and bones and teeth) [85,86]. Furthermore, Ca helps to maintain mineral homeostasis as well as general physiological performance and can act as a cofactor in enzyme activities (mitochondrial transporter for ATP and fatty acid oxidation) [53,54]. Recent investigations have demonstrated calcium’s function as a second messenger [87]. Ca consumption somewhat lowers colon cancer’s risk. To lower the risk of pre-eclampsia, it is advised that pregnant women consume more calcium [88]. Many circumstances cause additional intake of Ca in the body because of damage to the control mechanisms, including hypercalcemia, which can be caused by increased mobilization of calcium from bone, augmented tubular reabsorption, diminished glomerular purification in the kidneys, or increased dietary intake. Ca levels are subject to homeostatic controls to prevent an unnecessary accumulation in blood tissues [89,90].
7.4. Magnesium
Magnesium (Mg) has an RDA of 200-400 mg. This necessary mineral affects insulin post-receptor signaling and vascular smooth muscle tone as a Ca antagonist. As a cofactor of up to 300 enzymes, this mineral has been linked to energy metabolism, neurotransmitter release, endothelial cell activities, and participation in muscle and neuron excitability [91]. Age-related diseases and magnesium insufficiency are linked [92]. The lower magnesium content in the diet can cause insulin resistance, particularly when the deficit is combined with a fructose-enriched diet, which may also raise the risk of developing chronic diseases like metabolic syndrome, diabetes, hypertension, and numerous cardiovascular problems [93]. The most prevalent adverse effects of consuming too much magnesium are hypotension, headaches, vague bone pain, nausea, and abdominal discomfort. Magnesium's toxic consequences are rare [94,95].
7.5. Potassium
The daily consumption rate of Potassium (K) is 3500 mg [76]. K aids nerve functions by upholding the stability of the physical fluid system and assisting nerve functions through its role in nerve impulse transmission. This mineral is also related to muscle retraction and cardiac activity. Cardiac arrhythmias are linked to potassium deficiencies [96]. A lower concentration of Kin serum or hypokalemia is characterized by weakness, exhaustion, and twitching of the muscles [96]. If K in the serum is above 5.5 mmol/L, arrhythmias or hyperkalemia may result. Hyperkalemia includes symptoms like myoglobinuria, rhabdomyolysis, muscle spasms, and weakness [96].
7.6. Sodium
The daily sodium (Na) intake recommendation is 2400 mg. A deficit of Na in the body may cause diarrhea, vomiting, sweating, nausea, dizziness, poor focus, muscle weakness, and other symptoms. Surplus Na intake in the body may be caused by increased absorption or as a side effect of kidney disease, resulting in neurological problems and high blood pressure. Excessive Na consumption may result in Ca2+ loss over time [97].
7.7. Zinc
The RDA for Zinc (Zn) is 8.0 to 11.0 mg/day. More than 100 enzymes involved in the production of nucleic acids and proteins, cellular development, the utilization of glucose, and the secretion of insulin all need zinc for proper structure and function [98,99]. This mineral is involved in the Zn fingers that are related to DNA, hemoglobin, myoglobin, and cytochromes; whereas other elements, such as Fe or Cu, are present in high concentrations, the bioavailability of these organic compounds, including Zn, is reduced [100,101]. Zn's insufficiency or absence in the body reduces DNA synthesis, sensitivity to taste and smell, and immune system efficacy [100,101]. It was summarized that Zn deficiency in organisms causes hypochromic anemia, hair whiting, and shedding [102]. Both acute and chronic effects are caused by Zn toxicity or overeating. Taking Zn 150–450 mg/day for a long time lowers Cu absorption, transforms Fe, impairs immunological functioning, and lowers HDL levels [103,104].
7.8. Iron
Iron (Fe) is an essential element for producing energy in the body. Its dosage daily is 8.0–18 mg/day. The primary cause of iron deficiency is a lower Fe intake than the RDA. Hypochromic anemia develops from severe Fe deficiency [69]. Often, blood transfusions, genetic or metabolic problems, or excessive consumption can all promote toxic Fe levels in the body. In addition, liver and heart diseases, diabetes, and skin abnormalities might be caused by excessive iron intake, as described by Porter and Rawla (2022) [105].
7.9. Manganese
Manganese (Mn) acts as an enzyme cofactor in oxidative processes to metabolize glucose [106]. Mn deficiency is commonly rare, but it is associated with reduced levels of cholesterol, abnormalities in red blood cells, and mucopolysaccharide composition. Under controlled conditions, a scaly rash and low plasma cholesterol levels were found [101]. An overabundance of Mn in the brain causes a toxic effect, resulting in a Parkinson-like disease [100,101].
7.10. Copper
The RDA for copper (Cu) is 1.0-1.6 mg/day. Major roles are linked to enzyme function, which includes Phase-I detoxifying enzymes (cytochrome C oxidase family of enzymes) [107] (Gupta and Lutsenko, 2009). Furthermore, Cu is required for the development of connective tissue and nerve coverings (myelin sheath) [101] and contributes to Fe metabolism [102]. Cu can be collected in the human body (liver and brain) up to a limit of 80 mg without causing clinical symptoms of toxicity over a short period, supporting insufficient food intake [102]. Although copper deficiency is uncommon in humans, it can cause skeletal abnormalities, normocytic, hypochromic anemia, leucopenia, and neutropenia, among other hematological symptoms [102]. Cu toxicity has been linked to gastrointestinal effects such as cramps, nausea, diarrhea, and vomiting in acute episodes as well as liver damage in chronic overdoses [108].
7.11. Selenium
The necessary dosage for selenium (Se) as a micronutrient is 70 g/day. Se is required for the formation of selenoproteins, which are involved in antioxidant processes [109]. It plays a vital role in regulating the activities of the thyroid and immune systems [101]. She has been linked to a significant reduction in the risk of numerous types of cancer [110]. Hypothyroidism, heart disease, and inadequacies of the immune system may be caused by a shortage of selenium [111,112]. Numerous symptoms, like hair loss, gastrointestinal distress, exhaustion, and slight nerve damage, have been linked to an overabundance of selenium. Se toxicity, on the other hand, is uncommon and linked to unintentional exposures [112].
7.12. Chromium
The chromium (Cr) RDA is 25-35 g/day. Cr functions as an insulin adjuvant and is necessary for healthy blood glucose and lipid metabolism [112]. Other biochemical functions for Cr have also been identified, including regulation of metabolism, energy production, lipoprotein or lipid synthesis, and participation in gene expression. Cr deficiency symptoms include peripheral neuropathy, glucose intolerance, and weight loss [101]. A lower dosage of Cr in the body may elevate the severity of heart diseases [113]. There is no evidence that Cr is toxic to the body. High Cr doses, on the other hand, have been linked to chromosomal damage, renal and liver changes, and metallic-mineral problems [114].
7.13. Cobalt
The RDA for the cobalt (Co) is 300 g per day. Cobalt is required for red blood cell hemopoiesis and anemia prevention [102]. Co influences the physiological roles of vitamin B12, and the creation and maintenance of red blood cells are controlled by their jointly functioning functions (Co and B12). Furthermore, Co excites hunger, growth, and energy release [115]. Excessive cobalt consumption can harm the heart muscles, raise hemoglobin levels, cause heart failure, and affect the thyroid glands' functions [116].
7.14. Molybdenum
Molybdenum (Mo) doses of 250 g per day are considered safe. Functions of molybdenum include purine metabolism, amino acid turnover, and the removal of secondary harmful chemicals (nitrosamines) [101]. For oxidizing enzymes, molybdenum acts as a cofactor, particularly for xanthine oxidase and sulfite oxidase [101]. Mo deficiency may be due to a genetic metabolic condition that causes acute neurodegeneration and early childhood death [117]. Mo in excess and toxic amounts might slow down the metabolism of Co and cause anemia-like symptoms [118].
8. The Medicinal Properties of Wheat on Overall Health
Uses of wheat for metabolic syndrome: “Metabolic syndrome” refers to an imbalance in the human metabolic pattern. Metabolic syndrome may increase cholesterol levels and increase obesity and blood sugar levels while raising the risk of diabetes [119]. Numerous investigations have demonstrated the presence of tocotrienols, ferulic acids, arabinoxylan, and tocopherols in whole wheat [120]. These compounds in wheat may regulate the risk of metabolic syndrome by regulating blood sugar, decreasing blood pressure, and resulting in a healthy body mass index [119].
8.1. Use of Wheat to Improve the Immune System
Numerous vitamins and elements included in wheat may help with immunity. Wheat contains dietary fibers and ferulic acid, which can produce T-helper cells, macrophages, and neutrophils that improve the function of immune cells [121].
8.2. Use of Wheat for Cancer Treatment
Numerous malignancies can be treated with wheat. Kumar et al. (2017) [39] found that eating foods high in dietary fiber may lower the risk of colon, colorectal, stomach, liver, and pancreatic cancer.
8.3. Use of Wheat for Heart Health
Wheat may be beneficial for conditions like myocardial infarction or stroke. High fiber intake may reduce the risk of cardiovascular diseases. A study found that those who consumed a lot of dietary fiber had a lower risk of myocardial infarction [122].
8.4. Use of Wheat for Gallstones
Wheat has high levels of indigestible fibers that may help to avoid gallstones. Researchers have reported that individuals consuming more fiber have a lesser risk of developing gallstones than those who consume less [123].
8.5. Use of Wheat for Tooth Disorders
Consuming wheat may reduce the chances of toothache or tooth decay. Although chewing is a must while taking wheat, this may help in the fast movement of teeth and may give proper exercise to the teeth [119].
8.6. Use of Wheat for Constipation
Wheat may be used to produce bowel movements and thereby relieve constipation. In addition, a high amount of fiber in wheat may be helpful for easy movement of stools and may prevent piles [39].
8.7. Use of Wheat for Diabetes
Wheat may have anti-diabetic properties due to the presence of fiber. Studies on rats showed that high fiber intake might lower the blood glucose level. Furthermore, large-scale human studies have shown that dietary fiber consumption may reduce the risk of diabetes [39].
9. Nutrient Composition and Protein Quality of Rice Relative to Other Cereals
Comparing staple cereals and high-moisture tubers shows cereals have higher energy content, while tubers are richer in ascorbic acid. Due to their higher moisture, tubers have lower nutrient and energy density. Cassava has extremely low protein content, while rice, despite having the lowest dietary fiber among cereals, has protein levels similar to potato and yam on a dry weight basis (Table 5, Table 6).
Nitrogen balance studies in Peruvian preschool children showed that wheat noodles had the highest nitrogen absorption, while peeled potatoes had the highest nitrogen retention. Potato and milled rice had the best protein quality based on nitrogen retention. Wheat and rice provided the most utilizable protein. High-lysine maize, though better than regular maize, was inferior to milled rice in protein quality. Sorghum had the lowest energy digestibility, likely due to its high tannin content.
Table 8.
Balance data of whole-grain cereals and potatoes in five rats.
| Food | True N Digestibility (%) |
Biological Value (%) |
Net protein Utilization (%) |
Utilizable Protein (%) |
Digestible energy | |
|---|---|---|---|---|---|---|
| Brown rice | 99.7 | 74.0 | 73.8 | 5.4 | 3.70 | 96.3 |
| Wheat | 96.0 | 55.0 | 53.0 | 5.6 | 3.24 | 86.4 |
| Maize | 95.0 | 610 | 58.0 | 5.7 | 3.21 | 81.0 |
| Millet | 92.0 | 60.0 | 56.0 | 6.4 | 3.44 | 87.2 |
| Sorghum | 84.8 | 59.2 | 50.0 | 4.2 | 3.07 | 79.9 |
| Rye | 77.0 | 77.7 | 59.0 | 5.1 | 3.18 | 85.0 |
| Oats | 84.1 | 70.4 | 59.1 | 5.5 | 2.77 | 70.6 |
| Potato | 82.7 | 80.9 | 66.9 | 5.2 | - | - |
| Brown rice | 99.7 | 74.0 | 73.8 | 5.4 | 3.70 | 96.3 |
Table 9.
Calculated true digestibility by adults and children of various cereal proteins as compared to egg, milk, and meat protein.
Table 9.
Calculated true digestibility by adults and children of various cereal proteins as compared to egg, milk, and meat protein.
| Protein source | Mean | Digestibility relative to reference proteins |
|---|---|---|
| Rice, milled | 88 ± 4 | 93 |
| Wheat, whole | 86 ± 5 | 90 |
| Wheat endosperm (farina) | 96 ± 4 | 101 |
| Maize, whole | 85 ± 6 | 89 |
| Millet | 79 | 83 |
| Sorghum | 74 | 78 |
| Oatmeal | 86 ± 7 | 90 |
| Egg | 97 ± 3 | 100a |
| Milk | 95 ± 3 | - |
| Meat, fish | 94 ± 3 | - |
10. Nutritional Value of Rice
According to FAO Food Balance Sheets for the period 1979-81, rice played a critical role in providing protein in the diets of people in South Asia and Southeast Asia. In South Asia, 69.2% of the protein intake came from rice, while in Southeast Asia, rice contributed 51.4% of dietary protein [136]. These figures indicate that rice was the primary source of protein in these regions, surpassing the protein contribution of any other cereal in any part of the world during that time. This highlights the significant role rice plays not just as a staple food but also as a vital source of nutrition, particularly in these densely populated regions. The vitamin and amino acid content of the milling fractions is given in Table 10, and Table 11.
11. Nutritional Value of Maize and Other Cereals
Cereal grains are vital for the nutrition of millions, especially in developing countries, providing both energy and protein. However, their protein quality is limited by deficiencies in essential amino acids like lysine. Some grains, like maize, also have excesses of certain amino acids, affecting protein utilization. Compared to other cereals, common maize has similar protein quality, except for rice. High-lysine varieties like opaque-2 and QPM (Nutricta) offer significantly better protein quality. Studies have shown that supplementing maize protein with lysine can improve its nutritional value, though results vary depending on maize variety.
Some studies suggest that tryptophan, rather than lysine, is the first limiting amino acid in maize, especially in varieties with higher lysine content. Researchers agree that adding both lysine and tryptophan significantly improves maize's protein quality. After lysine and tryptophan, isoleucine is the next limiting amino acid, as excess leucine in maize can interfere with isoleucine absorption (Table 11). High leucine intake may also increase niacin requirements, contributing to pellagra. Adding amino acids like isoleucine and threonine improves maize's protein quality. Lysine and tryptophan supplementation can boost maize protein quality by 150%. High-protein maize contains more zein, which is low in lysine and tryptophan, but high-protein maize still shows slightly better quality than low-protein maize.
Osborne fractions from various cereals show similarities in the proportions of amino acids, particularly glutamine (Glx), proline (Pro), glycine (Gly), and cysteine (Cys), with glutamine, proline, and glycine being predominant in all cereal protein fractions (Table 13). However, differences in amino acid composition cannot account for the inferior baking performance of cereals like rye and barley. Sulfhydryl-disulfide interchanges primarily drive wheat dough formation. The gliadin and glutenin fractions comprise 80-85% of wheat endosperm protein and together form gluten. A specific interaction pattern between low molecular weight glutenin (<90 kDa) and high molecular weight glutenin (>90 kDa) is crucial for developing viscoelastic gluten.
12. Progress in Improving Nutritional Quality
Nutrients are the compounds in food required by the body to perform its basic functions. Nutritional quality refers to the bioavailability or concentration of desirable nutritional substances for human health, such as carbohydrates, protein, lipids, fiber, vitamins, minerals, and selected phenolic acids found in wheat grain [138].
Nutritional improvement is done mainly in two stages, one at the crop production stage and another at the post-harvest food processing stage [138,139,140,141,142,143,144]. To improve nutrition during the post-harvest food processing stage, various desirable parts of the grain are added to the food. The major functional compounds such as fibers, vitamins, minerals, and phenolics are chiefly concentrated in the bran of wheat grains [39]. Therefore, the addition of the bran part of wheat grain is an effective way to formulate fortified wheat foods in wheat-based food products, but due to the negative effects of bran on dough rheology and the sensory properties of final products [145,146], the consumption of whole grain meals is still below dietary recommendations [147,148]. It was also shown that the addition of bran increases cooking loss, swelling index, and water absorption in pasta products [149,150,151]. Likewise, several studies showed that hard crumbs, bitter flavor, and dark color were observed in baked products that had been enriched with wheat bran [151,152,153]. It was concluded that the levels of bran addition should not exceed 20% to obtain products with acceptable sensory qualities [142,143,154]. For the bioavailability of the nutrients upon consumption, a series of processes such as assimilation, accumulation, biosynthesis, translocation, and remobilization are involved [138,155,156,157,158,159]. To improve the nutritional quality of wheat grain, the genotypic and phenotypic characterization of these key biological processes or pathways should be carried out [138]. The application of biofortification is the ultimate method to improve the nutritional quality of wheat or other crops, which is the most sustainable approach that can reach the nutritional requirements of the global community cost-effectively. Biofortification is a process that enhances the dietary bioavailability or concentration of desirable nutritional components in plants genetically [160,161]. The primary information regarding the crop’s genetic and phenotypic profile across different environments is required to apply the biofortification method. Significant progress has been made in efforts to improve the nutritional value of wheat. Conventional and transgenic approaches are being used to improve the nutritional value of wheat.
Generally, in conventional-based approaches, soil and foliar application of specific nutrients and germplasm screening, which contains higher amounts of desired nutrients across different wheat genotypes grown in different environments, are performed to increase nutritional quality in wheat [162]. Much progress has been made to increase the different nutrients in wheat grains. Generally, Zn and Fe concentrations in grains of commercial wheat cultivars are 20–35 mg/kg [162) showing that zinc fertilizers can increase the zinc density in wheat grains. Further, they showed that Fe and Zn accumulation was increased by the application of nitrogen. Cakmak et al. (2010) [162] also showed that positive correlations between grain Zn and protein concentrations were observed under high soil applications of Zn, and N. Bharti et al. (2013) [139] demonstrated that soil application of ZnSO4 at 20 kg/ha plus foliar spray of 0.5% ZnSO4 increased grain Zn by 80%, methionine content by 61.3%, and phytic acid by 23.2% in wheat. Zink-amino acid chelates are another important source of Zn and are capable of increasing the nutritional quality of wheat. Ghasemi et al. (2013) [140] showed that foliar application of zinc-amino acid chelates increased 14.3% Zn, Fe, and protein over ZnSO4 application. Waraich et al. (2010) [163] conducted a field experiment to determine wheat response to four irrigation regimes applied at different growth stages and four nitrogen levels of 0, 50, 100, and 150 kg nitrogen (N) per hectare. They also observed that nitrogen application significantly improved grain crude protein at all irrigation levels.
Micronutrients are essential components that promote health. It is crucial to create varieties with increased micronutrient content because the majority of people in the world, especially those in underdeveloped countries, rely on cereal and plant-based diets to meet their micronutrient needs [62]. The two most significant micronutrients are iron and zinc [62]. Due to insufficient genetic variety, the majority of wheat types do not have adequate levels of iron and zinc. Plant breeding for micronutrient concentration started in the 21st century when deficiencies in micronutrients such as iron, iodine, zinc, and vitamins were recognized as an issue of overwhelming global public health significance. To improve the nutritional quality of agricultural products, the Consultative Group on International Agricultural Research (CGIAR) established HarvestPlus in July 2003.
The genetic diversity of the genes in wheat that code for many commercially significant features has been reduced as a result of domestication. Utilizing its wild relatives will expand this genetic diversity. The genus Aegilops, which is its nearest relative, can be a valuable source of novel alleles [39,164]. Tetraploid and hexaploid wheat have greatly benefited from the influence of Aegilops. Kumar et al. (2019) [165] reported that more than 180 lines or accessions of Aegilops have been investigated to increase genetic diversity and overcome this genetic limitation.
Many accessions of Ae. kotschyi, Ae. longissima, Ae. tauschii, Ae. peregrina, Ae. cylindrica, Ae. ventricosa, and Ae. geniculate has been reported to contain increased amounts of iron and zinc in seeds [38,39,164,166,167,168]. A quantitative trait locus (Gpc-B1) from wild emmer wheat has been identified and cloned [169] that is linked to increased levels of grain protein, zinc, and iron, resulting in rapid senescence and higher nutrient mobilization from leaves to the developing grains. Due to the absence of phytases, which break down phytic acid in the digestive tract, monogastric animals such as humans are unable to digest phosphorus, which is stored in the form of phytic acid in plant seeds (including wheat) [170]. Phytase is accumulated in the seeds of transgenic wheat plants that express the Aspergillus niger phytase-encoding gene phyA [171]. Increased bioavailability of Zn2+, Ca 2+, and Fe2+ by breaking down complexes with phytic acid was another achievement in the expression and thermostability of phytases in transgenic wheat plants.
Studies on the phytochemical composition of Aegilops species are rare, with most of the research being done in Europe [165]. But because Aegilops species have such a wide genetic range, it is possible to study various phytochemicals in them, including phenolic acids, carotenoids, tocopherols, alkyl resorcinols, benzoxazinoids, phytosterols, and lignans. Ae. geniculata has been found to have a large number of phenolic diglycerides [165]. A genetic approach was also considered to increase the amount of phenolic acids by evaluating the phenolic content and composition among different wheat species and cultivars [170,172]. Genetic variability for phenolic acids was extensively documented in winter and spring bread-wheat genotypes [173] and, more recently, in a large number of durum wild and cultivated genotypes [159]. It was shown that phenolic acid variation was only partly due to genetic factors, as a strong influence of environmental factors was observed [173,174]. Indeed, more recent evidence on durum genotypes showed a higher ratio of genotypic variance to the total variance, suggesting that it might be realistic to improve phenolic acid content in elite durum wheat germplasm through appropriate breeding programs [159].
Protein is an important nutrient for humans and animals. Unfortunately, cereal proteins are nutritionally incomplete due to their deficiency in several essential amino acids (EAAs) such as lysine (1.5-4.5% vs. 5.5% of the WHO recommendation), tryptophan (Trp, 0.8–2.0% vs. 1.0%), and threonine (Thr, 2.7–3.9% vs. 4.0%) [175]. The protein content of wheat grains may vary from 10% to 18% of the total dry matter. In the past, plant breeders made efforts to improve the quality of plant proteins. They identified natural mutants like high-lysine corn and barley and developed them into elite genotypes [175]. Unfortunately, these mutants were more susceptible to diseases and pests, and lower yields were associated with them. Alternative methods to address these inadequacies are used in modern biotechnology, such as sequence modification of a protein for increased EAAs. This method requires specific protein areas that can be changed without changing the protein's overall structure, stability, or function [175]. The zein protein was altered by inserting Lys-rich (Pro-Lys) residues adjacent to or in place of the -zein's Pro-Xaa region [175]. The modified Lys-rich zeins were found in high concentrations in protein bodies and co-localized with endogenous - and -zeins in the temporarily transformed maize endosperms [175].
13. Conclusions
Over 3 billion of the world's 7.75 billion people suffer from micronutrient deficiencies, especially in iron, zinc, and vitamin A. Malnutrition, including obesity, overweight, and underweight, affects over 2 billion people globally. Undernutrition is responsible for 45% of deaths among children under five. In 2020, about 150 million children under five were affected by stunting, and in 2019, vitamin A and zinc deficiencies caused around 23,800 and 2,810 child deaths, respectively. Cereals are a key global food source for humans and animals, supplying around half of the world's calories and being the most traded crop. By 2032, 41% of cereals will be consumed by humans, and 37% used for animal feed. They provide essential carbohydrates, protein, vitamins, minerals, and fiber, delivering energy and balanced nutrients to humans and livestock. Among the cereal crops, wheat, rice, and maize are the first- second, and third staple foods in the world, respectively which are a strong source of calories, protein, vitamins, minerals, and fiber and are widely used in bakery and feed industries. Other cereals like durum, triticale, barley, foxtail millet, oats, etc. are the best sources of protein, fiber, phenolic compounds, and antioxidants. Triticale is used for both purposes, fodder, and human food. Phenolic compounds and antioxidants mitigate oxidative stress in living organisms. Fiber also controls blood pressure and prevents rectal cancer. Therefore, this review will provide information to the people about the nutrient values of cereals, habituate them to take diversified foods for proper nourishment, reduce their malnutrition, and lastly strengthen income-generating activities
Author Contributions
MZI AR and MNA conceptualized the manuscript. MZI, MNA, and AR wrote it. MMR3 and MMR4 revised, edited, and improved it. All authors have read and agreed to the published version of the manuscript.
Funding
This work was supported by the Ministry of Agriculture, The Government of the People’s Republic of Bangladesh [Grant number 135015200, 2023), and denoted to Mohammad Nur Alam, and Aminur Rahman.
Conflicts of Interest
The authors have no competing interests.
References
- S. Goel, M. Singh, S. Grewal, A. Razzaq, S.H. Wani, Wheat Proteins: A Valuable Resource to Improve Nutritional Value of Bread, Front. Sustain. Food. Syst. (2021) 5 769681. [CrossRef]
- G.R. Goldberg, Nutrition in pregnancy: the facts and fallacies, Nursing Standard, (2003) 17 (19) 39-42. [CrossRef]
- WHO (World Health Organization), Malnutrition, (2024a) Retrieved 23 October 2024. Available online: https://www.who.int/news-room/fact-sheets/detail/malnutrition.
- UNICEF, Child Malnutrition, (2024) Retrieved 23 October 2024. Available online: https://data.unicef.org/topic/nutrition/malnutrition/.
- IHME (Institute for Health Metrics and Evaluation), Vitamin a deficiency level 3 risk (2024a) Retrieved 23 October 2024. Available online: https://www.healthdata.org/results/gbd_summaries/2019/vitamin-a-deficiency-level-3-risk.
- IHME (Institute for Health Metrics and Evaluation), Zinc deficiency Level 3 risk, (2024) Retrieved 23 October 2024. Available online: https://www.healthdata.org/sites/default/files/disease_and_injury/gbd_2019/topic_pdf/risk/97.pdf.
- USAID, Bangladesh: Nutrition Profile, (2024) Retrieved 23 October 2024. Available online: https://www.usaid.gov/sites/default/files/2022-05/USAID-Bangladesh_NCP.pdf.
- ICDDRB, Malnutrition, (2024) Retrieved 23 October 2024. Available online: https://www.icddrb.org/news-and-events/press-corner/media-resources/malnutrition.
- WBG (World Bank Group), Prevalence of anemia among children (% of children ages 6-59 months)-Bangladesh, (2024) Retrieved 23 October 2024. Available online: https://data.worldbank.org/indicator/SH.ANM.CHLD.ZS?locations=BD.
- USDA (United States Department of Agriculture), Agricultural Research Service Nutrient Database Laboratory USDA. In: National Nutrient Database for Standard Reference Release 28 (2016) USDA ARS, Beltsville, MD.
- R. Khanam, A.C. Lee, D.K. Mitra, M. Ram, S. Das Gupta, A. Quaiyu, A. Choudhury, P. Christian, L.C. Mullany, A.H. Baqui. Maternal short stature and under-weight status are independent risk factors for preterm birth and small for gestational age in rural Bangladesh, Eur. J. Clin. Nutr. (2019) 73(5), 733-742. [CrossRef]
- G.A. Stevens, C.J. Paciorek, M.C. Flores-Urrutia. National, regional, and global estimates of anaemia by severity in women and children for 2000-19: a pooled analysis of population-representative data (2022).
- WFP (World Food Programmee). Food Security and Nutrition in Bangladesh, (2024) Retrieved 23 October 2024. Available online: https://www.wfp.org/publications/food-and-nutrition-security-bangladesh.
- WHO (World Health Organization). Diabetes, (2024b). Available online: https://www.who.int/news-room/fact-sheets/detail/diabetes (2024).
- IDF (International Diabetes Federation). Diabetes around the world, (2024). Available online: https://idf.org/about-diabetes/what-is-diabetes/.
- T. Biswas, A. Islam, L.B. Rawal, et al. Increasing prevalence of diabetes in Bangladesh: a scoping review. Public Health (2016) 138, 4-11. [CrossRef]
- N.H. Cho, J.E. Shaw, S. Karuranga, et al. IDF diabetes atlas: global estimates of diabetes prevalence for 2017 and projections for 2045, Diabetes Res. Clin. Pract. (2018) 138, 271-81. 10.1016/j.diabres.2018.02.
- NGDM (National Guideline on Diabetes Mellitus). National guideline on diabetes mellitus, 2023, Non-Communicable Disease Control Programme (NCDC), Directorate General of Health Services (DGHS), Ministry of Health & Family Welfare, Mohakhali, Dhaka 1212, Bangladesh (2023).
- Q. Nahar, S. Choudhury, M.O. Faruque, S.S.S. Saliheen Sultana, M.A. Siddiquee. Dietary guidelines for Bangladesh (DGB). National food policy capacity strengthening programme. BIRDEM, Dhaka, June 2013 (2013).
- S. Mustafa, C.E. Haque, S. Baksi. Low daily intake of fruits and vegetables in rural and urban Bangladesh: influence of socioeconomic and demographic factors, Social food beliefs and behavioural practices. Nutrients, (2021) 13(8). [CrossRef]
- S. Akhtar, J.A. Nasir, A. Sarwar A, et. al. Prevalence of diabetes and pre-diabetes in Bangladesh: a systematic review and meta-analysis, BMJ Open, 2020 10(9), e036086. [CrossRef]
- S. Allender, B. Lacey, P. Webster, et al. Level of urbanization and noncommunicable disease risk factors in Tamil Nadu, India. Bull. World Health Organ. (2010) 88, 297304.
- ADA (American Diabetes Association). Diagnosis and classification of diabetes mellitus. Diabetes Care (2010), 33 Suppl 1:S62-9. [CrossRef]
- BBS. Population and Housing Census 2022 (Preliminary Report), Bangladesh Bureau of Statistics, Statistics and Informatics Division, Ministry of Planning, Government of the People’s Republic of Bangladesh, Agargaon, Dhaka-1207, Bangladesh (2022).
- BADC (Bangladesh Agricultural Development Corporation). Miscellaneous Info: Seed production Target (2024). Link: https://badc.gov.
- A.K. Padhy, P. Kaur, S. Singh, L. Kashyap, A. Sharma. Colored wheat and derived products: key to global nutritional security, Critical Rev. Food Sci. Nutri. (2022) 64(7), 1894-1910. [CrossRef]
- K.K. Adom, R.H. Liu. Antioxidant activity of grains, J. Agric. Food Chem. (2002) 50(21), 6182-6187.
- I.Z. Islam, B.J. Park, Y.T. Lee. Effect of salinity stress on bioactive compounds and antioxidant activity of wheat microgreen extract under organic cultivation conditions, Int. J. Biol. Macromol. (2019) 140, 631-636. [CrossRef]
- M.Z. Islam, B.J. Park, Y.-T. Lee. Influence of selenium biofortification on the bioactive compounds and antioxidant activity of wheat microgreen extract, Food Chem. (2020) 309,125763. [CrossRef]
- M.Z. Islam, B-J. Park, Y-T Lee. Bioactive phytochemicals and antioxidant capacity of wheatgrass treated with salicylic acid under organic soil cultivation, Chem. Biodiver. (2021a) 18(2), e2000861. [CrossRef]
- M.Z. Islam, B-J. Park, Y-T Lee. Influence of temperature conditions during growth on bioactive compounds and antioxidant potential of wheat and barley grasses, Foods, (2021b) 10(11), 2742. [CrossRef]
- M.Z. Islam, B-J. Park, S-Y. Jeong, et al. Assessment of biochemical compounds and antioxidant enzyme activity in barley and wheatgrass under water-deficit conditions, J. Sci. Food Agric. (2022) 102(5), 1995-2002. [CrossRef]
- FAO. Crop prospects and food situation - Quarterly global report No. 1, March 2022. Rome, 2022. [CrossRef]
- FAO. IFAD. UNICEF. WFP. WHO. The State of food security and nutrition in the world 2022. Repurposing food and agricultural policies to make healthy diets more affordable, Rome, FAO (2022). [CrossRef]
- M.C. Martínez-Ballesta, R. Dominguez-Perles, D.A. Moreno, et al. Minerals in plant food: effect of agricultural practices and role in human health. A review, Agron Sustain Dev, Springer Verlag/EDP Sciences/INRA, (2010) 30 (2). [CrossRef]
- Q. Nahar, S. Choudhury, M.O. Faruque, S.S.S. Saliheen Sultana, M.A. Siddiquee. Dietary Guidelines for Bangladesh (DGB). National Food Policy Capacity Strengthening Programme, BIRDEM, Dhaka, June 2013 (2013).
- H. Wieser, P. Koehler, K.A. Scherf. The Two faces of wheat. 7 (2020). [CrossRef]
- Jideani, D. Beswa. Review Composition and functionality of wheat bran and its application in some cereal food products, Int. J. Food Sci. Tech. (2015) 50(12), 2509–2518. [CrossRef]
- B. Kumar, N. Tirkey, S. Kumar. Chemical Science Review and Letters. Anti-Nutrient in Fodders: A Review, Chem. Sci. Rev. Lett. (2017) 6(24), 2513-2519.
- Z. Ang. Effect of wheat flour with different quality in the process of making flour products, Int. J. Metrol. Quality Engg. (2020) 1-6. [CrossRef]
- W.H.M. Alrayyes. Open PRAIRIE: Open public research access institutional repository and information exchange nutritional and health benefits enhancement of wheat-based food products using chickpea and distiller’s dried grains (Thesis), Brookings: South Dakota State University (2018).
- M.H. Mughal. Wheat compounds - A comprehensive review, (2019) 6:1-6. [CrossRef]
- P. Farming. In: Importance of wheat in animal feed and production. In: All information about veterinary medicine and animal production [Internet], (2021). Available online: https://www.veterinariadigital.com/en/articulos/importance-of-wheat-in-animal-feed-and-production/.
- H.H. Stein, A.A. Pahm, J.A. Roth. Feeding wheat to pigs [Internet] (2010). Available online: https://nutrition.ansci.illinois.edu/sites/default/files/SwineFocus002.pdf.
- D. Kokoszyński. Whole wheat in commercial poultry production. Wheat and rice in disease prevention and health, (2014) 41-55. [CrossRef]
- Arnarson. Wheat 101: Nutrition facts and health effects [Internet] (2019). Available online: https://www.healthline.com/nutrition/foods/wheat.
- Ocheme, O.E. Adedeji, C.E. Chinma, C.M. Yakubu, U.H. Ajibo. Proximate composition, functional, and pasting properties of wheat and groundnut protein concentrate flour blends. Food Sci Nutr, (2018) 6(5), 1173-1178. [CrossRef]
- C.D. Nandini, P.V. Salimath. Carbohydrate composition of wheat, wheat bran, sorghum, and bajra with good chapatti/roti (Indian flat bread) making quality. Food Chem. (2001) 73:197-203. [CrossRef]
- W. Li, J. Gao, G. Wu, et al. Physicochemical and structural properties of A- and B-starch isolated from normal and waxy wheat: Effects of lipids removal. Food Hydrocol. (2016) 60, 364-373. [CrossRef]
- K. Gebruers, E. Dornez, Z. Bedõ, et al. Environment and genotype effects on the content of dietary fiber and its components in wheat in the health grain diversity screen. J. Agric. Food Chem. (2010), 58(17), 9353-9361. [CrossRef]
- D. Godfrey, M.J. Hawkesford, S.J. Powers, S. Millar, P.R. Shewry. Effects of crop nutrition on wheat grain composition and end-use quality. J. Agric. Food Chem. (2010) 58(5), 3012-3021. [CrossRef]
- G. Gartaula, S. Dhital, G. Netzel, et al. Quantitative structural organization model for wheat endosperm cell walls: Cellulose as an important constituent. Carbohydr. Polym. (2018) 196, 199-208. [CrossRef]
- Healthline. Wheat 101: Nutrition facts and health effects, (2024). Available online: https://www.healthline.com/nutrition/foods/wheat#nutrition.
- M. Garg, A. Sharma, S. Vats, et al. Vitamins in cereals: A critical review of content, health effects, processing losses, bio-accessibility, fortification, and biofortification strategies for their improvement. Front. Nutr. (2021), 8, 586815. [CrossRef]
- M.G. Traber, R.S. Bruno: Chapter 7 - Vitamin E, Editor(s): P. Bernadette, D.F. Marriott, A.V. Birt, Stallings, A.A. Yates. Present knowledge in nutrition (Eleventh Edition), Academic Press, (2020) p.115-136. [CrossRef]
- P.R. Shewry, S.J. Hey. The contribution of wheat to human diet and health. Food and Enei G, Aleshin V, Parkhomenko Y, et al. Molecular mechanisms of the non-coenzyme action of thiamin in brain: biochemical, structural and pathway analysis. Sci. Reports, (2015) 1-26. [CrossRef]
- Z. Ang. Effect of wheat flour with different quality in the process of making flour products. Int. J. MetroL. Quality EngG. (2020) 1-6. [CrossRef]
- S. Redzic, M.F. Hashmi, V. Gupta. Niacin deficiency. [Updated 2023 Jul 25]. In: StatPearls [Internet]. Treasure Island (FL): StatPearls Publishing, (2024). Available online: https://www.ncbi.nlm.nih.gov/books/NBK557728/.
- R.B. Rucker. Pantothenic acid. Linus Pauling Institute [Internet], (2015). Available online: https://lpi.oregonstate.edu/mic/vitamins/pantothenic-acid.
- V.R. Da Silva, J.F. Gregory III. “Vitamin B6”. In: B.P. Marriott, D.F. Birt, V.A. Stallings, A.A, Yates, editors. Present knowledge in nutrition, 11th ed. London: Elsevier, 225-38 (2020). [CrossRef]
- W.T. Penberthy, M. Sadri, J. Zempleni. In: BP Marriott, DF Birt, VA Stallings, AA Yates, (eds). Present knowledge in nutrition. 11th ed. London, United Kingdom: Academic Press (Elsevier), 289-304 (2020).
- K. Fekete, C. Berti, M. Trovato, et al. Effect of folate intake on health outcomes in pregnancy: a systematic review and meta-analysis on birth weight, placental weight and length of gestation. Nutri. J. (2012) 1, 75. [CrossRef]
- P. Das, S. Adak, A. Lahiri Majumder. (2020) Genetic manipulation for improved nutritional quality in rice. Front. Genet. (2020), 11, 776.
- Rice, In Wikipedia (2024). Available online: https://en.wikipedia.org/wiki/Rice.
- Saritha, A.V. Ramanjaneyulu, N. Sainath, E. Umarani. Nutritional Importance and Value Addition in Maize. Biotica Research Today (2020), 2(9), 974/977.
- Wheat, In: Wikipedia (2024). Available online: https://en.wikipedia.org/wiki/Wheat.
- N. Yankah, F.D. Intiful, A.E.M. Tette. Comparative study of the nutritional composition of local brown rice, maize (obaatanpa), and millet-A baseline research for varietal complementary feeding. Food Sci. Nutri. (2020) 8(6), 2692-2698. [CrossRef]
- Feedinamics. Grain of soft wheat (Triticum aestivum L., also known as Triticum aestivum L. subsp. aestivum), (2024). Available online: https://www.feedtables.com/content/wheat-soft.
- R.E. Jocelyne, K. Béhiblo, A.K. Ernest. Comparative study of the nutritional value of wheat, maize, sorghum, millet, and fonio: some cereals commonly consumed in Cote d’Ivoire. Euro. Sci. J. (2020), 16(2), 118-131. [CrossRef]
- B. Juliano, T. Arvin. Gross structure and composition of the rice grain, (2019). [CrossRef]
- M.H. Mughal, Wheat compounds - A comprehensive review, 2019, 6, 1-6. [CrossRef]
- FAO (Food and Agriculture Organization). Crop prospects and food situation - Quarterly global report No. 1, 2022. Rome (2022). [CrossRef]
- N. Kumari, N. Rawat, T.V. Tiwari, et al. Development and molecular characterization of wheat- Aegilops longissima derivatives with high grain micronutrients. Aust. J. Crop Sci. 2013, 7(4), 508-514.
- Arnarson, Wheat 101: Nutrition facts and health effects [Internet], (2019). Available online: https://www.healthline.com/nutrition/foods/wheat.
- WHO (World Health Organization). Diabetes. World Health Organization (2024). Available online: https://www.who.int/news-room/fact-sheets/detail/diabetes.
- S. Bencze, M. Makádi, T.J. Aranyos, et al. Re-introduction of ancient wheat cultivars into organic agriculture-emmer and einkorn cultivation experiences under marginal conditions. Sustainability, 2020, 12(4), 1584. [CrossRef]
- IOM (Institute of Medicine). Standing committee on the scientific evaluation of dietary reference intakes. Dietary reference intakes for calcium and vitamin D. Washington (DC): The National Academies Press (US). 2011.
- IOM (Institute of Medicine). Standing committee on the scientific evaluation of dietary reference intakes. Dietary reference intakes for Vitamin C, Vitamin E, Selenium, and Carotenoids. Washington (DC): The National Academies Press (US). 2000.
- IOM (Institute of Medicine). Standing committee on the scientific evaluation of dietary reference intakes. Dietary reference intakes for Vitamin A, Vitamin K, Arsenic, Boron, Chromium, Copper, Iodine, Iron, Manganese, Molybdenum, Nickel, Silicon, Vanadium, and Zinc. Washington (DC): The National Academies Press (US), (2001).
- W. Biel., A Jaroszewska, S. Stankowski et al. Comparison of yield, chemical composition and farinograph properties of common and ancient wheat grains. Eur. Food Res. Technol. (2021) 247, 1525-1538. [CrossRef]
- Hussain, H. Larsson, R. Kuktaite, E. Johansson. Mineral composition of organically grown wheat genotypes: contribution to daily minerals intake. Int. J. Envirnl Res Public Health (2010), 7(9), 3442-56. [CrossRef]
- D.R. Jacobs Jr, K.A. Meyer, L.H. Kushi, A.R. Folsom. Whole-grain intake may reduce the risk of ischemic heart disease death in postmenopausal women: the Iowa Women’s Health Study. Am. J. Clin. Nutri. (1998) 68(2), 248-257. [CrossRef]
- K.Y. Renkema, R.T. Alexander, R.J. Bindels, G. Hoenderop. Calcium and phosphate homeostasis: Concerted interplay of new regulators, Ann, Med. (2008) 40, 82-91. [CrossRef]
- J.L. Shaker, L. Deftos. Calcium and phosphate homeostasis. In: K.R. Feingold, B. Anawalt, A. Boyce, et al., editors. Endotext [Internet]. South Dartmouth (MA): MDText.com, Inc.; 2000, 2023. Available online: https://www.ncbi.nlm.nih.gov/books/NBK279023/.
- K.O. Soetan, C.O. Olaiya, O.E. Oyewole. The importance of mineral elements for humans, domestic animals, and plants: A review. African J. Food Sci. 2010, 4(5), 200-222. Available online http://www.academicjournals. Available online: http://www.academicjournals.org/ajfs.
- V. Kasche, Z. Ignatova, H. Märkl H, et al. Ca2+ is a cofactor required for membrane transport and maturation and is a yield-determining factor in high-cell-density penicillin amidase production. Biotechnology Progress, (2005) 21(2), 432-8. [CrossRef]
- I.D. Volotovski, S.G. Sokolovsky, O.V. Molchan, M.R. Knight. Second messengers mediate increases in cytosolic calcium in tobacco protoplasts. Plant Physiol (1998) 17(3), 1023-30. [CrossRef]
- Theobald H. Dietary calcium and health. Nutrition Bulletin (2005) 30, 237–277.
- G. Rinonapoli, V. Pace V, C. Ruggiero, et al. Obesity and Bone: A complex relationship. International Journal of Molecular Science, (2021) 22, 13662. [CrossRef]
- U. Gröber, J. Schmidt, K. Kisters. Magnesium in prevention and therapy. Nutrients. (2015), 23, 7(9), 8199-226. [CrossRef]
- M. Barbagallo, N. Veronese, L.J. Dominguez. Magnesium in aging, health, and diseases. Nutrients, (2021) 13(2), 463. [CrossRef]
- S.L. Volpe, Magnesium in disease prevention and overall health. Advances in Nutrition. (2013) 4(3), 378S-83S. [CrossRef]
- F.A. Ajib, J.M. Childress. Magnesium Toxicity. In: StatPearls [Internet] (2023). Available online: https://www.ncbi.nlm.nih.gov/books/NBK554593/.
- Shrimanker, S. Bhattarai. Electrolytes. In StatPearls [Internet] (2022). Available online: https://pubmed.ncbi.nlm.nih.gov/31082167/.
- Hyponatremia, In Wikipedia (2022). Available online: https://en.wikipedia.org/wiki/Hyponatremia.
- R.B. Saper, R. Rebecca. Zinc: an essential micronutrient. Am. Fam. Physician (2009), 79(9), 768-72.
- W. Maret. Zinc biochemistry: from a single zinc enzyme to a key element of life. Advances in Nutrition (2013), 4(1), 82-91. [CrossRef]
- F. Guerrero-Romero, M. Rodríguez-Morán. Complementary therapies for diabetes: The case for chromium, magnesium, and antioxidants. Archives Med. Res. (2005) 36, 250-257.
- Shenkin. Basics in clinical nutrition: Physiological function and deficiency states of trace elements, e-SPEN, (2008) 3, 255-258. [CrossRef]
- M.G. Angelova, T.V. Petkova-Marinova, M.V. Pogorielov, et al. Trace Element Status (Iron, Zinc, Copper, Chromium, Cobalt, and Nickel) in iron-deficiency anaemia of children under 3 Years. Anemia (2014) 718089. [CrossRef]
- G.O. Rennan, R.G.O. Araujo, S.M. Macedo. M.G.A. Korn, et al. Mineral composition of wheat flour consumed in Brazilian cities. J. Brazilian Chem. Soci. (2008) 19(5), 935-942. [CrossRef]
- L. Li, X. Tian, X. Yu, S. Dong. Effects of acute and chronic heavy metal (Cu, Cd, and Zn) exposure on sea cucumbers (Apostichopus japonicus). BioMed Res. Int. (2016), 6:4532697. [CrossRef]
- J.L. Porter, P. Rawla. Hemochromatosis. In: StatPearls [Internet], (2022). Available online: https://www.ncbi.nlm.nih.gov/books/NBK430862/.
- L. Li, X. Yang. The essential element manganese, oxidative stress, and metabolic diseases: Links and interactions. Oxid. Med. Cell. Longev. (2018) 7580707. [CrossRef]
- F. Pizarro, M. Olivares, R. Uauy, et al. Acute gastrointestinal effects of graded levels of copper in drinking water. Environ. Health Perspect (1999) 107(2), 117-21. [CrossRef]
- S. Hariharan, S. Dharmaraj. Selenium and selenoproteins: It role in regulation of inflammation. Inflammo-pharmacology. Nature Public Health Emergency Collection, (2020) 28(3), 667-695. [CrossRef]
- M. Vinceti, T. Filippini, C. Del Giovane, et al. Selenium for preventing cancer. Cochrane Database of Systematic Reviews (2018) 1(1), CD005195. [CrossRef]
- L.H. Duntas. Selenium and the thyroid: A Close-Knit connection, J. Clin. Endocrin. Metabol. (2010), 95(12), 5180-5188. [CrossRef]
- G. Barchielli, A. Capperucci, D. Tanini. The role of selenium in pathologies: an updated review. Antioxidants (Basel), (2022) 27, 11(2), 251. [CrossRef]
- P.J. Havel. A scientific review: the role of chromium in insulin resistance. The diabetes educator (2004) Suppl:2-14.
- Hen, M. Kan, P. Ratnasekera, et al. Blood chromium levels and their association with Cardiovascular diseases, diabetes, and depression: National health and nutrition examination survey (NHANES) 2015-2016. Nutrients (2022) 14(13), 2687. [CrossRef]
- P.B. Tchounwou, C.G. Yedjou, A.K. Patlolla, D.J. Sutton. Heavy metal toxicity and the environment. Mol. Clin. Environ Toxicol (2012) 01, 133-64. [CrossRef]
- J.R. González-Montaña, F. Escalera-Valente, A.J. Alonso, et al. Relationship between Vitamin B12 and Cobalt Metabolism in Domestic Ruminant: An Update. Animals (Basel), (2020) 10(10), 1855. [CrossRef]
- M. Packer. Cobalt Cardiomyopathy: A critical reappraisal in light of a recent resurgence. circulation: Heart Failure (2016) (12), 9. [CrossRef]
- G. Schwartz. Molybdenum cofactor biosynthesis and deficiency. Cell. Mol. Life Sci. (2005) 62, 2792-2810.
- S. Xiao-Yun, D. Guo-Zhen, L. Hong. Studies of a naturally occurring molybdenum-induced copper deficiency in the yak, Veterinary J. 2006, 171(2), 352–357. [CrossRef]
- R. Singh. Wheat: Uses, Benefits, Side Effects, (2022). Available online: https://pharmeasy.in/blog/ayurveda-uses-benefits-side-effects-of-wheat/.
- P. Goufo, H. Trindade. Rice antioxidants: phenolic acids, flavonoids, anthocyanins, and phytic acid. Food Sci Nutri (2014) 75. [CrossRef]
- H. Kang, M-G. Lee, J-K. Lee, Y-H. Choi, Y-S. Choi. Enzymatically-Processed Wheat Bran Enhances Macrophage Activity and Has in Vivo Anti-Inflammatory Effects in Mice. Nutrients (2016) 8(4),188. [CrossRef]
- S.S. Anand, C. Hawkes, R.J. de Souza, et al. Food consumption and its impact on cardiovascular disease: the importance of solutions focused on the globalized food system: A report from the workshop convened by the world heart federation. J Am College Cardiol. (2015) 66(14), 1590-1614. [CrossRef]
- M. Jessri, B. Rashidkhani. Dietary patterns and risk of gallbladder disease: a hospital-based case-control study in adult women. J. Health Population Nutri. (2015) 33(1), 39-49.
- M.C. Lephuthing, T.A. Baloyi, N.Z. Sosibo, T.J. Tsilo. Progress and challenges in improving nutritional quality in wheat. In: Wanyera R, Owuoche J, editors. Wheat improvement, management, and utilization. 2nd. ed. IntechOpen 345 (2017). [CrossRef]
- C. Uauy, A. Distelfeld, T. Fahima, A. Blechl, J. Dubcovsky J. An NAC gene regulating senescence improves grain protein, Zn and Fe content in wheat. Sci, 2006, 314, 1298–1301.
- S.W. Souci, W. Fuchmann, H. Kraut. 1986. Food composition and nutrition tables 1986187, 3rd Rev. Ed. Stuttgart, Wissenschaftliche Verlagsgesellschaft mbH (1986).
- B.O. Eggum. Evaluation of protein quality and the development of screening techniques. In New approaches to breeding for improved plant protein, p. 125- 135. Vienna, IAEA (1969).
- B.O. Eggum, Nutritional aspects of cereal protein. In A. Muhammad, R. Aksel & R.C. von Boustel, eds. Genetic diversity in plants, p. 349369. New York, Plenum Press (1977).
- B.O. Eggum, The nutritional value of rice in comparison with other cereals. In Proceedings, Workshop on Chemical Aspects of Rice Grain Quality, p. 91-111. Los Baños, Laguna, the Philippines, IRRI (1979).
- H. Bradbury, W.D. Holloway. Chemistry of tropical root crops: significance for nutrition and agriculture in the Pacific. Canberra, Australian Centre for International Agricultural Research. 201 (1988).
- WHO. 1985. Energy and protein requirements. Report of a Joint FAO/WHO/UNU Expert Consultation WHO Tech. Rep. Ser. 724. Geneva WHO. 206 (1985).
- FNRI (Food and Nutrition Research Institute). 1980. Food composition tables, recommended for use in the Philippines. FNRI Handbook 1, 5th rev. Manila, FNRI, (1980) pp. 313.
- D. Hopkins. Effect of variation in protein digestibility. In C.E. Bodwell, J.S. Adkins & D.T. Hopkins, eds. Protein quality in humans: assessment and in vitro estimation, (1981) p.169-193. Westport, CT, USA, AVI Publishing Co.
- B.O. Juliano. Factors affecting nutritional properties of rice protein. Trans. Natl. Acad. Sci. Technol. (Philipp.), (1985a) 7, 205-216.
- B. Pedersen, B.O. Eggum. The influence of milling on the nutritive value of flour from cereal grains. IV. Rice. Qual. Plant. Plant Foods Hum. Nutr. (1983) 33, 267-278.
- B.O. Juliano. ed. Rice: chemistry and technology, 2nd ed. St Paul, MN, USA, Am. Assoc. Cereal Chem. (1985b), pp. 774 pp.
- B.O. Eggum, B.O. Juliano, C.C. Maniñgat. Protein and energy utilization of rice milling fractions by rats. Qual. Plant. Plant Foods Hum. Nutr. (1982.) 31,371-376.
- WHO. Energy and protein requirements. Report of a Joint FAO/WHO/UNU Expert Consultation. WHO Tech. Rep. Ser. 724. Geneva, WHO. (1985) pp. 206.
- H.W. Wiesner. H.-D. Seilmeier, Belitz. Vergleichende Untersuchungen uber partielle Aminosauresequenzen von Prolaminen und Glutelinen verschriedener Getreidearten. Z. Lebensm. Unters. Forsch. (1980) 170, 17.
- M.C. Lephuthing, T.A. Baloyi, N.Z. Sosibo, T.J. Tsilo. Progress and challenges in improving nutritional quality in wheat. In: R. Wanyera, J. Owuoche, editors. Wheat improvement, management, and utilization. 2nd. ed. IntechOpen (2017) p.345. [CrossRef]
- Bharti, N. Pandey, D. Shankhdhar, P.C. Srivastava, S.C. Shankhdhar. Improving nutritional quality of wheat through soil and foliar zinc application. Plant Soil Environ. (2013) 59, 348-352.
- S. Ghasemi, A.H. Khoshgoftarmanesh, M. Afyuni, H. Hadadzadeh. The effectiveness of foliar applications of synthesized zink-amino acid chelates in comparison with zinc sulfate to increase yield and grain nutritional quality of wheat. Eur. J. Agron. (2013) 45, 68-74.
- Pasqualone, L.N. Delvecchio, G. Gambacorta G, et al. Effect of supplementation with wheat bran aqueous extracts obtained by ultrasound-assisted technologies on the sensory properties and the antioxidant activity of dry pasta. Nat. Products Commun. (2015) 10(10), 1739-42.
- Li L, Shewry PR, Ward JL. Phenolic acids in wheat varieties in the HEALTHGRAIN diversity screen. Journal of agricultural and food chemistry. 2008;56(21):9732–9739. [CrossRef]
- D.M. Lebesi, C. Tzia. Effect of the addition of different dietary fiber and edible cereal bran sources on the baking and sensory characteristics of cupcakes. Food Bioproc. Tech. (2011) 4, 710–722.
- S. Ragaee, I. Guzar, N. Dhull, K. Seetharaman. Effects of fiber addition on antioxidant capacity and nutritional quality of wheat bread, LWT - Food Science and Technology. (2011) 44, 2147-2153.
- D. Zhang, W.M. Moore. Wheat bran particle size effects on bread baking performance and quality, (1999) 79(6), 805-809.
- N.K.M. Alparce, A.K. Anal, Food processing by-products as sources of functional foods and nutraceuticals. In: A. Noomhorm, I. Ahmad, A.K. Anal, eds. Functional foods and dietary supplements: Processing effects and health benefits. Chichester: John Wiley & Sons Ltd., (2014) pp. 164-166.
- S. Kuznesof, I.A. Brownlee, C. Moore, D.P. Richardson, S.A. Jebb, C.J. Seal. Whole heart study participant acceptance of wholegrain foods. Appetite, (2012) 59, 187-193.
- M.G. Ferruzzi, S.S. Jonnalagadda, S. Liu, et al. Developing a standard definition of whole-grain foods for dietary recommendations: Summary report of a multidisciplinary expert roundtable discussion. Adv. Nutri. (2014) 5, 164-176. [CrossRef]
- C.S. Brennan, C.M. Tudorica. Fresh pasta quality is affected by the enrichment of non-starch polysaccharides. J. Food Sci. (2007) 72, S659–S665. [CrossRef]
- Foschia, D. Peressini, A. Sensidoni, M.A. Brennan, C.S. Brennan. How combinations of dietary fibers can affect the physicochemical characteristics of pasta. Food Science and Technology, (2015) 61, 41–46.
- N.M. Edwards, C.G. Biliaderis, Dexter JE. Textural characteristics of whole wheat pasta and pasta containing non-starch polysaccharides. J. Food Sci. (1995) 60, 1321-1324.
- D. Gazzolaa, S. Vincenzia, L. Gastaldona, S. Tolinb, G. Pasinia, A. Curionia. The proteins of the grape (Vitis vinifera L.) seed endosperm: Fractionation and identification of the major components. Food Chem. (2014) 155, 132–139.
- Wang, R.J. Hamer, T. van Vliet, et al. Effect of water unextractable solids on gluten formation and properties: Mechanistic considerations. J. Cereal Sci. (2003), 37, 55–64. [CrossRef]
- D. Peressini, A. Sensidoni. Effect of soluble dietary fiber addition on rheological and breadmaking properties of wheat doughs. J. Cereal Sci. (2009) 49,190-201.
- Borrill, J.M. Connorton, J. Balk, et al. Biofortification of wheat grain with iron and zinc: integrating novel genomic resources and knowledge from model crops. Front. Plant Sci. (2014) 5, 53. [CrossRef]
- B.M. Waters, R.P. Sankaran. Moving micronutrients from the soil to the seeds: genes and hysiological processes from a biofortification perspective. Plant Sci. (2011) 180, 562-574. [CrossRef]
- S.A. Kim, M.L. Guerinot. Mining iron: Iron uptake and transport in plants. FEBS Letter. (2007) 581, 2273-2280. [CrossRef]
- D. Ma, Y. Li, J. Zhang, C. Wang et al. Accumulation of phenolic compounds and expression profiles of phenolic acid biosynthesis-related genes in developing grains of white, purple, and red wheat. Front. Plant Sci. (2016) 7, 528. [CrossRef]
- B. Laddomada, m Durante, Mangini G, et al. Genetic variability for individual and total phenolic acids in a tetraploid wheat collection. Genet. Resour. Crop Evol. (2015). [CrossRef]
- J.E. Mayer, W.H. Pfeiffer, P. Beyer. Biofortified crops to alleviate micronutrient malnutrition. Curr. Opi. Plant Biol. (2008) 11, 166-170. [CrossRef]
- P.J. White, M.R. Broadley. Biofortification of crops with seven mineral elements often lacking in human diets iron, zinc, copper, calcium, magnesium, selenium, and iodine. New Phytol. (2009) 182, 49-84. [CrossRef]
- I Cakmak, WH Pfeiffer, B. McClafferty. Biofortification of durum wheat with zinc and iron: a review. Cereal Chem. (2010) 87, 10-20. [CrossRef]
- E.A, Waraich, R. Ahmad, Saifullah, S. Ahmad, A. Ahmad. Impact of water and nutrient Management on the Nutritional Quality of Wheat, J. Plant Nutri. (2010) 33(5), 640-643. [CrossRef]
- N. Kumari, N. Rawat, V.K. Tiwari, et al. Development and molecular characterization of wheat-Aegilops longissima derivatives with high grain micronutrients. Aust. J. Crop Sci. (2013) 7(4), 508–514.
- Kumar, P. Kapoor, V. Chunduri, S. Sharma, M. Garg. Potential of Aegilops sp. for improvement of grain processing and nutritional quality in wheat (Triticum aestivum). Front. Plant Sci. (2019) 10, 308. [CrossRef]
- N. Rawat, V.K. Tiwari, K. Neelam, et al. Development and characterization of Triticum aestivum-Aegilops kotschyi amphiploids with high grain iron and zinc contents. Plant Genetic Resources: Characterization and Utilization, (2009a) 7, 271–280. [CrossRef]
- N. Rawat, V.K. Tiwari, N. Singh, et al. Evaluation and utilization of Aegilops and wild Triticum species for enhancing iron and zinc content in wheat. Genet. Resour. Crop Evol. (2009b) 56, 53–64. [CrossRef]
- N. Rawat, K. Neelam, V.K. Tiwari, et al. Development and molecular characterization of wheat-Aegilops kotschyi addition and substitution lines with high grain protein, iron, and zinc. Genome, (2011) 54,943–953. [CrossRef]
- C. Uauy, A. Distelfeld, T. Fahima, A. Blechl, J. Dubcovsky. An NAC gene regulating senescence improves grain protein, Zn, and Fe content in wheat. Science. (2006) 314, 1298–1301.
- N. Rawat, K. Neelam, V,K. Tiwary, Dhaliwal HS. Biofortification of cereals to overcome hidden hunger. Plant Breed. (2013) 132, 437–445.
- H. Brinch-Pedersen, F. Hatzack, E. Stoger E, et al. Heat-stable phytases in transgenic wheat (Triticum aestivum L.): deposition pattern, thermostability, and phytate hydrolysis. J. Agric. Food Chem. (2006) 54, 4624-4632. [CrossRef]
- P.R. Shewry, G. Charmet, G. Branlard, et al. Developing new types of wheat with enhanced health benefits. Trends Food Sci. Tech. (2012) 25(2), 70–77. [CrossRef]
- R. Fernandez-Orozco, L. Li, C. Harflett, P.R. Shewry, J.K. Ward. Effects of environment and genotype on phenolic acids in wheat in the HEALTHGRAIN diversity screen. J. Agric. Food Chem. (2010) 58(17), 9341–9352. [CrossRef]
- P.R. Shewry, V. Piironen, A.M. Lampi, et al. The HEALTHGRAIN wheat diversity screen: Effects of genotype and environment on phytochemicals and dietary fiber components. J. Agric. Food Chem. (2010) 58(17), 9291–9298. [CrossRef]
- Z. Sramkova, E. Gregova, E. Sturdik. Chemical composition and nutritional quality of wheat grain. Acta Chimica Slovaca (2009) 2, 115-138.
Figure 1.
Foods prepared by wheat, maize, barley, foxtail millet, oats, and rice, respectively.
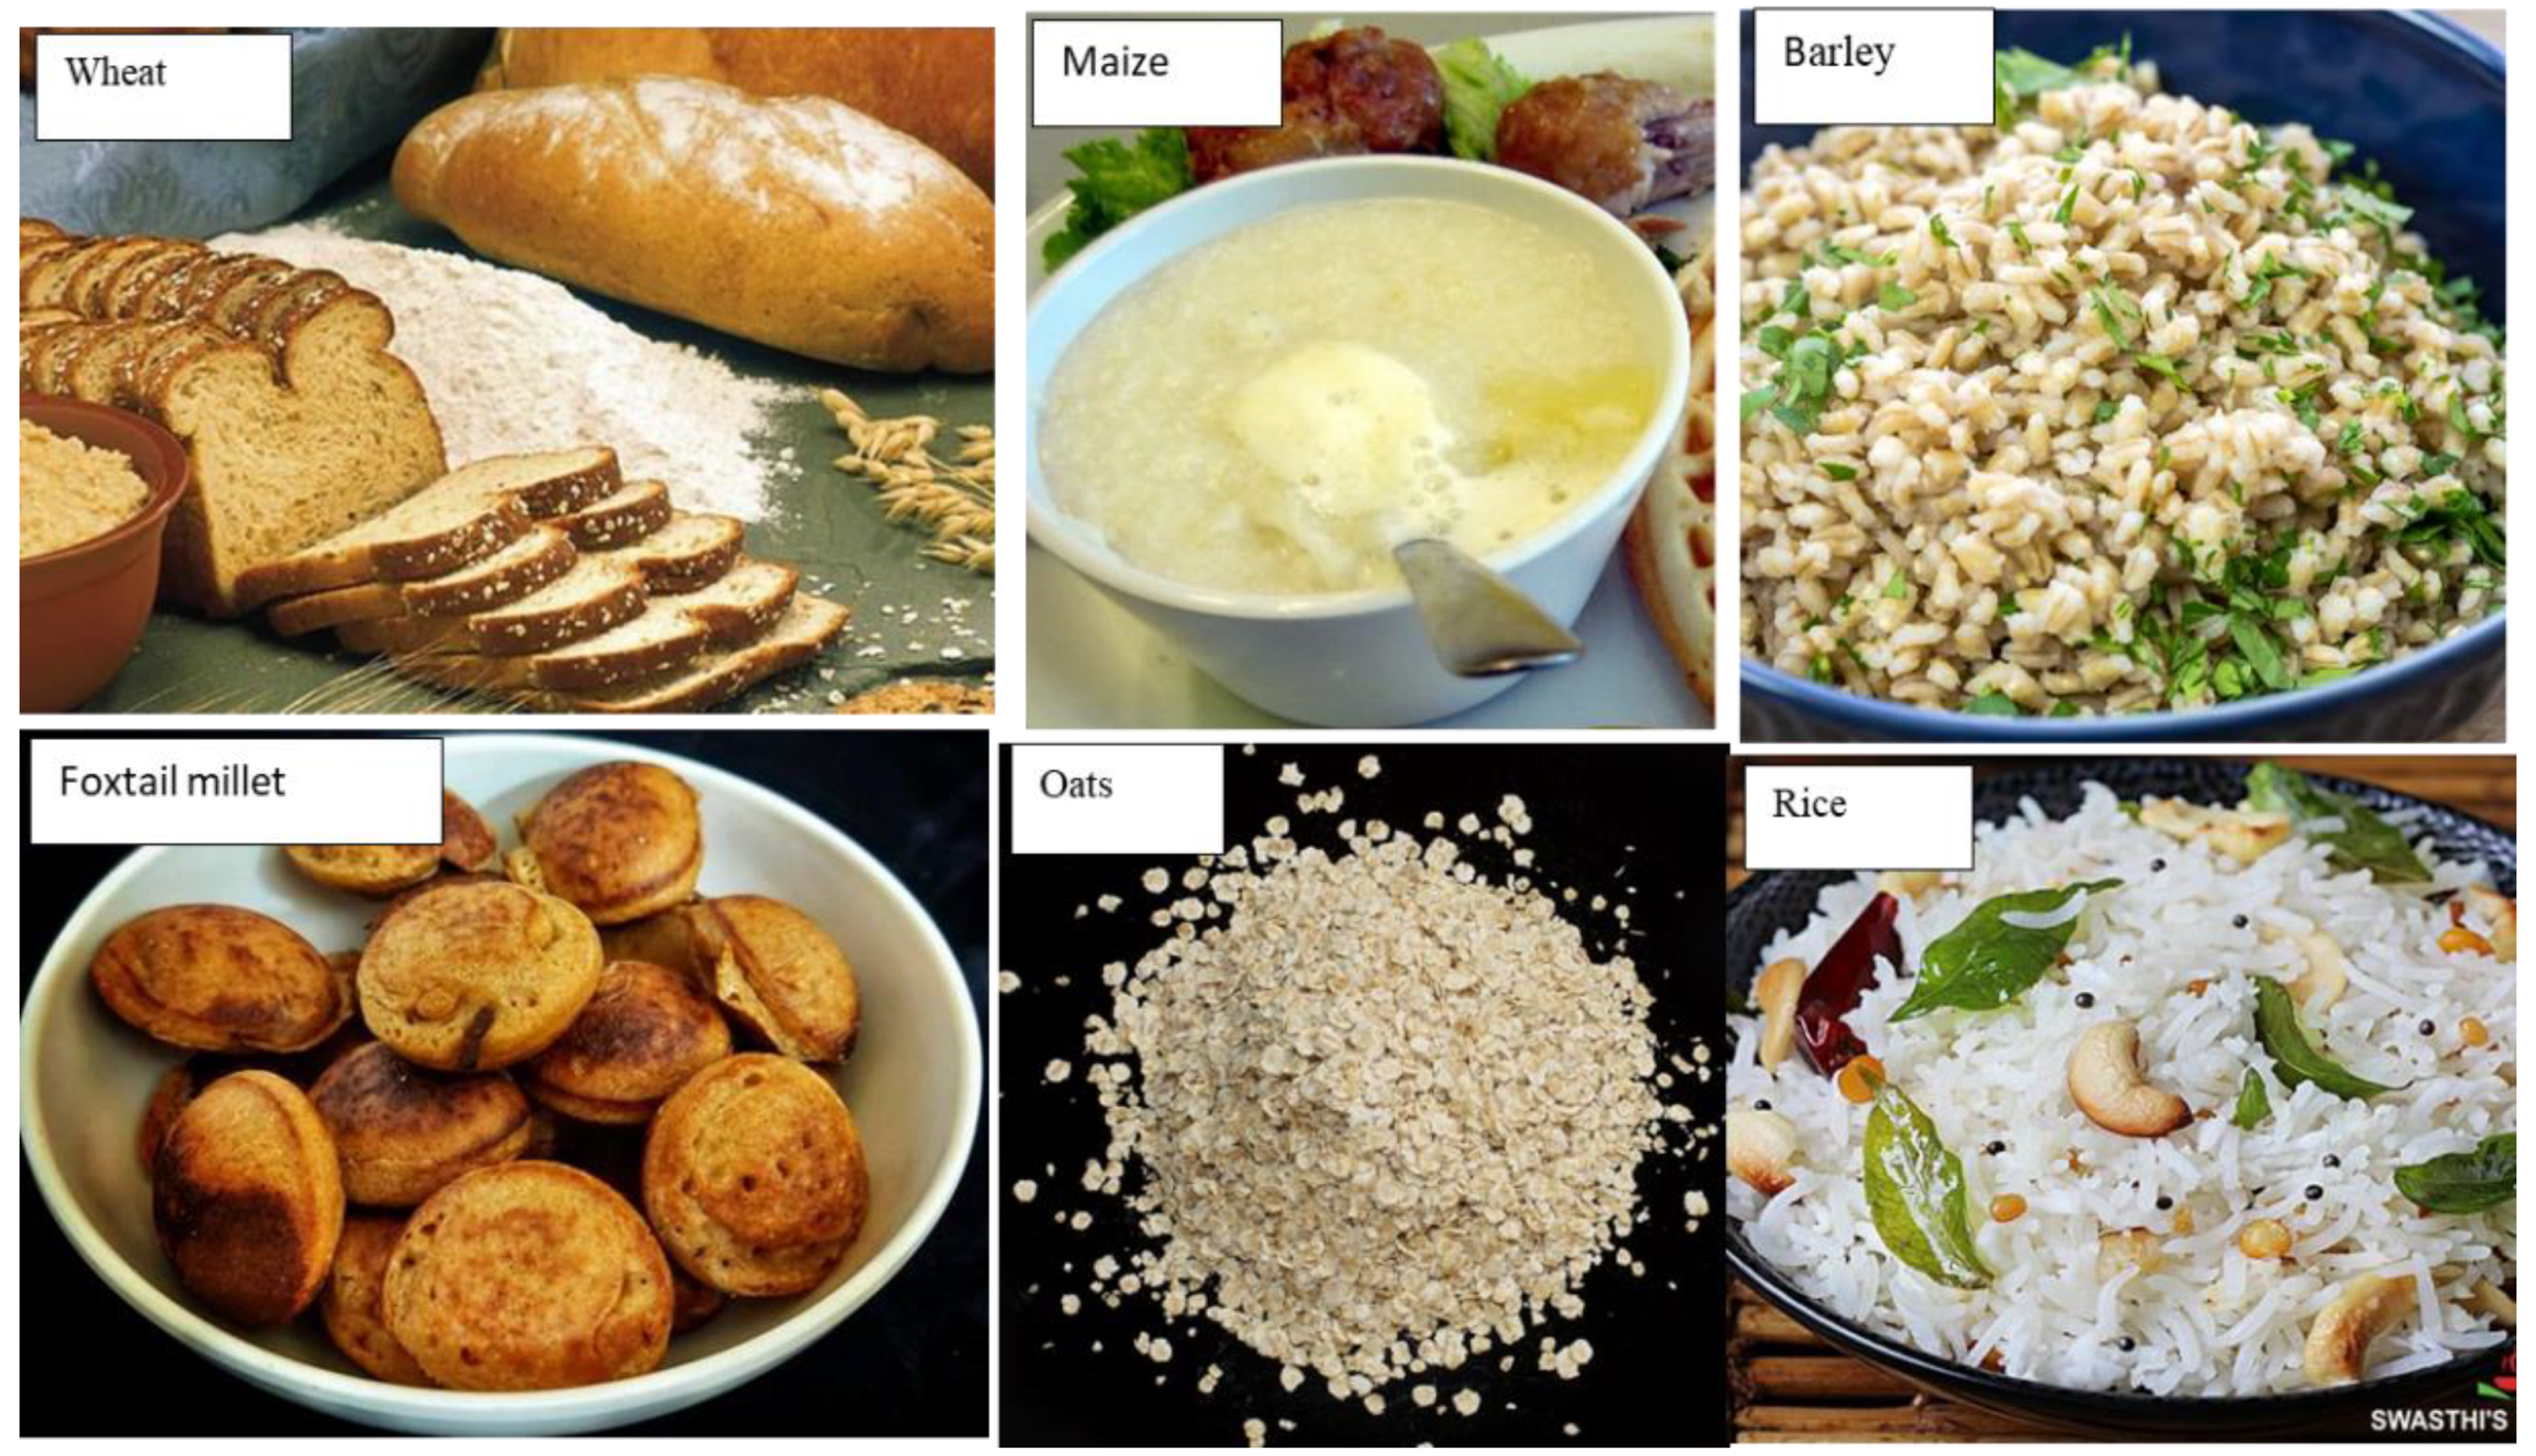
Table 4.
Recommended daily allowance of macro- and microelements for human health (Age: 19 - 65 years).
Table 4.
Recommended daily allowance of macro- and microelements for human health (Age: 19 - 65 years).
| Nutrients | g/day | Vitamins | mg/day | ||
|---|---|---|---|---|---|
| Male | Female | Male | Female | ||
| Energy | 2430 kcal/d | 2150kcal/d | Vitamin A | 600 | 600 |
| Carbohydrate | 130 | 130 | Thiamine (B1) | 1.2 | 1.1 |
| Protein | 33-66 | 33-66 | Riboflavin (B2) | 1.3 | 1.0 |
| Total fat | 20-35 | 20-35 | Niacin (B3) | 16 | 14 |
| Fibre | 30 | 25 | Pantothenic acid (B5) | 5 | 5 |
| Choline | 550 | 425 | Vitamin (B6) | 1.7 | 1.5 |
| Water | 3.7 L/d | 2.7 L/d | Vitamin E | 15 | 15 |
| Vitamins | µg/day | ||||
| Vitamin C | 90 | 75 | Biotin (B7) | 30 | 30 |
| Vitamin D | 20 | 20 | Folate (B9) | 400 | 400 |
| Vitamin K | 120 | 90 | Cobalamin (B12) | 2.4 | 2.4 |
| Minerals | |||||
| Macroelements | mg/day | Microelements | µg/day | ||
| Male | Female | Male | Female | ||
| Phosphorus | 700 | 700 | Cobalt | 300 | 275 |
| Calcium | 1000 | 1000 | Molybdenum | 45 | 45 |
| Magnesium | 260 | 220 | Nickel | 600 | 600 |
| Potassium | 3750 | 3225 | Iodine | 150 | 150 |
| Sodium | 2092 | 1902 | Molybdenum | 45 | 45 |
| Manganese | 2.3 | 1.8 | Chromium | 35 | 25 |
| Chloride | 2300 | 2300 | Fluoride | 4 | 3 |
| Zinc | 11 | 9 | Copper | 900 | 900 |
| Iron | 13.7 | 29.4 | Selenium | 55 | 55 |
| Manganese | 2.3 | 1.8 | |||
Table 5.
Proximate composition of cereal and tuber staple foods (per 100 g).
| Food | Moisture (%) | Protein (g N × 6.25) | Crude fat (g) | Available carbohydrates (g) | Fibre (g) | Crude ash (g) | Energy (kJ) | Energy (kcal) | ||
|---|---|---|---|---|---|---|---|---|---|---|
| Dietary | Water insoluble | Lignin | ||||||||
| Brown rice | 14.0 | 7.30 | 2.2 | 71.1 | 4.0 | (2.7) | (0.1) | 1.4 | 1 610 | 384 |
| Wheat | 14.0 | 10.6 | 1.9 | 61.6 | 10.5 | (7.8) | (0.6) | 1.4 | 1 570 | 375 |
| Maize | 14.0 | 9.80 | 4.9 | 60.9 | 9.0 | (6.8) | (0.0) | 1.4 | 1 660 | 396 |
| Millet | 14.0 | 11.5 | 4.7 | 64.6 | 37.0 | (2.3) | (0.0) | 1.5 | 1 650 | 395 |
| Sorghum | 14.0 | 8.30 | 3.9 | 57.4 | 13.8 | (12.4) | (3.0) | 2.6 | 1 610 | 384 |
| Rye | 14.0 | 8.70 | 1.5 | 60.9 | 13.1 | (8.4) | (1 4) | 1.8 | 1 570 | 375 |
| Oats | 14.0 | 9.30 | 5.9 | 63.0 | 5.5 | (39) | (0.0) | 2.3 | 1 640 | 392 |
| Potato | 77.8 | 2.00 | 0.1 | 15.4 | 2.5 | (1.9) | (0.0) | 1.0 | 294 | 70 |
| Cassava | 63.1 | 1.00 | 0.2 | 31.9 | 2.9 | (2.2) | (0.0) | 0.7 | 559 | 133 |
| Yam | 71.2 | 2.00 | 0.1 | 22.4 | 3.3 | (2.6) | (0.0) | 1.0 | 411 | 98 |
Table 6.
Vitamin and mineral content of cereal and tuber staple foods (per 100 g).
| Food | Carotene (mg) | Thiamine (mg) | Riboflavin (mg) | Niacin (mg) | Ascorbic acid (mg) | Vitamin E (mg) | Iron (mg%) | Zinca (mg%) |
|---|---|---|---|---|---|---|---|---|
| Brown rice | 0.0 | 0.29 | 0.04 | 4.0 | 0.0 | 0.8 | 3.0 | 2.0 |
| Wheat | 0.02 | 0.45 | 0.10 | 3.7 | 0.0 | 1.4 | 4.0 | 3.0 |
| Maize | 0.37 | 0.32 | 0.10 | 1.9 | 0.0 | 1.9 | 3.0 | 3.0 |
| Millet | 0.0 | 0.63 | 0.33 | 2.0 | 0.0 | 0.07 | 7.0 | 3,0 |
| Sorghum | 10.0 | 0.33 | 0.13 | 3.4 | 0.0 | 0.17 | 9.0 | 2,0 |
| Rye | 0.0 | 0.66 | 0.25 | 1.3 | 0.0 | 1.9 | 9.0 | 3,0 |
| Oats | 0.0 | 0.60 | 0.14 | 1.3 | 0.0 | 0.84 | 4,0 | 3,0 |
| Potato | 0.01 | 0.11 | 0.05 | 1.2 | 17.0 | 0.06 | 0.8 | 0.3 |
| Cassava | 0.03 | 0.06 | 0.03 | 0.6 | 30.0 | 0.0 | 1.2 | 0.5 |
| Yam | 0.01 | 0.09 | 0.03 | 0.6 | 10.0 | 0.0 | 0.9 | 0.7 |
| Brown rice | 0.0 | 0.29 | 0.04 | 4.0 | 0.0 | 0.8 | 3.0 | 2.0 |
| Wheat | 0.02 | 0.45 | 0.10 | 3.7 | 0.0 | 1.4 | 4.0 | 3,0 |
| Maize | 0.37 | 0.32 | 0.10 | 1.9 | 0.0 | 1.9 | 3.0 | 3,0 |
Table 7.
Amino acid and tannin content in whole-grain cereals and tubers.
| Food | Lysine (g/16 g N) |
Threonine (g/16 g N) |
Methionine + cystine (g/16 g N) | Tryptophan (g/16 g N) | Amino acid scorea (%) | Tannin (%) |
|---|---|---|---|---|---|---|
| Brown rice | 3.8 | 3.6 | 3.9 | 1.1 | 66 | 0.4 |
| Wheat | 2.3 | 2.8 | 3.6 | 1.0 | 40 | 0.4 |
| Maize | 2.5 | 3.2 | 3.9 | 0.6 | 43 | 0.4 |
| Millet | 2.7 | 3.2 | 3.6 | 1.3 | 47 | 0.6 |
| Sorghum | 2.7 | 3.3 | 2.8 | 1.0 | 47 | 1.6 |
| Rye | 3.7 | 3.3 | 3.7 | 1.0 | 64 | 0.6 |
| Oats | 4.0 | 3.6 | 4.8 | 0.9 | 69 | 1.1 |
| Potato | 6.3 | 4.1 | 3.6 | 1.7 | 100 | - |
| Cassava | 6.3 | 3.4 | 2.6 | 1.0 | 91 | - |
| Yam | 6.0 | 3.4 | 2.9 | 1.3 | 100 | - |
an All based on 5.8% lysine as 100%, except based on 1.1% tryptophan as 100% for cassava. [125,126,127,129,130] Lysine is the limiting essential amino acid in cereals, but oats and rice have the highest lysine content. In contrast, tuber proteins are rich in lysine but lack sulfur amino acids like cysteine and methionine. Whole-grain maize meal has protein quality similar to wheat due to its lysine-rich germ. While tuber proteins score higher than cereal proteins in amino acid content, this does not reflect actual digestibility. Rice has the highest protein digestibility among staples, and potato protein, though high in biological value, has lower net protein utilization than rice. Utilizable protein is comparable in brown rice, wheat, maize, rye, oats, and potato, but lower in sorghum and higher in millet. Cereal proteins are generally less digestible than egg and milk proteins. Cooked rice protein has a true digestibility of 89% in rats, lower than raw rice.
Table 10.
Vitamin and mineral content of rough rice and its milling fractions at 14 percent moisture.
Table 10.
Vitamin and mineral content of rough rice and its milling fractions at 14 percent moisture.
| Rice fraction | Thiamine (mg) | Riboflavin (mg) | Niacin (mg) | Tocopherol (mg) | Calcium (mg) | Phosphorus (g) | Phytin (g) | Iron (mg) | Zinc (mg) |
|---|---|---|---|---|---|---|---|---|---|
| Rough rice | 0.26-0.33 | 0.06-0.11 | 2.9-5.6 | 0.90-2.00 | 10-80 | 0.17-0.39 | 0.18-0.21 | 1.4-6.0 | 1.7-3.1 |
| Brown rice | 0.29-0.61 | 0.04-0.14 | 3.5-5.3 | 0.90-2.50 | 10-50 | 0.17-0.43 | 0.13-0.27 | 0.2-5.2 | 0.6-2.8 |
| Milled rice | 0.02-0.11 | 0.02-0.06 | 1.3-2.4 | 75-0.30 | 10-30 | 0.08-0.15 | 0.02-0.07 | 0.2-2.8 | 0.6-2.3 |
| Rice bran | 1.20-2.40 | 0.18-0.43 | 26.7-49.9 | 2.60-13.3 | 30-120 | 1.1-2.5 | 0.9-2.2 | 8.6-43.0 | 4.3-25.8 |
| Rice hull | 0.09-0.21 | 0.05-0.07 | 1.6-4.2 | 0 | 60-130 | 0.03-0.07 | 0 | 3.9-9.5 | 0.9-4.0 |
Table 11.
Amino acid content of rough rice and its milling fractions at 14 percent moisture (9 per 16 9 N).
Table 11.
Amino acid content of rough rice and its milling fractions at 14 percent moisture (9 per 16 9 N).
| Rice fraction | Histidine | Isoleucine | Leucine | Lysine + cysteine | Methionine + tyrosine | Phenylalanine | Threonine | Tryptophan | Valine | Amino acid scorea |
|---|---|---|---|---|---|---|---|---|---|---|
| Rough rice | 1.5-2.8 | 3.0-4.8 | 6.9-8.8 | 3.2-4.7 | 4.5-6.2 | 9.3-10.8 | 3.0-4.5 | 1.2-2.0 | 4.6-7.0 | 55-81 |
| Brown rice | 2.3-2.5 | 3.4-4.4 | 7.9-8.5 | 3.7-4.1 | 4.4-4.6 | 8.6-9.3 | 3.7-3.8 | 1.2-1.4 | 4.8-6.3 | 64-71 |
| Milled rice | 2.2-2.6 | 3.5-4.6 | 8.0-8.2 | 3.2-4.0 | 4.3-5.0 | 9.3-10.4 | 3.5-3.7 | 1.2-1.7 | 4.7-6.5 | 55-69 |
| Rice bran | 2.7-3.3 | 2.7-4.1 | 6.9-7.6 | 4.8-5.4 | 4.2-4.8 | 7.7-8.0 | 3.8-4.2 | 0.6-1.2 | 4.9-6.0 | 83-93 |
| Rice hull | 1.6-2.0 | 3.2-4.0 | 8.0-8.2 | 3.8-5.4 | 3.5-3.7 | 6.6-7.3 | 4.2-5.0 | 0.6 | 5.5-7.5 | 66-93 |
Table 12.
Protein quality (% casein) of various cereal crops.
| Cereal | Protein quality (% casein) |
|---|---|
| Common maize | 32.1 |
| Opaque-2 maize | 96.8 |
| QPM | 82.1 |
| Rice | 79.3 |
| Wheat | 38.7 |
| Oats | 59.0 |
| Sorghum | 32.5 |
| Barley | 58.0 |
| Pearl millet | 46.4 |
| Finger millet | 35.7 |
| Teff | 56.2 |
| Rye | 64.8 |
Table 13.
Partial amino acid composition (mole percent) of Osborne fractions from different cereals1.
Table 13.
Partial amino acid composition (mole percent) of Osborne fractions from different cereals1.
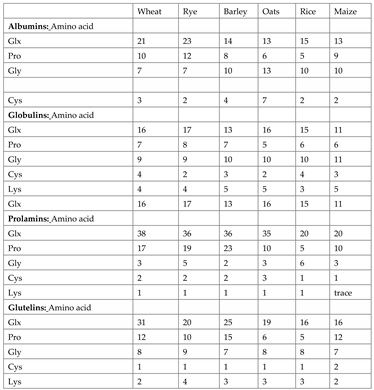
1Data from Wiesner et al. (1980) [137].
Disclaimer/Publisher’s Note: The statements, opinions and data contained in all publications are solely those of the individual author(s) and contributor(s) and not of MDPI and/or the editor(s). MDPI and/or the editor(s) disclaim responsibility for any injury to people or property resulting from any ideas, methods, instructions or products referred to in the content. |
© 2024 by the authors. Licensee MDPI, Basel, Switzerland. This article is an open access article distributed under the terms and conditions of the Creative Commons Attribution (CC BY) license (http://creativecommons.org/licenses/by/4.0/).
Copyright: This open access article is published under a Creative Commons CC BY 4.0 license, which permit the free download, distribution, and reuse, provided that the author and preprint are cited in any reuse.


