
Submitted:
01 November 2024
Posted:
05 November 2024
You are already at the latest version
Abstract
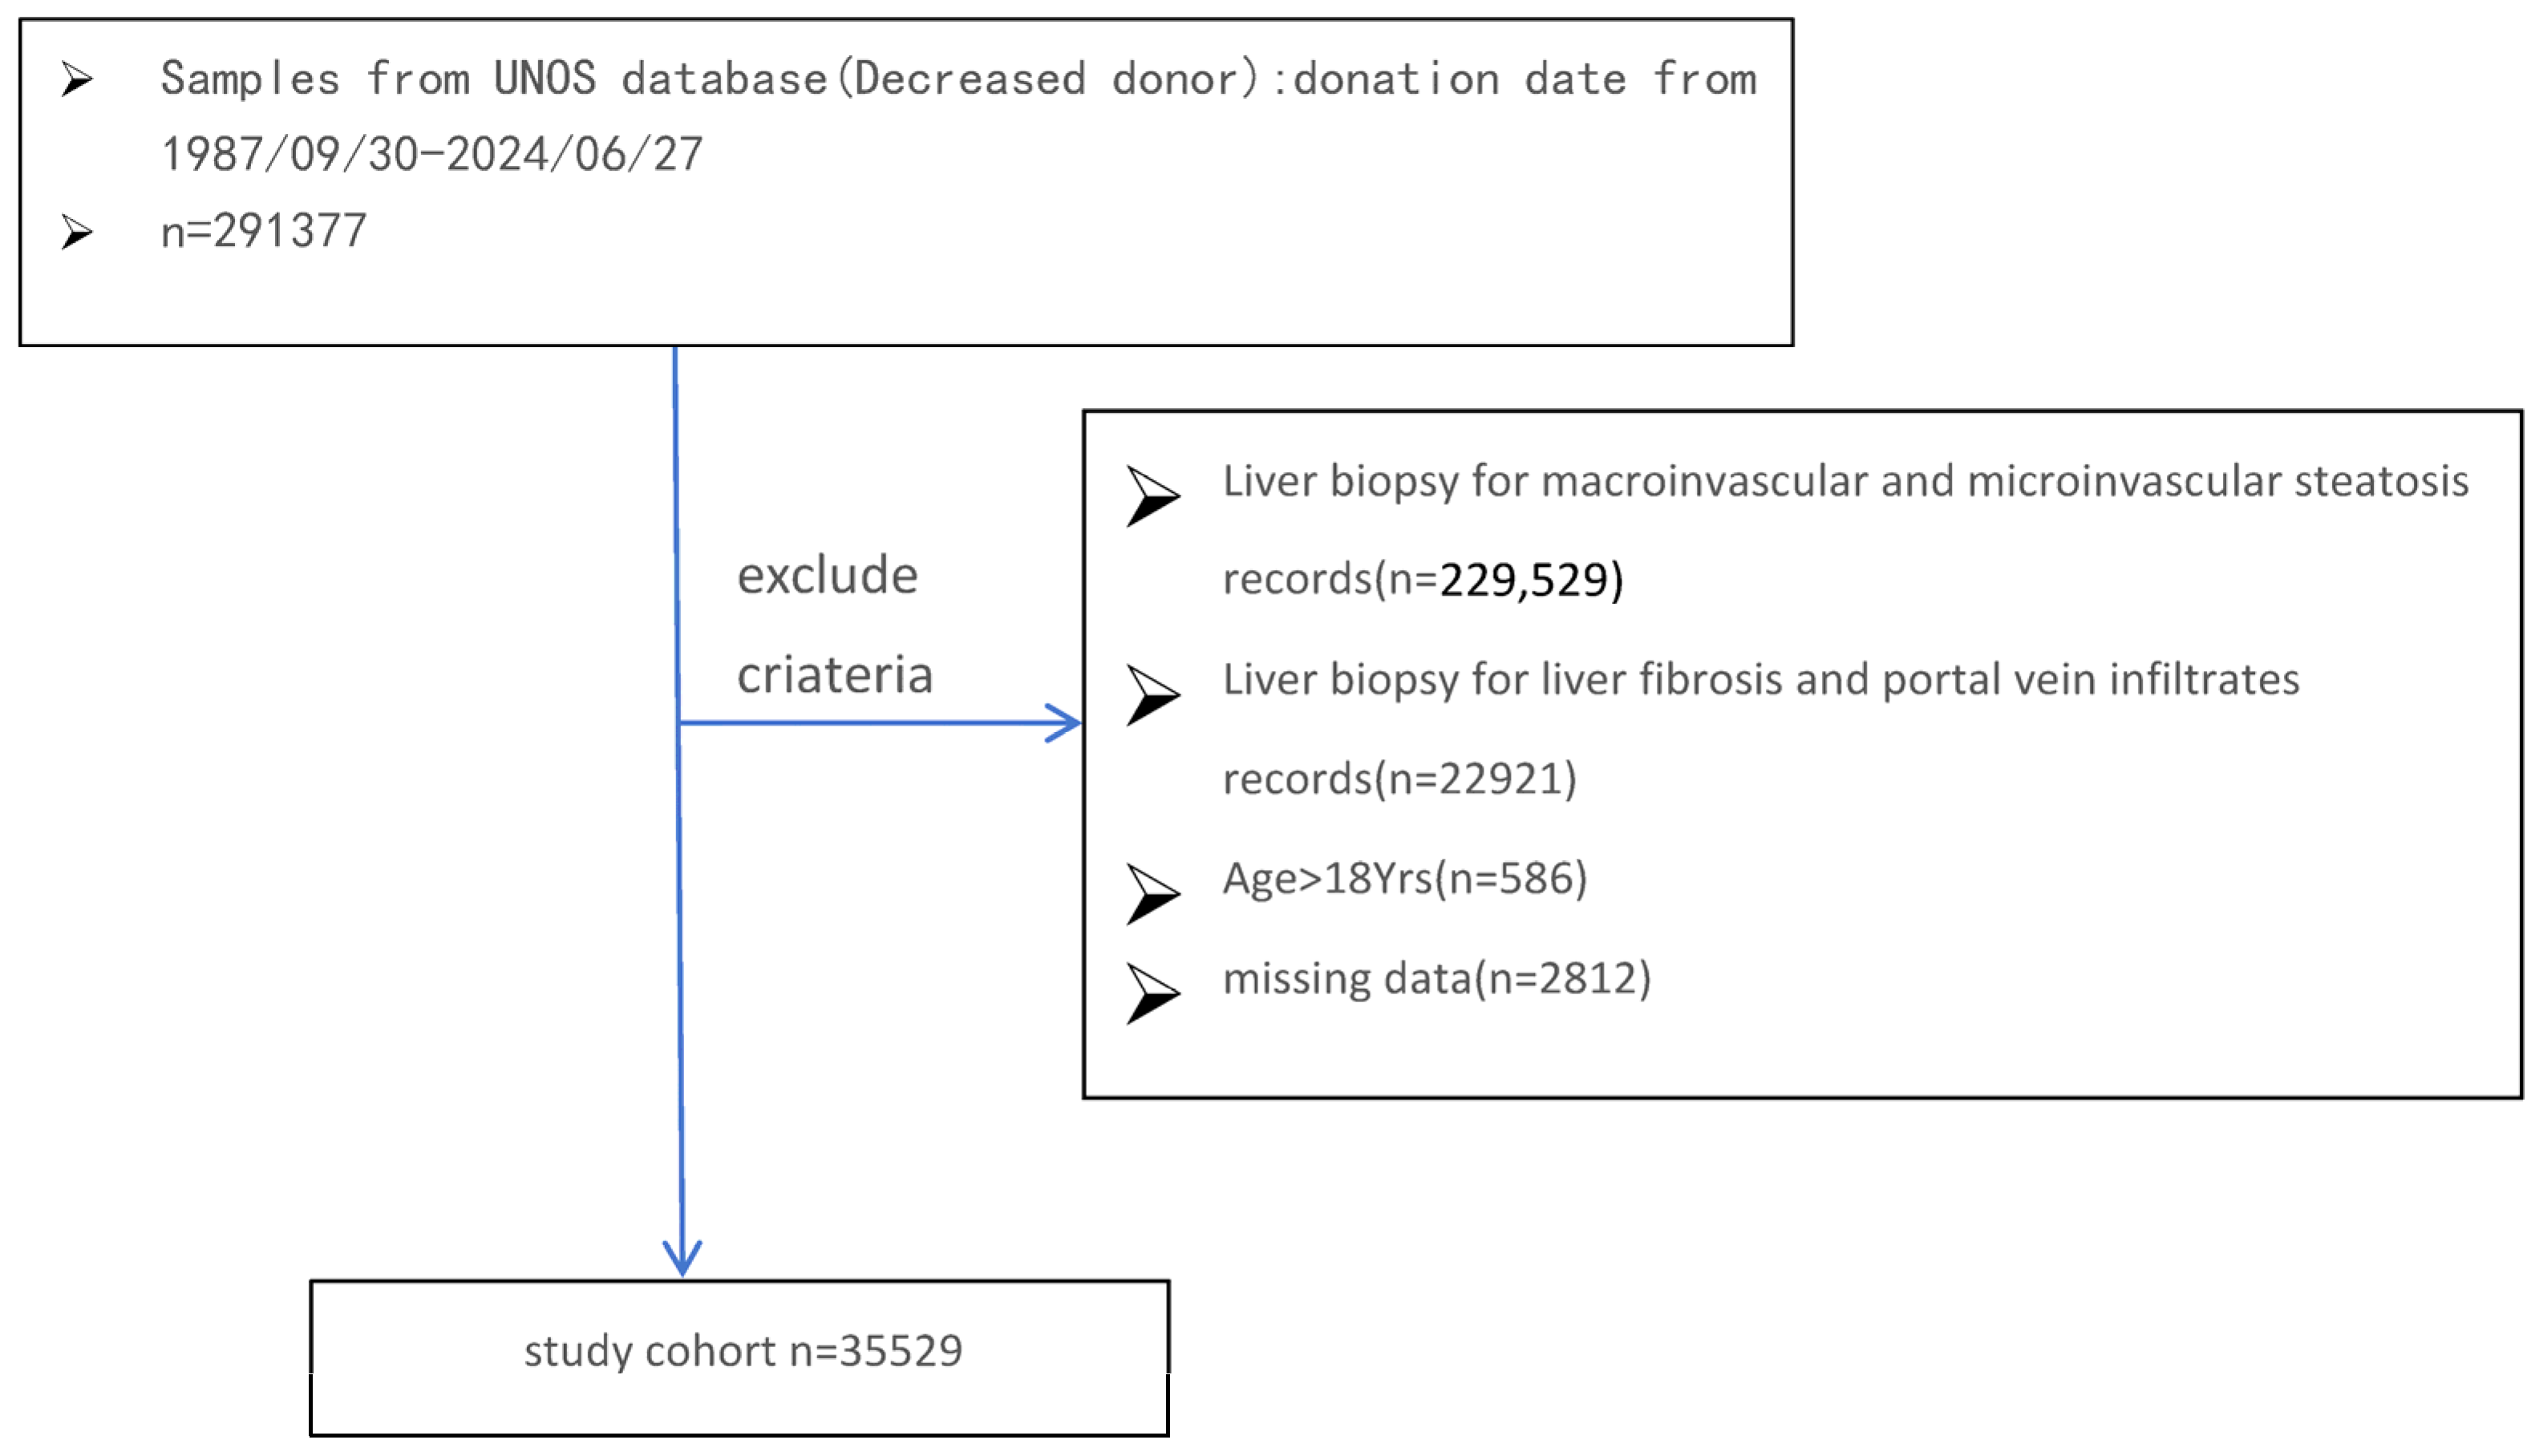
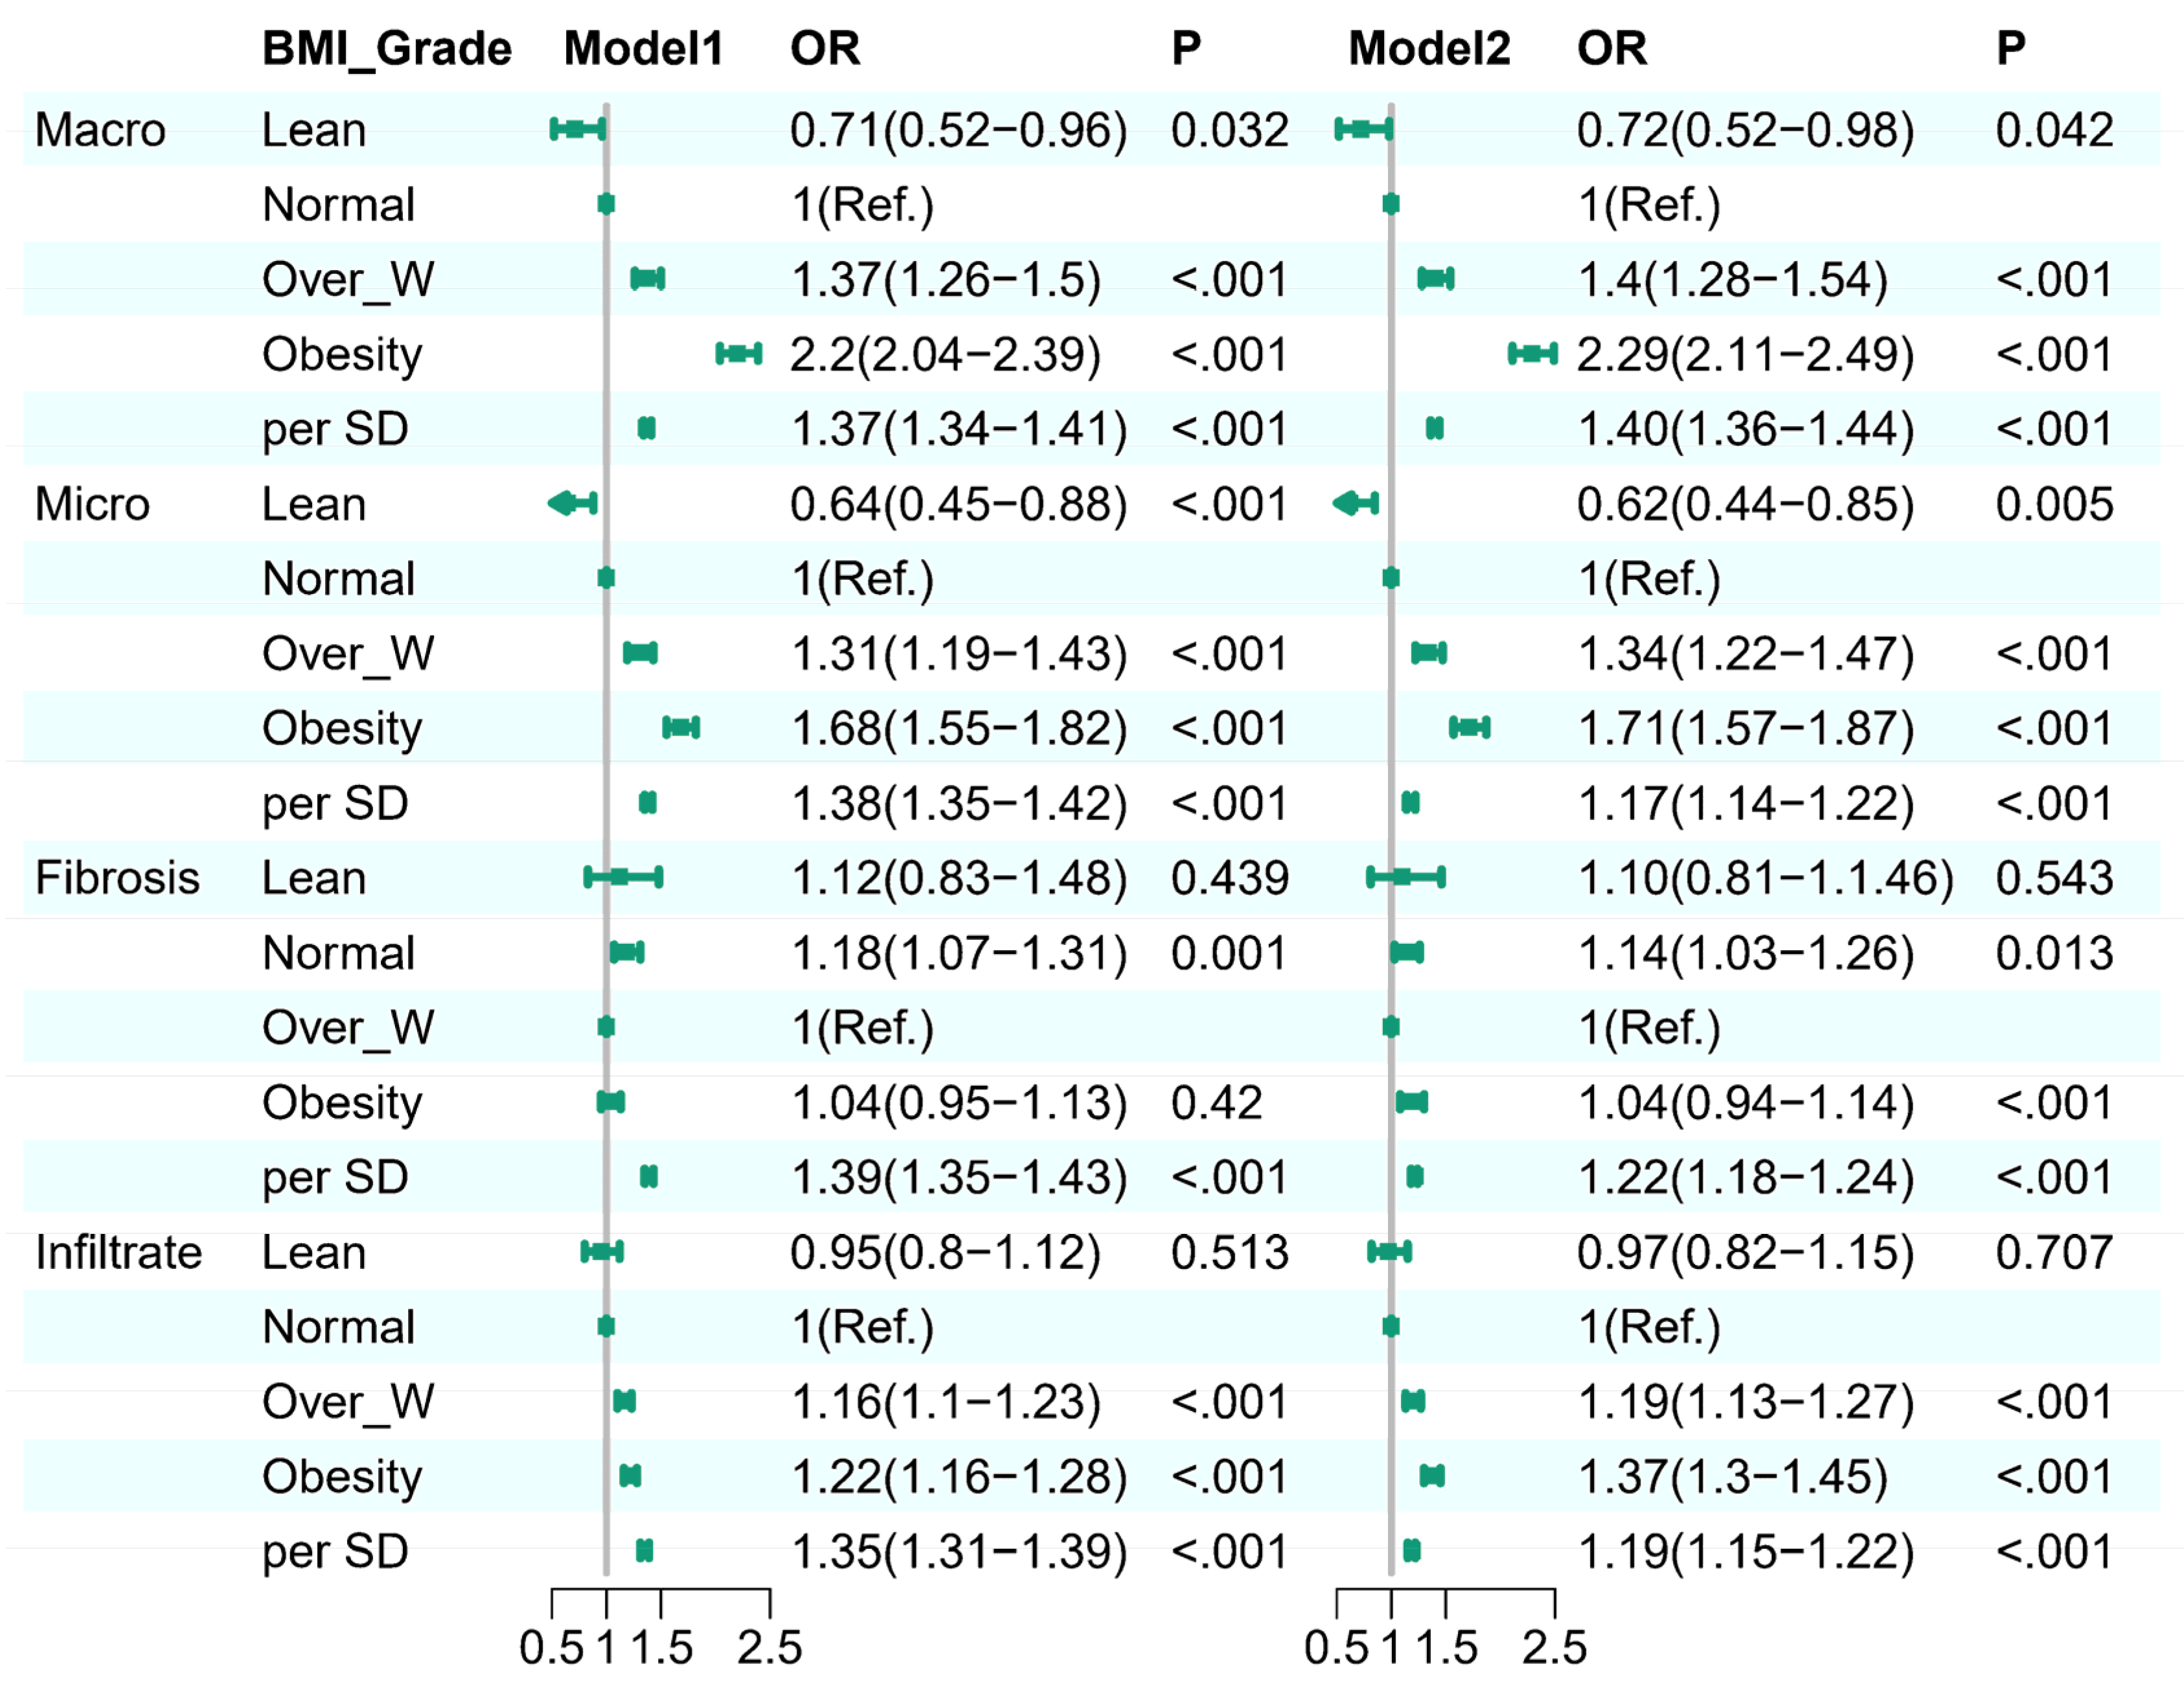
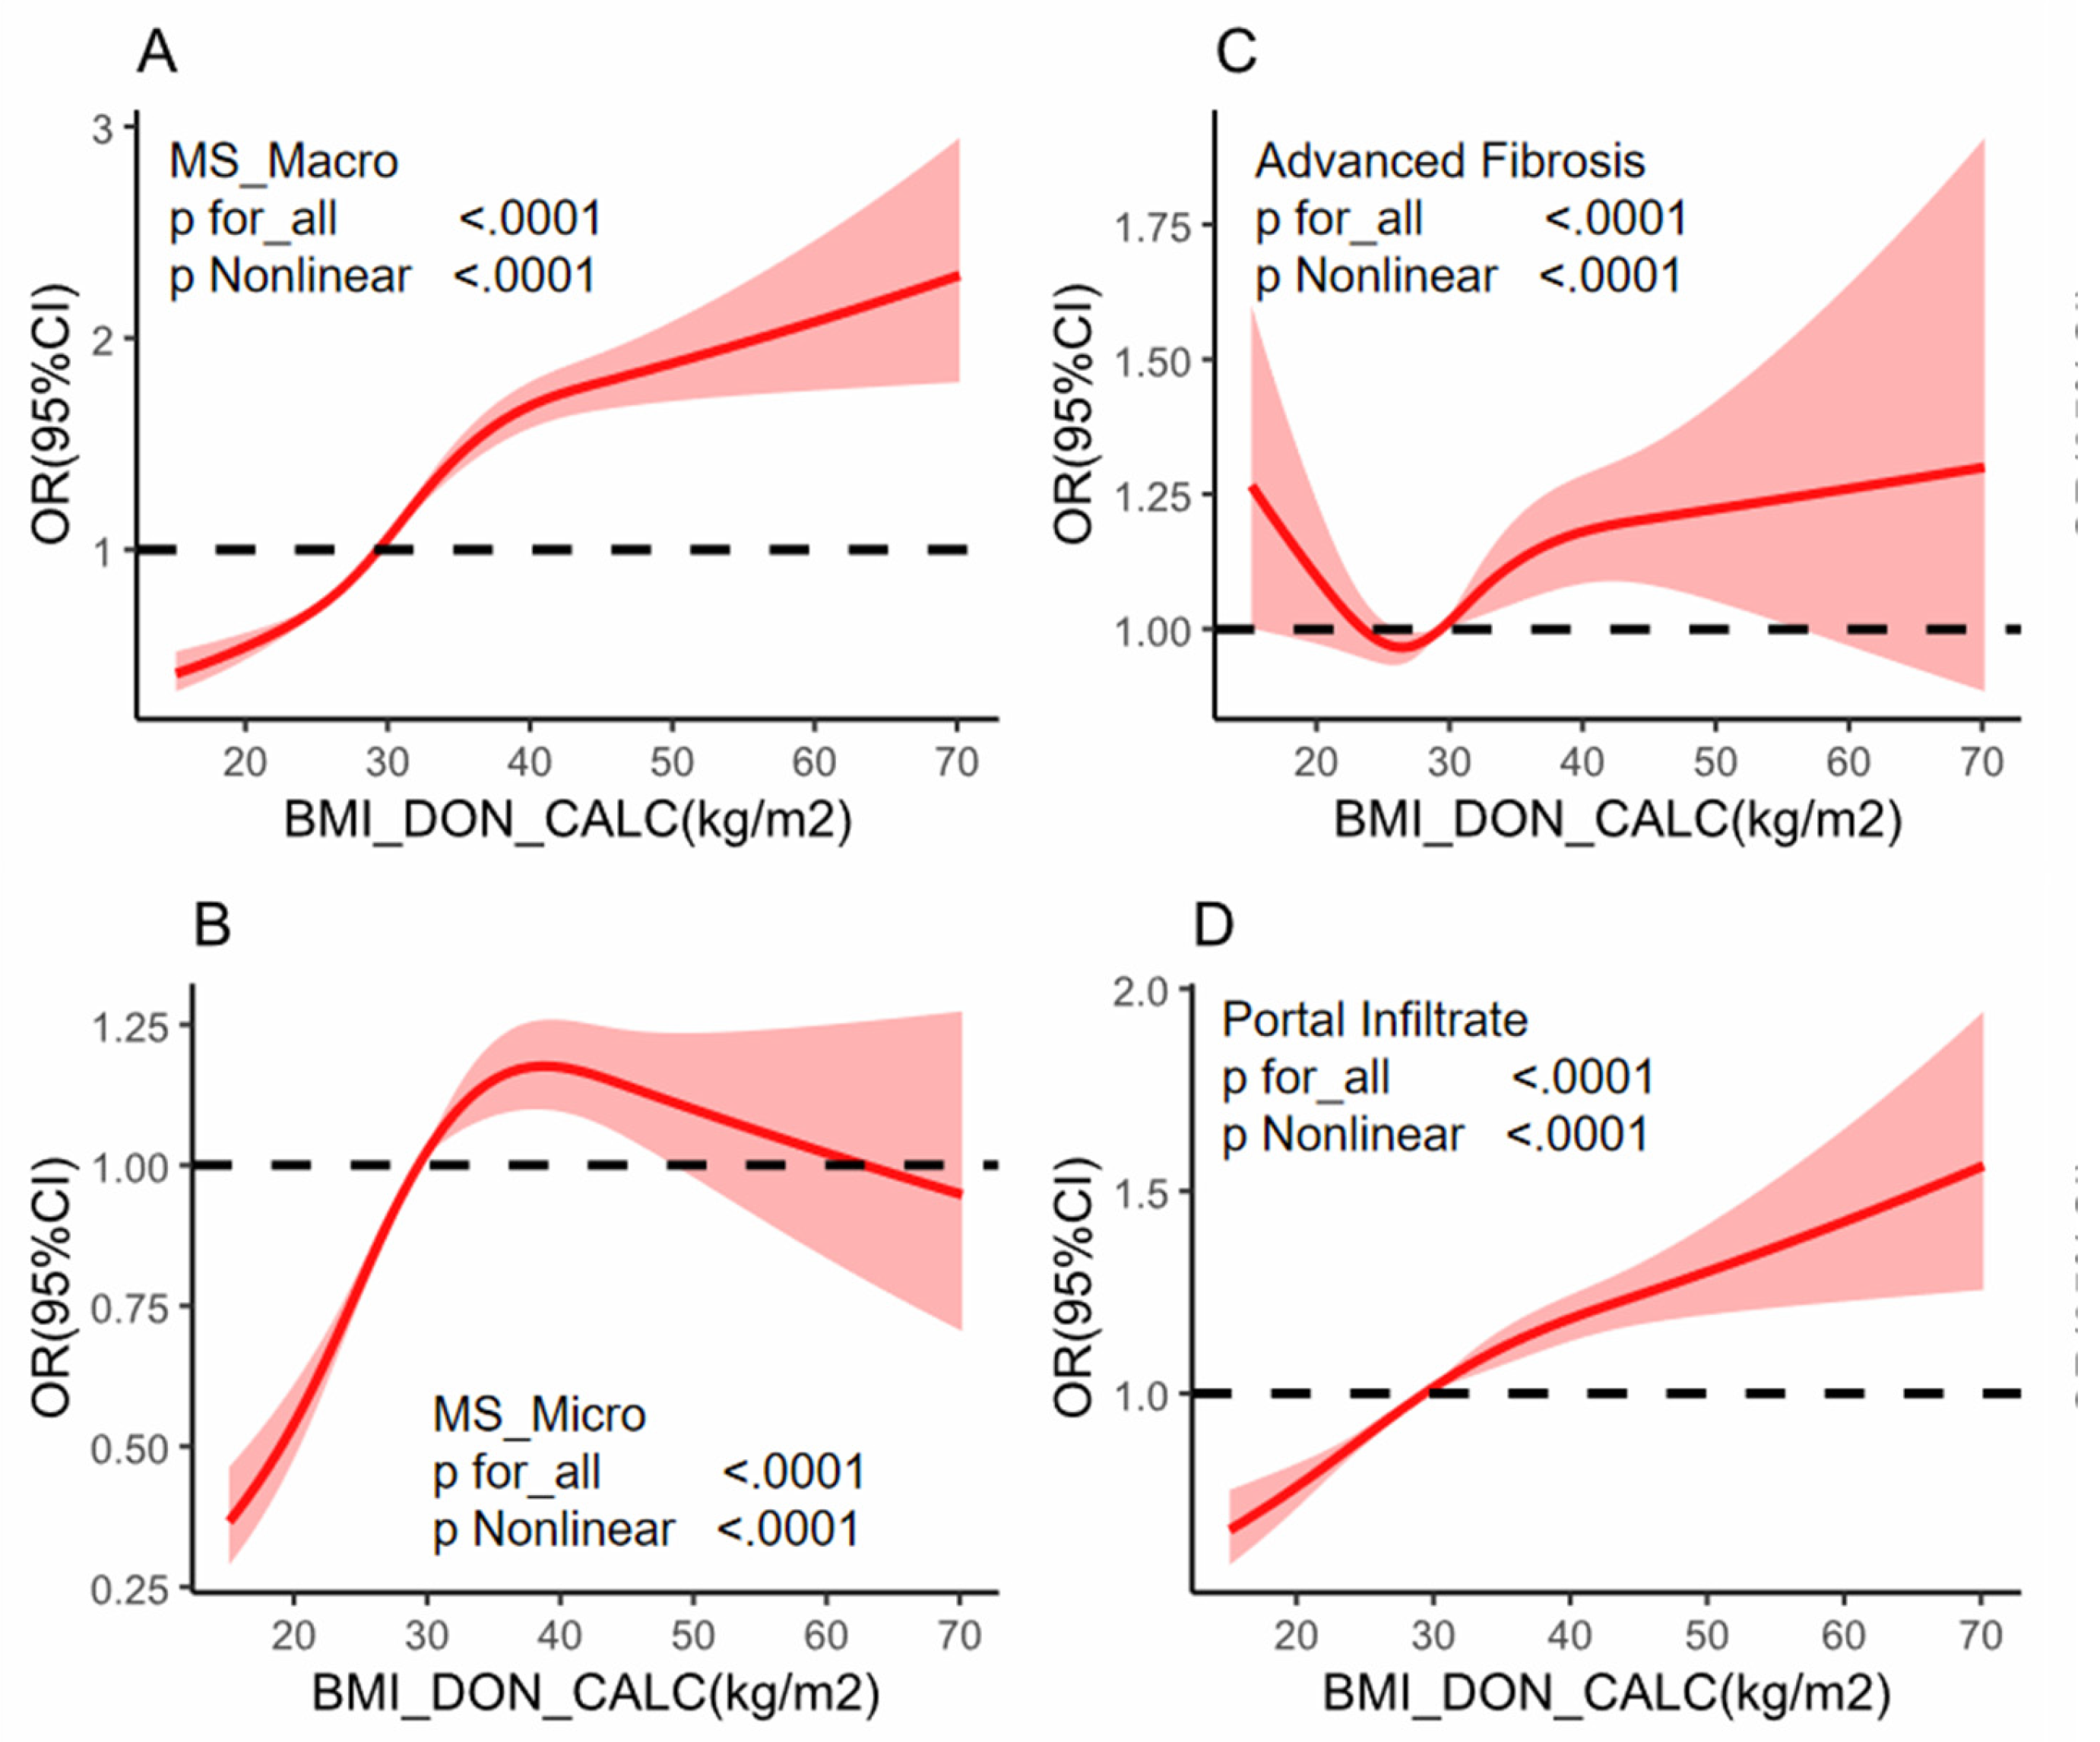
Background: While the prevalence of obesity and its negative effects on graft steatosis in liver transplantation are well recognized, the impact of obesity in the absence of hepatic steatosis, fibrosis, and inflammation in deceased donor livers remains unclear. This knowledge gap may affect the decision to adopt a transplant strategy and influence the following outcomes. Methods: A donor population-based cohort study was performed on 35,529 donors who received liver biopsy from 1987 to 2024. Donor BMI was categorized and assessed for its association with liver conditions, including macrovesicular steatosis, microvesicular steatosis, liver fibrosis, and portal infiltrates. Multivariable logistic regression and restricted cubic spline (RCS) regression models were employed to explore both linear and nonlinear relationships between BMI and the specified liver conditions. Results: In a cohort of 35,529 donors, donor livers from higher BMI groups exhibited higher percentages of macro-steatosis, micro-steatosis,advanced fibrosis and portal infiltrate.Logistic regression indicated obesity as an independent predictor of liver histology assessment: for higher risk with moderate-servere macro-steatosis (OR 2.29, 95% CI 2.11–2.49, p < 0.001),moderate-servere micro-steatosis (OR 1.71, 95% CI 1.57–1.87, p < 0.001), portal infiltrate (OR 1.37, 95% CI 1.3–1.45, p < 0.001) and advanced fibrosis (OR 1.04, 95% CI 0.94–1.14, p < 0.001). Restricted cubic spline regression depicted J-shaped with moderate-servere macro-steatosis and portal infiltrate,a U-shaped advanced fibrosis, and a upside down U-shaped with moderate-servere micro-steatosis,P for for nonlinearity <0.0001),respectively. Subgroup analyses identified interactions with factors such as gender, hypertension, and hepatitis C, highlighting BMI’s complex influence on liver histology and reinforcing its role in liver donor evaluation. Conclusion: This donor population-based cohort study found a different association pattern between donor BMI and liver biopsy outcomes,integrating BMI into donor liver assessments could enhance decision-making during transplantation, potentially reducing organ discard rates and improving transplant success by identifying high-risk organs earlier.
Keywords:
Introduction
Methods
Database and Study Cohort
Donor Study Population and Exclusion Criteria
BMI Classification
Donor Liver Quality Assessment and Outcomes
Covariates
Statistical Analysis
Results
Discussion
Strengths and Limitations
Conclusion
Author Contributions
Funding
Institutional Review Board Statement
Data Availability Statement
Conflicts of Interest
Publisher’s Note
References
- Starzl TE, Fung JJ. Themes of liver transplantation. Hepatology. 2010 Nov;52(5):1383-94. [CrossRef]
- Bruinsma BG, Avruch JH, Sridharan GV, Weeder PD, Jacobs ML, Crisalli K, Amundsen B, Porte RJ, Markmann JF, Uygun K, Yeh H. Peritransplant Energy Changes and Their Correlation to Outcome After Human Liver Transplantation. Transplantation. 2017 Jul;101(7):1637-1644. [CrossRef]
- Moore DE, Feurer ID, Speroff T, et al. Impact of Donor, Technical, and Recipient Risk Factors on Survival and Quality of Life After Liver Transplantation. Arch Surg. 2005;140(3):273–277. [CrossRef]
- Lin JS, Muhammad H, Lin T, Kamel I, Baghdadi A, Rizkalla N, Ottmann SE, Wesson R, Philosophe B, Gurakar A. Donor BMI and Post-living Donor Liver Transplantation Outcomes: A Preliminary Report. Transplant Direct. 2023 Jan 12;9(2):e1431. [CrossRef]
- Loomis AK, Kabadi S, Preiss D, Hyde C, Bonato V, St Louis M, Desai J, Gill JM, Welsh P, Waterworth D, Sattar N. Body Mass Index and Risk of Nonalcoholic Fatty Liver Disease: Two Electronic Health Record Prospective Studies. J Clin Endocrinol Metab. 2016 Mar;101(3):945-52. [CrossRef]
- Leow WQ, Chan AW, Mendoza PGL, Lo R, Yap K, Kim H. Non-alcoholic fatty liver disease: the pathologist’s perspective. Clin Mol Hepatol. 2023 Feb;29(Suppl):S302-S318. [CrossRef]
- Kristiansen MNB, Veidal SS, Christoffersen C, Jelsing J, Rigbolt KTG. Molecular Characterization of Microvesicular and Macrovesicular Steatosis Shows Widespread Differences in Metabolic Pathways. Lipids. 2019 Jan;54(1):109-115. [CrossRef]
- 8. Bataller R, Brenner DA. Liver fibrosis. J Clin Invest. 2005 Feb;115(2):209-18. doi: 10.1172/JCI24282. Erratum in: J Clin Invest. 2005 Apr;115(4):1100.
- Gadd VL, Skoien R, Powell EE, Fagan KJ, Winterford C, Horsfall L, Irvine 8.K, Clouston AD. The portal inflammatory infiltrate and ductular reaction in human nonalcoholic fatty liver disease. Hepatology. 2014 Apr;59(4):1393-405. [CrossRef]
- Fabbrini E, Sullivan S, Klein S. Obesity and nonalcoholic fatty liver disease: biochemical, metabolic, and clinical implications. Hepatology. 2010 Feb;51(2):679-89. [CrossRef]
- Weir CB, Jan A. BMI Classification Percentile And Cut Off Points. 2023 Jun 26. In: StatPearls [Internet]. Treasure Island (FL): StatPearls Publishing; 2024 Jan.
- Lee DU, Yoo A, Kolachana S, Lee J, Ponder R, Fan GH, Lee KJ, Lee K, Schuster K, Chou H, Chou H, Sun C, Chang M, Pu A, Urrunaga NH. The impact of macro- and micro-steatosis on the outcomes of patients who undergo liver transplant: Analysis of the UNOS-STAR database. Liver Int. 2024 Aug;44(8):2011-2037. [CrossRef]
- Vass JK, Wilson RH. ‘Z’STATS’’--a statistical analysis for potential Z-DNA sequences. Nucleic Acids Res. 1984 Jan 11;12(1 Pt 2):825-32. [CrossRef]
- Lee YS, Hwang LC, Hsu HY, Tsou MT. The Association Between Different Obesity Phenotypes and Liver Fibrosis Scores in Elderly Individuals with Fatty Liver in Taiwan. Diabetes Metab Syndr Obes. 2021 Mar 30;14:1473-1483. [CrossRef]
- Tutunchi H, Naeini F, Ebrahimi-Mameghani M, Najafipour F, Mobasseri M, Ostadrahimi A. Metabolically healthy and unhealthy obesity and the progression of liver fibrosis: A cross-sectional study. Clin Res Hepatol Gastroenterol. 2021 Nov;45(6):101754. [CrossRef]
- Zarrinpar A, et al. Body mass index as a predictor of outcomes in liver transplantation: does increased body mass index adversely affect outcome? Liver Transplantation. 2013;19(11):1334-42. [CrossRef]
- Fisher RA, et al. Donor Body Mass Index and Outcomes in Liver Transplantation. Transplantation. 2019;103(1):86-94. [CrossRef]
- Burra P, Becchetti C, Germani G. NAFLD and liver transplantation: Disease burden, current management and future challenges. JHEP Rep. 2020 Oct 9;2(6):100192. [CrossRef]
- Reichman TW, Therapondos G, Serrano MS, Seal J, Evers-Meltzer R, Bohorquez H, Cohen A, Carmody I, Ahmed E, Bruce D, Loss GE. “Weighing the risk”: Obesity and outcomes following liver transplantation. World J Hepatol. 2015 Jun 18;7(11):1484-93. [CrossRef]
- Soma, Daiki MD, PhD1; Park, Yujin MD1; Mihaylov, Plamen MD1; Ekser, Burcin MD, PhD1; Ghabril, Marwan MD2; Lacerda, Marco MD2; Chalasani, Naga MD2; Mangus, Richard S. MD1; Kubal, Chandrashekhar A. MD, PhD1. Liver Transplantation in Recipients With Class III Obesity: Posttransplant Outcomes and Weight Gain. Transplantation Direct 8(2):p e1242, February 2022. [CrossRef]
- Brunt EM, et al. The effect of donor liver steatosis on post-transplant outcomes: A meta-analysis. Transplantation. 2019;103(4):511-522. [CrossRef]
- IKwong AJ, Kim WR, Lake J, Stock PG,et.al. Impact of Donor Liver Macrovesicular Steatosis on Deceased Donor Yield and Posttransplant Outcome. Transplantation. 2023 Feb 1;107(2):405-409. [CrossRef]
- Nonalcoholic Fatty Liver Disease: Two Electronic Health Record Prospective Studies. J Clin Endocrinol Metab. 2016 Mar;101(3):945-52. [CrossRef]
- Chan AW, et al. Underweight and severely obese individuals have higher risks of liver graft failure. Liver Transplantation. 2019;25(5):579-589. [CrossRef]
- Rabindranath M, Zaya R, Prayitno K, Orchanian-Cheff A, Patel K, Jaeckel E, Bhat M. A Comprehensive Review of Liver Allograft Fibrosis and Steatosis: From Cause to Diagnosis. Transplant Direct. 2023 Oct 16;9(11):e1547. [CrossRef]
- Rakha EA, Adamson L, Bell E, Neal K, Ryder SD, Kaye PV, Aithal GP. Portal inflammation is associated with advanced histological changes in alcoholic and non-alcoholic fatty liver disease. J Clin Pathol. 2010 Sep;63(9):790-5. [CrossRef]
- Vasuri F, Riefolo M, Ravaioli M, Cescon M, Pasquinelli G, Germinario G, D’‘E’rrico A. Predictive value of portal fibrosis and inflammation in transplanted liver grafts treated with hypothermic oxygenated perfusion. Pathol Res Pract. 2023 Mar;243:154361. [CrossRef]
- Rajaram RB, Jayaraman T, Yoong BK, Koh PS, Loh PS, Koong JK, et al. Non-alcoholic fatty liver disease and obesity among adult donors are major challenges to living-donor liver transplantation: a single-center experience. Asian J Surg. 2022;45(1):441–7.
- Orman ES, et al. Donor obesity and organ discard in liver transplantation: A registry-based analysis. American Journal of Transplantation. 2018;18(5):1160-1171. [CrossRef]
- Chan AW, et al. Obesity‘s’ Impact on Liver Transplant Outcomes: Evaluating both ends of the spectrum. Liver Transplantation. 2019;25(5):789-796. [CrossRef]
- Trotter JF, et al. The impact of obesity on liver transplantation outcomes. Current Opinion in Organ Transplantation. 2021;26(2):203-210. [CrossRef]
- Long MT, Zhang X, Xu H, Liu CT, Corey KE, Chung RT, Loomba R, Benjamin EJ. Hepatic Fibrosis Associates With Multiple Cardiometabolic Disease Risk Factors: The Framingham Heart Study. Hepatology. 2021 Feb;73(2):548-559. [CrossRef]
- Tuong TTK, Tran DK, Phu PQT, Hong TND, Chu Dinh T, Chu DT. Non-Alcoholic Fatty Liver Disease in Patients with Type 2 Diabetes: Evaluation of Hepatic Fibrosis and Steatosis Using Fibroscan. Diagnostics. 2020; 10(3):159. [CrossRef]
- 34. Ampuero J, Aller R, Gallego-Durán R, Crespo J,. Significant fibrosis predicts new-onset diabetes mellitus and arterial hypertension in patients with NASH. J Hepatol. 2020 Jul;73(1):17-25. doi: 10.1016/j.jhep.2020.02.028. Epub 2020 Mar 6. Erratum in: J Hepatol. 2020 Sep;73(3):740-741. doi: 10.1016/j.jhep.2020.06.018.

| Variables | Total (n = 35529) | Lean (n = 584) | Normal (n = 8426) | Over_W (n = 9996) | Obesity (n = 16523) | P | |
|---|---|---|---|---|---|---|---|
| AGE,Mean(SD),y | 48.31 ± 14.13 | 48.08 ± 15.42 | 47.30 ± 15.36 | 48.87 ± 14.39 | 48.50 ± 13.20 | <.001 | |
| <60y,n,(%) | 27133 (76.37%) | 423 (72.43%) | 6394 (75.88%) | 7405 (74.08%) | 12911 (78.14%) | <.001 | |
| ≥60y,n,(%) | 8396 (23.63%) | 161 (27.57%) | 2032 (24.12%) | 2591 (25.92%) | 3612 (21.86%) | ||
| GENDER(M),n,(%) | 20027 (56.37%) | 261 (44.69%) | 4894 (58.08%) | 6285 (62.88%) | 8587 (51.97%) | <.001 | |
| ETHNICITY,n,(%) | <.001 | ||||||
| White,Non-Hispanic | 23237 (65.40%) | 399 (68.32%) | 5728 (67.98%) | 6553 (65.56%) | 10557 (63.89%) | ||
| Hispanic/Latino | 5406 (15.22%) | 59 (10.10%) | 1057 (12.54%) | 1680 (16.81%) | 2610 (15.80%) | ||
| BMI,Mean(SD),kg/m2 | 30.55 ± 7.77 | 17.36 ± 0.90 | 22.47 ± 1.71 | 27.46 ± 1.43 | 37.00 ± 6.35 | <.001 | |
| SGOT,Mean(SD),U/L | 98.38 ± 249.05 | 78.14 ± 135.66 | 109.16 ± 308.32 | 98.67 ± 226.28 | 93.43 ± 230.61 | <.001 | |
| SGPT,Mean(SD),U/L | 106.10 ± 261.36 | 74.73 ± 135.56 | 117.35 ± 310.45 | 111.51 ± 264.21 | 98.19 ± 233.84 | <.001 | |
| TBIL, Mean(SD),mg/L | 0.89 ± 1.07 | 0.81 ± 0.78 | 0.92 ± 1.23 | 0.92 ± 1.03 | 0.86 ± 1.01 | <.001 | |
| HYPERTENSION,n,(%) | 17536 (49.36%) | 219 (37.50%) | 3129 (37.14%) | 4518 (45.20%) | 9670 (58.52%) | <.001 | |
| CAD,n,(%) | 3675 (10.34%) | 49 (8.39%) | 677 (8.03%) | 984 (9.84%) | 1965 (11.89%) | <.001 | |
| MI,n,(%) | 2288 (6.44%) | 36 (6.16%) | 432 (5.13%) | 597 (5.97%) | 1223 (7.40%) | <.001 | |
| DIABETES,n,(%) | 7038 (19.81%) | 61 (10.45%) | 1059 (12.57%) | 1674 (16.75%) | 4244 (25.69%) | <.001 | |
| HBV,n,(%) | 2704 (7.61%) | 64 (10.96%) | 840 (9.97%) | 874 (8.74%) | 926 (5.60%) | <.001 | |
| HCV,n,(%) | 4864 (13.69%) | 110 (18.84%) | 1689 (20.05%) | 1647 (16.48%) | 1418 (8.58%) | <.001 | |
| ALCOHOL,n,(%) | 8503 (23.93%) | 172 (29.45%) | 2601 (30.87%) | 2725 (27.26%) | 3005 (18.19%) | <.001 | |
| SMOKING,n,(%) | <.001 | ||||||
| Y | 1683 (4.74%) | 25 (4.28%) | 275 (3.26%) | 494 (4.94%) | 889 (5.38%) | ||
| current in 6M/20 packs/yr | 8246 (23.21%) | 188 (32.19%) | 2324 (27.58%) | 2375 (23.76%) | 3359 (20.33%) | ||
| MACRO,Mean(SD),% | 12.45 ± 16.78 | 7.24 ± 13.96 | 8.96 ± 14.91 | 11.32 ± 16.19 | 15.09 ± 17.65 | <.001 | |
| Mild,n(%) | 29715 (83.64%) | 538 (92.12%) | 7524 (89.30%) | 8584 (85.87%) | 13069 (79.10%) | <.001 | |
| Moderate-Severe,n(%) | 5814 (16.36%) | 46 (7.88%) | 902 (10.70%) | 1412 (14.13%) | 3454 (20.90%) | ||
| MICRO,Mean(SD),% | 10.76 ± 16.86 | 6.67 ± 12.86 | 8.63 ± 15.17 | 10.37 ± 16.62 | 12.21 ± 17.77 | <.001 | |
| Mild,n(%) | 30738 (86.52%) | 545 (93.32%) | 7575 (89.90%) | 8715 (87.18%) | 13903 (84.14%) | <.001 | |
| Moderate-Severe,n(%) | 4791 (13.48%) | 39 (6.68%) | 851 (10.10%) | 1281 (12.82%) | 2620 (15.86%) | ||
| FIBROSIS, Mean(SD),score | 0.45 ± 0.93 | 0.47 ± 0.91 | 0.47 ± 0.99 | 0.43 ± 0.91 | 0.44 ± 0.91 | 0.01 | |
| F0-1,n(%) | 32402 (91.20) | 530 (90.75) | 7610 (90.32) | 15099 (91.38) | 9163 (91.67) | 0.008 | |
| F2-6,n(%) | 3127 (8.80) | 54 (9.25) | 816 (9.68) | 1424 (8.62) | 833 (8.33) | ||
| PORTAL INFILTRATE, Mean(SD),score | 0.67±0.69 | 0.60 ±0.66 | 0.64 ±0.70 | 0.68 ±0.70 | 0.69 ±0.68 | <.001 | |
| F0,n(%) | 15485 (43.58%) | 282 (48.29%) | 3951 (46.89%) | 4310 (43.12%) | 6942 (42.01%) | <.001 | |
| F1-4,n(%) | 20044 (56.42%) | 302 (51.71%) | 4475 (53.11%) | 5686 (56.88%) | 9581 (57.99%) |
| Macro-steatosis | Micro-steatisis | Fibrosis | Portal infiltrate | ||||||||||
|---|---|---|---|---|---|---|---|---|---|---|---|---|---|
| Variables | n (%) | OR (95%CI) | P | Pi | OR (95%CI) | P | Pi | OR (95%CI) | P | Pi | OR (95%CI) | P | Pi |
| All patients | 35529 (100.00) | 1.04 (1.04-1.05) | <.001 | 1.02 (1.02-1.03) | <.001 | 1.00 (0.99-1.00) | 0.076 | 1.01 (1.01-1.01) | <.001 | ||||
| GENDER | 0.002 | 0.003 | 0.119 | 0.476 | |||||||||
| F | 15502 (43.63) | 1.04 (1.03-1.04) | <.001 | 1.02 (1.01-1.02) | <.001 | 0.99 (0.99-1.00) | 0.046 | 1.01 (1.01-1.01) | <.001 | ||||
| M | 20027 (56.37) | 1.05 (1.04-1.05) | <.001 | 1.03 (1.02-1.03) | <.001 | 1.00 (0.99-1.01) | 0.811 | 1.01 (1.01-1.02) | <.001 | ||||
| AGE | 0.4 | 0.293 | 0.022 | 0.039 | |||||||||
| <60 | 27133 (76.37) | 1.04 (1.04-1.05) | <.001 | 1.02 (1.02-1.03) | <.001 | 0.99 (0.99-1.00) | 0.008 | 1.01 (1.01-1.01) | <.001 | ||||
| ≥60 | 8396 (23.63) | 1.04 (1.03-1.05) | <.001 | 1.03 (1.02-1.04) | <.001 | 1.01 (1.00-1.02) | 0.21 | 1.02 (1.01-1.02) | <.001 | ||||
| HYPERTENSION | 0.028 | 0.127 | 0.254 | 0.161 | |||||||||
| N | 17993 (50.64) | 1.05 (1.04-1.05) | <.001 | 1.03 (1.02-1.03) | <.001 | 0.99 (0.98-1.00) | 0.012 | 1.01 (1.00-1.01) | <.001 | ||||
| Y | 17536 (49.36) | 1.04 (1.03-1.04) | <.001 | 1.02 (1.02-1.03) | <.001 | 1.00 (0.99-1.00) | 0.206 | 1.01 (1.01-1.02) | <.001 | ||||
| CAD | 0.242 | 0.011 | 0.045 | 0.013 | |||||||||
| N | 31854 (89.66) | 1.04 (1.04-1.05) | <.001 | 1.02 (1.02-1.03) | <.001 | 0.99 (0.99-1.00) | 0.017 | 1.01 (1.01-1.01) | <.001 | ||||
| Y | 3675 (10.34) | 1.05 (1.04-1.06) | <.001 | 1.04 (1.03-1.05) | <.001 | 1.01 (1.00-1.02) | 0.192 | 1.02 (1.01-1.03) | <.001 | ||||
| MI | 0.781 | 0.273 | 0.207 | 0.348 | |||||||||
| N | 33241 (93.56) | 1.04 (1.04-1.05) | <.001 | 1.02 (1.02-1.03) | <.001 | 0.99 (0.99-1.00) | 0.043 | 1.01 (1.01-1.01) | <.001 | ||||
| Y | 2288 (6.44) | 1.04 (1.02-1.06) | <.001 | 1.01 (1.00-1.03) | 0.121 | 1.01 (0.99-1.03) | 0.431 | 1.02 (1.00-1.03) | 0.006 | ||||
| HBV | 0.909 | 0.119 | 0.967 | 0.277 | |||||||||
| N | 32825 (92.39) | 1.04 (1.04-1.04) | <.001 | 1.02 (1.02-1.03) | <.001 | 1.00 (0.99-1.00) | 0.226 | 1.01 (1.01-1.01) | <.001 | ||||
| P | 2704 (7.61) | 1.04 (1.02-1.06) | <.001 | 1.03 (1.02-1.05) | <.001 | 1.00 (0.98-1.01) | 0.752 | 1.00 (0.99-1.02) | 0.405 | ||||
| HCV | 0.025 | 0.004 | 0.937 | 0.445 | |||||||||
| N | 30665 (86.31) | 1.04 (1.03-1.04) | <.001 | 1.02 (1.02-1.02) | <.001 | 1.00 (1.00-1.01) | 0.213 | 1.02 (1.01-1.02) | <.001 | ||||
| P | 4864 (13.69) | 1.05 (1.04-1.07) | <.001 | 1.04 (1.03-1.05) | <.001 | 1.00 (0.99-1.01) | 0.644 | 1.01 (1.00-1.02) | 0.023 | ||||
| ALCOHOL | <.001 | 0.277 | 0.047 | 0.124 | |||||||||
| N | 27026 (76.07) | 1.05 (1.05-1.06) | <.001 | 1.02 (1.02-1.03) | <.001 | 1.00 (1.00-1.01) | 0.245 | 1.01 (1.01-1.01) | <.001 | ||||
| Y | 8503 (23.93) | 1.02 (1.01-1.03) | <.001 | 1.03 (1.02-1.04) | <.001 | 0.99 (0.98-1.00) | 0.106 | 1.02 (1.01-1.02) | <.001 | ||||
| DIABETES | 0.606 | 0.469 | 0.01 | 0.699 | |||||||||
| N | 28491 (80.19) | 1.04 (1.04-1.05) | <.001 | 1.02 (1.02-1.03) | <.001 | 0.99 (0.98-1.00) | <.001 | 1.01 (1.01-1.01) | <.001 | ||||
| Y | 7038 (19.81) | 1.04 (1.04-1.05) | <.001 | 1.03 (1.02-1.04) | <.001 | 1.00 (1.00-1.01) | 0.366 | 1.01 (1.00-1.02) | 0.001 | ||||
| SMOKING | 0.456 | 0.243 | 0.398 | 0.912 | |||||||||
| N | 25600 (72.05) | 1.04 (1.04-1.04) | <.001 | 1.02 (1.02-1.02) | <.001 | 1.00 (0.99-1.00) | 0.17 | 1.01 (1.01-1.01) | <.001 | ||||
| Y | 1683 (4.74) | 1.04 (1.02-1.06) | <.001 | 1.02 (1.00-1.04) | 0.052 | 1.01 (0.99-1.03) | 0.339 | 1.01 (1.00-1.02) | 0.074 | ||||
| current in 6M | 8246 (23.21) | 1.05 (1.04-1.05) | <.001 | 1.03 (1.02-1.04) | <.001 | 1.00 (0.99-1.01) | 0.917 | 1.01 (1.01-1.02) | <.001 | ||||
| /20 packs/yr | |||||||||||||
Disclaimer/Publisher’s Note: The statements, opinions and data contained in all publications are solely those of the individual author(s) and contributor(s) and not of MDPI and/or the editor(s). MDPI and/or the editor(s) disclaim responsibility for any injury to people or property resulting from any ideas, methods, instructions or products referred to in the content. |
© 2024 by the authors. Licensee MDPI, Basel, Switzerland. This article is an open access article distributed under the terms and conditions of the Creative Commons Attribution (CC BY) license (http://creativecommons.org/licenses/by/4.0/).


