
Submitted:
22 September 2024
Posted:
23 September 2024
You are already at the latest version
Abstract
Background: Non-alcoholic fatty liver disease (NAFLD) is one of the most common chronic liver diseases worldwide, and its incidence has been rising in parallel with the prevalence of obesity and diabetes. A critical marker for the progression of NAFLD is advanced hepatic fibrosis (AHF), which can result in cirrhosis and hepatocellular carcinoma. This study sought to investigate the potential associations between five nutrition-related indices—the geriatric nutritional risk index (GNRI), prognostic nutritional index (PNI), controlled nutritional score (CONUT), triglyceride-total cholesterol-body mass index (TCBI), and albumin/globulin ratio (AGR)—and the progression of NAFLD and AHF. Methods: This study analyzed the association between five nutrition-related indicators and the occurrence of NAFLD and AHF by utilizing data from the National Health and Nutrition Examination Survey (NHANES) from 2017 to 2020.03. After adjusting for demographic, lifestyle, clinical, and laboratory-related factors, the associations were examined employing various statistical techniques, including multivariate logistic regression, subgroup analysis, and smooth curve fitting analysis. Results: This study included 5,514 subjects, of whom 2,088 were diagnosed with NAFLD and 359 with AHF. After adjusting for potential confounding factors using multivariate logistic regression analysis, the results revealed that GNRI, PNI, and TCBI were positively associated with the incidence of NAFLD, while CONUT and AGR demonstrated negative associations with NAFLD. Additionally, GNRI, CONUT, and TCBI were positively associated with the incidence of AHF, while AGR demonstrated a negative association with AHF.Conclusions: The study demonstrates that nutritional status plays a dual role in the progression of NAFLD and AHF, serving as both a risk and protective factor. These findings offer a scientific foundation for the early identification of high-risk populations and the development of individualized nutritional intervention strategies.
Keywords:
NAFLD
; AHF
; nutritional status
; NHANES
; cross-sectional study
1. Introduction
NAFLD is one of the most common chronic liver diseases worldwide, with an estimated prevalence of approximately 25.24% [1]. With the continued rise in global obesity and diabetes rates, NAFLD has emerged as a major non-communicable disease, presenting a significant challenge to global public health [2]. NAFLD is characterized by excessive fat accumulation in the liver without significant alcohol consumption. As the disease progresses, it can progress to liver fibrosis, cirrhosis, and even hepatocellular carcinoma (HCC) [3]. The pathophysiological mechanisms of NAFLD are highly complex and involve processes such as insulin resistance, oxidative stress, lipid peroxidation, inflammation, and hepatocyte apoptosis [4]. AHF is regarded as a key marker of disease progression in the natural history of NAFLD. It is a pathological process triggered by chronic inflammation and tissue damage, marked by the excessive deposition of collagen and other extracellular matrix in the liver. As fibrosis progresses, the liver’s structure becomes increasingly disrupted, potentially leading to cirrhosis [5]. The onset of cirrhosis signals the progression of NAFLD to an irreversible stage, significantly increasing the risk of liver failure and HCC. Currently, there is no specific treatment for NAFLD, making in-depth research into its risk factors essential for its prevention and management.
Previous studies have shown that nutritional imbalance, oxidative stress, and immune function are closely associated with the progression of NAFLD [6,7]. Nutritional imbalance is a primary driver of NAFLD development, contributing to disorders in lipid metabolism and oxidative stress [8]. Oxidative stress plays a key role in the development and progression of NAFLD by inducing hepatocellular injury, inflammation, and fibrogenesis [9]. The liver, rich in immune cells such as macrophages, lymphocytes, and natural killer cells, plays a vital role in immune homeostasis and pathogen defense. In patients with NAFLD, the function of immune cells is often impaired, resulting in a dysregulated immune response that exacerbates liver inflammation and promotes fibrosis [10].
In recent years, several novel laboratory-based nutritional indicators have emerged for identifying malnutrition risk, including the Geriatric Nutritional Risk Index (GNRI), Prognostic Nutritional Index (PNI), Controlled Nutritional Score (CONUT), Triglyceride-Total Cholesterol-Body Mass Index (TCBI), and Albumin-to-Globulin Ratio (AGR). These indices incorporate a range of test parameters, such as albumin, lymphocyte count, body weight, total cholesterol, and triglycerides, providing insight into the nutritional and immune status of patients. They have been widely used in research on tumors, cardiovascular diseases, and chronic obstructive pulmonary disease, but their application in NAFLD patients remains underexplored.
This study used data from the National Health and Nutrition Examination Survey (NHANES) from 2017 to 2020.03, incorporating demographic, lifestyle, and disease factors to explore the associations between five nutrition-related indicators, NAFLD, and AHF. The results of the study offer new insights into NAFLD and may inform the formulation of public health policies.
2. Materials and Methods
NHANES is a nationally representative survey administered by the National Center for Health Statistics (NCHS) within the U.S. Centers for Disease Control and Prevention (CDC), designed to assess the nutrition and health status of the U.S. population. The survey maintains a high level of transparency regarding both its data and methodological design. All publicly available data and detailed survey methodologies can be accessed via the NHANES official website. NHANES has received approval from the CDC Institutional Review Board and adheres to strict guidelines for safeguarding participant safety and privacy. All participants provided written informed consent prior to participation. The data used in this study were sourced from NHANES between 2017 and March 2020, including a total of 15,560 participants. Exclusion criteria included: (1) age < 20 years (n = 6328), (2) missing nutritional status index (n = 1489), (3) missing transient elastography data (n = 431), (4) positive for serum hepatitis B surface antigen (n = 41), hepatitis C virus RNA (n = 83), and hepatitis C antibody (n = 88), (5) cancer diagnosis (n = 706), and (6) missing other covariates (n = 880). A total of 5514 participants were included in the final analysis. Of these participants, 2666 were male and 2848 were female. The detailed screening process is illustrated in Figure 1.
Assessment of NAFLD and AHF
Although liver biopsy remains the gold standard for diagnosing NAFLD, its invasiveness and high cost render it impractical for large-scale population studies. CAP, measured by FibroScan—an emerging technology based on transient elastography using ultrasound—offers a quantitative diagnosis of fatty liver disease with accuracy comparable to liver biopsy in detecting NAFLD. Previous studies have indicated that a CAP value of ≥ 285 dB/m is indicative of NAFLD, while an LSM value of ≥ 9.7 kPa corresponds to AHF [11].
Assessment of Nutritional Status
This study utilized five nutritional indicators to assess the population’s nutritional status: GNRI, PNI, CONUT, TCBI, and AGR. The specific calculation methods for each indicator are outlined in Table 1. Based on previous research, GNRI is classified into a risk-free cohort (GNRI ≥ 98) and a risk cohort (GNRI < 98). CONUT is categorized into normal nutrition (0–1), mild malnutrition (2–4), and moderate to severe malnutrition (5–12). PNI, TCBI, and AGR are classified by quartiles, with participants in the first quartile at higher risk of malnutrition and those in the fourth quartile at lower risk.
Covariates
To minimize the potential confounding of research results, we conducted a comprehensive literature review and included relevant covariates in the analysis. Sociodemographic covariates included age, sex, race, education level, marital status, and poverty-to-income ratio (PIR). Lifestyle covariates included smoking status, alcohol consumption, and physical activity level. Health covariates included BMI, stroke, lung disease, heart disease, chronic kidney disease (CKD), hypertension, and diabetes. Laboratory covariates included ALT, ALP, AST, and GGT. Race categories included Mexican-American, non-Hispanic Black, non-Hispanic White, other Hispanic, and other races. Marital status was classified as married or cohabiting, divorced, separated, widowed, or never married. Educational attainment was classified as less than high school, high school graduate, and college graduate or higher. PIR was divided into low income (<1.3), medium income (1.3–3.5), and high income (≥3.5). Smoking status was classified as ex-smokers, current smokers, and never smokers, based on lifetime smoking behavior (≥ 100 cigarettes smoked). Alcohol consumption was classified as never drinkers, moderate drinkers (1–2 drinks/day for men, 1 drink/day for women), and heavy drinkers (more than 2 drinks/day for men, more than 1 drink/day for women). Physical activity level was calculated by multiplying the weekly frequency of activity by its duration and the corresponding MET. Based on WHO Guidelines on Physical Activity and Sedentary Behavior, activity intensity was classified into low-to-moderate (<1,200 MET-min/week) and high (≥ 1,200 MET-min/week). BMI was classified as underweight/normal (< 25.0 kg/m²), overweight (25.0–29.9 kg/m²), or obese (> 29.9 kg/m²). Stroke diagnosis was based on self-report. Heart disease was defined as a diagnosis of congestive heart failure, coronary heart disease, myocardial infarction, or angina pectoris, and lung disease as a diagnosis of asthma, chronic obstructive pulmonary disease (COPD), or emphysema. CKD was defined as an estimated glomerular filtration rate (eGFR) < 60 mL/min/1.73 m², calculated using the MDRD study equation. Hypertension was defined as: (1) confirmed diagnosis, (2) mean systolic blood pressure ≥ 130 mmHg or mean diastolic blood pressure ≥ 80 mmHg, or (3) use of antihypertensive medication. Diabetes was defined as: (1) confirmed diagnosis, (2) HbA1c level ≥ 6.5%, or (3) use of diabetes medication or insulin.
Statistical Analysis
Due to the impact of the COVID-19 pandemic, field operations for NHANES were suspended in March 2020. Data collected between 2019 and March 2020 were combined with NHANES 2017–2018 cycle data. A comprehensive sample database reflecting the health status of the national population was reconstructed. Continuous variables are presented as mean ± standard deviation (SD), while categorical variables are expressed as percentages. Data significance was tested using the t-test and chi-square test. GNRI was divided into a risk-free and a risk group, while CONUT was classified into normal nutrition, mild malnutrition, and moderate to severe malnutrition. PNI, TCBI, and AGR were divided into quartiles, with Q1 serving as the reference group. To examine the relationship between nutrition-related indicators and NAFLD/AHF, a multivariate logistic regression model was employed. Model 1 was unadjusted, Model 2 controlled for age, sex, and race, and Model 3 additionally adjusted for education, marital status, PIR, smoking, alcohol consumption, physical activity, BMI, stroke, pulmonary disease, heart disease, CKD, hypertension, diabetes, and ALT, ALP, AST, and GGT. Results are presented as weighted odds ratios (OR) with 95% confidence intervals (95% CI). Additionally, we assessed the dose-response relationship between nutritional indicators and NAFLD/AHF using smooth curve fitting, and verified result robustness through stratified analysis. All statistical analyses were conducted using R software (version 4.4.1, http://www.R-project.org) and EmpowerStats software (versions 2.0 and 4.2, http://www.empowerstats.com). A p-value < 0.05 was considered statistically significant.
3. Results
3.1. Participant Characteristics
A total of 5,514 participants were included in this study. The mean age of the participants was 48.67 ± 16.80 years, with 48.35% being male, as shown in Table 1. Among the participants, 2088 were diagnosed with NAFLD, and 359 were diagnosed with AHF. The mean values of GNRI, PNI, CONUT, TCBI, and AGR were 117.36 ± 13.48, 51.81 ± 5.15, 1.38 ± 0.76, 2335.01 ± 2414.36, and 1.35 ± 0.24, respectively.
Compared with the non-NAFLD group, participants in the NAFLD group were characterized by older age, male sex, Mexican American ethnicity, lower education level, being married or cohabiting, obesity, presence of lung disease, heart disease, hypertension, diabetes, chronic kidney disease, lower activity level, former smoking status, elevated ALT, ALP, AST, and GGT levels, and higher nutritional indices such as GNRI, PNI, and TCBI, but lower CONUT and AGR.
Compared with the non-AHF group, participants in the AHF group were characterized by older age, male sex, middle income, obesity, presence of lung disease, heart disease, hypertension, diabetes, lower activity level, former smoking status, never drinking status, elevated ALT, ALP, AST, and GGT levels, and higher nutritional indices such as GNRI, CONUT, and TCBI, but lower PNI and AGR.

Table 2.
Characteristics of the study cohort.
| Characteristics | Total (n = 5514) | NAFLD | AHF | ||||
|---|---|---|---|---|---|---|---|
| No(n = 3426) | Yes(n = 2088) | p-value | No(n = 5155) | Yes(n = 359) | p-value | ||
| Age (years) | 48.67± 16.80 | 47.23 ± 17.50 | 51.04 ± 15.29 | <0.001 | 48.23 ± 16.82 | 54.99 ± 15.24 | <0.001 |
| Sex, n (%) | <0.001 | 0.005 | |||||
| Male | 2666(48.35%) | 1506 (43.96%) | 1160 (55.56%) | 2467 (47.86%) | 199 (55.43%) | ||
| Female | 2848(51.65%) | 1920 (56.04%) | 928 (44.44%) | 2688 (52.14%) | 160 (44.57%) | ||
| Race, n (%) | <0.001 | 0.062 | |||||
| Mexican American | 685(12.42%) | 318 (9.28%) | 367 (17.58%) | 634 (12.30%) | 51 (14.21%) | ||
| Other Hispanic | 575(10.43%) | 361 (10.54%) | 214 (10.25%) | 536 (10.40%) | 39 (10.86%) | ||
| Non-Hispanic White | 1876(34.02%) | 1136 (33.16%) | 740 (35.44%) | 1738 (33.71%) | 138 (38.44%) | ||
| Non-Hispanic Black | 1400(25.39%) | 957 (27.93%) | 443 (21.22%) | 1315 (25.51%) | 85 (23.68%) | ||
| Other Race - Including Multi-Racial | 978(17.74%) | 654 (19.09%) | 324 (15.52%) | 932 (18.08%) | 46 (12.81%) | ||
| Education level, n (%) | 0.007 | 0.092 | |||||
| Below high school | 957(17.36%) | 565 (16.49%) | 392 (18.77%) | 889 (17.25%) | 68 (18.94%) | ||
| High school | 1311(23.78%) | 789 (23.03%) | 522 (25.00%) | 1212 (23.51%) | 99 (27.58%) | ||
| Above high school | 3246(59.45%) | 2072 (60.48%) | 1174 (56.23%) | 3054 (59.24%) | 192 (53.48%) | ||
| Marital status , n (%) | <0.001 | 0.06 | |||||
| Married or living with partner | 3278(48.35%) | 1926 (56.22%) | 1352 (64.75%) | 3059 (59.34%) | 219 (61.00%) | ||
| Divorced, separated, or widowed | 1128(20.46%) | 706 (20.61%) | 422 (20.21%) | 1044 (20.25%) | 84 (23.40%) | ||
| Never married | 1108(20.09%) | 794 (23.18%) | 314 (15.04%) | 1052 (20.41%) | 56 (15.60%) | ||
| PIR, n (%) | 0.3 | 0.002 | |||||
| <1.3 | 1547(28.06%) | 973 (28.40%) | 574 (27.49%) | 1447 (28.07%) | 100 (27.86%) | ||
| 1.3-3.5 | 2149(38.97%) | 1308 (38.18%) | 841 (40.28%) | 1981 (38.43%) | 168 (46.80%) | ||
| ≥3.5 | 1818(32.97%) | 1145 (33.42%) | 673 (32.23%) | 1727 (33.50%) | 91 (25.35%) | ||
| BMI | <0.001 | <0.001 | |||||
| < 25.0 kg/m² | 1404(25.46%) | 1278 (37.30%) | 126 (6.03%) | 1386 (26.89%) | 18 (5.01%) | ||
| 25.0–29.9 kg/m² | 1720(31.19%) | 1185 (34.59%) | 535 (25.62%) | 1670 (32.40%) | 50 (13.93%) | ||
| >29.9 kg/m² | 2390(43.34%) | 963 (28.11%) | 1427 (68.34%) | 2099 (40.72%) | 291 (81.06%) | ||
| Stroke,n (%) | 0.421 | 0.066 | |||||
| Yes | 221(4.01%) | 143 (4.17%) | 78 (3.74%) | 200 (3.88%) | 21 (5.85%) | ||
| NO | 5293(95.99%) | 3283 (95.83%) | 2010 (96.26%) | 4955 (96.12%) | 338 (94.15%) | ||
| Pulmonary disease, n (%) | 0.003 | 0.003 | |||||
| Yes | 1099(19.93%) | 640 (18.68%) | 459 (21.98%) | 1006 (19.52%) | 93 (25.91%) | ||
| NO | 4415(80.07%) | 2786 (81.32%) | 1629 (78.02%) | 4149 (80.48%) | 266 (74.09%) | ||
| Heart disease, n (%) | <0.001 | <0.001 | |||||
| Yes | 380(6.89%) | 194 (5.66%) | 186 (8.91%) | 322 (6.25%) | 58 (16.16%) | ||
| NO | 5134(93.11%) | 3232 (94.34%) | 1902 (91.09%) | 4833 (93.75%) | 301 (83.84%) | ||
| Hypertension, n (%) | <0.001 | <0.001 | |||||
| Yes | 2980(54.04%) | 1563 (45.62%) | 1417 (67.86%) | 2699 (52.36%) | 281 (78.27%) | ||
| NO | 2534(45.96%) | 1863 (54.38%) | 671 (32.14%) | 2456 (47.64%) | 78 (21.73%) | ||
| Diabetes, n (%) | <0.001 | <0.001 | |||||
| Yes | 986(17.88%) | 364 (10.62%) | 622 (29.79%) | 812 (15.75%) | 174 (48.47%) | ||
| NO | 4528(82.12%) | 3062 (89.38%) | 1466 (70.21%) | 4343 (84.25%) | 185 (51.53%) | ||
| Intensity of activity, n (%) | <0.001 | <0.001 | |||||
| Moderate to low | 2530(45.88%) | 1506 (43.96%) | 1024 (49.04%) | 2330 (45.20%) | 200 (55.71%) | ||
| High | 2984(54.12%) | 1920 (56.04%) | 1064 (50.96%) | 2825 (54.80%) | 159 (44.29%) | ||
| Smoking status, n (%) | <0.001 | <0.001 | |||||
| Former | 1252(22.71%) | 675 (19.70%) | 577 (27.63%) | 1132 (21.96%) | 120 (33.43%) | ||
| Current | 958(17.37%) | 622 (18.16%) | 336 (16.09%) | 910 (17.65%) | 48 (13.37%) | ||
| Never | 3304(59.92%) | 2129 (62.14%) | 1175 (56.27%) | 3113 (60.39%) | 191 (53.20%) | ||
| Drinking status, n (%) | 0.257 | 0.005 | |||||
| Moderate | 1899(34.44%) | 1179 (34.41%) | 720 (34.48%) | 1767 (34.28%) | 132 (36.77%) | ||
| Heavy | 1958(35.51%) | 1241 (36.22%) | 717 (34.34%) | 1858 (36.04%) | 100 (27.86%) | ||
| Never | 1657(30.05%) | 1006 (29.36%) | 651 (31.18%) | 1530 (29.68%) | 127 (35.38%) | ||
| Chronic kidney disease | <0.001 | 0.296 | |||||
| Yes | 1037(18.81%) | 596 (17.40%) | 441 (21.12%) | 962 (18.66%) | 75 (20.89%) | ||
| NO | 4477(81.19%) | 2830 (82.60%) | 1647 (78.88%) | 4193 (81.34%) | 284 (79.11%) | ||
| ALT | 22.17± 16.27 | 18.81 ± 12.10 | 27.67 ± 20.25 | <0.001 | 21.46 ± 14.72 | 32.34 ± 29.11 | <0.001 |
| ALP | 77.00± 25.73 | 74.41 ± 26.00 | 81.25 ± 24.71 | <0.001 | 76.16 ± 24.83 | 89.06 ± 34.15 | <0.001 |
| AST | 21.55± 12.50 | 20.43 ± 10.17 | 23.39 ± 15.43 | <0.001 | 20.96 ± 9.97 | 30.06 ± 29.97 | <0.001 |
| GGT | 31.63± 53.53 | 26.54 ± 54.61 | 39.98 ± 50.63 | <0.001 | 29.20 ± 38.19 | 66.53 ± 147.71 | <0.001 |
| GNRI | 117.36± 13.48 | 112.87 ± 11.30 | 124.72 ± 13.54 | <0.001 | 116.31 ± 12.29 | 132.38 ± 19.58 | <0.001 |
| PNI | 51.81± 5.15 | 51.63 ± 5.11 | 52.10 ± 5.22 | <0.001 | 51.87 ± 5.10 | 50.90 ± 5.76 | <0.001 |
| CONUT | 1.38± 0.76 | 1.40 ± 0.77 | 1.34 ± 0.73 | 0.002 | 1.37 ± 0.73 | 1.58 ± 1.02 | <0.001 |
| TCBI | 2335.01± 2414.36 | 1729.94 ± 1541.31 | 3327.82 ± 3148.38 | <0.001 | 2252.99 ± 2297.38 | 3512.78 ± 3506.11 | <0.001 |
| AGR | 1.35± 0.24 | 1.37 ± 0.24 | 1.32 ± 0.24 | <0.001 | 1.36 ± 0.24 | 1.27 ± 0.26 | <0.001 |
Continuous variables were expressed as mean ± standard deviation (SD), while categorical variables were expressed as percentages. The significance of the data was evaluated using the t-test and the chi-square test. ALT: alanine aminotransferase; ALP: alkaline phosphatase; AST: aspartate aminotransferase; GGT: gamma glutamyl transferase; PIR: Poverty Income Ratio; BMI: body mass index; GNRI: Geriatric Nutritional Risk Index; PNI: Prognostic Nutritional Index; CONUT: Control Nutritional Status Score; TCBI: Triglycerides × Total Cholesterol × Body Weight Index; AGR: Albumin-to-globulin ratio.n: number of study samples.
3.2. Association of Nutrition-Related Indices with NAFLD and AHF
Table 3 presents the results of multiple linear regression analysis between five nutrition-related indicators and NAFLD. To emphasize the effect, TCBI was divided by 100.The nutrition-related indicators were categorized as continuous and categorical variables, and multiple models, adjusted for different covariates, were analyzed. The results indicate that in the fully adjusted model (Model 3), when the nutrition-related indicators are treated as continuous variables, there was a significant positive correlation between GNRI, PNI, and TCBI and NAFLD, and a significant negative correlation between CONUT, AGR, and NAFLD. For every one-unit increase in GNRI, the risk of NAFLD increased by 0.054 (OR = 1.054 [1.045, 1.063]). Similarly, for every unit increase in PNI, the risk of NAFLD increased by 0.02 (OR = 1.020 [1.007, 1.034]). For every unit increase in TCBI/100, the risk of NAFLD increased by 0.021 (OR = 1.021 [1.017, 1.025]). For every one-unit increase in CONUT, the risk of NAFLD decreased by 0.101 (OR = 0.899 [0.821, 0.983]). For every one-unit increase in AGR, the risk of NAFLD decreased by 0.412 (OR = 0.588 [0.431, 0.801]). When the nutrition-related indicators were considered as categorical variables, a significant dose-response relationship was observed between PNI, CONUT, TCBI, AGR, and NAFLD (P for trend < 0.05). Compared to the lowest group, the risk of NAFLD in the highest GNRI group was elevated by 1.487 (OR = 2.487 [1.238, 4.996]), the risk of NAFLD in the highest PNI group rose by 0.351 (OR = 1.351 [1.115, 1.638]), the highest TCBI/100 group exhibited a 2.751-fold increased risk of NAFLD (OR = 3.751 [2.982, 4.718]), and the highest AGR group demonstrated a 0.237-fold decreased risk of NAFLD (OR = 0.763 [0.622, 0.936]).
Table 4 presents the results of the multiple linear regression analysis between nutrition-related indicators and AHF. To emphasize the effect, TCBI was divided by 100.The indicators were categorized as continuous and categorical variables, and different models were analyzed after adjusting for multiple covariates. The results indicate that in the fully adjusted model (Model 3), when the nutrition-related indicators were treated as continuous variables, there was a significant positive correlation between GNRI, CONUT, and TCBI and AHF, and a significant negative correlation between AGR and AHF. For every one-unit increase in GNRI, the risk of AHF increased by 0.074 (OR = 1.074 [1.062, 1.086]). For every unit increase in CONUT, the risk of AHF increased by 0.219 (OR = 1.219 [1.068, 1.391]). For every unit increase in TCBI/100, the risk of AHF increased by 0.004 (OR = 1.004 [1.000, 1.008]). For each unit increase in AGR, the risk of AHF decreased by 0.589 (OR = 0.411 [0.235, 0.716]). When the nutrition-related indicators were considered as categorical variables, a significant dose-response relationship was observed between CONUT, TCBI, AGR, and AHF (P for trend < 0.05). Compared with the lowest group, the risk of AHF in the highest AGR group decreased by 0.343 (OR = 0.657 [0.459, 0.940]).
3.3. Subgroup Analysis
This study conducted subgroup analyses according to age, gender, race, hypertension, diabetes, drinking, smoking, and other dependent variables to explore the differences in the associations between five nutrition-related indicators and NAFLD and AHF across different population subgroups. Figure 2 presents the results of the subgroup analysis between nutrition-related indicators and NAFLD. Significant differences were observed in the association between GNRI and NAFLD across all subgroups. In the race and smoking subgroups, significant differences were observed in the association between PNI and NAFLD. The relationship between CONUT and NAFLD remained unaffected across all subgroups. In the gender and smoking subgroups, significant differences were observed in the association between TCBI and NAFLD. The association between AGR and NAFLD was significant in the smoking subgroup. Figure 3 presents the results of the subgroup analysis between nutrition-related indicators and AHF. Across all subgroups, significant differences were observed between GNRI and AHF. The association between PNI and AHF was significant in the gender and hypertension subgroups. In the age and drinking subgroups, significant differences were observed in the association between CONUT and AHF. Significant differences were observed in the association between TCBI and AHF in the race and hypertension subgroups. In the age and smoking subgroups, significant differences were observed in the association between AGR and AHF.
3.4. Smooth Curve Fitting and Threshold Effect Analysis
Smooth curve fitting was employed in the study to assess the non-linear correlation between nutrition-related indicators and NAFLD and AHF. To emphasize the effect, TCBI was divided by 100. As shown in Figure 4, there was a significant non-linear correlation between GNRI and NAFLD and AHF, and between TCBI/100 and NAFLD, with inflection points of 141.16, 120.17, and 31.20, respectively. When GNRI was less than 141.16, for every unit increase in GNRI, the risk of NAFLD increased by 0.054, and the relationship was not statistically significant when GNRI exceeded 141.16. When GNRI was less than 120.17, the relationship between GNRI and AHF was not statistically significant. When GNRI exceeded 120.17, for every unit increase in GNRI, the risk of AHF increased by 0.083. When TCBI/100 was less than 31.20, the risk of NAFLD increased by 0.052 for every unit increase in TCBI/100. When TCBI/100 exceeded 31.20, the risk of NAFLD increased by 0.005 for every unit increase in TCBI/100. (Table 5).
4. Discussion
With the rising incidence of metabolic syndrome and obesity, the prevalence of NAFLD and AHF has also increased globally, becoming a significant public health concern. GNRI, PNI, CONUT, TCBI, and AGR have been extensively used in clinical practice to assess the nutritional status and prognosis of patients, particularly those with cancer, cardiovascular diseases, and severe illnesses, demonstrating substantial clinical value. Our study is the first comprehensive retrospective analysis to thoroughly investigate the association between these five nutrition-related indicators and NAFLD and AHF. The study included 5,514 participants from the NHANES database between 2017 and March 2020. The results indicated that after adjusting for all confounding factors, malnutrition was significantly associated with both NAFLD and AHF. Specifically, GNRI, PNI, and TCBI were positively associated with the incidence of NAFLD, while CONUT and AGR were negatively associated with NAFLD. GNRI, CONUT, and TCBI were positively associated with AHF, while AGR was negatively associated with AHF.
The GNRI combines serum albumin levels and body weight data to assess the prognosis of patients with various diseases. Zhao et al. [17] analyzed 12,058 patients with acute kidney injury (AKI) from the eICU Collaborative Research Database and found that a nutritional risk (GNRI < 98) was significantly associated with increased in-hospital mortality among AKI patients in the intensive care unit. Another cohort study from China demonstrated that GNRI was negatively correlated with the risk of all-cause mortality in patients with atrial fibrillation, and that a higher GNRI acted as a protective factor in this population. Our study found that GNRI was positively correlated with the risk of NAFLD and AHF. This may be due to GNRI being composed of two components: serum albumin and current body weight/standard body weight. Albumin, one of the primary plasma proteins in the human body, plays a crucial role in maintaining plasma colloid osmotic pressure and transporting endogenous and exogenous substances [18]. Recent studies indicate that a reduction in albumin levels is closely related to the progression of NAFLD. In patients with NAFLD, low albumin levels are often associated with aggravated liver fibrosis, likely due to chronic inflammation, oxidative stress, and diminished albumin synthesis resulting from liver dysfunction [19]. In patients with AHF, hypoalbuminemia is more pronounced, reflecting severe impairment of liver synthetic function and closely correlating with further disease progression and an adverse prognosis. A study by Khanna et al. [20] demonstrated that a sustained reduction in albumin levels may predict liver failure and an increased incidence of complications, including ascites, hepatic encephalopathy, and infection. In contrast to the protective effect of albumin, obesity is a major risk factor for the development of NAFLD and AHF. Kuang et al. demonstrated that obesity-related indices such as BMI, A Body Shape Index (ABSI), Anthropometric Risk Index (ARI), and waist circumference were significantly and positively correlated with the risk of NAFLD. Obesity is associated with lipid metabolism disorders and excessive fat accumulation in the liver. This steatosis induces liver cell stress, oxidative damage, and non-alcoholic steatohepatitis (NASH), ultimately resulting in liver cell damage and the initiation of fibrosis [21]. Lipid metabolism disorders and chronic low-grade inflammation promote abnormal liver collagen deposition and accelerate fibrosis formation [22]. Additionally, obesity is closely linked to metabolic syndrome (e.g., insulin resistance, hypertension, and dyslipidemia), which is a key risk factor for the progression of NAFLD to AHF [23].
The PNI comprises serum albumin levels and lymphocyte counts and is used to predict the risk of malnutrition and postoperative complications. It is widely used in assessing the survival prognosis of cancer patients. A PNI value below 40 typically indicates poor nutritional status. Pinato et al. [24] analyzed clinical data from 112 liver cancer patients and found that PNI is an independent predictor of poor prognosis. Another cohort study demonstrated that PNI is an important predictor of recurrence and survival after radical surgery for early-stage hepatocellular carcinoma [25]. The pathogenesis of NAFLD involves complex metabolic disorders and chronic low-grade inflammation, where lymphocytes play a dual role. Activated T lymphocytes, such as helper T cells 1 (Th1) and 17 (Th17), secrete pro-inflammatory cytokines like interferon-gamma (IFN-γ) and tumor necrosis factor-alpha (TNF-α), exacerbating liver cell damage and apoptosis, stimulating hepatic stellate cell activation, and leading to excessive collagen deposition [26]. Conversely, regulatory T cells (Treg) and helper T cells 22 (Th22) inhibit excessive immune responses by secreting anti-inflammatory cytokines (IL-10, IL-22), thereby reducing liver damage and exerting an anti-fibrosis effect [27]. Additionally, IgG autoantibodies produced by B lymphocytes can accelerate the progression of NAFLD fibrosis. As NAFLD progresses to advanced liver fibrosis, lymphocytes increasingly promote fibrosis [28]. Our study found that PNI was significantly positively correlated with the risk of NAFLD, while no significant association was found with AHF. A retrospective study from the same NHANES cohort showed that an increase in PNI was positively correlated with an increased risk of NAFLD and negatively correlated with an increased risk of AHF. This may be attributed to differing inclusion and exclusion criteria for the samples and varying covariates [11].
The CONUT score comprises serum albumin, total lymphocyte count, and total cholesterol scores, which collectively assess the patient’s protein-energy malnutrition and immune function status. Low serum albumin levels reflect decreased liver function and impaired protein synthesis. The total lymphocyte count is a key indicator of immune system function, reflecting the patient’s current immune response capacity. Total cholesterol levels are closely linked to energy metabolism and nutritional status, with lower cholesterol levels generally indicating malnutrition [29]. Patients with NAFLD experience lipid metabolism disorders, characterized by elevated serum cholesterol levels that result in excessive cholesterol accumulation in hepatocytes. Excessive intrahepatic cholesterol induces mitochondrial damage and oxidative stress, subsequently activating hepatic stellate cells (HSCs) and promoting liver fibrosis [30]. In the early stages of the disease, elevated total cholesterol is closely associated with hepatic steatosis and inflammation. However, as the disease progresses to advanced liver fibrosis, liver synthetic function becomes impaired, and cholesterol synthesis and metabolism decline, potentially leading to lower serum total cholesterol levels [31]. This dynamic shift in cholesterol levels reflects the pathophysiological progression of NAFLD to AHF. Our study found that the CONUT score was negatively correlated with the incidence of NAFLD and positively correlated with the incidence of AHF. A possible explanation is that in the early stages of NAFLD, patients are often overweight or obese, typically associated with better nutritional reserves and higher protein levels. As a result, despite the formation of fatty liver, the CONUT score remains low. However, as the disease progresses to advanced fibrosis, liver synthetic function becomes impaired, protein metabolism is disrupted, immune function declines, and cholesterol synthesis decreases, leading to an increase in the CONUT score. Miano et al. [32] found that an elevated CONUT score is closely associated with severe hepatic steatosis but not significantly correlated with moderate steatosis. Severe hepatic steatosis is often accompanied by significant liver fibrosis, supporting our findings to some extent.
TCBI is a novel and straightforward nutritional tool that evaluates a patient’s nutritional and metabolic health status, primarily based on triglyceride levels, total cholesterol, and body weight. A retrospective observational cohort study from Japan demonstrated that a lower TCBI score was significantly associated with an increased risk of all-cause mortality, cardiovascular disease mortality, and cancer mortality [33]. Another recent study found that TCBI was independently and negatively associated with stroke prevalence, particularly in hypertensive patients under 60 years of age [34]. Our study found that TCBI was significantly positively correlated with the risk of NAFLD and AHF, likely due to the combined effects of triglycerides, total cholesterol, and body weight. Triglycerides are the primary form of fat storage in the liver. Elevated serum triglyceride levels typically reflect abnormal fat metabolism, and excessive fat accumulation in the liver contributes to the development of NAFLD. Insulin resistance is a core pathological mechanism of NAFLD. Insulin resistance decreases the liver’s sensitivity to insulin, leading to increased fatty acid mobilization and enhanced triglyceride synthesis, which further promotes intrahepatic fat accumulation [35]. Additionally, excessive triglycerides activate immune cells, such as Kupffer cells, which release inflammatory factors like TNF-α and IL-1β, promoting the progression of NAFLD to AHF [36].
AGR is the ratio of serum albumin to globulin and reflects both liver function and the systemic inflammatory state. A low AGR typically indicates chronic inflammation, impaired liver function, or protein malnutrition, all of which are risk factors for poor prognosis. Wen et al. [37] demonstrated that in diabetic patients, higher serum AGR levels were significantly and linearly associated with reduced mortality from all causes, cancer, and cardiovascular diseases. Albumin, produced by the liver, has antioxidant, anti-inflammatory, and immune-modulating functions. Higher albumin levels are typically associated with better liver function and overall health [38]. Impaired liver function in NAFLD patients can lead to decreased albumin production and reduced serum albumin levels. Globulin plays a key role in the immune response and is a potential predictor of inflammation and cancer [39]. NAFLD development is often accompanied by chronic inflammation and immune system activation, prompting the body to produce more immunoglobulins [40]. As liver fibrosis progresses and liver cell function further deteriorates, immune and inflammatory responses become more pronounced, causing globulin levels to rise. AGR is typically low when albumin levels are low and globulin levels are high. The protective effect of albumin diminishes, while the pathological increase in globulin reflects chronic inflammation and poor liver function. Our results indicate that AGR is negatively correlated with the risk of NAFLD and AHF.
Nutritional indicators such as GNRI, PNI, CONUT, TCBI, and AGR can reflect an individual’s current nutritional status to a certain extent. Previous studies have typically identified nutrition as a protective factor against disease, with high nutritional status often indicating a lower disease prevalence and longer survival. Our study demonstrates that the relationship between nutritional status and NAFLD and AHF is complex. On the one hand, high nutritional status can lead to excessive fat accumulation in the liver, causing fat degeneration and inflammation, potentially increasing the risk of NAFLD. Persistent inflammatory stimuli and nutritional metabolites, such as cholesterol, exacerbate the progression of NAFLD to AHF. Conversely, nutrients like albumin can protect the liver through anti-inflammatory and antioxidant effects, improve the liver microenvironment, and delay disease progression. When liver cirrhosis progresses to liver failure, better nutritional status can enhance patient survival [41]. Therefore, maintaining a proper balance of nutrient intake, reducing excessive calories and fat, and limiting sugars and simple carbohydrates can help control body weight and improve insulin resistance. Additionally, increasing the intake of high-quality protein can aid in repairing damaged liver cells and promote liver function recovery. Overall, an individualized nutritional intervention strategy is crucial for the prevention and management of NAFLD and AHF, and warrants clinical attention.
This study has several advantages. It utilized all available continuous NHANES data cycles, encompassing a large sample of participants from across the United States, enhancing the robustness of the statistical analysis and improving the generalizability of the results. The study design carefully considered various potential confounding factors, including socio-demographics, lifestyle, health status, and laboratory tests, and adjusted for these factors through multivariate analysis to ensure accuracy and reliability. Notably, this is the first study to comprehensively analyze the association between nutritional indices and the risk of developing NAFLD and AHF. It offers new insights into the potential role of nutritional status in NAFLD and AHF, helping to more accurately identify high-risk populations and develop personalized intervention strategies.
This study has certain limitations. First, due to the cross-sectional design, establishing a clear causal relationship between nutritional status and NAFLD and AHF is not possible. Second, although multiple confounding factors were adjusted for, some external variables may not have been fully accounted for, and these unaccounted confounding factors may influence the accuracy of the results. Additionally, this study is based on a representative sample from the United States, and the generalizability of the results to other populations may be limited. Therefore, further research and data are needed to explore the relationship between nutritional status and NAFLD and AHF.
5. Conclusions
In summary, our study found that nutritional status indicators were significantly associated with NAFLD and AHF. Specifically, GNRI, PNI, and TCBI were positively associated with NAFLD incidence, while CONUT and AGR were negatively associated with NAFLD incidence. GNRI, CONUT, and TCBI were positively associated with AHF incidence, while AGR was negatively associated with AHF incidence. These findings highlight the complex relationship between nutritional status and NAFLD and AHF. In clinical practice, individualized nutritional intervention plans should be developed based on specific nutritional indicators to prevent or delay the onset and progression of NAFLD and AHF. Additionally, further large-scale studies are needed to better understand the mechanistic links between these nutritional indicators and NAFLD and AHF, providing a scientific foundation for developing more effective prevention and treatment strategies.
Author Contributions
Conceptualization, Shouxin Wei. and Sijia Yu.; methodology, Shouxin Wei.; software, Shouxin Wei.; validation, Yingdong Jia. and Ningbo Yang.; formal analysis, Shouxin Wei.; resources, Shouxin Wei.; data curation, Shouxin Wei.; writing—original draft preparation, Shouxin Wei.; writing—review and editing, Yunshen Lan.; visualization, Shouxin Wei.; supervision, Sijia Yu.; project administration, Yindong Jia.; All authors have read and agreed to the published version of the manuscript.
Funding
This research received no external funding.
Institutional Review Board Statement
The NCHS Research Ethics Review Board (ERB) reviewed and approved NHANES study protocols, and all participants provided their written informed consent to participate in this study.
Informed Consent Statement
Not applicable.
Data Availability Statement
The datasets generated and/or analyzed during the current study are available in the NHANES repository, [https://www.cdc.gov/nchs/nhanes/].
Acknowledgments
Our team sincerely appreciates all the staff and participants whose invaluable contributions have greatly enhanced the NHANES data collection.
Conflicts of Interest
The authors declare no conflicts of interest.
References
- Blüher, M. Obesity: global epidemiology and pathogenesis. Nature reviews Endocrinology. 2019;15(5):288-98. [CrossRef]
- Younossi, Z.M.; Stepanova, M.; Younossi, Y.; Golabi, P.; Mishra, A.; Rafiq, N. , et al. Epidemiology of chronic liver diseases in the USA in the past three decades. Gut. 2020;69(3):564-8. [CrossRef]
- Shah, P.A.; Patil, R.; Harrison, S.A. NAFLD-related hepatocellular carcinoma: The growing challenge. Hepatology (Baltimore, Md). 2023;77(1):323-38. [CrossRef]
- Buzzetti, E.; Pinzani, M.; Tsochatzis, E.A. The multiple-hit pathogenesis of non-alcoholic fatty liver disease (NAFLD). Metabolism: clinical and experimental. 2016;65(8):1038-48. 10.1016/j.metabol.2015.12.012.
- Tanwar, S.; Rhodes, F.; Srivastava, A.; Trembling, P.M.; Rosenberg, W.M. Inflammation and fibrosis in chronic liver diseases including non-alcoholic fatty liver disease and hepatitis C. World journal of gastroenterology. 2020;26(2):109-33. [CrossRef]
- Fan, J.G.; Cao, H.X. Role of diet and nutritional management in non-alcoholic fatty liver disease. Journal of gastroenterology and hepatology. 2013;28 Suppl 4:81-7. [CrossRef]
- Rives, C.; Fougerat, A.; Ellero-Simatos, S.; Loiseau, N.; Guillou, H.; Gamet-Payrastre, L. , et al. Oxidative Stress in NAFLD: Role of Nutrients and Food Contaminants. Biomolecules. 2020;10(12). [CrossRef]
- Tan, B.L.; Norhaizan, M.E.; Liew, W.P. Nutrients and Oxidative Stress: Friend or Foe? Oxidative medicine and cellular longevity. 2018;2018:9719584.
- Ucar, F.; Sezer, S.; Erdogan, S.; Akyol, S.; Armutcu, F.; Akyol, O. The relationship between oxidative stress and nonalcoholic fatty liver disease: Its effects on the development of nonalcoholic steatohepatitis. Redox report: communications in free radical research. 2013;18(4):127-33. [CrossRef]
- Alisi, A.; McCaughan, G.; Grønbæk, H. Role of gut microbiota and immune cells in metabolic-associated fatty liver disease: clinical impact. Hepatology international. 2024. [CrossRef] [PubMed]
- Chen, G.; Fan, L.; Yang, T.; Xu, T.; Wang, Z.; Wang, Y. , et al. Prognostic nutritional index (PNI) and risk of non-alcoholic fatty liver disease and advanced liver fibrosis in US adults: Evidence from NHANES 2017-2020. Heliyon. 2024;10(4):e25660. [CrossRef]
- Bouillanne, O.; Morineau, G.; Dupont, C.; Coulombel, I.; Vincent, J.P.; Nicolis, I. , et al. Geriatric Nutritional Risk Index: a new index for evaluating at-risk elderly medical patients. The American journal of clinical nutrition. 2005;82(4):777-83.
- Onodera, T.; Goseki, N.; Kosaki, G. [Prognostic nutritional index in gastrointestinal surgery of malnourished cancer patients]. Nihon Geka Gakkai zasshi. 1984;85(9):1001-5.
- Buzby, G.P.; Mullen, J.L.; Matthews, D.C.; Hobbs, C.L.; Rosato, E.F. Prognostic nutritional index in gastrointestinal surgery. American journal of surgery. 1980;139(1):160-7. [CrossRef]
- Doi, S.; Iwata, H.; Wada, H.; Funamizu, T.; Shitara, J.; Endo, H. , et al. A novel and simply calculated nutritional index serves as a useful prognostic indicator in patients with coronary artery disease. International journal of cardiology. 2018;262:92-8. [CrossRef]
- Li, X.; Qin, S.; Sun, X.; Liu, D.; Zhang, B.; Xiao, G. , et al. Prognostic Significance of Albumin-Globulin Score in Patients with Operable Non-Small-Cell Lung Cancer. Annals of surgical oncology. 2018;25(12):3647-59. [CrossRef]
- Zhao, D.; Zhou, D.; Li, T.; Wang, C.; Fei, S. The relationship between Geriatric Nutritional Risk Index (GNRI) and in-hospital mortality in critically ill patients with Acute Kidney Injury (AKI). BMC anesthesiology. 2024;24(1):313. [CrossRef]
- Belinskaia, D.A.; Jenkins, R.O.; Goncharov, N.V. Serum Albumin in Health and Disease: From Comparative Biochemistry to Translational Medicine. International journal of molecular sciences. 2023;24(18). [CrossRef]
- Oettl, K.; Birner-Gruenberger, R.; Spindelboeck, W.; Stueger, H.P.; Dorn, L.; Stadlbauer, V. , et al. Oxidative albumin damage in chronic liver failure: relation to albumin binding capacity, liver dysfunction and survival. Journal of hepatology. 2013;59(5):978-83. [CrossRef]
- Khanna, D.; Kar, P.; Sahu, P. Efficacy of long-term albumin therapy in the treatment of decompensated cirrhosis. Indian journal of gastroenterology: official journal of the Indian Society of Gastroenterology. 2024;43(2):494-504.
- Lela, L.; Russo, D.; De Biasio, F.; Gorgoglione, D.; Ostuni, A.; Ponticelli, M. , et al. Solanum aethiopicum L. from the Basilicata Region Prevents Lipid Absorption, Fat Accumulation, Oxidative Stress, and Inflammation in OA-Treated HepG2 and Caco-2 Cell Lines. Plants (Basel, Switzerland). 2023;12(15). [CrossRef]
- Zhang, H.; Li, Y.; Zhang, C.; Huang, K.; Zhao, J.; Le, S. , et al. B-cell lymphoma 6 alleviates nonalcoholic fatty liver disease in mice through suppression of fatty acid transporter CD36. Cell death & disease. 2022;13(4):359. [CrossRef]
- Radu, F.; Potcovaru, C.G.; Salmen, T.; Filip, P.V.; Pop, C. , Fierbințeanu-Braticievici C. The Link between NAFLD and Metabolic Syndrome. Diagnostics (Basel, Switzerland). 2023;13(4). [CrossRef]
- Pinato, D.J.; North, B.V.; Sharma, R. A novel, externally validated inflammation-based prognostic algorithm in hepatocellular carcinoma: the prognostic nutritional index (PNI). British journal of cancer. 2012;106(8):1439-45. [CrossRef]
- Chan, A.W.; Chan, S.L.; Wong, G.L.; Wong, V.W.; Chong, C.C.; Lai, P.B. , et al. Prognostic Nutritional Index (PNI) Predicts Tumor Recurrence of Very Early/Early Stage Hepatocellular Carcinoma After Surgical Resection. Annals of surgical oncology. 2015;22(13):4138-48. [CrossRef]
- Zhou, Y.; Zhang, H.; Yao, Y.; Zhang, X.; Guan, Y.; Zheng, F. CD4(+) T cell activation and inflammation in NASH-related fibrosis. Frontiers in immunology. 2022;13:967410. [CrossRef]
- Mao, T.; Yang, R.; Luo, Y.; He, K. Crucial role of T cells in NAFLD-related disease: A review and prospect. Frontiers in endocrinology. 2022;13:1051076. [CrossRef]
- Bruzzì, S.; Sutti, S.; Giudici, G.; Burlone, M.E.; Ramavath, N.N.; Toscani, A. , et al. B2-Lymphocyte responses to oxidative stress-derived antigens contribute to the evolution of nonalcoholic fatty liver disease (NAFLD). Free radical biology & medicine. 2018;124:249-59. [CrossRef]
- Li, K.; Cao, W.W.; Chen, S.H.; Zhang, B.F.; Zhang, Y.M. Association between total cholesterol and all-cause mortality in geriatric patients with hip fractures: A prospective cohort study with 339 patients. Advances in clinical and experimental medicine: official organ Wroclaw Medical University. 2024;33(5):463-71. [CrossRef]
- Rauchbach, E.; Zeigerman, H.; Abu-Halaka, D.; Tirosh, O. Cholesterol Induces Oxidative Stress, Mitochondrial Damage and Death in Hepatic Stellate Cells to Mitigate Liver Fibrosis in Mice Model of NASH. Antioxidants (Basel, Switzerland). 2022;11(3). [CrossRef]
- Ferreira, J.; Bicho, M.; Serejo, F. ABCA1 Polymorphism R1587K in Chronic Hepatitis C Is Gender-Specific and Modulates Liver Disease Severity through Its Influence on Cholesterol Metabolism and Liver Function: A Preliminary Study. Genes. 2022;13(11). [CrossRef]
- Miano, N.; Todaro, G.; Di Marco, M.; Scilletta, S.; Bosco, G.; Di Giacomo Barbagallo, F. , et al. Malnutrition-Related Liver Steatosis, CONUT Score and Poor Clinical Outcomes in an Internal Medicine Department. Nutrients. 2024;16(12). [CrossRef]
- Ishiwata, S.; Yatsu, S.; Kasai, T.; Sato, A.; Matsumoto, H.; Shitara, J. , et al. Prognostic Effect of a Novel Simply Calculated Nutritional Index in Acute Decompensated Heart Failure. Nutrients. 2020;12(11). [CrossRef]
- Shi, Y.; Wang, X.; Yu, C.; Zhou, W.; Wang, T.; Zhu, L. , et al. Association of a novel nutritional index with stroke in Chinese population with hypertension: Insight from the China H-type hypertension registry study. Frontiers in nutrition. 2023;10:997180. [CrossRef]
- Gastaldelli, A. Insulin resistance and reduced metabolic flexibility: cause or consequence of NAFLD? Clinical science (London, England: 1979). 2017;131(22):2701-4.
- Moreno-Vedia, J.; Llop, D.; Rodríguez-Calvo, R.; Plana, N.; Amigó, N.; Rosales, R. , et al. Lipidomics of triglyceride-rich lipoproteins derived from hyperlipidemic patients on inflammation. European journal of clinical investigation. 2024;54(3):e14132. [CrossRef]
- Wen, H.; Niu, X.; Yu, R.; Zhao, R.; Wang, Q.; Sun, N. , et al. Association of Serum AGR With All-Cause and Cause-Specific Mortality Among Individuals With Diabetes. The Journal of clinical endocrinology and metabolism. 2024. [CrossRef]
- Duran-Güell, M.; Flores-Costa, R.; Casulleras, M.; López-Vicario, C.; Titos, E.; Díaz, A.; et al. Albumin protects the liver from tumor necrosis factor α-induced immunopathology. FASEB journal: official publication of the Federation of American Societies for Experimental Biology. 2021;35(2):e21365.
- Yang, M.; Zhang, Q.; Ge, Y.; Tang, M.; Hu, C.; Wang, Z. , et al. Prognostic Roles of Inflammation- and Nutrition-Based Indicators for Female Patients with Cancer. Journal of inflammation research. 2022;15:3573-86.
- Patrick-Melin, A.J.; Kalinski, M.I.; Kelly, K.R.; Haus, J.M.; Solomon, T.P.; Kirwan, J.P. Nonalcoholic fatty liver disease: biochemical and therapeutic considerations. Ukrains’kyi biokhimichnyi zhurnal (1999 ). 2009;81(5):16-25.
- Sakamoto, N.; Suda, G.; Morikawa, K.; Ogawa, K. Nutrition is often ignored in management of chronic liver diseases. Journal of gastroenterology and hepatology. 2019;34(7):1127-8. [CrossRef]
Figure 1.
Flowchart of the study.
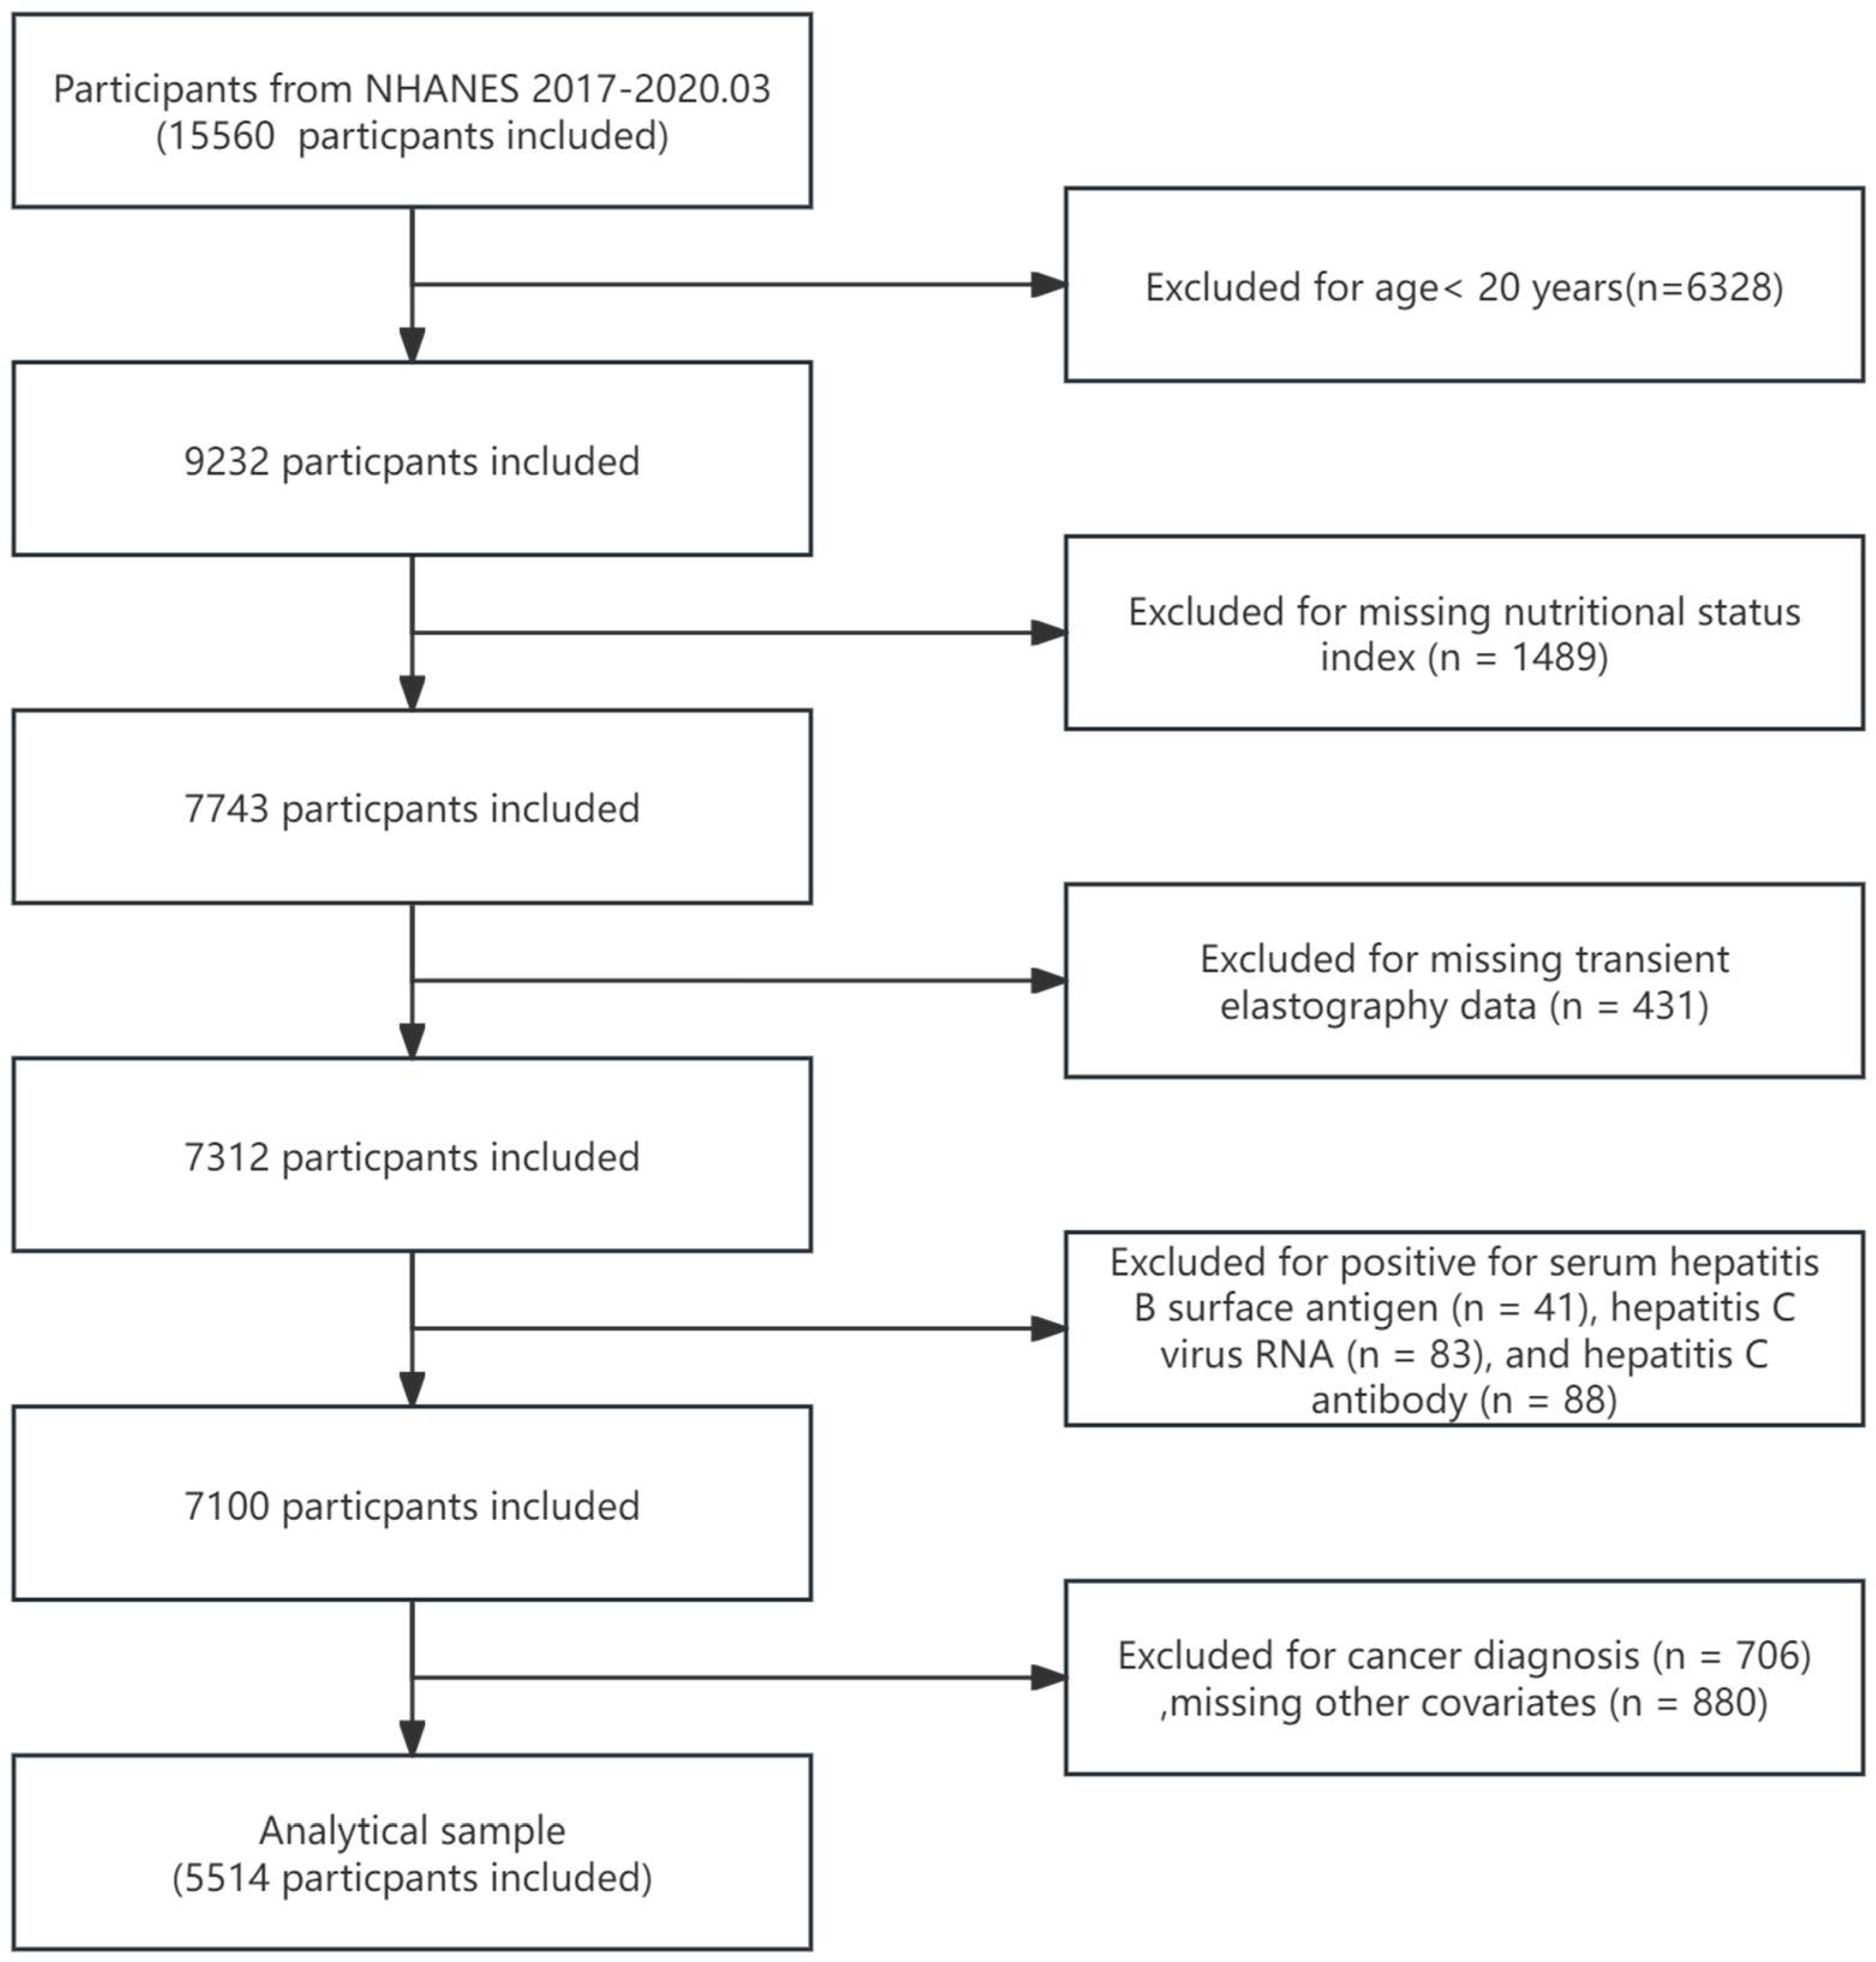
Figure 2.
Stratified analysis of the association between nutrition-related indicators and NAFLD in the 2017–2020.03 US National Health and Nutrition Examination Survey (NHANES). This analysis considered factors such as age, gender, race, education level, marital status, PIR, smoking, drinking, activity level, BMI, stroke, lung disease, heart disease, chronic kidney disease, hypertension, diabetes, and ALT, ALP, AST, and GGT. (A) Stratified analysis of the association between GNRI and NAFLD. (B) Stratified analysis of the association between PNI and NAFLD. (C) Stratified analysis of the association between CONUT and NAFLD. (D) Stratified analysis of the association between TCBI and NAFLD. (E) Stratified analysis of the association between AGR and NAFLD.
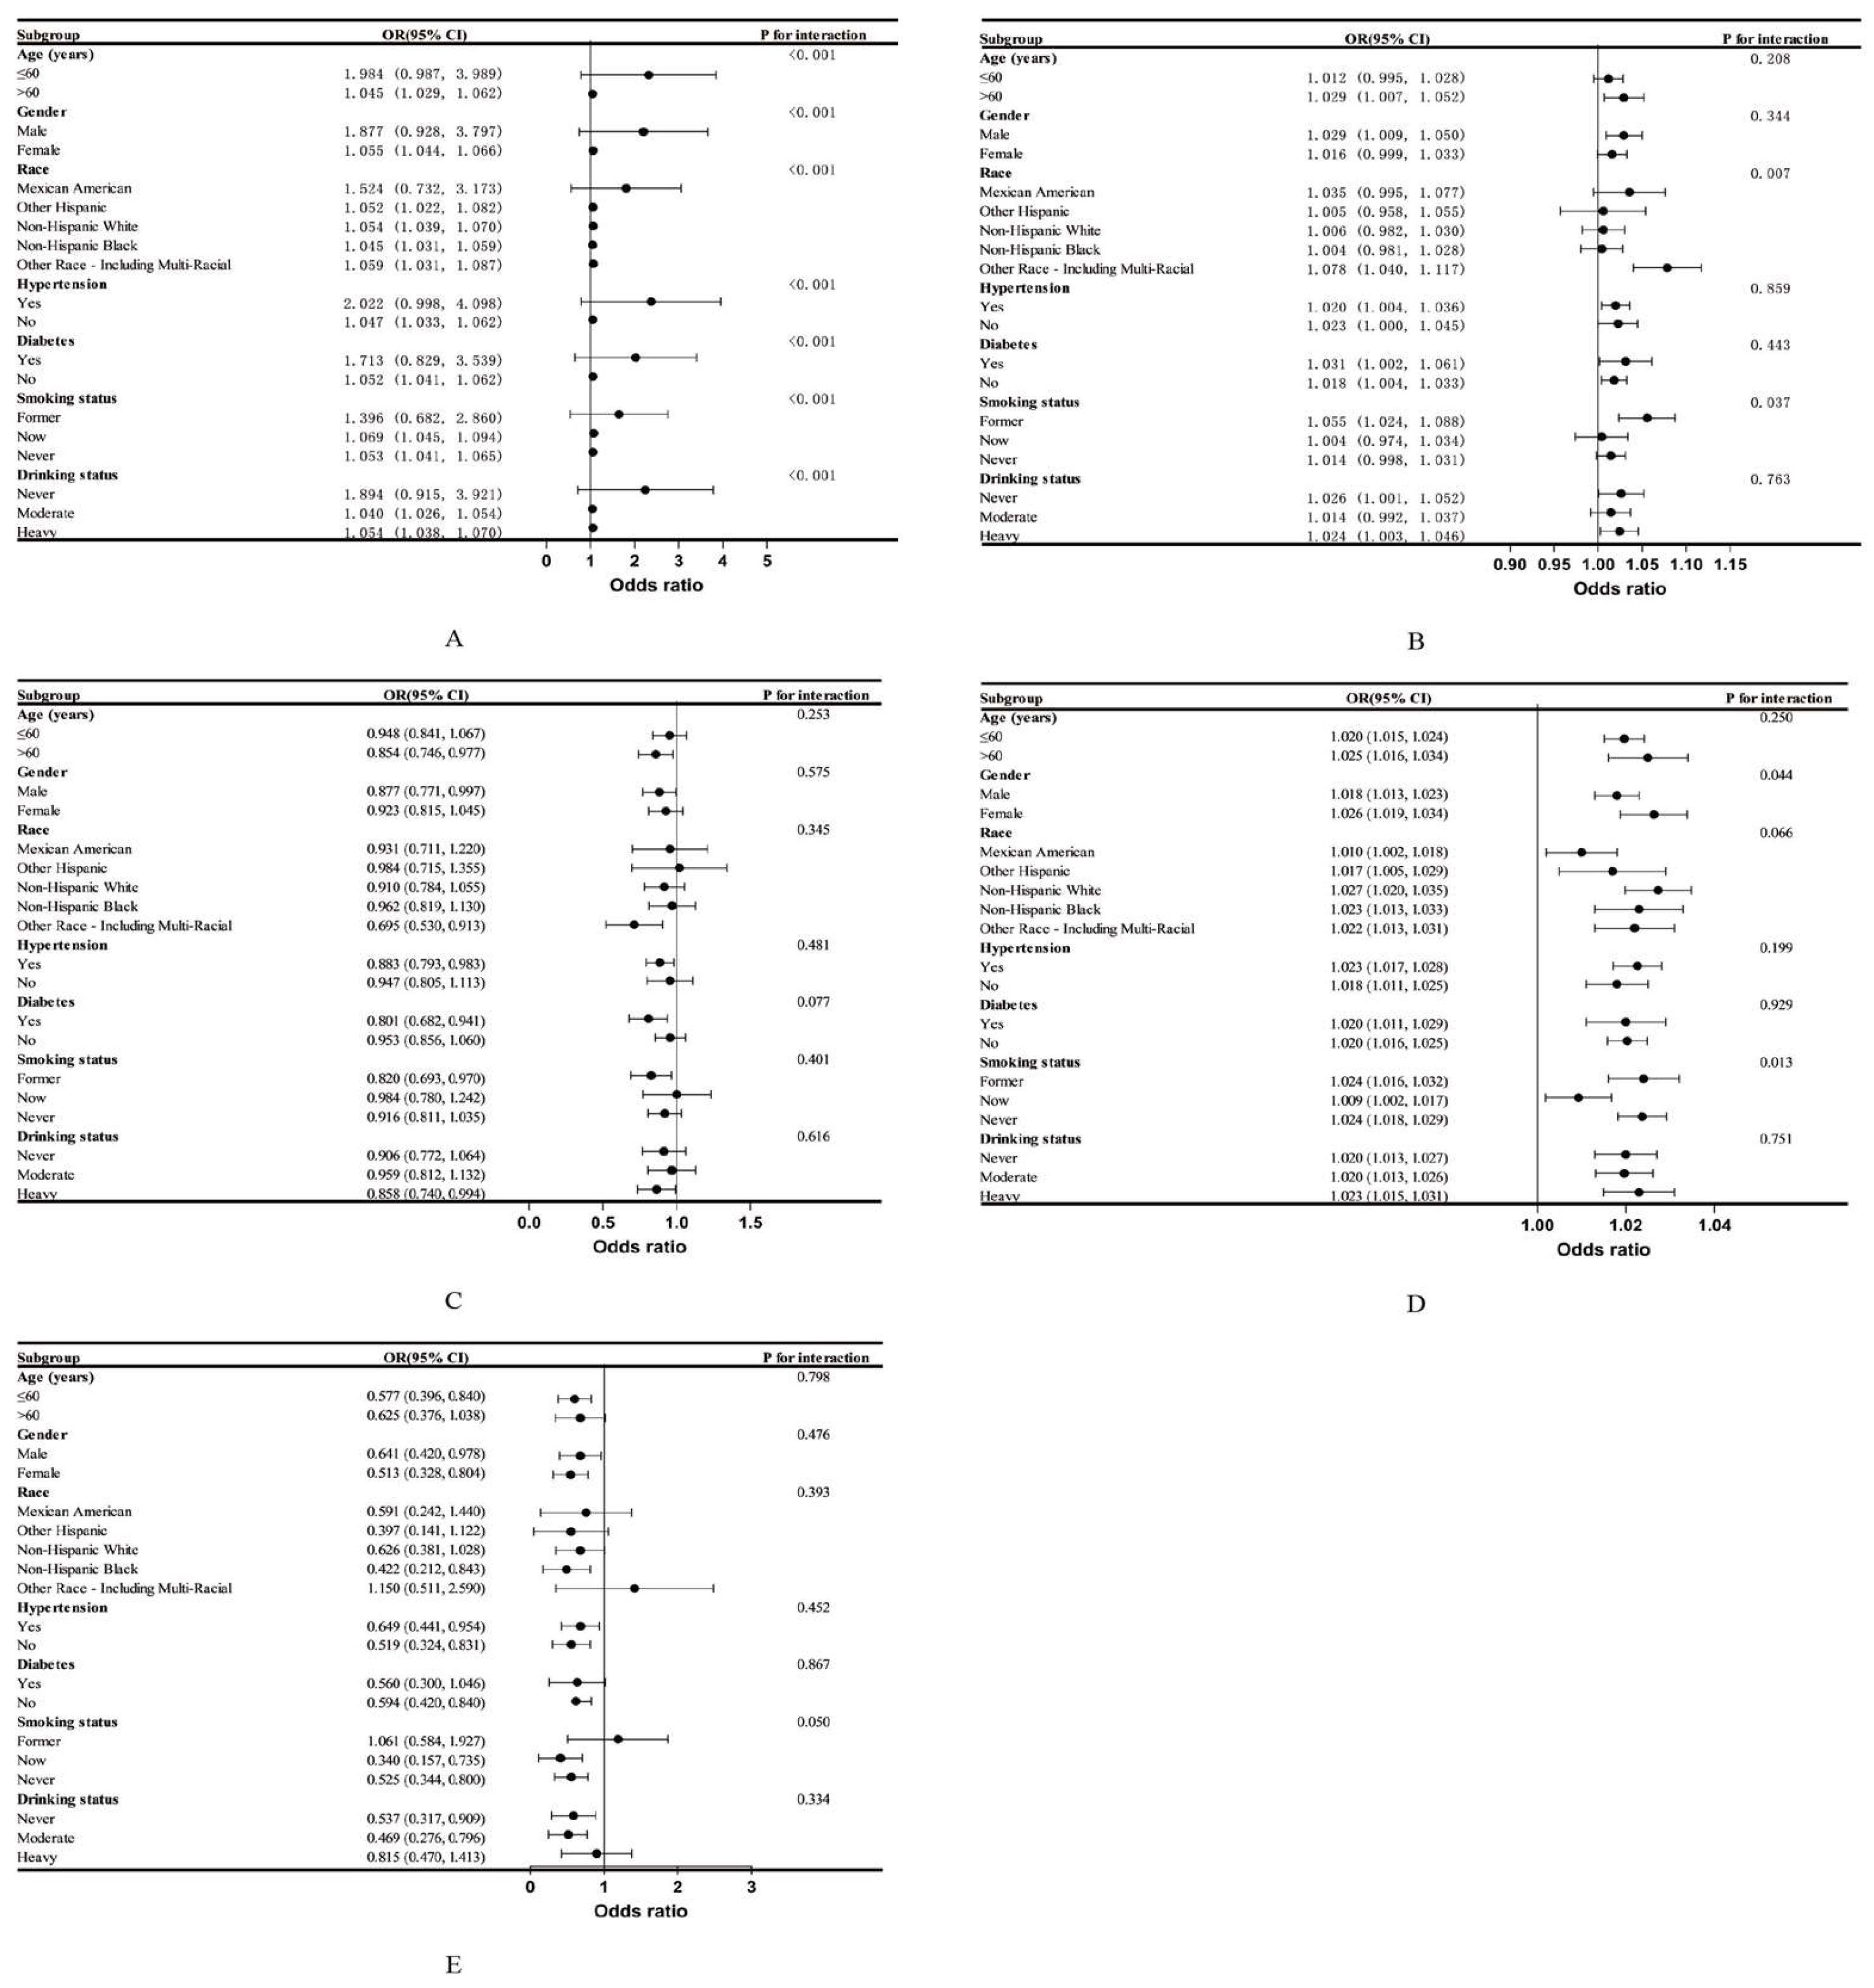
Figure 3.
Stratified analysis of the association between nutrition-related indicators and AHF in the 2017–2020.03 US National Health and Nutrition Examination Survey (NHANES).This analysis considered factors such as age, gender, race, education level, marital status, PIR, smoking, drinking, activity level, BMI, stroke, lung disease, heart disease, chronic kidney disease, hypertension, diabetes, and ALT, ALP, AST, and GGT. (A) Stratified analysis of the association between GNRI and AHF. (B) Stratified analysis of the association between PNI and AHF. (C) Stratified analysis of the association between CONUT and AHF. (D) Stratified analysis of the association between TCBI and AHF. (E) Stratified analysis of the association between AGR and AHF.
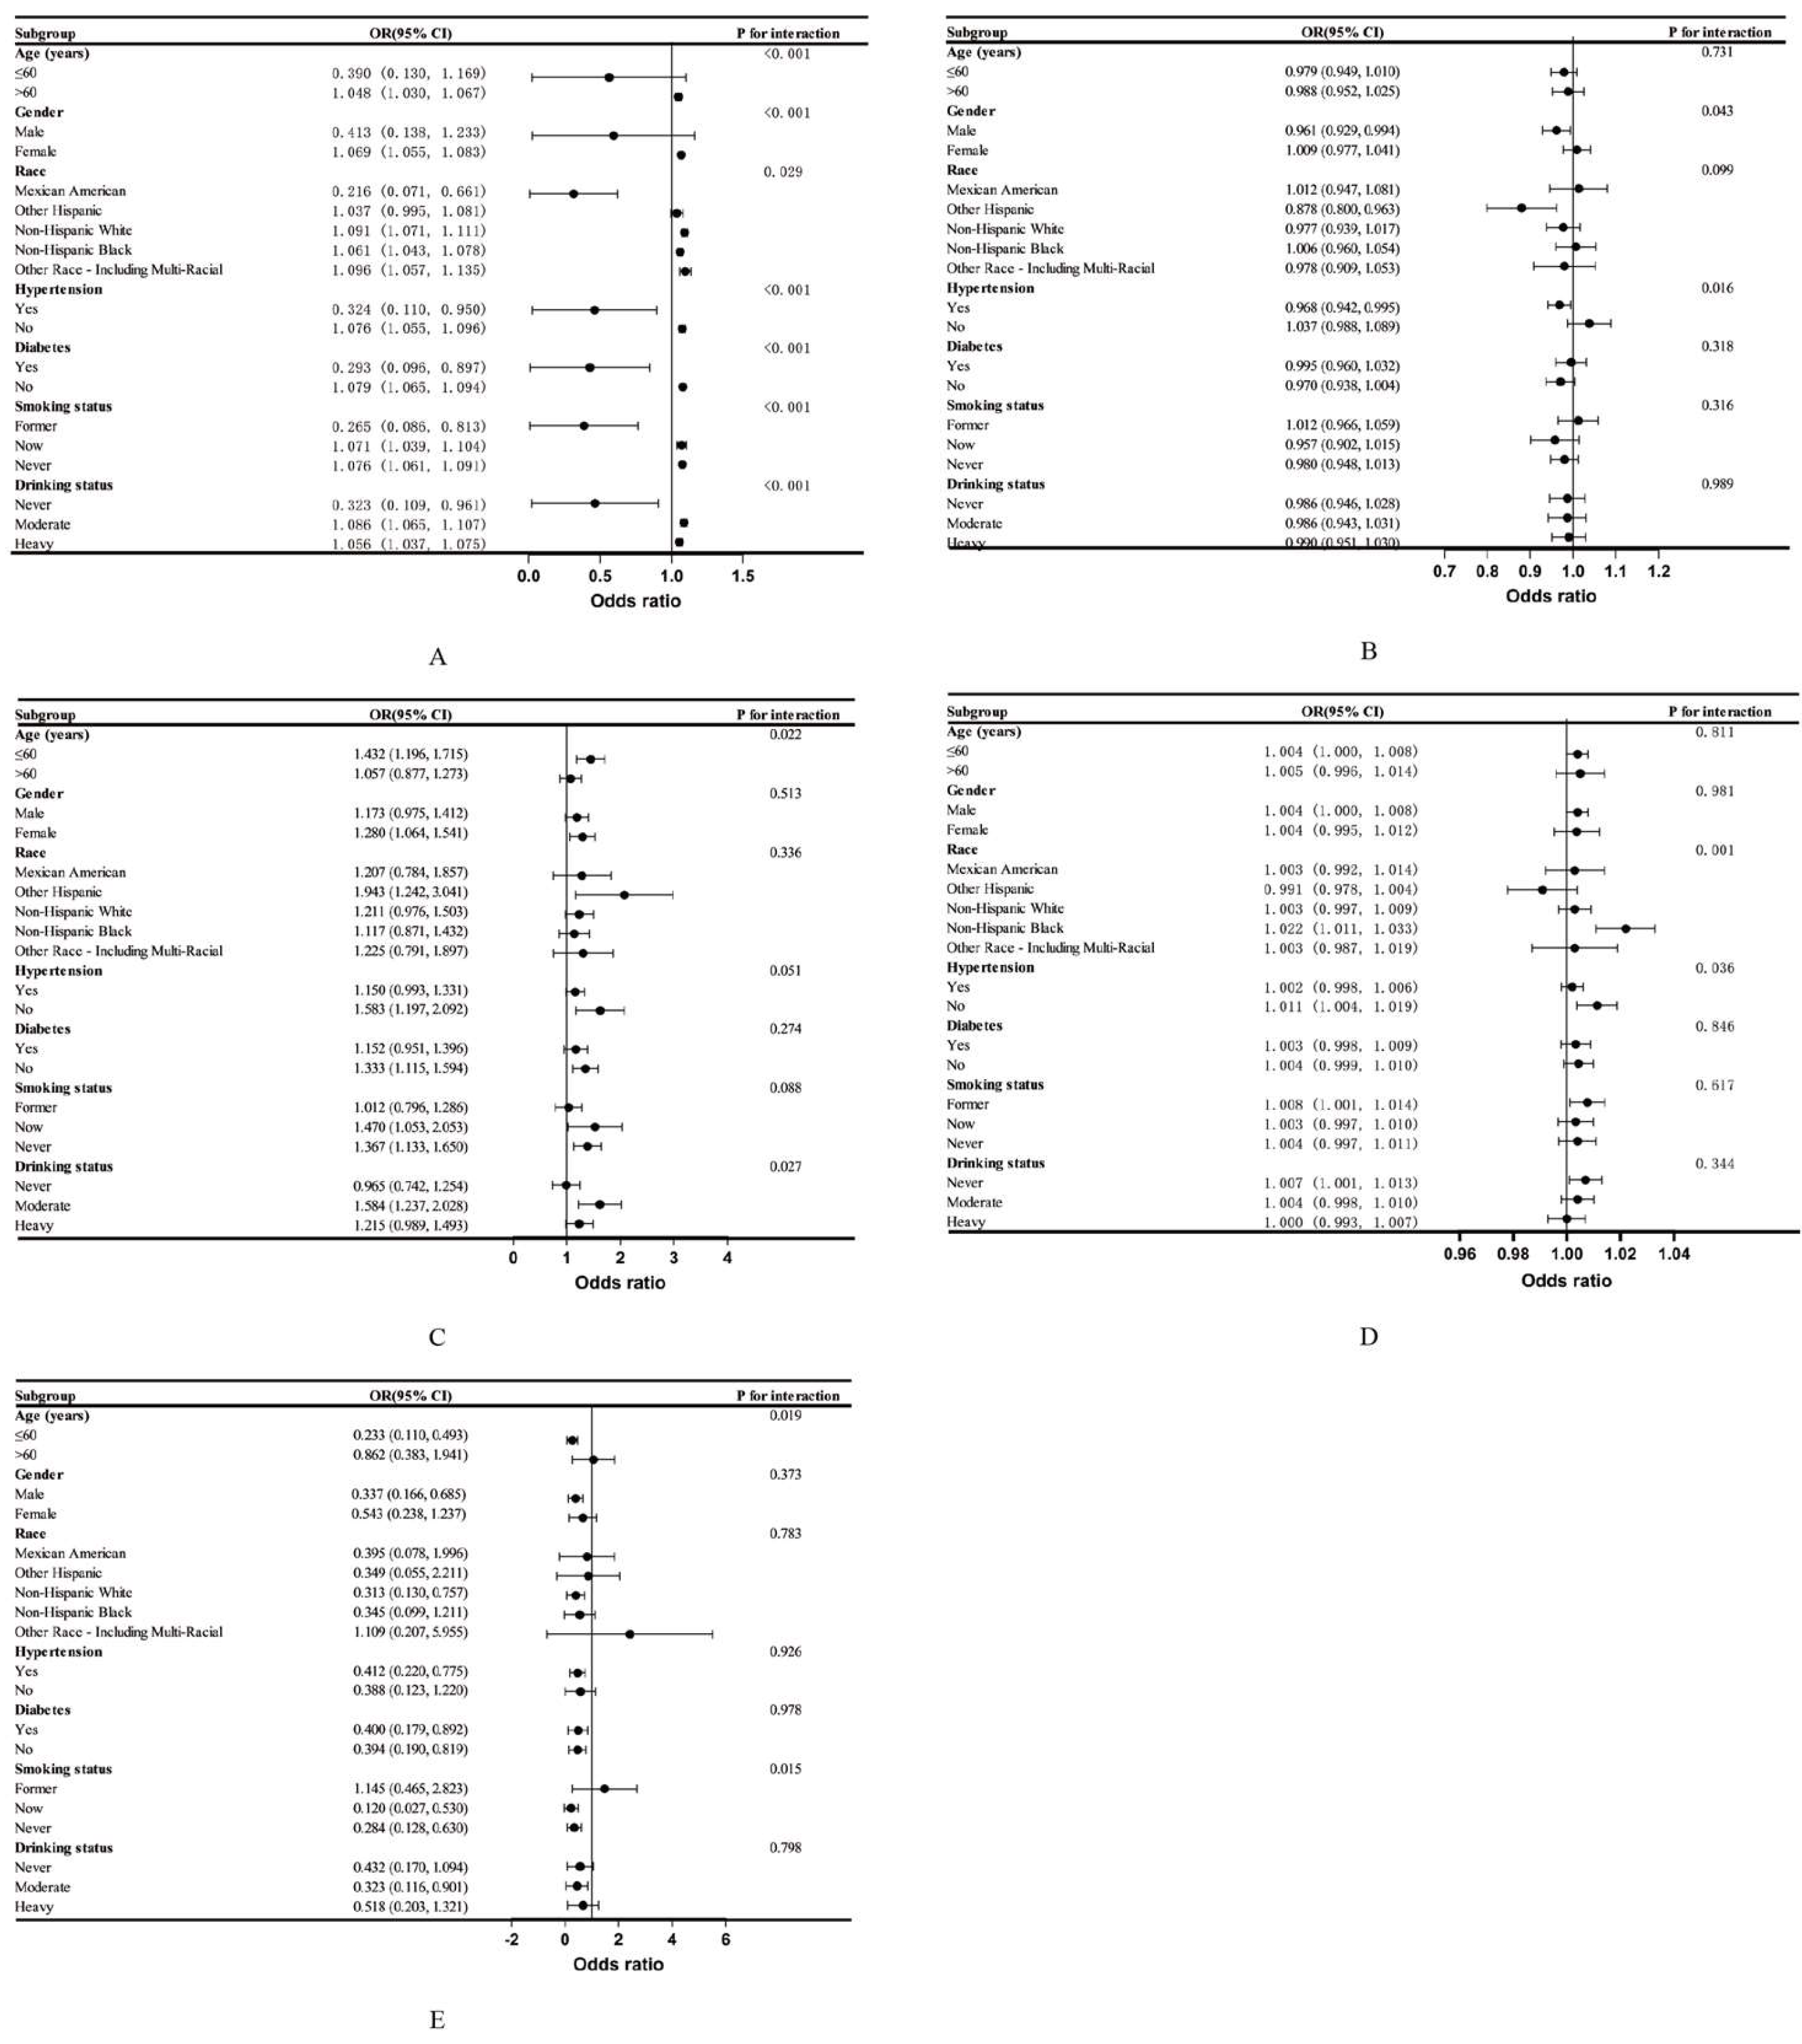
Figure 4.
The dose-response relationship between GNRI and NAFLD and AHF, and between TCBI/100 and NAFLD. Adjusted for age, sex, race, education, marital status, PIR, smoking, drinking, activity level, BMI, stroke, lung disease, heart disease, chronic kidney disease, hypertension, diabetes, and ALT, ALP, AST, and GGT. (A) GNRI and NAFLD. (B) GNRI and AHF. (C) TCBI/100 and NAFLD.
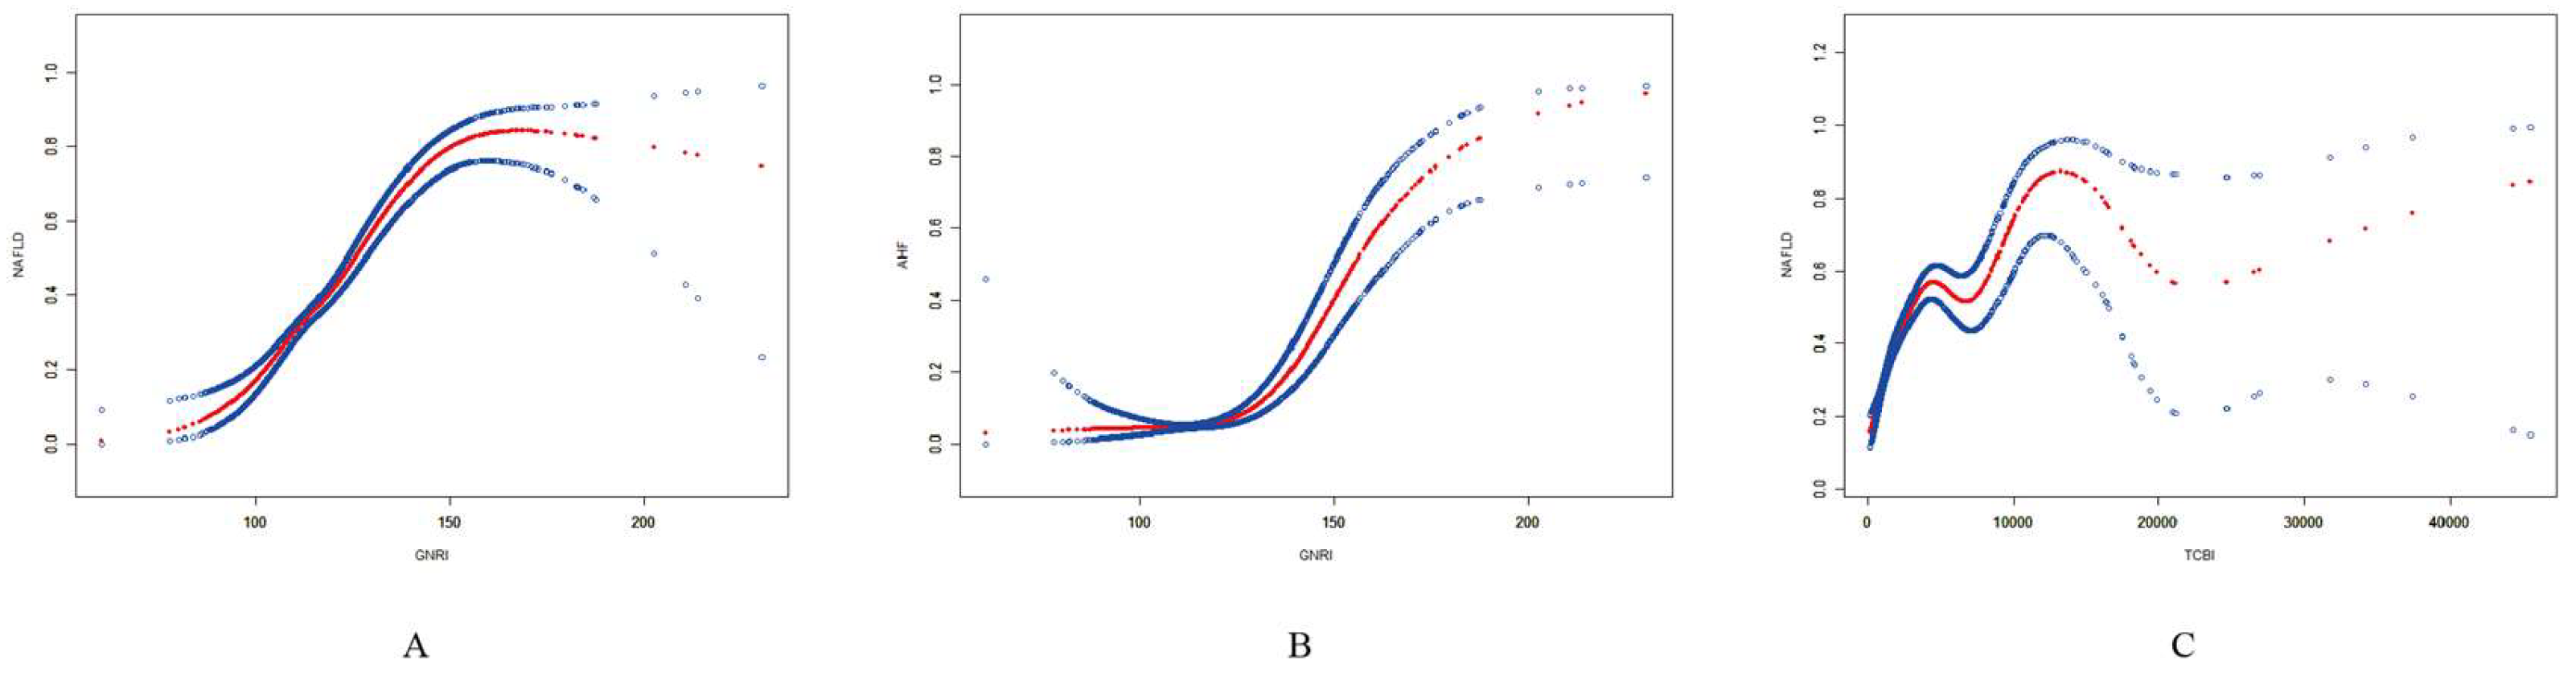
Table 1.
Details of the nutritional indices used in the study.
| Nutrition-related indicators | Calculation formula | Reference |
| GNRI | 1.489 × serum albumin (g/L) + 41.7 × (current weight/ideal weight) Men: Ideal body weight = Height (cm) − 100 − (Height (cm) − 150)/4 Women: Ideal body weight = Height (cm) − 100 − (Height (cm) − 150)/2.5 |
[12] |
| PNI | Albumin (g/L) + 5 × total lymphocyte count (109/L) | [13] |
| CONUT | Serum albumin score + total lymphocyte count score + total cholesterol score Albumin score: 0, 2, 4 and 6 points are assigned when the albumin level is ≥3.5, 3.0-3.49, 2.5-2.99 and <2.5 g/dL, respectively.Lymphocyte total score: 0, 1, 2 and 3 points are awarded for total lymphocyte counts of ≥1,600, 1,200-1,599, 800-1,199 and <800/mm3, respectively.Total cholesterol score: When the total cholesterol level is ≥180, 140-179, 100-139 and <100 mg/dL, the corresponding scores are 0, 1, 2 and 3 points, respectively. |
[14] |
| TCBI | Triglycerides (mg/dL) × Total cholesterol (mg/dL) × Weight (kg)/1,000 | [15] |
| AGR | Albumin (g/L)/Globulin (g/L) | [16] |
Table 3.
Association between nutrition-related indices and NAFLD.
| Characteristics | Model 1 | Model 2 | Model 3 |
| GNRI continuous | 1.086 (1.080, 1.093) *** | 1.099 (1.092, 1.106) *** | 1.054 (1.045, 1.063) *** |
| GNRI binary | |||
| < 98 | 1[Reference] | 1[Reference] | 1[Reference] |
| ≥ 98 | 12.814 (6.774, 24.242)*** | 12.370 (6.513, 23.492) *** | 2.487 (1.238, 4.996)* |
| PNI continuous | 1.018 (1.007, 1.029) *** | 1.022 (1.011, 1.034)* | 1.020 (1.007, 1.034)** |
| PNI quartiles | |||
| Quartile 1 | 1[Reference] | 1[Reference] | 1[Reference] |
| Quartile 2 | 1.090 (0.929, 1.280) | 1.116 (0.946, 1.317) | 1.156 (0.955, 1.400) |
| Quartile 3 | 1.048 (0.893, 1.229) | 1.104 (0.935, 1.305) | 1.179 (0.971, 1.431) |
| Quartile 4 | 1.271 (1.091, 1.481) ** | 1.343 (1.141, 1.581)*** | 1.351 (1.115, 1.638)** |
| P for trend | 0.004 | <0.001 | 0.003 |
| CONUT continuous | 0.891 (0.827, 0.960)** | 0.849 (0.785, 0.917) *** | 0.899 (0.821, 0.983) * |
| CONUT ternary | |||
| 0-1 | 1[Reference] | 1[Reference] | 1[Reference] |
| 2-4 | 0.789 (0.696, 0.894) *** | 0.733 (0.644, 0.835) *** | 0.873 (0.748, 1.019) |
| 5-12 | 0.651 (0.321, 1.321) | 0.540 (0.262, 1.113) | 0.476 (0.209, 1.083) |
| P for trend | <0.001 | <0.001 | 0.032 |
| TCBI/100 continuous | 1.049 (1.044, 1.053) *** | 1.046 (1.042, 1.051)*** | 1.021 (1.017, 1.025)* |
| TCBI/100 quartiles | |||
| Quartile 1 | 1[Reference] | 1[Reference] | 1[Reference] |
| Quartile 2 | 2.766 (2.266, 3.376) *** | 2.608 (2.131, 3.193)*** | 1.547 (1.236, 1.935) *** |
| Quartile 3 | 6.083 (5.017, 7.376) *** | 5.525 (4.542, 6.720) *** | 2.347 (1.882, 2.928) *** |
| Quartile 4 | 13.539 (11.135, 16.462) *** | 12.198 (9.990, 14.894)*** | 3.751 (2.982, 4.718) *** |
| P for trend | <0.001 | <0.001 | <0.001 |
| AGR continuous | 0.434 (0.345, 0.546) *** | 0.255 (0.197, 0.330)*** | 0.588 (0.431, 0.801)*** |
| AGR quartiles | |||
| Quartile 1 | 1[Reference] | 1[Reference] | 1[Reference] |
| Quartile 2 | 0.784 (0.673, 0.912) ** | 0.685 (0.584, 0.803) *** | 0.887 (0.738, 1.066) |
| Quartile 3 | 0.698 (0.598, 0.815) *** | 0.540 (0.457, 0.637) *** | 0.759 (0.624, 0.923)** |
| Quartile 4 | 0.583 (0.500, 0.681) *** | 0.418 (0.353, 0.496) *** | 0.763 (0.622, 0.936)* |
| P for trend | <0.001 | <0.001 | 0.004 |
OR: odds ratio; 95% CI: 95% confidence interval.GNRI: Geriatric Nutritional Risk Index; PNI: Prognostic Nutritional Index; CONUT: Control Nutritional Status Score; TCBI: Triglycerides × Total Cholesterol × Body Weight Index; AGR: Albumin-to-globulin ratio.Model 1: No covariates were adjusted. Model 2: Age, gender and race were adjusted. Model 3: Age, gender, race, education level, marital status, PIR, smoking, drinking, activity level, BMI, stroke, lung disease, heart disease, chronic kidney disease, hypertension, diabetes, as well as ALT, ALP, AST, and GGT were adjusted.*p < 0.05, **p < 0.01, ***p < 0.001; P < 0.05 is considered statistically significant.
Table 4.
Association between nutrition-related indices and AHF.
| Characteristics | Model 1 | Model 2 | Model 3 |
| GNRI continuous | 1.071 (1.063, 1.079) *** | 1.087 (1.078, 1.096) *** | 1.074 (1.062, 1.086) ** |
| GNRI binary | |||
| < 98 | 1[Reference] | 1[Reference] | 1[Reference] |
| ≥ 98 | 2.051 (0.958, 4.388) | 1.973 (0.917, 4.245) | 0.544 (0.184, 1.604) |
| PNI continuous | 0.961 (0.940, 0.983)*** | 0.975 (0.953, 0.998) * | 0.984 (0.961, 1.008) |
| PNI quartiles | |||
| Quartile 1 | 1[Reference] | 1[Reference] | 1[Reference] |
| Quartile 2 | 0.632 (0.468, 0.854) ** | 0.676 (0.498, 0.917) * | 0.784 (0.563, 1.093) |
| Quartile 3 | 0.600 (0.443, 0.812) *** | 0.689 (0.505, 0.940) * | 0.812 (0.577, 1.141) |
| Quartile 4 | 0.658 (0.495, 0.874)** | 0.793 (0.588, 1.069) | 0.875 (0.628, 1.219) |
| P for trend | 0.005 | 0.154 | 0.493 |
| CONUT continuous | 1.351 (1.206, 1.513) *** | 1.265 (1.125, 1.422) *** | 1.219 (1.068, 1.391) ** |
| CONUT ternary | |||
| 0-1 | 1[Reference] | 1[Reference] | 1[Reference] |
| 2-4 | 1.398 (1.111, 1.759) ** | 1.244 (0.983, 1.573) | 1.274 (0.980, 1.658) |
| 5-12 | 3.105 (1.283, 7.516)* | 2.430 (0.990, 5.965) | 2.097 (0.778, 5.655) |
| P for trend | <0.001 | 0.021 | 0.033 |
| TCBI/100 continuous | 1.012 (1.009, 1.016) *** | 1.012 (1.009, 1.015) *** | 1.004 (1.000, 1.008) * |
| TCBI/100 quartiles | |||
| Quartile 1 | 1[Reference] | 1[Reference] | 1[Reference] |
| Quartile 2 | 1.650 (1.063, 2.562) * | 1.883 (1.216, 2.915) ** | 0.995 (0.616, 1.606) |
| Quartile 3 | 2.979 (1.984, 4.473) *** | 3.508 (2.345, 5.247) *** | 1.193 (0.756, 1.882) |
| Quartile 4 | 4.993 (3.369, 7.399) *** | 5.603 (3.805, 8.251)*** | 1.453 (0.923, 2.287) |
| P for trend | <0.001 | <0.001 | 0.022 |
| AGR continuous | 0.189 (0.118, 0.304) *** | 0.133 (0.080, 0.220) *** | 0.411 (0.235, 0.716) ** |
| AGR quartiles | |||
| Quartile 1 | 1[Reference] | 1[Reference] | 1[Reference] |
| Quartile 2 | 0.480 (0.360, 0.640) *** | 0.438 (0.326, 0.588)*** | 0.617 (0.447, 0.852) ** |
| Quartile 3 | 0.464 (0.345, 0.623) *** | 0.389 (0.285, 0.530) *** | 0.645 (0.457, 0.909)* |
| Quartile 4 | 0.405 (0.301, 0.547) *** | 0.325 (0.236, 0.448) *** | 0.657 (0.459, 0.940)* |
| P for trend | <0.001 | <0.001 | 0.019 |
OR: odds ratio; 95% CI: 95% confidence interval.GNRI: Geriatric Nutritional Risk Index; PNI: Prognostic Nutritional Index; CONUT: Control Nutritional Status Score; TCBI: Triglycerides × Total Cholesterol × Body Weight Index; AGR: Albumin-to-globulin ratio.Model 1: No covariates were adjusted. Model 2: Age, gender and race were adjusted. Model 3: Age, gender, race, education level, marital status, PIR, smoking, drinking, activity level, BMI, stroke, lung disease, heart disease, chronic kidney disease, hypertension, diabetes, as well as ALT, ALP, AST, and GGT were adjusted.*p < 0.05, **p < 0.01, ***p < 0.001; P < 0.05 is considered statistically significant.
Table 5.
Analysis of threshold effects between GNRI and NAFLD and AHF, and between TCBI/100 and NAFLD.
Table 5.
Analysis of threshold effects between GNRI and NAFLD and AHF, and between TCBI/100 and NAFLD.
| Characteristics | OR (95% CI) |
| GNRI and NAFLD | |
| Fitting by standard linear model | 1.054 (1.045, 1.063) |
| Fitting by two-piecewise linear model | |
| Inflection point | 141.16 |
| < 141.16 | 1.066 (1.054, 1.077) |
| > 141.16 | 1.016 (0.996, 1.036) |
| Log likelihood ratio | <0.001 |
| GNRI and AHF | |
| Fitting by standard linear model | 1.074 (1.062, 1.086) |
| Fitting by two-piecewise linear model | |
| Inflection point | 120.17 |
| < 120.17 | 0.992 (0.953, 1.034) |
| > 120.17 | 1.083 (1.070, 1.096) |
| Log likelihood ratio | <0.001 |
| TCBI/100 and NAFLD | |
| Fitting by standard linear model | 1.021 (1.017, 1.025) |
| Fitting by two-piecewise linear model | |
| Inflection point | 31.20 |
| < 31.20 | 1.052 (1.042, 1.061) |
| > 31.20 | 1.005 (1.001, 1.010) |
| Log likelihood ratio | <0.001 |
Disclaimer/Publisher’s Note: The statements, opinions and data contained in all publications are solely those of the individual author(s) and contributor(s) and not of MDPI and/or the editor(s). MDPI and/or the editor(s) disclaim responsibility for any injury to people or property resulting from any ideas, methods, instructions or products referred to in the content. |
© 2024 by the authors. Licensee MDPI, Basel, Switzerland. This article is an open access article distributed under the terms and conditions of the Creative Commons Attribution (CC BY) license (http://creativecommons.org/licenses/by/4.0/).
Copyright: This open access article is published under a Creative Commons CC BY 4.0 license, which permit the free download, distribution, and reuse, provided that the author and preprint are cited in any reuse.


