
Submitted:
01 November 2024
Posted:
01 November 2024
You are already at the latest version
Abstract
When users interact with mobile platforms in an augmented reality environment, cognitive and emotional engagements change through different stimuli cues that respond to users’ behavioral intentions. The effects of those engagements through augmented reality, considering user-platform interactions, are unexplored. This study investigated a nuanced understanding of how stimuli cues in augmented reality affect sense of immersion and sense of presence, followed by an interaction-engagement-intention (I-E-I) model. A quantitative method was used to validate the proposed model. Based on an online survey with 886 responses, product fit, network quality, and artificial intelligence-driven recommendation influences were assessed for cognitive engagements. This study examined the importance of engaging satisfaction and trust as emotional engagements, influencing users’ continuance intention. The findings showed that sources of information, especially online reviews, positively affect the perception of subjective norms. Also, trust has a more significant influence on the continuance intention to use AR mobile platforms. Also, the results explored that the generation of users significantly impacts continuance intention. This could enhance the capabilities of information system designers, researchers, marketing professionals, and solution providers to attain sustainable user retention.
Keywords:
user-platform interaction
; continuance intention
; augmented reality
; mobile platform
; interaction-engagement-intention model
1. Introduction
Augmented reality (AR) revolutionizes the mobile platform industry through interactive engagements. AR enhances user experience (UX) through correlated actions among cognitive, physical, and virtual encounters to collaborate, cooperate, and communicate in the physical world (Ameen, 2021). This requirement has increased due to rapid changes in user expectations for heterogeneous human-computer interaction (HCI). The effect of those interactions involves users’ engagements with AR applications that demand to assess users’ decision-making through continuance intention (Wang et al., 2021). Previous literature has shown that exploring the effects of interactive engagements in perceiving UX for augmented reality in the user-platform interaction paradigm is unrealized (Chandler et al., 2022).
This study addressed a fundamental research interest to explain the consequences of user-platform interaction through product fit (Soliman et al., 2024), network quality (Huang et al., 2023) and artificial intelligence-driven recommendation (Goti et al., 2023). The study investigated how AR intrinsically motivated users' cognitive engagement to perceive user experience (Jessen et al., 2020) and explained a process of assessing users’ emotions through satisfaction and trust as subsequent effects of engagement. Finally, it explained how user engagement motivates user experience through cognitive and emotional values and understanding to facilitate the decision-making process on continuance intention (Acharya et al., 2023).
In socio-cultural aspects, this study described cultural background, age group, and acculturated culture as essential factors influencing users’ choices, values, and behavioral responses to interact with AR mobile platforms. This study considered individualism/collectivism and uncertainty avoidance as cultural dimensions to identify cultural groups within Australia for assessing continuance intention to use AR mobile platforms (Martínez et al., 2023). Furthermore, this study determined the generation of users through age groups to identify user classifications with distinct sociocultural norms and their effects on continuance intention (Cabanillas & Santos, 2017). Moreover, the acculturated culture was addressed to explain the behavioral change of users who migrated from native to host culture in a multicultural society. This thesis explored the nuances of understanding the effects of cultural background, age group, and acculturate culture on users’ continuance intention considering the multicultural society in Australia (Kim et al., 2022).
This study aims to deliver a research framework to explain how stimuli cues affect user experience through perceived sense of immersion and a sense of presence that influences continuance intention. An online survey (N=886) was conducted with an AR mobile platform (IKEA app) to validate the interaction-engagement-intention (I-E-I) model. Then, a smart-partial least square (PLS) - structural equation model (SEM) approach was applied to analyze the data guided by the following research questions: RQ1: What are the key factors determining users’ continuance intention in the user-platform interaction paradigm? RQ2: What influences cognitive and emotional engagement on continuance intention? RQ3: What are the intervening effects of user generation towards continuance intention?
This study reveals that user-platform interactions through AR influence users’ continuance intention, encourage the user retention process, and support the mobile platform industry in understanding how to assess user experience for user-platform interactions with an AR environment. It contributes to identifying the cognitive and emotional impact in perceiving user experience that influences continuance intention to use AR mobile platforms. Additionally, insights from the potential effects of cultural background, age group, and acculturated culture on user behavior suggest that online retailers can plan to expand their AR platforms globally and should consider nuances in cultural values and generation gaps in their strategies. Moreover, research outcomes and valuable insights could guide UX researchers, developers, business promoters, marketing professionals, and solution providers to understand how socio-cultural factors affect users on technology adoption to continue using technological platforms.
2. Literature Review
In the e-commerce revolution, user-platform interactions engage interaction-based stimuli cues. Emerging technologies like augmented reality have revolutionized the analytical process to provide more interactions in AR mobile platforms (Nazir et al., 2023), where users can create a virtual identity to communicate, interact, and perform activities with mobile platforms and create a user-platform interaction-enabled environment (Yuntao et al., 2022). Furthermore, previous studies examined user experience (UX) as a user’s perceptions gained through cognitive (Qin et al., 2021) and emotional engagements (Goel et al., 2023).
Previous studies explained that users interact with virtual products through spatial registration and gesture-based interaction by changing the orientation of physical spaces in an AR environment (Grubert, 2023). AR provides product fit through personalization, scale measurement, positioning, and virtual try-on features in the online platform industry. Conversely, network qualities were addressed as crucial to maintaining uninterrupted immersive services using mobile devices (Huang et al., 2021). Further, network quality is vital in maintaining the platform’s ability to provide uninterrupted services. Artificial intelligence (AI) provides more interactions between users in an AR environment that generates recommendations (Yin & Qiu, 2021) and persuades cognitive engagements (Soliman et al., 2024) to provide user comfort.
Studies have shown that augmented reality provides real-time interactions by placing computer-generated products in physical spaces (Dargan et al., 2023), while virtual products can be viewed on the mobile platform. AR allows users to engage with sensory information through a user-platform interaction paradigm, which seems to be how users are sensing close to the real world. Considering user-platform interactions in an AR mobile application, cognitive engagement may represent users’ perceptions of products or services (Yim et al., 2017). Previous studies have examined how users' expectations are fulfilled through AR interactions that create a sense of immersion through users’ psychological responses (Dargan et al., 2023). In another context, the situated cognition theory explains that sense of presence occurs when a user interacts with virtual products and perceives situated feeling as a unique psychological state of “being there” in the virtual world (Alimamy & Gnoth, 2022).
A user’s emotional engagement is highly impacted by stimuli cues, which subsequently influence behavioral intentions (Goel et al., 2023). Previous literature explains the effects of perceived emotions on user’s decision-making processes in AR environments. Furthermore, researchers have explained satisfaction (David et al., 2022; Park et al., 2020) and trust (Kumar et al., 2023) as emotional feelings. Satisfaction develops a pleasant mode and trust as a mental state where a user confirms willingness to perform actions after fulfilling expectations. Moreover, previous studies described trust and satisfaction as emotional factors influencing users’ behavioral responses through word-of-mouth (WOM) and repurchase intentions (Al-Adwan et al., 2022).
The term “continuance intention” was adapted from the expectation-confirmation theory (ECT) in the field of consumer behavior literature (Bhattacherjee, 2001). Recently, researchers have studied the effects of AR on continuance intention to use mobile platforms. Hung describes the continuance intention through cognitive states for AR mobile platforms (Huang et al., 2021). In an e-commerce mobile platform, the physical distance to touch a product creates user uncertainty. Thus, augmented reality features can alleviate the problems by perceiving immersive experiences to end-users. Sun examines the critical implications of AR characteristics on user experience to gain continuance intention (Sun et al., 2022).
3. Hypotheses Development and Research Model
Previous studies have followed the stimulus-organism-response (S-O-R) paradigm to investigate immersive experience, repurchase, and continuance intentions (Goel et al., 2023; Huang et al., 2021). This model was rooted in environmental psychology, which considered stimuli cues to explain cognitive reactions. Multiple stimuli cues in an environment influence the user’s cognitive state, which consequently affects the user’s behavioral responses (Mehrabian & Russell, 1974).
AR involves product movement through tracking and engages sense of immersion in an immersive environment (David et al., 2022). In the context of AR applications, Kowalczuk explained the effects of network qualities in engaging a sense of immersion and feeling absorbed in the AR environment (Kowalczuk et al., 2021), while AR involves users with a high level of influence when placing virtual products in physical spaces. Moreover, online mobile platforms use feeling Artificial Intelligence (AI) through adaptive and personalized recommendation systems to extend predictive data analytics (Yin & Qiu, 2021; Huang et al., 2021). Therefore, the following hypotheses are proposed:
H1.
Product fit positively influences the sense of immersion in user-platform interactions.
H2.
Network quality positively influences the sense of immersion in user-platform interactions.
H3.
AI-driven recommendation positively influences the sense of immersion in user-platform interactions.
In AR, Hilken defines situated experience as a sense of presence in an augmented reality environment (Hilken et al., 2017). Furthermore, AR features provide users comfort in viewing virtual products in their physical spaces, which alleviates product uncertainties and reduces the need for touch (Wang et al., 2021). On the other hand, AI transforms wireless networks through network optimization with network parameters, enhancing the UX by adopting seamless convergence of virtual and physical realms that engage the sense of presence (Schubert, 2009). Therefore, we propose the following hypothesis:
H4.
Product fit positively influences the sense of presence in user-platform interactions.
H5.
Network quality positively influences the sense of presence in user-platform interactions.
Previous studies established that a sense of immersion engages users to sense virtual products through psychological ownership that persuades satisfaction (Sun et al., 2022). Furthermore, prior studies explained that the AR environment enhances the sense of presence through the embodiment of a product and enhances the user’s impression through satisfaction (Chylinski et al., 2020; Heller et al., 2019). Therefore, we are proposing the following hypothesis:
H6.
Sense of immersion positively influences satisfaction in user-platform interactions.
H7.
Sense of presence positively influences satisfaction in user-platform interactions.
Immersion engages closely with subjective sensation with product virtualization, and trust acts as a mediating construct that includes the effects of perceived immersive experiences (Koh et al., 2023). AR can alleviate those issues by incorporating immersive features and building trust to interact with mobile platforms (Payal et al., 2024). Grow defined the virtual body as being associated with the physical space, which develops a sense of presence that creates user trust (Grubert, 2023). Furthermore, sense of presence creates a realization of “being there” in the physical space, enhancing trust in products (Wang et al., 2021). Therefore, we are proposing the following hypothesis:
H8.
Sense of immersion positively influences trust in user-platform interactions.
H9.
Sense of presence positively influences trust in user-platform interactions.
Bhattacharjee emphasized that satisfaction with IS use is a prime concern for users to maintain usage intention (Bhattacharjee, 2001). Previous studies suggested that trust influences users’ willingness to use mobile apps (Nguyen, 2021). Moreover, Balakrishnan describes the relationship between user trust and continuance intention to use technological systems (Kumar et al., 2023). Therefore, we propose the following hypotheses:
H10.
Satisfaction positively influences continuance intention in user-platform interactions.
H11.
Trust positively influences continuance intention in user-platform interactions.
In the context of age variations in a multicultural society, different age groups create a generation of users that significantly moderates behavioral intention to use mobile platforms. Previous studies categorize users from different age groups and generations to explain the relationship between behavioral responses and continuance intention to use e-commerce platforms (Cabanillas & Santos, 2017). This generation prefers to communicate with images for innovative content, whereas the older generation communicates with text (Prakashyadav & Rai, 2017). So, the different age groups with classifications of generations affect behavioral responses to adopt immersive technologies. Therefore, we propose the following hypothesis considering the effect of generation on continuance intention.
H12.
The age group significantly impacts users’ continuance intention in the user-platform interaction.
A conceptual interaction-engagement-intention model (as shown in Figure 1) was developed to determine how interactions-based stimuli cues (product fit, network quality, and AI-driven recommendation) affect user experience (sense of immersion and sense of presence) in the user-platform interaction paradigm. Subsequently, the study investigates the effect of cognitive states on users’ satisfaction and trust as emotional states as emotional feelings on their influences on continuance intention.
4. Methodology
A survey guideline was designed to collect the quantitative data from the survey (Annex A). An online survey was conducted in Australia following a convenience snowball sampling technique. In the study, IKEA was chosen as an AR platform because of its versatility and AR capabilities. We have considered constructs and measurement items from the validated instruments. Considering previous studies, this study constructed measurement items (Annex B) and followed the measures of product fit from Sun (2022), network quality from Nadir (2021), and AI-driven recommendations from Yin and Qiu (2021). We followed this with a sense of immersion from Dargan (2023) and a sense of presence from Alimamy and Gnoth (2022). This study also followed the measures of satisfaction from Park (2020) and David (2021), as well as trust from Kumar (2023). The study relates to continuance intention as a behavioral response and measures continuance intention from Yin and Qiu (2021) and Park (2020). We have maintained all the UTS guidelines, and an ethical application has been approved as per UTS HREC REF NO. ETH22-7706 on 9 August 2023. The data were critically checked and computed using SPSS and cleaned through the proper validation. Finally, the sample size of 886 (N=886) was confirmed, with a response rate of 84%.
The proposed research model was validated using partial least squares structural equation modeling (PLS-SEM), which emphasized extending the explained variance of the constructs (Kowalczuk et al., 2021). SmartPLS 4.0 was used to examine the measurement and develop a structure model to contrast the results. The measurement model acted as an outer model assessment with confirmatory factor analysis (CFA) to determine the reliability of survey instruments and the validity of constructs (Kowalczuk et al., 2021). Then, the structural model was used as an inner model assessment to test the hypotheses (Nazir et al., 2023).
5. Results
Socio-demographic characteristics were analyzed, and user profiles were prepared from responses. It showed that 60.2% were male, 38.9% were female, and 0.9% did not prefer to say. Regarding the age group, 22.8% of respondents were Generation Z (18-26 years), 53.2% were Millennials (27-42 years), 18.8% were Generation X (43-58 years), and 5.2% were Boomers II (59 years and above). As reported, most respondents (51.2%) have achieved a bachelor’s degree, 14.6% have a professional degree, and 7.9% have a vocational degree in Australia.
This study used confirmatory factor analysis to check the reliability and validity of the measurement items and constructs in the measurement model (Covez et al., 2023). The measurement model is analyzed through factor loadings, Cronbach's alpha, composite reliability, and average variance extracted (AVE) to assess the reliability of the survey instrument. Table 1. describes the psychometric properties of all the constructs deployed in the study. As retrieved from the data, all the outer loadings are above 0.70, and the average variance extracted (AVE) values are above 0.50. Cronbach’s alpha value of all constructs is assessed from 0.750 to 0.924, which is higher than the recommended value of 0.7 (Payal et al., 2024). CR values of all constructs were assessed as higher than the recommended value of 0.70. (i.e., from 0.752 to 0.927). Further, the AVE values were found to be higher than MSV (Maximum Shared Variance) and ASV (Average Shared Variance), which shows the strength of AVE and confirms the threshold for discriminant validity (Goel et al., 2023).
In the structural model assessment, we initially assessed the value of R2 for all dependent variables and then observed the collinearity statistics value for all the relationships. The result showed that the value of R2 for all the variables is within the range of 0.11 - 0.25 (except sense of presence), which is recommended as a higher value. R2 values for sense of immersion (0.208), sense of presence (0.194), satisfaction (0.334), trust (0.272), and continuance intention (0.389) showed reasonable variance explained. Also, the collinearity statistics (VIF) value for all the relationships is less than 4.0 (as shown in Table 2).
The significance of the hypotheses was tested through path co-efficient (β), t-value, and p-value in the structural model assessment. All the hypotheses were supported with the p ˂ 0.001 level. The results for the AR environment show that all hypotheses are supported and sources of information positively influence users’ behavioral responses. The structural model results (hypothesis testing) are provided in Table 3.
The relationship of sense of presence toward satisfaction (9.740) is higher than trust (8.964). Similarly, the relationship of sense of immersion toward satisfaction (6.325) is higher than its relationship with trust (6.089). Also, the relationship of trust with continuance intention (2.986) is higher than that of satisfaction with continuance intention (2.619).
We have tested the effects of control variables (age group and gender) on continuance intention. Among the control variables, gender does not have an impact. However, the age group significantly affects continuance intention. Especially, Generation Z (β = 0.595, t= 2.863) and Millennials (β = 0.521, t= 2.504) have more significant effects rather than Generation X (β = 0.505, t= 2.285) on continuance intention (as shown in Table 4).
6. Discussion
This study contributes to the theoretical understanding of perceived user experience by considering user-platform interactions in augmented reality (AR) mobile platforms, identifying and validating cognitive and emotional engagements, and investigating their impacts on users' continuance intention. Although some of those variables have been determined in other contexts, we extended to empirical evidence of their applicability with user-platform interactions in the AR mobile platform context.
In this study, continuing the previous studies, our findings support the impact of perceived cognitive (Nazir et al., 2023; Kumar et al., 2023) and emotional factors (Payal et al., 2024) on continuance intention Online shopping benefits through AR are exposed in this study as an integral part of information system research. In the context of processing sensory information through multi-modal AI interactions with AR, this study confirms that the correlations among sense of immersion, sense of presence, satisfaction, and trust as consistent with the previous research findings (Wang et al., 2021; Payal et al., 2024). Satisfaction and trust were found to mediate the relationships among sense of immersion, sense of presence, and continuance intention.
This study contributes to the theoretical understanding of perceived user experience considering augmented reality by identifying and validating the cognitive and emotional factors and investigating their impacts on users' continuance intention. The findings confirm the significance of the relationships between cognitive and emotional engagements, extending the value of co-creation in perceiving user experience. Practically, this study guides developers and designers in optimizing AR to enhance user experiences. Marketers can leverage the study's findings to develop targeted marketing strategies that appeal to different demographic segments, particularly Generation Z and Millennials. Emphasizing trust-building initiatives and leveraging satisfaction can shape users' perceptions and foster continued usage.
The focus on a specific AR platform, the IKEA app, may limit the generalizability of findings. Future research could address these limitations by employing more extensive and diverse samples, using objective measures, exploring different AR platforms with different contexts, and considering cross-cultural influences.
7. Conclusions
The user experience is crucial for IS researchers in retaining users and moving toward the sustainable growth of AR mobile platforms in the e-commerce industry. User-platform interactions give users more value in AR and support them in changing their cognitive and emotional engagements. Consequently, these perceived values make users more satisfied and trusted in influencing continuance intention. This study empirically investigated the effects of different interactions-based stimuli cues on user experience that influence continuance intention. Also, we have identified the mediation effects of trust and satisfaction on the relationship between the perceived sense of immersion, sense of presence, and continuance intention. As a sustainable growth in the retail industry, interactions in augmented reality engage in immersive and interactive experiences, and this study confirms the significance of examining the consequences of user-platform interactions in AR and its effects on continuance intention.
Author Contributions
Conceptualization, Kabir. Zian Shah; methodology, Kabir. Zian Shah.; software, Kabir. Zian Shah; validation, Kabir. Zian Shah; formal analysis, Kabir. Zian Shah; investigation, Kabir. Zian Shah.; resources, Kabir. Zian Shah; data curation, Kabir. Zian Shah; writing—original draft preparation, Kabir. Zian Shah; writing—review and editing, Kabir. Zian Shah. and Kang, Kyeong; visualization, Kabir. Zian Shah; supervision, Kang, Kyeong. All authors have read and agreed to the published version of the manuscript.
Funding
There was no research funding.
Data Availability Statement
The data that supports the findings of this study is available from the corresponding author upon reasonable request.
Acknowledgments
The authors thank the anonymous reviewers for their valuable suggestions.
Conflicts of Interest
On behalf of all authors, the corresponding author states that there are no conflicts in publishing the research works.
Appendix A: Questionnaire Survey Guideline
Survey Guideline for Participant
Survey Objective: To validate and test the reliability of the research model in perceiving user experience on continuance intention to use augmented reality (AR) mobile platforms.
Research Instruments: The study will survey online users to assess their user experience (UX). We have developed eight demographic and 27 UX questionnaires, which might take 20-30 minutes.
Recruitment procedure: We follow a convenience snowball sampling technique to select participants for the survey.
Research platform: Participants are requested to interact with an AR mobile platform before participating in the questionnaire survey. We prefer that participants interact with the IKEA mobile app or responsive website with an augmented reality (AR) view.
Downloading/using the platform: The IKEA app is registered with the Apple App Store and Google Play Store. The participants are requested to download the app. Alternatively, participants can enter the IKEA responsive website using their smartphones using the link https://www.ikea.com/au.
All the products are still not available for 3D and augmented view. So, you can choose a malm drawer using the link below on your smartphone: https://www.ikea.com/au/en/p/malm-chest-of-4-drawers-white-20354646/. Alternatively, scan the QR code.

Click the View in 3D button and press the AR  button
on the page to locate the virtual product in your physical space.
button
on the page to locate the virtual product in your physical space.
button
on the page to locate the virtual product in your physical space.Participate in the survey: After interacting with the IKEA mobile platform, you are requested to attend an online survey following any of the below options:
Option 1: Use a survey link to get access from a computer or phone.
Option 2: Scan the QR code to participate in the survey.

Non-disclosure and privacy: We assure you that a secured analytical tool will collectively analyze your thoughts and opinions.
Your valuable experience will give us immense support in extending our research. Thank you again for your cooperation. If you have further queries about the research survey, please contact Zian Shah Kabir (PhD Student) at zian.kabir@student.uts.edu.au.
Appendix B. Measurement items and scales
| Construct | Items | Factors | Measurement Scales |
|
Sources of information such as Stimuli cues for AR mobile platforms Cognitive engagement as an organism Emotional Engagement as an organism Behavioral Response |
PF NQ AIR SI SP SF TR CI |
Product Fit Hong & Pavlou (2014), and Sun (2022) Network Quality Kowalczuk (2021) AI-driven recommendation Yin & Qiu (2021). Sense of Immersion Dassi (2021) Sense of Presence Hanh (2022), Hilken (2017) Satisfaction Park (2015) and David (2022) Trust Li et al. (2022), and Alimamy & Gnoth (2022) Continuance Intention Nikhashemi (2021), Qin (2021), and Hsu (2021) |
PF1: I could no longer doubt that the product would fit my desired spaces. PF2: I could measure the product size to check for my desired space. NQ1: The AR mobile platform performs its functions quickly and efficiently. NQ2: The AR mobile platform is reliable (it is always active and running, performs without errors, and does what it is supposed to do). AIR1: When interacting with the platform, AI marketing technology recommends what I want based on browsing habits. AIR2: With the support of AI marketing technology, the AR mobile platform can arouse my shopping desire. SI1: During the interactions, my body was in a physical place, but my mind was in the virtual world. SI2: The AR mobile platform made me forget my immediate surroundings. SP1: I felt like the product meshed with the AR mobile platform. SP2: It seemed to me that I could do whatever I wanted with the products in the AR mobile platform. SF1: Overall, I am satisfied with the AR mobile platform. SF2: The AR mobile platform meets my expectations. TR1: I feel safer using the AR mobile platform. TR2: I am pretty sure what to expect from the platform. CI1: I intend to stay on as a member of using this AR mobile platform. CI2: I will frequently use the AR mobile platform in future. CI3: I would prioritize the AR mobile platform over other alternative means. |
References
- Acharya, N.; Sassenberg, A.M.; Soar, J. The Role of Cognitive Absorption in Recommender System Reuse. Sustainability (Basel, Switzerland) 2023, 15(5), 3896. [Google Scholar] [CrossRef]
- Al-Adwan Al-Debei, M.M.; Dwivedi, Y.K. E-commerce in high uncertainty avoidance cultures: The driving forces of repurchase and word-of-mouth intentions. Technology in Society 2022, 71, 102083. [Google Scholar] [CrossRef]
- Al Amin, M. The Influence of Psychological, Situational and Interactive Technological Feedback-Related Variables on Customers’ Technology Adoption to Use Online Shopping Applications. Journal of Global Marketing 2022, 35(5), 384–407. [Google Scholar] [CrossRef]
- Alimamy, S.; Gnoth, J. I want it my way! The effect of perceptions of personalization through augmented reality and online shopping on customer intentions to co-create value. Computers in Human Behavior 2022, 128, 107105. [Google Scholar] [CrossRef]
- Bhattacherjee, A. Understanding information systems continuance: An expectation-confirmation model. Management Information Systems Quarterly 2001, 25, 351–370. [Google Scholar] [CrossRef]
- Chandler, T.; AE Richards, Jenny, B. Immersive landscapes: modeling ecosystem reference conditions in virtual reality. Landsc Ecol 2022, 37, 1293–1309. [Google Scholar] [CrossRef]
- Sun, C.; Y. F.; Kong, M.; Chen, X.; Liu, Y. Influence of augmented reality product display on consumers’ product attitudes: A product uncertainty reduction perspective. Journal of Retailing and Consumer Services 2022, 64, 102828. [Google Scholar] [CrossRef]
- Chylinski, H.; J; Hilken, T.; Keeling, D.I.; Mahr, D.; de Ruyter, K. Augmented reality marketing: A technology-enabled approach to situated customer experience. Australasian Marketing Journal 2020, 28, 374–384. [Google Scholar] [CrossRef]
- Coves-Martínez Sabiote-Ortiz, C.M.; Frías-Jamilena, D.M. How to improve travel-app use continuance: The moderating role of culture. Tourism Management Perspectives 2023, 45, 101070. [Google Scholar] [CrossRef]
- Dargan, S.; Bansal, S.; Kumar, M.; Mittal, A.; Kumar, K. Augmented Reality: A Comprehensive Review. Archives of Computational Methods in Engineering 2023, 30(2), 1057–1080. [Google Scholar] [CrossRef]
- David, A.; Senn, W.D.; Peak, D.A.; Prybutok, V.R.; Blankson, C. The value of visual and service quality to augmented reality-enabled mobile shopping experience. Quality Management Journal 2021, 28, 116–127. [Google Scholar] [CrossRef]
- Goel, P.; Garg, A.; Sharma, A.; Rana, N.P. Impact of Sensory Perceptions on the Urge to Buy Impulsively. The Journal of Computer Information Systems, ahead-of-print (ahead-of-print) 2023, 1–17.
- Goti, A.; Querejeta-Lomas, L.; Almeida, A.; de la Puerta, J.G.; López-de-Ipiña, D. Artificial Intelligence in Business-to-Customer Fashion Retail: A Literature Review. Mathematics (Basel) 2023, 11(13), 2943. [Google Scholar] [CrossRef]
- Grubert, J.; Merkle, D. I mixed Reality Interaction Techniques. In Springer Handbook of Augmented Reality; Springer International Publishin, 2023; pp. 109–129. [Google Scholar]
- Hilken d, R.; K; Chylinski, M.; Mahr, D.; Keeling, D.I. Augmenting the eye of the beholder: exploring the strategic potential of augmented reality to enhance online service experiences. Journal of the Academy of Marketing Science 2017, 45, 884–905. [Google Scholar] [CrossRef]
- Hong Qin DA, P.; Prybutok, V. A virtual market in your pocket: How does mobile augmented reality (MAR) influence consumer decision-making? Journal of Retailing and Consumer Services 2021, 58, 102337. [Google Scholar]
- Huang, M.H.; RT Rust. A strategic framework for artificial intelligence in marketing. Journal of the Academy of Marketing Science 2021, 49(1), 30–50. [Google Scholar] [CrossRef]
- Jessen Hilken, T.; Chylinski, M.; Mahr, D.; Heller, J.; Keeling, D.I.; de Ruyter, K. The playground effect: How augmented reality drives creative customer engagement. Journal of Business Research 2020, 116, 85–98. [Google Scholar] [CrossRef]
- Kim, M.J.; Gorman, B.K. Acculturation and Self-rated Health Among Asian Immigrants: The Role of Gender and Age. Population Research and Policy Review 2022, 41(1), 89–114. [Google Scholar] [CrossRef]
- Kowalczuk Siepmann (née, S.c.h.e.i.b.e.n.), C; Adler, J. Cognitive, affective, and behavioral consumer responses to augmented reality in e-commerce: A comparative study. Journal of Business Research 2021, 124, 357–373. [Google Scholar] [CrossRef]
- Kumar, P.; Chauhan, S.; Gupta, P.; Jaiswal, M.P. A meta-analysis of trust in mobile banking: the moderating role of cultural dimensions. International Journal of Bank Marketing 2023, 41(6), 1207–1238. [Google Scholar] [CrossRef]
- Liébana-Cabanillas, F.; Alonso-Dos-Santos, M. Factors that determine the adoption of Facebook commerce: The moderating effect of age. Journal of Engineering and Technology Management 2017, 44, 1–18. [Google Scholar] [CrossRef]
- Mehrabian, R.; JA. An approach to environmental psychology; MIT Press, 1974. [Google Scholar]
- Nazir, S.; Khadim, S.; Ali Asadullah, M.; Syed, N. Exploring the influence of artificial intelligence technology on consumer repurchase intention: The mediation and moderation approach. Technology in Society 2023, 72, 102190. [Google Scholar] [CrossRef]
- Nguyen, H.; M-T. The role of user adaptation and trust in understanding continuance intention towards mobile shopping: An extended expectation-confirmation model. Cogent Business & Management 2021, 8, 1–19. [Google Scholar]
- Park, Y.J. Effects of perceived interactivity of augmented reality on consumer responses: A mental imagery perspective. Journal of Retailing and Consumer Services 2020, 52. [Google Scholar] [CrossRef]
- Payal, R.; Sharma, N.; Dwivedi, Y.K. Unlocking the impact of brand engagement in the metaverse on Real-World purchase intentions: Analyzing Pre-Adoption behavior in a futuristic technology platform. Electronic Commerce Research and Applications 2024, 65, 101381. [Google Scholar] [CrossRef]
- Prakashyadav, S.; Rai, S. Generation Z's Preference for Innovative Content: An Analysis. International Journal of Digital Marketing 2017, 8(1), 23–36. [Google Scholar]
- Schubert, *!!! REPLACE !!!*. A New Conception of Spatial Presence: Once Again, with Feeling. Communication Theory. 19 2009, 2, 161–187. [Google Scholar] [CrossRef]
- Soliman, M.M.; Ahmed, E.; Darwish, A.; Hassanien, A.E. Artificial intelligence powered Metaverse: analysis, challenges and future perspectives. The Artificial Intelligence Review 2024, 57(2), 36. [Google Scholar] [CrossRef]
- Sun, C.; Fang, Y.; Kong, M.; Chen, X.; Liu, Y. Influence of augmented reality product display on consumers’ product attitudes: A product uncertainty reduction perspective. Journal of Retailing and Consumer Services 2022, 64, 102828. [Google Scholar] [CrossRef]
- Wang, X.W.; Riaz, M.; Alam, K.M.; Sherani Yang, M.; Haider, S. Information Sharing on Social Media by Multicultural Individuals: Experiential, Motivational, and Network Factors. Journal of Global Information Management 2021, 29(6), 1–25. [Google Scholar] [CrossRef]
- Yim, M.Y.-C.; Chu, S.-C.; Sauer, P.L. Is Augmented Reality Technology an Effective Tool for E-commerce? An Interactivity and Vividness Perspective. Journal of Interactive Marketing 2017, 39, 89–103. [Google Scholar] [CrossRef]
- Yin, J.; Qiu, X. Ai technology and online purchase intention: Structural equation model based on perceived value. Sustainability (Basel, Switzerland) 2021, 13(10), 5671. [Google Scholar] [CrossRef]
- Wang, Y.; Z. S.; Zhang, N.; Xing, R.; Liu, D.; Luan, T.H.; Shen, X. A Survey on Metaverse: Fundamentals, Security, and Privacy. IEEE Communications Surveys & Tutorials 2022. [Google Scholar]
Figure 1.
Interaction-Engagement-Intention model.
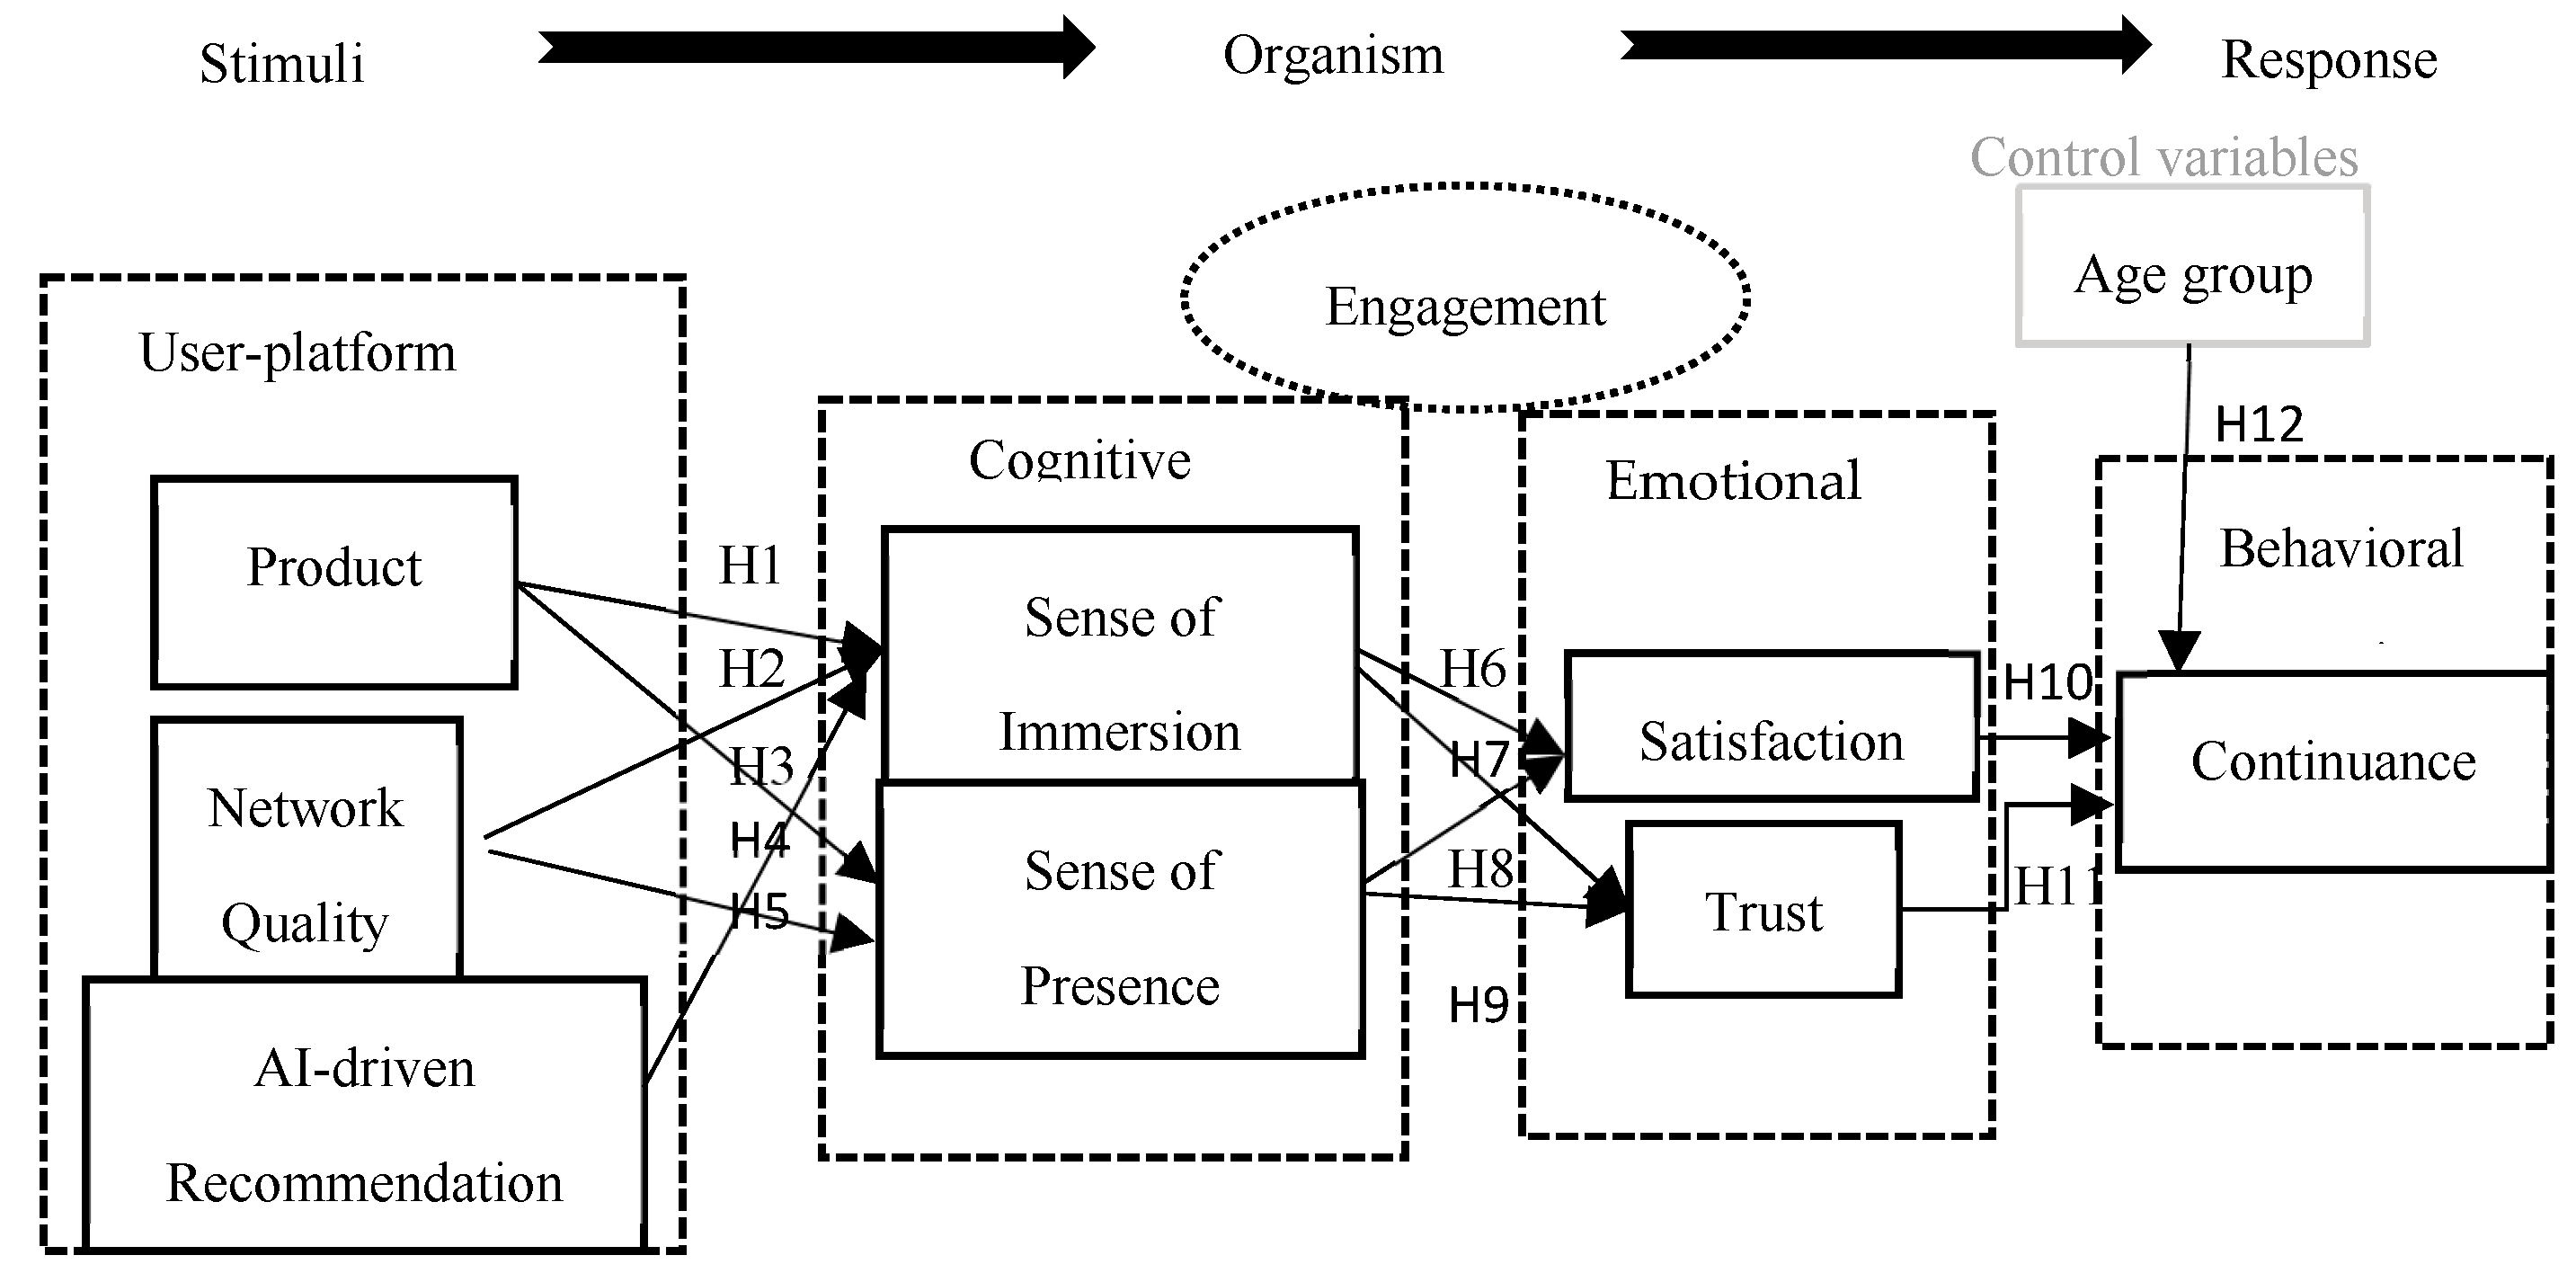

Table 1.
Measurement Model Assessment.
| Constructs | Items | Factor loading | Cronbach’s alpha | Composite reliability (rho_a) | Average variance extracted (AVE) |
|---|---|---|---|---|---|
| Product fit | PF1 | 0.958 | 0.911 | 0.855 | 0.919 |
| PF2 | 0.959 | ||||
| Network quality | NQ1 | 0.946 | 0.879 | 0.879 | 0.892 |
| NQ2 | 0.943 | ||||
| AI-driven recommendation | AIR1 | 0.924 | 0.924 | 0.927 | 0.929 |
| AIR2 | 0.966 | ||||
| Sense of immersion | SI1 | 0.952 | 0.902 | 0.903 | 0.911 |
| SI2 | 0.956 | ||||
| Sense of presence | SP1 | 0.943 | 0.880 | 0.880 | 0.834 |
| SP2 | 0.946 | ||||
| Satisfaction | SF1 | 0.958 | 0.912 | 0.912 | 0.919 |
| SF2 | 0.960 | ||||
| Trust | TR1 | 0.943 | 0.881 | 0.882 | 0.894 |
| TR2 | 0.948 | ||||
| Continuance intention | CI1 | 0.819 | 0.750 | 0.752 | 0.724 |
| CI2 | 0.833 | ||||
| CI3 | 0.798 |
Table 2.
R-square statistics and Collinearity statistics (VIF) .
| R2 Statistics | Collinearity statistics (VIF) | |||
|---|---|---|---|---|
| Construct | R-square | R-square adjusted | Relationship | VIF |
| SI | 0.208 | 0.204 | PF -> SP | 1.000 |
| SP | 0.194 | 0.191 | IE -> SN | 1.235 |
| SF | 0.334 | 0.331 | OR -> SN | 1.235 |
| TR | 0.272 | 0.271 | SP -> SF | 1.250 |
| CI | 0.389 | 0.387 | SP -> TR | 1.480 |
| SN -> SF | 1.348 | |||
| SN -> TR | 1.354 | |||
| SF -> CI | 1.178 | |||
| TR -> CI | 1.278 | |||
Table 3.
Hypotheses testing.
| Hypothesized Relationship |
Mean (M) | Std. deviation | T statistics | P values | Hypothesis Result |
|---|---|---|---|---|---|
| H1: PF ->SI | 0.150 | 0.035 | 1.439 | 0.001*** | Yes |
| H2: NQ -> SI | 0.156 | 0.058 | 2.688 | 0.007** | Yes |
| H3: AIR -> SI | 0.136 | 0.036 | 3.792 | 0.001*** | Yes |
| H4: PF -> SP | 0.197 | 0.035 | 2.787 | 0.003** | Yes |
| H5: NQ -> SP | 0.104 | 0.052 | 2.104 | 0.044* | Yes |
| H6: SI -> SF | 0.227 | 0.036 | 6.325 | 0.000*** | Yes |
| H7: SP -> SF | 0.343 | 0.035 | 9.740 | 0.000*** | Yes |
| H8: SI -> TR | 0.226 | 0.037 | 6.089 | 0.000*** | Yes |
| H9: SP -> TR | 0.321 | 0.036 | 8.964 | 0.000*** | Yes |
| H10: SF -> CI | 0.112 | 0.042 | 2.619 | 0.009** | Yes |
| H11: TR -> CI | 0.125 | 0.042 | 2.986 | 0.003** | Yes |
Table 4.
Control variables test analysis result.
| Effect of Control Variables | Original sample (O) | Sample mean (M) | Standard deviation (STDEV) | T statistics (|O/STDEV|) | P values | Significance |
|---|---|---|---|---|---|---|
| Generation Z -> CI | 0.595 | 0.601 | 0.208 | 2.863 | 0.002*** | Significant |
| Millennial -> CI | 0.521 | 0.525 | 0.208 | 2.504 | 0.006*** | Significant |
| Generation X -> CI | 0.505 | 0.512 | 0.221 | 2.285 | 0.011** | Significant |
Disclaimer/Publisher’s Note: The statements, opinions and data contained in all publications are solely those of the individual author(s) and contributor(s) and not of MDPI and/or the editor(s). MDPI and/or the editor(s) disclaim responsibility for any injury to people or property resulting from any ideas, methods, instructions or products referred to in the content. |
© 2024 by the authors. Licensee MDPI, Basel, Switzerland. This article is an open access article distributed under the terms and conditions of the Creative Commons Attribution (CC BY) license (http://creativecommons.org/licenses/by/4.0/).
Copyright: This open access article is published under a Creative Commons CC BY 4.0 license, which permit the free download, distribution, and reuse, provided that the author and preprint are cited in any reuse.


