1. Introduction
(Mobile) Augmented Reality (MAR) enhances the real world with real-time interactive digital information [
1]. Due to technological development, users can view and interact with virtual objects superimposed on their real environment using mobile devices such as smartphones and tablets in everyday life. Unlike Virtual Reality (VR), which immerses users in a fully digital world, AR augments the real world with contextual information and interactive elements [
2]. This unique capability allows for creating interactive and immersive experiences in diverse fields, such as entertainment, education, cultural heritage, or marketing. One dominant field of application is using (M)AR in marketing [
3,
4].
Within the marketing field, (M)AR creates a new way of addressing, communicating, and sharing content. This concerns the entire media value chain of an institution. Therefore, (M)AR can immerse content, changing the way of presenting and interacting with products [
5]. Thus, a new experience for the customers arises. However, innovative technologies encompass new interaction paradigms and, thus, a new experience. Regarding marketing, such a virtual marketing experience can enhance the purchase intention towards the immersed product and the brand attitude [
6,
7].
However, only a little research has been conducted to investigate the impact of the virtual experience on these marketing factors. Against this background, we address the following research questions:
RQ1: To what extent does the experience in virtual experience marketing influence the brand attitude and the use and purchase intention?
RQ2: Which factors of the experience influence the brand attitude and the use and purchase intention in virtual experience marketing?
We conducted a quantitative study in the field of cultural heritage. In particular, an online survey concerning the German Opera on the Rhine, a leading German opera house, was conducted. As the object of investigation, the OpAR app was evaluated. This app provides interactive, immersive content referring to different opera performances. We applied the Virtual Experience Marketing Model (VEMM) developed by [
8], investigating the influence of virtual marketing experience modules on brand attitude as well as use and purchase intention.
This paper is structured as follows:
Section 2 illustrates the theoretical foundation and related work.
Section 3 declares the methodological approach.
Section 4 shows results. This article ends with a conclusion and outlook in
Section 5.
2. Theoretical Foundation
The following sections explain the theoretical foundation regarding AR Marketing and Experience Marketing.
Section 2.1 introduces AR technology in marketing. Moreover,
Section 2.2 discusses Experience Marketing.
Section 2.3 summarizes both previous topics describing the related research concerning AR Experience Marketing.
2.1. Augmented Reality Marketing
Based on [
9], the literature indicates a growing interest in applying AR applications in Marketing. Therefore, the term
AR Marketing is defined as follows:
"AR Marketing is defined as the strategic integration of AR experiences, alone or in combination with other media or brand-related cues, to achieve overarching marketing goals by creating value for the brand, its stakeholders, and societies at large while considering ethical implications. [
9]"
AR marketing, as part of an organization’s strategic marketing, aims to improve the user experience and increase customer satisfaction [
10]. Although the implementation is based on different objectives depending on the company’s efforts, the ultimate purpose is to escape the flood of advertising, differentiate the brand, and generate a competitive advantage [
5]. Therefore, AR Marketing is broad, goal-oriented, and interdisciplinary [
9].
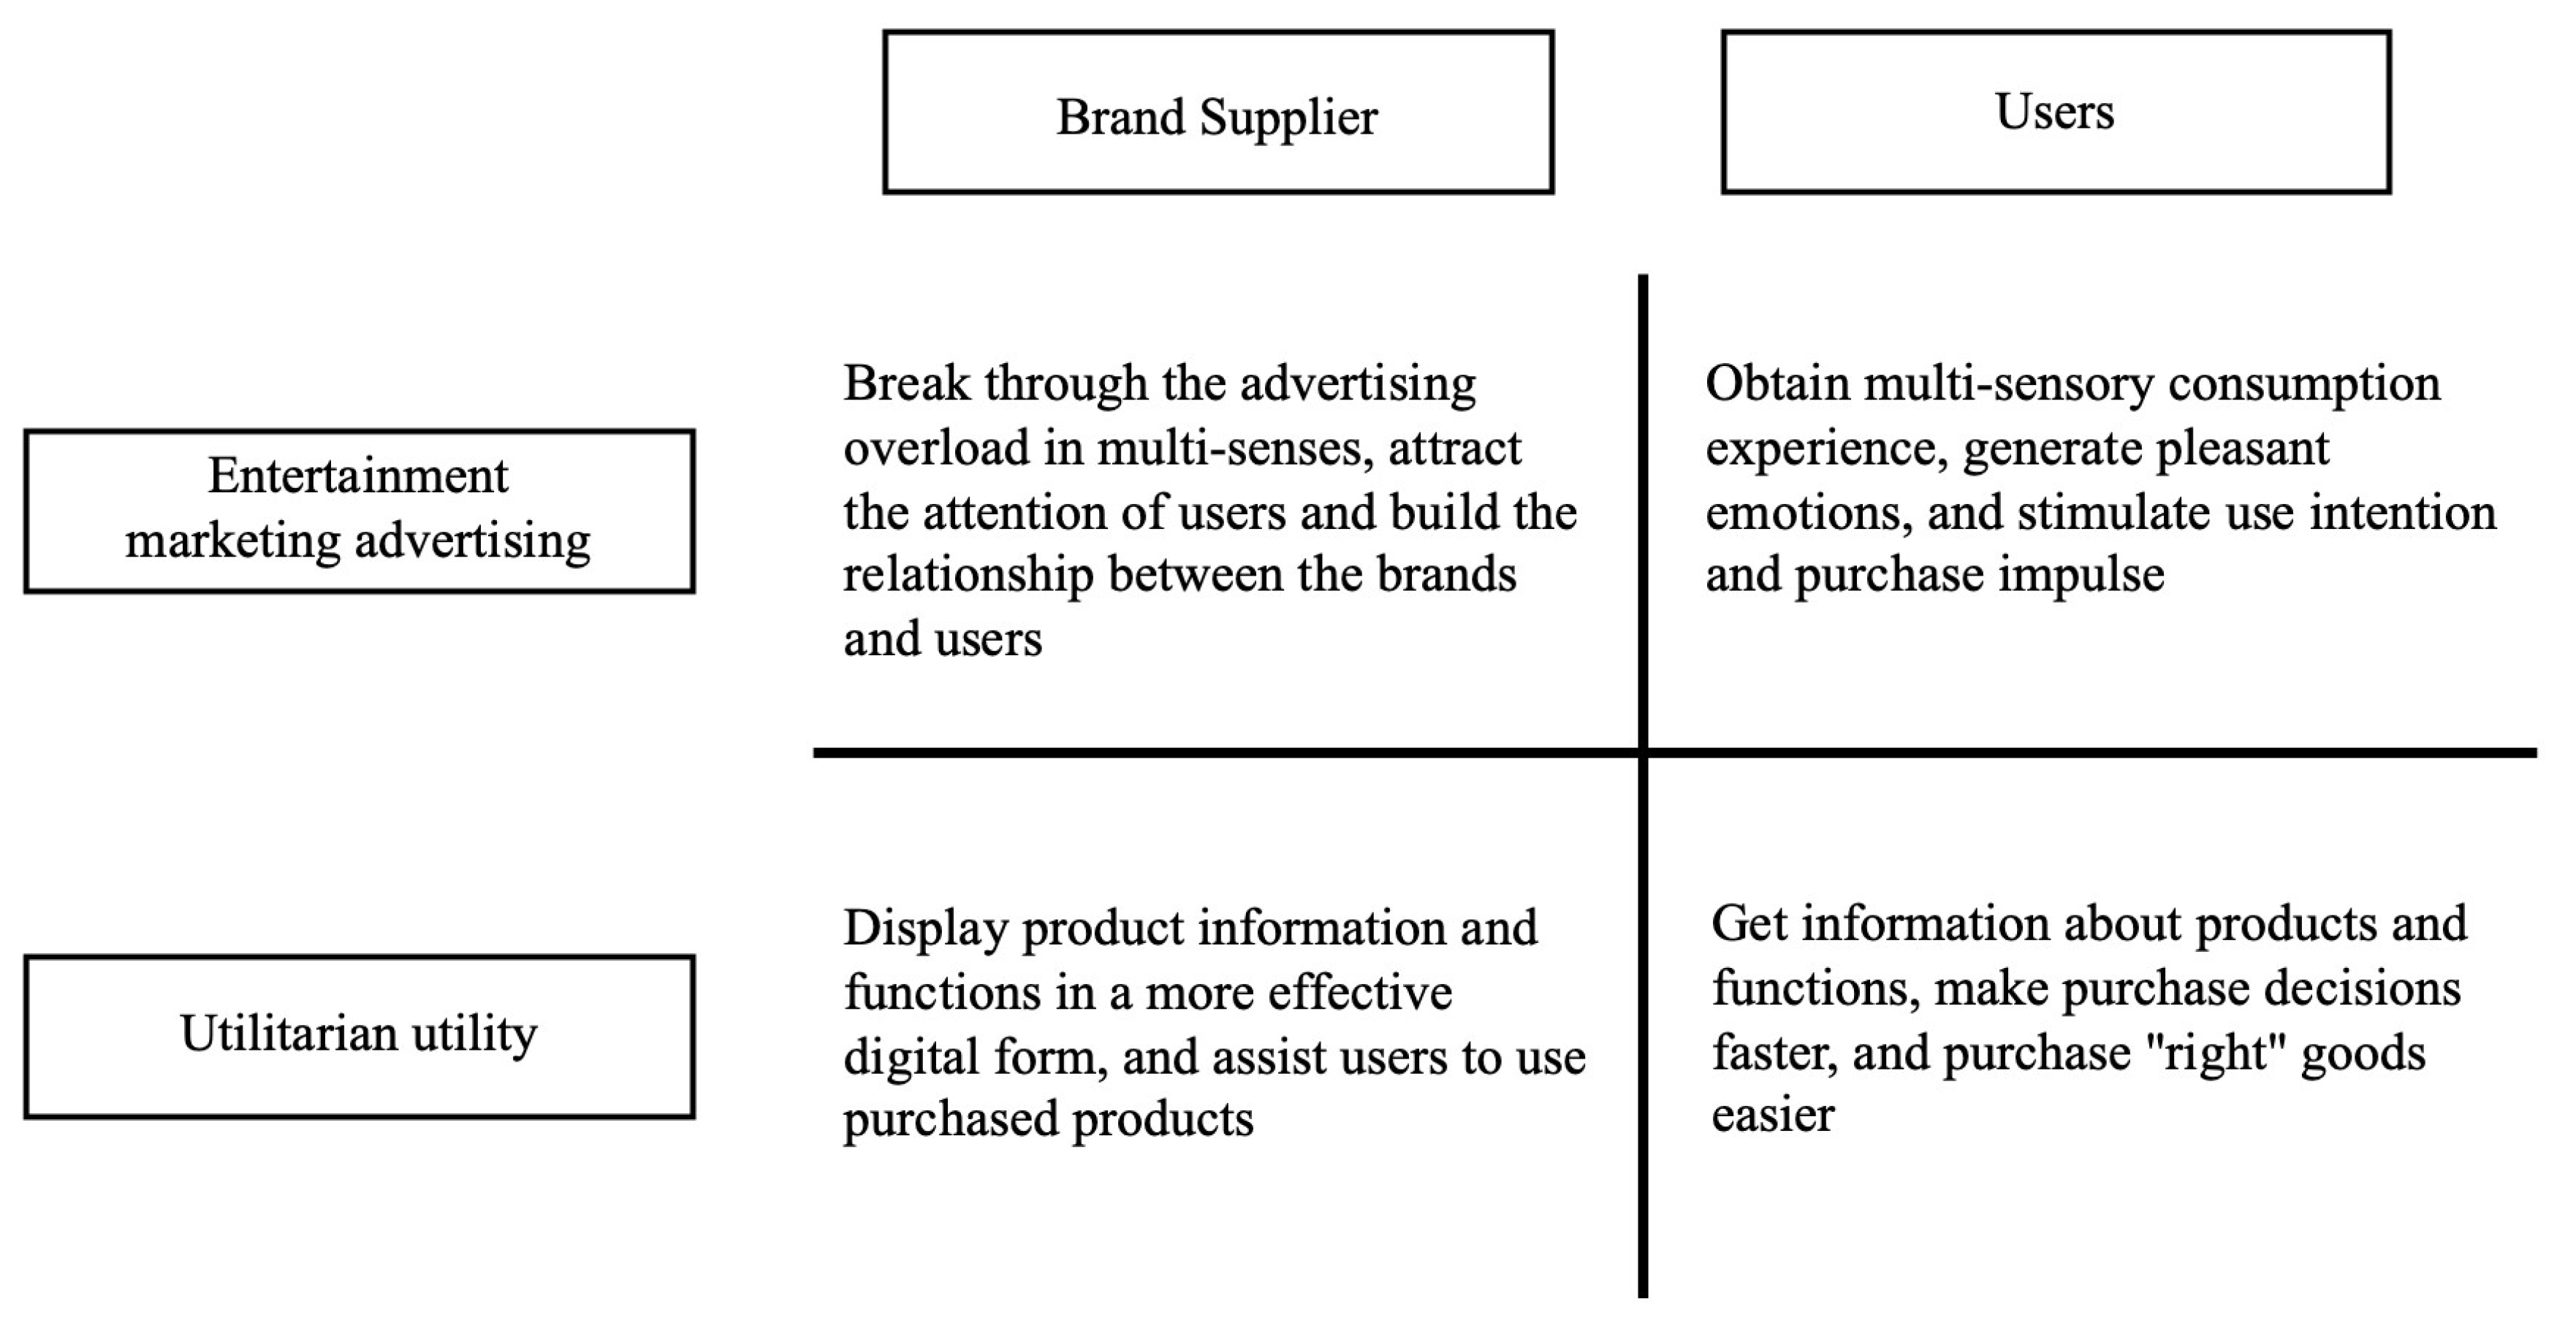
Zhu and Wang summarize the essential functions of AR marketing in a matrix, considering hedonic and utilitarian aspects (see
Figure 1) [
8].
AR marketing can be subsumed in its entirety under the research field of experiential marketing. The successful implementation of experience strategies in marketing requires multi-sensory consumer experiences, which in the field of AR are primarily realized through the combination of visual and haptic content. The user is involved in the marketing and actively shapes it through interactions, such as configuring content by touching the display. Accordingly, the result of product marketing is an increased haptic perception of the product and the creation of a general pleasure effect [
11,
12,
13].
2.2. Experience Marketing and Models
The term
Experience is defined as a subjective added value triggered by the implementation of marketing measures and contributes to the recipient’s quality of life. Experience marketing generally constitutes a possibility of strategic orientation within the company. The primary aim is to establish a profound affective connection between the consumer and the brand by staging positive experiences [
14,
15,
16]. The importance of multi-sensuality in experiential marketing, i.e., the simultaneous perception and processing of stimuli through multiple senses, is relevant in experiential marketing to ensure a high quality of experience [
13].
Based on the explanation of Experience Marketing, two fundamental theories within this research field can be introduced. two theories: the
Experience Economy Theory developed by [
17] and the
Experience Modules presented by [
18].
The Experience Economy theory divides an experience into four dimensions. The sweet spot is formed between the four areas of
entertainment,
education,
aesthetics, and
escapism, which, as an intersection, creates an unforgettable experience. The model’s content is consequently the idea that experiential marketing evokes emotions by providing entertainment, enabling an escape from reality, conveying education, and presenting aesthetic objects or places [
17,
19].
The five experience modules by [
18] differentiate an experience into the following dimensions:
(1) Sensory experience – (SENSE)
(2) Affective experience – (FEEL)
(3) Creative cognitive experience – (THINK)
(4) Physical experience – (ACT)
(5) Relate experience – (RELATE)
Each module contributes to the product or service in a way that extends beyond its purely functional characteristics. Moreover, the five modules refer to the five human senses. In particular,
(1) Sensory experience aims to create an exciting and attractive customer experience.
(2) Affective experience goes beyond the emotionality triggered by classic advertising measures. According to the subjective evaluation, they range from simple positive or negative feelings to extremes in joy, pride, satisfaction, or opposites.
(3) Cognitive experience addressing the consumer’s intellect by engaging with the brand and recognizing the added value of a purchase are distinguished from affective experiences. Furthermore,
(4) Behavioral experience shows the consumer the unique features of using and interacting with the product. Under certain circumstances, the resulting experience can lead to a change in behavior and lifestyle.
(5) Social experience relates to the consumer’s inner emotional world. Positive experiences stimulate identification and a sense of belonging [
20,
21].
2.3. Related Work
Regarding related research on AR Experience Marketing, two studies could be identified that examine the relationship between experience and purchase intention by applying (M)AR in marketing based on the S-O-R model.
Zeng et al. applied four determinants (entertainment experience, esthetic experience, educational experience, real escape experience) based on the Experience Economy Theory. Results showed that these determinants positively affect the relationship between brand and consumer. Moreover, the positive customer relationship has a significant causal relationship with customer satisfaction, which in turn significantly impacts purchase intention [
22].
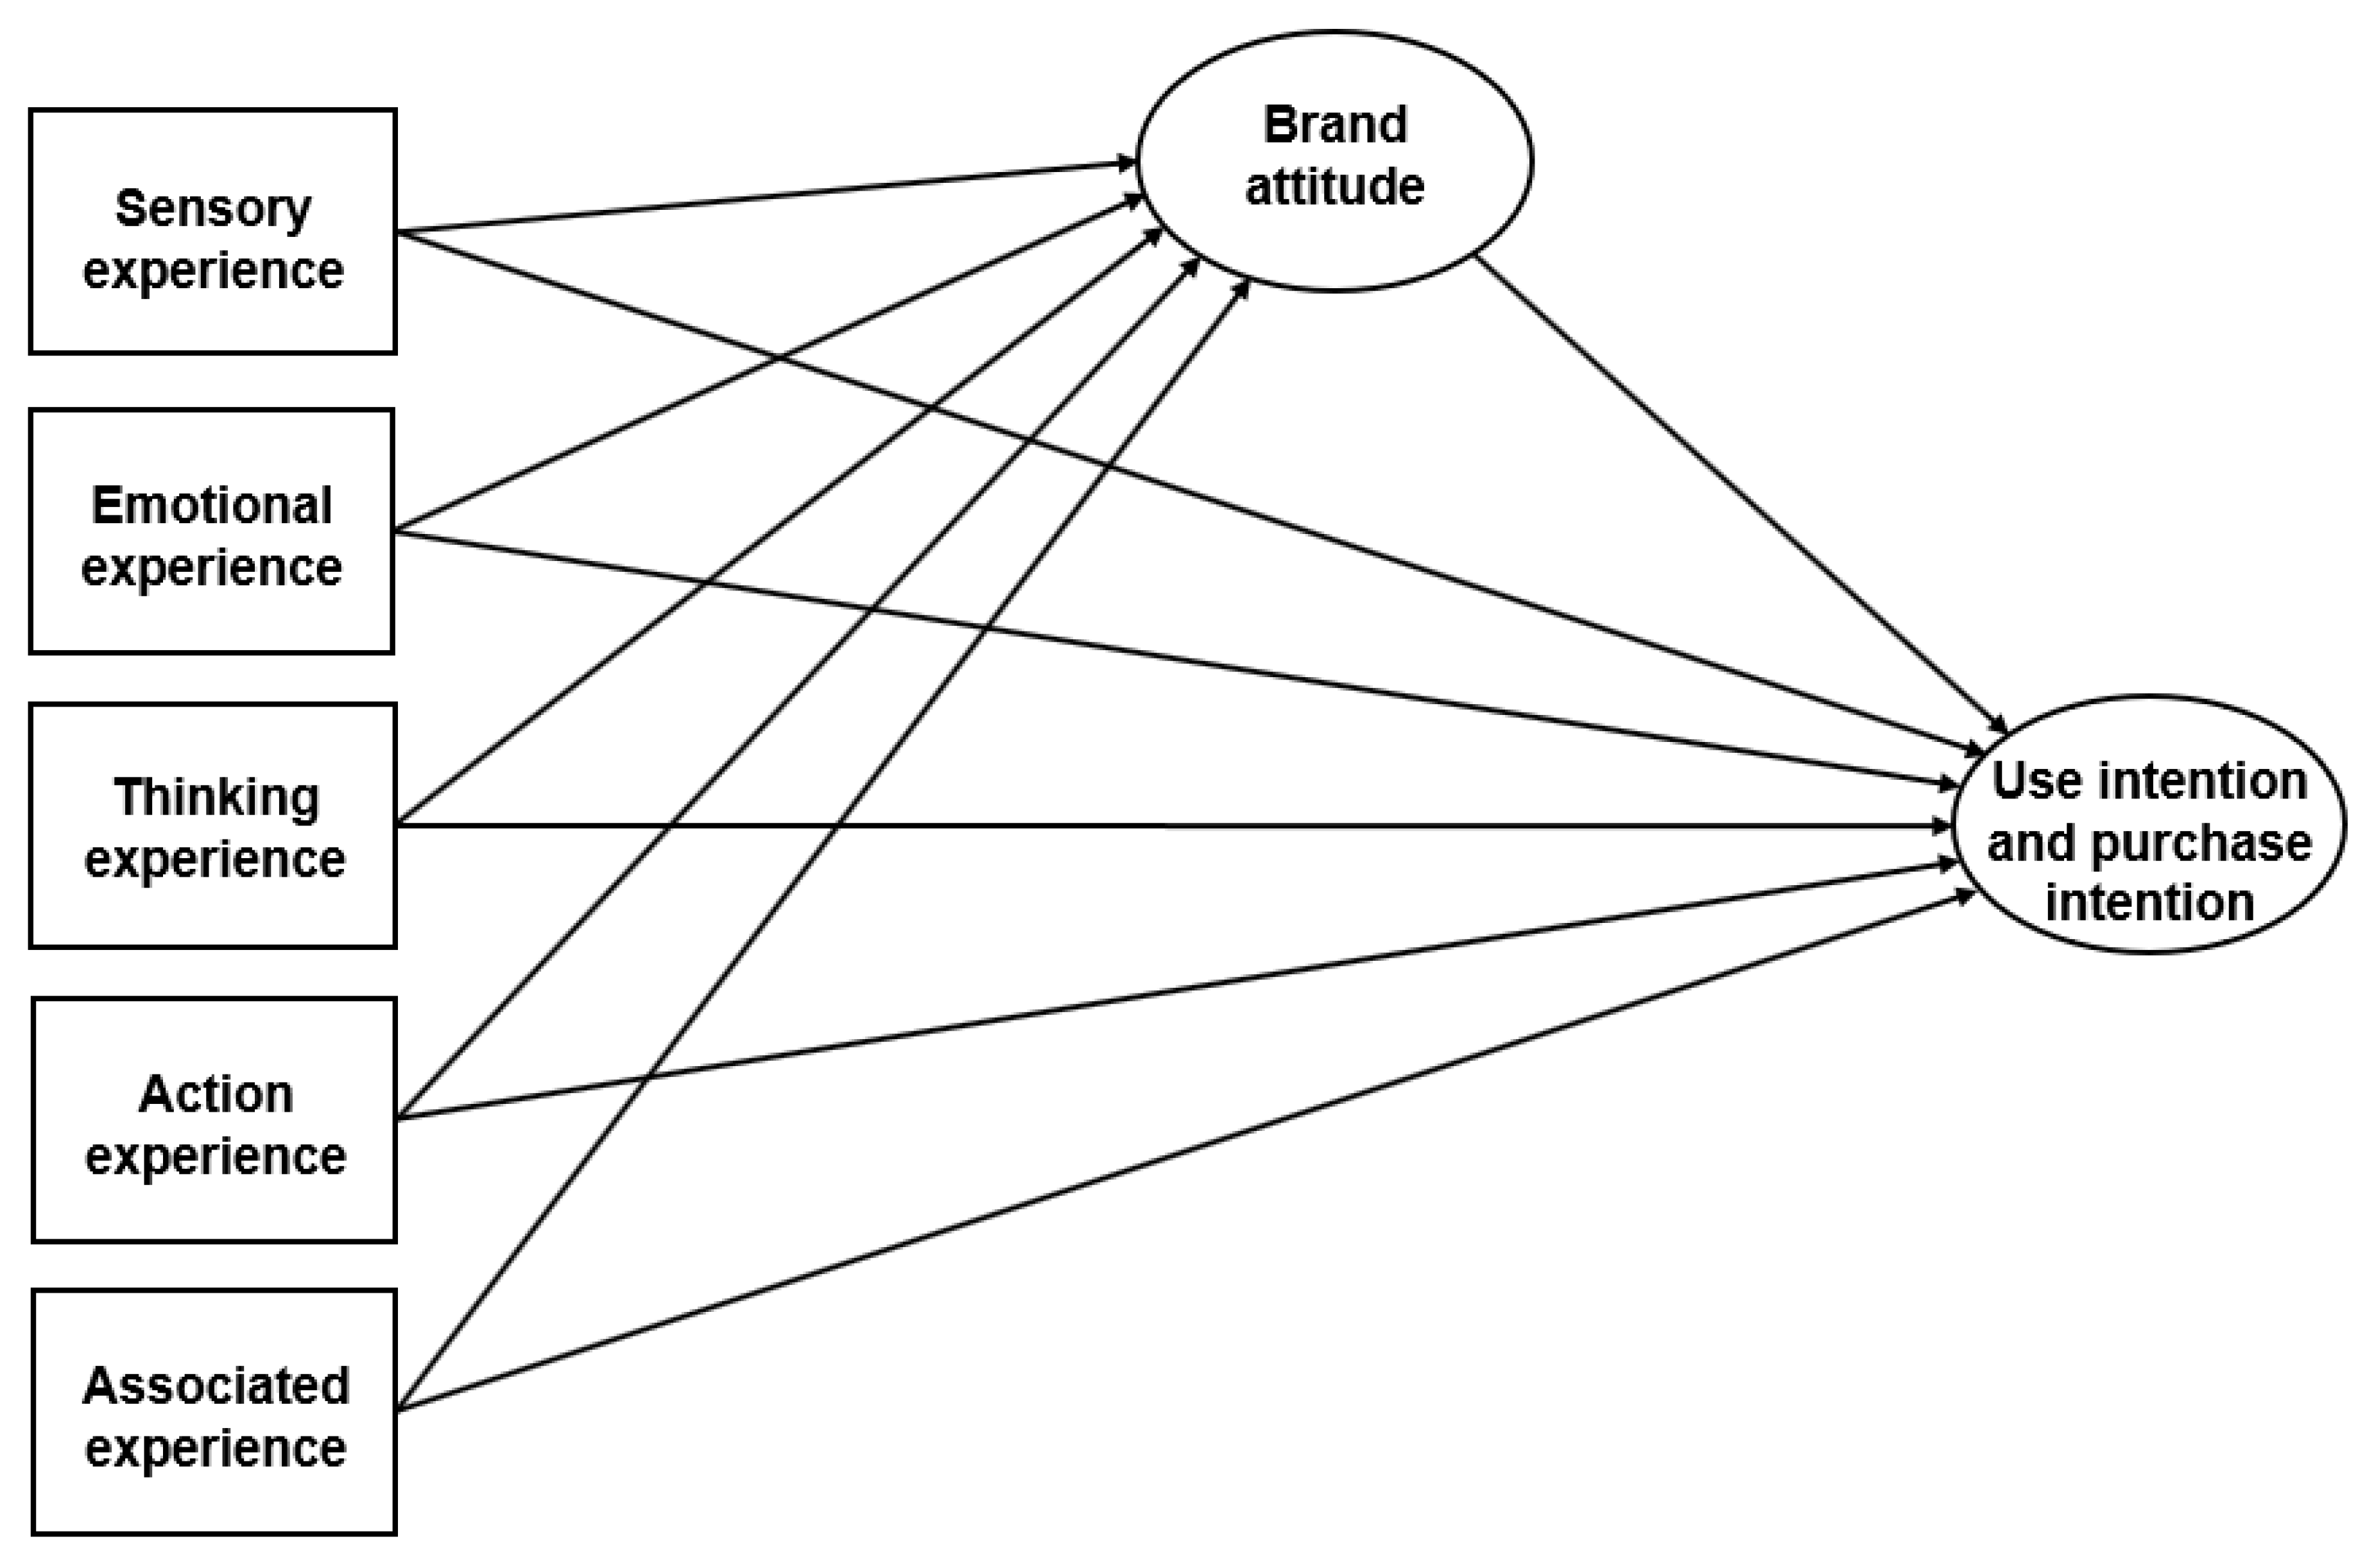
Zhu & Wang developed the Virtual Experience Marketing Model (VEMM), referring to the five experience modules by [
18]. The VEMM proposes the relationship between the five experience modules and brand attitude and usage & purchase intentions (See
Figure 3). The study was conducted within the field of cultural heritage. In particular, an AR application for the Guilin Museum was developed. The application presents various exhibitions at the museum, offering potential visitors a preliminary insight into the museum’s exhibitions. Results showed that Thinking experience and Action experience significantly influence the Brand attitude. Furthermore, the Emotional experience significantly impacts the Use intention and purchase intention. All other hypotheses could not be confirmed-
3. Methodological Approach
We conducted a quantitative empirical study examining the AR experience in the field of cultural heritage. In the following, the approach is explained.
3.1. Research Design and Data Collection
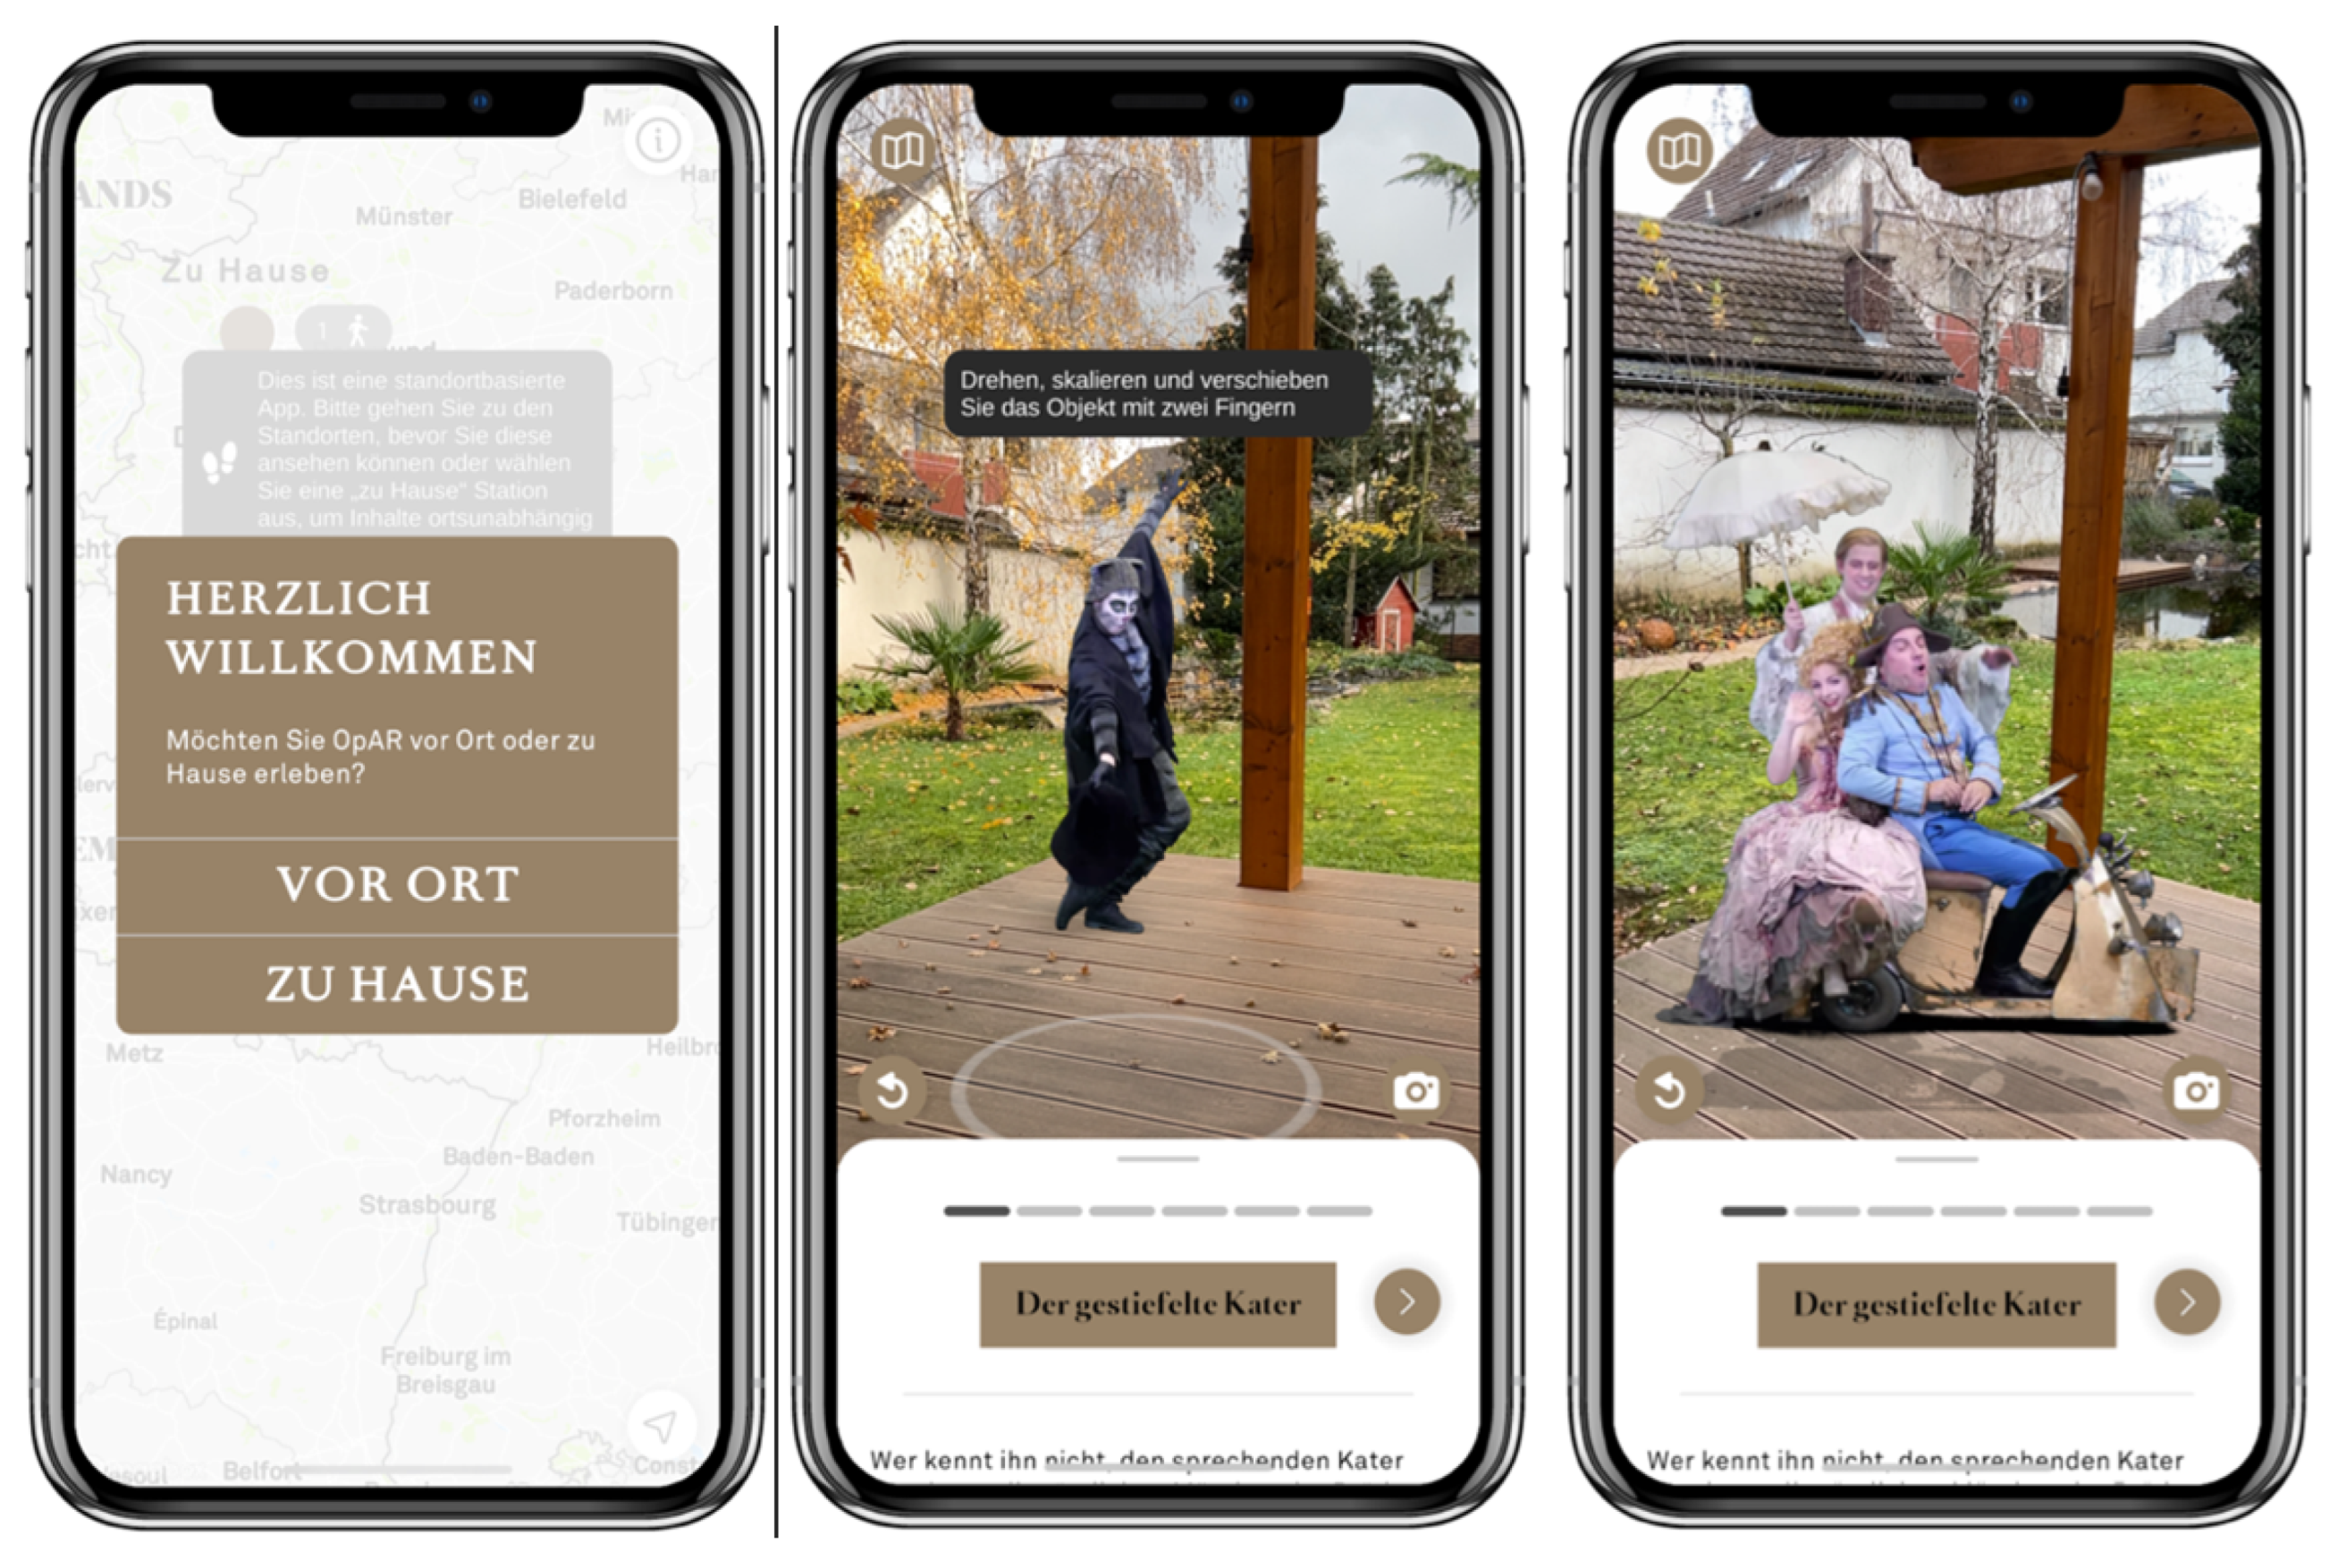
This empirical study investigates the influence of virtual marketing experience on brand attitude and purchase intention in the field of cultural heritage. We conducted a quantitative survey. We evaluated a so-called OpAR application regarding the German Opera on the Rhine. The app provides interactive, immersive content regarding the different opera performances. The user can display various excerpts from the performances in the room. The German Opera on the Rhine developed the OpAR app, which is available to download in the common app stores. Further information is provided online.
1.
Figure 2 shows an exemplary scene from the app:
As the app concerns opera visitors in Germany, the study addresses a German target group, including the four generations of Baby Boomers, X, Y, and Z. This broad range was selected to increase the study’s representativeness. Moreover, this range still ensures the necessary affinity with MAR technology.
The study was carried out in German. A convenience sample was conducted. The study was accessible from 29.11.2023 to 11.12.2023. It was distributed on common social media platforms. Moreover, participants from the social network were acquired by actively approaching them.
3.2. Research Model and Hypothesis
As shown in
Section 2, only a limited number of research models concerning Virtual Experience Marketing can be found. We chose the AR Virtual Experience Marketing Model (VEMM) by [
8] for evaluation. The model was selected due to its fit in the context of cultural heritage. Moreover, it is based on the relevant literature on experiential marketing. The model is shown in Figure X.
Figure 3.
Virtual Experience Marketing Model (VEMM) based on [
8].
Figure 3.
Virtual Experience Marketing Model (VEMM) based on [
8].
The five experience modules (1) sensory experience (SENSE), (2) affective experience (FEEL), (3) creative cognitive experience (THINK), (4) physical experience (ACT), and (5) related experience (RELATE) declared by Schmitt (1999) are the foundation of the VEMM model. Zhu and Wang (2022) adapted the modules and combined them with common AR evaluation modules. This results in the following model variables proposing the two perspectives of AR technology dimension evaluation indicators and dimension experience indicators of users.
Sensory experience (SE): SE refers to the perceptual experience generated by the user being stimulated by external senses. Indicators of sensory experiences are technical usability, sensory stimulation, and sensory immersion.
Emotional experience (EE): EE describes the stimulation of the inner emotions of the users. This is generated by consistency between system information and users’ psychological state. Indicators are the interestingness of the application, emotional resonance, and positive emotions.
Thinking experience (TE): Users are supported in making decisions by receiving product information, a profound understanding, and the reduction of uncertainty. Indicators for evaluating cognitive experience are the degree of information and usefulness, the triggers of thinking, and the retention of knowledge retention.
Action experience (AcE): AcE aims to improve the feeling of involvement and the active establishment of the relationship between the brand and the user. Indicators are the form of immediate interaction, interaction form, and participation enthusiasm.
Associated experience (AsE): Concerning the sociological dimension, AsE refers to the interaction between users and others as well as social networks. Moreover, the recommendation of the application is important.
It is assumed that the different experiences influence the use intention and purchase intention (UIPI) as well as the brand attitude (BA). The latter refers to positive brand satisfaction and the resulting brand loyalty. Furthermore, UIPI is declared as the consumer’s intention to decide based on a comprehensive evaluation of product information, brand impressions and quality of experience. Moreover, it is proposed that brand attitude influences the use intention and purchase intention.
Based on this, the hypotheses are proposed as follows (see
Table 1) [
8]:
Concerning the questionnaire design, we refer to the original items provided by Zhu and Wang (2022). The 23 items regarding the model variables were adapted and adjusted in relation to the context of this study. The items are provided in Appendix X. A 5-point Likert Scale was applied ("strongly disagree" (1) to "strongly agree" (5)). Moreover, socio-demographic data was collected.
4. Results
This section provides the results of the quantitative study. A convenience sample was conducted. The study was started 475 times and completed by 255 participants. One participant had to be excluded because his age did not comply with the defined sample regarding the four generations. Thus, we reached a completion rate of 254, or 53.68 percent. The following presents descriptive and empirical evaluation results.
4.1. Demographics and Sample Characteristics
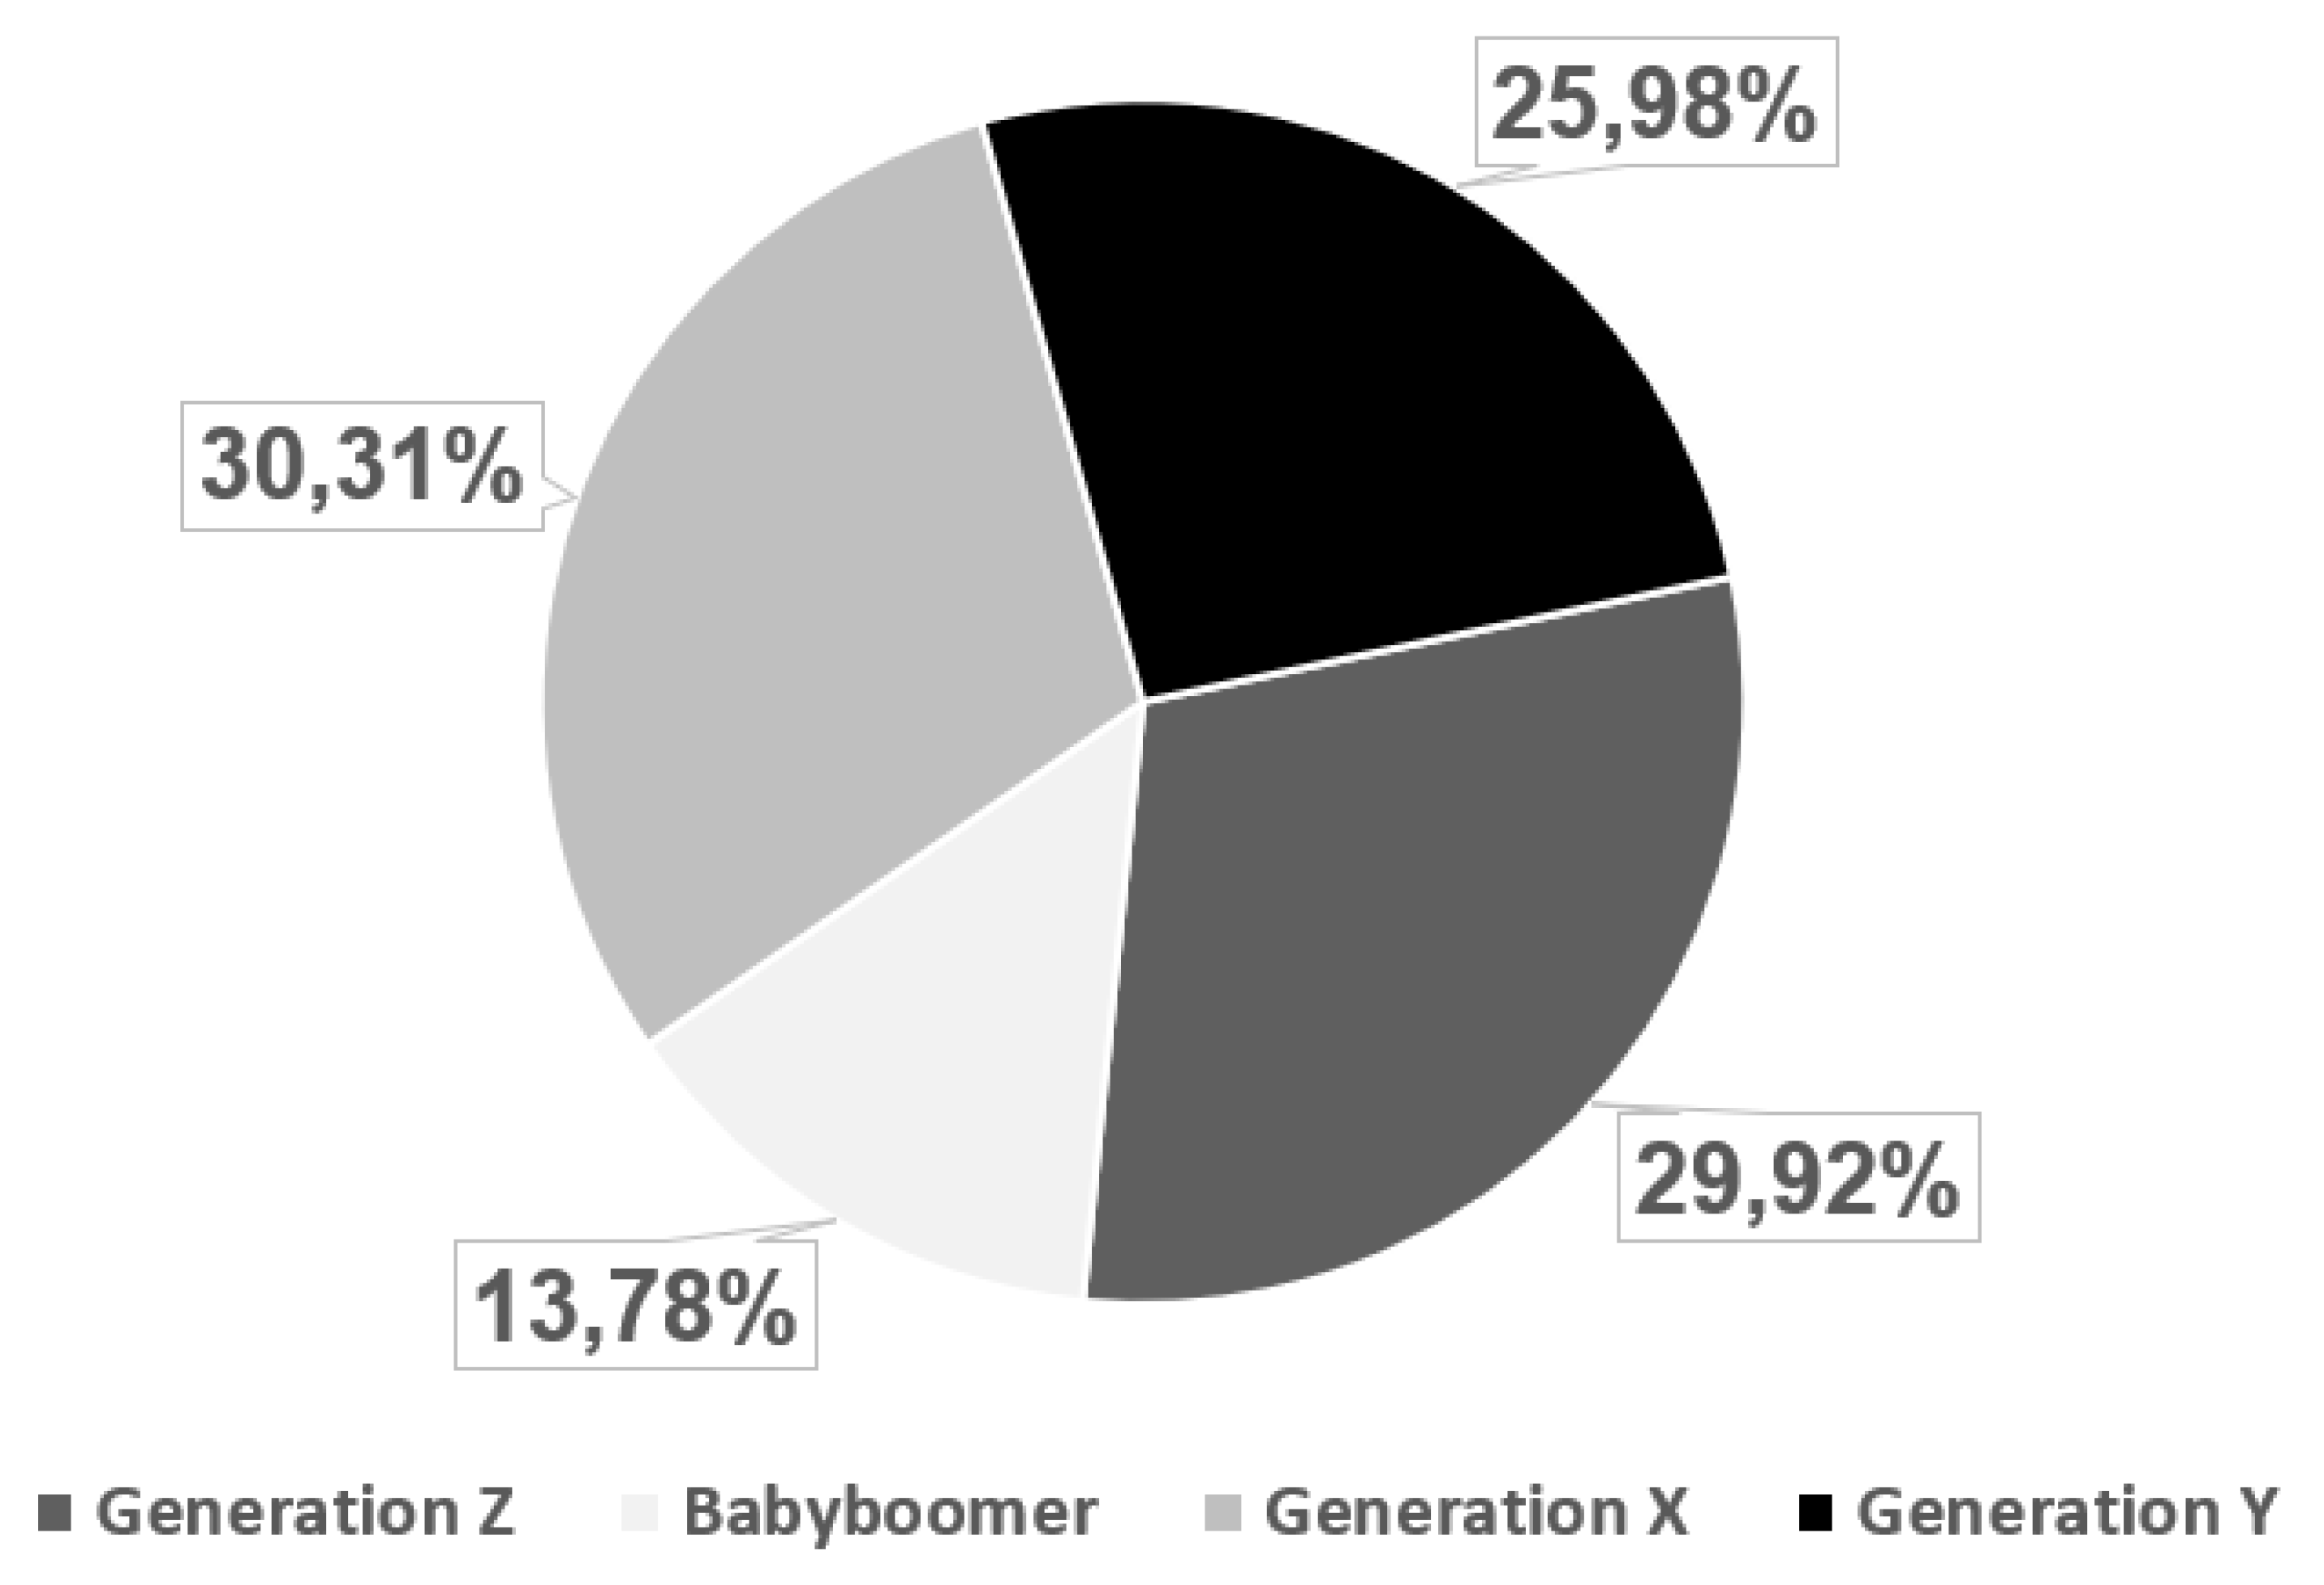
We examined the demographics and sample characteristics. All generations are represented among the participants. Generations X, Y, and Z are almost balanced, with minor differences. A slight deviation can be seen among the baby boomers, who are relatively less represented.
Figure 4 shows the detailed distribution among the generations.
The gender distribution is slightly in favor of female participants at 52%, whereas 48% of the test subjects were male.
The following
Section 4.2 provides the empirical evaluation results of the PLS-SEM analysis.
4.2. Empirical Validation
We applied Partial Least Squares Structural Equation Modeling (PLS-SEM) by [
23] to validate the model. Both measurement and structural models were analyzed using SmartPLS 4 software. We followed the evaluation procedure for reflective measurement models by [
23]. Detailed evaluation steps are shown below.
4.2.1. Measurement Model
In the first step, a measurement model was performed to confirm validity and reliability based on different criteria illustrated in the following:
Indicator reliability (indicator loadings)
Internal consistency (Cronbach’s Alpha, rho_a, and rho_c)
Convergent validity (AVE)
Discriminant validity (HTMT, Fornell-Larcker criterion, cross-loadings)
Indicator reliability aims to assess the suitability of each model variable for measuring a latent variable on the item level. A high value indicates a high similarity among the items. Therefore, the indicator loadings must reach a minimum value of 708 to fulfill the criterion. This can be confirmed for all items.
Internal consistency includes considering Cronbach’s Alpha, rho_a, and rho_c. The values of all three criteria range between 0 and 1. Values ranging between 0.6 and 0.9 for all three criteria are considered acceptable. Therefore, a higher value indicates higher reliability. Values above 0.9 (especially above 0.95) indicate that semantic similarity makes the elements redundant. Concerning the results, the rho_c value of the variables EE and TE is above 0.9 but below 0.95. However, Cronbach’s alpha and rho_a values are within the required range. Thus, internal consistency is confirmed.
Convergent validity is based on the AVE. The required minimum value of 0.5 indicates that the respective construct explains more than half of the variance of its indicators on average. All values are above the threshold, and thus, the convergent validity is confirmed. Results concerning these criteria are shown in
Table 2.
In the last step, we examined the discriminant validity. Therefore, the three criteria, the Heterotrait-Monotrait ratio (HTMT), the Fornell-Larcker criterion, and the cross-loadings, were calculated. Concerning the HTMT, values above 0.9 indicate a lack of discriminant validity as the item correlation is high. Results show that this applies to four values (see
Table 3 - marked in
cursive).
According to [
23], items correlating strongly with items of other constructs should be eliminated or reassigned to another construct. We first considered the other criteria before following this procedure. The Fornell-Larcker criterion is fulfilled if the square root of the AVE of each construct is greater than the correlation with any other construct. This applies in our study.
Table 4 shows the respective values.
Furthermore, the outer loadings of a construct should be greater than their cross-loadings. This is also confirmed. Results are shown in
Table 5. We did not eliminate or reassign items as two of the three criteria were confirmed.
To sum up, all criteria were fulfilled, confirming the validity and reliability of the reflective measurement model.
4.2.2. Structural Model
In the second step, the structural model was performed to analyze the relationship between the constructs. We considered the VIF illustrating the collinearity between the constructs. Values should be less than or equal to three. The corresponding indicator must be removed if the VIF value is above five. Concerning results, all values are below the threshold of 3 except one (AsE → BA: 3.473). However, the value is below the threshold of 5. Hence, critical collinearity is excluded.
We performed bootstrapping to analyze the t-value and p-value for the significance of the path coefficients. We applied a two-tailed test with 5000 iterations and a significance level of 5 percent [
23]. Results are shown in the following
Table 6.
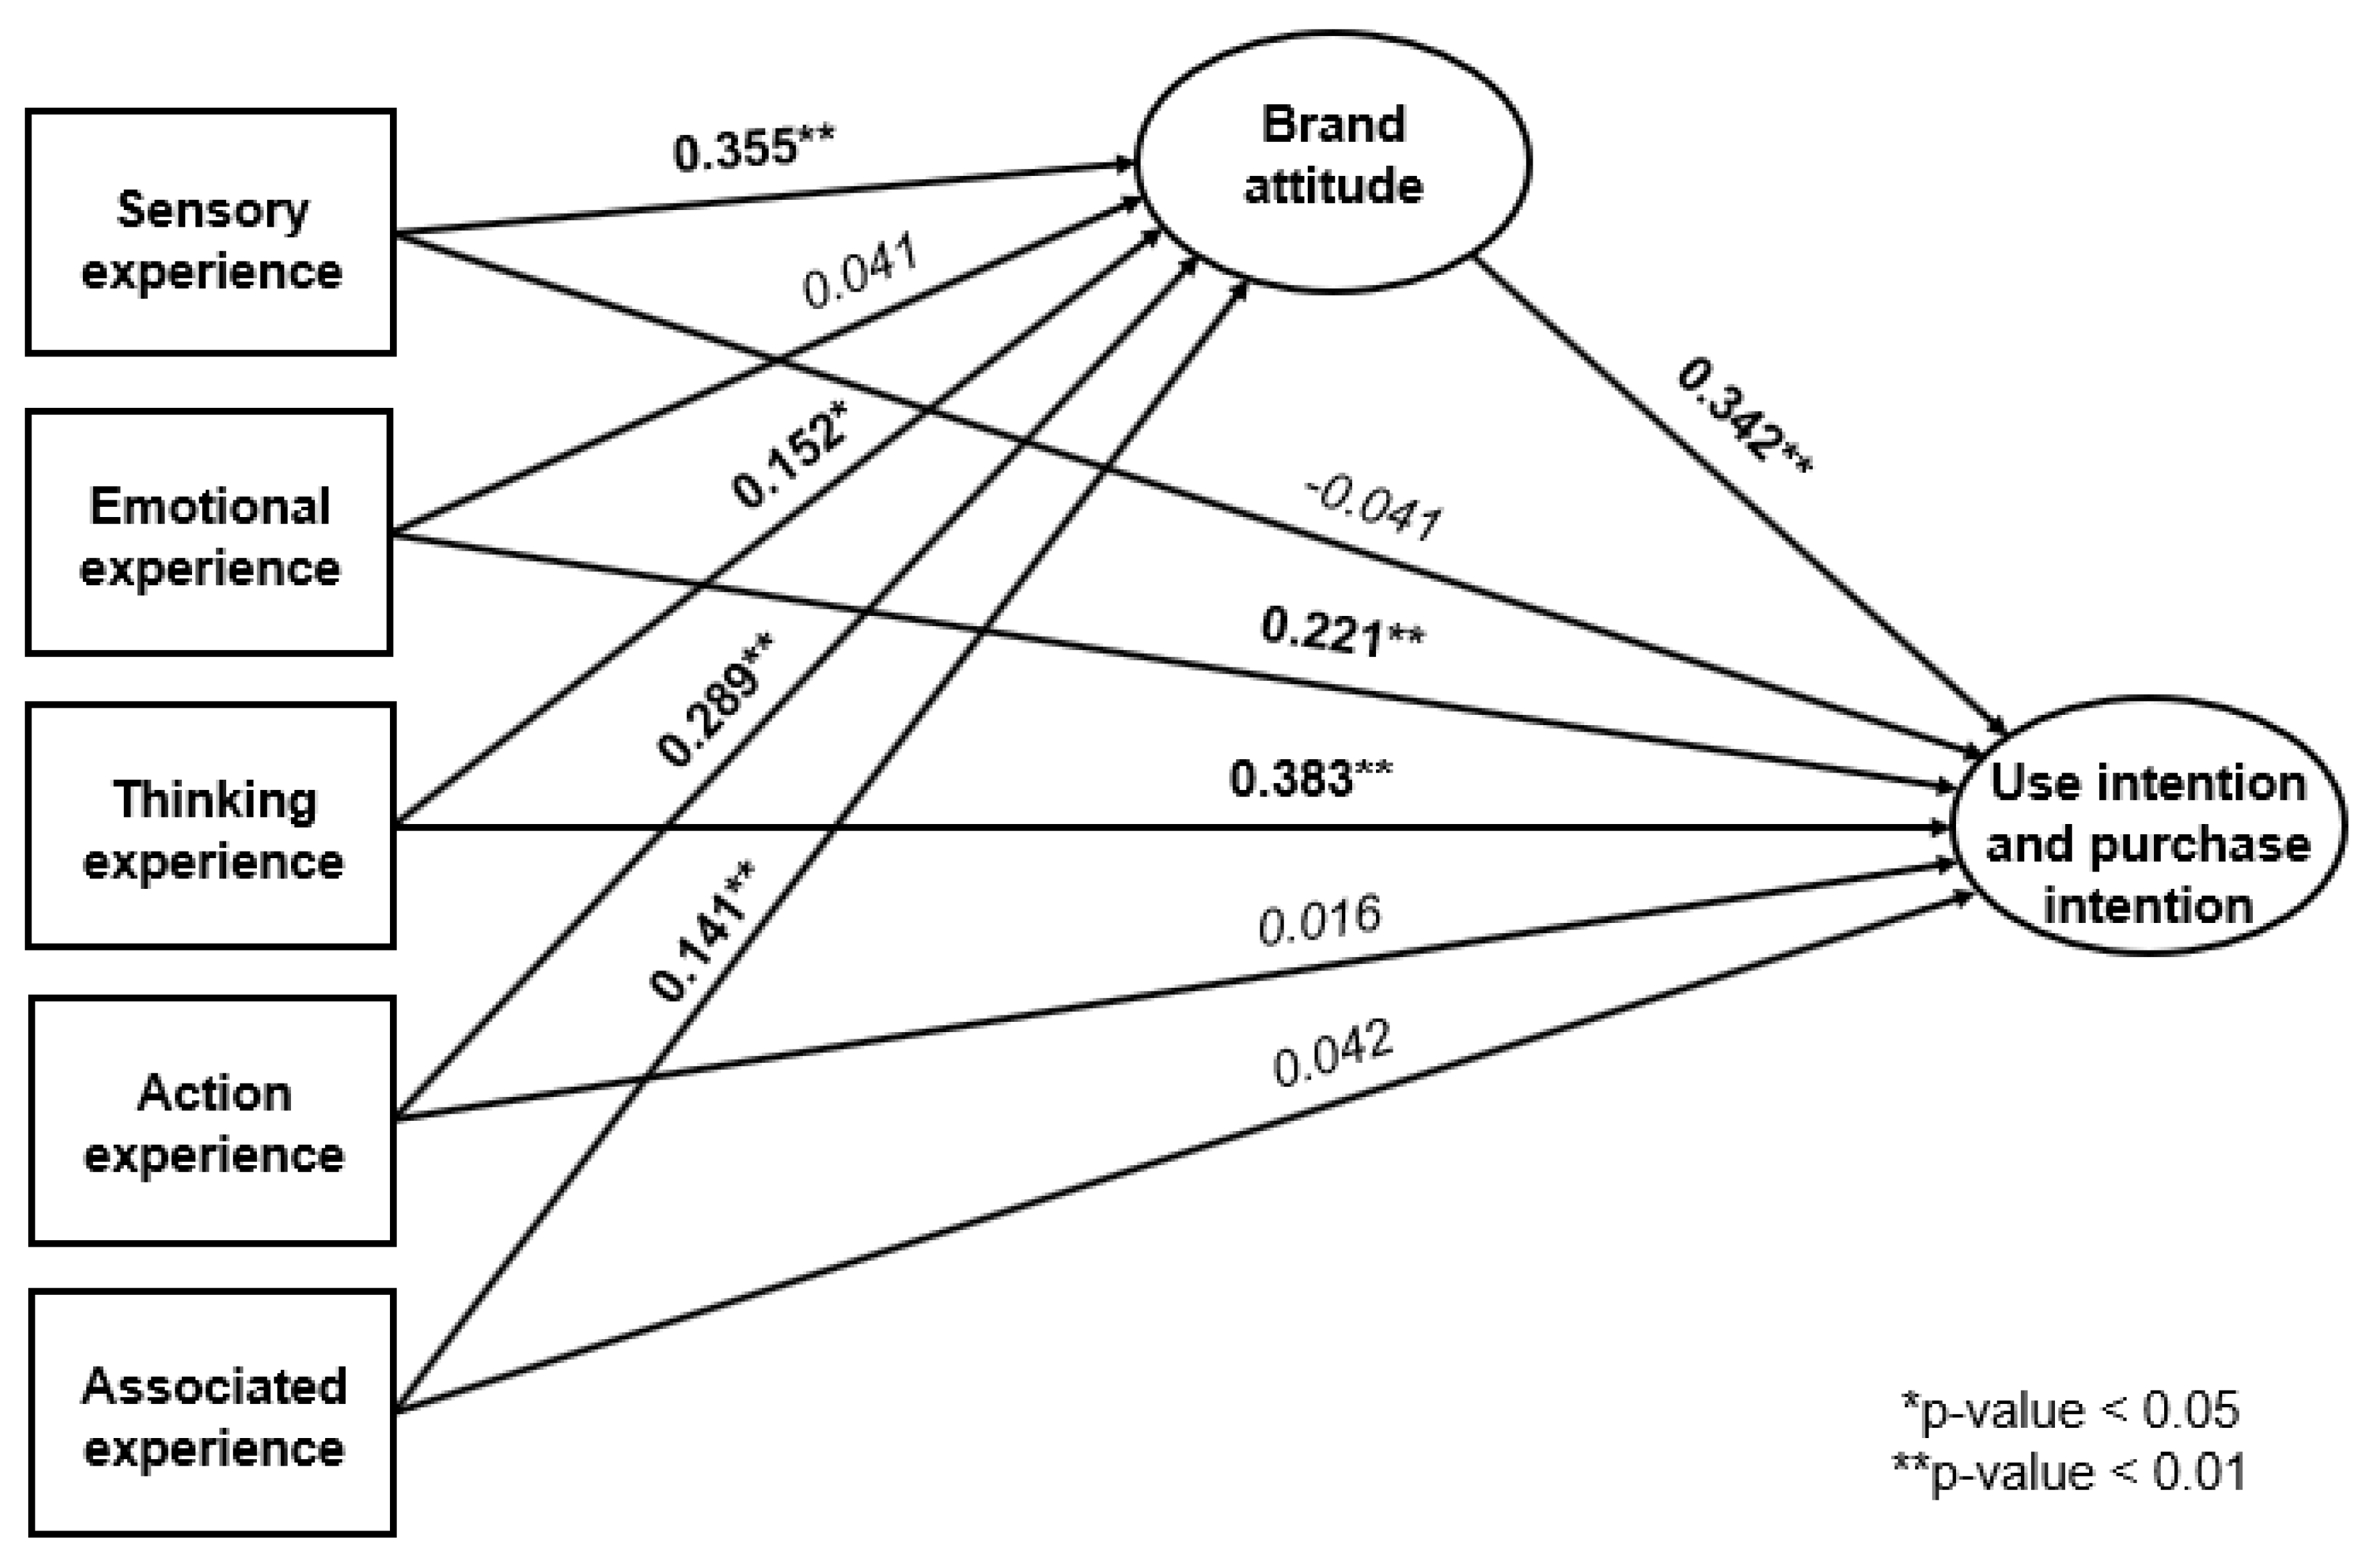
The path coefficients quantify the intensity of the causal relationships between the variables ranging between -1 and 1. Values close to 0 indicate a weak relationship. Except for one (SE → UIPI: -0.041), all path coefficients are in a low positive range. Regarding significance testing, six hypotheses are considered significant with an error probability of 1 percent and one (TE → BA) with an error probability of 5 percent. Four relationships are not significant. The strongest positive relationship is between TE and UIPI, with a path coefficient of 0.383. AsE and BA have the weakest significant positive relationship with a path coefficient of 0.141. Moreover, a negative relationship between SE and UIPI is shown.
Figure 5 illustrates the structural model with the different path coefficients.
Seven out of eleven hypotheses were confirmed as significant (H1, H3, H4, H5, H7, H8, and H11). In contrast to the results of the previous study by Zhu and Wang (2022), the hypotheses H2, H6, and H9 are falsified in our study. Moreover, in line with Zhu and Wang (2022), H10 is also not tenable.
5. Conclusions
This quantitative study examines the influence of a virtual marketing experience using (M)AR in cultural heritage. We applied the VEMM to explore the influence of the different experience modules on brand attitude and use intention & purchase intention in the context of an Opera. The so-called OpAR application showing different opera scenes in AR from the German Opera on the Rhine was applied for this. Therefore, this study considers important theoretical and practical insights concerning a virtual marketing experience in cultural heritage.
5.1. Limitations
Several limitations must be considered. One limitation refers to the sample of this study. It should be noted that this is a convenience sample. Although all generations are represented and the distribution is relatively even, most respondents can be assigned to the younger generation, which is not the typical target group of operas. The generation of baby boomers, which is most likely to take advantage of such cultural offerings, is the least represented. Moreover, the execution of the study must be mentioned. The study was conducted as an online survey. A description of how to download and use the app was integrated. The participants were then supposed to test the app. However, this could not be checked and verified. It, therefore, remains unclear whether all the participants in the study actually tested the app.
5.2. Implications
Based on the results, both theoretical and practical implications can be derived. From a theoretical perspective, we can indicate the significant influence of the modules Sensory experience, Thinking experience, Action experience, and Associated experience towards Brand attitude. In particular, the MAR application must convey product details and relevant, functional information. The user must understand this information. The experience should make the user feel part of what is happening. This should be able to be shared with other users and experienced together. This creates a positive experience towards the Brand attitude. A positive Brand attitude further influences the intention to use and purchase an opera ticket. Beside this, Emotional experience and Thinking experience directly influence the Use intention and purchase intention. This means that both attaching the emotions of the user and providing useful and understandable information is crucial. Thus, both RQ1 and RQ2 could be answered.
From a practical perspective, some insights can be derived into the design of MAR applications and their AR-based scenes of the event program. Concerning Sensory experience, the augmented content must deliver an extensive impression of the opera’s performance. Furthermore, the shown excerpt of the performance should be interesting such as a key scene to attach the emotions. Moreover, users must understand the context of the shown content. This goes along with the previous aspect of choosing a key scene users rather tend to know. The application should work, and system errors should be avoided. Based on this, the augmentation of the respective content should be realistic, interactive and in real-time to provide a unique experience. The delivered experience should be similar for everyone and possible to experience together.
5.3. Future Research
Due to innovative technologies, such as MAR, a new way of marketing emerges. Users can get a first impression of the performances. MAR offers the possibility to provide this realistically, interactively, and in real-time. Using this to deliver marketing content innovatively can be a crucial competitive advantage among operas.
This study is limited to one specific MAR application in the Rhine region. Future research should consider comparable studies in other regions, both national and international. Practical implications can be applied to other objects of investigation in the broad cultural heritage field. Lastly, future studies can be enhanced by applying a multi-method approach adding a qualitative survey component, such as Usability testing.
References
- Azuma, R.T. A survey of augmented reality 1997. 6, 355–385. [CrossRef]
- Milgram, P.; Takemura, H.; Utsumi, A.; Kishino, F. Augmented reality: A class of displays on the reality-virtuality continuum. Telemanipulator and Telepresence Technologies 1994, 2351. [CrossRef]
- Rauschnabel, P.A.; Babin, B.J.; tom Dieck, M.C.; Krey, N.; Jung, T. What is augmented reality marketing? Its definition, complexity, and future. Journal of Business Research 2022, 142, 1140–1150. [CrossRef]
- Graser, S.; Böhm, S. A systematic literature review on technology acceptance research on augmented reality in the field of training and education 2022. pp. 20 – 28.
- Prodea, B.; Constantin, C. The Role of Augmented Reality in Digital Marketing Strategy. Bulletin of the Transilvania University of Brasov. Series V: Economic Sciences 2023, 16(65), 39–46. [CrossRef]
- Barta, S.; Belanche, D.; Fernández, A.; Flavián, M. Influencer marketing on TikTok: The effectiveness of humor and followers’ hedonic experience. Journal of Retailing and Consumer Services 2023, 70, 103149. [CrossRef]
- Kumar, H.; Gupta, P.; Chauhan, S. Meta-analysis of augmented reality marketing. Marketing Intelligence & Planning 2022, pp. 110–123. [CrossRef]
- Zhu, Y.; Wang, C.; Mumtaz, S. Study on Virtual Experience Marketing Model Based on Augmented Reality: Museum Marketing (Example). Intell. Neuroscience 2022, 2022. [CrossRef]
- Rauschnabel, P.A.; Babin, B.J.; tom Dieck, M.C.; Krey, N.; Jung, T. What is augmented reality marketing? Its definition, complexity, and future, 2022.
- Rauschnabel, P.A.; Felix, R.; Hinsch, C. Augmented reality marketing: How mobile AR-apps can improve brands through inspiration. Journal of Retailing and Consumer Services 2019, 49, 43–53. [CrossRef]
- Brandão, T.K.; Wolfram, G. Digital Connection: Die bessere Customer Journey mit smarten Technologien – Strategie und Praxisbeispiele; Springer Gabler: Wiesbaden, 2018. [CrossRef]
- Qadri, S.B.; Mir, M.M.; Khan, M.A. Exploring the Impact of Augmented Reality on Customer Experiences and Attitudes: A Comparative Analysis with Websites. International Journal of Management Research and Emerging Sciences 2023, 13. [CrossRef]
- Steiner, P. Quick Guide Visuelles Marketing - Wie Sie mit visuellen Reizen Ihre Marke stärken; Wiesbaden: Springer Gabler, 2023. [CrossRef]
- Weinberg, P. Erlebnismarketing 1992.
- Lin, Y.H.; Fu, M.C.; Lin, P.H. Differences between Traditional and Augmented-Reality Experiential Marketing Campaigns. International Journal of Humanities and Social Science 2020, 10, 46–51. [CrossRef]
- Ghorbani, M.; Westermann, A. Integrierte Markenführung im digitalen Zeitalter: Bedeutung – Konzepte – Instrumente – Evaluation; Wiesbaden: Springer Gabler, 2023.
- Gilmore, J.H.; Pine, J. Welcome to the experience economy. Harvard business review 1998, 76 4, 97–105.
- Schmitt, B. Experiential Marketing. Journal of Marketing Management 1999, 15, 53–67. [CrossRef]
- Jung, T.H.; Bae, S.; Moorhouse, N.; Kwon, O. The impact of user perceptions of AR on purchase intention of location-based AR navigation systems. Journal of Retailing and Consumer Services 2021, 61, 102575. [CrossRef]
- Schmitt, B.H., Customer Experience Management; Gabler Verlag, 2009; pp. 697–711. [CrossRef]
- Schmitt, B., Customer Experience Management; Gabler Verlag, 2015; pp. 1–13. [CrossRef]
- Zeng, J.Y.; Xing, Y.; Jin, C.H. The Impact of VR/AR-Based Consumers’ Brand Experience on Consumer–Brand Relationships. Sustainability 2023, 15. [CrossRef]
- Hair, J.F.; Hult, G.T.M.; Ringle, C.M.; Sarstedt, M. A primer on partial least squares structural equation modeling (PLS-SEM), third edition ed.; SAGE: Los Angeles, 2022.
|
Disclaimer/Publisher’s Note: The statements, opinions and data contained in all publications are solely those of the individual author(s) and contributor(s) and not of MDPI and/or the editor(s). MDPI and/or the editor(s) disclaim responsibility for any injury to people or property resulting from any ideas, methods, instructions or products referred to in the content. |
© 2025 by the authors. Licensee MDPI, Basel, Switzerland. This article is an open access article distributed under the terms and conditions of the Creative Commons Attribution (CC BY) license (http://creativecommons.org/licenses/by/4.0/).