
Submitted:
01 November 2024
Posted:
04 November 2024
You are already at the latest version
Abstract
This research was carried out as part of a program for the conservation and improvement of the strawberry tree. Accessions’ prospecting was conducted in different Portuguese provenances. Accessions (204) were identified, and mature fruits were collected in autumn. The sugar contents in the fruit pulp (glucose, fructose, maltose, sucrose) were analyzed by HPLC and the correlation between the average sugar content, climatic classification (Thornthwaite Method and Xerothermic Index), and edaphic characteristics was investigated. The predominant sugar was fructose, which ranged from 7.89±0.55% to 17.01±1.46% (f.w.), respectively, under an Attenuated Thermomediterranean climate at limestone-derived soil and an Accentuated Mesomediterranean climate at schist-derived soil. The lowest sugar contents, linked to a reduction in photosynthesis, were found: 1) in the north, despite soil water availability, due to the low temperature, high precipitation and short photoperiod, particularly during the fruit maturation (autumn); 2) in the south, due to the excessive number of dry days, linked to low soil water availability during the active growth period, particularly at limestone zones prone to water retention. The relationship found between the total sugar content and climate classification by the Xerothermic Index allows to enhance fruit production, advise on the establishment of new orchards and restore natural areas.
Keywords:
annual precipitation
; annual temperature
; fructose
; limestone-derived soil
; orchard establishment
; photosynthesis
; schist-derived soil
; strawberry tree
; Thornthwaite Method
; xerothermic index
1. Introduction
The use and appreciation of native edible plants, both wild and cultivated, have been essential to the development of numerous cultures worldwide, particularly in the Mediterranean region, where these plants play a vital role in the health and well-being of local populations [1,2,3,4]. Arbutus unedo L., commonly known as the strawberry tree, is a small tree or shrub of the Ericaceae family, typical of Mediterranean climates [5]. Highly resistant to harsh conditions, it grows spontaneously in various regions of Portugal, predominantly south of the Tagus River, particularly in mountainous areas, such as the Caldeirão and Monchique [6]. This plant is of great ecological interest due to its numerous environmental benefits [7]. The successive flowerings during winter and its evergreen canopy contribute to biodiversity, serving as food and shelter for bees, birds, and small mammals, while its branched root forms mycorrhizal associations with a large group of fungi [8]. This symbiotic community plays an essential role in soil stabilization and erosion control. It serves as a carbon and water reservoir and contributes to the formation of intraspecific associations, as evidenced by the example provided by Richard et al. [9]with Quercus ilex. In addition, strawberry tree ability to regenerate after fire, makes it an ideal candidate for reforestation projects to promote plants survival in Mediterranean ecosystems [10], in the restoring of degraded soils [11], and used as a broadleaved green firebreak around villages and infrastructures, particularly in the wildland-urban interface [12].
From an economic perspective, the strawberry tree is one of the most important and widely recognized shrubs in the Mediterranean basin. It is valued for its many applications, including an ornamental plant, a melliferous plant [13], for its fruits [14] and wood and for medicinal purposes [3,4,15,16]. This multifunctional species has a wide range of applications in various industries, including nutraceuticals, pharmaceuticals, cosmetics, [3,17,18,19], and food, due to its antiseptic, diuretic, and antioxidant properties [1,20,21]. The fruit of the strawberry tree, a berry is edible and contains a high proportion of sugars (42 to 52% of dry weight) [22] as well as a range of other nutrients, including minerals [23], polyphenols [1,3,24], organic acids, volatile compounds [25], and antioxidant compounds [4] such as vitamins [26,27]. The composition of these compounds varies with the ripening stage of the fruit, as has been shown in numerous studies [14,18,19,21,22,25,27]. However, according to Morales [28], despite numerous studies and references to the use of the A. unedo in traditional folk medicine, further studies are needed to evaluate biological activity, animal studies and clinical trials. Similarly, apart from the well-established distillery industry, there are few advanced technologies for other uses of fruit, sclerenchyma and leaves, as well as efficient technology for extraction, purification and isolation of bioactive compounds, followed by appropriate scientific validation for subsequent use and dissemination.
Fruits can be consumed fresh, made into jams, jellies, and preserves, or fermented and distilled to produce alcoholic beverages, such as strawberry tree brandy [29,30]. This distinctive and aromatic spirit beverage is produced through the distillation of fermented fruits, a practice that is particularly prevalent in the southern and central regions of the country, representing a sustainable agroecological practice [31]. Despite the production costs of “Aguardente de medronho”, as it is known in Portugal, the market value of this product ensures its profitability, thereby enhancing the social and economic significance of the strawberry tree. Currently, three denominations of origin are recognized: Medronho do Algarve, Medronho do Buçaco and Medronho do Sudoeste.
The fruits covered with conical papillae (sclerenchyma tissue) are orange to red, when mature, and ready to be harvested, during autumn. It takes one year from flowering to fruit ripening, which is a long period, with the fruits under environmental stress (cold, frost, wind and then heat and water stress). During autumn, the plant displays both different physiological stages, ripening fruits and flowers [32].
In a three-year study of fruit harvesting in two natural forest areas in Spain, with differing environmental conditions, [24] revealed significant variability in sugar content, with sucrose, glucose and fructose exhibiting an increase order of concentration. Similar results in physicochemical composition and the content of specialized metabolites were reported for fruits harvested in different ecological conditions in Croatia [33]. Thus, and considering the increased interest in this crop in Portugal, and the potential uses of its fruits, it is relevant to better understand the relationship between sugar content in A. unedo fruits and climatic and edaphic characteristics. The knowledge and understanding of the dynamics in the fruit sugar content-soil-climate system will allow us to advise either plant field establishment (e.g. sun exposure) or fertilization program [34], with the objective of promoting fruit production and quality. For this purpose, a total of 204 accessions were identified through continental territory from North to South and mature fruits were collected during the autumn season. Fruits were processed to obtain fruit pulp free of seeds and sclerenchyma tissue. Then, sugar contents were analyzed using high-performance liquid chromatography (HPLC), with the objective of discerning the percentage composition of glucose, fructose, maltose, and sucrose. Furthermore, in order to evaluate the relationship between the sugar levels observed in the fruits and the edaphoclimatic characteristics of the accession site, the correlation between the average sugar levels, the climatic classification (determined by the Thornthwaite Method and the Xerothermic Index) and the edaphic characteristics, mainly the soil and its mother-rock, was studied.
2. Materials and Methods
2.1. Characterization of Accession Prospecting Sites/Provenances
This research was carried out as part of the program for the conservation and genetic improvement of the strawberry tree, with the aim of prospecting and collecting the genetic diversity [35] of cultivated and wild plants for their inscription in the Portuguese Plant Germplasm Bank (https://www.iniav.pt/bpgv), and in the GrinGlobal platform (https://www.grin-global.org/ ). A total of 204 accessions were prospected and harvested in 14 sites/provenances, distributed from the north to the south of the country and from the inland to the coast.
The identification of prospective sites was based on the application of two distinct criteria. The first criterion involved the inclusion of provenances that have a historical and economic tradition of harvesting fruit for brandy production. The second criterion involved provenances representative of the diversity of the species excluding sites that had already been characterized in previous studies [36,37,38,39]. In this way, accessions of cultivated and wild plants (in non-irrigated orchards and natural areas, respectively) were identified by producers for their fruit production and quality, as well as accessions from wild areas where there is no tradition of economic exploitation of the species, but which are of potential interest to small farmers, particularly in mountainous regions, characterized by a higher risk of desertification and forest fires. In these areas, the species can play an important role, providing a new source of income and contributing to population settlement, while increasing biodiversity and conserving the soil. Figure 1 shows the distribution of the different accessions according to the 14 provenances (Table 1).
Each accession was characterized (Table 1) by geographical coordinates, altitude, sun exposure (1-8), light conditions (1-3), lithology [40], soil [42], pH (1-5), soil texture (1-11), location (inland vs. coast), mean annual precipitation and temperature (mm and °C; from the climatological normal corresponding to the period 1951-1980 [43], humidity index (Ihu), xerothermic index [44] and Thornthwaite climatic classification [45].
The sun exposure scale, which ranges from 1 to 8, represents in increasing order from N-NE-E-NW/(1-4) to S-SE-W-SW/(5-8), and 4.5 to hilltop (no sun exposure and windy). The sun exposure is a relevant factor as it has been demonstrated to interfere with entomophilous pollination of flowers and the maturation of fruits, both processes occurring during the autumnal period in successive years [32]. The S-SW exposures have been shown to be conducive to flower pollination, a reduction in fruit drop during the winter period, and an increase in the number of fruits per cluster when compared to the N-NE-E-NW exposures [46]. Light conditions range from 1 to 3, from sunlight to understorey. In addition, the oceanic influence was also considered in the variable location, with sites situated less than 16 km (in a straight line) being categorized as coastal. Soil pH is reported in an ascending order (1-5), from very acidic soils with a pH below 4 to alkaline soils with a pH above 9; and finally, soil texture is presented in an ascending order (1-11), from coarse to medium to fine soil, with higher clay content, according to the guidelines of the collection form for plant material from wild plants from the Portuguese Plant Germplasm Bank (https://www.iniav.pt/bpgv).
The humidity index (Ihu), derived from the Thornthwaite hydrological balance, enables the characterization of the rainy season, which is of particular relevance for the study of dry climates, such as those prevalent in the southern regions (Table 1), where surplus water can be retained in the soil for utilization during subsequent dry periods [47] In contrast, in humid climates (A, B and C2), which are characterized by heavier rainy seasons, the humidity index is superfluous. Such conditions are observed in the Minho and Douro regions, the coastal area north of the Tagus River and in the mountainous regions in the south, at higher altitudes (Table 1). The Ihu is calculated using the following formula, where S is the surplus water and ETP is the potential evapotranspiration from the Thornthwaite method:
Ihu = (Σ S / Σ ETP) x 100.
The xerothermic index is a statistical measure that quantifies the number of days in each month when precipitation is less than twice the average temperature, as illustrated in the ombrothermic diagram. The number of dry days is calculated by summing the monthly xerothermic indexes, which represent the number of days during which, from a biological perspective, the plant is experiencing hydric stress [48].
The classification of climate is based on the balance of soil hydrological processes, as defined by Thornthwaite and Mather [49]. To establish this balance, the data set employed includes monthly precipitation data, as well as monthly average temperature and latitude data. The values of evapotranspiration (real and potential) are calculated according to the precipitation data, with soil water storage assumed to have a total capacity of 100 mm, corresponding to the maximum available for evapotranspiration consumption.
The evolution of soil water storage, in conjunction with the hydric inputs and outputs, allows for the identification of periods of excess and deficit of water for each month [49]. The Thornthwaite classification uses the excess and deficit water indexes to calculate the Hydric Index (IH), which represents the global behavior of the climate in hydrological terms. This is represented by the 1st letter of the Thornthwaite climatic classification (ranging from A to E, corresponding from Perhumid to Arid) [45]. According to this, the provenances of this study, situated in the northern and central regions of Portugal, show Humid and Rainy Sub-Humid climates (B and C2) characterized by moderate to severe water scarcity during the summer months. On the other hand, the southern region is characterized by Dry Sub-Humid Climates (C1), showing moderate to high water surplus during the winter season. Also, in both regions, the humidity increases in proximity to mountain ranges and decreases with distance from the Atlantic coast. The 2nd letter of the Thornthwaite climatic classification refers to thermal efficiency, which is the sum of potential evapotranspiration (EPT) ranging from A’/Megathermal to E’/Frost (corresponding to ∑PET ≥ 1140 mm vs < 142 mm, respectively). According to this, all provenances in this study are classified as B’2 (Mesothermal), corresponding to the range 712 ≤ ∑PET < 855 mm. The 3rd letter of the Thornthwaite climatic classification refers to the Aridity index and Humidity index for humid (A, B, C2) and dry (C1, D, E), climates respectively. Accordingly, in Portugal, mainly in the northern and mountainous areas: i) Humid and Subhumid climate group (1st Letter A, B or C2): s means moderate water deficiency in summer; and s2 corresponds to severe scarcity of water in summer); ii) Dry climate group (1st letter C1 or D): s means moderate excess water in winter; and s2 corresponds to high water excesses in the winter season. The 4th letter of the Thornthwaite climatic classification refers to the summer concentration of thermal efficiency, which is calculated in percentage of the sum of the potential evapotranspiration during the three months showing the highest temperature. According to this and due to Atlantic influence, the summer concentration of thermal efficiency is low (25-48%) for all provenances [45,49]. It should be noted, however, that extreme temperatures associated with heatwaves may occur during the summer months, especially in the southern inland regions.
2.2. Methodology for Sugar Contents Analysis
The strawberry tree fruits were harvested from the different accessions during the autumn, at the phenological development stage L (ripening/harvesting), as previously proposed [46,50], based on the findings of studies conducted on other fruit species [51,52]. The fruits were placed in plastic boxes and transported under refrigerated conditions (4ºC).
In the laboratory, fifteen fruits were randomly selected from each accession (Figure 2). The fruit pulp was extracted using a procedure previously proposed by J. Anastácio [53]. Briefly, a raw cloth was used to separate the seeds and sclerenchyma from the pulp, with the aim of obtaining a final weight of 200g of fruit pulp (Figure 2) for the analysis of sugar content by high-performance liquid chromatography (HPLC). The abundance of sclereids and lignin in the fruit pulp may have been a contributing factor to the necessity for this procedure [22].
For sugar content analysis, 2.5 g of the strawberry tree fruit pulp was dissolved in distilled water and stirred for 30 minutes. The mixture was then filtered through filter paper into a volumetric flask, and the final volume was adjusted to 100 mL. The resulting solution was further filtered through a 0.45 µm membrane filter before being injected into the HPLC system.
Sugar quantification was performed using high-performance liquid chromatography with refractive index detection (HPLC-RI). The system included an LC-1110 pump (GBC, Australia), LC-100 oven (Perkin-Elmer, USA), 830-RI refractive index detector (Jasco, Japan), and an HC-75 Ca++ 305 × 7.8 mm column (Hamilton, USA). The mobile phase was ultrapure water with traces of sodium azide, at a flow rate of 0.6 mL/min and a temperature of 80ºC. The quantification of glucose, fructose, maltose, and sucrose was carried out using BioUltra standards (Sigma-Aldrich, St. Louis, MO, USA). Data were collected using an Interface Hercule Lite (JMBS) and processed with Borwin Chromatography Software, version 1.5, build 16 (Jasco-Borwin, Japan). Three replicates were performed per sample.
2.3. Data Processing and Statistical Analysis
The statistical analysis was conducted using STATISTICA 12.0. As there was no normal distribution of the sugar contents, these were transformed into Logaritms on base 10, after which the normal distribution was confirmed (P>0.05, Shapiro-Wilks Test), followed by the analysis of variance (ANOVA) to evaluate the effect of different edaphoclimatic variables on the fruit sugar content. When significant differences were observed, the means were compared using the Tukey test (P < 0.05) [54]. Other complementary approaches were tested: multiple linear regression and a principal component analysis (PCA). For the multiple linear regression analysis, the effect of the different variables on the total sugar content (Log10) was evaluated, considering the edaphoclimatic characteristics as independent variables (Xi). To identify the linkage between the total sugar content and site characteristics a principal component analysis (PCA) was performed. For the PCA, 14 variables were analyzed to achieve a better understanding of the interactions between them and their significance level for the total variance.
3. Results
3.1. Analysis of Fruit Sugar Content of Accessions from Different Provenances
Table 2 presents the sugar content characterization of the fresh pulp of the A. unedo fruit, from the 204 accessions of different provenances. The concentrations of sugars (expressed in grams per 100 grams of fresh pulp) decreased in the following order: fructose, the most abundant sugar, followed by glucose and residual contents of maltose and sucrose. The mean values of fructose ranged from 7.89±0.55% to 17.01±1.46%, followed by glucose, which ranged from 3.98±0.11% to 6.80±0.26%. Then, residual values of maltose and sucrose were observed, ranging from undetected to 3.73±0.53% and from undetected to 1.58±0.15%, respectively.
Regarding the mean value of sugar per provenance, the location ODM-Cortes Pereira exhibited the highest mean values for fructose (17.01±1.46%), reducing sugars (26.56±2.31%) and total sugar (27.07±2.30%). However, no statistically significant differences (P>0.05) were observed regarding the remaining provenances that received producers’ support for the identification of accessions, with the exception for ODM-Trancão and ODM-Cerca dos Pomares and Penha Garcia (Table 2). In contrast, the lowest concentration of the reducing sugars, mainly fructose and glucose, was observed in the TM-Fisgas de Ermelo, TM-Mosteiró and Barrocal. The former two cases are associated with the high precipitation rates and the lower average temperatures, while the latter exhibits the highest xerothermic index / number of dry days (Table 1).
3.2. Sugar Content and Its Relation to Climatic Classifications and Edaphic Characteristics
The correlation between the sugar content of fresh pulp of the A. unedo fruit and the climatic classification of the respective accession regions, as determined by the xerothermic index, is presented in Table 3.
In accordance with the 3.1 preceding discussion, Table 3 illustrates that the highest mean values of reducing and total sugar (respectively, 19.61±0.46% and 20.39±0.47%) and fructose (12.79±0.29%) were observed in the provenance group classified as Accentuated Mesomediterranean (133 accessions), which includes the ODM-Cortes Pereira provenance and its 15 accessions. Furthermore, these elevated sugar contents are statistically significantly different (P<0.05) when compared to the provenances from other climatic classifications (71 accessions).
With regard to the glucose, the highest mean value (5.40±0.12%) is also observed in the Accentuated Mesomediterranean region, despite no significant differences (P>0.05) being identified when provenances from Attenuated Mesomediterranean (TM-Mosteiró and S. Mamede) were compared (Table 1 and Table 3).
In contrast, the lowest fructose value was observed in Barrocal, a provenance classified as Attenuated Thermomediterranean (7.89±0.55%), with no significant differences (P>0.05) identified when compared to the TM-Fisgas de Ermelo provenance (TM-FE) from a Sub-Mediterranean climate (8.66±0.42%) (Table 3). The climatic classification based on the xerothermic index reveals that Barrocal, the southernmost provenance under consideration in this study, is not included in the climatic region of the remaining southern provenances. This exclusion may be attributed to the highest number of dry days (118.18) observed in this region. However, the second lowest fructose value was observed in the TM-FE, situated at the northernmost point of Portugal and in a Sub-Mediterranean climate. This was despite the lowest number of dry days (42.40), but due to the highest annual precipitation value (1390.5 mm vs. to Barrocal, 697.0 mm) and the lowest annual temperature (13.4ºC vs. 15.9ºC).
Table 4 presents the classification of the various provenances of the A. unedo accessions, differentiated into 6 climatic regions according to the Thornthwaite climatic classification [45], and shows the correlation between the sugar content of the fresh pulp of the fruits and the corresponding climate classification of the regions of origin.
According to this new classification criterion, the highest mean values were observed in C1 B’2 s2 a’ climatic region corresponding to the 15 accessions of ODM-Cortes Pereira provenance (Table 2 and Table 4) with fructose 17.01±1.46%, reducing sugars of 26.56±2.31% and total sugar of 27.07±2.30 %, with significant differences (P<0.05) compared to the values of reducing and total sugars observed in all the other provenances (Table 4). Although, for fructose values no significant differences were found when compared to the provenances of ODM-Cerca dos Pomares and Cadaval (7 accessions, Table 1 and Table 4), both included in C2 B’2 s a’, according to the Thornthwaite method (Table 1 and Table 4). Thus, in the Thornthwaite classification the ODM-Cortes Pereira provenance is distinguished from the other southern provenances. On the contrary, Barrocal was included together with ODM -Pomba and ODM -Nave Redondo, in the same climatic region C2 B’2 s2 a’ (46 accessions in total, Table 1 and Table 4).
Also, for the lowest fructose results, the Thornthwaite classification does not discriminate Barrocal provenance, for which the lowest reducing and total sugar contents were assigned to the strawberry tree fruits in the climatic regions B4 B´2 s a’ and B3 B’2 s2 a2, corresponding to the provenances of TM-FE and TM-Mosteiró, respectively (Table 1). Both provenances show humid climates with a high water index (B4, B3), with moderate (s) to large (s2) water deficit in summer, respectively TM-FE and TM -Mosteiró.
Following several iterations of the linear regression analysis, the results indicate a stronger correlation between the total sugar content of fruits and the climate classification according to the xerothermic index than that indicated by the Thornthwaite method (results not shown). In conclusion, fourteen variables, related to edaphoclimatic characteristics such as: local/provenance, annual averages of precipitation and temperature, altitude, xerothermic index, sun exposure, light conditions, soil texture, soil pH, longitude & latitude, allocation (inland vs coast), humidity index and climatic classification (according to xerothermic index) were chosen. Table 5 shows the results of the multiple regression analysis of the dependent variable, total sugar content (Log10 % f.w.), as a function of the above referred fourteen variables, showing a correlation coefficient (R) of 0.671 for the total of 204 sample accessions.
As presented in Table 5, the results of the analysis indicate that precipitation, xerothermic index, soil pH, climatic classification according to xerothermic index and humid index (Ihu) (P < 0.05) are the independent variables that most influence on total sugar content. In particular, a statistically significant decrease in total sugar content is observed with the concomitant increase of these variables (P < 0.05), with the exception of the Ihu. Furthermore, it can be observed that annual precipitation and Ihu are the most significant independent variables, as both have the highest absolute values for the coefficient of determination (b). Thus, the results of the linear regression analysis corroborate the findings presented in the preceding discussion. According to the climatic classification based on the xerothermic index, the lowest total sugar values were observed in the two northernmost and in the southernmost origins included in this study. It was observed that the highest annual precipitation, associated to the lowest number of dry days (lowest xerothermic index), was recorded in the provenances TM-FE and TM-Mosteiró. Conversely, in Barrocal, despite the highest number of dry days, as indicated by the highest value of the xerothermic index, the lowest Ihu value and low precipitation resulted in the lowest total sugar content. This was a consequence of the limited availability of water, which in turn impeded photosynthesis and the synthesis of sugars.
A negative coefficient, meaning an inverse relationship, was identified between the soil pH parameter (1-5, corresponding to pH <4 to pH >9) and the dependent variable. In the present study, only one provenance had a soil pH value of 4, indicating a soil pH between 7.5 and 9.0, which was Barrocal. Notwithstanding the lowest sugar content observed in the Barrocal (20 accessions; Table 2), three out of four provenances with a soil pH value of 2 (pH=4-5.4; TM-FE, S. Mamede and Penamacor) exhibited total sugar contents that were also inferior to the general mean value (18.47±0,44 % f.w.). The exception is Monchique (21.34±0,97 % f.w.), confirming the relevance of producers to identify the plants. To analyze the relationship among the total sugar content (Log10% f.w.), site features (provenance, latitude, longitude, altitude, sun exposure, light conditions), edaphoclimatic characteristics (annual precipitation and temperature, humidity index, xerothermic index, soil texture, pH) and both climatic classifications (Thornthwaite method and xerothermic index) a principal component analysis (PCA) was performed, considering a total of 15 variables (Figure 3).
The PCA analysis explains 63.82% of the total variance observed (of 15 variables), being 34.5%, 15.7% and 13.7% linked to the variables associated to the factors 1 to 3, respectively (Figure 3, on the left table).
Factor 1 shows a direct relation among annual precipitation (mm), light conditions (levels 1-3), latitude, and humidity index (Ihu). All these variables show a high negative coefficient factor loading (> -0.70) and are inversely related to the xerothermic index (>0.70), and with annual temperature and provenance (factor >0.61). Factor 1 also shows that plants prospected and harvested on light conditions 3 (which means under canopy of forest trees) are located, mostly, in the northern regions of the Tagus River (higher latitude), corresponding to areas of natural regeneration, characterized by the presence of wild plants.
Factor 2 shows the direct relationship between longitude and altitude, i.e., inland (with higher longitude) plants identified and harvested are located predominantly in mountainous regions (higher altitude).
Factor 3 confirms the relevance of climate classification by the xerothermic index (high factor loading) in total sugar content (>0.61; left Table on the Figure 3), indicating that climate classification by the xerothermic index, compared to Thornthwaite Climatic Classification, allowed a better discrimination of the potential of the different provenances on fruit sugar content (considering a total of 14 provenances and 204 accessions). These outcomes corroborate the results presented in Table 1, Table 2, Table 3 and Table 4.
3. Discussion
There have been several recent studies on the sugar content of Arbutus fruits harvested throughout the circum-Mediterranean region, as this is one of the main quality differentiating parameters of the fruit [..]. In our study, all samples (204) of fresh fruit pulp analyzed were found in decreasing order of fructose, ranging from 7.89- 17.01% w/w, followed by glucose 3.98-6.80%, then maltose n.d.- 3.73%, and sucrose n.d.- 1.58% w/w. Similar results, concerning the sugar content order, were found in Spain [24] with values, also per fresh weight, of fructose (3.65%-12.34% w/w), glucose (2.34%-6.50%) and sucrose (n.d.-0.48% w/w). However, three out of the fourteen provenances in our study (37 out of 204 accessions) showed an average fructose content above the upper limit of the range found in Spain [24], especially as they were among the eight provenances identified by the producers, in cultivated or wild plants. These results show the importance of producer support in identifying plants with high-sugar fruit, thereby enhancing fermentation yield for the production of brandy or liqueur [14,55], the primary source of income of the producers. The same trend in sugar content was observed in Turkey. In a study by Ayaz et al. [56], where the average dry weight percentages of fructose, glucose, sucrose and maltose, from young trees, were 27.8, 21.5, 1.8 and 1.11% w/w, respectively. And, in a survey study by Seker & Toplu [57] in five natural areas for two consecutive years (showing no significant differences), where the dry weight percentages of fructose, glucose and sucrose were 24.09, 19.09 and 2.65% w/w, respectively. As the percentages in these two Turkish studies are relative to dry weight, they represent a significant increase in sugar content compared to the present study. Vidrih et al. [58] also observed comparable sugar content in fresh pulp fruit when compared to us. Their findings were obtained from three wild-growing tree in Croatia and indicated a fructose concentration of 17.2% and glucose 6.2% w/w. Also, in a study by Boussalah et al. [61] during two consecutive years and from four areas on the Atlas Mountains, in Algeria, fructose and glucose were found in fresh pulp ranging from 5.5%–8.4% w/w and 2.9%-5.2% w/w, below to those we had observed. In Portugal, Alarcão-e-Silva et al. [60] studied the influence of the fruit ripening stage on the sugar content. On a dry-weight basis, they found that fructose content ranged from 2.33% to 20.8% in unripe and ripe fruits, respectively. While glucose values ranged from 3.95% to 12.5%. However, no significant differences were found in sucrose content (8.77%-8.68%). Our study finds similar results considering the red mature fruits (results not shown). In the study of ripe fruit by Ait Lhaj et al. [62], they found higher glucose contents in 2–7 trees of 12 provenances from five Moroccan regions (45 samples) in all provenances. Also on a dry weight basis, they found glucose contents ranging from 11.57%-15.17%, followed by fructose contents ranging from 8.73%-13.08%, and with lower sucrose contents ranging from 4.16%-8.11% w/w. To the best of our knowledge, this was the only study to contradict the order of sugar content, reporting higher glucose content than fructose content.
Doukani & Tabak [59] determined the total and reducing sugars in fresh fruit pulp from two different origins (Tiaret and Tlemcen / Atlas Mountain) in Algeria, using a colorimetric method. The observed values were 8.9-14.0% and 7.0-9.3% w/w, respectively, finding significant differences only in the total sugars, quite inferior to our mean values of 18.5% and 17.8% w/w for total and reducing sugars, respectively, maybe due to the photosynthesis reduction linked to the altitude and temperature, as observed in our study. In our study, the lowest values of reducing sugars were observed in the northernmost (TM-FE, Fisgas de Ermelo, and TM-Mosteiró) and southernmost (Barrocal) provenances. The lowest values in the northernmost provenances are associated with reduced photosynthesis, which is a consequence of the diminished photoperiod at higher latitudes and the lower temperatures experienced during fruit ripening in autumn [32]. In contrast, the lower sugar contents in Barrocal are associated with the highest number of dry days/xerothermic index, indicating low water availability for photosynthesis during growth active period (spring and summer). In addition, the region is characterized by calcareous soils, rich in clay, which tend to retain water, reducing its bioavailability. In both situations, the reduction in sugar content is due to the reduction in photosynthesis, especially, in relation to the active growth phases, in spring–summer, for the Barrocal, where the main limiting factor is the water availability [44,48], and in autumn, during the fruit maturation period [32], for TM-FE and TM-Mosteiró provenances, where the main limiting factors are reduced photoperiod and low temperature.
From the climate classification perspective by the xerothermic index [44] these results are also corroborated. Thus, the highest reducing sugar contents were observed in regions integrated into the Accentuated Mesomediterranean region, as well as in accessions identified by the producers for their fruit production and quality. On the other hand, TM- FE, TM-Mosteiró and Barrocal are three of four provenances not included in Accentuated Mesomediterranean region, but included in different regions, classified as Sub-Mediterranean, Attenuated Mesomediterranean and Attenuated Thermomediterranean, respectively.
Ruiz-Rodríguez et al. [24] found that the sugar content, mainly fructose and glucose, was dependent on the year of harvesting (three consecutive years of ripening), environmental conditions of the two natural areas, and particularly water availability. Additionally, these authors suggest that the invertase may explain the low levels of sucrose, which we also observed in our study, although it cannot explain the higher level of fructose compared to glucose. The highest levels of fructose may be linked to the sweetest fruit taste [24], which is an add value for markets, such as fruit for fresh consumption.
According to the climate classification of the xerothermic index [44], the lowest fructose values were observed in the Attenuated Thermomediterranean, the southernmost provenance, Barrocal (7.89%), without significant differences compared to the Sub-Mediterranean, the northmost provenance, TM-FE (8.66%). According to the classification of the xerothermic index, the Barrocal provenance is included in a different climatic region from all the southern provenances, due to the high number of dry days (118.18). Similar results were reported by Molina et al. [63], who studied the fruit production of A. unedo, over two consecutive years, in two different ecological conditions in Spain, founding that fruit production was influenced by water availability and summer drought.
In the southern provenances were observed the highest mean values, particularly in ODM-Cortes Pereira (fructose 17.01±1.46%, reducing sugars of 26.56±2.31% and total sugar of 27.07±2.30% w/w) encompassed in an Accentuated Mesomediterranean climate, which comprise the provenances with the best results of sugar content.
On the other hand, TM-FE, at the northernmost point of Portugal, also in a different climate region by xerothermic index [44] (Sub-Mediterranean), shows the second lowest fructose value despite the number of the lowest dry days (42.40), because of the highest annual precipitation value (1390.5 mm, compared to Barrocal, 697.0 mm), lower temperature and photoperiod during autumn affecting flowering, and particularly, the fruit maturation [32,46]. Similar results were obtained by Molina et al. [63], who reported differences in fruit production and the number of fruits per branch over the years due to the risk of frost and low minimum temperatures in autumn. In this season, the flowering phase (autumn-0), the subsequent production and fruit maturation (autumn-0+1), as well as the ripening of the previous year's fruits are involved and negatively affected, which is consistent with our results.
On the other hand, according to the climatic classification of Thornthwaite [45], the highest mean values of reducing and total sugars were observed in the 15 accessions of ODM-Cortes Pereira provenance classified as C1B’2s2a’, exhibiting significantly higher levels compared to all other provenances. However, no significant differences were observed in the fructose content when compared to the provenances ODM-Cerca dos Pomares and Cadaval, both classified as C2B’2sa’, according to the Thornthwaite climatic classification [45]. Conversely, according to the Thornthwaite method [45], the lower results for fructose, reducing and total sugars were observed in regions B4B´2sa’ and B3B’2s2a2, corresponding to the northernmost provenances of this study, namely TM-FE and TM-Mosteiró. Both provenances show a humid climate with a high water index (B4, B3), with moderate (s) to large (s2) water deficit in summer, respectively TM-FE and TM-Mosteiró. These results confirm those previously observed and are in line with the conclusions of the xerothermic index [44]. However, unlike the xerothermic index climate classification [44], Thornthwaite’s climate classification [45] does not discriminate the lower results observed in Barrocal with the highest number of biologically dry days [44,48], since it was assembled in the same region C2B’2s2a’ as the ODM-NR and ODM-Pomba provenances. It therefore appears that the xerothermic index establishes a better relationship between climate classification and sugar content, particularly for the results observed for fructose, the predominant sugar in fruit pulp (in 14 provenances, N=204). In addition, the xerothermic index is considered in the literature [44] to be the most accurate for the Mediterranean climates, as it distinguishes regions according to the number of biologically dry days, which could explain the results of lower fructose content in Barrocal, despite its southern location. In our study, the multiple regression analysis confirms the inverse dependence of the total sugar content (P < 0.05) on precipitation, xerothermic index, soil pH and the climatic classification by xerothermic index [44]). Therefore, the highest number of biologically dry days observed in Barrocal [44,48], together with the highest pH (limestone area), are associated with the lowest water bioavailability, reducing photosynthesis and sugar synthesis, as previously mentioned.
Therefore, for species intolerant to excess water, such as A. unedo [64], the results of this study suggest an additional care for the local selection for the orchards, particularly in limestone regions or areas with soils showing higher content of clay.
On the other hand, the lowest number of dry days (lowest xerothermic index) observed in TM-FE and TM-Mosteiró are associated with the maximum precipitation value, giving this variable the highest negative coefficient (b), which is determinant of the lower total sugars observed [54,65]. Similar results have also been described by Molina et al. [63], as mentioned above. In the northernmost sites, to mitigate the high precipitation, low temperature and reduced photoperiod, orchards or wild plants should be oriented S-SW, in areas not subject to flooding, with wind protection, and not under the canopy to promote entomophilous pollination in the 1st autumn, active fruit growth during the spring-summer seasons, and finally fruit ripening in the 2nd autumn [32,66].
In the PCA analysis, the factor 1 shows that our sampling, in the center and north of the country (higher latitude), above the Tagus River, occurred mostly in areas of natural regeneration, characterized by the presence of wild plants, under canopy, which describes quite well the reality of these areas, due to the main land forestry use for wood production of Eucalyptus globulus and Pinus pinaster, which is one of the most important economic activity, associated to the major land use [67,68]. However, either small forest producers (main own landowners) or cellulose enterprises, are becoming aware of the importance of autochthonous species on protection of forest and interurban space [69]. Arbutus unedo is becoming one of the autochthonous species most requested in Portugal by stakeholders on nurseries to be established as orchards and as green firebreaks [12]. The PCA analysis (factor 2) highlights that prospected and harvested plants inland were predominantly in mountainous regions. The PCA analysis (factor 3) corroborates once again the relevance of climate classification by the xerothermic index on predicting the total sugar content. The highest total sugar contents were observed in regions integrated into the Accentuated Mesomediterranean (xerothermic index-based classification), which correspond to ten provenances (71.4%, 133 accessions). In eight of these ten provenances (57.1%, 84 accessions), the accessions, both cultivated and wild plants, were identified with the owners' support. The provenances included in this climatic region (Accentuated Mesomediterranean) are in the center and southern regions of Portugal, except for two (Barrocal and S. Mamede). Barrocal (the southernmost provenance) shows a high xerothermic index (number of dry days; 118.18), and belongs to the Attenuated Thermomediterranean region. On the other hand, S. Mamede is within Attenuated Mesomediterranean region, due to the oceanic influence, associated with altitude (mountain located inland of Portugal but preceded by a flat extension, Podzois).
The correlation found allows discriminate potential of the diverse provenances in terms of fruit sugar content (considering a total of 14 provenances and 204 accessions), thereby providing an effective instrument for the main regional constraints in the pursuit of optimal solutions for the establishment of orchard or the management of natural areas with wild plants for fruit production.
4. Conclusions
To survey and collect the genetic diversity of cultivated and wild plants of A. unedo for subsequent characterization of their sugar content, a total of 204 accessions were prospected and fruits were harvested in 14 sites/provenances in Portugal.
The predominant sugar in fruit was fructose. The presence of sucrose was residual, inducing a content of total sugars equivalent to that of reducing sugars. Fructose content in fruits is relevant for its commercialization as transformed products (brandy and others) and for consumption as a fresh fruit.
The lowest recorded values of sugar were observed in three provenances: the two northernmost locations (TM-FE and TM-Mosteiró) and the third, the Barrocal (the southernmost provenance and situated in a limestone zone). In the northern regions, the low sugar contents are attributable to elevated precipitation, low temperature, and higher latitude (photoperiod reduction), which, despite higher soil water availability, result in a reduction in sugar synthesis, particularly during the phase of fruit maturation (autumn). In the southern region, the low sugar contents are due to the number of dry days, linked to lower soil water availability, particularly in limestone zones (due to water retention by clay-rich soils). The findings of this study demonstrate the significance of investigating the relationship between sugar content, edaphoclimatic characteristics and climatic classification by xerothermic index. This is with a view to enhancing fruit production, providing guidance on the establishment of new orchards and facilitating the restoration of natural areas. This has the potential to enhance outcomes such as soil erosion protection, wildfire spread prevention and reforestation programs, as a resilient species that supports other autochthonous tree species in the subsequent stages of ecological succession.
The climatic classification by xerothermic index proved an effective tool for distinguishing the potential of each provenance regarding fruit sugar content production, as well as for identifying regional limitations. This approach offers valuable insights into the establishment of new orchards and management of natural areas. So, it is recommended that orchards or natural regions in the northernmost regions be oriented S-SW, in areas not subject to drenching, with wind protection, and not under canopy. In contrast, for the southernmost regions, particularly limestone zones, orchards or natural regions should be in areas with higher water availability, without drenching, and probably under canopy.
Author Contributions
Conceptualization, F.G., J.V. and M.N.; methodology F.G., J.V. and M.N., S.R.; software F.G.; J.V., S.R., M.N., L.O.; validation F.G., M.V., M.N.; formal analysis F.G., M.V., J.V., M.N., S.R.; investigation F.G.; J.V., S.R., M.N., L.O., L.C.C.; resources F.G., M. V.; data curation: S.R., S.S., L.O., L.C.C.; writing—original draft preparation F.G. and M.V.; writing—review and editing F.G., M.V., S.R., M.N.; visualization F.G., M.V. S.R. and L.C.C.; supervision: F.G., M.V., J.V. and S.R.; project administration F.G., J.V., S.R., funding acquisition: F.G., M.V. and S.S. All authors have read and agreed to the published version of the manuscript
Funding
This research was co-financed by the European Union, through the European Agricultural Fund for Rural Development, under the partnership agreement Portugal 2020-Rural Development Program, project PDR2020-784-042742, Genetic Resources, Conservation and Plant Breeding for the strawberry tree (Arbutus unedo L) and Consortium TransForm-WP1-P1. 1 “Genetic improvement and forest materials for reproduction of native species”, project no. C644865735-00000007, in scope of the Mobilization Agendas for Business Innovation (Notice no. 02/C05-i01/2021), supported by the Recovery and Resilience Plan and the Next Generation EU European Funds.
Data Availability Statement
Not applicable.
Acknowledgments
The authors thank all their colleagues and students, particularly Andreia Francisco, for their assistance in the research for this study. The authors also thank the Portuguese Foundation for Science and Technology (FCT) for the financial support to the Research Centre for Natural Resources, Environment and Society/CERNAS (UIDB/00681/2020; DOI: 54499/UIDP/10.00681/2020).
Conflicts of Interest
The authors declare no conflict of interest.
References
- Miguel, M.G.; Faleiro, M.L.; Guerreiro, A.C.; Antunes, M.D. Arbutus Unedo L.: Chemical and Biological Properties. Molecules 2014, 19, 15799–15823. [CrossRef]
- Oliveira, I.; Baptista, P.; Bento, A.; Pereira, J.A. Arbutus Unedo L. and Its Benefits on Human Health. J. Food Nutr. Res 2011, 50, 73–85.
- Salem, I. Ben; Ouesleti, S.; Mabrouk, Y.; Landolsi, A.; Saidi, M.; Boulilla, A. Exploring the Nutraceutical Potential and Biological Activities of Arbutus Unedo L. (Ericaceae) Fruits. Ind Crops Prod 2018, 122, 726–731. [CrossRef]
- Fortalezas, S.; Tavares, L.; Pimpão, R.; Tyagi, M.; Pontes, V.; Alves, P.M.; Mcdougall, G.; Stewart, D.; Ferreira, R.B.; Santos, C.N. Antioxidant Properties and Neuroprotective Capacity of Strawberry Tree Fruit (Arbutus Unedo). Nutrients 2010, 2, 214–229. [CrossRef]
- Hileman, L.C.; Vasey, M.C.; Thomas Parker, V. Phylogeny and Biogeography of the Arbutoideae (Ericaceae): Implications for the Madrean-Tethyan Hypothesis. Syst Bot 2001, 26, 131–143. [CrossRef]
- Torres, J.A.; Valle, F.; Pinto, C.; Garcia-Fuentes, A.; Salazar, C.; Cano, E. Arbutus Unedo Communities in Southern Iberian Peninsula Mountains. Plant Ecol. 2002, 160, 207–223. [CrossRef]
- Konstantinidis, P.; Tsiourlis, G.; Xofis, P. Effect of Fire Season, Aspect and Pre-Fire Plant Size on the Growth of Arbutus Unedo L. (Strawberry Tree) Resprouts. For Ecol Manage 2006, 225, 359–367. [CrossRef]
- Gomes, B.; Castro, F.; Santos, R.; Figueiredo, P.; Silva, M.; Vidal, M.; Ferreira, I.; Nunes, J.; Machado, H.; Gomes, F. Effect of Quercetin on Mycorrhizal Synthesis between Tuber Borchii and Arbutus Unedo L. In Vitro Plants. Microbiology Research 2021, 12.
- Richard, F.; Selosse, M.-A.; Gardes, M. Facilitated Establishment of Quercus Ilex in Shrub-Dominated Communities within a Mediterranean Ecosystem: Do Mycorrhizal Partners Matter? . FEMS Microbiol Ecol 2009, 68, 14–24. [CrossRef]
- Azcón-Aguilar, C.; Palenzuela, J.; Roldán, A.; Bautista, S.; Vallejo, R.; Barea, J.M. Analysis of the Mycorrhizal Potential in the Rhizosphere of Representative Plant Species from Desertification-Threatened Mediterranean Shrublands; 2003; Vol. 22;.
- Arnan, X.; Quevedo, L.; Rodrigo, A. Forest Fire Occurrence Increases the Distribution of a Scarce Forest Type in the Mediterranean Basin. Acta Oecologica 2013, 46, 39–47. [CrossRef]
- Oliveira, A.S.; Silva, J.S.; Guiomar, N.; Fernandes, P.; Nereu, M.; Gaspar, J.; Lopes, R.F.R.; Rodrigues, J.P.C. The Effect of Broadleaf Forests in Wildfire Mitigation in the WUI – A Simulation Study. International Journal of Disaster Risk Reduction 2023, 93. [CrossRef]
- Floris, I.; Satta, A.; Ruiu, L. Honeys of Sardinia (Italy). J Apic Res 2007, 46, 198–209. [CrossRef]
- Botelho, G.; Gomes, F.; Ferreira, F.M.; Caldeira, I. Influence of Maturation Degree of Arbutus (Arbutus Unedo L.) Fruits in Spirit Composition and Quality. International Scholarly and Scientific Research & Innovation 2015, 9 (6), 615–620.
- Ulloa, P.A.; Maia, M.; Brigas, A.F. Physicochemical Parameters and Bioactive Compounds of Strawberry Tree (Arbutus Unedo L.) Honey. J Chem 2015, 2015. [CrossRef]
- Pallauf, K.; Rivas-Gonzalo, J.C.; Del Castillo, M.D.; Cano, M.P.; Pascual-Teresa, S. Characterization of the Antioxidant Composition of Strawberry Tree (Arbutus Unedo L.) Fruits. J. Food Compos. Anal. 2008, 21, 273–281. [CrossRef]
- Tavares, L.; Fortalezaa, S.; Carrilho, C.; McDougall, G.J.; Stewart, D.; Ferreira, R.B.; Santos, C. Antioxidant and Antiproliferative Properties of Strawberry Tree Tissues. Journal Berry Research 2010, 1, 3–12. [CrossRef]
- Scarano, P.; Guida, R.; Zuzolo, D.; Tartaglia, M.; Prigioniero, A.; Postiglione, A.; Pinto, G.; Illiano, A.; Amoresano, A.; Schicchi, R.; et al. An Endemic Plant of the Mediterranean Area: Phytochemical Characterization of Strawberry Tree (Arbutus Unedo L.) Fruits Extracts at Different Ripening Stages. Front Nutr 2022, 9. [CrossRef]
- Izcara, S.; Morante-Zarcero, S.; Casado, N.; Sierra, I. Study of the Phenolic Compound Profile of Arbutus Unedo L. Fruits at Different Ripening Stages by HPLC-TQ-MS/MS. Applied Sciences (Switzerland) 2021, 11. [CrossRef]
- Fonseca, D.F.S.; Salvador, Â.C.; Santos, S.A.O.; Vilela, C.; Freire, C.S.R.; Silvestre, A.J.D.; Rocha, S.M. Bioactive Phytochemicals from Wild Arbutus Unedo L. Berries from Different Locations in Portugal: Quantification of Lipophilic Components. Int J Mol Sci 2015, 16. [CrossRef]
- Selen Isbilir, S.; Hulya Orak, H.; Yagar, H.; Ekinci, N. Determination of Antioxidant Activities of Strawberry Tree (Arbutus Unedo L.) Flowers and Fruits at Different Ripening Satges; 2012; Vol. 11;.
- Marques, M.P.; Martin, D.; Bosch, M.; Martins, J.; Biswal, A.; Zuzarte, M.; de Carvalho, L.B.; Canhoto, J.; da Costa, R. Unveiling the Compositional Remodelling of Arbutus Unedo L. Fruits during Ripening. Sci Hortic 2022, 303. [CrossRef]
- Özcan, M.M.; Haciseferogullan, H. The Strawberry (Arbutus Unedo L.) Fruits: Chemical Composition, Physical Properties and Mineral Contents. J Food Eng 2007, 78, 1022–1028. [CrossRef]
- Ruiz-Rodríguez, B.M.; Morales, P.; Fernández-Ruiz, V.; Sánchez-Mata, M.C.; Cámara, M.; Díez-Marqués, C.; Pardo-de-Santayana, M.; Molina, M.; Tardío, J. Valorization of Wild Strawberry-Tree Fruits (Arbutus Unedo L.) through Nutritional Assessment and Natural Production Data. Food Research International 2011, 44, 1244–1253. [CrossRef]
- Oliveira, I.; Pinho, P.G.; Malheiro, R.; Baptista, P.; Pereira, J.A. Volatile Profile of Arbutus Unedo L. Fruits through Ripening Stage. Food Chem 2011, 128, 667–673. [CrossRef]
- Celikel, G.; Demirsoy, L.; Demirsoy, H. The Strawberry Tree (Arbutus Unedo L.) Selection in Turkey. Sci. Hort. 2008, 118, 115–119. [CrossRef]
- Oliveira, I.; Baptista, P.; Malheiro, R.; Casal, S.; Bento, A.; Pereira, J.A. Influence of Strawberry Tree (Arbutus Unedo L.) Fruit Ripening Stage on Chemical Composition and Antioxidant Activity. Food Research International 2011, 44, 1401–1407. [CrossRef]
- Morales, D. Use of Strawberry Tree (Arbutus Unedo) as a Source of Functional Fractions with Biological Activities. Foods 2022, 11. [CrossRef]
- Botelho, G.; Anjos, O.; Estevinho, L.M.; Caldeira, I. Methanol in Grape Derived, Fruit and Honey Spirits: A Critical Review on Source, Quality Control, and Legal Limits. Processes 2020, 8, 1–21. [CrossRef]
- Galego, L.; Botelho, G.; Da Silva, J.P. Arbutus Unedo L. Fruit Distillates and the Requirement for Further Quality Specifications. In Proceedings of the 12th Meeting on Food Chemistry; Lisboa, 2014; p. 191.
- Caldeira, I.; Gomes, F.; Mira, H.; Botelho, G. Distillates Composition Obtained of Fermented Arbutus Unedo L. Fruits from Different Seedlings and Clonal Plants. Annals of Agricultural Sciences 2019, 64, 21–28. [CrossRef]
- Franco, J. O Medronho - Da Planta Ao Fruto, as Práticas Culturais. Actas Portuguesas de Horticultura - Jornadas do Medronho 2012, 22, 18–25.
- Šic Žlabur, J.; Bogdanović, S.; Voća, S.; Skendrović Babojelić, M. Biological Potential of Fruit and Leaves of Strawberry Tree (Arbutus Unedo L.) from Croatia. Molecules 2020, 25, 5102. [CrossRef]
- Pato, R.L.; Botelho, G.; Franco, J.; Santos, S.; Ressurreição, S.; Figueiredo, P.; Gama, J.; Gomes, F. Interaction between Farming Type, Nutrient Uptake and Plant Material in Strawberry Tree Fruit Production and Quality. In Proceedings of the Acta Horticulturae; International Society for Horticultural Science (ISHS), Leuven, Belgium, January 31 2022; pp. 275–284.
- INIAV Plano Nacional Para Os Recursos Genéticos Vegetais; Ministério da Agricultura e do Mar, Ed.; INIAV: Lisboa, 2015;
- Ribeiro, M.M.; Piotti, A.; Ricardo, A.; Gaspar, D.; Costa, R.; Parducci, L.; Vendramin, G.G. Genetic Diversity and Divergence at the Arbutus Unedo L. (Ericaceae) Westernmost Distribution Limit. PLoS One 2017, 1–15.
- Gomes, F.; Costa, R.; Ribeiro, M.M.; Figueiredo, E.; Canhoto, J.M. Analysis of Genetic Relationship among Arbutus Unedo L. Genotypes Using RAPD and SSR Markers. J For Res (Harbin) 2013, 24, 227–236. [CrossRef]
- Gomes, F.; Simões, M.; Lopes, M.L.; Canhoto, J.M. Effect of Plant Growth Regulators and Genotype on the Micropropagation of Adult Trees of Arbutus Unedo L. (Strawberry Tree). N Biotechnol 2010, 27, 882–892. [CrossRef]
- Gomes, F.; Gama, J.; Figueiredo, P.; Clemente, M.; Plácito, F.; Pato, R.L.; Botelho, G.; Franco, J.; Nazaré, N.; Guilherme, R.; et al. Avaliação de Clones de Arbutus Unedo L.: Apresentação de Resultados. In Proceedings of the II Jornadas do Medronho; Gomes, F., Sousa, R.M., Guilherme, R., Eds.; Actas Portuguesas de Horticultura: Coimbra, 2015; Vol. 24, pp. 15–23.
- Soares da Silva, A.M. Carta Litológica – Notícia Explicativa I.13; Atlas do Ambiente, Estação Agronómica Nacional, C.N. do A., Ed.; Lisboa, 1983;
- IUSS Working Group WRB World Reference Base for Soil Resources. International Soil Classification System for Naming Soils and Creating Legends for Soil Maps; International Union of Soil Sciences (IUSS), Ed.; 4th ed.; Vienna, 2022;
- Cardoso, J.C.; Bessa, M.T.; Marado, M.B. Carta Dos Solos de Portugal (1: 1 000 000). Sep. da Agronomia Lusitana 1973, 33, 481–602.
- INMG O Clima de Portugal. Normais Climatológicas Correspondentes a 1951-1980 (1a, 2a, 3a e 4a Regiões).; INMG: Lisboa, 1991;
- Alcoforado, M.J.; Alegria, M.F.; Ramos-Pereira, A.; Sirgado, C. Domínios Bioclimáticos Em Portugal Definidos Por Comparação Dos Índices de Gaussen e de Emberger; Centro de Estudos Geográficos Universidade de Lisboa, Ed.; 3aEd.; Lisboa, 2009; ISBN 9789726361930.
- Thornthwaite, C.W. An Approach toward a Rational Classification of Climate. In Geographical Review; 1948; Vol. 38, pp. 55–94. [CrossRef]
- Nunes, A.S.; Castro, F.; Simões, M.; Botelho, G.; Gomes, F.; Franco, J. Caracterização Dos Estados Fenológicos e Da Produção de Clones de Medronheiro. Actas Portuguesas de Horticultura 2022, 35, 27–34. [CrossRef]
- Bento, V.A.; Russo, A.; Vieira, I.; Gouveia, C.M. Identification of Forest Vulnerability to Droughts in the Iberian Peninsula. Theor Appl Climatol 2023, 152, 559–579. [CrossRef]
- Jafari, M.; Tavili, A.; Panahi, F.; Zandi Esfahan, E.; Ghorbani, M. Chapter 1 Introduction. In Reclamation of Arid Lands; Jafari, M., Tavili, A., Panahi, F., Zandi Esfahan, E., Ghorbani, M., Eds.; Springer International Publishing: Cham, 2018; pp. 1–19 ISBN 978-3-319-54828-9.
- Thornthwaite, C.W.; Mather, J.R. The Water Balance. In Publications in climatology; Drexel Institute of Technology, 1955; Vol. 8, pp. 5–86.
- Nunes, A.S.; Castro, F.; Simões, M.; Gomes, F.; Botelho, G.; Franco, J. AGROTEC Revista técnico-científica agrícola No 34. Suplemento Pequenos Frutos. Porto March 2020, pp. 4–6.
- Fleckinger, J. Notations Phénologiques et Représentations Graphiques Du Dévelopment Des Bourgeons de Poirier. In Proceedings of the Congrès de Paris de L ’Association française pour l’avancement des Sciences; Paris, 1945; p. 118.
- Baggiolini, M. Les Stades Repères Dans Le Développement Annuel de La Vigne et Leur Utilisation Pratique. Rev. Rom. Agric. 1952, 8–10.
- Anastácio, J. Contributo Para o Estudo Do Medronheiro (Arbutus Unedo L.): Caracterização Morfológica de Clones e Fisiologia Pós-Colheita Do Fruto. Master’s in Agricultural Engineering, Instituto Superior de Agronomia: Lisboa, 2014.
- Miller, J.N.; Miller, J.C. Statistics and Chemometrics for Analytical Chemistry; Fifth edit.; Pearson Education Limited: Edinburgh, 2005; ISBN 0 131 29192 0.
- Caldeira, I.; Gomes, F.; Botelho, G. Arbutus Unedo L. Spirit: Does the Water Addition Before Fermentation Matters? In INCREaSE; Mortal, A. et al., Ed.; Springer International Publishing: Cham, 2018; pp. 206–215 ISBN 978-3-319-70271-1.
- Ayaz, F.A.; Kucukislamoglu, M.; Reunanen, M. Sugar, Non-Volatile and Phenolic Acids Composition of Strawberry Tree (Arbutus Unedo L. Var.Ellipsoidea ) Fruits. J. Food Compos. Anal. 2000, 13, 171–177. [CrossRef]
- Seker, M.; Toplu, C. Determination and Comparison of Chemical Characteristics of Arbutus Unedo L. and Arbutus Andrachnae L. (Family Ericaceae) Fruits. J Med Food 2010, 13, 1013–1018. [CrossRef]
- Vidrih, R.; Hribar, J.; Prgomet, Ž.; Ulrih, N.P. The Physico-Chemical Properties of Strawberry Tree (Arbutus Unedo L.) Fruits. Croatian Journal of Food Science and Technology 2013, 5, 29–33.
- Doukani, K.; Tabak, S. Profil Physicochimique Du Fruit “Lendj” (Arbutus Unedo L.). Nature & Technologie».B-Sciences Agronomiques et Biologiques 2015, 12, 51–64.
- Alarcão e Silva, M.L.; Leitão, A.E.; Azinheira, H.G.; Leitão, M.C. The Arbutus Berry: Studies on Its Color and Chemical Characteristics at Two Mature Stages. J. Food Comp. Anal. 2001, 14, 27–35. [CrossRef]
- Boussalah, N.; Boussalah, D.; Cebadera-Miranda, L.; Fernández-Ruiz, V.; Barros, L.; Ferreira, I.C.F.R.; Cortes Sanchez Mata, M.; Madani, K. Nutrient Composition of Algerian Strawberry-Tree Fruits (Arbutus Unedo L.). Fruits 2018, 73, 283–297. [CrossRef]
- Ait Lhaj, Z.; Bchitou, R.; Gaboun, F.; Abdelwahd, R.; Benabdelouahab, T.; Kabbour, M.R.; Pare, P.; Diria, G.; Bakhy, K. Moroccan Strawberry Tree (Arbutus Unedo L.) Fruits: Nutritional Value and Mineral Composition. Foods 2021, 10. [CrossRef]
- Molina, M.; Pardo-De-Santayana, M.; Aceituno, L.; Morales, R.; Tardio, J. Fruit Production of Strawberry Tree (Arbutus Unedo L.) in Two Spanish Forests. Forestry 2011, 84, 419–429. [CrossRef]
- Duarte, R.; Castro, F.; Ramos, I.; Antunes, C.; Figueiredo, P.; Franco, J.; Gama, J.D.; Silva, J.P.; Balseiro, M.; Chá, L.C.; et al. Apresentação de Resultados de Ensaios Instalados No Campo Com Plantas Clonais e Seminais de Medronheiro. In Proceedings of the Congresso Nacional dos Recursos Silvestres 2023; Escola Superior Agrária de Bragança: Bragança, October 18 2023; p. 37.
- Molina, R. Pure Culture Synthesis and Host Specificity of Red Alder Mycorrhizae - :’’: In Future Forest Management ( Tarrant and Found Only Six Types Associated with Three Japanese Alder Species ; Mejstrik and Benecke ( 1969 ) Report Only Three Types on Alnus Viridi. 1979, 1223–1228.
- Gomes, F.; Franco, J.; Pato, R.L.; Botelho, G.; Rodrigues, I.; Figueiredo, P.; Casau, F. Produção de Medronho Para Destilar. In Medronheiro, Caderno Técnico; Pestana, M., Ed.; INIAV, Silva Lusitana: Lisboa, 2017; pp. 5–33 ISBN 978-972-579-045.
- ICNF 6o. Inventário Florestal Nacional. 2015 Relatório Final; ICNF, Ed.; ICNF: Lisboa, 2019;
- ICNF 6o Inventário Florestal Nacional, Áreas Dos Usos Do Solo e Das Espécies Florestais de Portugal Continental. Resultados Preliminares; Instituto da Conservação da Natureza e das Florestas: Lisboa, 2013;
- Oliveira, A.S. De; Silva, J.S. Is Native Forest an Alternative to Prevent Wildfire in the WUI in Central Is Native Forest an Alternative to Prevent Wildfire in the WUI in Central Portugal ? 2021.
- Martins, J.; Pinto, G.; Canhoto, J. Biotechnology of the Multipurpose Tree Species Arbutus Unedo: A Review. J For Res (Harbin) 2022, 33, 377–390. [CrossRef]
- Martins, J.; Correia, S.; Pinto, G.; Canhoto, J. Cloning Adult Trees of Arbutus Unedo L. through Somatic Embryogenesis. Plant Cell Tissue Organ Cult 2022, 150, 611–626. [CrossRef]
- Gomes, F.; Canhoto, J.M. Micropropagation of Strawberry Tree (Arbutus Unedo L.) from Adult Plants. In Vitro Cell. Dev. Biol.-Plant 2009, 45, 72–82. [CrossRef]
- Gomes, F.; Botelho, G.; Franco, J.; Gama, J.; João, C.; Santos, R.; Figueiredo, P. Assessment of Arbutus Unedo L. Clonal Plants in a Field Clonal Trial. In Proceedings of the IUFRO Forest Tree Breeding Conference. Program and Abstract Book; IUFRO, Ed.; Prague, Czech Republic, 25-29 August, 2014; pp. 29, ISBN: 978-80-213-2471–2478.
- Figueiredo, P.; Gomes, F.; Santos, R.; Pop, R.L. Rapid Propagation of Arbutus Unedo L. Adult Selected Plants Using Ex Vitro Rooting. In Proceedings of the 8th International Symposium on In Vitro Culture and Horticultural Breeding. Program and Abstract Book; Canhoto, J., Correia, S., Eds.; Coimbra, Portugal, June 2-7, 2013; p. 157.
- Guerreiro, A.C.; Gago, C.M.L.; Miguel, M.G.C.; Antunes, M.D.C. The Effect of Temperature and Film Covers on the Storage Ability of Arbutus Unedo L. Fresh Fruit. Sci Hortic 2013, 159, 96–102. [CrossRef]
- Guerreiro, A.C.; Gago, C.M.L.; Faleiro, M.L.; Miguel, M.G.C.; Antunes, M.D.C. The Effect of Alginate Based Edible Coatings Enriched with Essential Oils Constituents on Arbutus Unedo L. Fresh Fruit Storage. Postharvest Biol Technol 2015, 100, 226–233. [CrossRef]
Figure 1.
Geographical distribution of accessions according to provenance.
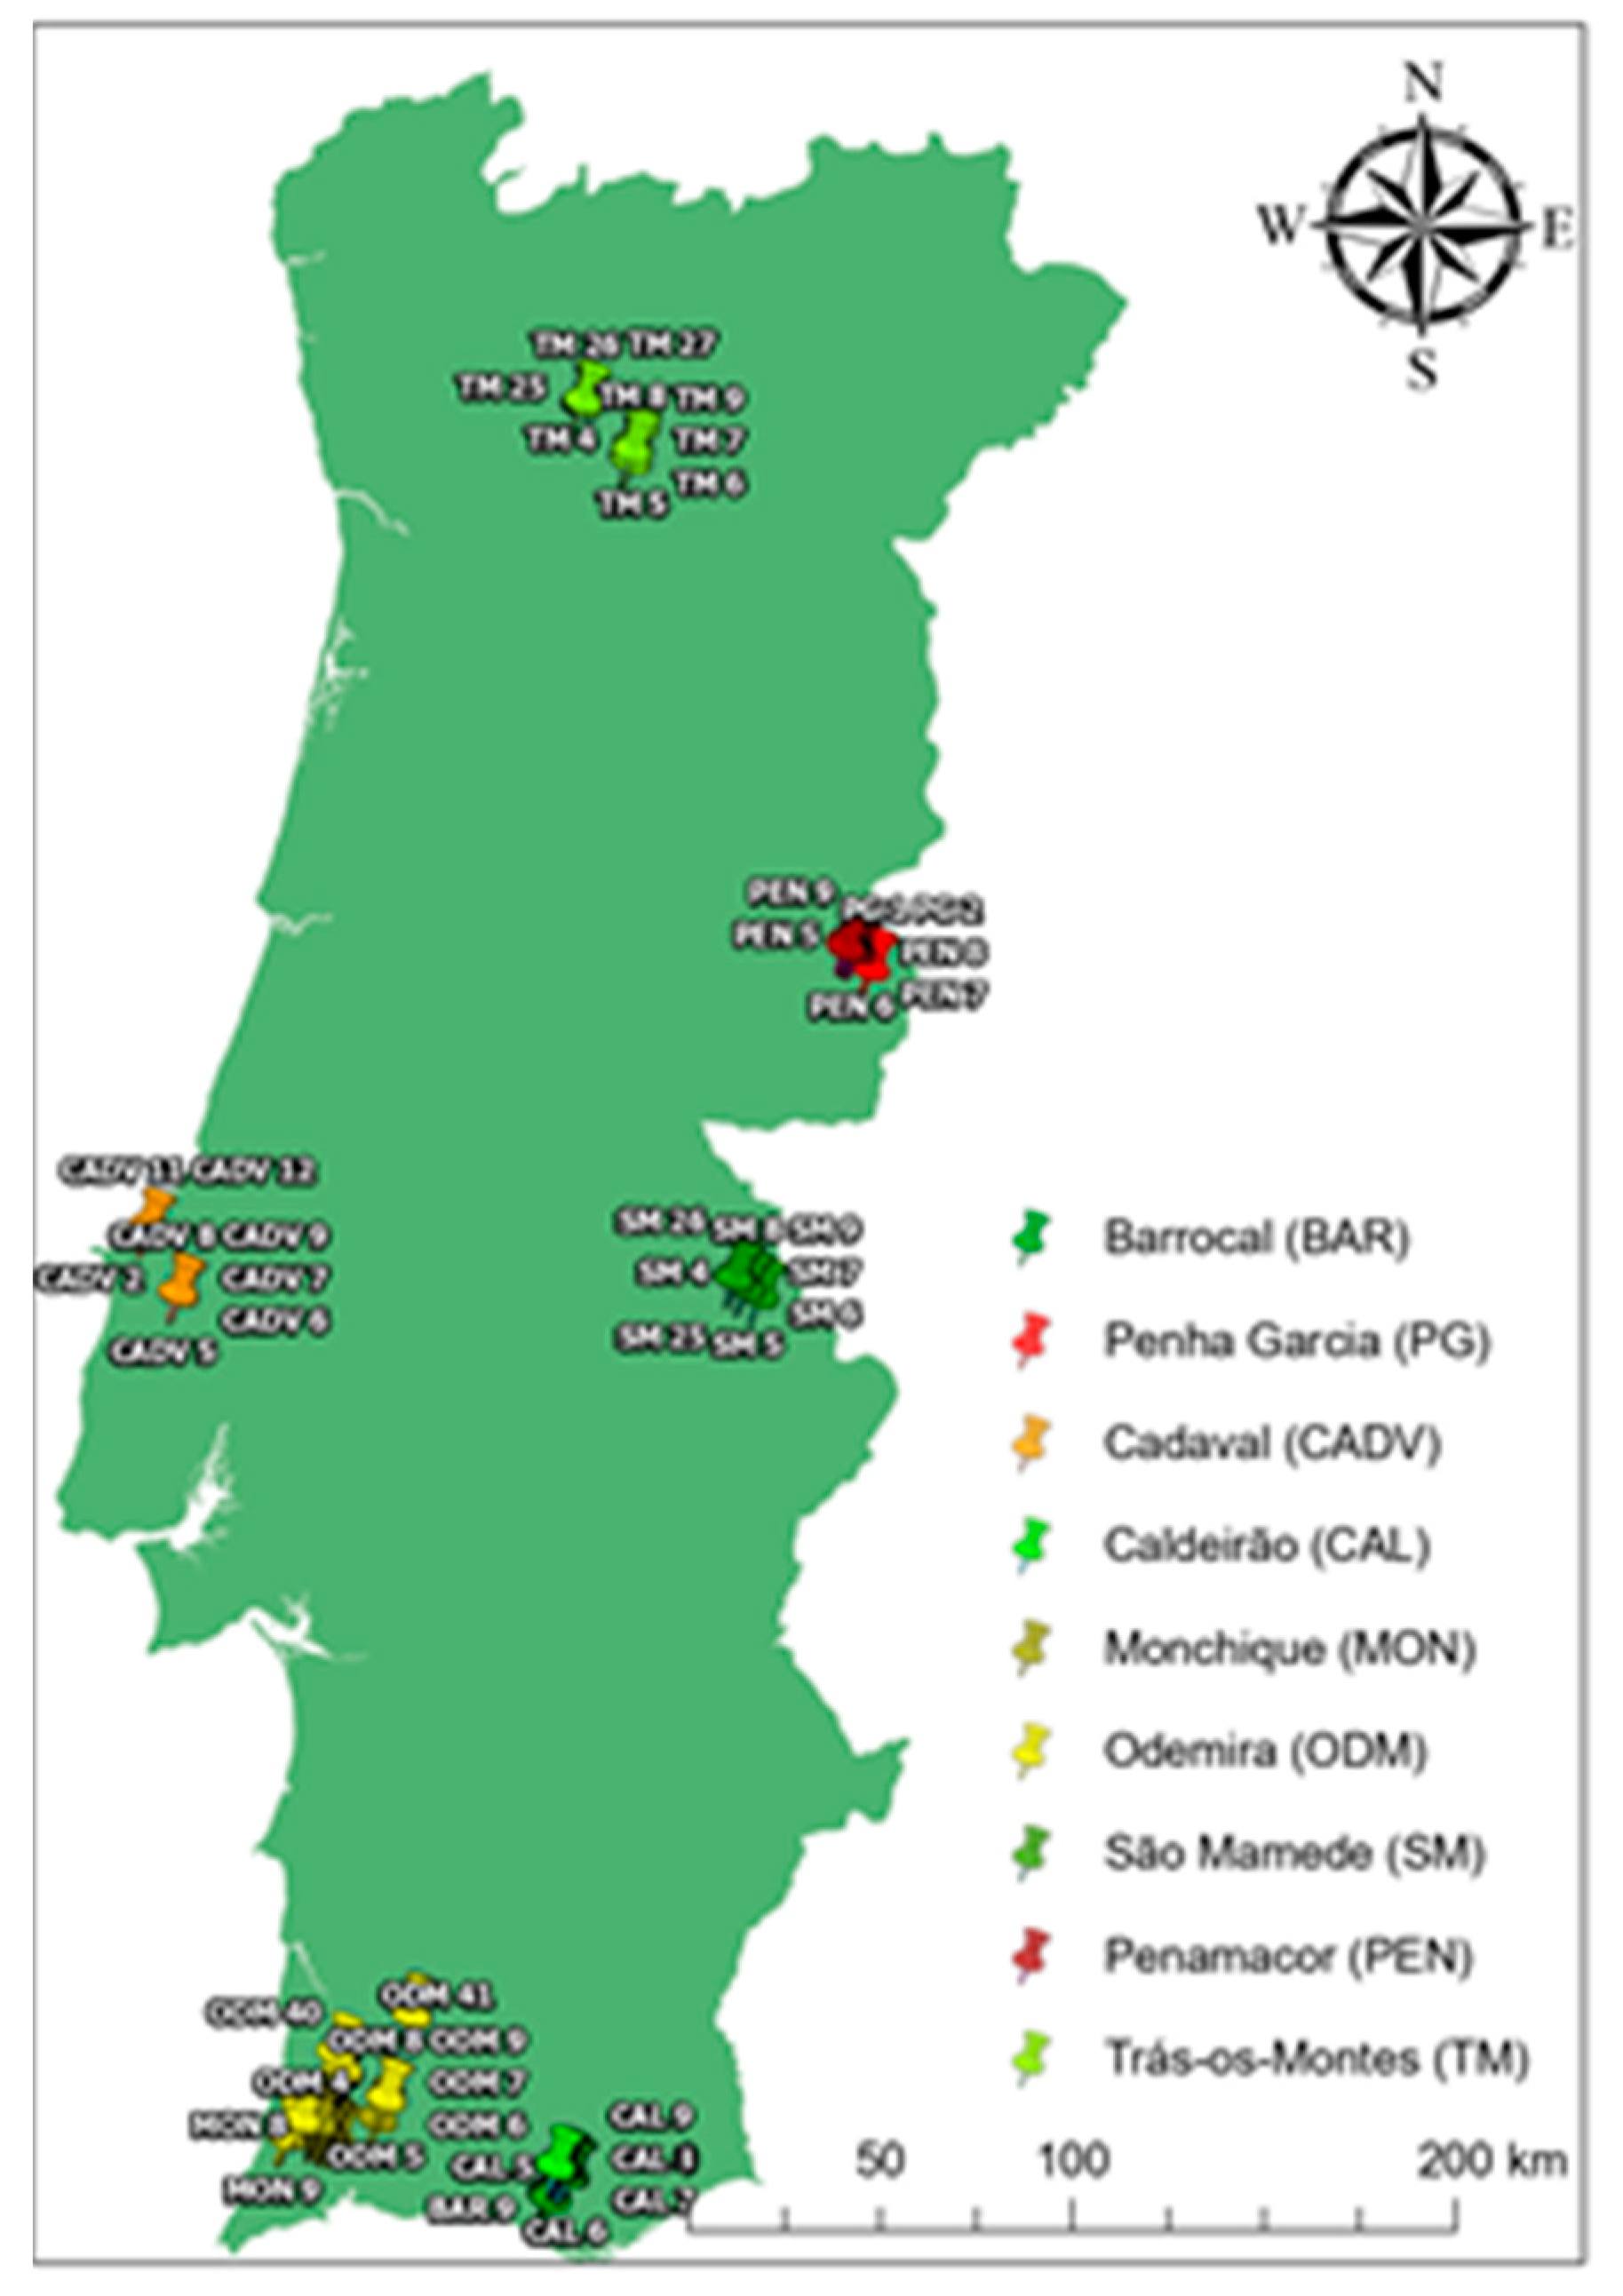
Figure 2.
Fruit pulp preparation for sugar analysis: (a) fruits (15) from each accession were randomly selected; (b) extraction of the pulp (200g), manually using a raw cloth; (c) fruit pulp in beakers and the residues retained in the raw cloth (seeds and sclerenchyma).
Figure 2.
Fruit pulp preparation for sugar analysis: (a) fruits (15) from each accession were randomly selected; (b) extraction of the pulp (200g), manually using a raw cloth; (c) fruit pulp in beakers and the residues retained in the raw cloth (seeds and sclerenchyma).
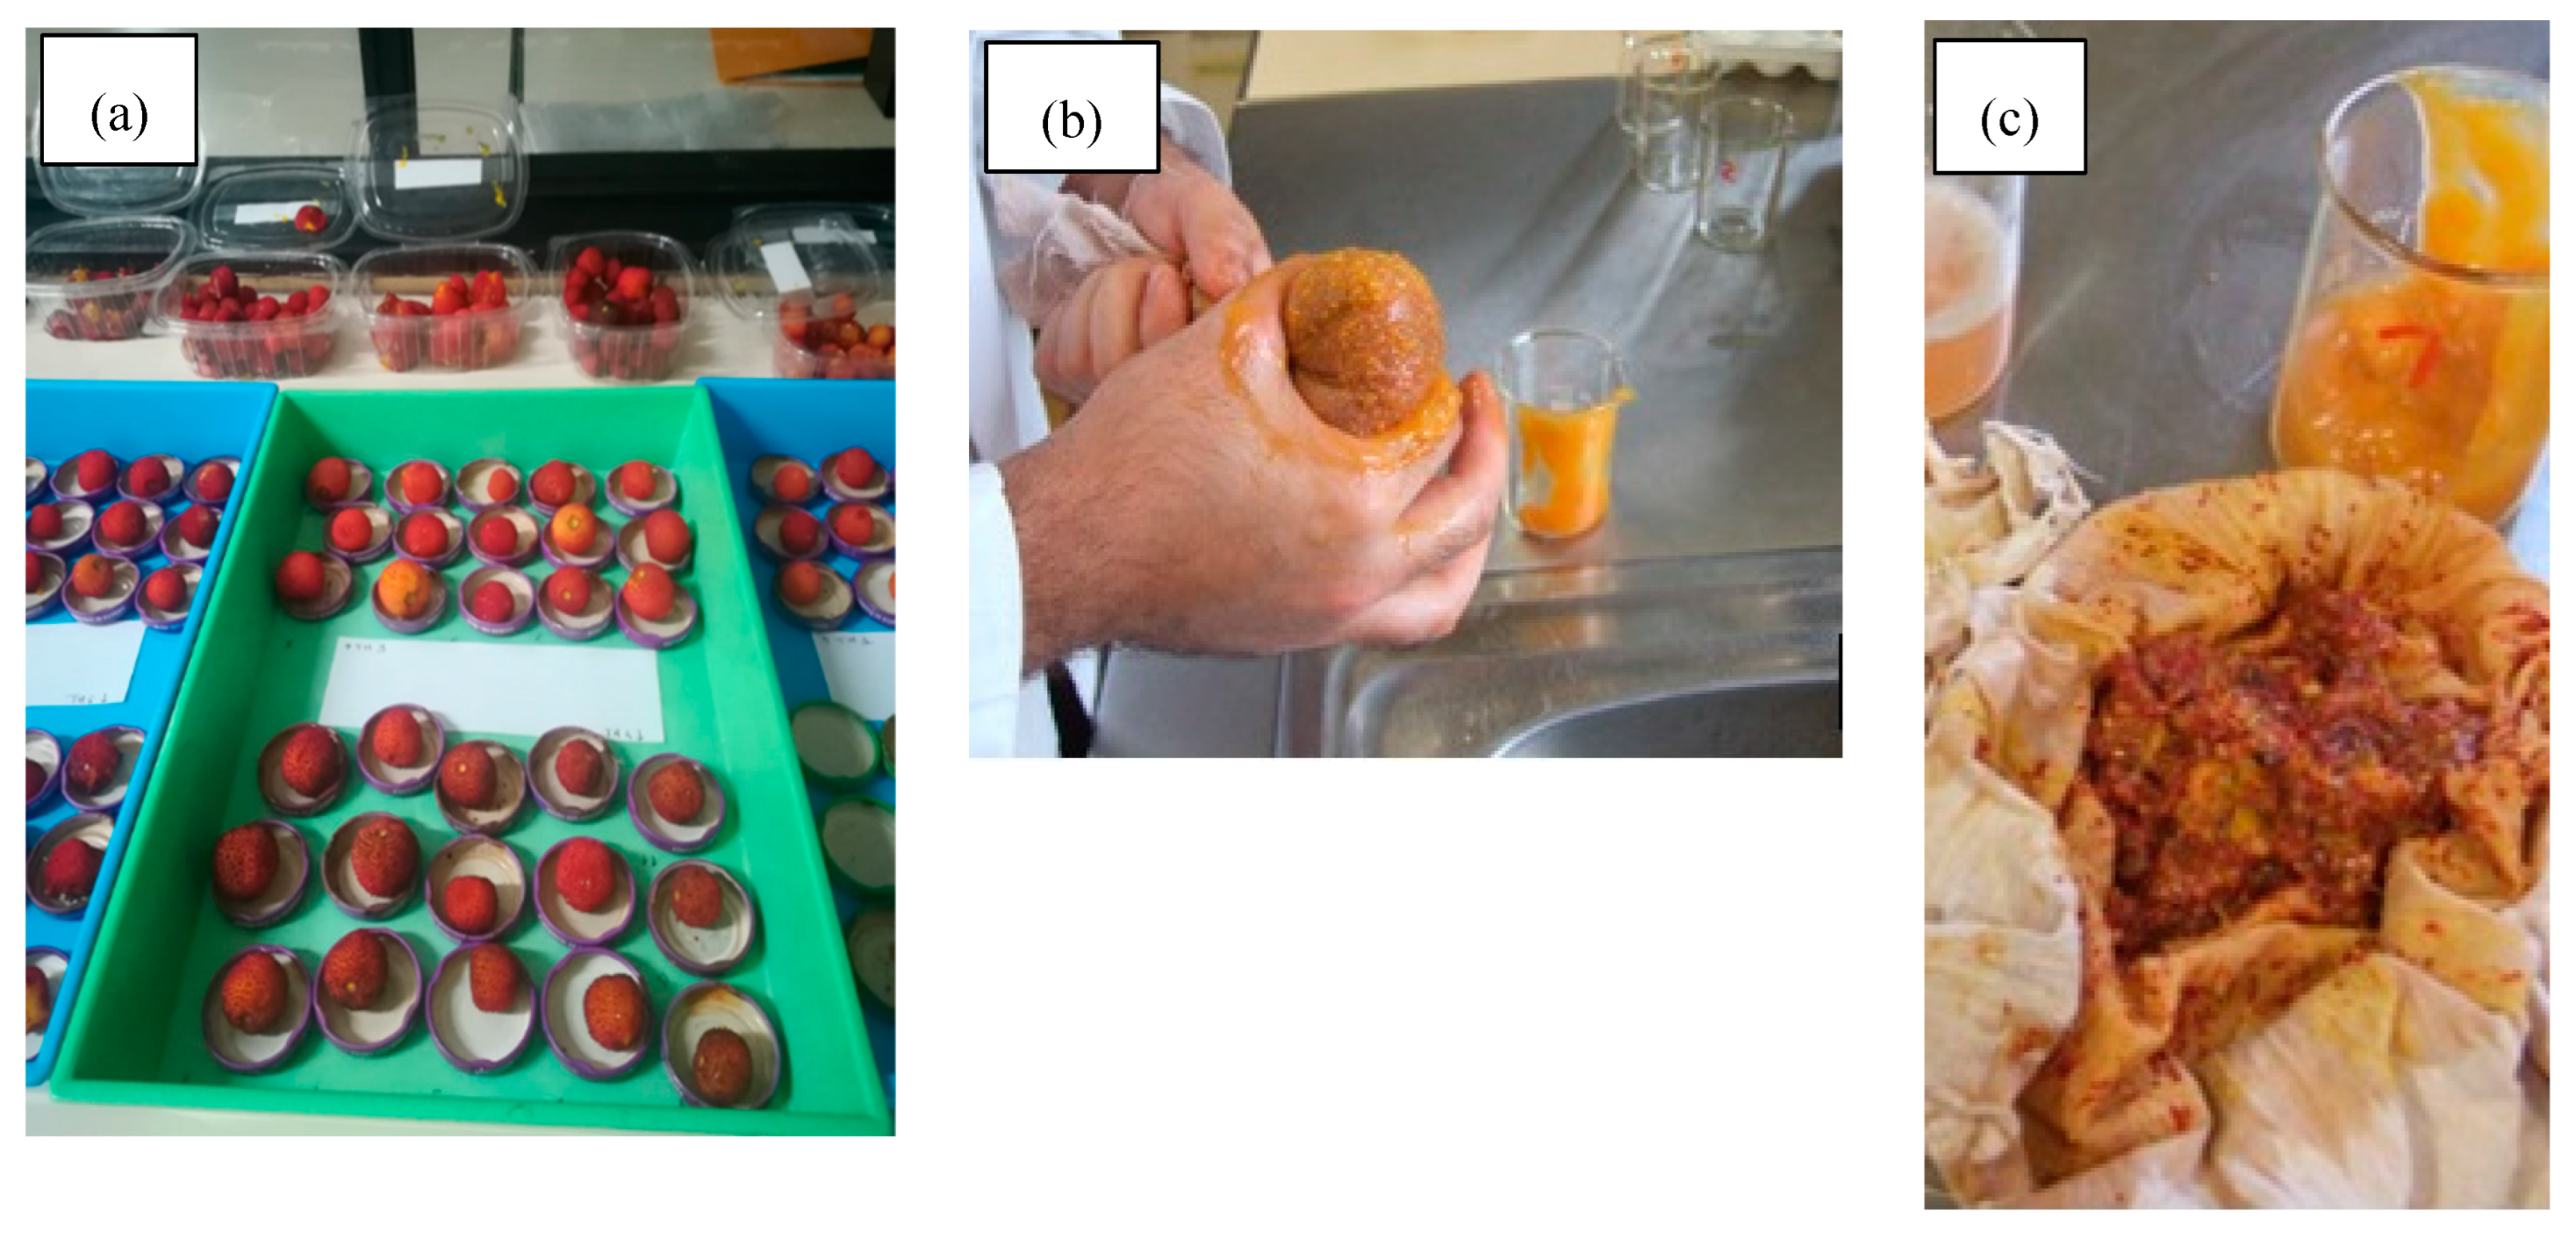
Figure 3.
Characterization of the interaction among the total sugar content (% f.w.), site features (latitude, longitude, altitude), edaphoclimatic characteristics and climatic classifications (Thornthwaite and xerothermic index) by PCA analysis according to the variables on the left table.
Figure 3.
Characterization of the interaction among the total sugar content (% f.w.), site features (latitude, longitude, altitude), edaphoclimatic characteristics and climatic classifications (Thornthwaite and xerothermic index) by PCA analysis according to the variables on the left table.
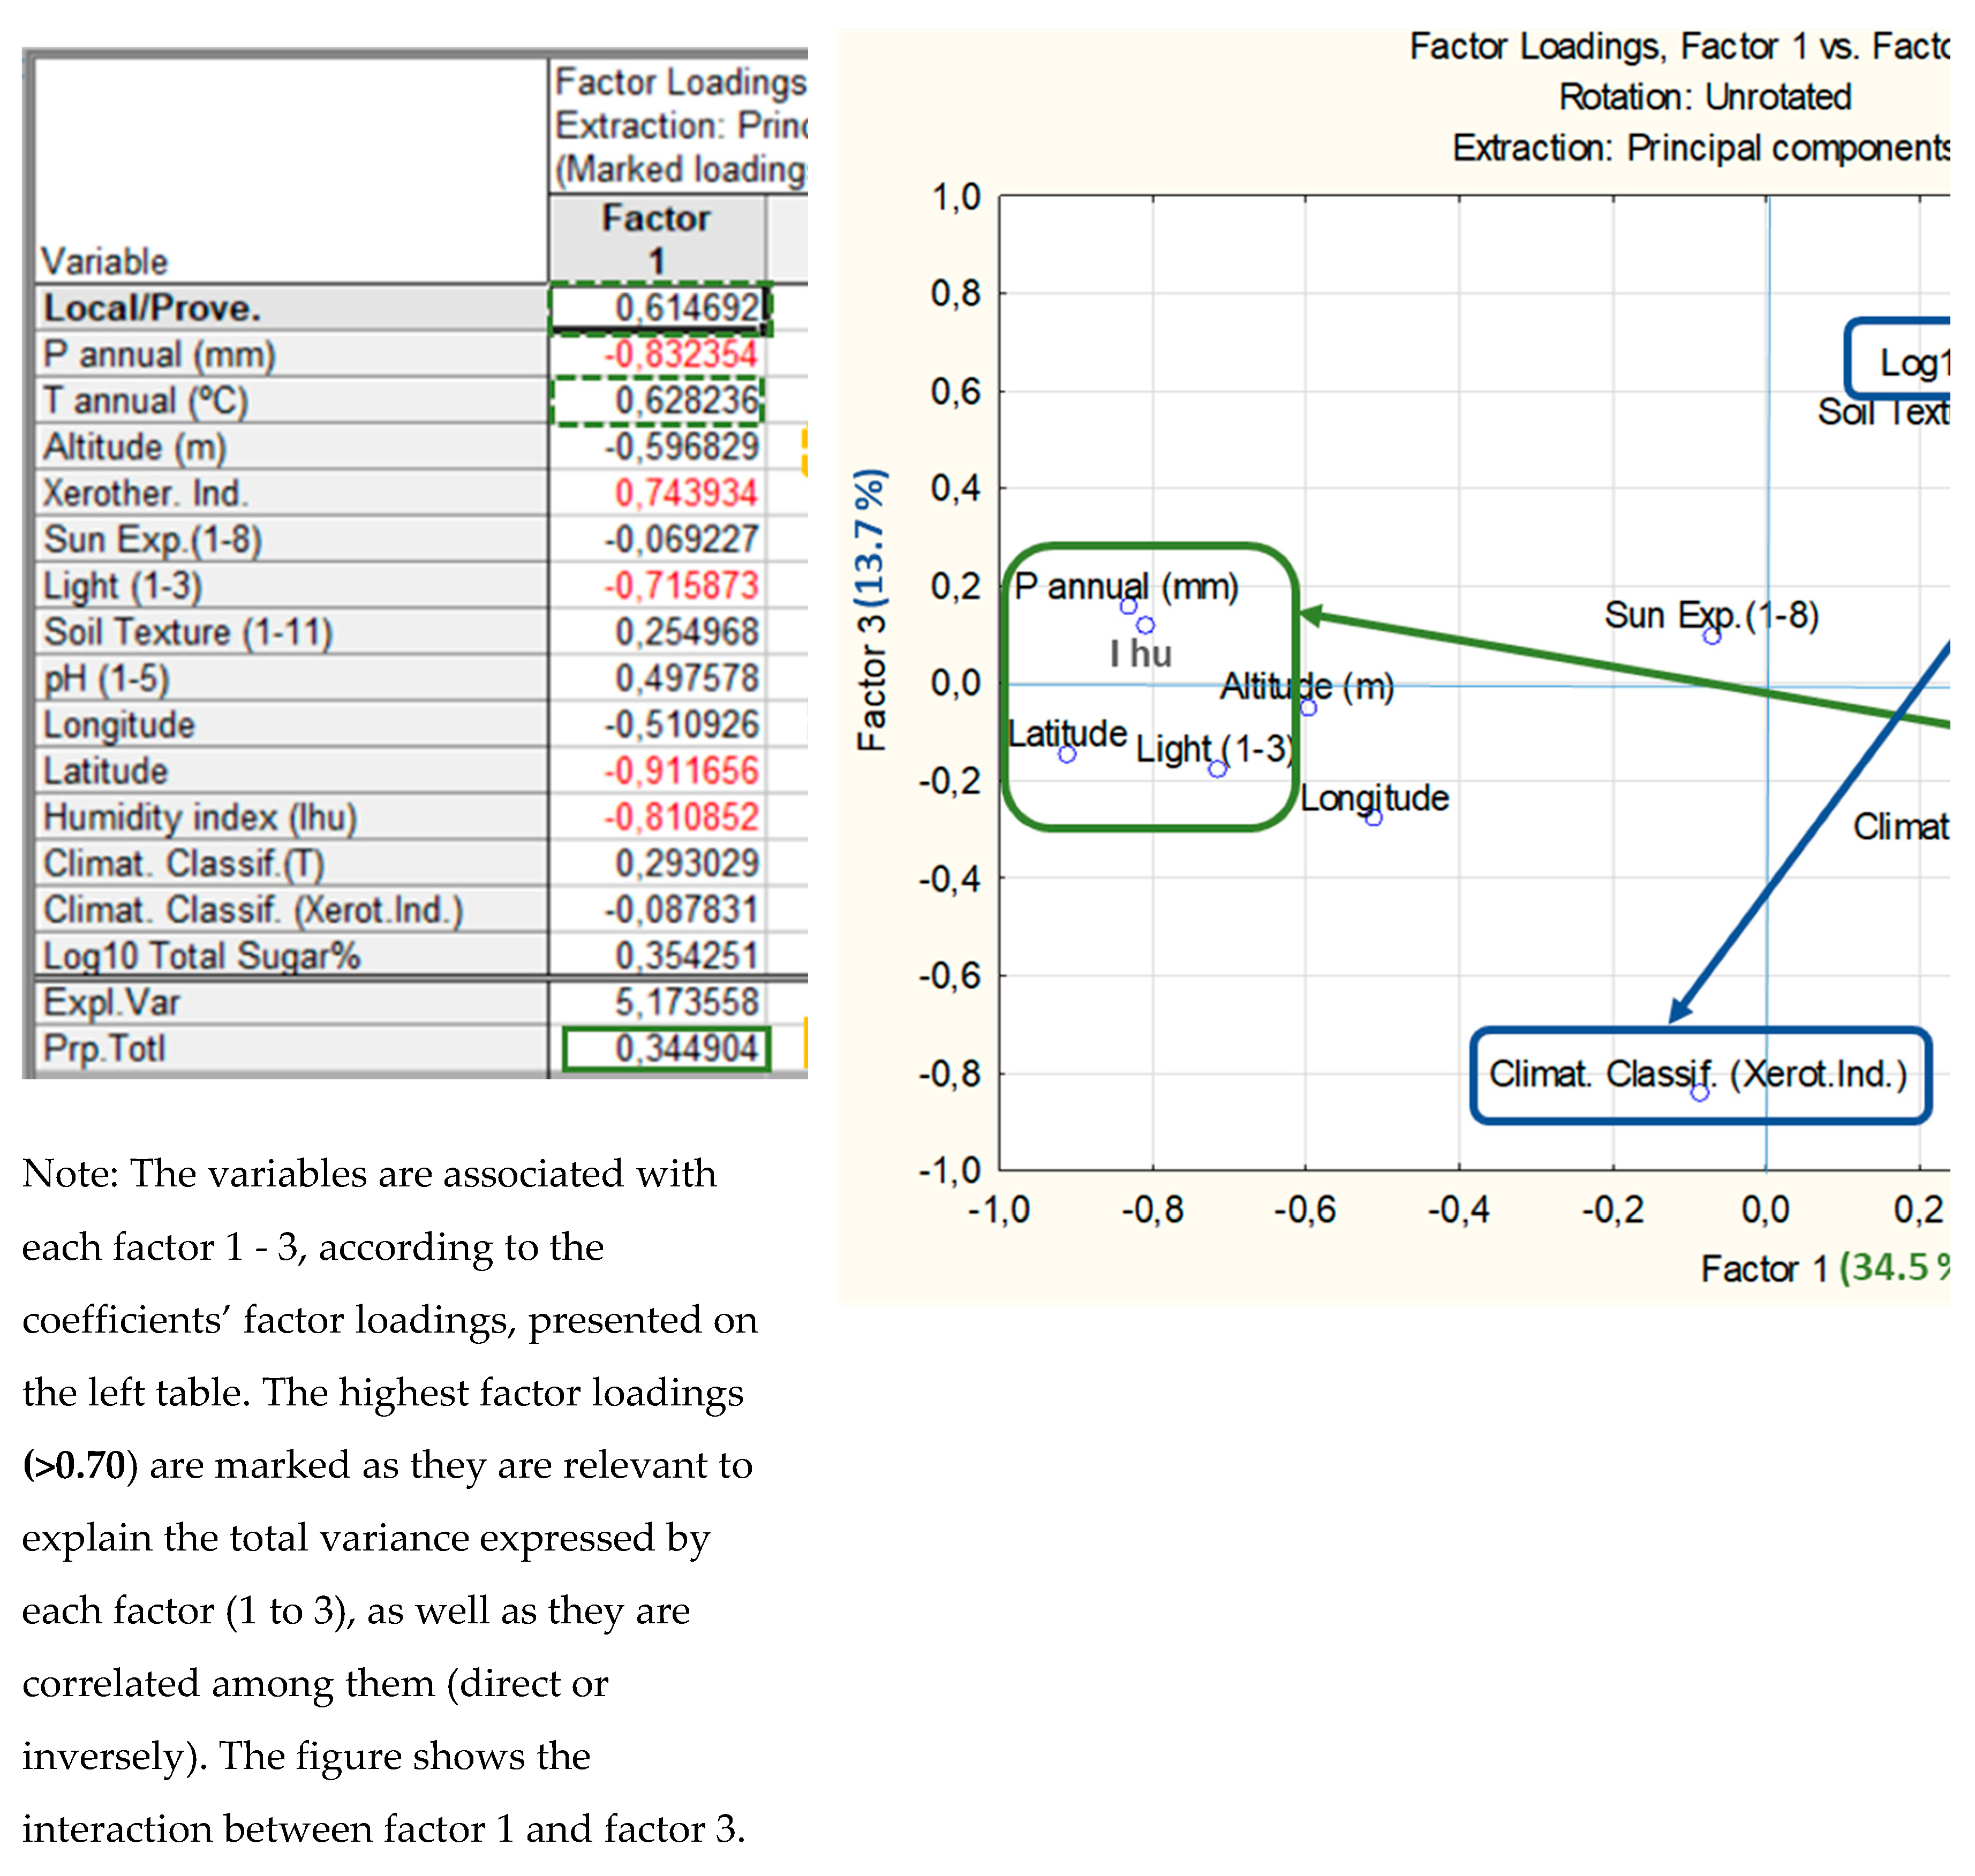

Table 1.
Identification of the number of accessions (N°) and edaphoclimatic characterization of the different provenances.
Table 1.
Identification of the number of accessions (N°) and edaphoclimatic characterization of the different provenances.
| Local / Provenance | N° | Lithology1 | pH2 | T annual (°C)3 | P annual (mm)3 | Humidity index | Xeroth. Index | Climatic classification4 | Climatic Classif.5 |
|---|---|---|---|---|---|---|---|---|---|
| TM-Fisgas Ermelo/FE | 6 | Shales, Quarzites | 2 | 13.4 | 1390.5 | 111.51 | 42.40 | Sub-Mediterranean | B4 B´2 s a´ |
| TM -Mosteiró | 19 | Shales | 3 | 13.4 | 1128.1 | 84.69 | 60.96 | Attenuated Mesomed4.1 | B3 B´2 s2 a´ |
| São Mamede | 26 | Shales, Sandst.1.1 | 2 | 15.2 | 852.4 | 45.41 | 71.38 | Attenuated Mesomed4.1 | B1 B´2 s2 a´ |
| Penamacor | 24 | Shales, Quarzites | 2 | 14.4 | 838.2 | 47.80 | 98.64 | Accentuated Mesomed4.1 | B1 B´2 s2 a´ |
| Penha Garcia* | 2 | Shales | 3 | 14.4 | 838.2 | 47.80 | 98.64 | Accentuated Mesomed4.1 | B1 B´2 s2 a´ |
| Cadaval* | 4 | Gonglomerates1.2 Sand1.1 | 3 | 15.0 | 777.6 | 40.20 | 86.64 | Accentuated Mesomed4.1 | C2 B´2 s a´ |
| Monchique* | 25 | Syenite & Shale | 2 | 15.1 | 949.0 | 60.22 | 87.36 | Accentuated Mesomed4.1 | B1 B´2 s2 a´ |
| ODM -Pomba* | 16 | Shale, graywacke | 3 | 15.8 | 715.7 | 34.27 | 87.52 | Accentuated Mesomed4.1 | C2 B´2 s2 a´ |
| ODM -Cerca Pomares* | 3 | Shale, graywacke | 3 | 15.0 | 760.5 | 35.69 | 88.96 | Accentuated Mesomed4.1 | C2 B´2 s a´ |
| ODM -Trancão* | 9 | Shale, graywacke | 3 | 15.0 | 571.9 | 15.73 | 85.04 | Accentuated Mesomed4.1 | C1 B´2 s a´ |
| ODM -Nave Redondo* | 10 | Shale, graywacke | 3 | 15.1 | 748.9 | 40.03 | 90.56 | Accentuated Mesomed4.1 | C2 B´2 s2 a´ |
| ODM -Cortes Pereira* | 15 | Shale, graywacke | 3 | 15.8 | 623.1 | 22.08 | 83.52 | Accentuated Mesomed4.1 | C1 B´2 s2 a´ |
| Caldeirão | 25 | Shale, graywacke | 3 | 15.9 | 866.7 | 51.40 | 95.90 | Accentuated Mesomed4.1 | B1 B´2 s2 a´ |
| Barrocal | 20 | Limestone | 4 | 15.9 | 697.0 | 33.96 | 118.18 | Attenuated Thermomed4.2 | C2 B´2 s2 a´ |
| *Cultivated and wild plants identified with the Producers' support. 1Lithology according to lithological map [40] associated, in general (according to Soil Classification WRB [41]), to Leptosols and Cambisols [42]. 1.1Shales and sandstones; 1.2Gonglomerates and sandstones. 2pH soil classification mean per provenance: 1- very low (<4); 2- low (4-5.4); 3- medium (5.5-7.4); 4- hight (7.5-9); 5- very hight (>9). 3Annual averages of temperature (°C) and precipitation (mm), corresponding to 1951-1980 period [43]. 4Climatic classification according to xerothermic index [44]. 4.1Mesomediterranean; 4.2Thermomediterranean. 5Climatic classification according to Thornthwaite [45] present in the table: 1st letter (Hydric index - IH): i) humid and rainy climates B4, B3 e C2 – respectively very humid, humid and subhumid vs. ii) dry climates C1 - Dry subhumid. 2nd letter (Thermal efficiency (∑ ETP): B’2 – mesothermic. 3rd letter for mediterranean climate: i) Humid and subhumid climate group (1st Letter A, B or C2): - s (moderate water deficiency in summer); s2 (severe scarcity of water in the summer); ii) Dry climate group (1st letter C1 or D): s (moderate excess water in winter); s2 (high water excesses in the winter season). 4th letter (concentration of thermal efficiency in the hot season): a’ - small concentration of thermal efficiency during summer. | |||||||||
Table 2.
Identification of the number of accessions by provenance and their characterization by sugar content.
Table 2.
Identification of the number of accessions by provenance and their characterization by sugar content.
| Local / Provenance | N° | Maltose | Sucrose | Glucose | Fructose | Reducing sugar | Total sugar |
|---|---|---|---|---|---|---|---|
| (Mean ± SE g/100g, fresh pulp fruit) | |||||||
| TM-Fisgas Ermelo | 6 | 0.87 ± 0.30 d | 0.00 ± 0.00 c | 4.33 ± 0.10 b-d | 8.66 ± 0.43 d-f | 13.86 ± 0.71 c-e | 13.86 ± 0.71 de |
| TM-Mosteiró | 19 | 1.24 ± 0.23 cd | 0.12 ± 0.07 b | 3.98 ± 0.11 cd | 8.54 ± 0.32 ef | 13.77 ± 0.55 de | 13.89 ± 0.58 e |
| São Mamede | 26 | 0.63 ± 0.13 d | 0.85 ± 0.11 b | 5.13 ± 0.55 b-d | 10.42 ± 1.14 c-f | 16.18 ± 1.76 de | 17.04 ± 1.81 de |
| Penamacor | 24 | 0.61 ± 0.14 d | 0.74 ± 0.12 b | 5.14 ± 0.22 bc | 11.70 ± 0.39 b-d | 17.45 ± 0.58 cd | 18.19 ± 0.63 cd |
| Penha Garcia* | 2 | 0.00 ± 0.00 de | 0.00 ± 0.00 c | 4.13 ± 0.04 b-d | 12.26 ± 0.20 a-d | 16.39 ± 0.16 b-d | 16.39 ± 0.16 a-d |
| Cadaval* | 4 | 0.81 ± 0.27 d | 0.45 ± 0.45 ab | 4.72 ± 0.29 b-d | 12.16 ± 0.61 a-d | 17.70 ± 1.03 a-d | 18.15 ± 0.73 a-d |
| Monchique* | 25 | 0.67 ± 0.13 d | 1.58 ± 0.15 a | 6.80 ± 0.26 a | 12.29 ± 0.61 a-d | 19.77 ± 0.88 a-c | 21.34 ± 0.97 ac |
| ODM-Pomba* | 16 | 2.08 ± 0.16 bc | 0.16 ± 0.09 b | 4.91 ± 0.28 b-d | 12.66 ± 0.60 a-c | 19.65 ± 0.86 a-c | 19.81 ± 0.89 a-d |
| ODM-Cerca Pomares* | 3 | 0.96 ± 0.50 cd | 0.32 ± 0.32 b | 3.77 ± 0.11 b-d | 10.82 ± 0.06 b-d | 15.54 ± 0.43 b-d | 15.86 ± 0.61 b-d |
| ODM-Trancão* | 9 | 2.06 ± 0.30 bc | 0.32 ± 0.16 b | 4.16 ± 0.30 b-d | 11.31 ± 0.61 b-d | 17.54 ± 0.85 b-d | 17.85 ± 0.88 b-d |
| ODM-Nave Redondo* | 10 | 3.30 ± 0.96 ab | 0.66 ± 0.36 ab | 6.03 ± 0.40 ab | 15.33 ± 1.28 ab | 24.66 ± 1.63 ab | 25.31 ± 1.57 ab |
| ODM - Cortes Pereira* | 15 | 3.73 ± 0.53 a | 0.51 ± 0.17 b | 5.82 ± 0.39 ab | 17.01 ± 1.46 a | 26.56 ± 2.31 a | 27.07 ± 2.30 a |
| Caldeirão | 25 | 0.41 ± 0.12 d | 0.97 ± 0.14 ab | 4.93 ± 0.11 b-d | 11.78 ± 0.33 b-d | 17.12 ± 0.43 cd | 18.08 ± 0.45 cd |
| Barrocal | 20 | 1.02 ± 0.15 d | 0.39 ± 0.14 b | 4.03 ± 0.25 cd | 7.89 ± 0.55 f | 12.95 ± 0.79 e | 13.34 ± 0.84 e |
| Total / Global mean | 204 | 1.25 ± 0.10 | 0.67 ± 0.05 | 5.07 ± 0.11 | 11.49 ±0.28 | 17.81 ± 0.43 | 18.47 ± 0.44 |
*Cultivated and wild plants identified with the Producers' support. Values are expressed as Mean±SE% (f.w.); different letters in columns indicate stastically significant differences (P<0.05) according to Tukey multiple range test. Bold values show the highest value (a - in columns) and those that are not significantly different from it.
Table 3.
Identification of the number of accessions by groups of the climate classification according to xerothermic index [44] and their characterization on sugar content.
Table 3.
Identification of the number of accessions by groups of the climate classification according to xerothermic index [44] and their characterization on sugar content.
| Climatic Classification | N | Maltose | Sucrose | Glucose | Fructose | Reducing sugar | Total sugar |
|---|---|---|---|---|---|---|---|
| (Mean ± SE g/100g, fresh pulp fruit) | |||||||
| Accentuated Mesomediterranean | 133 | 1.42 ± 0.15a | 0.78 ± 0.07 a | 5.40 ± 0.12 a | 12.79 ± 0.29a | 19.61 ± 0.46 a | 20.39 ± 0.47 a |
| Attenuated Mesomediterranean | 45 | 0.89 ± 0.13b | 0.55 ± 0.09 a | 4.64 ± 0.33 ab | 9.63 ± 0.68b | 15.16 ± 1.05 b | 15.71 ± 1.09 b |
| Attenuated Thermomediterranean | 20 | 1.02 ± 0.15ab | 0.39 ± 0.14 a | 4.03 ± 0.25 c | 7.89 ± 0.55c | 12.95 ± 0.79 b | 13.34 ± 0.84 b |
| Sub-Mediterranean | 6 | 0.87 ± 0.30b | 0.00 ± 0.00 a | 4.33 ± 0.10 bc | 8.66 ± 0.43bc | 13.86 ± 0.71 b | 13.86 ± 0.71 b |
| Total / Global mean | 204 | 1.25 ± 0.10 | 0.67 ± 0.05 | 5.07 ± 0.11 | 11.49 ± 0.28 | 17.81 ± 0.43 | 18.47 ± 0.44 |
| Values are expressed as Mean ± SE% (f.w.); different letters in columns indicate stastically significant differencesf (P<0.05) according to Tukey multiple range test. Bold values show the highest value (a - in columns) and those that are not significantly different from it. | |||||||
Table 4.
Identification of the number of accessions by groups of the climate classification according to Thornthwaite [45] and their characterization on sugar content.
Table 4.
Identification of the number of accessions by groups of the climate classification according to Thornthwaite [45] and their characterization on sugar content.
| Climatic classification | N | Maltose | Sucrose | Glucose | Fructose | Reducing sugar | Total sugar |
|---|---|---|---|---|---|---|---|
| Mean ± SE (g/100g, fresh pulp fruit) | |||||||
| B4 B´2 s a´ | 6 | 0.87 ± 0.30 c-e | 0.00 ± 0.00 ab | 4.33 ± 0.10 ab | 8.66 ± 0.43 bc | 13.86 ± 0.71 bc | 13.86 ± 0.71 bc |
| B3 B´2 s2 a´ | 19 | 1.24 ± 0.23 cd | 0.12 ± 0.07 b | 3.98 ± 0.11 b | 8.54 ± 0.32 c | 13.77 ± 0.55 c | 13.89 ± 0.58 c |
| B1 B´2 s2 a´ | 102 | 0.57 ± 0.06 e | 1.02 ± 0.07 a | 5.47 ± 0.18 a | 11.55 ± 0.35 b | 17.59 ± 0.54 b | 18.61 ± 0.57 b |
| C1 B´2 s a´ | 9 | 2.06 ± 0.30 b | 0.32 ± 0.16 ab | 4.16 ± 0.30 ab | 11.31 ± 0.61 bc | 17.54 ± 0.85 bc | 17.85 ± 0.88 bc |
| C1 B´2 s2 a´ | 15 | 3.73 ± 0.53 a | 0.51 ± 0.17 ab | 5.82 ± 0.39 a | 17.01 ± 1.46 a | 26.56 ± 2.31 a | 27.07 ± 2.30 a |
| C2 B´2 s a´ | 7 | 0.87 ± 0.24 de | 0.39 ± 0.27 ab | 4.31 ± 0.25 ab | 11.59 ± 0.43 a-c | 16.77 ± 0.72 bc | 17.17 ± 0.65 bc |
| C2 B´2 s2 a´ | 46 | 1.89 ± 0.25 bc | 0.37 ± 0.10 ab | 4.77 ± 0.20 ab | 11.17 ± 0.61 bc | 17.83 ± 0.89 bc | 18.19 ± 0.91 bc |
| Total / Global mean | 204 | 1.25 ± 0.10 | 0.67 ± 0.05 | 5.07 ± 0.11 | 11.49 ± 0.28 | 17.81 ± 0.43 | 18.47 ± 0.44 |
| Values are expressed as Mean ± SE% (f.w.); different letters in columns indicate stastically significant differences (P<0.05) according to Tukey multiple range test. Bold values show the highest value (a - in columns) and those that are not significantly different from it. | |||||||
Table 5.
Multiple linear regression analysis for total sugar content, assessed by the dependent variable Total Sugar% f.w. (Log10) as a function of the different independent variables1.
Table 5.
Multiple linear regression analysis for total sugar content, assessed by the dependent variable Total Sugar% f.w. (Log10) as a function of the different independent variables1.
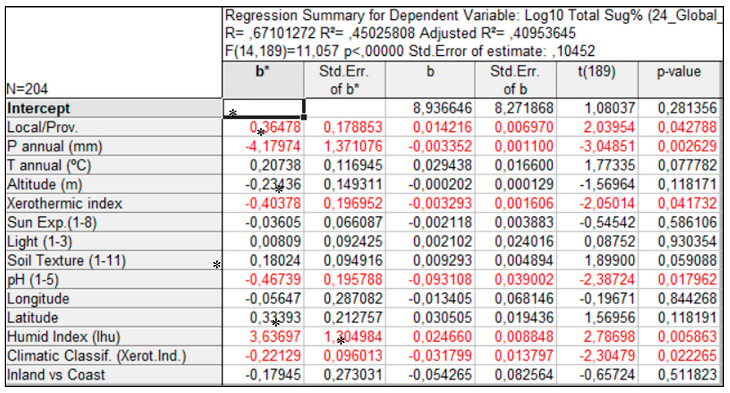 |
1Independent variables: local/provenance*, annual averages of precipitation* and temperature, altitude, xerothermic index*, sun exposure, light conditions, soil texture, soil pH*, longitude & latitude, allocation (inland vs coast), humidity index*, climatic classification (according to xerothermic index) *.
*Independent variables (P<0.05) with partial regression coefficients that indicate the rate of variation of the dependent variable (total sugar content), keeping the other independent variables constant.
Disclaimer/Publisher’s Note: The statements, opinions and data contained in all publications are solely those of the individual author(s) and contributor(s) and not of MDPI and/or the editor(s). MDPI and/or the editor(s) disclaim responsibility for any injury to people or property resulting from any ideas, methods, instructions or products referred to in the content. |
© 2024 by the authors. Licensee MDPI, Basel, Switzerland. This article is an open access article distributed under the terms and conditions of the Creative Commons Attribution (CC BY) license (http://creativecommons.org/licenses/by/4.0/).
Copyright: This open access article is published under a Creative Commons CC BY 4.0 license, which permit the free download, distribution, and reuse, provided that the author and preprint are cited in any reuse.


