Preprint
Article

This version is not peer-reviewed.

Ecophysiological and Molecular Analysis of Contrasting Genotypes for Leaf Senescence in Sunflower (Helianthus annuus L.) under Differential Doses of N in Soil

A peer-reviewed article of this preprint also exists.

Submitted:

31 October 2024

Posted:

01 November 2024

You are already at the latest version

Abstract

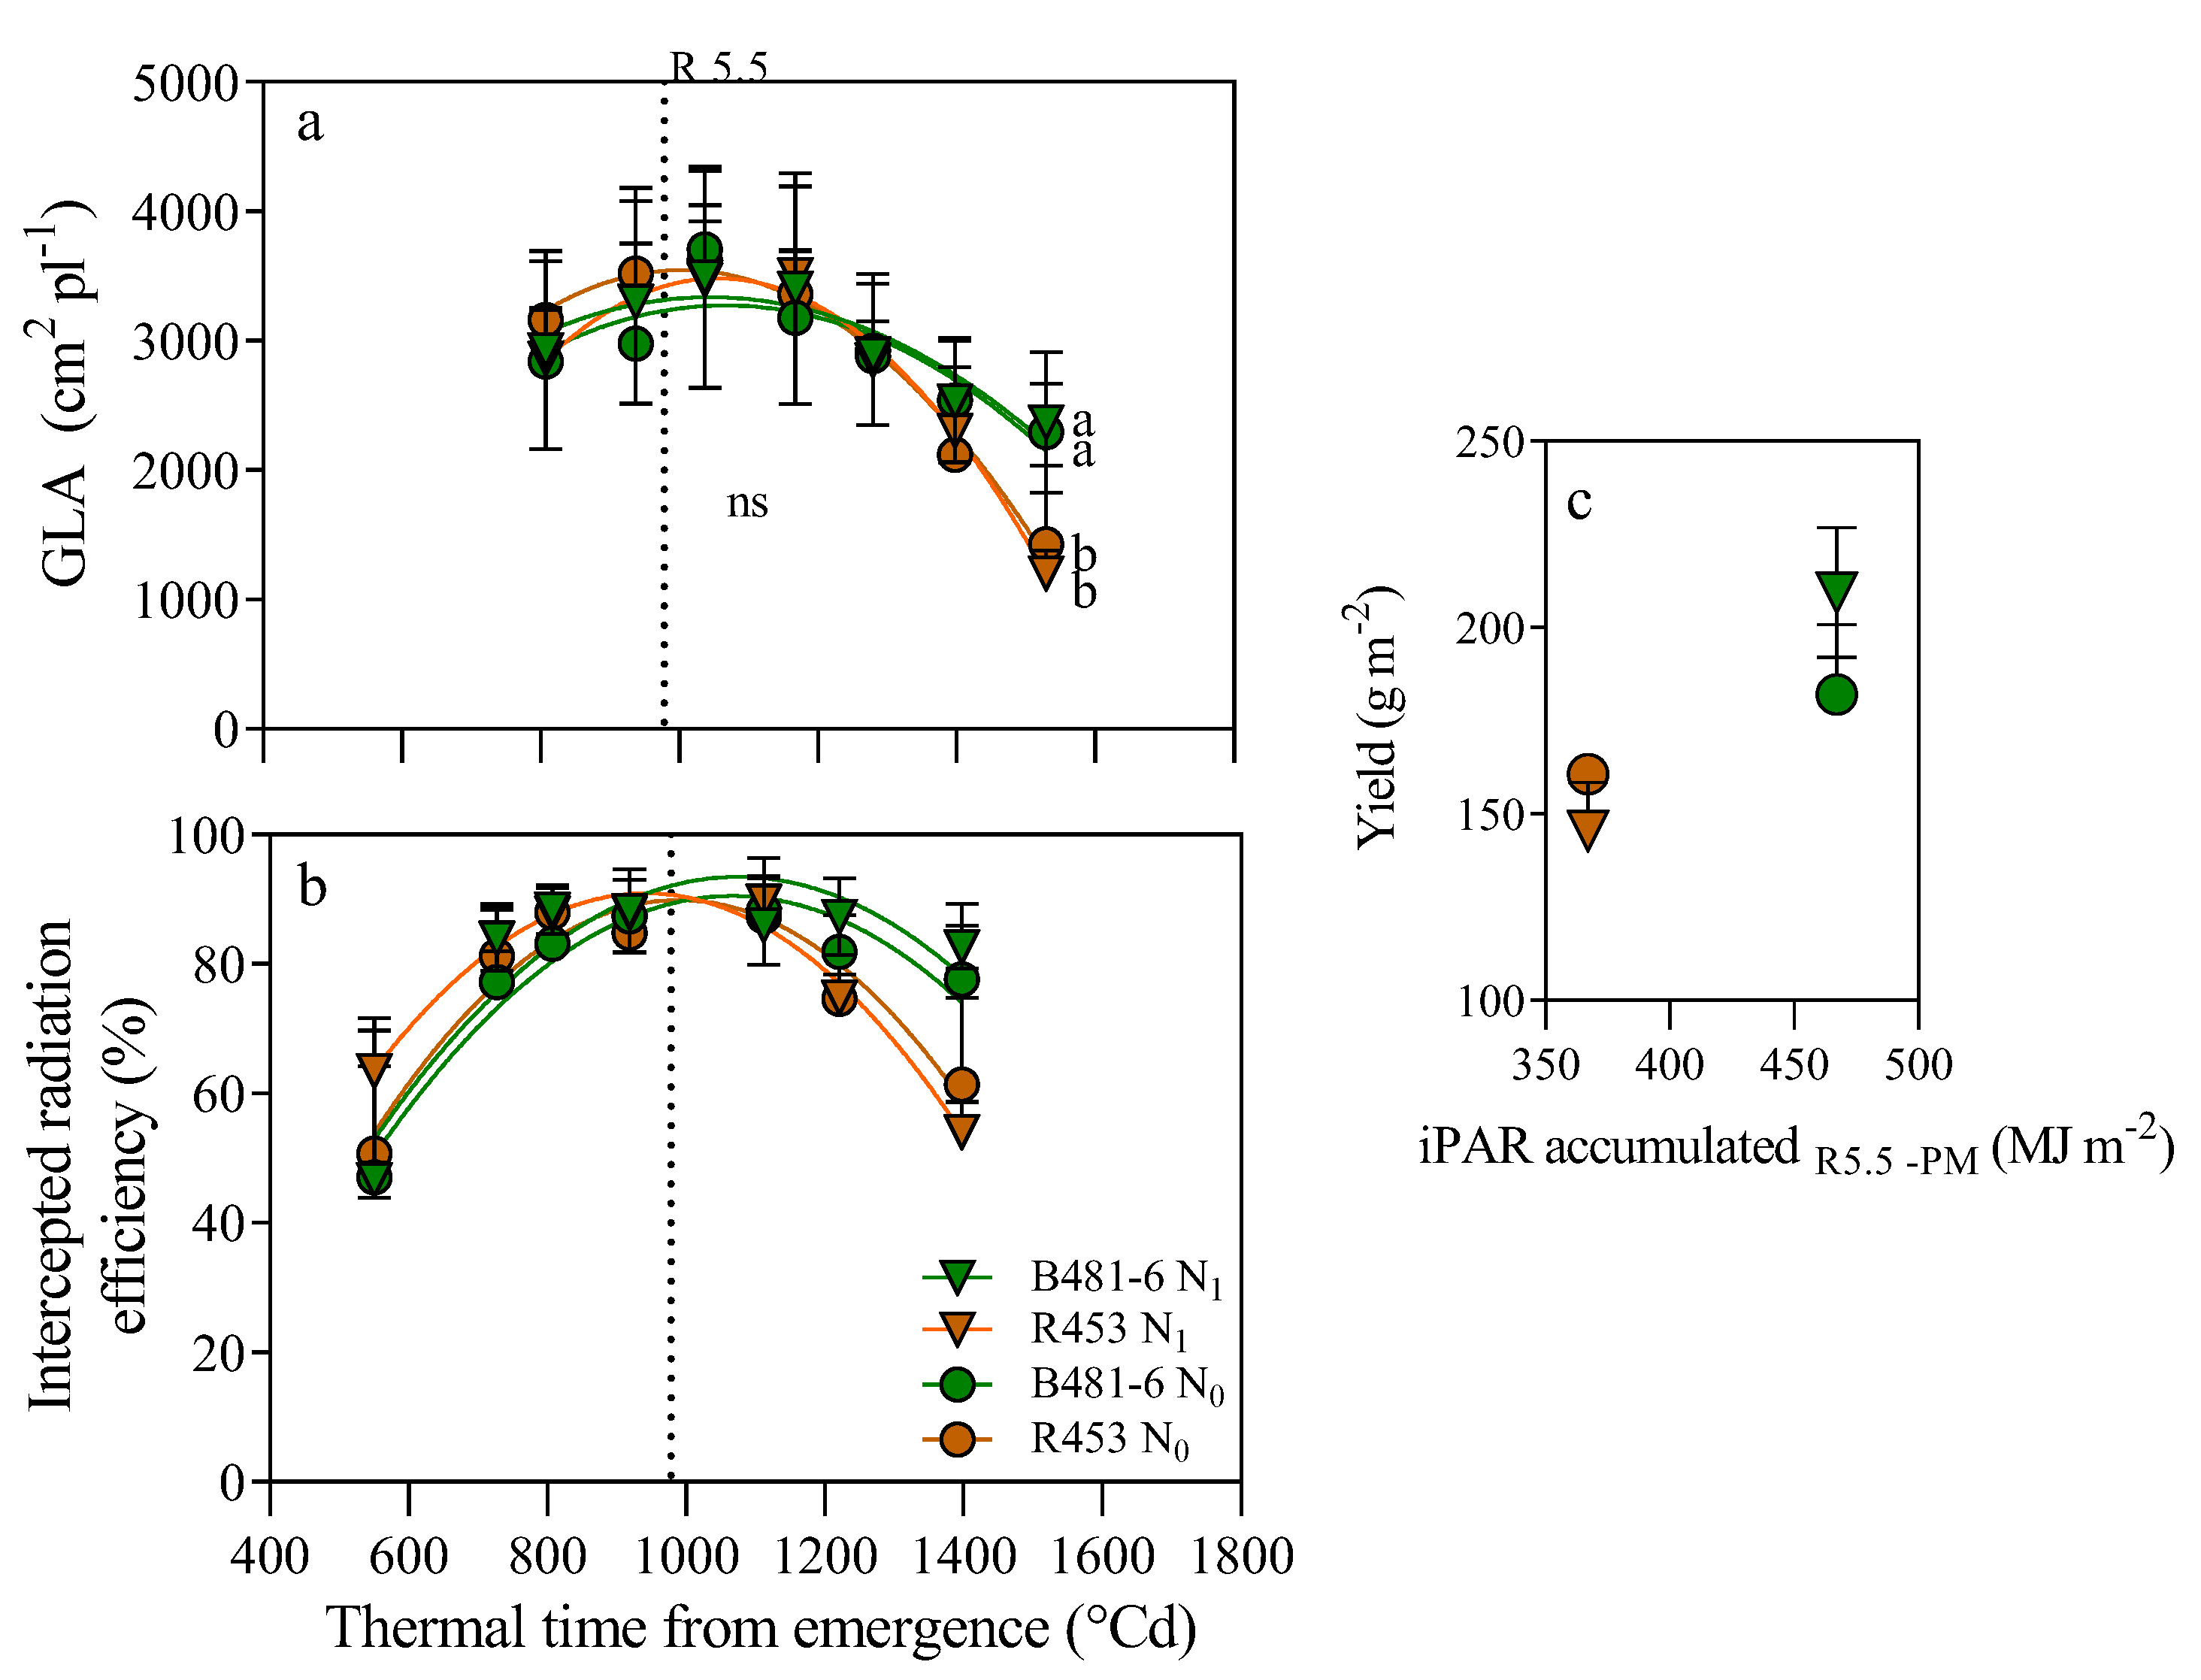
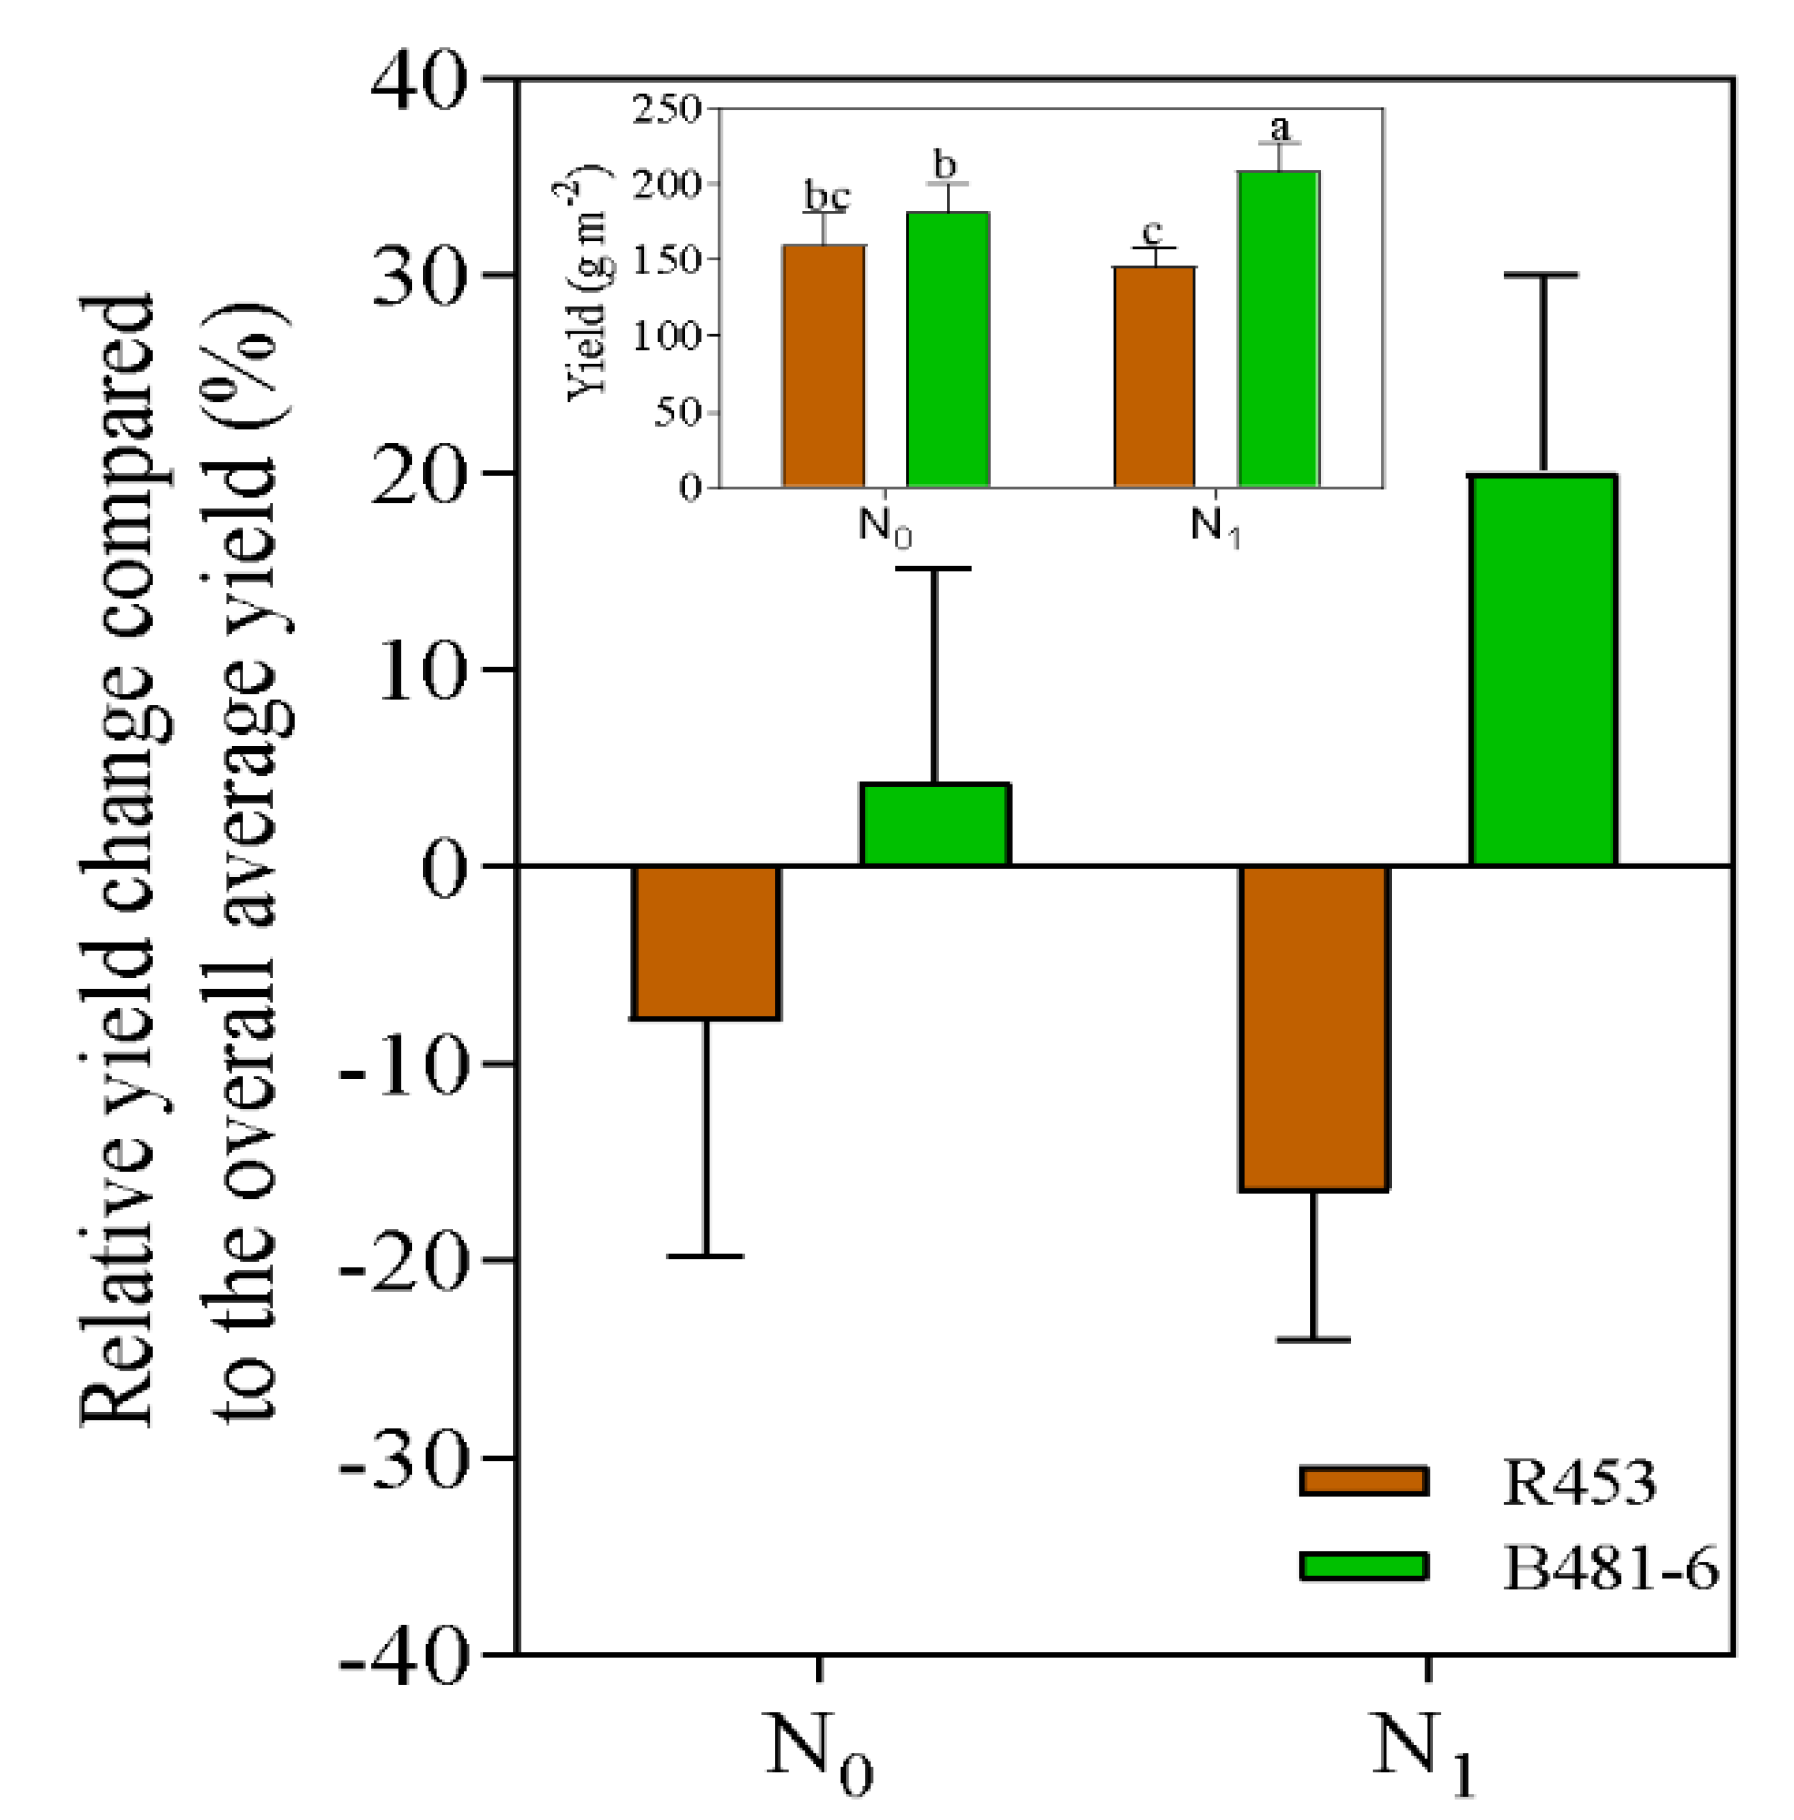
Leaf senescence in plants is the last stage of leaf development that is characterized by a decline in photosynthetic activity, an active degeneration of cellular structures and the recycling of accumulated nutrients to areas of active growth such as buds, young leaves, flowers, fruits and seeds. This process holds economic significance as it can impact yield, influencing the plant´s ability to maintain an active photosynthetic system during prolonged periods, especially during the grain filling stage, which affects plant weight and oil content. It can be associated with different stresses or environmental conditions, manifesting itself widely in the context of climate change and limiting yield, especially in crops of agronomic relevance. In this work we study the stability of two widely described sunflower genotypes belonging to the INTA Breeding Program against differential N conditions, to verify their yield stability in control conditions and under N supply. Two inbred lines were utilized, namely R453 (early senescence) and B481–6 (late senescence), with contrasting nitrogen availability in the soil but sharing the same ontogeny cycle length. It was observed that, starting from R5.5, the B481-6 genotype not only delayed senescence but also exhibited a positive response to increased nitrogen availability in the soil. This response included an increase in intercepted radiation, resulting in a statistically significant enhancement in grain yield. Conversely, the R453 genotype did not show significant differences under varying nitrogen availability and exhibited a tendency to decrease grain yield when nitrogen availability was increased. The response to nitrogen can vary depending on the specific genotype.

Keywords: 
;  ;  ;  

1. Introduction

Sunflower (Helianthus annuus L.) is an economically important crop containing 20-27 % proteins and 25-28 % edible oil [1]. Sunflower oil is considered as top-quality, because it has a high level of polyunsaturated fatty acids[2]. Following 51 rapeseed, mustard, and cotton, sunflower is the fourth major oilseed crop worldwide [3,4].
Leaf senescence is a complex mechanism controlled by multiple genetic and environmental variables that influence the yield of crops[5]. A delay or reduction in the senescence rate not only benefits the plant by allowing for a longer photosynthesis time, but can also allow plants to remobilize more nutrients accumulated in the senescence leaves to maximize their final contribution to plant reproduction[6]. In plants, senescence is a prelude to cell (organ) death, and during this process metabolites and macromolecules released are reutilized for plant growth [7]. The advances in genomic and post genomic technologies in the last decade allowed the discovery and functional characterization of many genes simultaneously. Functional genomics allows the integrated analysis of data derived from transcriptomics and other post-genomic disciplines such as proteomics and metabolomics, leading to the identification of the function and regulation of genes in certain biological processes. The scenario of genomic biotechnology has radically changed the context of application of classical statistical techniques and is leading to a paradigm shift for the analysis of biological data.
The implementation of RNA-seq technology for the study of leaf senescence in sunflower has been recently studied by our group. In this study, we identify gene expression profiling, metabolic pathways and gene co-expression networks associated with leaf senescence in contrasting sunflower genotypes [8].
The response to nitrogen fertilization in sunflower (and its complementation with P) regarding yield and grain quality is strongly related to the soil supply, the genotypic characteristics, and the adequate water supply during the crop cycle [9]. Furthermore, it is necessary to consider that the evaporative demand by the crop is 300 mm and considering the high water and N requirements during the period ranging from 2-4 leaf pairs to anthesis (approximately 20 to 80 days after the emergence), where 75% of the N absorption is produced in the 30 days around anthesis [10]. This is a key factor since nitrogen plays an important role in the processes of growth, development, leaf senescence and yield generation [11]. If the soil is provided with adequate amounts of N, this supply will be sufficient to meet the demand of the crop and therefore fertilization will be an unnecessary practice, giving a situation of luxury consumption by the plant. According to the early applications [12] are those that generate a greater absorption of nitrogen by the sunflower. The crop yields depend directly on the duration of the foliar area, between the stages of anthesis and physiological maturity [13]. An important parameter to consider is the NUE (nitrogen use efficiency) which indicates the crop´s capacity to incorporate nitrogen from soil sources (acquisition) and utilize it for growth (utilization). However, both the response to fertilization and the NUE have high genetic variability and environmental responses that may influence these parameters [9]. In turn, it is necessary to consider how nitrogen supply affects the capacity to capture radiation and convert it to dry weight. Previous studies showed that this capacity depends mainly on two components: I) Green leaf area of the crop capable of capturing the light which can be potentially limited by leaf duration, related –in turn- with leaf senescence [14]. II) The photosynthesis activity per unit of green surface of the crop (capacity to convert intercepted radiation into assimilated, that is, chemical energy), which is related with the accumulation of nitrogen in leaves [15].
The signal of senescence occurs in response to the combination of environmental stimuli and gene expression. The leaf is the main photosynthetic organ of plants, and its development is a complex process governed by a combination of developmental and environmental stimuli which involves also post-transcriptional modifications due to the interference of the environment in the gene expression.
During early development, the leaf is a sink that receives nutrients from the rest of the plant; however, as soon as it reaches full photosynthetic capacity, it becomes the main source organ of the plant [16].
Under nutritional deficiency, where senescence is prematurely triggered, the increase of soluble sugars can lead to a loss in both functional and structural integrity in cell membranes, increasing the lipid catabolism of the membrane and the production of sugar by gluconeogenesis [17]. During senescent leaf metabolism, the assimilation of carbon and nitrogen is replaced by a catabolism of chlorophyll and macromolecules such as proteins, RNA and membrane lipids, whose degradation marks the phase of senescence [18]. This event should have prevalence in the advanced grain filling phase, driving the remobilization of the nutrients stored in the leaves and in the stem, which in optimal conditions will satisfy the demand of the destination.
The "stay green" genotypes (SG) condition is a mechanism to mitigate the premature leaf senescence and potentially to extend the period of PAR (Photosynthetically Active Radiation) capture by a crop, promoting a delay in the activation of the signaling cascade of nutrient remobilization and foliar senescence. This impacts on several parameters, firstly if the stay green genotype is functional and the photosynthetic machinery does not lose efficiency, the RUE (Radiation Use Efficiency) increases, leading to a greater accumulation of photoassimilates. On the other hand, due to the hormonal balance (particularly, increase in the cytokinin concentration), many photoassimilates may end up in the roots, generating a more active root system that will be able to absorb more nutrients available, a situation that will have an impact on the delay of the remodeling of nutrients (balance of C / N) [19]. These two phenomena (the remobilization and the contribution of N edaphic) have equal preponderance in the demand of N by the reproductive destinies, the reason why both are an important source of nutrients. Additionally, the primary determinant of crop biomass production is cumulative net photosynthesis over the growing season[20], where photosynthesis is defined as a plant process using the energy from light to convert carbon dioxide (CO2) and water (H2O) into oxygen (O2) and carbohydrates [21]. The aim of this work is to characterize two contrasting sunflower genotypes under varying soil nitrogen supplements. We aim to evaluate the stability of these genotypes across control and nitrogen-supplemented conditions to validate the treatment independence for the age-induced senescence trait under different nutritional environments/conditions.

2. Results

2.1.1. Environmental Conditions and Phenology
This section may be divided by subheadings. It should provide a concise and precise description of the experimental results, their interpretation, as well as the experimental conclusions that can be drawn. Environmental conditions and phenology
The phenological study revealed a precise sequence of events from the seeding stage to physiological maturity, providing a detailed insight into plant development. The initial phase (from seeding to emergence) lasted only four days, highlighting the rapid germination and emergence of sunflower seedlings in our study environment. Following emergence, the time to R1 stage (characterized by floral bud formation) was 42 days for both genotype B481-6 and genotype R453. The time to the onset of R5.5 was also similar in both genotypes but we observed that the time elapsed from anthesis to physiological maturity was approximately 40 days for genotype B481-6 and 31 days for genotype R453, thus completing a total phenological cycle of 98 and 89 days, respectively.
In relation to the climatic conditions, Figure 1 displays the average values of temperature, radiation, and accumulated precipitation. The average temperatures remained around 24 °C during the flowering period, with recorded minimums between 18 °C and a maximum of 32 °C. Regarding radiation, it remained constant at approximately 21 MJ m-2d-1 during the same stage.
Precipitation was consistent, although the highest accumulation was observed in region R1 stage, reaching 111 mm, and around R5.5 with 43 mm.
2.1.2. Net photosynthesis and Stomatal Conductance
No differences among treatments and genotypes were observed for net photosynthesis (Pn) and its related traits at leaf 5 and the last leaf (Figure 2). At leaf 10, Pn remained stable (around 35 µmol m-2 s-1 across all treatments) during both the R1 and R5.5 stages. On average, a drastic drop was observed at the R8 stage, although this decline was more pronounced in the early-senescent genotype R453 (dropping to approximately 5 µmol m-2 s-1 in the unfertilized treatment, Figure 2b) compared to the delayed-senescent genotype B481-6. Interestingly, the Pn pattern observed at R8 was not mirrored by stomatal conductance (gs), as no differences among treatments were detected for this trait at the same thermal time (Figure 2e). However, at the R5.5 stage, gs was 30% lower in genotype B481-6 fertilized than the early-senescent one unfertilized, despite no differences being observed for Pn.
In contrast to the trends observed for Pn at leaf 10, no clear temporal tendences were found for intercellular CO2 concentration (Ci, Figure 3d). However, at the R8 stage, the results showed a clear association with Pn: the higher the Pn, the lower the Ci. Consequently, Ci was reduced by up to 30% (from 300 to 200 ppm) in the delayed-senescent genotype compared to the early-senescent one, independently of N availability. Interestingly, this trend was also observed in the last leaf (Figure 2a) and at leaf 5 (Figure 2g). Even more notable is the fact that the fluorescence parameters ΦPSII and qP followed the same pattern as Pn in leaf 10 (Figs. 3e and 3f). Both traits remained stable until R5.5 stage. around 0.3 and 0.6 for ΦPSII and qP, respectively, but sharply decreased by the R8 state. However, the drop was more pronounced in the early-senescent R453 genotype, reaching approximately 0.5 and 0.1 for ΦPSII and qP, respectively.
2.1.3. Green Leaf Area and Intercepted Radiation
A similar trend to that observed for Pn was noted in the green leaf area (GLA, Figure 4a). At leaf 10, no differences were detected among treatments or genotypes from R1 until 1400 ºCd (around the R7 stage). Once again, the decrease in GLA was more pronounced in the R453 genotype by the R8 stage compared to B481-6, with no significant differences between fertilized and non-fertilized plants. At this stage, a significant reduction of 50% was observed in R453 and 20% in B481-6 (p<0.05). Additionally, the efficiency of intercepted radiation (%) closely correlated with the trends in GLA (Figure 4b). The highest values for intercepted radiation efficiency were recorded at the R5.5 stage, followed by a decrease of 35% in R453 and 8% in B481-6, irrespective of the different nitrogen levels in the soil.
2.1.4. Yield and Biomass
In contrast to the previously described traits, a strong interaction between genotype and nitrogen level was detected for yield. No significant differences were observed between genotypes under the N0 treatment. However, under fertilized conditions, the delayed-senescent B481-6 produced 2000 kg ha-1, while the yield of R453 was 25% lower (Figure 5). Additionally, a positive association was found between intercepted PAR (iPAR) and yield during grain filling, with a more pronounced response in B481-6 compared to R453 under the same conditions (Figure 4c).
Surprisingly, the total aerial biomass weight per plant was the same at both R5.5 and R8 stages for the overall treatments and genotypes (Table 1). Main stem weight followed a similar pattern, while leaf weight per plant was significantly higher in the fertilized B481-6 genotype
2.1.5. Molecular Analysis
Through qPCR assays, we analyzed the expression profiles of the candidate gene HaNAC01, a transcription factor, at four different time points (stages R1, R3, R7, and R8) for two sunflower genotypes. In a previous study, the HaNAC01 transcription factor was validated as a SAG (senescence associated genes) in sunflower [15,16].
Genotype R453 exhibited slightly lower relative expression levels compared to B481-6 for the HANAC01 transcription factor, with a significant increase in expression during maturity (Figure 5 c and d). In the unfertilized condition (No), lower levels of HaNAC01 were observed compared to the fertilized condition (N1), but at maturity, relative expression levels increased to similar values. These results are like those of a previous study[22], in which NAC FTs were overexpressed in the premature senescing genotype.
Sunflower HaCAB02 gene, present high sequence similarity to a chlorophyll A/B-binding protein 2 [24]. This gene is an indicator of advanced senescence phases and consequently differences in expression patterns between contrasting genotypes might arise in later sampling times [24]. Relative expression levels of HaCAB2 between contrasting genotypes showed slight differences between fertilized and unfertilized conditions (Figure 6 a and b). These differences changed as senescence progressed, and where expression levels decreased, with the R453 genotype showing a more pronounced decrease. At maturity, relative expression levels remained constant in the unfertilized condition, while in the fertilized condition, the relative expression level of HaCAB2 was higher in the R453 genotype and lower in the B481-6 genotype.

3. Discussion

Detailed research on the physiology and performance of sunflower (Helianthus annuus L.) in relation to soil nitrogen availability has provided valuable insights into the underlying mechanisms of variability in yield and physiological response of different genotypes [15,19]. In various crops, such as sunflower, delaying leaf senescence can have a significant impact on grain production by maintaining photosynthetic leaf surface during the reproductive phase [27]. However, this process is complex and influenced by various temporal, spatial, biotic, and abiotic stresses.
The study conducted on inbred lines of sunflower revealed interesting patterns in plant response to soil nitrogen availability. Significant variations were observed in physiological aspects such as net photosynthesis (Pn) at the end of the ontogenetic cycle (R8, Figure 2), influenced mainly by genotype and not by nitrogen treatment. This increase in photosynthesis was related to a higher green leaf area per plant and % of intercepted radiation (Figure 4), as previous research has demonstrated that the larger nitrogen availability of the delayed senescent genotype can lead to increases in those traits[28,29,30]. Notably, no association was found between Pn and stomatal conductance (Gs, Figure 3), discarding possible causes related to diffusion processes, although the antecedents about the effect of nitrogen availability over the later are contrasting. Thus, low Gs rates have been evidenced in plants growing with low nitrogen availability [31,32] as well as high [33] or null [34,35].
Independently of stomata conductance, lower Ci concentrations were found for the delayed senescent B481-6 genotype, when Pn rates are higher than those for the R-453. This means that the photosynthesis enhancement was produced by other no-stomata limiting processes (instead of Gs) such as the biochemical pathway. Indeed, the lower ΦPSII and qP associated with the higher Pn is explained by a possible lack of Rubisco enough to support the photosynthesis activity [36].
Despite the observations for photosynthesis and related traits at the R8 stage, a strong interaction between genotype and nitrogen level was detected for yield, as the advantage of the delayed-senescent B481-6 genotype was clearly exacerbated under fertilized conditions (Figure 5). Surprisingly, no differences in total aerial biomass were found among treatments and genotypes, suggesting that the proportion of total biomass allocated to the reproductive fraction was increased. Although the causes are no clear, a possible explanation is that, with the N1 treatment, there may have been a higher growth rate leading to a greater integral of the generative area, which is crucial for determining potential yield [37]. In this way, the B481-6 genotype could have capitalized on that potential to increase its yield compared to the more senescent genotype, due to its higher nitrogen availability even during the final stage of reproductive maturity. Further research is needed in order to check this hypothesis.
Additionally, gene expression analysis revealed interesting differences among genotypes, especially concerning nitrogen availability. The expression levels of HaCAB2 showed significant variations among genotypes and fertilization conditions, suggesting a differential response to nutrient availability, particularly nitrogen. These results highlight the complexity of the mechanisms regulating plant response to nutritional stress and the importance of considering the specific growth stage when evaluating the effects of fertilization on gene expression.
Overall, these findings provide a deeper understanding of the interaction between sunflower and soil nitrogen availability, with important implications for genetic improvement and sustainable agricultural practice. However, further research is needed to fully elucidate the underlying mechanisms of these responses and their practical application in agriculture.
In previous work in the group [6,15,23], it was identified a downregulation of CAB gene over time is lower when senescence progress due to this gene being a chlorophyll a/b binding protein, highly dependent on net photosynthesis. These results indicate that genotype B481-6 could be classified as a putative stable functional stay green and the differences in time-to-senescence rate are genetically dependent rather than to differential photosynthesis due to differences in nitrogen. Here, we observed this differential expression, both because of the genotype and the effect of the N1 treatment. This is why, as with other types of programmed cell death, plant senescence is accompanied by a decrease in protein synthesis (e.g. ribulose 1,5 bisphosphate carboxylase/oxygenase (Rubisco)], expression of senescence-downregulated genes (SDGs) often related to photosynthesis (e.g. Cab gene encoding a chlorophyll a/b-binding protein) and up-regulation of senescence-associated genes (SAGs), as well as de novo synthesis of proteins [17], being on of the most suitable molecular indicators of senescence progression [17,24].
In this study, a novel sunflower NAC transcription factor, HaNAC01, previously identified by the group [22], was evaluated and displayed increased expression during leaf development, as a positive regulator of leaf senescence, similar results were reports in Arabidopsis[40]. Regarding HaNAC01 [6,25] a putative orthologous TF for sunflower of ORE1 in Arabidopsis [42], it also presents a genotype-dependent expression. Said FT advances its expression as thermal time progresses, and consequently, natural senescence begins in the plant. This effect could be seen in Arabidopsis, wheat, soybeans and petunia [43,44,45]. NAC genes that are negative regulators of senescence appear to be rare: so far only the Arabidopsis JUB1 gene has been unequivocally identified as a negative regulator of senescence [46]. A further three NAC genes in barley (HvNAC004, HvNAC042, HvNAC046) with decreased expression at late senescence stages have been identified [47].
This is the first work which characterizes and evaluates two contrasting sunflower genotypes not only under varying soil nitrogen supplements for age induced leaf senescence trait, but also for senescent associated transcription factors associated with the process. The demonstrated stability of these genotypes across control and nitrogen-supplemented conditions validates them as future candidates for a biparental population in a regional breeding program.

4. Materials and Methods

4.1. Plant Material and Experimental Conditions

The experiment was conducted at INTA Castelar Biotechnology Institute during the 2019-2020 growing season under field conditions. Previously selected inbred lines, R453 (early senescence) and B481–6 (delayed senescence) genotypes, belonging to INTA Sunflower Breeding Program and INTA Sunflower Germplasm Collection in Manfredi, were used.
Sowing took place on November 17, 2019, in seedling trays inside a greenhouse, where the plants grew until reaching the two true-leaf stage with a length of more than 4 cm (V4, according to [25]. Subsequently, the plants were acclimated outdoors before being transplanted to their final location. Prior to sowing, soil sampling was conducted in the upper 0.40 m layer to determine nitrogen availability. The plot average initial nitrogen levels were 72 kg ha-1.
The plots consisted of 10 rows with a spacing of 50 cm and a length of 5 m. The experimental was conducted using a split-plot design with a block structure. The main plot treatment involved nitrogen fertilization with two specific conditions: Control (no fertilization, denoted as N0) and fertilized with the application of 100 kg of nitrogen (N) per hectare in the form of granular urea (denoted as N1). This fertilization condition was applied in bands at the V6 phenological stage [25] and increased the initial nitrogen level mentioned above to a value of 200 kg ha-1. The sub-plot treatment corresponded to the evaluated genotypes (R453 and B481-6). This design comprised 2 blocks of 50 m2, each with 2 sub-plots of 25 m2. The spatial arrangement was set with a row spacing of 0.5 m and a plant spacing of 0.25 m, resulting in a density of 8 plants per unit area.
Time was expressed on a thermal time basis by daily integration of air temperature with a threshold temperature of 6◦C and with plant emergence as thermal time origin[48].
Chemical control for weeds, pests, and diseases was implemented as needed, following local agronomic practices. Rainfall throughout the crop cycle was supplemented with a drip irrigation system.

4.2. Measurements

4.2.1. Phenology

Crop phenology was registered following the scale proposed by Schneiter and Miller (1981) to distinguish different phenological stages. For instance, the R1 stage (denoted as " visible star") means the point at which the inflorescence, encircled by immature bracts, becomes apparent at the apex of the plant. Additionally, at the R5.5 stage, occurring during mid-anthesis, approximately 50% of the plants have reached this critical point.
Subsequent stages, namely R7 and R8, mark significant developments in the crop's maturation process. At R7, the rear of the head initiates a transformation to a pale-yellow hue, and the grain attains 50% of its final dry weight. Advancing to R8, the back of the head takes on a yellowish tint, although the bracts persist in their green state, and the grain achieves 90% of its ultimate dry weight. Phases duration was expressed on a thermal time basis by daily integration of air temperature with a base temperature of 6 ◦C and with plant emergence as thermal time origin [48].

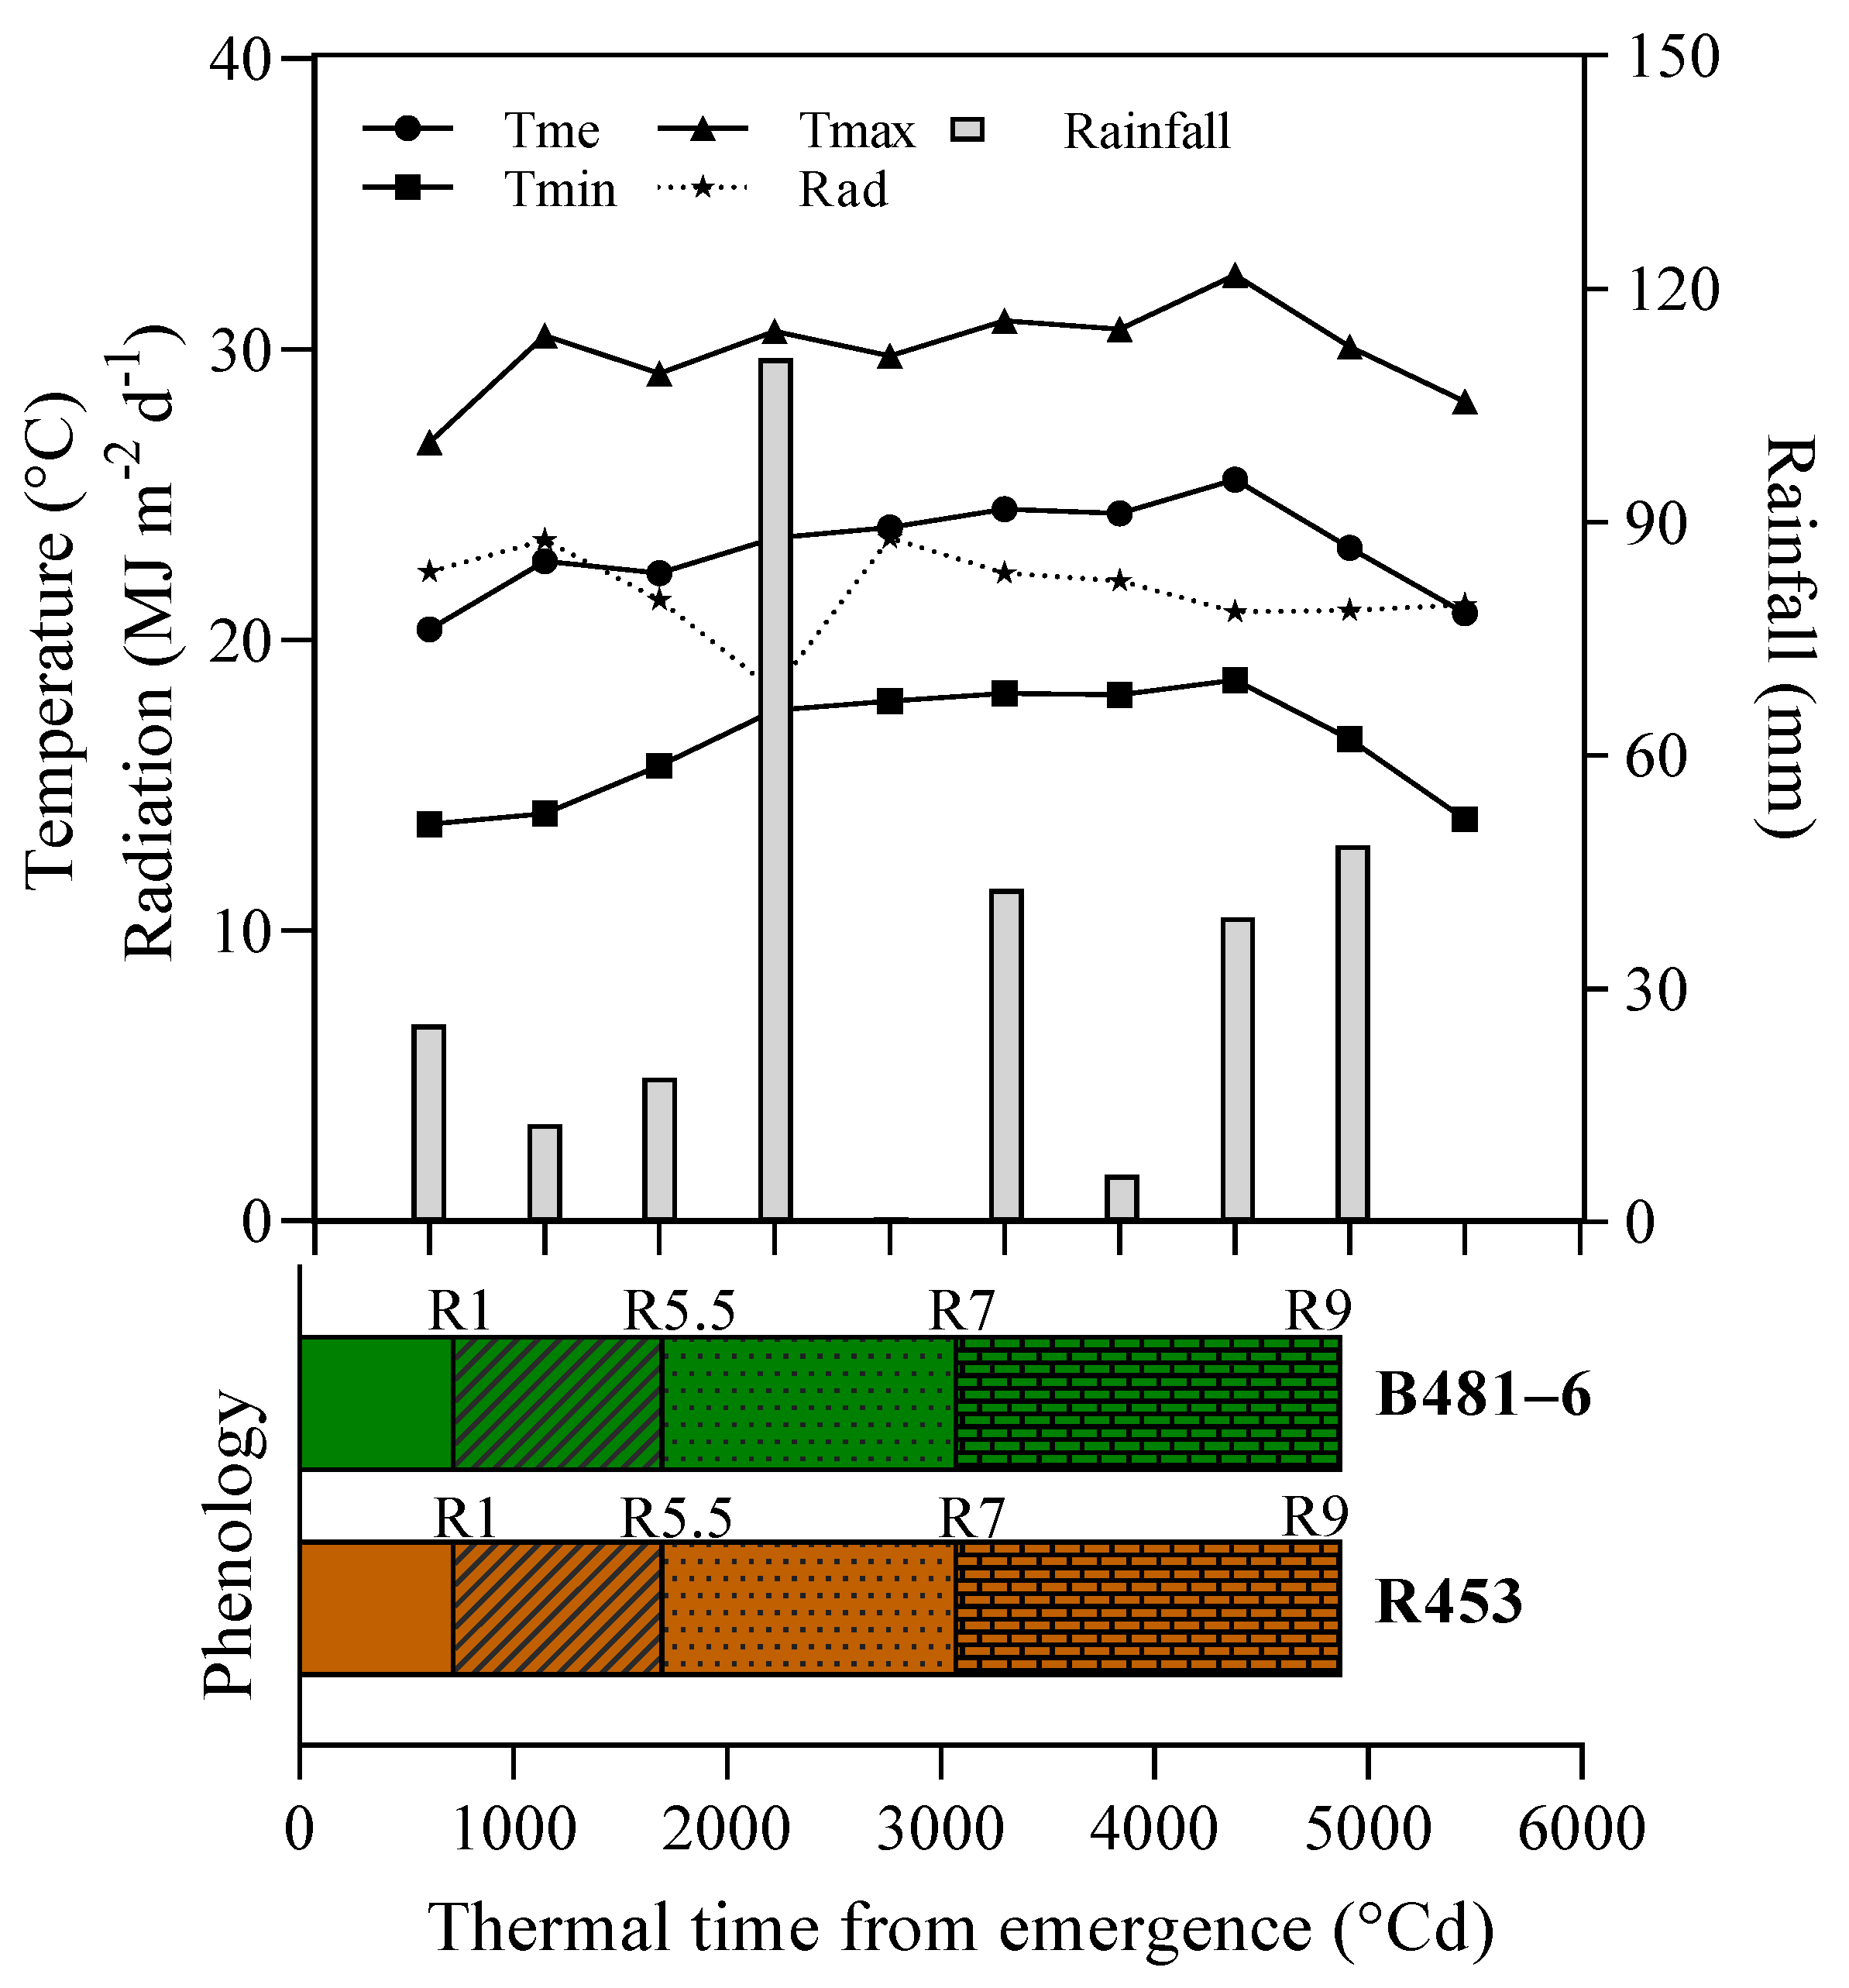
4.2.2. Climate Conditions

Hourly values of incident solar radiation, air temperature, and daily rainfall were recorded by a meteorological dataset at the Castelar Experimental Station of the National Institute of Agricultural Technology (INTA) at the experimental site. Incident photosynthetically active radiation (IPAR) was assumed to represent 45% of the incident solar radiation [49].

4.2.3. Radiation Interception

From R1 stage to physiological maturity (PM), photosynthetically active radiation interception (iPAR) of the canopy was determined with a linear ceptometer (CAVARAD, Cavadevises, Argentina) be- tween 12:00 PM and 02:00 PM on clear days. The measurements were made at each plot, one above the canopy, to determine the incident PAR (I0), and another below, following the senescence profile, representing transmitted PAR (It). The fraction of intercepted PAR (iPAR %) was calculated as (I0−It)/I0. Photosynthetically active radiation intercepted by the crop (iPAR; MJ m−2 day−1) was calculated each day as the product of iPAR %, incident global radia- tion (MJ m−2 day−1) and 0.48 (i.e. ratio of photosynthetically active to total radiation [50].

4.2.4. Green Leaf Area (GLA)

The evolution of the green leaf area was assessed through periodic measurements of the maximum width of each leaf in selected plants representative of the plots. The degree of greenness was visually evaluated by a single observer, through a comparison of the ratio between the green and yellow sections on each leaf (ranging from 100% to 0%). The subsequent determination was made by calculating the green leaf area (GLA) per plant [49,26]:
GLA ( cm 2 ) = L e a f   a r e a   c m 2 × P e r c e n t a g e   o f   g r e e n n e s s 100
Where: The Leaf Area (cm2) = 1.528 × (leaf width) 1.7235

4.2.5. Dry Weight, Yield and Its Components

In R5.5 and R8 stage and physiological maturity, total aboveground biomass was harvested from 8 plants in each plot and separated into stem, leaves and head. The material was oven dried at 65 °C until constant weight and dry weight was measured. In addition, in the physiological maturity stage, the sunflower heads were collected from a total of 10 plants. The number and weight of seeds were then measured for each collected head. To assess the performance by genotype, the following formula was used [26,51].
Yield ( g ) = A v e r a g e   f r e s h   w e i g h t   o f   s e e d s   p e r   p l a n t   ( g ) N u m b e r   o f   s e e d s × 1.000

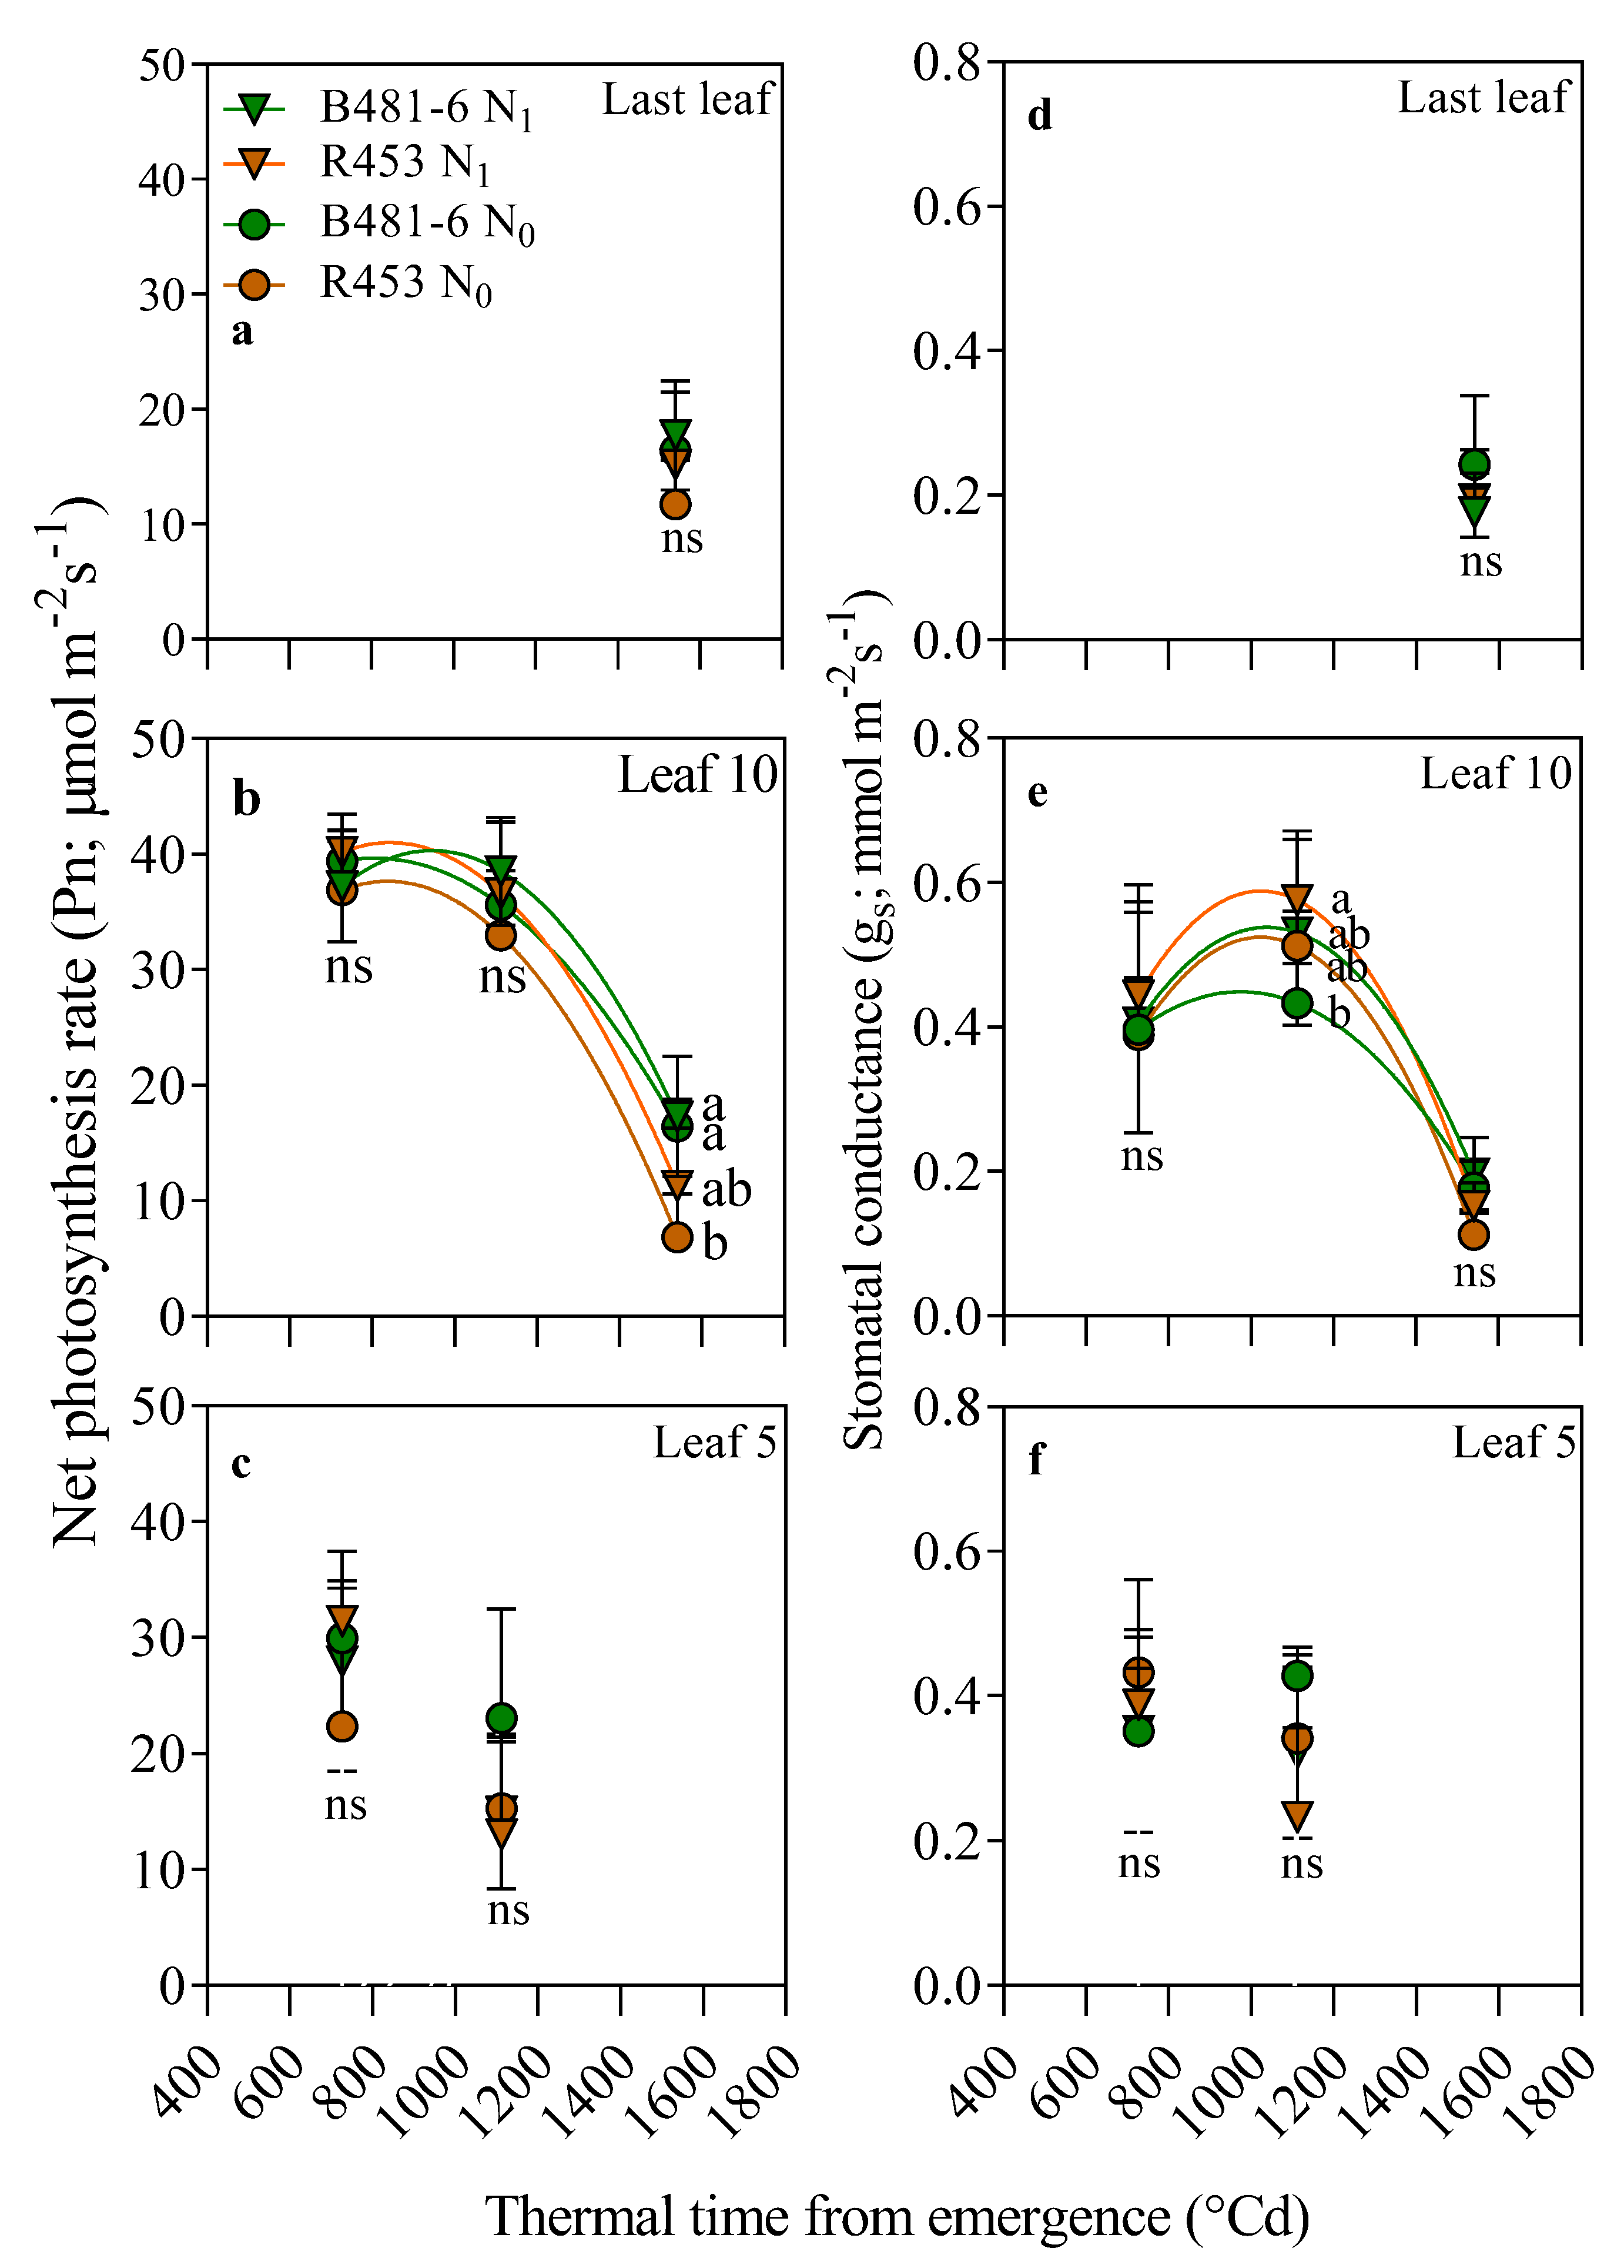
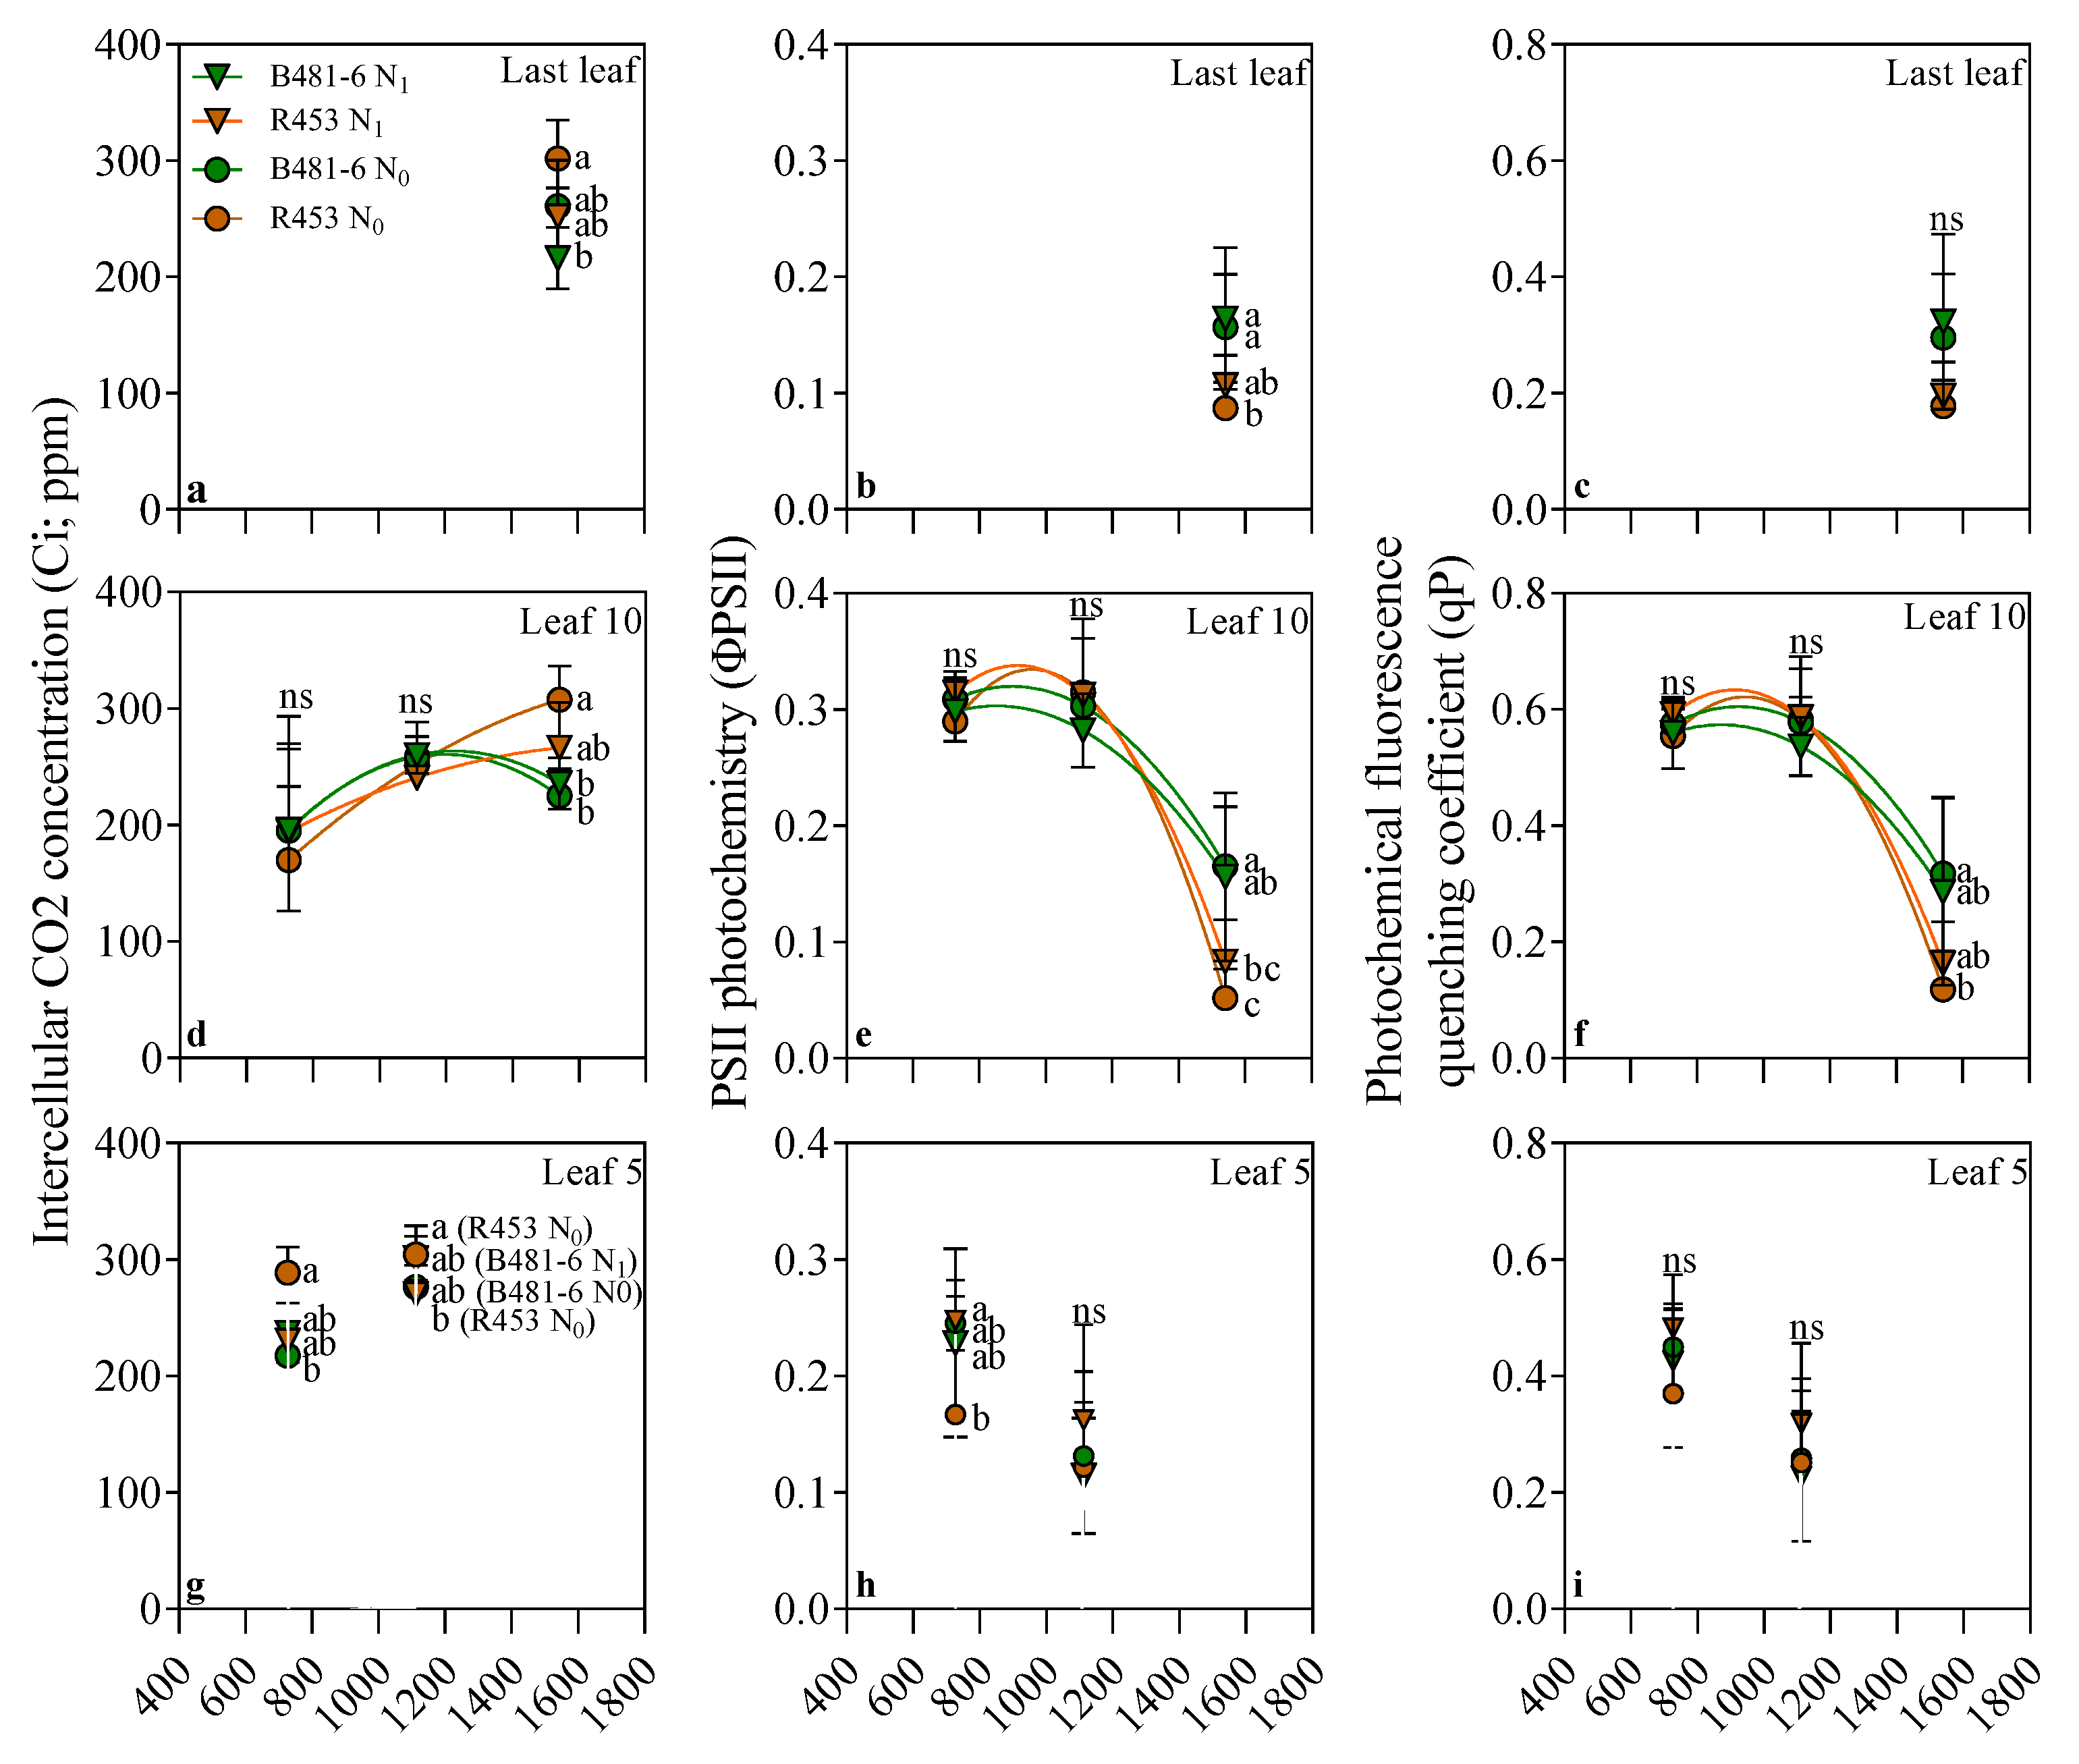
4.2.6. Leaf Physiological Measurements

Net photosynthesis rates (Pn), stomatal conductance (gs), intercellular CO2 concentration (Ci), quantum yield of PSII photochemistry (ΦPSII) and photochemical fluorescence quenching coefficient (qP) were determined for all treatments at approximately the R1 and R5.5 stages on the 5th and 10th fully expanded leaves of the plants, as well as at the R8 stage on the 10th and last fully expanded leaves (corresponding to the 15th fully expanded leaf). Measurements were taken from the lower, middle and upper strata of the plants, assessing the 5th leaf (lower stratum), the 10th leaf (middle stratum) and the last leaf (upper stratum). A portable infrared gas analyzer (IRGA), specifically the Li-Cor 6400 from Li-Cor Inc., (Lincoln, NE, United States), was used for the measurements under 2000 umol m–2 s–1 PPFD. Saturating light was provided by the 6400-40 leaf chamber fluorometer, using a mixture of 80% red and 20% blue light. Airflow, CO2 concentration in the reference chamber, and block temperature were automatically controlled by the equipment at 300 umol s−1, 400 umol mol−1 (ppm) and 25 ◦C, respectively.

4.2.7. Quantitative RT-PCR Analysis

Four different time points (stages R1, R3, R7, and R8), the tenth leaf (numbered for the bottom to the top of the plant) of 3 plants per genotype under two conditions of nitrogen were harvested, frozen in liquid nitrogen and stored at -80°C until use. High quality total RNA was isolated from 100 mg of tissue using TRIZOL and following the manufacturer’s instructions. Genomic DNA was eliminated using DNase I (Invitrogen, Argentina). RNA concentration was quantified by a Nanodrop. The purity of total RNA was determined by 260/280 nm ratio while the integrity was assessed by electrophoresis in 1.5% (w/v) agarose gel.
A quantitative analysis of RT-PCR was performed, as described by López Gialdi et al. 2016, to examine the expression of genes associated with leaf senescence. RNA treated with DNase was used for reverse transcription using the Superscript III kit (Invitrogen) and random hexamer primers. qPCR reactions were conducted with specific primers and the FastStart Universal SYBR Green Master (Rox) in a thermocycler, incorporating negative controls and verifying amplicon specificity through melting curve analysis. Thermal profile was set to 95◦C for 10 min, and 40 cycles of 95◦C for 15 s and hybridization temperature for 1 min. The optimization of hybridization temperature for each primer was previously tuned up. Each condition was biologically and technically replicated three times. The relative expression of senescence-related genes, HaNAC01 and HaCAB2, was estimated using the gene EF-1α and Actin as reference genes, which was previously selected as references genes [19]. Amplification efficiencies and Ct values were determined for each gene and condition using LinRegPCR Analysis of quantitative RT-PCR data software [52]. The expression profiles were compared between early and late senescence genotypes by using specialized software.

4.3. Data Analysis

Statistical analysis included a study of differences between treatments using the InfoStat Professional v.1.1 software [53]. This software allowed for tests of variance using a split-plot ANOVA with “nitrogen” as the main factor and “genotype” as the minor factor. To compare treatment means, the Fisher LSD (Least Significant Difference) test was employed at a significance level of 0.05. Additionally, GraphPad Prism 5 for Windows (GraphPad Software, San Diego, California, USA, www.graphpad.com) was used to generate graphs.

Author Contributions

Conceptualization DB, MC, SBL, SM and PF.; methodology, formal analysis: DB, MC, EP, NH, DA, PF; investigation: DB, MC, SN, EP, SBL, JDR, SM and PF.; data analysis: DB, MC, SN, SBL, EP, SM and PF writing—original draft preparation, DB, MC, PF.; writing—review and editing, DB, MC, SM; supervision PF. All authors have read and agreed to the published version of the manuscript.

Funding

This research was funded by INTA PE 1131022, 1131043; ANPCyT Préstamo BID PICT 2019–01602 and PIP CONICET PIP 11220120100262CO. The funding bodies provided financial support and were not involved in the design of the study, collection, interpretation or analysis of data and in writing the manuscript.

References

  1. Haj Sghaier, H. Khaeim, Á. Tarnawa, G. P. Kovács, C. Gyuricza, y Z. Kende, «Germination and Seedling Development Responses of Sunflower (Helianthus annuus L.) Seeds to Temperature and Different Levels of Water Availability», Agriculture, vol. 13, n.o 3, Art. n.o 3, mar. 2023. [Google Scholar] [CrossRef]
  2. «Oilseed crop sunflower (Helianthus annuus) as a source of food: Nutritional and health benefits - Adeleke - 2020 - Food Science & Nutrition - Wiley Online Library». Accedido: 15 de marzo de 2024. [En línea]. Disponible en: https://onlinelibrary.wiley.com/doi/full/10.1002/fsn3.1783.
  3. M. Ijaz et al., «Citric acid assisted phytoextraction of nickle from soil helps to tolerate oxidative stress and expression profile of NRAMP genes in sunflower at different growth stages», Front. Plant Sci., vol. 13, dic. 2022. [CrossRef]
  4. H. Ahmad et al., «Evaluation of Genetic Diversity in Maintainer and Restorer Inbreds of Helianthus annus L. using Multivariate Techniques», Pakistan Journal of Agricultural Research, vol. 34, jun. 2021. [CrossRef]
  5. D. Noodén, J. J. Guiamét, y I. John, «Senescence mechanisms», Physiologia Plantarum, vol. 101, n.o 4, pp. 746-753, 1997. [CrossRef]
  6. S. Nehe, S. Misra, E. H. Murchie, K. Chinnathambi, B. Singh Tyagi, y M. J. Foulkes, «Nitrogen partitioning and remobilization in relation to leaf senescence, grain yield and protein concentration in Indian wheat cultivars», Field Crops Research, vol. 251, p. 107778, jun. 2020. [CrossRef]
  7. Ostrowska-Mazurek, P. Kasprzak, S. Kubala, M. Zaborowska, y E. Sobieszczuk-Nowicka, «Epigenetic Landmarks of Leaf Senescence and Crop Improvement», International Journal of Molecular Sciences, vol. 21, n.o 14, Art. n.o 14, ene. 2020. [Google Scholar] [CrossRef]
  8. S. Moschen et al., «Exploring gene networks in two sunflower lines with contrasting leaf senescence phenotype using a system biology approach», BMC Plant Biol, vol. 19, n.o 1, p. 446, oct. 2019. [CrossRef]
  9. E. dos S. Coêlho et al., «Efficiency of Nitrogen Use in Sunflower», Plants (Basel), vol. 11, n.o 18, p. 2390, sep. 2022. [CrossRef]
  10. Bono, J. Montoya, y F. Babinec, «FERTILIZACION EN GIRASOL Resultados obtenidos en tres años de estudio».
  11. R. Melgar y M. Diaz Zorita, La fertilizacion de cultivos y pasturas. 1997. Accedido: 15 de marzo de 2024. [En línea]. Disponible en: https://agris.fao. 1226.
  12. Sosa, L.J. , Echeverria, H.E., Dosia, G.A.A, y Aguirrezabal, L.A.N., «Nitrogen nutrition of sunflower cultivated in Balcare (Buenos Aires, Argentina)», Ciencia del Suelo, vol. Vol. 17, n.o No. 1, pp. 20-26, 1999.
  13. S. J. Whitcomb, E. Heyneke, F. Aarabi, M. Watanabe, y R. Hoefgen, «Mineral Nutrient Depletion Affects Plant Development and Crop Yield», en Nutrient Use Efficiency in Plants: Concepts and Approaches, M. J. Hawkesford, S. Kopriva, y L. J. De Kok, Eds., Cham: Springer International Publishing, 2014, pp. 205-228. [CrossRef]
  14. G. A. Dosio et al., «A whole-plant analysis of the dynamics of expansion of individual leaves of two sunflower hybrids», J Exp Bot, vol. 54, n.o 392, Art. n.o 392, 2003. [CrossRef]
  15. J. De la Vega, M. a. Cantore, M. M. Sposaro, N. Trápani, M. López Pereira, y A. J. Hall, «Canopy stay-green and yield in non-stressed sunflower», Field Crops Research, vol. 121, pp. 175-185, feb. 2011. [CrossRef]
  16. E. Agüera, P. Cabello, L. de la Mata, E. Molina, y P. de la Haba, «Metabolic regulation of leaf senescence in sunflower (Helianthus annuus L.) plants», en Senescence, InTech Open Access Publisher, 2012.
  17. V. Buchanan-Wollaston et al., «The molecular analysis of leaf senescence--a genomics approach.», Plant biotechnology journal, vol. 1, n.o 1, Art. n.o 1, 2003. [CrossRef]
  18. K. Pageau, M. Reisdorf-Cren, J.-F. Morot-Gaudry, y C. Masclaux-Daubresse, «The two senescence-related markers, GS1 (cytosolic glutamine synthetase) and GDH (glutamate dehydrogenase), involved in nitrogen mobilization, are differentially regulated during pathogen attack and by stress hormones and reactive oxygen species in Nicoti», Journal of experimental botany, vol. 57, n.o 3, Art. n.o 3, 2006. [CrossRef]
  19. E. Heyneke et al., «Characterization of the Wheat Leaf Metabolome during Grain Filling and under Varied N-Supply», Front. Plant Sci., vol. 8, nov. 2017. [CrossRef]
  20. D. R. Ort et al., «Redesigning photosynthesis to sustainably meet global food and bioenergy demand», Proceedings of the National Academy of Sciences, vol. 112, n.o 28, pp. 8529-8536, jul. 2015. [CrossRef]
  21. J. Burgess y P. Wang, «Not all Calvin’s are equal: Differential control of the Calvin cycle in C3 versus C4 plants», Plant Physiology, vol. 191, n.o 2, p. 817, nov. 2022. [CrossRef]
  22. S. Moschen, «Identificación y caracterización funcional de genes candidatos asociados a la senescencia foliar en girasol basado en perfiles transcripcionales y metabólicos», p. 183, 2014.
  23. S. Bengoa Luoni, «Análisis, identificación y validación de factores de transcripción asociados a senescencia foliar temprana en girasol (Helianthus annuus L.)», Universidad Nacional de San Martin, San Martin, Argentina, 2014.
  24. P. O. Lim, H. J. Kim, y H. G. Nam, «Leaf Senescence», Annual Rev. Plant Biol., vol. 58, pp. 115-136, 2007. [CrossRef]
  25. A. Schneiter y J. F. Miller, «Description of sunflower growth stages», Crop Science, vol. 21, pp. 901-903, 1981.
  26. I. López Gialdi et al., «Identification and characterization of contrasting sunflower genotypes to early leaf senescence process combining molecular and physiological studies (Helianthus annuus L.)», Plant Science, vol. 250, pp. 40-50, 2016. [CrossRef]
  27. P. L. Gregersen, A. Culetic, L. Boschian, y K. Krupinska, «Plant senescence and crop productivity.», Plant molecular biology, vol. 82, n.o 6, Art. n.o 6, 2013. [CrossRef]
  28. D. J. Connor, J. A. Palta, y T. R. Jones, «Response of sunflower to strategies of irrigation. III. Crop photosynthesis and transpiration», Field Crops Research, vol. 12, pp. 281-283, 1985.
  29. D. E. McCullough, A. Aguilera, y M. Tollenaar, «N uptake, N partitioning, and photosynthetic N-use efficiency of an old and a new maize hybrid», Can. J. Plant Sci., vol. 74, n.o 3, pp. 479-484, jul. 1994. [CrossRef]
  30. D. J. Connor, A. J. Hall, y V. O. Sadras, «Effect of Nitrogen Content on the Photosynthetic Characteristics of Sunflower Leaves», Functional Plant Biol., vol. 20, n.o 3, pp. 251-263, 1993. [CrossRef]
  31. M. R. Broadley, A. J. Escobar-Gutiérrez, A. Burns, y I. G. Burns, «What are the effects of nitrogen deficiency on growth components of lettuce?», The New Phytologist, vol. 147, n.o 3, pp. 519-526, sep. 2000. [CrossRef]
  32. Z. Shangguan, M. Z. Shangguan, M. Shao, y J. Dyckmans, «Effects of Nitrogen Nutrition and Water Deficit on Net Photosynthetic Rate and Chlorophyll Fluorescence in Winter Wheat», Journal of Plant Physiology, vol. 156, n.o 1, pp. 46-51, ene. 2000. [Google Scholar] [CrossRef]
  33. S. Ciompi, E. S. Ciompi, E. Gentili, L. Guidi, y G. F. Soldatini, «The effect of nitrogen deficiency on leaf gas exchange and chlorophyll fluorescence parameters in sunflower», Plant Science, vol. 118, n.o 2, pp. 177-184, ago. 1996. [Google Scholar] [CrossRef]
  34. «Photosynthetic parameters in seedlings of Eucalyptus grandis as affected by rate of nitrogen supply - GRASSI - 2002 - Plant, Cell & Environment - Wiley Online Library». Accedido: 24 de octubre de 2024. [En línea]. Disponible en: https://onlinelibrary.wiley.com/doi/full/10.1046/j.1365-3040.2002.00946.x.
  35. Cechin y T. de Fátima Fumis, «Effect of nitrogen supply on growth and photosynthesis of sunflower plants grown in the greenhouse», Plant Science, vol. 166, n.o 5, pp. 1379-1385, may 2004. [CrossRef]
  36. H. Lambers y R. Oliveira, «Plant Physiological Ecology», Plant Physiological Ecology, ene. 2019. [CrossRef]
  37. Marc y J., H. Palmer, «Photoperiodic sensitivity of inflorescence initiation and development in sunflower», Field Crops Research, vol. 4, pp. 155-164, ene. 1981. [Google Scholar] [CrossRef]
  38. S. Moschen et al., «Integration of transcriptomic and metabolic data reveals hub transcription factors involved in drought stress response in sunflower (Helianthus annuus L.)», Plant Molecular Biology, vol. 94, n.o 4-5, Art. n.o 4-5, 2017. [CrossRef]
  39. S. Balazadeh, D. M. S. Balazadeh, D. M. Riaño-Pachón, y B. Mueller-Roeber, «Transcription factors regulating leaf senescence in Arabidopsis thaliana», Plant Biology, vol. 10, n.o (Suppl. 1), Art. n.o (Suppl. 1), sep. 2008. [Google Scholar] [CrossRef]
  40. Kim, H. R. Woo, y H. G. Nam, «Toward Systems Understanding of Leaf Senescence: An Integrated Multi-Omics Perspective on Leaf Senescence Research», Mol Plant, vol. 9, n.o 6, pp. 813-825, jun. 2016. [Google Scholar] [CrossRef]
  41. S. Bengoa Luoni, «Genome-wide and comparative phylogenetic analysis of senescence-associated NAC transcription factors in sunflower (Helianthus annuus)», BMC Genomics, 2021.
  42. J. Kim, K. J. Kim, K. Baek, y C.-M. Park, «Optimization of conditions for transient Agrobacterium-mediated gene expression assays in Arabidopsis», Plant Cell Reports, vol. 28, pp. 1159-1167, 2009.
  43. H. J. Kim et al., «Gene regulatory cascade of senescence-associated NAC transcription factors activated by ETHYLENE-INSENSITIVE2-mediated leaf senescence signalling in Arabidopsis.», Journal of experimental botany, vol. 65, n.o 14, Art. n.o 14, jul. 2014. [CrossRef]
  44. D. Zhao, a. P. Derkx, D.-C. Liu, P. Buchner, y M. J. Hawkesford, «Overexpression of a NAC transcription factor delays leaf senescence and increases grain nitrogen concentration in wheat», Plant Biology, p. n/a-n/a, 2015. [CrossRef]
  45. S. A. Trupkin et al., «Identification and expression analysis of NAC transcription factors potentially involved in leaf and petal senescence in Petunia hybrida», Plant Science, vol. 287, p. 110195, oct. 2019. [CrossRef]
  46. Wu, *!!! REPLACE !!!*; et al. , «JUNGBRUNNEN1, a reactive oxygen species-responsive NAC transcription factor, regulates longevity in Arabidopsis.», The Plant cell, vol. 24, n.o 2, Art. n.o 2, feb. 2012. [Google Scholar] [CrossRef]
  47. «Members of the barley NAC transcription factor gene family show differential co-regulation with senescence-associated genes during senescence of flag leaves | Journal of Experimental Botany | Oxford Academic». Accedido: 24 de octubre de 2024. [En línea]. Disponible en: https://academic.oup.com/jxb/article/65/14/4009/588262.
  48. J. R. Kiniry, R. Blanchet, J. R. Williams, V. Texier, K. Jones, y M. Cabelguenne, «Sunflower simulation using the EPIC and ALMANAC models», Field Crops Research, vol. 30, pp. 403-423, 1992.
  49. J. L. Monteith, «Radiation and Crops», Experimental Agriculture, vol. 1, n.o 4, pp. 241-251, oct. 1965. [CrossRef]
  50. G. Szeicz, «Solar Radiation for Plant Growth», Journal of Applied Ecology, vol. 11, n.o 2, pp. 617-636, 1974. [CrossRef]
  51. «librogirs.pdf». Accedido: 24 de octubre de 2024. [En línea]. Disponible en: https://www.criba.edu.ar/morfologiavegetal/producfiles/papers/librogirs.pdf.
  52. J. M. Ruijter et al., «Amplification efficiency: linking baseline and bias in the analysis of quantitative PCR data», Nucleic Acids Res, vol. 37, n.o 6, Art. n.o 6, 2009. [CrossRef]
  53. J. A. Di Rienzo, F. Casanoves, M. G. Balzarini, L. Gonzalez, y M. Tablada, «InfoStat». 2013.
Figure 1. Meteorological conditions during the crop cycle. Values are daily means of medium (Tm), maximum (Tmax) and minimum (Tmin) temperature and daily photosynthetic incident radiation (Rad) and accumulated rainfall (Rainfall). Bars indicate the phenology of B481-6 and R453 genotypes. R1 corresponds to the "star visible" stage, while R5.5 marks mid-anthesis, R7 indicates the rear of the head initiates a transformation to a pale-yellow hue and R9 The bracts become yellow and brown following the scale proposed by Schneiter and Miller (1981) [25].
Preprints 138113 g001
Figure 2. The net photosynthesis (Pn) and stomatal conductance (gahh s) data for the 5th leaf (c;f), 10th leaf (b,e) and last leaf (a,d) in genotype B481-6 and R453 with different soil nitrogen levels as a function of thermal time to emergence (°Cd). R1 corresponds to observations taken at 727 °Cd, R5.5 at 1112 °Cd and R8 at 1540 °Cd following the scale proposed by Schneiter and Miller (1981) [25]. Vertical bars indicate ± standard error. Different letters at each phenological stages indicate significant differences for Tukey’stest at p =0.05.
Preprints 138113 g002
Figure 3. Intercellular CO₂ concentration (Ci), Quantum yield of PSII photochemistry (ΦPSII) and Photochemical fluorescence quenching coefficient (qP) data for the 5th leaf (d,e,f), 10th leaf (g,h,i) and last leaf (a,b,c) in genotype B481-6 and R453 with different soil nitrogen levels as a function of thermal time to emergence (°Cd). R1 corresponds to observations taken at 727 °Cd, R5.5 at 1112 °Cd and R8 at 1540 °Cd following the scale proposed by Schneiter and Miller (1981) [25]. Vertical bars indicate ± standard error. Different letters at each phenological stages indicate significant differences for Tukey’stest at p =0.05.
Preprints 138113 g003
Figure 4. The green leaf area (GLA) per plant (a) and fraction of intercepted PAR (iPAR %) (b) as a function of thermal time to emergence (°Cd). Insets (c): Yield (g m-2) as a function of intercepted PAR accumulated during the period from R5.5 to physiological maturity (R5.5 -PM; MJ m-2) in genotypes B481-6 and R453 with different soil nitrogen levels. A dashed line indicates mid- anthesis (R5.5). Symbols indicate nitrogen availability and colors indicate line. Vertical bars indicate ± standard error. Different letters at each phenological stages indicate significant differences for Tukey’stest at p =0.05.
Preprints 138113 g004
Figure 5. Relative yield change compared to the overall average yield (%) for the entire experiment under the unfertilized condition (N0) and the fertilized condition (N1) in lines R453 and B481-6. Insets: Yield (g m-2) as a function of fertilized conditions. Different letters indicate significant differences (p < 0.05) between treatments.
Preprints 138113 g005
Figure 6. qPCR Assays: Relative expression profiles of transcription factors under unfertilized (N0) and fertilized (N1) conditions in genotypes R453 and B481-6. (a y b) HaCAB2 (senescence marker gene; SDG in sunflower) and (b y d) HaNAC01 - SAGs in sunflower. Relative transcript levels are depicted as the ratio (log2 scale) between the gene expression of the premature senescence genotype and its contrasting delayed senescence genotype.
Preprints 138113 g006
Table 1. Flower head (g pl-1), leave (g pl-1), stem (g pl-1), and total aerial biomass (g pl-1) of two sunflower inbred lines grown under different nitrogen conditions: unfertilized condition (N0) and fertilized condition (N1) at R5.5 and R8R7 stages. Mean values and significance for main factors (G= genotypes; N= nitrogen) and interaction are presented.
Phenological stages Nitrogen Genotypes Flower head
(g pl-1)
Leaves
(g pl-1)
Stem
(g pl-1)
Total aerial biomass
(g pl-1)
R5.5 stage N0 B481-6 95.7 a 134.0 a 256.3 a 486.0 a
R453 171.3 a 158.6 a 376.5 a 706.4 a
N1 B481-6 162.0 a 204.0 a 437.3 a 803.3 a
R453 143.4 a 169.9 a 275.7 a 710.3 a
G ns ns ns ns
N ns ns ns ns
G*N * ns ns ns
R8 stage N0 B481-6 334.3 a 140.1 b 299.1 a 773.5 a
R453 406.9 a 133.6 b 296.9 a 837.4 a
N1 B481-6 439.7 a 181.4 a 313.7 a 934.8 a
R453 496.1 a 123.4 b 305.3 a 924.7 a
G ns ** ns ns
N ns ns ns ns
G*N ns * ns ns
*ns = non-significant difference p ≥ 0.05; *p < 0.05; **p < 0.01; ***p < 0.001. Within each column, means followed by the same letter indicate no significant differences at p = 0.05 (Tukey test) effect.
Disclaimer/Publisher’s Note: The statements, opinions and data contained in all publications are solely those of the individual author(s) and contributor(s) and not of MDPI and/or the editor(s). MDPI and/or the editor(s) disclaim responsibility for any injury to people or property resulting from any ideas, methods, instructions or products referred to in the content.
Copyright: This open access article is published under a Creative Commons CC BY 4.0 license, which permit the free download, distribution, and reuse, provided that the author and preprint are cited in any reuse.
Prerpints.org logo

Preprints.org is a free preprint server supported by MDPI in Basel, Switzerland.

Subscribe

Disclaimer

Terms of Use

Privacy Policy

Privacy Settings

© 2025 MDPI (Basel, Switzerland) unless otherwise stated