
Submitted:
07 October 2024
Posted:
10 October 2024
You are already at the latest version
Abstract
Wheat is one of the most important crops to ensure food production globally. Understanding the mechanism of leaf senescence in wheat plays a crucial role in improving its productivity and resilience under varying stress scenario. In this study, we investigated biochemical, functional, and ultrastructural changes during leaf senescence in wheat genotypes with contrasting drought tolerance. For this, key parameters such as chlorophyll and total protein content, membrane stability, malondialdehyde level, and the activity of antioxidant enzymes (superoxide dismutase, ascorbate peroxidase, guaiacol peroxidase, benzidine peroxidase, catalase) were comparatively analyzed during both natural and drought-induced senescence. Additionally, the expression of superoxide dismutase isoform genes functioning in different cellular compartments was studied, alongside ultrastructural changes in flag leaves. The experiments involved genotypes of bread wheat (Triticum aestivum L.) and durum (Triticum durum Desf.) wheat. After the booting stage, irrigation was discontinued for drought-treated plants. Flag leaves were sampled at 7, 14, 21, 28, and 35 days after anthesis. The drought-tolerant genotypes exhibited slower chlorophyll degradation, lower lipid peroxidation levels, higher membrane stability, and more robust antioxidant responses, maintaining cellular function longer than the sensitive genotypes, which showed accelerated leaf senescence. Transcript levels of FeSOD increased significantly post-flowering but declined as senescence progressed, while MnSOD expression rose towards the end of ontogenesis. Ultrastructural analysis revealed progressive damage to chloroplast membranes, thylakoid structures, and mesophyll cell walls under stress conditions. These findings contribute to a deeper understanding of the physiological and molecular responses of wheat to drought stress, offering potential targets for improving crop performance in water-limited environments.
Keywords:
Wheat
; flag leaf senescence
; drought
; antioxidant enzymes
; expression of SOD genes
; ultrastructural changes
1. Introduction
Wheat is a globally significant crop and a vital source of human nutrition (Cheng et al., 2024). The senescence of wheat leaves is a key physiological process that directly impacts grain yield and quality. Understanding the mechanisms governing leaf senescence is crucial for developing strategies to enhance wheat productivity and resilience (Zhao et al., 2022; Chapman et al., 2021; Hassan et al., 2021).
Leaf senescence is a developmental process characterized by a series of programmed disassembly and degenerative events, such as the accumulation of reactive oxygen species, degradation of macromolecules, breakdown of intracellular organelles, and the transition from nutrient assimilation to remobilization (Li et al., 2024; Woo et al., 2019). Natural leaf senescence is typically associated with age and accelerates as the plant transitions from vegetative to reproductive growth (Aloryi et al., 2023). During physiological leaf senescence, stored nutrients accumulated in the leaves are translocated to actively growing organs, and in cereals, to the grain (Guo et al, 2021). Premature senescence, induced by unfavorable environmental conditions, can reduce crop yields. Various abiotic stressors, including drought, extreme temperatures, salinity, nutrient deficiencies, and light intensity, as well as biotic factors such as pathogen infections and insect infestations, can hasten the leaf senescence process (Tan et al., 2023). Furthermore, genetic factors and hormonal regulation play a pivotal role in controlling the timing and progression of leaf senescence (Cao et al., 2022; Sultana et al., 2021).
In the context of global climate change, water scarcity is expected to have the most significant negative impact on crop yields worldwide. The complex stress caused by drought can trigger premature leaf senescence and lead to early maturation of the entire plant, resulting in reduced productivity (Tan et al., 2023). Drought-induced leaf senescence contributes to plant survival under drought stress in certain species by (i) facilitating the early redirection of resources from vegetative to reproductive development, thereby ensuring the completion of the life cycle in monocarpic species, (ii) enabling the remobilization of nutrients from senescing leaves to younger leaves, which supports the survival of perennial plants, and (iii) reducing water loss at the whole-plant level (Munné-Bosch and Alegre, 2004). It has been observed that under drought conditions, nitrogen availability in the soil decreases, which initiates and accelerates the leaf senescence process (Hajibarat and Saidi, 2022). Research on drought-induced leaf senescence is critical not only for understanding how plants survive under adverse climatic conditions but also for improving agricultural productivity, as crops with delayed leaf senescence can be used to enhance crop yields (Joshi et al., 2019; Gregersen et al., 2013).
The leaf senescence process is characterized by alterations in the expression of thousands of senescence-associated genes (SAGs) (Cao et al., 2022; Camargo Rodriguez, 2021). Studies have shown that numerous transcriptional regulators govern senescence by modulating SAG expression (Cao et al., 2023; Borril et al., 2019). In addition to genetic and environmental factors, epigenetic regulation adds a new layer of complexity to our understanding of the control of leaf senescence. Epigenetic modifications, such as DNA methylation and histone modifications, influence the expression of genes associated with aging, offering additional avenues for research and potential targets for intervention (Woo et al., 2019; Yolcu et al., 2018). Multi-omics approaches have revealed that leaf senescence is governed by multiple layers of regulation, including chromatin remodeling, transcriptional and post-transcriptional processes, as well as translational and post-translational mechanisms (Zhang et al., 2021; Kim et al., 2018).
The antioxidant system plays a crucial role in mitigating the effects of aging and environmental stress (Qi et al., 2023; Nousis et al., 2023). Antioxidants are vital for maintaining cellular homeostasis and protecting plant tissues from oxidative damage during aging. The equilibrium between the production of reactive oxygen species (ROS) and the activity of the antioxidant system is a pivotal factor in determining leaf longevity and overall plant health (Yuan et al., 2023). During leaf senescence, as chlorophyll degrades and photosynthetic activity diminishes, the generation of ROS in chloroplasts increases, leading to oxidative stress (Li et al., 2023; Buet et al., 2019). This prompts the activation of antioxidant enzymes, such as superoxide dismutase, catalase, and peroxidases, to neutralize ROS and protect cellular components from oxidative damage. The dynamic regulation of antioxidant enzyme activity during leaf senescence is a complex process influenced by a range of intracellular and environmental factors (Sachdev et al., 2021; Hönig et al., 2018). Understanding the intricate relationship between these factors and antioxidant enzyme activity is crucial for elucidating the underlying mechanisms of leaf senescence (Chen et al., 2021).
Cellular organelles are known to respond rapidly to environmental stress through various adaptive and avoidance mechanisms. Leaf cell organelles across different plant species exhibit distinct changes, reflecting their survival strategies under stress (Ďúranová et al., 2023). Cell death in senescent leaves is predominantly associated with the deterioration of intracellular organelles (Lim et al., 2007). To date, most research has focused on physiological and biochemical parameters (Tefera et al., 2023) with relatively few studies examining changes at the ultrastructural level. This indicates a gap in the scientific literature regarding the ultrastructural aspects of the aging process (Gan et al., 2022). As plants age, the cell membrane's structure is initially compromised with the subsequent transition of the functional proteins of the membrane through the liquid crystal phase. The accumulation of malondialdehyde, resulting from membrane lipid peroxidation, triggers a series of physiological and biochemical changes. Chloroplasts are reported to undergo degeneration earlier in the aging process compared to mitochondrial and nuclear fragmentation (Tamary et al., 2019).
Our current understanding of leaf senescence is primarily derived from studies using model systems such as Arabidopsis (Yumoto et al., 2024; Xie et al., 2021; Zhao et al., 2023; Kim et al., 2018). Research indicates that the molecular and biochemical pathways involved in leaf senescence are highly conserved across various plant species (Guo et al., 2021; Woo et al., 2019). Investigating these pathways in wheat could yield valuable insights into the genetic and regulatory networks that govern this complex process in cereals. Recently, there has been a growing body of research on the aging process in wheat (Yan et al., 2023; Chapman et al., 2021; Sultana et al., 2021; Borril et al., 2019; Joshi et al., 2019). Transcriptomic analysis has revealed key insights into the genetic regulation underlying leaf senescence in wheat (Sultana et al., 2021; Borril et al., 2019).
Overall, managing senescence in crops such as wheat requires a thorough understanding of complex regulatory networks at various levels, including molecular, biochemical, and physiological processes. In this study, we aim to investigate the mechanisms of drought-induced senescence in contrasting genotypes of durum and bread wheat, explore the role of antioxidant enzymes during flag leaf senescence, and identify ultrastructural changes in leaves during senescence dynamics. Gaining deeper insights into different aspects of leaf senescence may allow us to identify potential targets for manipulating these processes.
2. Materials and Methods
2.1. Cultivation of Plant Material
Seeds of local bread wheat (Triticum aestivum L.) genotypes, including the tolerant Gyrmyzy gul 1 and sensitive Tale 38, as well as durum wheat (Triticum durum Desf.) genotypes, the tolerant Vugar and sensitive Tartar, were obtained from the gene bank of the Research Institute of Crop Husbandry (Baku, Azerbaijan). Five seeds of each genotype were planted in 5 L plastic pots filled with a soil mixture consisting of 40% topsoil and 60% natural sand. Throughout the experiment, the ambient temperature was maintained between 19-29°C, and the relative humidity was between 50% and 65%. The plants were grown in controlled environment chambers with a 16h light/8h dark cycle. The plants were watered 2-3 times weekly to make sure the soil stayed moist. All plants were provided with equal irrigation until the booting stage. Afterward, watering was stopped for the drought-treated plants, while the control plants continued to be watered regularly. Flag leaves were sampled 7, 14, 21, 28, and 35 days after anthesis. The leaf samples were immediately frozen in liquid nitrogen and stored at -80°C until analysis.
2.2. Chlorophyll Content
Total chlorophyll content and chlorophyll a/b ratio were determined spectrophotometrically in the 80% acetone extract according to Porra et al. (1989).
2.3. Cell Membrane Stability
For the membrane stability index (MSI), flag leaf samples (2 cm from the middle sections, with 3 repetitions for each sample) were washed three times in deionized water to remove surface electrolytes. The samples were placed in 10 ml of double-distilled water at 40°C for 30 minutes (Deshmukh et al. 1991). Electrical conductivity (C1) was measured using a conductivity meter. Subsequently, the same samples were placed in a boiling water bath (100°C) for 10 minutes, and their electrical conductivity (C2) was re-recorded. The membrane stability index (MSI) was calculated as MSI = [1 - (C1 / C2)] × 100.
2.4. Lipid Peroxidation Assay
The intensity of lipid peroxidation in plants was assessed by measuring the quantity of malondialdehyde (MDA) in flag leaf samples under both normal watering and drought stress conditions (Wang, 2011). The MDA content was determined spectrophotometrically using the Thermo Scientific Evolution 350 UV/Vis Spectrophotometer (UK, England) through its reaction with 0.5% thiobarbituric acid at wavelengths 532 nm and 600 nm. The formula used for calculation was: A = (D532 - D600) / (E * m). Where, A - represents MDA concentration, D - is the optical density, m - denotes plant wet biomass, and E - is a constant coefficient.
2.5. Total Protein Content
Soluble protein content was determined using the Bradford method (1976) at 595 nm, with bovine serum albumin used to construct the calibration curve.
2.6. Preparation of Enzyme Extract
Flag leaf samples (0.5 g) were crushed in liquid nitrogen and dissolved in a buffer solution containing 100 mM Na-phosphate (pH 7.8), 1 mM EDTA, 2 mM phenylmethylsulfonyl fluoride (PMSF), 1% polyvinylpyrrolidone (PVP), and 0.1% Triton X-100. The homogenized samples were then centrifuged at 15,000 g for 20 minutes at 4°C. The resulting supernatant was used to determine the activity of antioxidant enzymes
2.7. Ascorbate Peroxidase (APX, EC 1.11.1.11)
APX activity was measured by monitoring the decrease in optical density at a wavelength of 290 nm using a spectrophotometer (ULTROSPEC 3300 PRO, AMERSHAM, USA), following the method described by Nakano and Asada (1980). The reaction mixture contained 0.1 mM EDTA (pH 8.0), 0.05 mM ascorbate, 0.1 mM H₂O₂, 50 mM sodium phosphate buffer (pH 7.6), and 100 µl of enzyme extract. The molar extinction coefficient used was 2.8 mM⁻¹ cm⁻¹, with enzyme activity expressed in units of µmol ascorbate/ (mg protein·min).
2.8. Guaiacol Peroxidase (GPX, EC 1.11.1.7)
The activity of guaiacol peroxidase (GPX) was determined spectrophotometrically by measuring the change in optical density of the reaction solution at 470 nm over 2 minutes, as described by Zelinova et al. (2010). The reaction medium consisted of 50 mM sodium phosphate buffer (pH 7.0), 25 mM guaiacol, 25 mM H₂O₂, and 20 μl of enzyme extract. The molar extinction coefficient (ε) of 26.6 mM⁻¹ cm⁻¹ was used, with enzyme activity expressed in units of µmol guaiacol/ (mg protein·min).
2.9. Benzidine Peroxidase (BPX, EC 1.11.1.7)
Benzidine peroxidase (BPX) activity was determined spectrophotometrically by monitoring the increase in optical density of the reaction solution at 590 nm for 1 minute, as described by Gechev et al. (2002). The activity of the enzyme was calculated in units of µmol benzidine/ (mg protein·min), using an extinction coefficient (ε) of 39 mM⁻¹ cm⁻¹.
2.10. Catalase (CAT, E.C. 1.11.1.6)
For the determination of catalase (CAT) activity, 1 g of flag leaf tissue was homogenized in 10 ml of 50 mM potassium phosphate buffer (pH 7.0). The homogenate was filtered and centrifuged at 8000 g for 10 minutes to obtain a clear supernatant. For the assay, 2.9 ml of phosphate buffer (pH 7.0) was combined with 25 μl of the enzyme extract. To initiate the reaction, 90 μl of 3% hydrogen peroxide (H₂O₂) was added to the solution. The decrease in optical density at 240 nm was measured per minute using a spectrophotometer. The enzyme activity was calculated in mmol/(g·min) using a molar extinction coefficient (ε) of 39.4 mM⁻¹cm⁻¹ (Kumar and Knowles, 1993).
2.11. Superoxide Dismutase (SOD, EC 1.15.1.1)
To determine the activity of the superoxide dismutase (SOD) enzyme, a specific kit (SOD Assay Kit-WST, Sigma-Aldrich) was employed. In this study, the cytosolic isoform of SOD from plant cells was analyzed. Leaves were homogenized in 50 mM potassium phosphate buffer (pH 7.8), and the homogenate was centrifuged. The supernatant, which contained the cytosolic form of SOD, was used for further analysis. The optical density (OD) of the reaction was measured at a wavelength of 450 nm to assess SOD activity.
2.12. RNA Extraction and cDNA Synthesis
Total RNA was extracted from leaf material using the Monarch Total RNA Miniprep Kit (New England Biolabs, Inc.) following the manufacturer's instructions. Genomic DNA contamination was removed using RNase-free DNase I. The quality and quantity of the extracted RNA were assessed by agarose gel electrophoresis. RNA concentration was measured spectrophotometrically using a NanoDrop Thermo Scientific-2000C (USA). Single-stranded cDNA synthesis was performed from the total RNA using the LunaScript RT SuperMix Kit (New England Biolabs, Inc.) according to the manufacturer’s instructions, in a final volume of 20 µl.
2.13. Quantitative Real-Time PCR
PCR was conducted using a Mic Real-Time PCR system in a total reaction volume of 20 µl. Each reaction mixture contained 10 µl of Luna Universal qPCR Mix (New England Biolabs, Inc.), 1 µl of 1:5 diluted cDNA, 0.5 µl each of forward and reverse primers (10 µM), and 7 µl of nuclease-free water. The PCR protocol included an initial denaturation step at 94°C for 60 seconds, followed by 45 cycles of 95°C for 15 seconds and 60°C for 30 seconds. No-template controls (NTCs) were included for each primer pair. Each reaction was performed in triplicate (technical replicates) for each of the three biological replicates. Elongation factor 1 alpha (Elf1-α) was used as an internal control gene. Primer sequences used for expression analysis are listed in Table 1. Primer efficiency for each pair was determined by the standard curve method using serial dilutions of cDNA, calculated using the formula: Efficiency (%) = (10^(-1/slope) - 1) × 100. Dissociation curves for each amplicon were analyzed to confirm the specificity of the amplification reactions. Fold change in gene expression (stressed versus control) was calculated using the 2^−ΔΔCt method (Livak and Schmittgen, 2001).
2.14. Analysis of Leaf Mesophyll Cells by Light and Transmission Electron Microscopy (TEM)
Flag leaves were used for ultrastructural examination. The specimens were fixed in a solution containing 2.5% glutaraldehyde, 2% paraformaldehyde, 4% sucrose, and 0.1% picric acid, prepared in 0.1 M phosphate buffer (pH 7.4). The fixed material was then transported to the Electron Microscopy Laboratory at Azerbaijan Medical University (Baku) for further processing. After fixation for one day, the samples were postfixed in 1% osmium tetroxide solution prepared in phosphate buffer (pH 7.4) for two hours. Araldite-Epon blocks were prepared from the material using standard methods in electron microscopy (Kuo, 2014). Semi-thin (1–2 μm) sections were cut from the blocks using a Leica EM UC7 ultramicrotome (Leica, USA), stained with methylene blue, azure II, and basic fuchsin (Morikawa et al., 2018), and viewed under a Primo Star microscope (Zeiss, Germany). Images of the relevant sections were captured with a digital camera EOS D650 (Canon, Japan). Ultrathin sections (50–70 nm) of the blocks, double-stained with uranyl acetate and lead citrate, were examined using a Transmission Electron Microscope JEM-1400 (JEOL, Japan) at a voltage of 80–120 kV. Morphometric analysis of the electron micrographs was performed in TIF format using the TEM Imaging Platform software developed by Olympus Soft Imaging Solutions GmbH (Germany).
2.15. Statistical Analysis
All experiments were conducted in triplicate. Statistical significance was tested using the student's t-test. Differences between mean values were considered significant at p<0.001 (***), p<0.01 (**), and p<0.05 (*).
3. Results
3.1. Chlorophyll Content
The content of photosynthetic pigments—chlorophyll a and chlorophyll b—was measured in flag leaves at five time points (7, 14, 21, 28, and 35 days after anthesis, DAA) during natural (age-induced) and drought-induced senescence in wheat genotypes with contrasting stress tolerance (Table 2). In all plants, the quantities of both chlorophyll a and chlorophyll b progressively decreased as senescence advanced. At 7 DAA, although there was a slight reduction in pigment levels in stress-sensitive genotypes, no significant differences were observed in tolerant plants. In contrast to naturally senescing plants, a sharp decline in pigment levels was observed in the flag leaves of drought-stressed wheat at 21 DAA. This decline was particularly pronounced in sensitive genotypes, with the amount of both chlorophyll a and chlorophyll b being more than twofold lower in drought-exposed tetraploid Tartar and hexaploid Tale 38 compared to 14 DAA. A significant decrease in chlorophyll a content was observed in naturally senescing plants at 35 DAA. Notably, the reduction in chlorophyll b content in stressed plants was detected earlier, at 14 DAA in sensitive genotypes and at 21 DAA in tolerant genotypes.
3.2. Membrane Stability
During the post-anthesis period, due to the aging process, membrane stability in the flag leaves exhibited a declining trend. (Figure 1). At 7 DAA, this parameter was at a similar level across all genotypes. However, in the subsequent periods, membrane stability in stressed plants was lower compared to those under normal conditions. At 21 DAA, the membrane stability index decreased by up to 20% in stress-sensitive genotypes.
3.3. Malondialdehyde Content
An increase in the content of malondialdehyde (MDA), an indicator of lipid peroxidation, was observed in wheat genotypes during natural senescence (Figure 2). The level of MDA was higher during drought-induced senescence. This difference was more pronounced and occurred earlier in stress-sensitive genotypes. At 21 DAA, no significant difference in MDA levels was observed between control and stressed variants of the drought-tolerant durum wheat genotype Vugar, while a 2.3-fold increase was noted in the stress-sensitive bread wheat genotype Tale 38. Towards the end of senescence, the difference in MDA content between control and drought-stressed variants became more pronounced, showing increases of 1.55, 1.73, 2.25, and 2.4-fold in Vugar, Tartar, Gyrmyzy gul 1, and Tale 38, respectively.
3.4. Soluble Protein Content
The total soluble protein content is shown in Figure 3. At 7 DAA, no significant differences were observed between genotypes for this parameter. In naturally senescing
plants, the protein content increased until 28 DAA and then sharply decreased
at 35 DAA. In stressed plants, the curve reflecting soluble protein content showed
changes earlier, at 21 DAA, similar to other parameters. The only exception was
the drought-tolerant durum wheat genotype, which, like the control plants,
exhibited a decrease in protein content after 28 DAA.
3.5. The Activity of SOD
At 7 DAA, the activity of SOD was similar across all variants (Figure 4). By 14 DAA, enzyme activity increased, with a more significant rise observed in stress-exposed genotypes. In naturally aging wheat, the maximum SOD activity was recorded at 28 DAA. In contrast, during stress-induced senescence, the maximum activity occurred earlier, at 21 DAA. Towards the end of ontogenesis, SOD activity declined. A sharp decrease in enzyme activity was observed in stress-exposed bread wheat compared to durum wheat.
3.6. Gene Expression Analysis of SOD Isoforms
To determine which SOD isoforms are closely involved in the senescence process, gene expression analysis was performed. Transcript levels of CuZnSOD, FeSOD, and MnSOD were examined (Figure 5). The transcript level of CuZnSOD was similar across all variants at 7 DAA. In naturally aging plants, the expression of this isoform increased progressively, reached a peak at 28 DAA, and then decreased at 35 DAA. Under stress conditions, the maximum expression of this gene was observed at 21 DAA, after which the expression decreased, reaching a minimum level at 35 DAA. The expression pattern of FeSOD during flag leaf senescence differed. In all genotypes, the transcription of this isoform significantly increased after flowering, peaked at 21 DAA, and then declined sharply. MnSOD expression was higher towards the end of ontogenesis, with transcript levels reaching a maximum at 35 DAA.
3.7. The Activity of Peroxidases
The activity of peroxidase enzymes, including APX, BPX, and GPX was measured in flag leaves at five stages after anthesis (Figure 6).
In naturally senescing plants, APX activity increased after anthesis, reaching a maximal level at 28 DAA, and then decreased at 35 DAA. Except for the drought-tolerant durum wheat genotype Vugar in stressed plants, APX activity peaked at 21 DAA. In the Vugar genotype, APX activity under drought conditions nearly doubled at 28 DAA, reaching the highest level compared to other genotypes. BPX activity reached a maximum in all genotypes at 28 DAA and sharply decreased at 35 DAA. Under stressed conditions, BPX activity was higher in stressed plants compared to control plants. The activity of GPX in flag leaves of both naturally senescing and drought-stressed wheat genotypes also increased after anthesis, peaking at 28 DAA. Similar to other peroxidases, GPX activity decreased again at 35 DAA, with a significant reduction observed particularly, in bread wheat genotypes.
3.8. The Activity of CAT
In contrast to peroxidases, the CAT enzyme reached its maximum activity earlier (14 DAA). As senescence progressed, CAT activity decreased. In plants subjected to stress, which senesced more rapidly, CAT activity was higher compared to control plants (Figure 7).
3.9. Light Microscopy
Changes occurring in the flag leaves of bread wheat genotypes were examined by light microscopy at 7, 21, and 35 days after anthesis (DAA) (Figure 8 and Figure 9). Figure 8A shows the anatomical structure of the flag leaf of the Gyrmyzy gul 1 genotype under normal watering conditions at 7 DAA.
The anatomy of the flag leaf exhibits distinct features: the epidermis (E), stomata (St), and mesophyll cells (Mc) are visible. The stomata are open, and the mesophyll cells are rich in chloroplasts. At 7 days after anthesis (DAA) under drought stress (Figure 8B), no significant anatomical differences are observed. By 21 DAA, both open and closed stomata are present, and some areas of the epidermis show signs of thickening (Figure 8C). At 35 DAA, all stomata are observed to be closed. In addition to the thickening of various epidermal layers, some mesophyll cell walls exhibit damage (Figure 8D).
In contrast to the tolerant genotype, the Tale 38 genotype exhibits more pronounced changes in anatomical structure during the examination of its flag leaves (Figure 9). At 7 DAA under drought stress, the structural elements of the leaves are similar to those in the control group (Figure 9A). However, at 21 DAA, some stomata are closed, and thickening of the epidermal cell layers and damage to the walls of some mesophyll cells are observed (Figure 9B). By 35 DAA, pathological changes in the flag leaves of the Tale 38 genotype have intensified. Specifically, the epidermal layer shows increased thickening in some areas, with structural integrity compromised, most stomata remain open, and the walls of mesophyll cells are disrupted. Additionally, there is a reduction in the number of chloroplasts in the mesophyll cell cytoplasm (Figure 9C).
3.10. Transmission Electron Microscopy
Changes in the ultrastructure of flag leaves in the Gyrmyzy gul 1 and Tale 38 genotypes during drought-induced leaf senescence were also examined using transmission electron microscopy (TEM) (Figure 10 and Figure 11). In the control leaves of the Gyrmyzy gul 1 genotype, cultivated under normal watering conditions, the ultrastructure clearly shows cell walls (Cw), chloroplasts (Ch), the central nucleus (N), lipid droplets (Ld), mitochondria (M), internal thylakoid membranes of chloroplasts (Th), and plastoglobuli (Pl) (Figure 10A).
Figure 10B shows the ultrastructural appearance of flag leaves at 7 DAA under drought conditions. No significant pathology is observed. At 21 DAA, although the cell walls maintain a normal structure, some organelles with membranous structures, such as mitochondria, exhibit structural damage and transform into myelin-like structures (Ms) (Figure 10C). More severe changes compared to the control are observed at 35 DAA (Figure 10D-F). Specifically, some mesophyll cell walls are damaged (Figure 10D), chloroplast membranes are compromised, and connections between chloroplasts are severed, with alterations in thylakoid membrane structures (Figure 10E). The nuclear envelope of mesophyll cells is thickened and structurally disrupted in some areas (Figure 10F). Figure 10 depicts the changes occurring in the mesophyll cells of the Tale 38 genotype during leaf senescence, as observed using TEM.
Figure 11A illustrates the structural elements of mesophyll cells in flag leaves of plants grown under normal watering conditions (control). At 7 DAA under drought conditions, no significant pathology is observed in the flag leaves (Figure 11B). At 21 DAA, chloroplast membranes are damaged and their connections are severed. The crystals in the mitochondria are not clearly visible, and some mitochondria are severely damaged and completely disintegrated (Figure 11C). At 35 DAA, most mesophyll cell walls are severely damaged and fragmented in several places (Figure 11D). The majority of chloroplast membranes are damaged and fragmented, causing the chloroplasts to disassociate from the cell walls and migrate toward the center of the cytoplasm (Figure 11E). Additionally, most membranous structures in the cytoplasm are also damaged. Ultrastructural analysis of the chloroplasts reveals that the thylakoid membranes are damaged and disintegrated, with vacuoles forming in the intermembrane spaces (Figure 11F).
Discussion
Leaf senescence is characterized by specific changes at cellular, biochemical, and molecular levels. Observing these changes collectively provides a comprehensive understanding of the mechanisms behind leaf aging in plants. These changes occur in a coordinated manner to facilitate the remobilization of nutrients during the progression of leaf senescence, especially under drought stress. Our study identified a sequence of events occurring during flag leaf senescence induced by drought in contrasting wheat genotypes. Significant chlorophyll degradation occurred concurrently with increased lipid peroxidation and decreased membrane stability. This was further accompanied by enhanced activation of antioxidant system components and a reduction in total soluble protein levels, ultimately affecting the leaf cell ultrastructure. Our findings indicate that chlorophyll loss during natural senescence occurs gradually. Under drought stress, chlorophyll a and b levels in tolerant genotypes sharply declined by 21 DAA, while in sensitive genotypes, chlorophyll b decreased earlier, by 14 DAA. Accelerated leaf senescence in response to drought is considered an important adaptive survival mechanism, as it reduces the plant's overall water requirements (Tan et al., 2023). Chlorophyll degradation is regarded as a precursor to leaf senescence, as it is associated with nutrient remobilization (Guo et al., 2021). Chlorophyll loss may play a role in photoprotection during the early stages of drought-induced leaf senescence when chloroplasts still retain some photosynthetic activity. The loss of chlorophyll reduces the controlled effects of singlet oxygen formation in thylakoids (Španić et al., 2023). This protection may be particularly important in the initial phase of leaf senescence under drought, as it could prevent the rapid dismantling of chloroplasts, which, in the absence of protective mechanisms, could threaten nutrient remobilization (Krieger-Liszkay et al., 2019). Once chlorophyll degradation occurs, the pigment-protein complex dissociates, and enzymes can break down proteins that may constitute a significant amount of the nitrogen present in chloroplasts (Buet et al., 2019). Additionally, some studies suggest that the onset of leaf senescence may occur before chlorophyll degradation becomes apparent Pic et al. (2002) demonstrated that a gene homologous to SAG2 from Arabidopsis, which codes for a cysteine protease and is considered a specific marker of senescence, is expressed in water-stressed potted pea plants before a decline in photosynthesis, chlorophylls, or protein levels. In our study, we observed a gradual increase in MDA levels during natural leaf senescence, with a noticeable sharp rise in stress-sensitive genotypes starting from 28 DAA and in drought-stressed genotypes from 21 DAA. Previous research also reported an increase in MDA with elevated O₂• levels during light-induced leaf senescence in wheat (Liu et al., 2019). A premature senescence mutant from a rice mutant library exhibited increased MDA levels (Huang et al., 2016). MDA is a product of lipid peroxidation in cell membranes, indicating damage to the ROS cellular membrane system. Accordingly, our experiments showed a decrease in the membrane stability index with advancing senescence, which was especially pronounced in drought-stressed plants. Interestingly, our study found that the amount of soluble proteins in drought-stressed plants was higher initially compared to those under control conditions. This increase appears to be due to the effect of drought stress rather than the natural senescence process. Similarly, Maqsood et al. (2022) reported that water deficit stress resulted in a significant increase in soluble proteins in wheat genotypes. In our research, a sharp decrease in protein content was observed starting from 21 DAA. Protein degradation is a crucial catabolic process during leaf senescence and plays a significant role in nutrient recycling, particularly nitrogen. Chloroplastic proteases, which increase in synthesis during drought-induced senescence, can mobilize up to 75% of the total cellular nitrogen in leaves (Hajibarat and Saidi, 2022). Increased expression and activity of serine, cysteine, aspartic, and metalloproteases have been detected in senescing leaves (Buet et al., 2019; Díaz-Mendoza et al., 2016; Christiansen and Gregersen, 2014; Hollmann et al., 2014; Roberts et al., 2012). Although many proteins degrade during senescence, some remain intact. The decrease in protein amount was more rapid in early aging lines compared to normal aging lines in wheat (Hongwei et al., 2014). Protein content also decreased in Tropaeolum majus leaves during senescence (Karatas et al., 2010) and in French bean leaves during both natural and dark-induced senescence (Lambert et al., 2017).
Oxidative stress, resulting from an imbalance between ROS and antioxidants, intensifies during plant senescence (Maqsood et al., 2022). Under optimal conditions, constitutive antioxidant levels manage basal ROS production (Laus et al., 2022). The induction of antioxidant synthesis counters increased ROS production at low concentrations during moderate stress (Sachdev et al., 2021). This is also characteristic of the early stages of leaf senescence in plants subjected to drought stress, where enhanced photo- and antioxidant protection is observed (Huseynova, 2012). Senescence may progress further due to higher ROS production, potentially triggered by an oxidative burst (Chen et al., 2021). Cell death can occur when antioxidant defenses are overwhelmed by excessively large, rapid, and uncontrolled ROS accumulation (Qiu et al., 2023). In plants, the antioxidant defense is primarily constituted by the enzymatic actions of superoxide dismutase (SOD, EC 1.15.1.1), which catalyzes the disproportionation of O₂⁻ to H₂O₂ and O₂. SOD is considered one of the first lines of defense (Kohli et al., 2019; Mao et al., 2018). Three main types of SOD are described in plants based on their metal cofactors: Cu/Zn-SOD (found in the cytosol, chloroplast stroma, peroxisomes, and apoplast), Mn-SOD (present in mitochondria, peroxisomes, apoplast, and cell walls), and Fe-SOD (restricted to the chloroplast stroma of certain plant species) (Mittler et al., 2004). In our study, we investigated the expression levels of Cu/Zn-SOD, Mn-SOD, and Fe-SOD genes to determine which isoform plays a major role during senescence. Cu/Zn-SOD expression increased during the senescence process, peaked at 28 DAA, and then significantly decreased. In contrast, Fe-SOD expression remained high until mid-flowering (21 DAA) and then sharply declined as senescence progressed. Mn-SOD transcript levels, however, increased with deeper senescence, reaching a maximum at 35 DAA. These findings align with some studies but also contradict others. For instance, Cu/Zn-SOD and Mn-SOD activity increased at the beginning of senescence in bean cotyledons (Prochazkova and Wilhelmova, 2007) but decreased as senescence progressed. Mn-SOD activity continually decreased in pea leaves (Jiménez et al., 1998) from the onset of senescence. In wheat, Cu/Zn-SOD gene expression remained consistent in early and late aging lines immediately after the flag leaf expansion (Hongwei et al., 2014). Aliyeva et al. (2023) demonstrated that SOD activity in wheat leaves under drought stress increased in tolerant genotypes but decreased in sensitive ones. Saed-Moucheshi et al. (2021) found that a tolerant triticale genotype had significantly higher expression levels of Mn-SOD and Cu/Zn-SOD compared to a susceptible genotype, while Fe-SOD levels did not differ. Mn-SOD showed higher expression in shoots, Fe-SOD was more expressed in roots, and Cu/Zn-SOD was higher in the roots of the tolerant genotype but lower in the roots of the susceptible one, indicating genotype specificity. The authors suggested that Mn-SOD is likely a general isozyme responding to stress, while Cu/Zn-SOD is more genotype-specific, with higher expression in certain genotypes like the tolerant triticale in their study. Zhao et al. (2018) found that SOD expression levels and malondialdehyde content in rice were significantly correlated, with SOD levels being much lower in heat-sensitive cultivars compared to tolerant ones. Similarly, Mohammadi et al. (2020) reported that Cu/Zn-SOD was significantly expressed in common bean plants under drought stress, with a higher induction rate in tolerant genotypes. Xie et al. (2019) also noted that Cu/Zn-SOD likely played a crucial role in regulating total SOD activity and ROS detoxification under stress conditions. Our study also correlates with the dynamics of SOD activity with changes in Cu/Zn-SOD gene expression under both control and drought-treated conditions. Based on our findings, Cu/Zn-SOD appears to be responsible for responding to drought stress, while Mn-SOD was mainly induced by aging, showing minimal differences between drought and stress conditions. Some researchers, such as Awan et al. (2020), Sheoran et al. (2015), and Wang et al. (2018), have suggested that Mn-SOD is crucial for drought tolerance. Sheoran et al. (2015) found that Mn-SOD gene expression significantly increased under drought stress, showing a strong correlation with overall SOD activity, which contradicts our results. A genome-wide analysis by Jiang et al. (2019) identified 26 SOD genes in wheat, including 17 Cu/Zn-SODs, 6 Fe-SODs, and 3 Mn-SODs.
Hydrogen peroxide is more efficiently scavenged by ascorbate peroxidase (APX), which has a better affinity for H₂O₂ than CAT and is widely distributed in various cellular compartments, including chloroplasts, where CAT is absent, as well as in the cytosol, mitochondria, and peroxisomes (Dumanović et al., 2021). APX6, in particular, is associated with senescence, being induced in aging leaves and in response to senescence-promoting stimuli like abscisic acid (ABA), extended darkness, and osmotic stress. APX6 is thought to modulate ROS/redox homeostasis and signaling in aging leaves, playing a crucial role in both developmental and stress-induced senescence programs (Chen et al., 2021). Both GPX and BPX reached maximum activity at 28 DAA. GPX activity was comparatively lower in durum wheat genotypes than in bread wheat and showed less fluctuation in activity dynamics. There were no significant differences in GPX activity between stress and control conditions. Conversely, BPX activity was higher in drought-stressed plants. The activity of guaiacol peroxidase was examined in durum wheat genotypes under drought stress during flowering, milk ripeness, and wax ripeness stages, showing increased activity toward the end of ontogenesis. Similarly, benzidine peroxidase activity also reached a maximum during the wax ripeness phase (Huseynova et al., 2014; 2015; 2016). Similar trends for guaiacol peroxidase were observed in bread wheat seedlings acclimated to low temperatures (Scebba et al., 1998). Multiple forms of peroxidases operate under different growth and development stages of plants, oxidizing various substrates and functioning under diverse environmental conditions.
CAT is a heme-containing enzyme that catalyzes the rapid decomposition of H₂O₂ to H₂O and O₂. It is predominantly found in peroxisomes, where it scavenges H₂O₂ generated during photorespiration and β-oxidation of fatty acids. CAT has also been identified in mitochondria and cytosol, but not in chloroplasts (Dumanović et al., 2021). In our study, CAT activity peaked at 14 DAA and subsequently decreased. This pattern is consistent with reports of increased CAT activity at the beginning of senescence, followed by a decline as senescence progresses (Hongwei et al., 2014). Studies across various plant species have shown a continual decrease in CAT enzyme activity from the onset of senescence in cucumber and bean cotyledons (Manoharan et al., 2005). In maize, CAT activity increased until 25 days after tasseling but decreased thereafter (Prochazkova et al., 2001). In wheat, CAT activity was lower in early aging lines compared to normal aging lines across different sampling times (Hongwei et al., 2014). In our research, we compared the activity of peroxidases, specifically APX, BPX, and GPX. APX exhibited the highest activity among these enzymes and its activity increased during the senescence process. In drought-affected senescence, APX reached its maximum activity earlier: 28 DAA in tolerant wheat genotypes, 21 DAA in sensitive genotypes, and as early as 14 DAA in bread wheat genotypes.
Drought-induced leaf senescence is accompanied by a range of structural changes within cells (Paluch-Lubawa et al., 2021). We investigated the ultrastructural changes associated with senescence induced by age and drought stress in flag leaves using light and electron microscopy at three time points after DAA. The observed structural damage intensified proportionally over time. Toward the end of senescence, most mesophyll cell walls were extensively damaged and disintegrated, chloroplast membranes were damaged and fragmented, and due to the loss of connections between them, chloroplasts migrated toward the center of the cytoplasm. Additionally, most membrane-bound structures within the cytoplasm were also disintegrated. The thylakoid membranes inside the chloroplasts were damaged, and vacuoles formed in the intermembrane spaces. Chloroplasts are among the first organelles to undergo destruction during senescence, while nuclei and mitochondria maintain their integrity until the later stages of leaf senescence (Smart, 1994). This is because oxidative stress plays a critical role in the progression of leaf senescence, and chloroplasts are among the most potent intracellular generators of reactive oxygen species. The transformation of chloroplasts into gerontoplasts characterizes the senescence reorganization phase of leaves. Chloroplasts lose volume and density due to extensive loss of stromal components and thylakoids, and the number and size of plastoglobuli increase with aging. Ultrastructural studies of plastoglobuli confirm their significant role in protecting thylakoid membranes from oxidative damage through the intensive synthesis and storage of lipids (e.g., carotenoids). Plastoglobuli are found in both chloroplasts and chromoplasts. Under various stress conditions, the amount of plastoglobuli increases as thylakoids disintegrate (Austin et al., 2006). During drought, cultivar-specific differences in the ultrastructure and functions of mitochondria in autumn wheat have been observed (Challabathula et al., 2022). Leaf mitochondria in drought-tolerant cultivars are better preserved compared to sensitive ones, which can be considered a trait contributing to drought tolerance in plants. These changes occur in drought-induced leaf senescence in field-grown plants (Munné-Bosch and Alegre, 2004) and are also considered good indicators of leaf senescence in response to other stresses (Vollenweider et al., 2003). Thus, both light and electron microscopy studies have revealed that as the duration of leaf senescence increases, more severe changes are observed in the ultrastructure of flag leaves.
Conclusion
This study highlights the critical role of antioxidant enzymes and cellular integrity in mitigating the effects of drought-induced senescence in wheat genotypes. The contrasting responses between drought-tolerant and drought-sensitive genotypes underline the complexity of the senescence process under stress. The increase in MDA levels indicates more pronounced oxidative damage to membranes in drought-sensitive genotypes. In contrast, drought-tolerant genotypes exhibited higher antioxidant enzyme activity, which helps mitigate oxidative stress and slow down the senescence process. Additionally, they showed greater expression of antioxidant enzyme genes, enhancing their ability to cope with drought. Sensitive genotypes experienced more severe damage to chloroplasts and cell walls under drought conditions compared to the tolerant ones, which led to rapid leaf senescence. These findings provide valuable insights for breeding programs aimed at developing drought-resilient wheat varieties, emphasizing the importance of maintaining antioxidant balance and cellular ultrastructure in prolonging leaf vitality under drought conditions.
Author Contributions
Conceptualization, I.H.; methodology, D.A. and S.R.; investigation, T.I., S.R., D.A.; validation, D.A. and S.R.; formal analysis, S.R.; microscopy analysis, F.R. and E.G.; writing-original draft preparation, S.R. and T.I.; writing-review and editing, I.H., D.A. and S.R.; visualization, S.R. and T.I.; supervision, I.H.; project administration, I.H.; funding acquisition, I.H. All authors have read and agreed to the published version of the manuscript.
Funding
This work was supported by the Ministry of Science and Education of the Republic of Azerbaijan.
Conflicts of Interest
The authors declare no conflict of interest.
Abbreviations
ROS, reactive oxygen species; FLA, flag leaf area; DAA, days after anthesis, MDA, malondialdehyde; SOD, superoxide dismutase; APX, ascorbate-peroxidase; GPX, guaiacol-peroxidase; BPX, benzidine-peroxidase; CAT, catalase, TEM, Transmission Electron Microscopy
References
- Aliyeva, D.R.; Gurbanova, U.A.; Rzayev, F.H.; Gasimov, E.K.; Huseynova, I.M. Biochemical and ultrastructural changes in wheat plants during drought stress. Biochem. (Moscow) 2023, 88, 1944–1955. [Google Scholar] [CrossRef] [PubMed]
- Aloryi, K.D.; Jing, H.C.; Dijkwel, P.P. Comparison of leaf senescence regulation between distantly related plant species uncovers knowledge gaps and opportunities for plant improvement strategies. Environ. Exp. Bot. 2023, 214, 105474. [Google Scholar] [CrossRef]
- Austin, J.R.; Frost, E.; Vidi, P.A.; Kessler, F.; Staehelin, L.A. Plastoglobules are lipoprotein subcompartments of the chloroplast that are permanently coupled to thylakoid membranes and contain biosynthetic enzymes. Plant Cell 2006, 18, 1693–1703. [Google Scholar] [CrossRef] [PubMed]
- Awan, S.A.; Khan, I.; Rizwan, M.; Zhang, X.; Brestic, M.; Khan, A.; El-Sheikh, M.A.; Alyemeni, M.N.; Ali, S.; Huang, L. Exogenous abscisic acid and jasmonic acid restrain polyethylene glycol-induced drought by improving the growth and antioxidative enzyme activities in pearl millet. Physiol. Plant. 2020, 147, 125–136. [Google Scholar] [CrossRef] [PubMed]
- Borrill, P.; Harrington, S.A.; Simmonds, J.; Uauy, C. Identification of transcription factors regulating senescence in wheat through gene regulatory network modelling. Plant Physiol. 2019, 180, 1740–1755. [Google Scholar] [CrossRef] [PubMed]
- Bradford, M.M. A rapid and sensitive method for the quantitation of microgram quantities of protein utilizing the principle of protein-dye binding. Anal. Biochem. 1976, 72, 248–254. [Google Scholar] [CrossRef]
- Buet, A.; Costa, M.L.; Martínez, D.E.; Guiamet, J.J. Chloroplast protein degradation in senescing leaves: Proteases and lytic compartments. Front. Plant Sci. 2019, 10, 747. [Google Scholar] [CrossRef]
- Camargo Rodriguez, A.V. Integrative modelling of gene expression and digital phenotypes to describe senescence in wheat. Genes 2021, 12, 909. [Google Scholar] [CrossRef]
- Cao, J.; Liu, H.; Tan, S.; Li, Z. Transcription Factors-Regulated Leaf Senescence: Current Knowledge, Challenges and Approaches. Int. J. Mol. Sci. 2023, 24, 9245. [Google Scholar] [CrossRef]
- Cao, J.; Zhang, Y.; Tan, S.; Yang, Q.; Wang, H.-L.; Xia, X.; Luo, J.; Guo, H.; Zhang, Z.; Li, Z. LSD 4.0: An improved database for comparative studies of leaf senescence. Mol. Hortic. 2022, 2, 24. [Google Scholar] [CrossRef]
- Challabathula, D.; Analin, B.; Mohanan, A.; Bakka, K. Differential modulation of photosynthesis, ROS and antioxidant enzyme activities in stress-sensitive and -tolerant rice cultivars during salinity and drought upon restriction of COX and AOX pathways of mitochondrial oxidative electron transport. J. Plant Physiol. 2022, 268, 153583. [Google Scholar] [CrossRef] [PubMed]
- Chapman, E.A.; Orford, S.; Lage, J.; Griffiths, S. Capturing and selecting senescence variation in wheat. Front. Plant Sci. 2021, 12, 638738. [Google Scholar] [CrossRef] [PubMed]
- Chen, C.; Galon, Y.; Rahmati Ishka, M.; Malihi, S.; Shimanovsky, V.; Twito, S.; Miller, G. Ascorbate peroxidase 6 delays the onset of age-dependent leaf senescence. Plant Physiol. 2021, 185, 441–456. [Google Scholar] [PubMed]
- Cheng, S.; Feng, C.; Wingen, L.U.; et al. Harnessing landrace diversity empowers wheat breeding. Nature 2024. [CrossRef] [PubMed]
- Christiansen, M.W.; Gregersen, P.L. Members of the barley NAC transcription factor gene family show differential co-regulation with senescence-associated genes during senescence of flag leaves. J. Exp. Bot. 2014, 65, 4009–4022. [Google Scholar] [CrossRef] [PubMed]
- Deshmukh, P.; Sairam, R.; Shukla, D. Measurement of ion leakage as a screening technique for drought resistance in wheat genotypes. Indian J. Plant Physiol. 1991, 35, 89–91. [Google Scholar]
- Díaz-Mendoza, M.; Velasco-Arroyo, B.; Santamaría, M.E.; González-Melendi, P.; Martínez, M.; Díaz, I. Plant senescence and proteolysis: Two processes with one destiny. Genet. Mol. Biol. 2016, 39, 329–338. [Google Scholar] [CrossRef] [PubMed]
- Gechev, T.; Gadjiev, I.; Van Breusagem, F.; Inze, D.; Dukiandjiev, S.; Toneva, V. , Minkov, I. Hydrogen peroxide protects tobacco from oxidative stress by inducing a set of antioxidant enzymes. Cell Mol. Life Sci. 2002, 59, 708–714. [Google Scholar]
- Dumanović, J.; Nepovimova, E.; Natić, M.; Kuča, K.; Jaćević, V. The significance of reactive oxygen species and antioxidant defense system in plants: A concise overview. Front. Plant Sci. 2021, 11, 552969. [Google Scholar] [CrossRef]
- Ďúranová, H.; Šimora, V.; Ďurišová, Ľ.; Olexiková, L.; Kovár, M.; Požgajová, M. Modifications in ultrastructural characteristics and redox status of plants under environmental stress: A review. Plants 2023, 12, 1666. [Google Scholar] [CrossRef]
- Gan, S.S. Hypothesis: The subcellular senescence sequence of a mesophyll cell mirrors the cell origin and evolution. Mol. Hortic. 2022, 2, 27. [Google Scholar] [CrossRef] [PubMed]
- Gregersen, P.L.; Culetic, A.; Boschian, L.; Krupinska, K. Plant senescence and crop productivity. Plant Mol. Biol. 2013, 81, 1–13. [Google Scholar] [CrossRef] [PubMed]
- Guo, Y.; Ren, G.; Zhang, K.; et al. Leaf senescence: progression, regulation, and application. Mol. Hortic. 2021, 1, 5. [Google Scholar] [CrossRef] [PubMed]
- Hajibarat, Z.; Saidi, A. Senescence-associated proteins and nitrogen remobilization in grain filling under drought stress condition. J. Genet. Eng. Biotechnol. 2022, 20, 101. [Google Scholar] [CrossRef] [PubMed]
- Hassan, M.A.; Yang, M.; Rasheed, A.; Tian, X.; Reynolds, M.; Xia, X.; Xiao, Y.; He, Z. Quantifying senescence in bread wheat using multispectral imaging from an unmanned aerial vehicle and QTL mapping. Plant Physiol. 2021, 187, 2623–2636. [Google Scholar] [CrossRef] [PubMed]
- Hollmann, J.; Gregersen, P.L.; Krupinska, K. Identification of predominant genes involved in regulation and execution of senescence-associated nitrogen remobilization in wheat. J. Exp. Bot. 2014, 65, 4101–4113. [Google Scholar] [CrossRef] [PubMed]
- Hongwei, L.; Gui, W.; Shudong, L.; Qiang, A.; Zheng, Q.; Bin, L.; Zhensheng, L. Comparative changes in the antioxidant system in the flag leaf of early and normally senescing near-isogenic lines of wheat (Triticum aestivum L.). Plant Cell Rep. 2014, 33, 1109–1120. [Google Scholar]
- Hönig, M.; Plíhalová, L.; Husičková, A.; Nisler, J.; Doležal, K. Role of Cytokinins in Senescence, Antioxidant Defence and Photosynthesis. Int. J. Mol. Sci. 2018, 19, 4045. [Google Scholar] [CrossRef] [PubMed]
- Huang, Q.N.; Shi, Y.F.; Zhang, X.B.; Song, L.X.; Feng, B.H.; Wang, H.M.; Xu, X.; Li, X.H.; Guo, D.; Wu, J.L. Single base substitution in OsCDC48 is responsible for premature senescence and death phenotype in rice. J. Integr. Plant Biol. 2016, 58, 12–28. [Google Scholar] [CrossRef]
- Huseynova, I.M. Photosynthetic characteristics and enzymatic antioxidant capacity of leaves from wheat cultivars exposed to drought. Biochim. Biophys. Acta Bioenerg. 2012, 1817, 1516–1523. [Google Scholar] [CrossRef]
- Huseynova, I.; Aliyeva, D.; Aliyev, J. Subcellular localization and responses of superoxide dismutase isoforms in local wheat varieties subjected to continuous soil drought. Plant Physiol. Biochem. 2014, 81, 54–60. [Google Scholar] [CrossRef] [PubMed]
- Huseynova, I.; Aliyeva, D.; Mammadov, A.; Aliyev, J. Hydrogen peroxide generation and antioxidant enzyme activities in the leaves and roots of wheat cultivars subjected to long-term soil drought stress. Photosynth. Res. 2015, 1125, 279–289. [Google Scholar] [CrossRef] [PubMed]
- Huseynova, I.; Rustamova, S.; Suleymanov, S.; Aliyeva, D.; Mammadov, A.; Aliyev, J. Drought-induced changes in photosynthetic apparatus and antioxidant components of wheat (Triticum durum Desf.) varieties. Photosynth. Res. 2016, 130, 215–223. [Google Scholar] [CrossRef] [PubMed]
- Jiang, W.; Yang, L.; He, Y.; Zhang, H.; Li, W.; Chen, H.; Yin, J. Genome-wide identification and transcriptional expression analysis of superoxide dismutase (SOD) family in wheat (Triticum aestivum). PeerJ 2019, 7, e8062. [Google Scholar] [CrossRef] [PubMed]
- Jiménez, A.; Hernández, J.A.; Pastori, G.; del Río, L.A.; Sevilla, F. Role of the ascorbate-glutathione cycle of mitochondria and peroxisomes in the senescence of pea leaves. Plant Physiol. 1998, 118, 1327–1335. [Google Scholar] [CrossRef] [PubMed]
- Joshi, S.; Choukimath, A.; Isenegger, D.; Panozzo, J.; Spangenberg, G.; Kant, S. Improved wheat growth and yield by delayed leaf senescence using developmentally regulated expression of a cytokinin biosynthesis gene. Front. Plant Sci. 2019, 10, 1285. [Google Scholar] [CrossRef] [PubMed]
- Karatas, I.; Ozturk, L.; Ersahin, Y.; Okatan, Y. Effects of auxin on photosynthetic pigments and some enzyme activities during dark-induced senescence of Tropaeolum leaves. Pak. J. Bot. 2010, 42, 1881–1888. [Google Scholar]
- Kim, J.; Kim, J.H.; Lyu, J.I.; T, H.R.; Lim, P.O. New insights into the regulation of leaf senescence in Arabidopsis. J. Exp. Bot. 2018, 69, 787–799. [Google Scholar] [CrossRef] [PubMed]
- Kohli, S.K.; Khanna, K.; Bhardwaj, R.; Abd_Allah, E.F.; Ahmad, P.; Corpas, F.J. Assessment of subcellular ROS and NO metabolism in higher plants: multifunctional signaling molecules. Antioxidants 2019, 8, 641. [Google Scholar] [CrossRef]
- Krieger-Liszkay, A.; Krupinska, K.; Shimakawa, G. The impact of photosynthesis on initiation of leaf senescence. Physiol. Plant. 2019, 166, 148–164. [Google Scholar] [CrossRef]
- Kumar, G.M.; Knowles, N.R. Changes in lipid peroxidation and lipolytic and free-radical scavenging enzyme activities during aging and sprouting of potato (Solanum tuberosum) seed-tubers. Plant Physiol. 1993, 102, 115–124. [Google Scholar] [CrossRef] [PubMed]
- Kuo, J. Processing plant tissues for ultrastructural study. Electron Microsc. Methods Protoc. 2014, 39–55. [Google Scholar]
- Lambert, R.; Quiles, F.A.; Gálvez-Valdivieso, G.; Piedras, P. Nucleases activities during French bean leaf aging and dark-induced senescence. J. Plant Physiol. 2017, 218, 235–242. [Google Scholar] [CrossRef] [PubMed]
- Laus, M.N.; De Santis, M.A.; Flagella, Z.; Soccio, M. Changes in Antioxidant Defence System in Durum Wheat under Hyperosmotic Stress: A Concise Overview. Plants 2022, 11, 98. [Google Scholar] [CrossRef] [PubMed]
- Li, C.; Wu, X.; Wang, P.; Wang, H.; Wang, L.; Sun, F.; Jing, H.C. Genome-wide association study of image-based trait reveals the genetic architecture of dark-induced leaf senescence in rice. J. Exp. Bot. 2024, erae391. [Google Scholar] [CrossRef]
- Li, W.; Yang, Y.; Yu, L. The role of chloroplasts in leaf senescence and related signaling pathways. Int. J. Mol. Sci. 2023, 24, 1147. [Google Scholar]
- Lim, P.O.; Kim, H.J.; Nam, H.G. Leaf senescence. Annu. Rev. Plant Biol. 2007, 58, 115–136. [Google Scholar] [CrossRef]
- Liu, Y.N.; Xu, Q.Z.; Li, W.C.; Yang, X.H.; Zheng, Q.; Li, B.; Li, H.W. Long-term high light stress induces leaf senescence in wheat (Triticum aestivum L.). Photosynthetica 2019, 57, 3. [Google Scholar] [CrossRef]
- Livak, K.J.; Schmittgen, T.D. Analysis of relative gene expression data using real-time quantitative PCR and the 2−ΔΔCT method. Methods 2001, 25, 402–408. [Google Scholar] [CrossRef]
- Manoharan, K.; Karuppanapandian, T.; Sinha, P.B.; Prasad, R. Membrane degradation, accumulation of phosphatidic acid, stimulation of catalase activity and nuclear DNA fragmentation during 2,4-D-induced leaf senescence in mustard. J. Plant Biol. 2005, 48, 394–403. [Google Scholar] [CrossRef]
- Mao, H.; Chen, M.; Su, Y.; Wu, N.; Yuan, M.; Yuan, S.; Brestic, M.; Zivcak, M.; Zhang, H.; Chen, Y. Comparison on photosynthesis and antioxidant defense Systems in Wheat with different Ploidy levels and Octoploid Triticale. Int. J. Mol. Sci. 2018, 19, 300–306. [Google Scholar] [CrossRef] [PubMed]
- Maqsood, M.F.; Shahbaz, M.; Kanwal, S.; Kaleem, M.; Shah, S.M.R.; Luqman, M.; Farhat, F. Methionine promotes the growth and yield of wheat under water deficit conditions by regulating the antioxidant enzymes, reactive oxygen species, and ions. Life 2022, 12, 969. [Google Scholar] [CrossRef] [PubMed]
- Mittler, R.; Vanderauwera, S.; Gollery, M.; Van Breusegem, F. Reactive oxygen gene network of plants. Trends Plant Sci. 2004, 9, 490–498. [Google Scholar] [CrossRef] [PubMed]
- Mohammadi, M.; Tavakoli, A.; Pouryousef, M.; Fard, E.M. Study the effect of 24-epibrassinolide application on the Cu/Zn-SOD expression and tolerance to drought stress in common bean. Physiol. Mol. Biol. Plants 2020, 23, 1–16. [Google Scholar] [CrossRef] [PubMed]
- Morikawa, S.; Sato, A.; Ezaki, T. A simple, one-step polychromatic staining method for epoxy-embedded semithin tissue sections. Microscopy 2018, 67, 331–344. [Google Scholar] [CrossRef] [PubMed]
- Munné-Bosch, S.; Alegre, L. Die and let live: leaf senescence contributes to plant survival under drought stress. Funct Plant Biol. 2004, 31(3), 203–216. [Google Scholar] [CrossRef] [PubMed]
- Nakano, Y.; Asada, K. Hydrogen peroxide is scavenged by ascorbate-specific peroxidase in spinach chloroplasts. Plant Cell Physiol. 1981, 22, 867–880. [Google Scholar]
- Nousis, L.; Kanavaros, P.; Barbouti, A. Oxidative Stress-Induced Cellular Senescence: Is Labile Iron the Connecting Link? Antioxidants 2023, 12, 1250. [Google Scholar] [CrossRef] [PubMed]
- Paluch-Lubawa, E.; Stolarska, E.; Sobieszczuk-Nowicka, E. Dark-induced barley leaf senescence – a crop system for studying senescence and autophagy mechanisms. Front. Plant Sci. 2021, 12, 635619. [Google Scholar] [CrossRef]
- Pic, E.; de La Serve, B.T.; Tardieu, F.; Turc, O. Leaf senescence induced by mild water deficit follows the same sequence of macroscopic, biochemical, and molecular events as monocarpic senescence in pea. Plant Physiol. 2002, 128, 236–246. [Google Scholar] [CrossRef]
- Porra, R.J.; Thompson, W.A.; Kriedemann, P.E. Determination of accurate extinction coefficients and simultaneous equations for assaying chlorophylls a and b extracted with four different solvents: verification of the concentration of chlorophyll standards by atomic absorption spectroscopy. Biochim. Biophys. Acta Bioenerg. 1989, 975, 384–394. [Google Scholar] [CrossRef]
- Prochazkova, D.; Sairam, R.K.; Srivastava, G.C.; Singh, D.V. Oxidative stress and antioxidant activity as the basis of senescence in maize leaves. Plant Sci. 2001, 161, 765–771. [Google Scholar] [CrossRef]
- Prochazkova, D.; Wilhelmova, N. Leaf senescence and activities of the antioxidant enzymes. Biol. Plant. 2007, 51, 401–406. [Google Scholar] [CrossRef]
- Qiu, H.; Wang, J. Mitochondrial functions in leaf senescence: Insights from metabolic and cellular dynamics. J. Plant Physiol. 2023, 271, 153681. [Google Scholar]
- Roberts, I.N.; Caputo, C.; Criado, M.V.; Funk, C. Senescence-associated proteases in plants. Physiol. Plant. 2012, 145, 130–139. [Google Scholar] [CrossRef] [PubMed]
- Sachdev, S.; Ansari, S.A.; Ansari, M.I.; Fujita, M.; Hasanuzzaman, M. Abiotic Stress and Reactive Oxygen Species: Generation, Signaling, and Defense Mechanisms. Antioxidants 2021, 10, 277. [Google Scholar] [CrossRef] [PubMed]
- Saed-Moucheshi, A.; Sohrabi, F.; Fasihfar, E.; Baniasadi, F.; Riasat, M.; Mozafari, A.A. Superoxide dismutase (SOD) as a selection criterion for triticale grain yield under drought stress: a comprehensive study on genomics and expression profiling, bioinformatics, heritability, and phenotypic variability. BMC Plant Biol. 2021, 21, 1–19. [Google Scholar] [CrossRef] [PubMed]
- Scebba, F.; Sebastiani, L.; Vitagliano, C. Changes in activity of antioxidative enzymes in wheat (Triticum aestivum) seedlings under cold acclimation. Physiol. Plant. 1998, 104, 747–752. [Google Scholar] [CrossRef]
- Sheoran, S.; Thakur, V.; Narwal, S.; Turan, R.; Mamrutha, H.; Singh, V.; Tiwari, V.; Sharma, I. Differential activity and expression profile of antioxidant enzymes and physiological changes in wheat (Triticum aestivum L.) under drought. Appl. Biochem. Biotechnol. 2015, 177, 1282–1298. [Google Scholar] [CrossRef]
- Smart, C.M. Gene expression during leaf senescence. New Phytol. 1994, 126, 419–448. [Google Scholar] [CrossRef]
- Španić, V.; Šunić, K.; Duvnjak, J.; Hu, Y.G.; Katanić, Z. Chlorophyll a fluorescence during flag leaf senescence of field-grown winter wheat plants under drought conditions. Ann. Appl. Biol. 2023, 183, 80–92. [Google Scholar] [CrossRef]
- Sultana, N.; Islam, S.; Juhász, A.; Ma, W. Wheat leaf senescence and its regulatory gene network. Crop J. 2021. [CrossRef]
- Tamary, E.; Nevo, R.; Naveh, L.; Levin-Zaidman, S.; Kiss, V.; Savidor, A.; Adam, Z. Chlorophyll catabolism precedes changes in chloroplast structure and proteome during leaf senescence. Plant Direct 2019, 3, e00127. [Google Scholar] [CrossRef] [PubMed]
- Tan, S.; Sha, Y.; Sun, L.; Li, Z. Abiotic stress-induced leaf senescence: regulatory mechanisms and application. Int. J. Mol. Sci. 2023, 24, 11996. [Google Scholar] [CrossRef] [PubMed]
- Tefera, A.; Kebede, M.; Tadesse, K.; Getahun, T. Morphological, physiological, and biochemical characterization of drought-tolerant wheat (Triticum spp.) varieties. Int. J. Agron. 2021, 8811749. [Google Scholar] [CrossRef]
- Vollenweider, P.; Ottiger, M.; Günthardt-Goerg, M.S. Validation of leaf ozone symptoms in natural vegetation using microscopical methods. Environ. Pollut. 2003, 124, 101–118. [Google Scholar] [CrossRef] [PubMed]
- Wang, H.F.; Zhong, X.H.; Shi, W.Y.; Guo, B. Study of malondialdehyde (MDA) content, superoxide dismutase (SOD) and glutathione peroxidase (GSH-Px) activities in chickens infected with avian infectious bronchitis virus. Afr. J. Biotechnol. 2011, 10, 9213–9217. [Google Scholar]
- Wang, W.; Xia, M.; Chen, J.; Yuan, R.; Deng, F.; Shen, F. Gene expression characteristics and regulation mechanisms of superoxide dismutase and its physiological roles in plants under stress. Biochemistry 2018, 81, 465–480. [Google Scholar] [CrossRef] [PubMed]
- Woo, H.R.; Kim, H.J.; Lim, P.O.; Nam, H.G. Leaf senescence: systems and dynamics aspects. Annu. Rev. Plant Biol. 2019, 70, 347–376. [Google Scholar] [CrossRef]
- Xie, X.; He, Z.; Chen, N.; Tang, Z.; Wang, Q.; Cai, Y. The roles of environmental factors in regulation of oxidative stress in plant. Biomed Res. Int. 2019, 2019, 435–455. [Google Scholar] [CrossRef]
- Xie, Y.; Ma, M.; Liu, Y.; Wang, B.; Wei, H.; Kong, D.; Wang, H. Arabidopsis FHY3 and FAR1 function in age gating of leaf senescence. Front. Plant Sci. 2021, 12, 770060. [Google Scholar] [CrossRef] [PubMed]
- Yan, F.; Yu, Z.; Shi, Y. Optimized border irrigation delays winter wheat flag leaf senescence and promotes grain filling. Front. Plant Sci. 2023, 14, 1051323. [Google Scholar] [CrossRef] [PubMed]
- Yolcu, S.; Li, X.; Li, S.; Kim, Y.J. Beyond the genetic code in leaf senescence. J. Exp. Bot. 2018, 69, 801–810. [Google Scholar] [CrossRef]
- Yuan, Y.; Zhang, W.; Pang, J.; Zhou, M.; Liu, J.; Zhao, J.; Yang, M. Integrated physiological and metabolomic analyses reveal changes during the natural senescence of Quercus mongolica leaves. PLoS One 2023, 18, e0289272. [Google Scholar] [CrossRef] [PubMed]
- Yumoto, G.; Nishio, H.; Muranaka, T.; et al. Seasonal switching of integrated leaf senescence controls in an evergreen perennial Arabidopsis. Nat. Commun. 2024, 15, 4719. [Google Scholar] [CrossRef] [PubMed]
- Zelinova, V.; Mistrik, I.; Palove-Balang, P.; Tamas, L. Peroxidase activity against guaiacol, NADH, chlorogenic acid, ferulic acid and coniferyl alcohol in root tips of Lotus japonicus and L. corniculatus grown under low pH and aluminium stress. Biologia, 2010; 65, 279–283. [Google Scholar]
- Zhang, Y.M.; Guo, P.; Xia, X.; Guo, H.; Li, Z. Multiple layers of regulation on leaf senescence: new advances and perspectives. Front. Plant Sci. 2021, 12, 788996. [Google Scholar] [CrossRef] [PubMed]
- Zhao, Q.; Zhou, L.; Liu, J.; Du, X.; Huang, F.; Pan, G.; Cheng, F. Relationship of ROS accumulation and superoxide dismutase isozymes in developing anther with floret fertility of rice under heat stress. Plant Physiol. Biochem. 2018, 122, 90–101. [Google Scholar] [CrossRef]
- Zhao, W.; Zhao, H.; Wang, H.; He, Y. Research progress on the relationship between leaf senescence and quality, yield and stress resistance in horticultural plants. Front. Plant Sci. 2022, 13, 1044500. [Google Scholar] [CrossRef]
- Zhao, X.; Zhuang, W.; Zhang, Y. The relationship between leaf senescence and stress tolerance in plants. J. Plant Growth Regul. 2023, 42, 1–15. [Google Scholar]
Figure 1.
Dynamics of membrane stability in wheat flag leaves during natural and drought-induced senescence. DAA – days after anthesis. All tests were conducted in triplicate, and the results are presented as the mean ± standard deviation (s.d.). Significance from a two-way Student's t-test: P < 0.05 (*), P < 0.01 (**), P < 0.001 (***); ns indicates non-significance (P > 0.05).
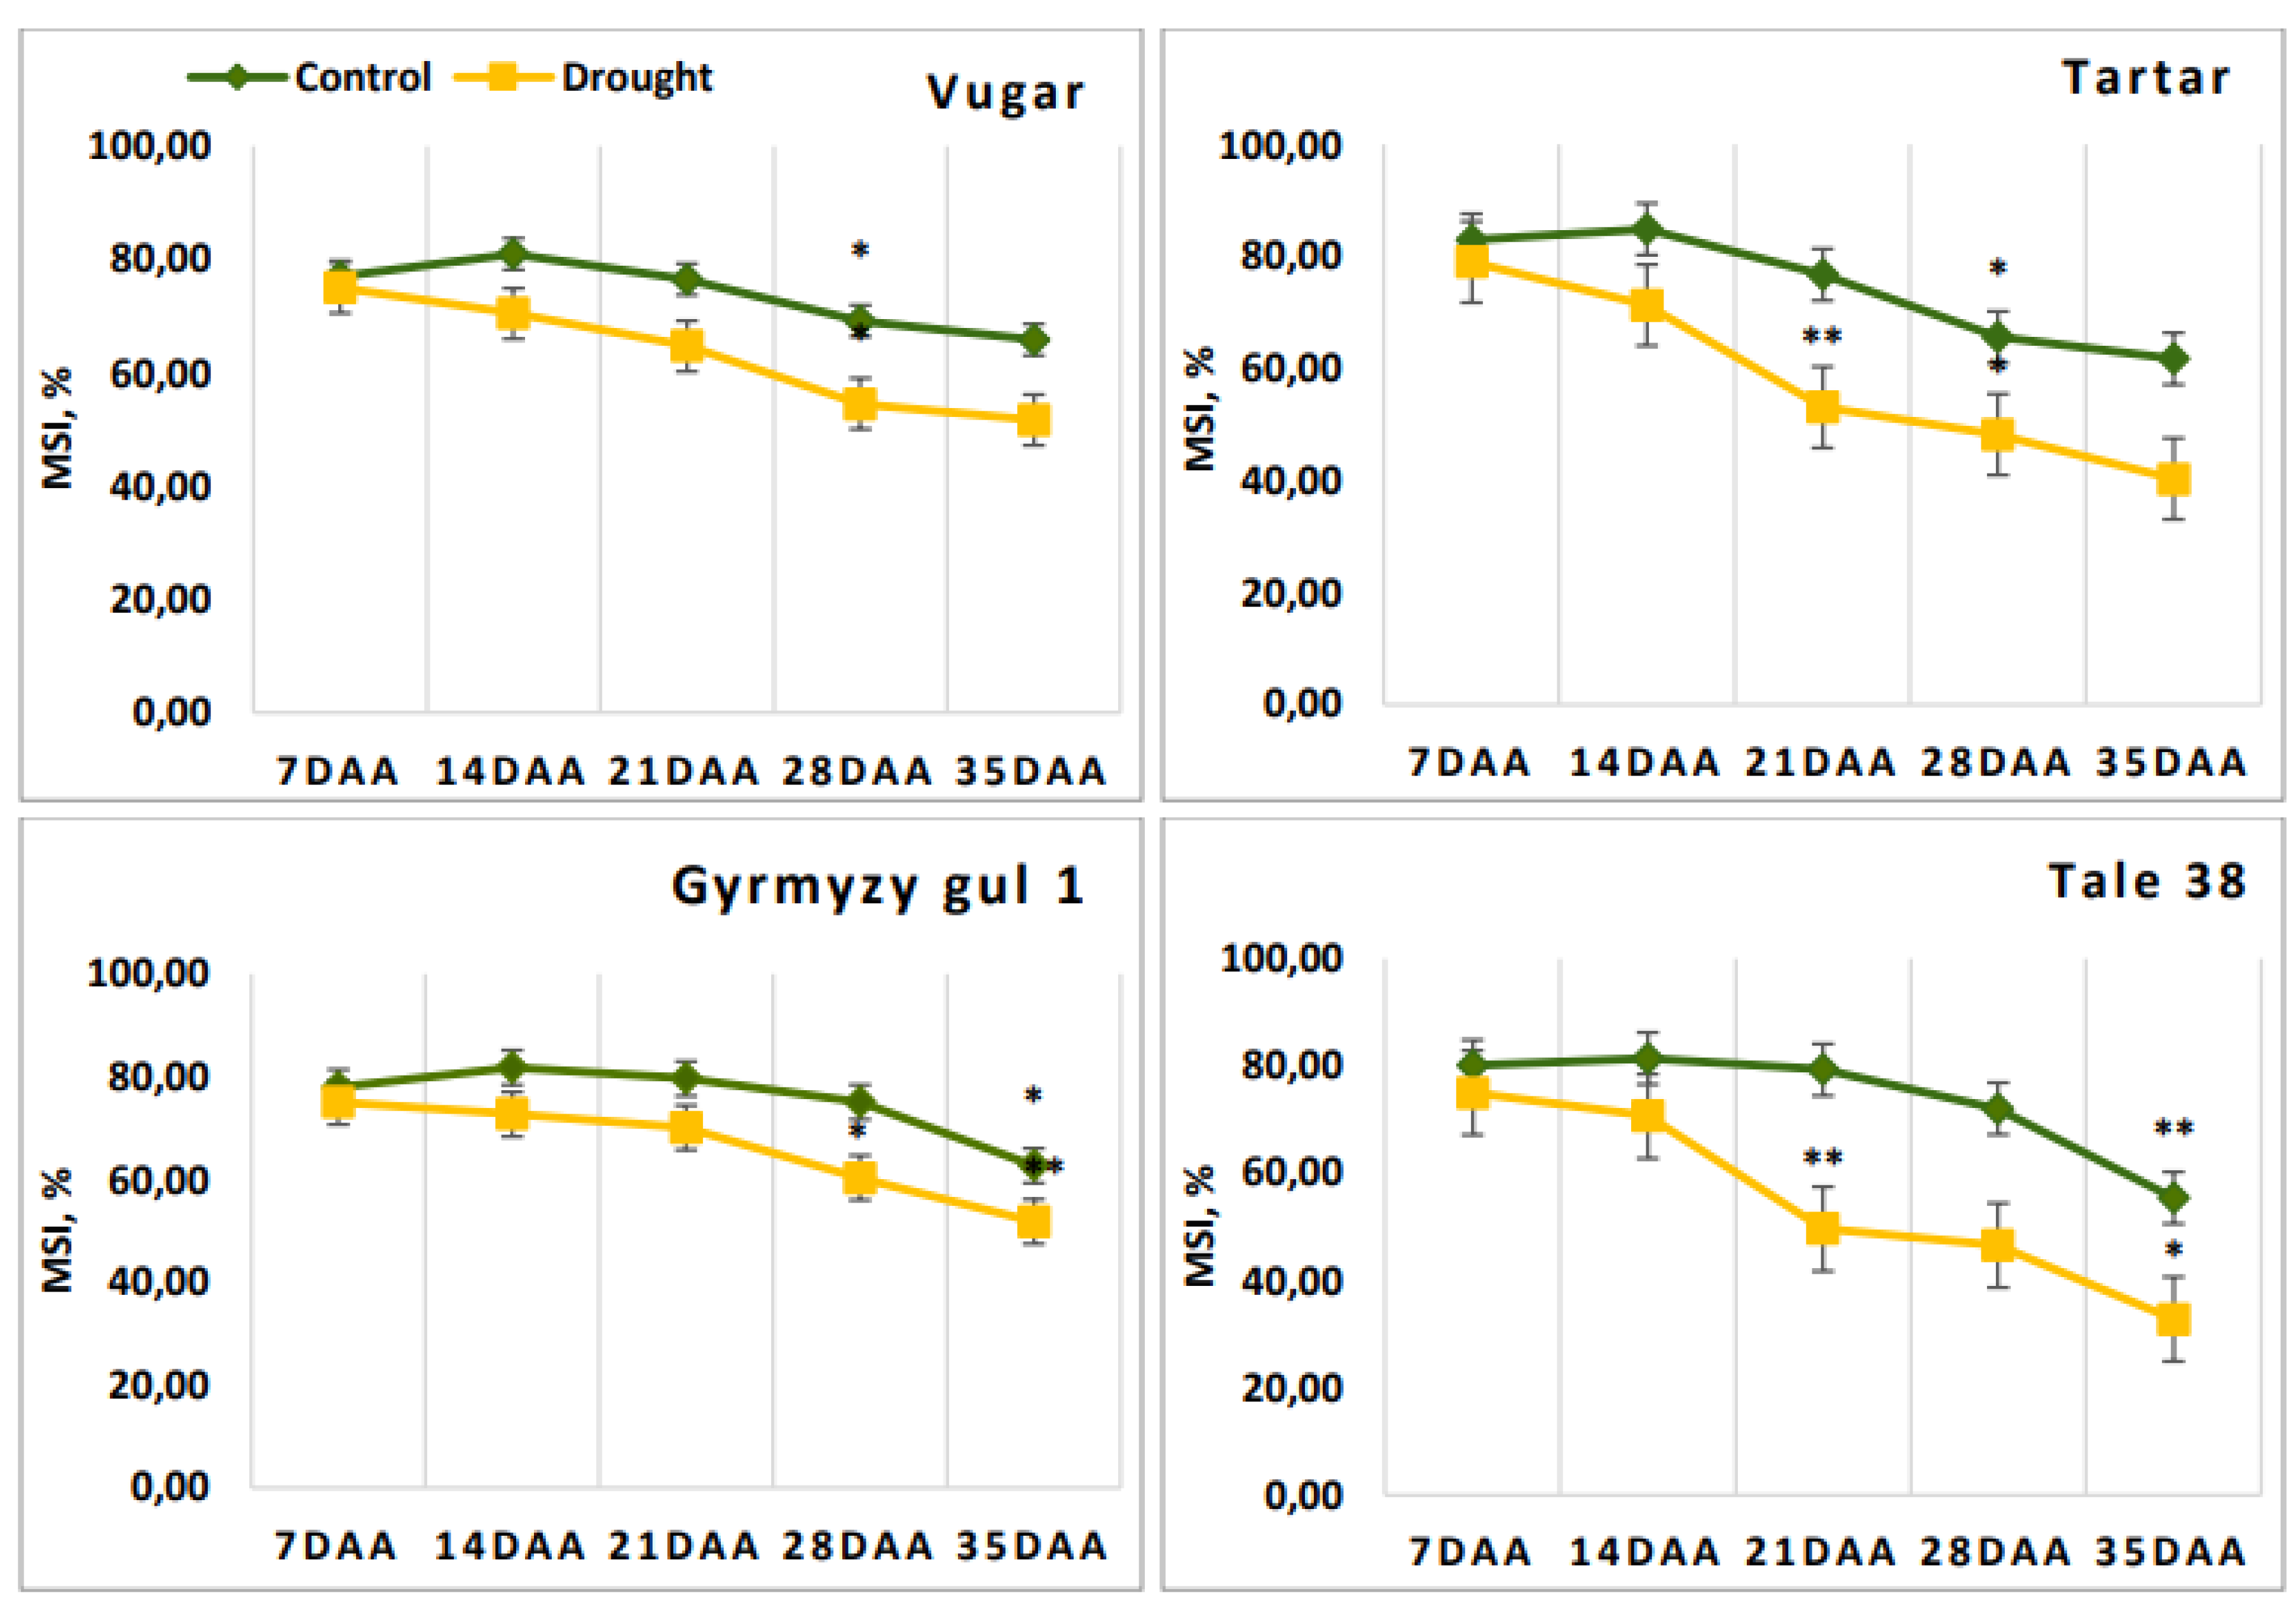
Figure 2.
Changes in malondialdehyde (MDA) content in wheat flag leaves during senescence. DAA – days after anthesis. All tests were conducted in triplicate, and the results are presented as the mean ± standard deviation (s.d.). Significance from a two-way Student's t-test: P < 0.05 (*), P < 0.01 (**), P < 0.001 (***); ns indicates non-significance (P > 0.05).
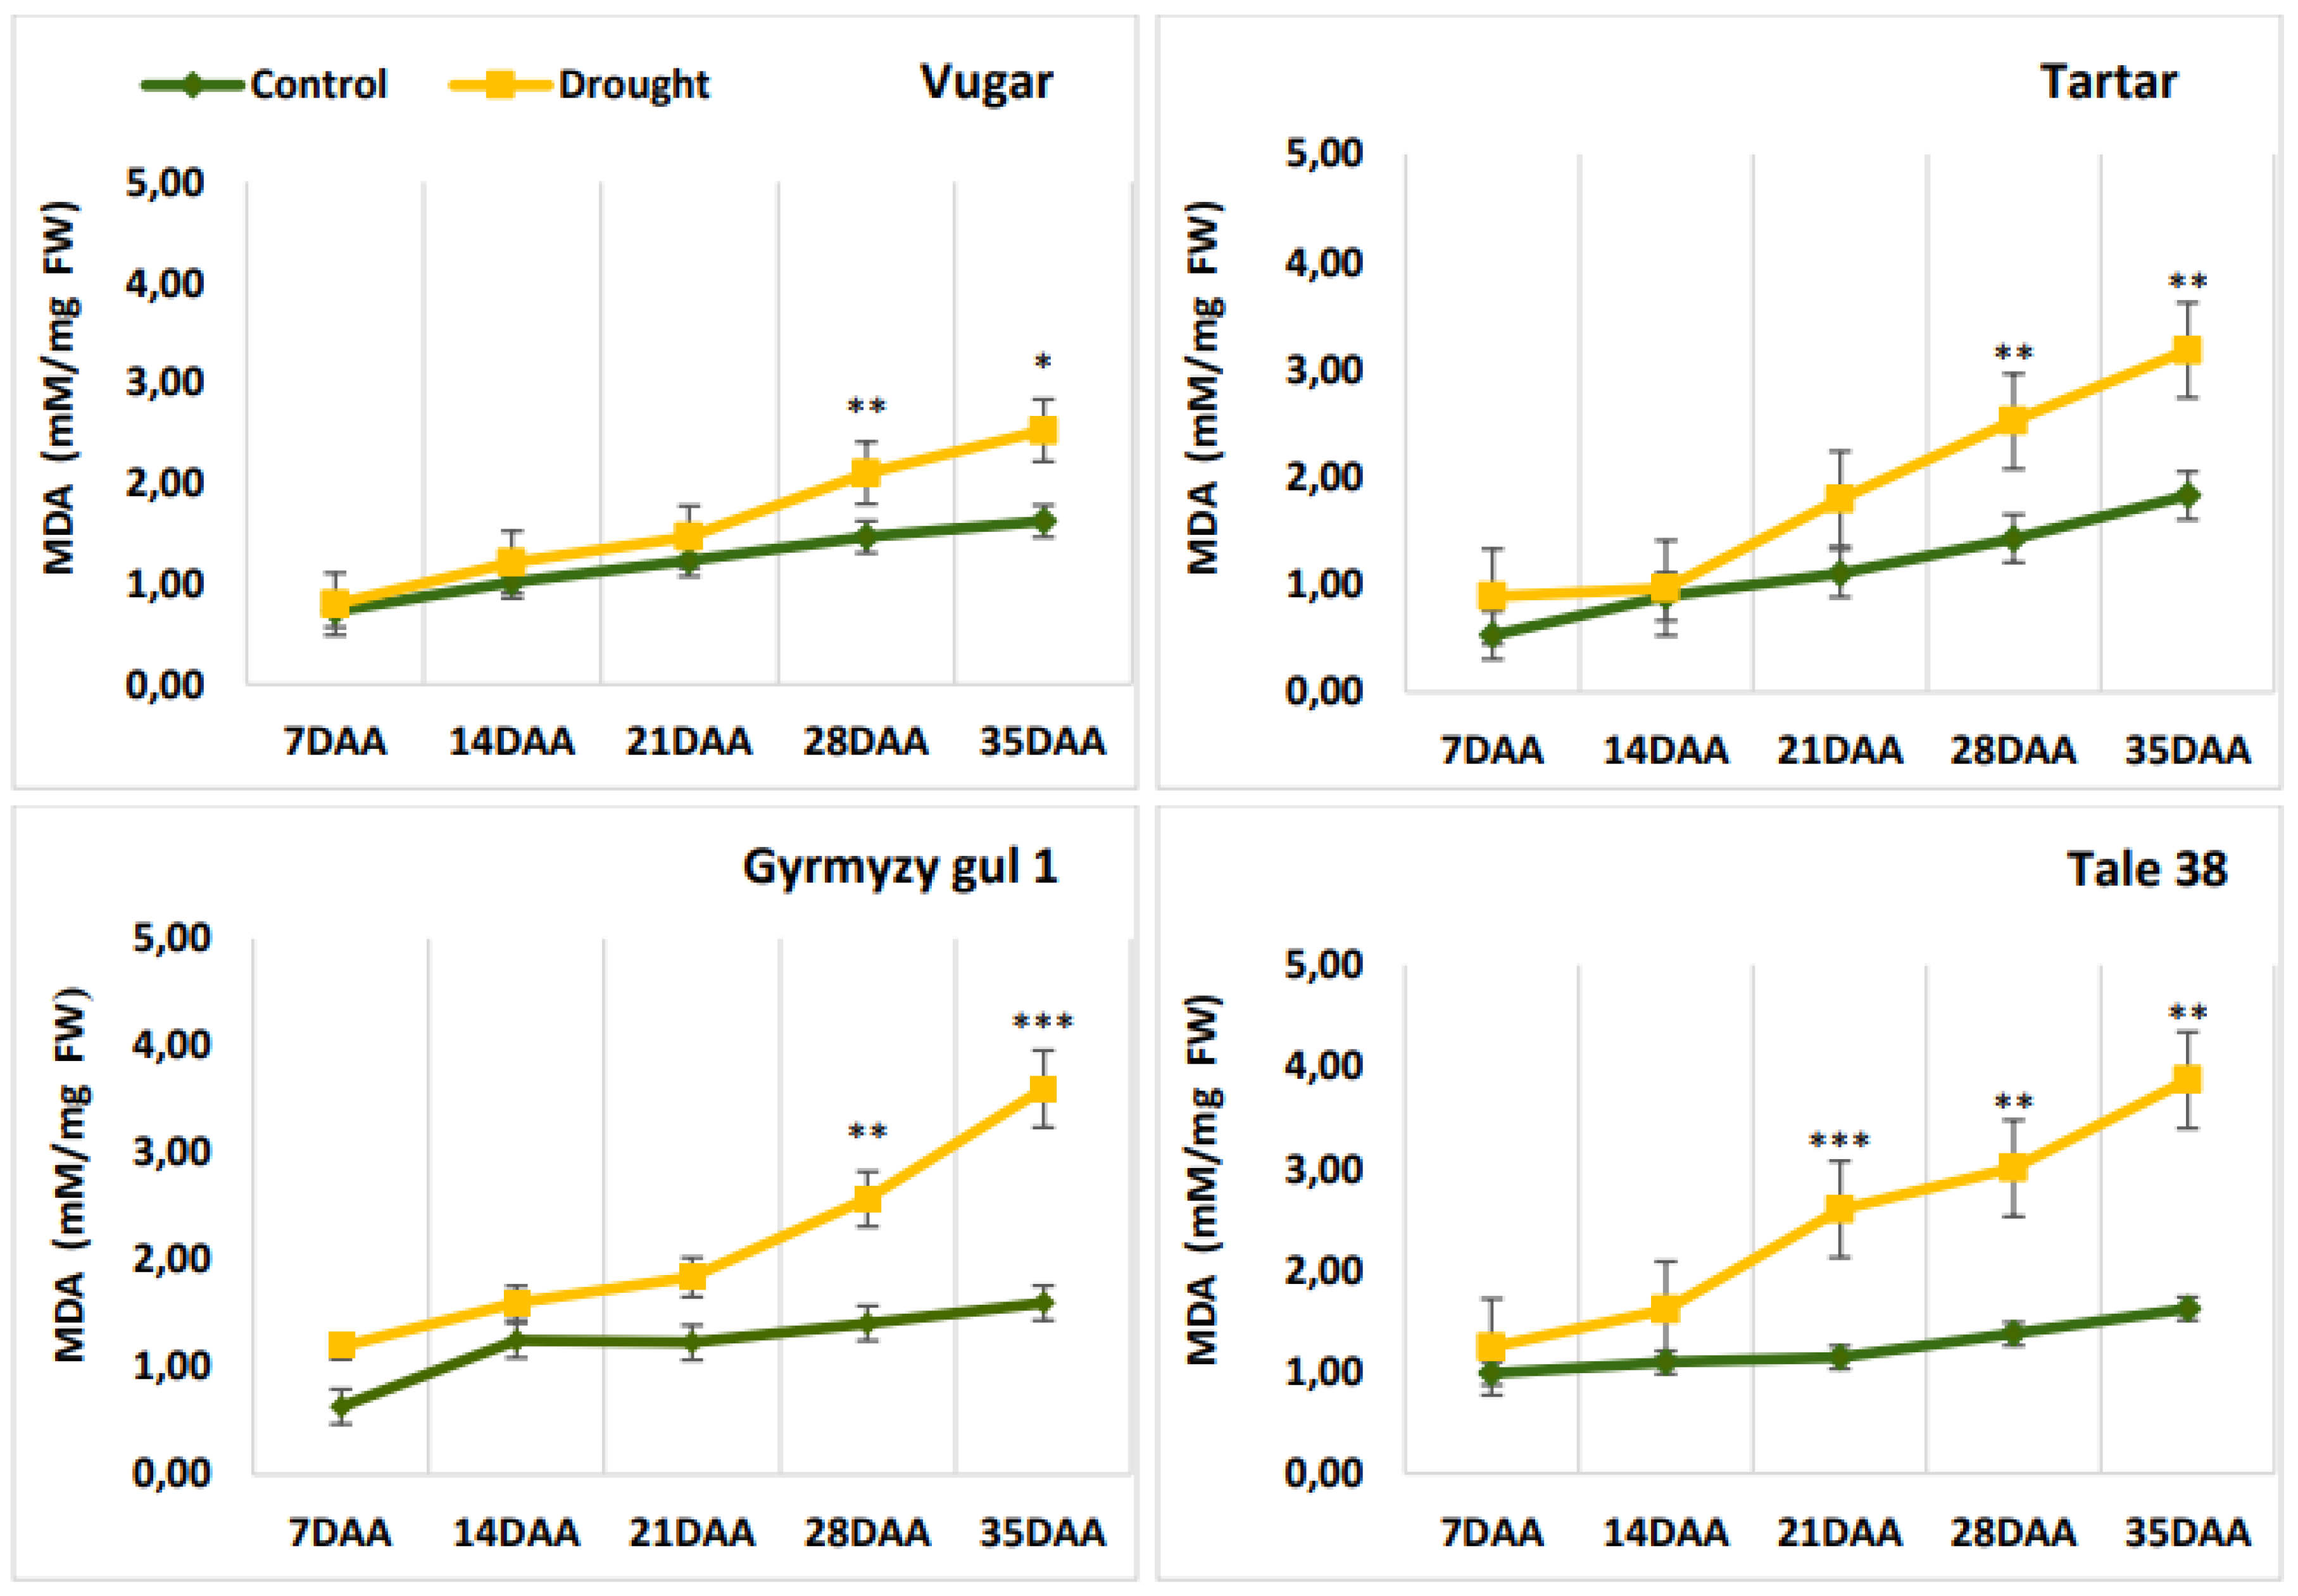
Figure 3.
Total soluble protein content in wheat flag leaves during senescence. DAA – days after anthesis. All tests were conducted in triplicate, and the results are presented as the mean ± standard deviation (s.d.). Significance from a two-way Student's t-test: P < 0.05 (*), P < 0.01 (**), P < 0.001 (***); ns indicates non-significance (P > 0.05).
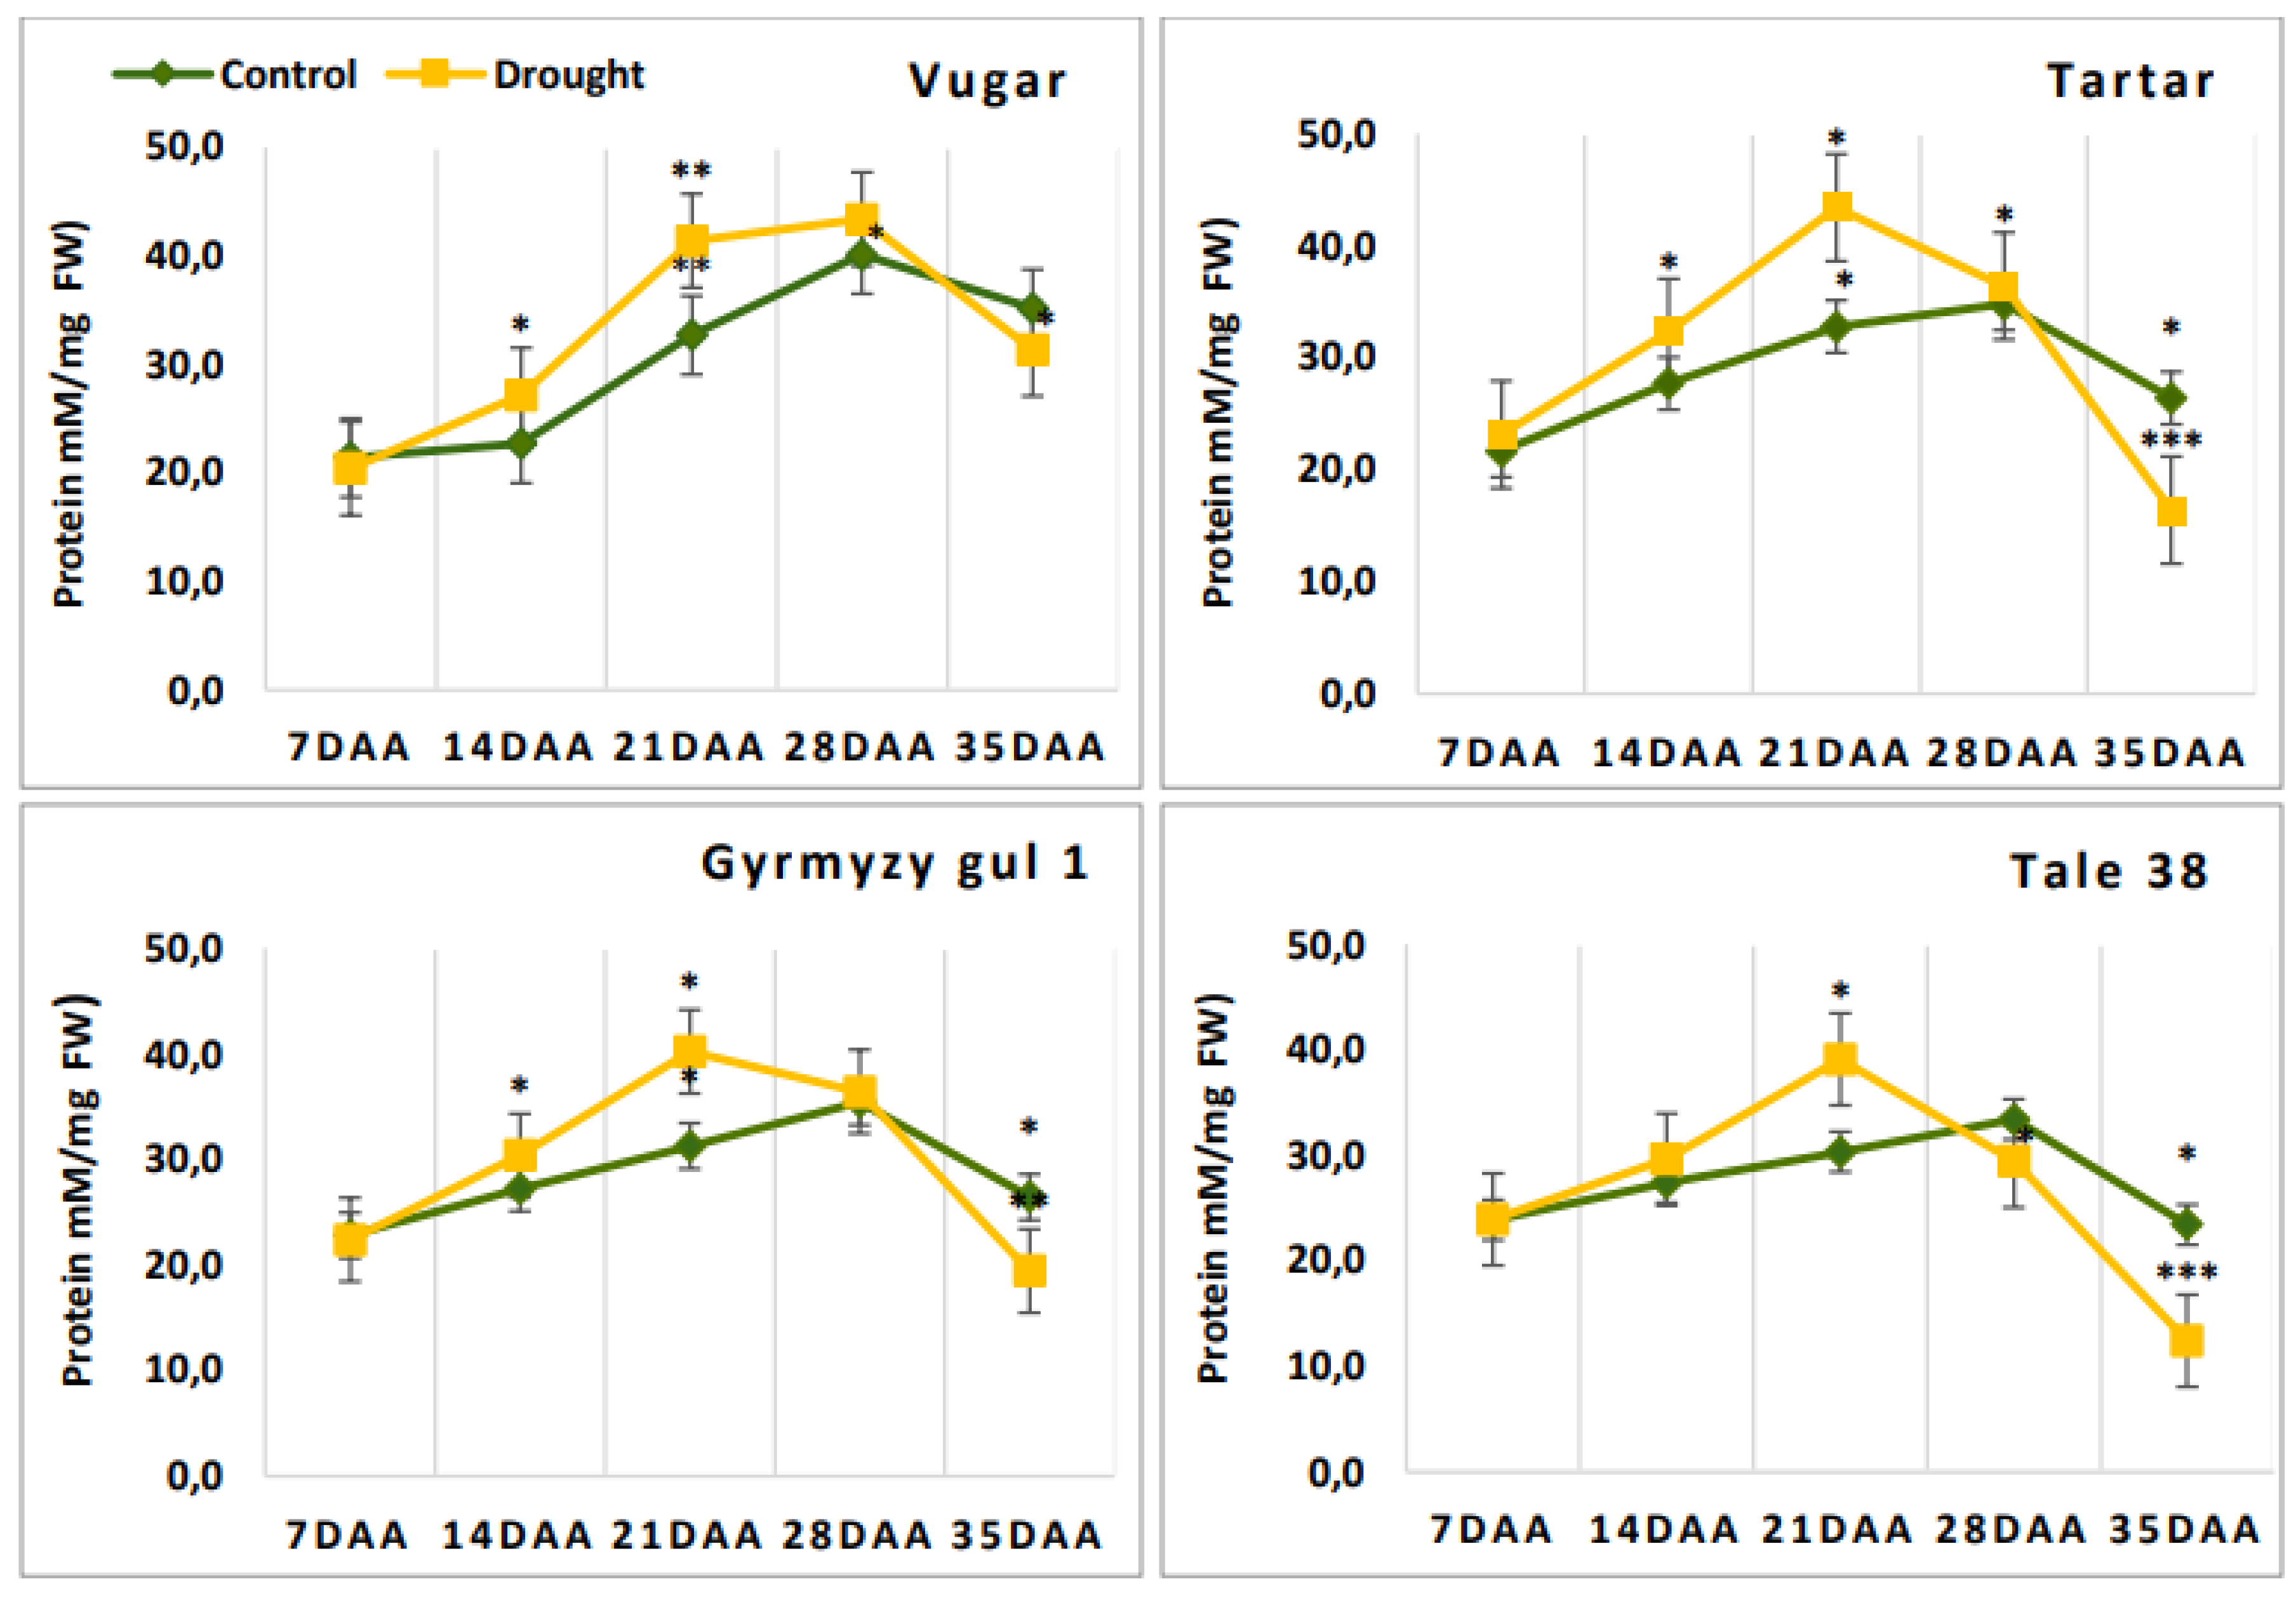
Figure 4.
The activity of SOD during natural and stress-induced flag leaf senescence in wheat genotypes. DAA – days after anthesis. All tests were conducted in triplicate, and the results are presented as the mean ± standard deviation (s.d.). Significance from a two-way Student's t-test: P < 0.05 (*), P < 0.01 (**), P < 0.001 (***); ns indicates non-significance (P > 0.05).
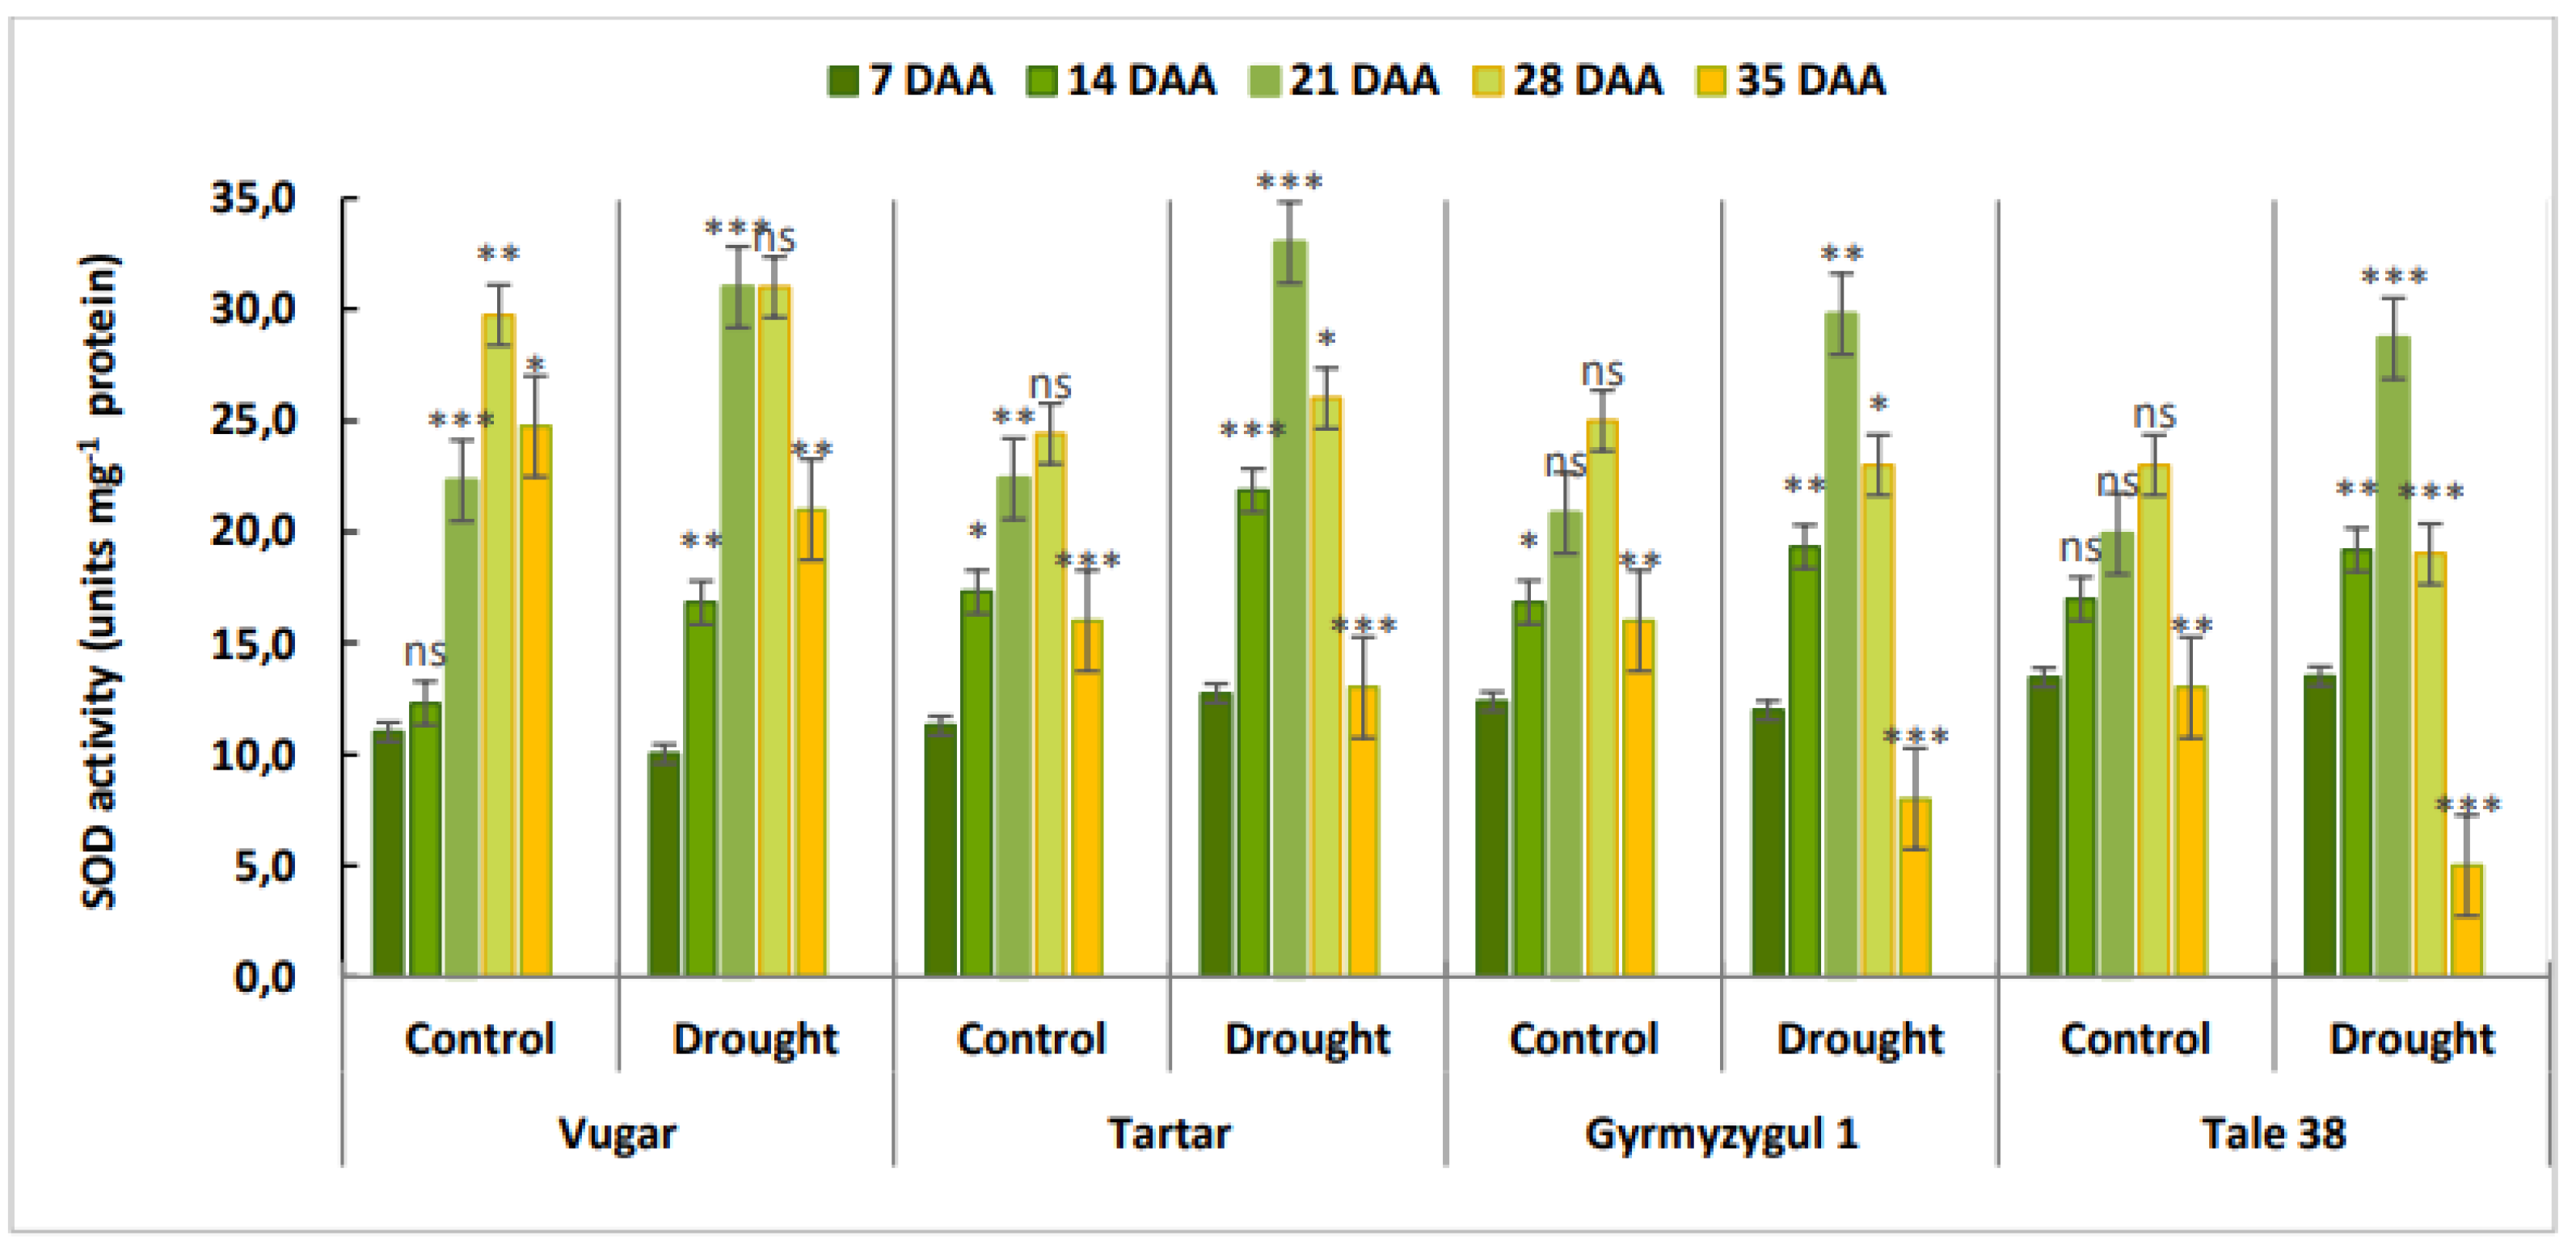
Figure 5.
Transcript levels of CuZnSOD, FeSOD, and MnSOD in flag leaves of wheat plants during natural and stress-induced senescence. DAA – days after anthesis. The fold change in expression was calculated using the 2−ΔΔCt method. All tests were conducted in triplicate, and the results are presented as the mean ± standard deviation (s.d.). Significance from a two-way Student's t-test: P < 0.05 (*), P < 0.01 (**), P < 0.001 (***); ns indicates non-significance (P > 0.05).
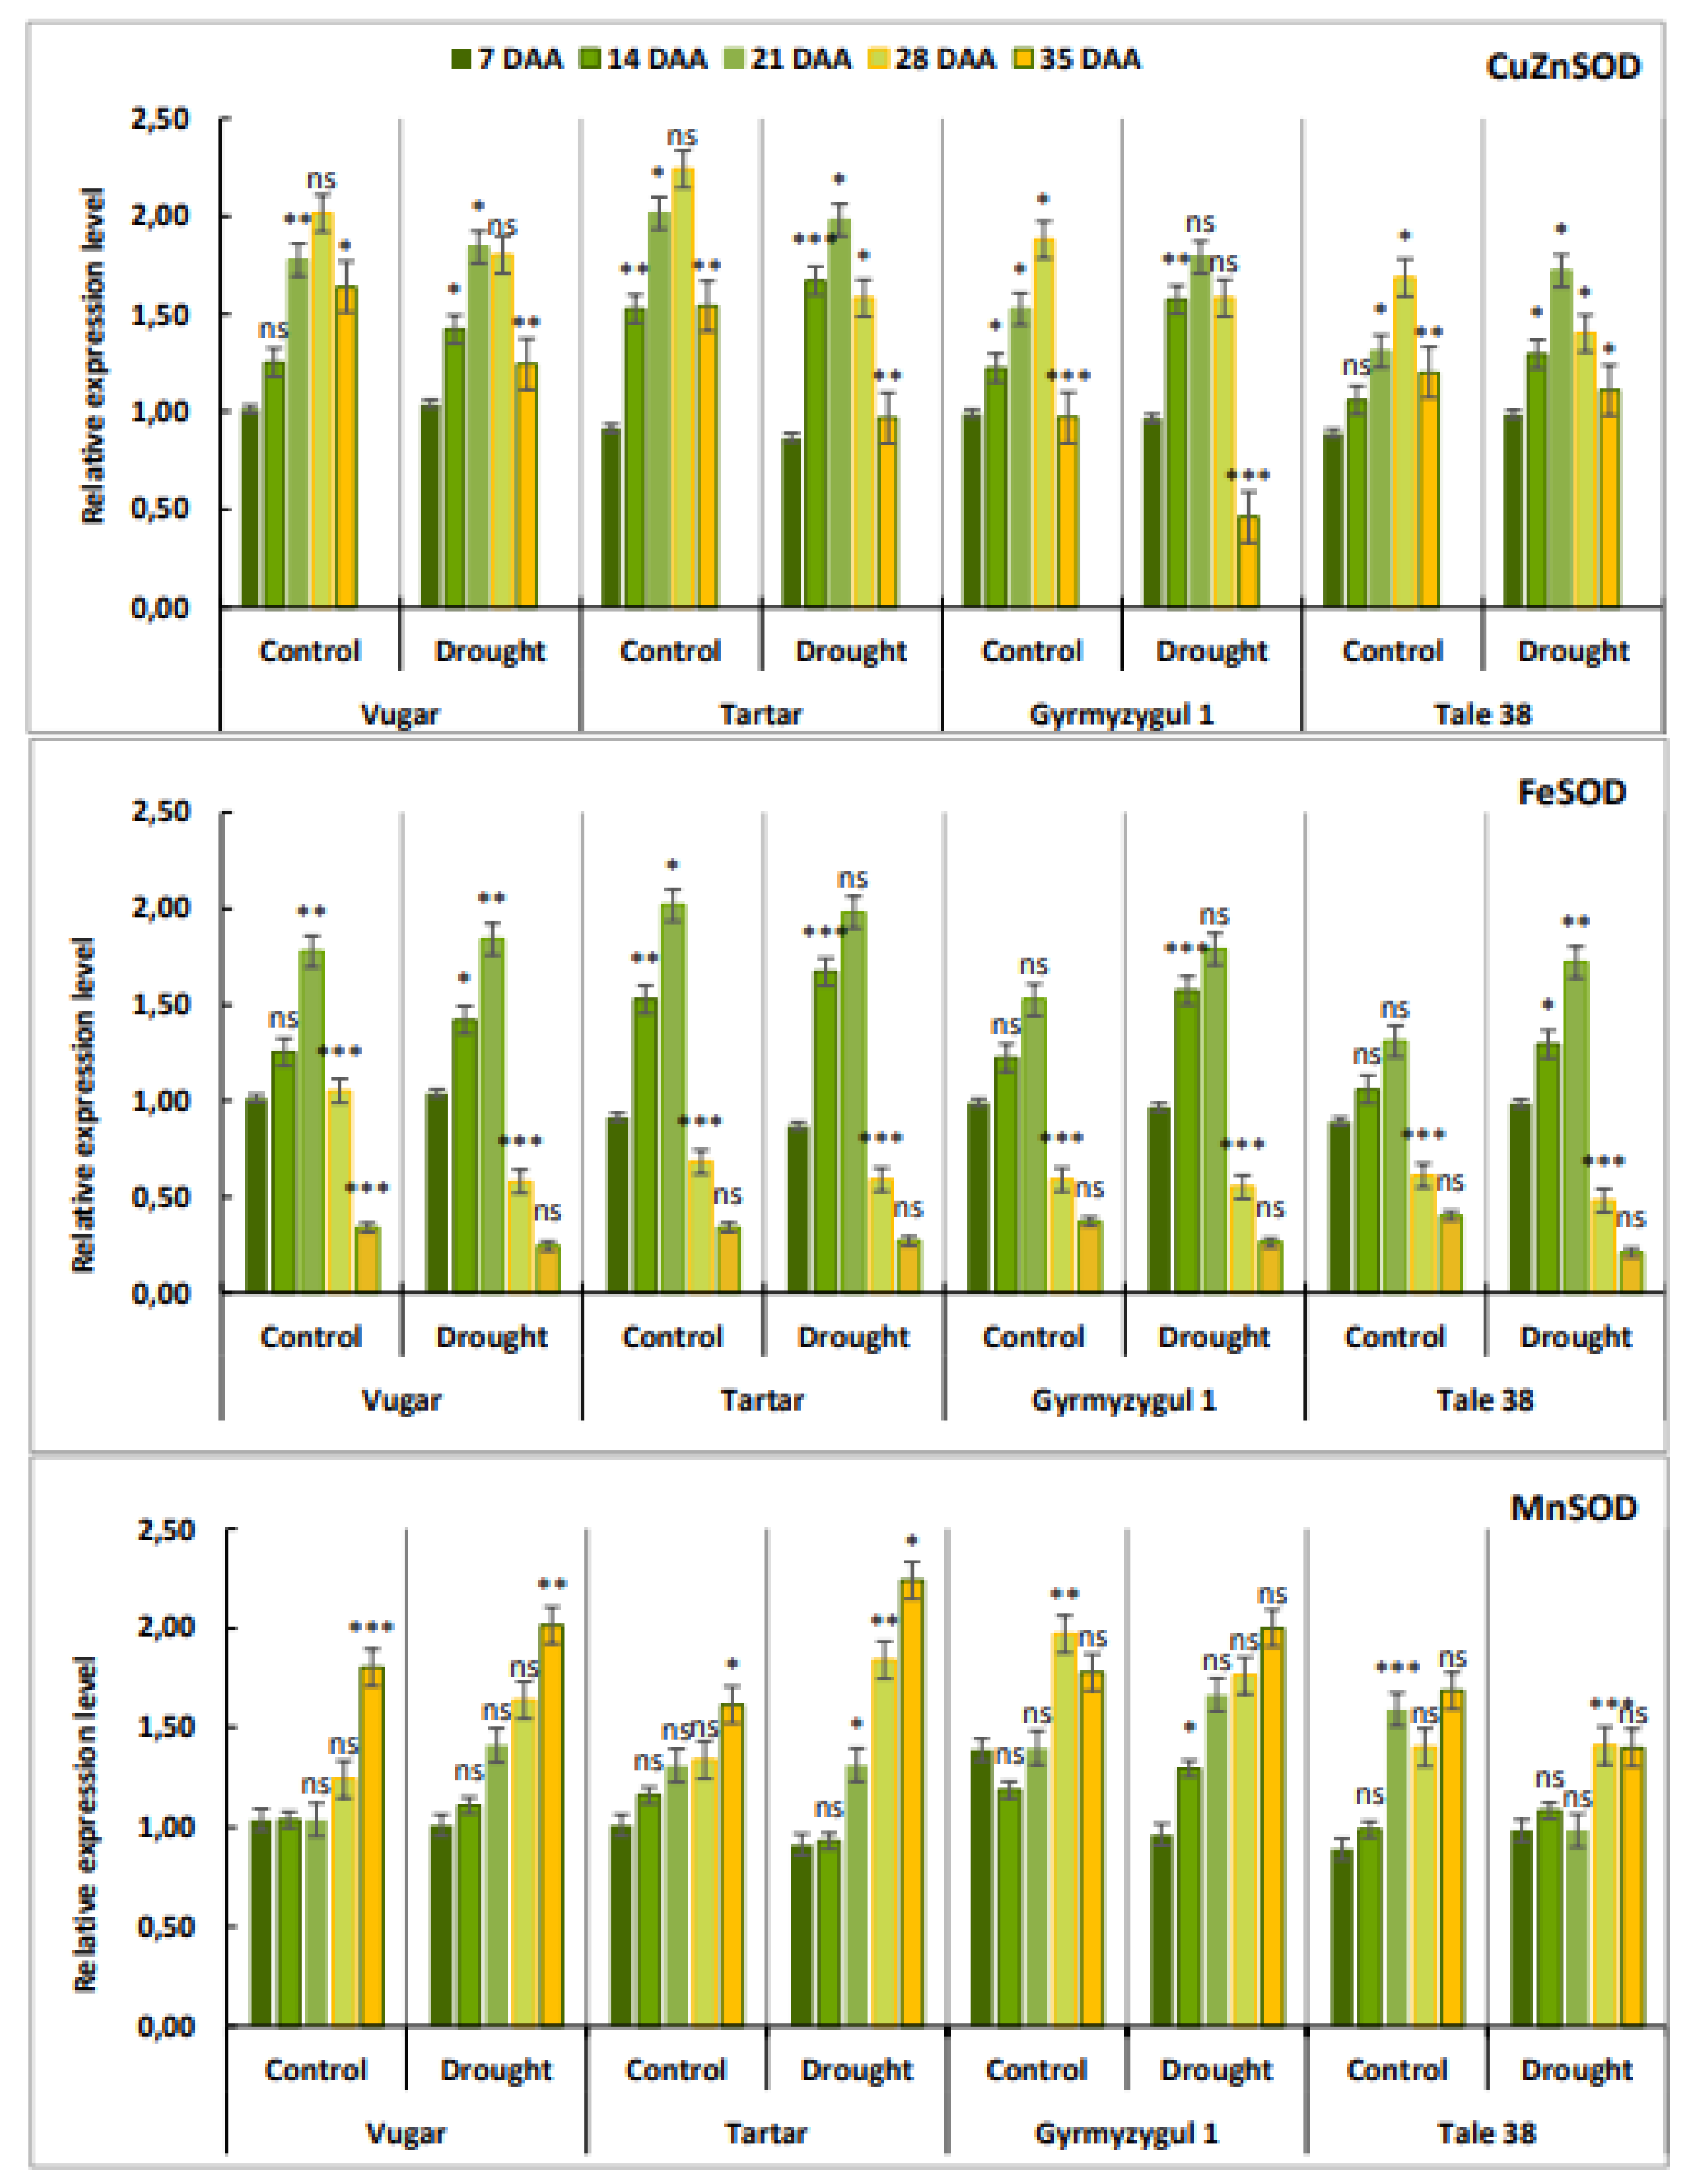
Figure 6.
Dynamics of ascorbate peroxidase (APX), benzidine peroxidase (BPX), and guaiacol peroxidase (GPX) activity during natural and stress-induced flag leaf senescence in wheat genotypes. DAA – days after anthesis. All tests were conducted in triplicate, and the results are presented as the mean ± standard deviation (s.d.). Significance from a two-way Student's t-test: P < 0.05 (*), P < 0.01 (**), P < 0.001 (***); ns indicates non-significance (P > 0.05).
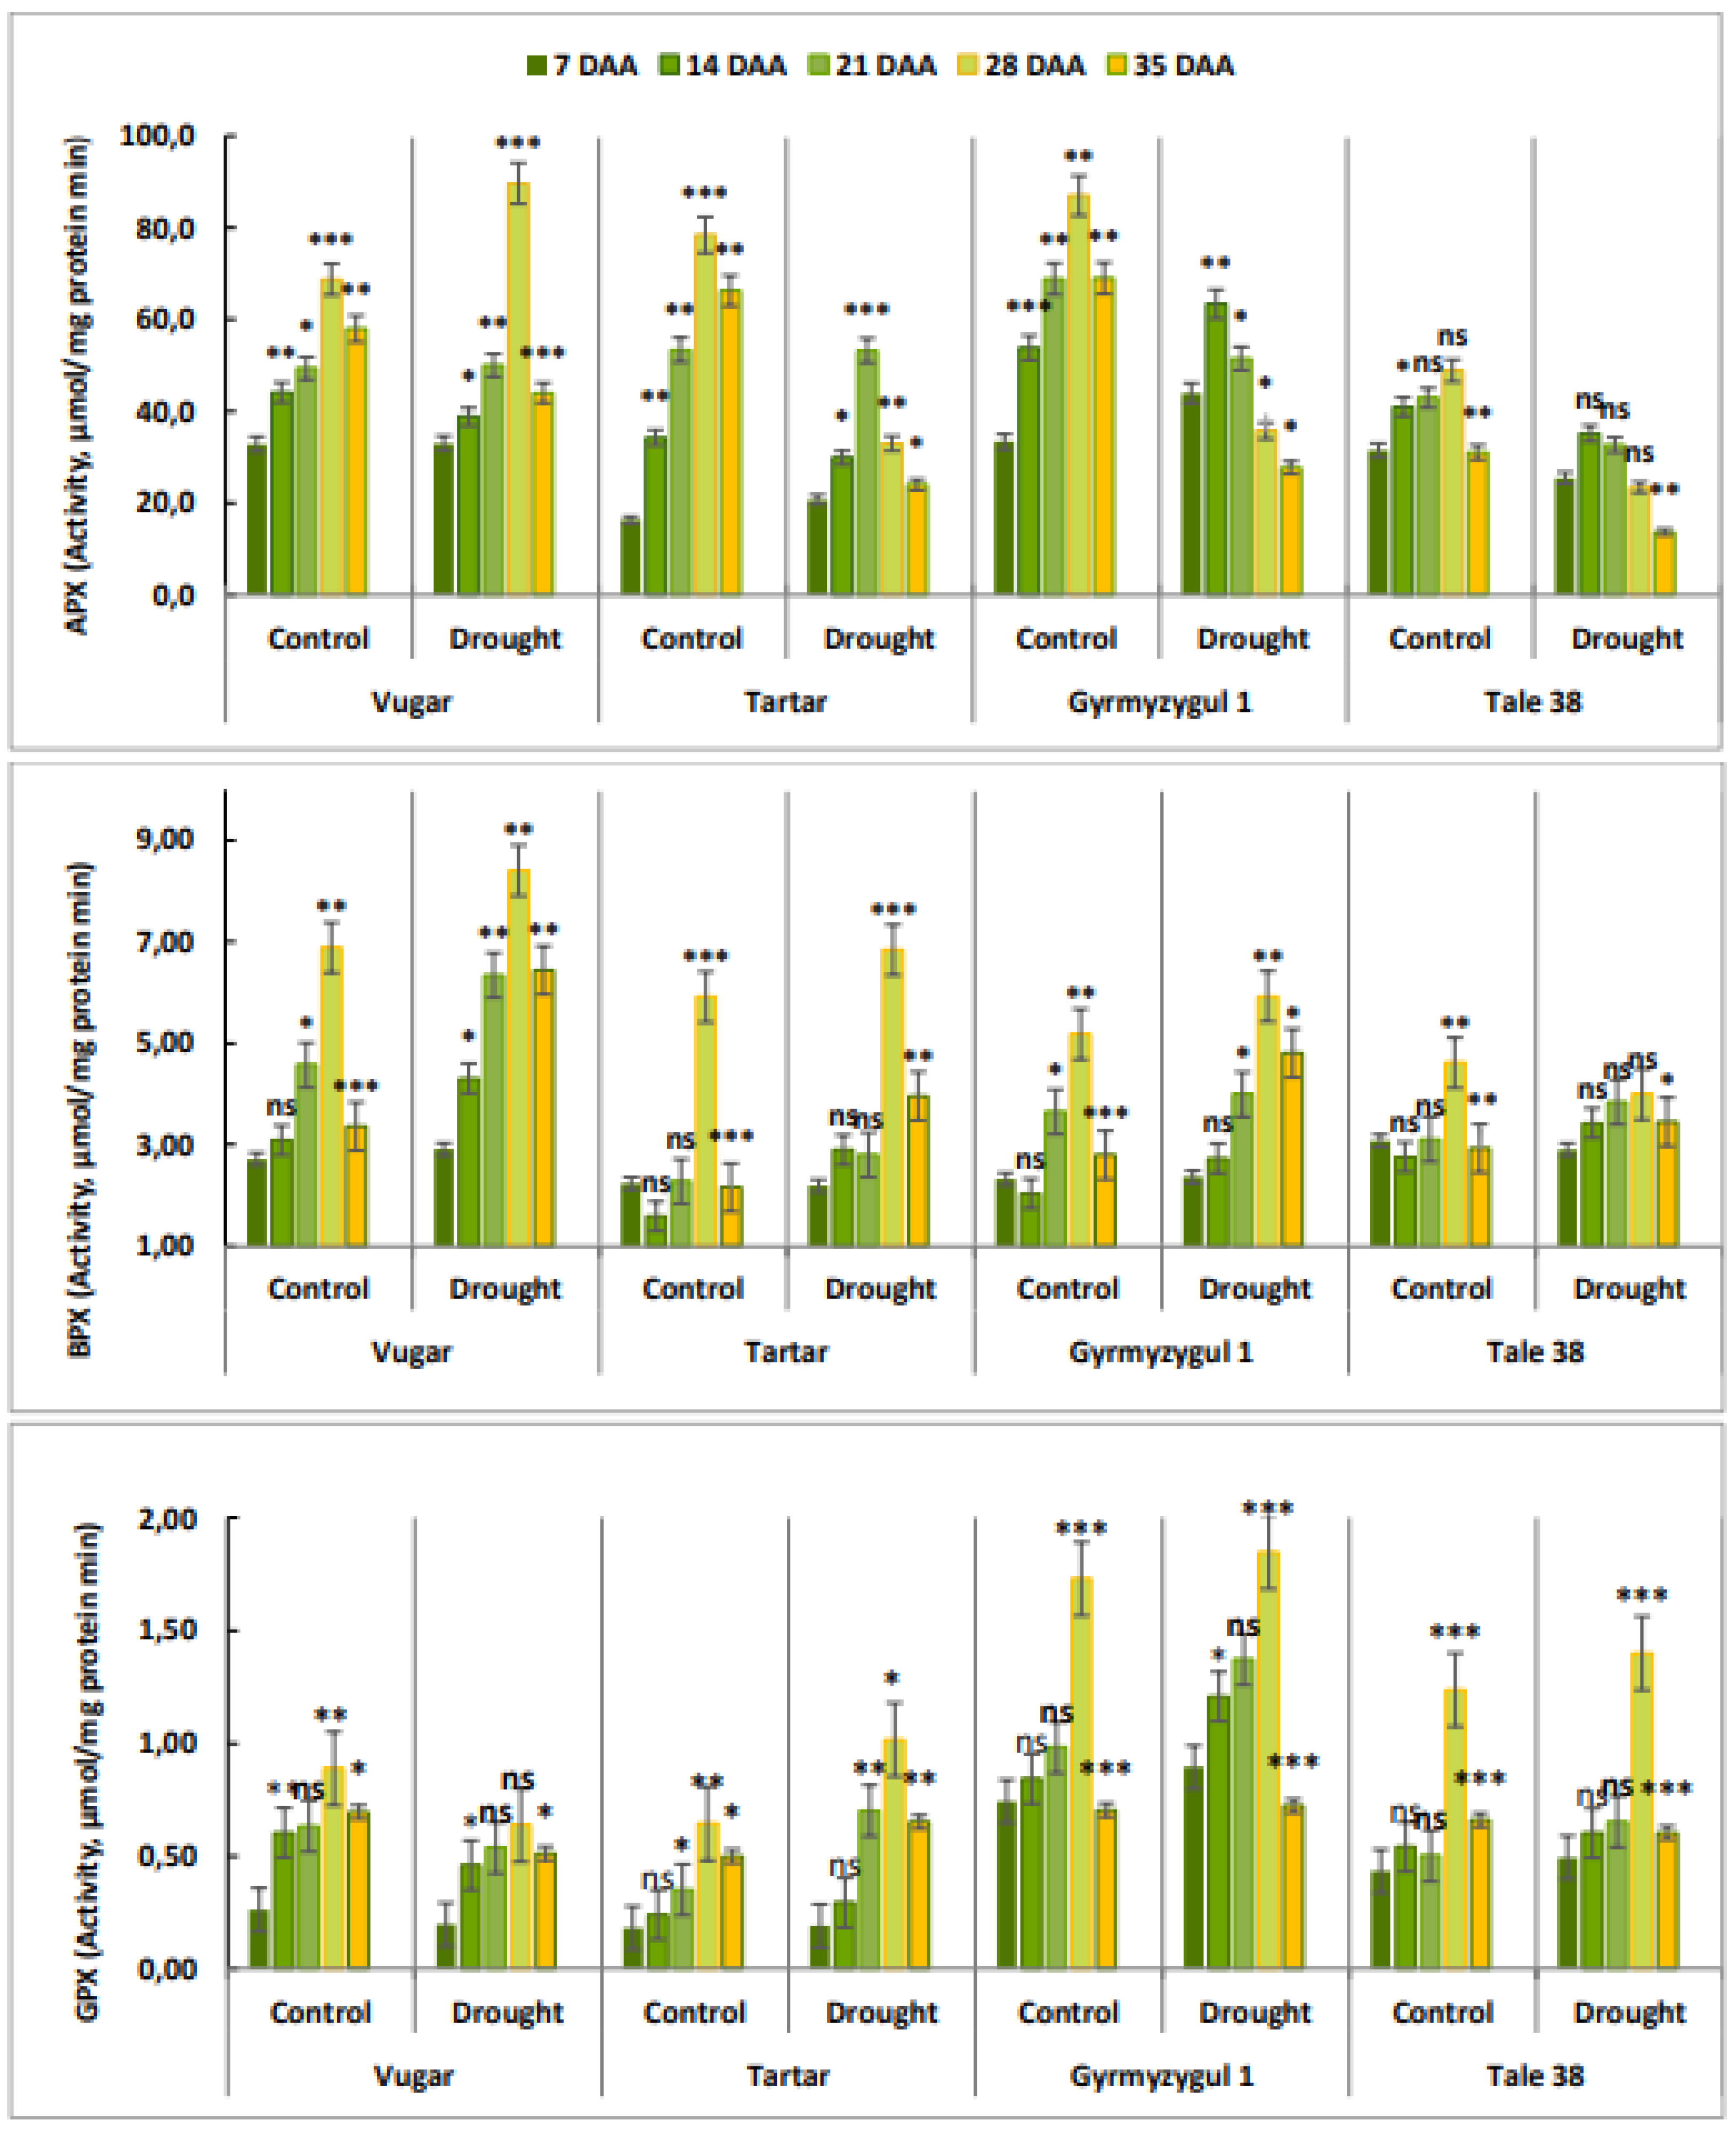
Figure 7.
The activity of CAT during natural and stress-induced flag leaf senescence in wheat genotypes. DAA – days after anthesis. All tests were conducted in triplicate, and the results are presented as the mean ± standard deviation (s.d.). Significance from a two-way Student's t-test: P < 0.05 (*), P < 0.01 (**), P < 0.001 (***); ns indicates non-significance (P > 0.05).
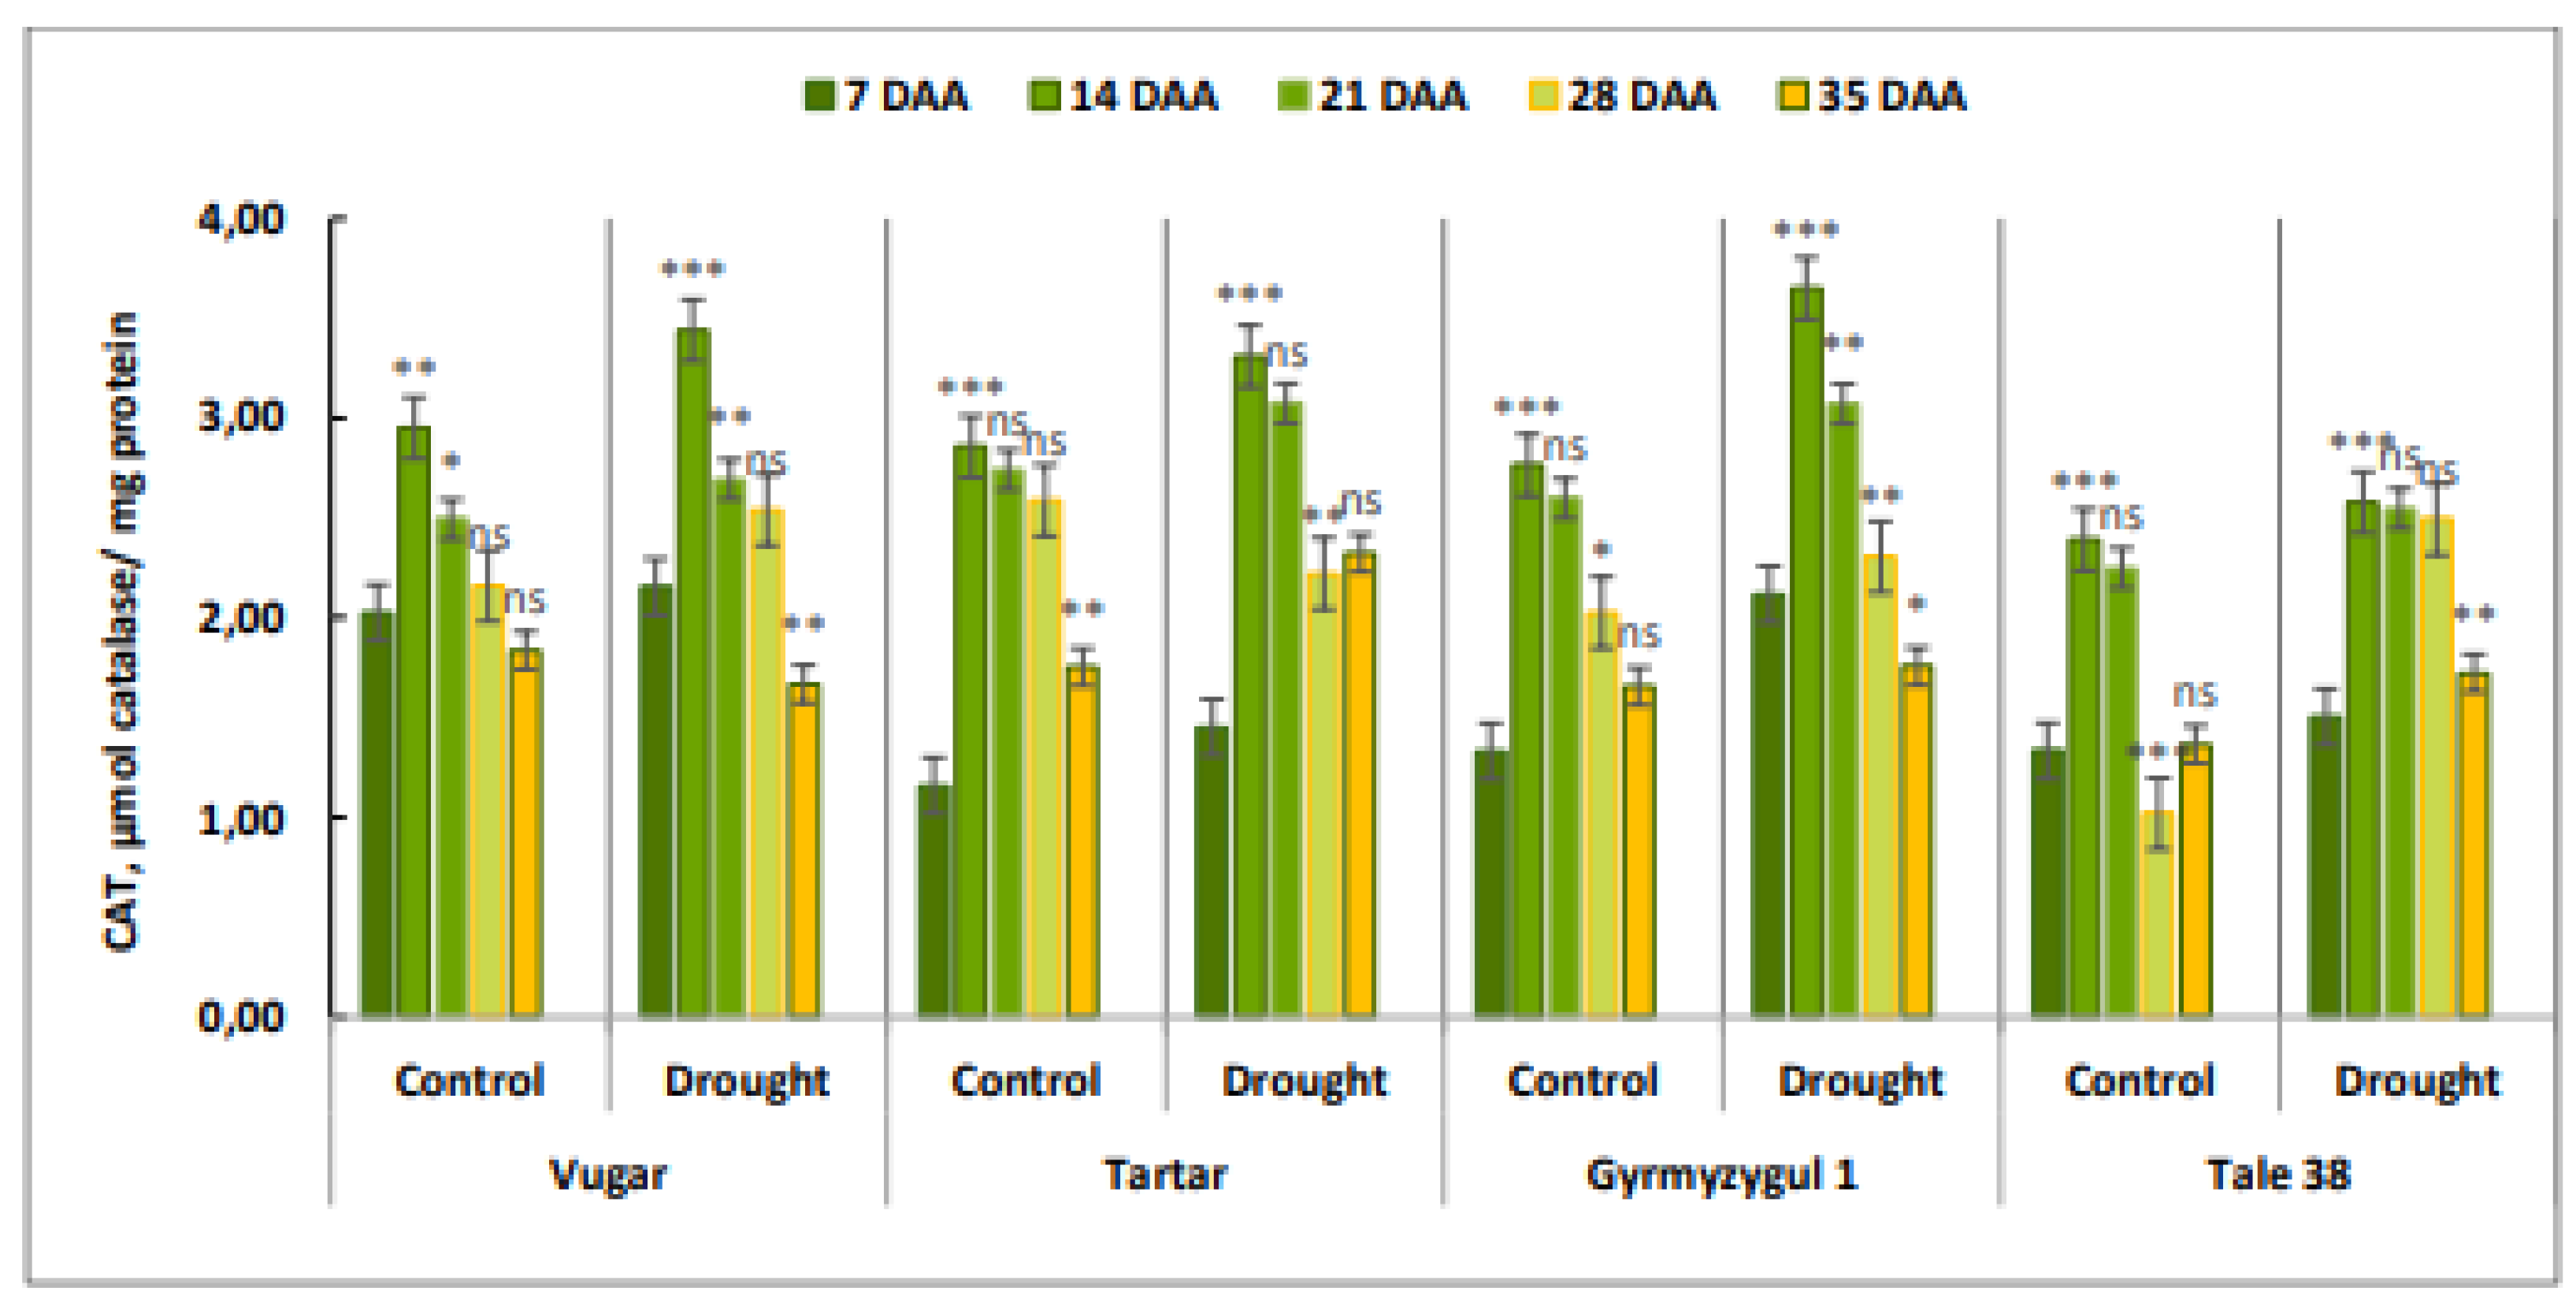
Figure 8.
Light microscopy images of the flag leaves of the Gyrmyzy gul 1 genotype. DAA – days after anthesis. A - 7 DAA under normal watering conditions; B, C, D - 7, 21, and 35 DAA under drought stress, respectively. Designations: E - epidermis, Mc - mesophyll cells, St - stomata. Semi-thin section (1 µm), one-step staining.
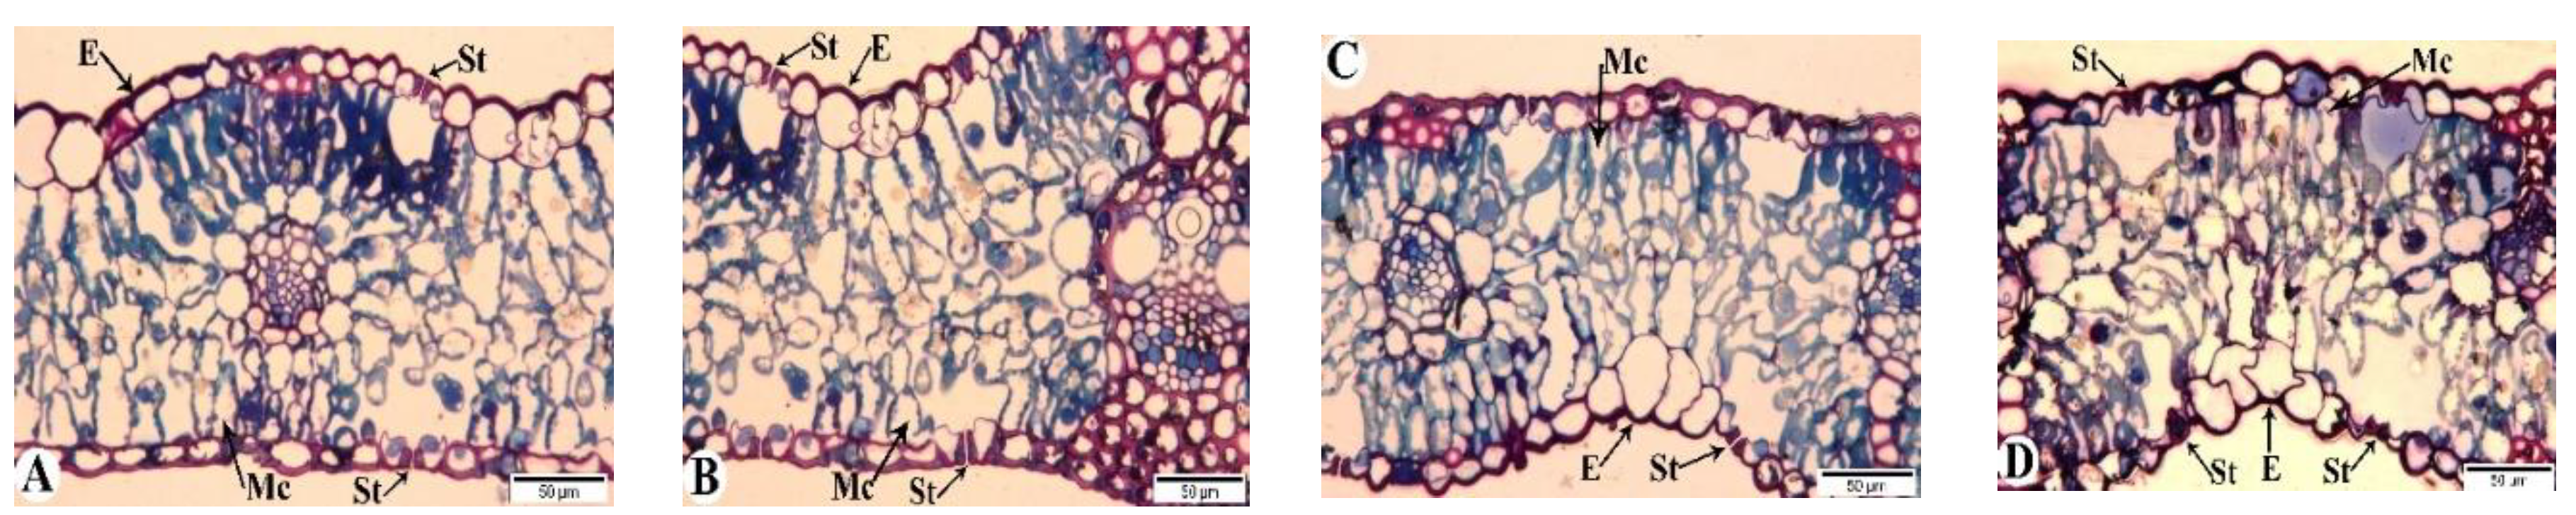
Figure 9.
Light microscopy images of the flag leaves of the Tale 38 genotype. DAA – days after anthesis. A - 7 DAA under normal watering conditions; B, C, D - 7, 21, and 35 DAA under drought stress, respectively. Designations: E - epidermis, Mc - mesophyll cells, St - stomata. Semi-thin section (1 µm), one-step staining.
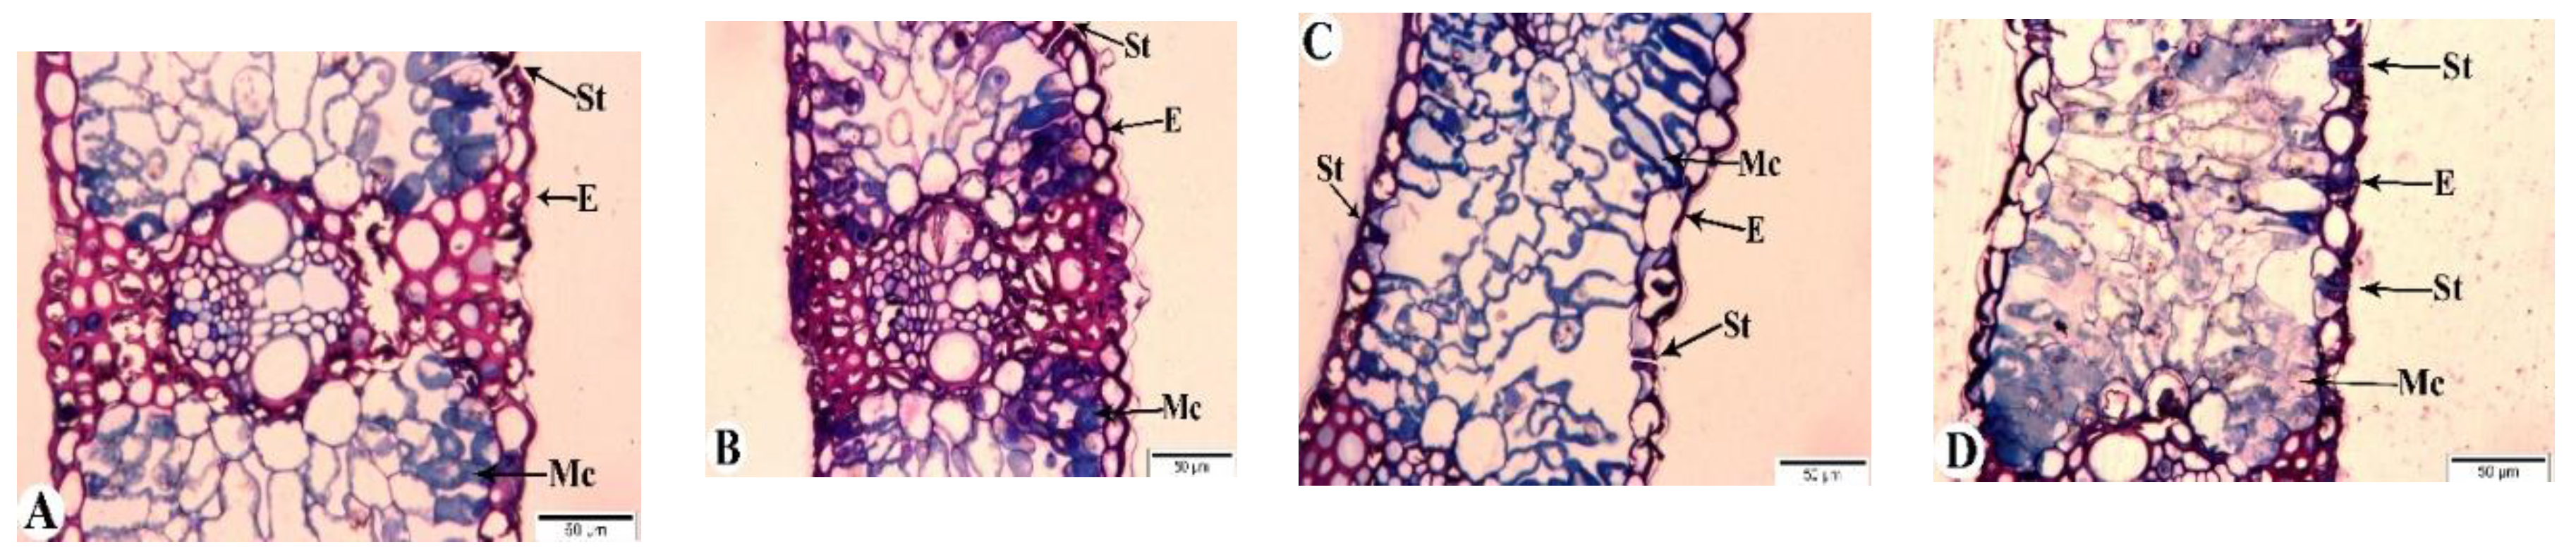
Figure 10.
Transmission electron microscopy (TEM) images of the flag leaves of the Gyrmyzy gul 1 genotype. DAA – days after anthesis. A - 7 DAA under normal watering conditions; B, C, D-F - 7, 21, and 35 DAA under drought stress, respectively. Designations: N - nucleus, Cw - cell wall, Th - thylakoids, Ld - lipid droplets, M - mitochondria, Ch - chloroplasts, Pl - plastoglobulins, Ms - myelin-like structures. Ultrathin sections (50-70 nm), stained with uranyl acetate and lead citrate.
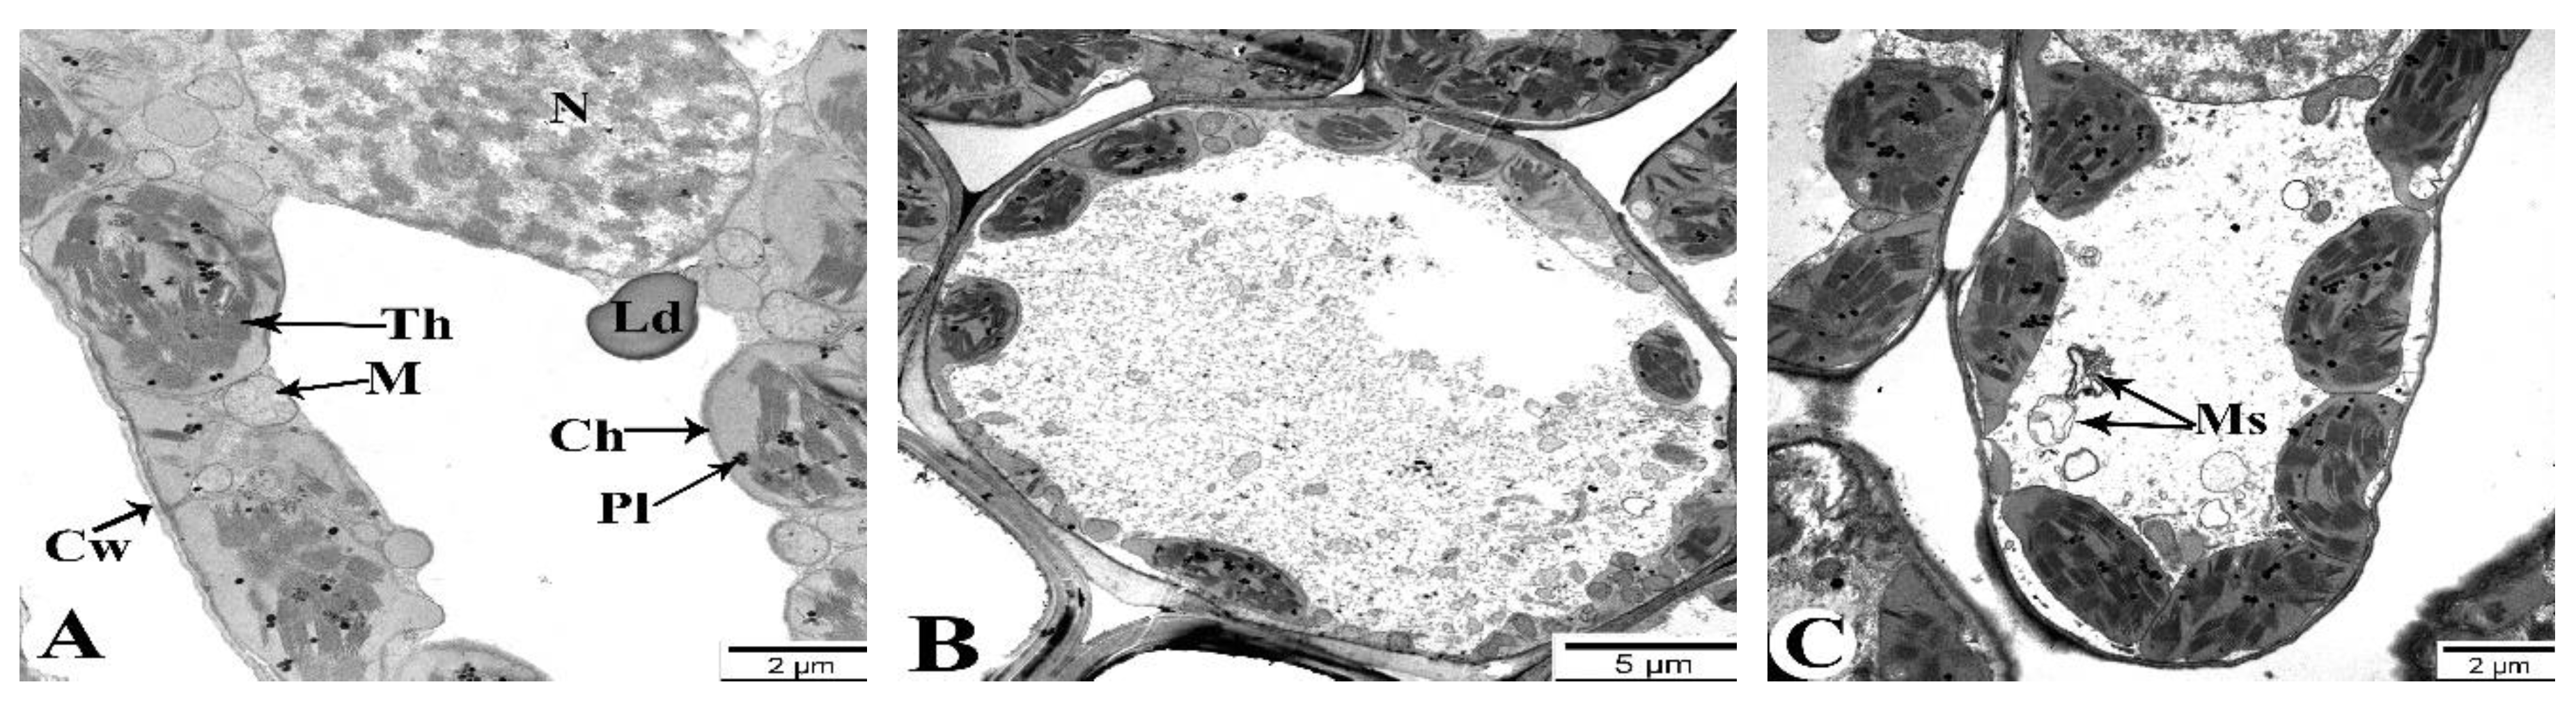
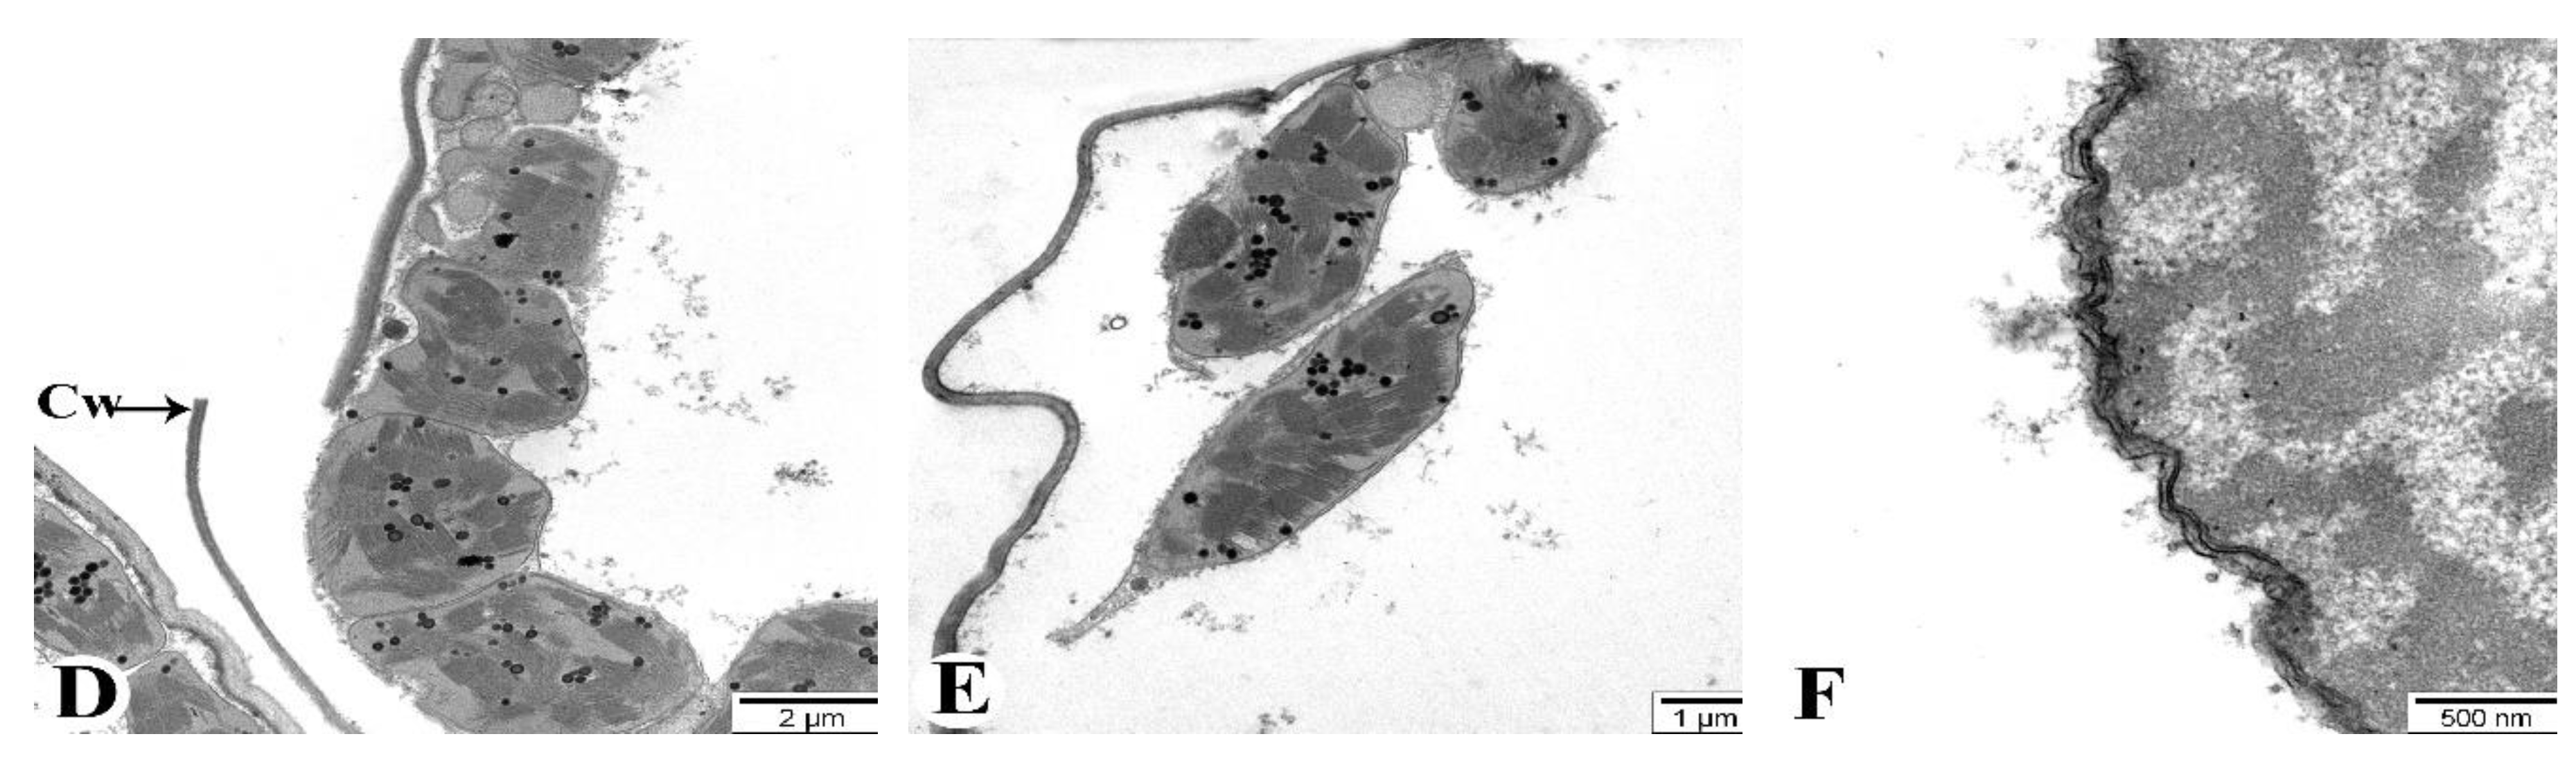
Figure 11.
Transmission electron microscopy (TEM) images of the flag leaves of the Tale 38. A - 7 DAA under normal watering conditions; B, C, D-F - 7, 21, and 35 DAA under drought stress, respectively. Designations: Cw - cell wall, Th - thylakoids, Ld - lipid droplets, M - mitochondria, Ch - chloroplasts, Pl - plastoglobulins. Ultrathin sections (50-70 nm), stained with uranyl acetate and lead citrate.
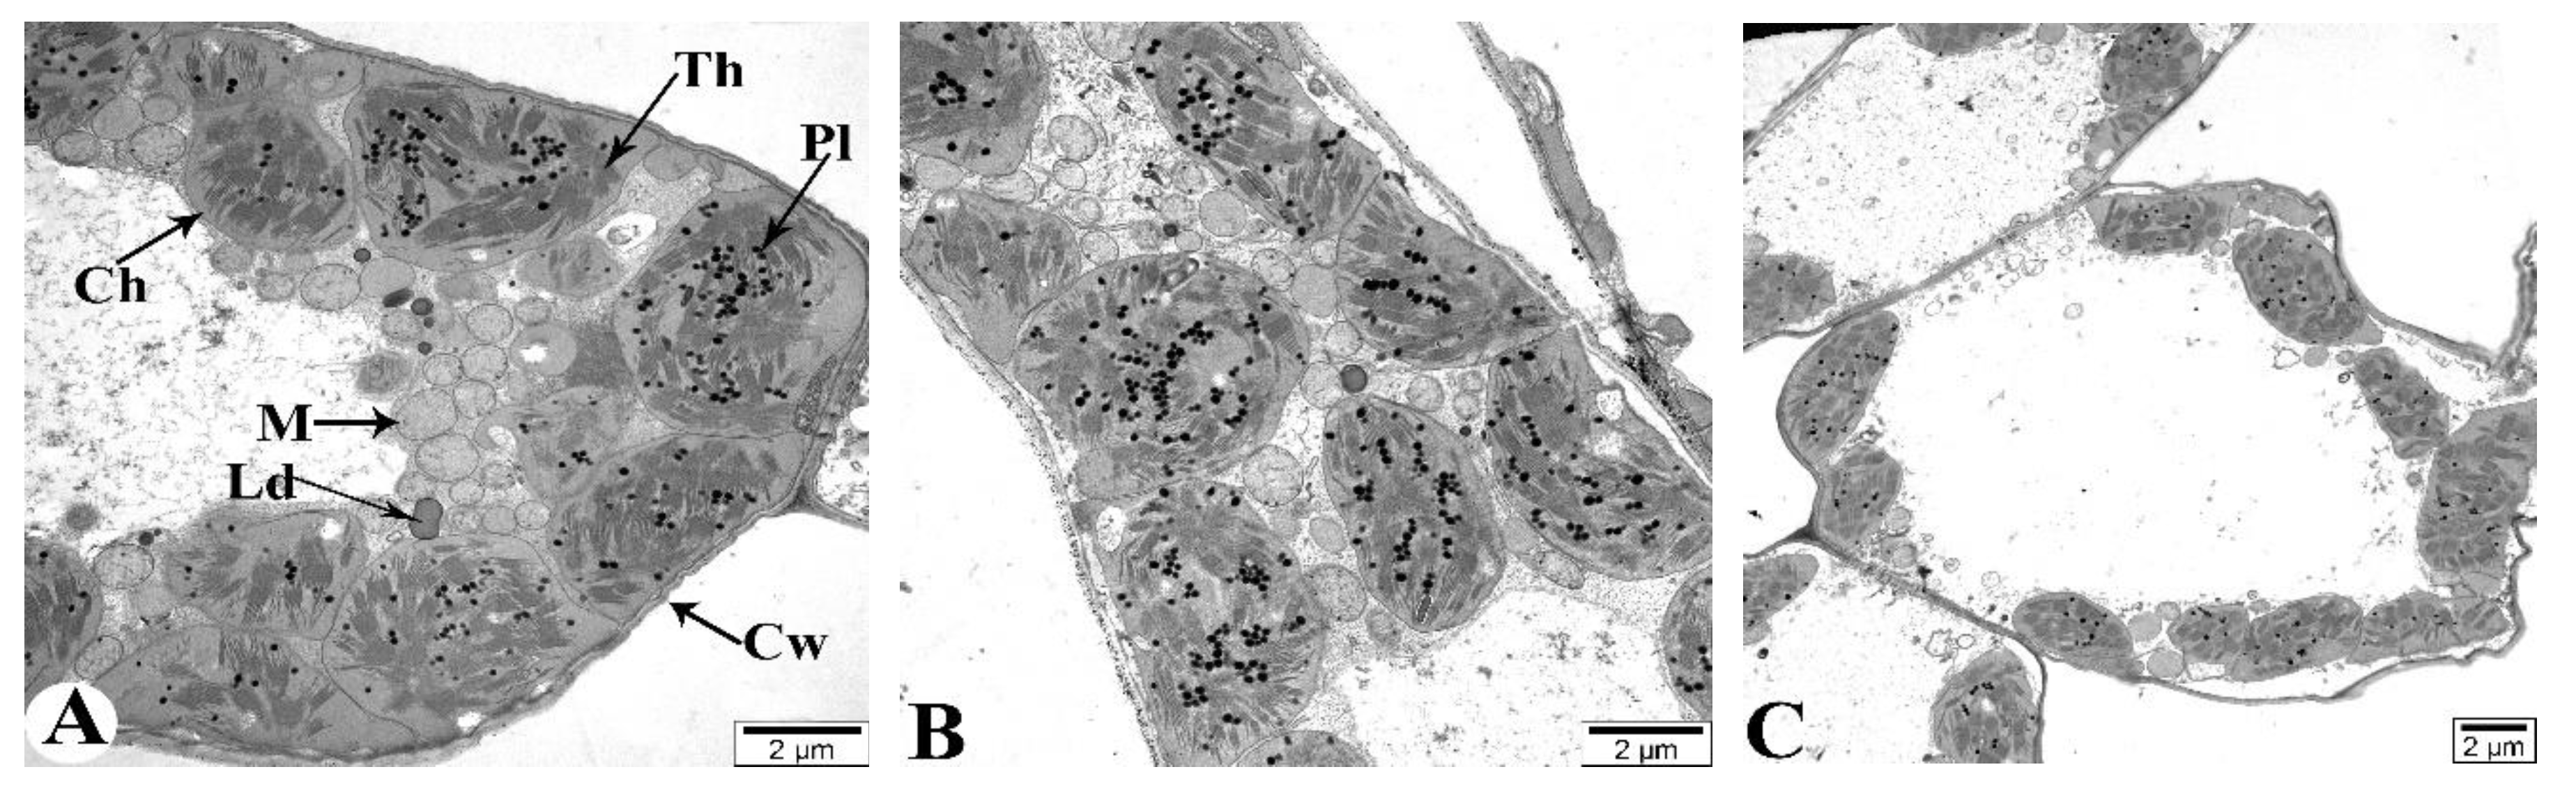
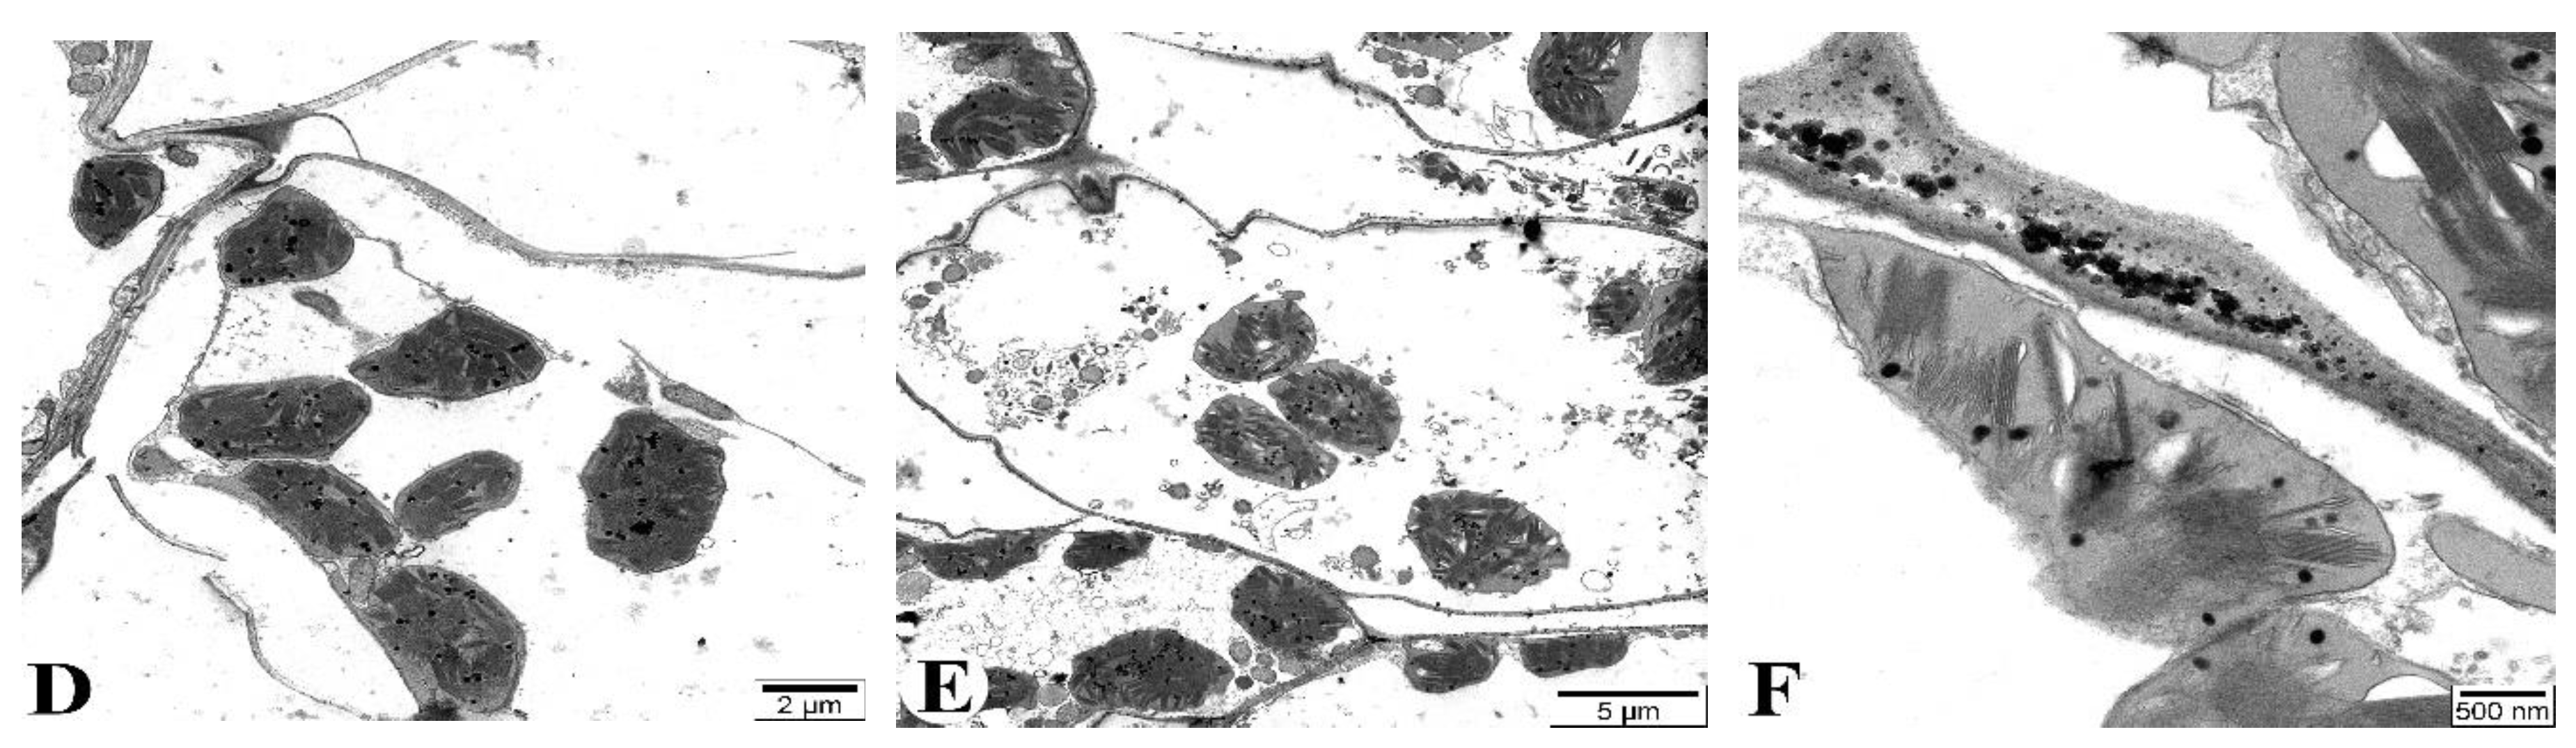

Table 1.
Sequences of primers used for qRT-PCR.
| Gene | Direction | Sequences |
| MnSOD | F | AACATCTGGAAGGTGGTGAACT |
| R | AACTCAAGAGCGAGCGAAGTA | |
| Cu/ZnSOD | F | CTCCATGAGTTCGGTGACAT |
| R | GACGGACTTCATCTTCTGGT | |
| FeSOD | F | GAATTCCACTGGGGAAGCATC |
| R | GTAAGCGTGCTCCCAAACGTC | |
| Elf1-α | F | CAGATTGGCAACGGCTACG |
| R | CGGACAGCAAAACGACCAAG |
Table 2.
Dynamics of changes in photosynthetic pigments during the post-anthesis period.
| Vugar | Tartar | Gyrmyzy gul 1 | Tale 38 | ||||||
| DAA | control | stress | control | stress | control | stress | control | stress | |
| Chlorophyll a (mg/g FW) |
7 | 6,89 | 6,51 | 7,43 | 6,82 | 5,56 | 5,09 | 5,12 | 4,49 |
| 14 | 7,18 | 6,18 | 7,09 | 6,06 | 5,04* | 4,45* | 5,06 | 4,04 | |
| 21 | 6,4* | 4,89* | 6,07* | 3,23** | 4,35* | 3,02* | 4,6 | 2,21** | |
| 28 | 5,8* | 3,5* | 4,8* | 2,2* | 3,5* | 2,5* | 2,9** | 1,7* | |
| 35 | 3,5** | 2,3* | 3,3* | 1,3* | 2,1* | 1,8* | 1,9* | 1,04* | |
| Chlorophyll b (mg/g FW) |
7 | 1,96 | 1,87 | 2,25 | 1,81 | 1,98 | 1,66 | 2,18 | 1,56 |
| 14 | 1,92 | 1,65 | 2,14 | 1,28** | 1,82 | 1,61** | 2,04 | 1,05** | |
| 21 | 1,50** | 1,3** | 2,03 | 0,6** | 1,5** | 0,9** | 1,65** | 0,6** | |
| 28 | 1,20* | 0,7** | 1,6** | 0,4* | 1,2** | 0,7* | 0,9** | 0,5 | |
| 35 | 1,10 | 0,5* | 1,1** | 0,19* | 0,8** | 0,4** | 0,6** | 0,2** | |
Note: DAA – days after anthesis. All tests were conducted in triplicate, and the results are presented as the mean ± standard deviation (s.d.). Significance from a two-way Student's t-test: P < 0.05 (*), P < 0.01 (**), P < 0.001 (***); ns indicates non-significance (P > 0.05).
Disclaimer/Publisher’s Note: The statements, opinions and data contained in all publications are solely those of the individual author(s) and contributor(s) and not of MDPI and/or the editor(s). MDPI and/or the editor(s) disclaim responsibility for any injury to people or property resulting from any ideas, methods, instructions or products referred to in the content. |
© 2024 by the authors. Licensee MDPI, Basel, Switzerland. This article is an open access article distributed under the terms and conditions of the Creative Commons Attribution (CC BY) license (http://creativecommons.org/licenses/by/4.0/).
Copyright: This open access article is published under a Creative Commons CC BY 4.0 license, which permit the free download, distribution, and reuse, provided that the author and preprint are cited in any reuse.


