
Submitted:
28 October 2024
Posted:
29 October 2024
You are already at the latest version
Abstract
Methyl Mercaptan is a sulfur-based chemical found as a co-product in produced natural gas and causes corrosion in pipelines, storage tanks, catalysts, and solid adsorption beds. To improve the quality of methane produced, researchers studied the use of metal oxides and aluminum silicates as catalysts for removing mercaptan. However, there are restricted limitations on the efficiency of metal oxides or aluminum silicates as adsorbents for this particular application. Therefore, this study investigated the performance of these materials in a fixed-bed reactor with simulated natural gas streams under various operating conditions. The testing procedure includes a detailed assessment of the adsorbent/catalysts by several techniques, such as Braeuer-Emmett-Teller (BET), Scanning Electron Microscope (SEM), Energy-Dispersive X-ray Spectrometry (EDS), and X-ray Photoelectron Spectroscopy. The result revealed that metal oxides such as copper, manganese, and zinc performed well in methyl mercaptan elimination. The addition of manganese, copper, and zinc oxides to the aluminum silicate surface resulted in a sulfur capacity of 1226 mg S/g of catalyst. These findings provide critical insights for the development of catalysts that combine metal oxides to increase adsorption while reducing the production of byproducts like dimethyl sulfide (DMS) and dimethyl disulfide (DMDS) during methyl mercaptan removal.
Keywords:
Dimethylsulfide
; Breakthrough
; Pore size
; Adsorption
; Metal-oxides
1. Introduction
Natural gas is widely recognized as a more environmentally friendly fuel compared to other fossil fuels like coal and oil. It boasts the lowest carbon content per unit of mass among fossil fuels, resulting in reduced emissions of key pollutants such as carbon dioxide (CO2), sulfur dioxide (SO2), particulate matter (PM), and nitrogen oxides (NOx) when generating an equivalent amount of energy [1]. The primary components of natural gas include methane (CH4), nitrogen (N2), carbon dioxide (CO2), water (H2O), and sulfur compounds, particularly hydrogen sulfide, dimethyl sulfide, dimethyl disulfide, carbon sulfide, carbonyl sulfide, and mercaptans. However, the composition varies depending on the field, formation, or reservoir from which it is extracted [2].
Methyl mercaptan, also referred to as methanethiol (CH3SH), is a colorless gas with a highly unpleasant odor resembling that of rotten cabbage. It is produced from various sources, including sewage sludge, wastepaper, wood-pulping production, and petroleum-refining processes [3]. This compound pose significant health risks when exposure exceeds the Occupational Safety and Health Administration (OSHA) time-weighted average (TWA) limits [4] impacting the nervous, respiratory, and cardiac systems. Furthermore, it can have detrimental effects, such as corroding pipelines and fuel storage tanks, as well as harming catalysts and solid adsorption beds used in catalytic processes like ethylene oxidation, hydrogenation, and ammonia synthesis [5,6,7]. Additionally, the combustion of methyl mercaptan results in the emission of sulfur dioxide (SO2).
Several methods are available for the removal of acid gases from product gas streams. These technologies are mainly based on absorption, adsorption, catalytic, and thermal oxidation processes to convert acid gases to elemental sulfur (As shown in Figure 1 and Figure 2). However, processes that remove hydrogen sulfide and carbon dioxide from natural gas are usually not effective in removing mercaptans [8,9,10]. The reason is that higher molecular weight sulfur compounds, such as mercaptans, do not ionize (hydrolyze) to form anions that react with caustic, amine, or titanium oxide. [8,10,11,12]. As a result, efforts have been directed towards designing, adapting, verifying, and scaling up more efficient techniques for the removal of mercaptans. These methods include adsorption [13], MEROX [14], chemisorption [15], and photocatalytic oxidation [16].
Among these techniques, adsorption has gained prominence due to its chemical selectivity. Additionally, the adsorption process has proven effective for the thorough removal of methyl mercaptan from natural gas, offering a high desulfurization rate, manageable operating conditions (e.g., ambient temperature and low pressure), and cost-effectiveness. Contemporary research for the purpose of methyl mercaptan removal primarily centers on adsorbents like activated carbon, zeolites, and metal-organic frameworks. Activated carbon is a well-known material characterized by its large surface area of about 1000 m2/g due to its substantial porosity and specific surface chemistry [17]. It is sourced from various materials like coconut shells, wood, waste tea, sludge, coal, peat, and rice husks, providing cost-effective alternatives [17,18,19]. However, pure activated carbon does not perform well in adsorbing sulfur compounds due to its surface properties lacking the necessary chemistry for effective sulfur capture. Zeolites, which are crystalline microporous aluminosilicates, have garnered substantial attention across scientific and industrial domains owing to their exceptional properties and diverse applications.
These materials possess a unique three-dimensional crystal structure formed by interconnected oxygen atoms in [SiO4]4- and [AlO4]5- networks, resulting in a highly porous substance with pore dimensions ranging from 0.3 to 1 nm [20]. Currently, there are more than 190 synthetic zeolite frameworks and over 40 naturally occurring zeolites. There is an increasing demand for natural zeolites in gas separation applications, including Mordenite, Clinoptilolite, Erionite, Phillipsite, and Ferrierite [21]. Metal-organic frameworks (MOFs) represent a class of advanced crystalline materials known for their exceptional properties, making them highly versatile and promising for applications in nanotechnology and biotechnology [22]. These materials feature a hybrid structure that combines metal ions or clusters with organic molecules through covalent bonds, resulting in a unique inorganic-organic framework [23].
Notably, MOFs are characterized by their impressive porosity, with pore diameters typically ranging from 3 to 20 Å, and they exhibit large surface areas that can span from 1000 to 10,000 m2/g. Moreover, the design of MOFs can be tailored by altering the inorganic components or organic linkers, allowing for the creation of materials with specific pore shapes, sizes, and chemical functionalities [24]. However, there is limited exploration of the effectiveness of metal oxides or aluminum silicates as adsorbents for this specific application. The effectiveness of an adsorbent in sulfur removal depends on the adsorbent’s capacity to accommodate the anticipated load of sulfur compounds in the gas stream. This ensures prolonged and efficient operation, reducing the frequency of replacement and contributing to the economic viability of the sulfur removal process [25]. Therefore, this study encompasses a multifaceted approach aimed at advancing the understanding of commercial catalysts' composition and performance, as well as exploring novel catalyst synthesis methods for enhanced methyl mercaptan removal from natural gas. Through rigorous characterization techniques and breakthrough experiments, coupled with the synthesis and evaluation of commercial and new catalysts, this research endeavors to contribute significantly to the optimization of methyl mercaptan removal processes in the natural gas industry.
2. Materials and Methods
The study examined the performance of five different catalysts: Select HP, CTG-ESC-011, Halloysite Pure, Halloysite Mixed, and Halloysite MinO, in the removal of methyl mercaptan. Before the experiments, the catalyst samples were grounded into a fine powder and sieved to a 40 mesh particle size. To replicate natural gas conditions, a gas mixture containing 100 ppm of methyl mercaptan in CH4 was used. Prior to conducting the experiments, the reactor system, shown in Figure 1 was purged with compressed nitrogen source.
2.1. Materials for Synthesis
Zinc acetate dihydrate (97%), Nickel (II) acetate tetrahydrate (99%), Copper(II) nitrate trihydrate (99%), and Magnesium acetate tetrahydrate (98%) were obtained from Thermo Fisher Scientific. Sodium hydroxide and Acetic acid (99.7%) were acquired from Sigma-Aldrich, and 200-proof ethanol was sourced from Decon Labs, Inc.
2.1.1. Catalyst Preparation
3 g of Halloysite Pure were crushed and sieved through a Mesh 40 screen to obtain particles with a size of 0.4 mm. Subsequently, the Halloysite Pure was combined with 120 ml of 99.5% ethanol. This mixture was then homogenized using ultrasonication for a duration of 20-25 minutes, resulting in Solution 1. For the preparation of Solution 2, Zinc acetate dihydrate (zn(CH3COO)2·2H2O), Nickel (II) acetate tetrahydrate (Ni(CH3CO2)2·4H2O), copper(II) nitrate trihydrate (Cu(NO3)2·3H2O), magnesium acetate tetrahydrate (Mg(H₃CCOO)₂·4H₂O), and 3.6 mL of 99.7% acetic acid were dissolved in 240 mL of 99.5% ethanol. The quantities of these metals were adjusted according to their mass percentages (%w/w). This solution was gradually introduced into Solution 1, followed by further ultrasonication. Subsequently, the pH of the resulting mixture was raised to 8 by adding a 1M NaOH solution.
The mixture was then subjected to reflux at 80°C for a duration of 3 hours, leading to the formation of the CuO-ZnO-NiO-MgO-MnO/Halloysite Pure precursor. Any remaining ethanol was removed by filtration, and the sample was air-dried. Finally, the solid sample was recovered and underwent heat treatment at 400 °C for 3 hours. To improve the catalyst preparation, the Sol-Gel method was employed to prepare metal-impregnated Halloysite pure, utilizing four different metals: zinc (Zn), copper (Cu), nickel (Ni), magnesium (Mg). To determine the best performing catalyst loading for the removal of methyl mercaptan in terms of sulfur capacity, a Central Composite Design (CCD) of experiments was utilized. The various factor levels used in the CCD experiments were chosen by prior studies on metal oxide impregnation for mercaptan removal [26,27,28,29,30].
2.1.2. System Calibration
The calibration of methyl mercaptan was carried out with the Agilent 6890 gas chromatography (GC) system manufactured by Agilent technologies. Inc. A standard calibration procedure was implemented by injecting 100 ppm of CH3SH in CH4 into the system. The calibration of methyl mercaptan was carried out by flowing the mercaptan through an empty reactor. A sample was taken 7-10 times using auto-sampling to generate an average calibration curve. These calibration curves establish the correlation between the average area counts and the concentrations of the gas standards. Subsequently, these curves are employed to convert the area counts of the test samples collected during experiments into corresponding concentrations. This calibration process ensures precise quantification of methyl mercaptan levels in the analyzed samples.
2.2. Methods and Procedure
The catalytic activity assessment was conducted within a stainless-steel tube reactor, featuring dimensions of 310 mm in length and an inner diameter of 6.35 mm. In each experimental run, 0.5 g of catalyst was placed into the reactor. After the reactor bed depicted in Figure 1 loaded with catalyst, it was pressurized at 60 psi with a nitrogen gas flowing at a rate of 36 mL/min. Once the operating pressure is reached, the system was leak-checked using Snoop TM and was then left for 30 minutes to determine if there were any small leaks that Snoop TM did not find by measuring the pressure drop on the pressure gauge. This allowed for leak testing along all connections from the gas tank all the way to the downstream mass flow controller. Once the system was determined to be the leak-free, the reactor was wrapped with a heating coil for temperature requirements above ambient temperature. Once the temperature had stabilized and all connections checked and corrected for leaks, the nitrogen was purged from the reactor. Then, the online GC-MS sequence was prepared.
To initiate the methyl mercaptan removal process, the feed was switched from N2 to a gas mixture containing 100 ppm methyl mercaptan in methane. This gas mixture was introduced axially into the packed bed reactor. The GC-MS sequence was immediately started once the flow was stabilized at the correct pressure. The concentration of methyl mercaptan at the reactor outlet was monitored using an Agilent 6890 GC equipped with an auto-sampling valve. The GC system was connected to an Agilent 5975 MS detector, operated at 20.3 PSI and maintained at 180 °C.
The experiment was concluded when the outlet concentration of sulfur reached 5 ppm. Following this, the column was cooled down using N2, and the spent catalyst was removed. The methyl mercaptan removal capacity at the breakthrough time, denoted as q [mg S/g catalyst], was calculated using the following equations (Eq. 1-4) .
A1= t * Ci
A2 = A1 – A
Where Ci stands for the initial concentration of CH3SH measured in ppm/L; Q denotes the volumetric flow rate of the model gas, measured in ml/min; t corresponds to the breakthrough time, measured in minutes; M indicates the mass of the loaded catalyst, measured in mg-catalyst; A1, A2, and A3 correspond to the total area, area above the curve and area under the curve, respectively as shown in Figure 2. Tm corresponds to the total mass of sulfur from time 0 to breakthrough time.
These equations were employed to monitor the sulfur removal as it fluctuated under different conditions of temperature, pressure, and flow rates, as outlined in Table 1.
3. Results and Discussions
3.1. The Analysis of Surface Morphology
3.1.1. Commercial Catalysts
Table 2 displays the results of the Brunauer-Emmett-Teller (BET) analysis conducted to determine the surface area, pore volume, and pore size of the five commercial catalysts. Among these catalysts, CTG-ESC-011 exhibited the highest surface area, measuring at 196.74 m2/g. Following closely behind is Select HP at 88.82 m2/g, and Halloysite MinO with a surface area of 85.5 m2/g. A similar trend was observed in terms of pore volume, where CTG-ESC-011 had the highest value of 0.5 cm3/g, while Select HP and Halloysite MinO displayed similar pore volume values of 0.27 cm3/g. Pore size is a crucial factor for adsorption capacity [31,32]. The molecular size of methyl mercaptan (MM) is known to be approximately 4.37 Å [33]. Pore sizes varied across the commercial catalysts, ranging from 108.42 Å to 163.98 Å, with CTG-ESC-011 featuring the smallest pore size and Halloysite pure showcasing the largest.
The optimal pore size for effective adsorption of methyl mercaptan is suggested to be within a certain range. Literature suggests that an optimal ratio of pore size to pollutant molecular size falls between 1.7 and 3.0 for excellent adsorption performance [34,50]. This means that the pore size should be sufficiently large to allow methyl mercaptan molecules to enter and interact with the catalyst, but not excessively large. Comparing the size of methyl mercaptan molecules with the pore size of these commercial catalysts, the pore sizes are extremely large. The differences in methyl mercaptan removal cannot be attributed only to pore size. Other critical factors contributing to the varying adsorption capacities are the chemical compositions. A detailed analysis of the chemical composition will be further discussed in the next sections with the analysis of EDS, FTIR, and XPS results.
3.1.2. Synthesized Catalysts
Table 3 presents the BET results for Halloysite pure alongside the top 3 catalysts developed in this study. A notable reduction in surface area is evident in these three catalysts when compared to Halloysite pure. Halloysite pure exhibits a BET surface area of 51.18 m2/g, an average pore size of 163.9 Å, and a pore volume of 0.21 cm3/g. However, in the developed catalysts numbered 8, 16, and 22, the BET surface area decreased to 43.26 m2/g, 29.97 m2/g, and 43.02 m2/g, respectively. This decrease can be attributed to the physical blocking effect of the impregnated metal oxides on the surface of Halloysite pure.
3.2. The Analysis of Functional Groups
The catalysts' characteristic bands were identified using FTIR spectroscopy within the wave number range of 4000-400 cm-1. Figure 3 illustrates the FTIR spectra for Select HP. Typically, vibrations associated with metal-oxygen bonds manifest as peaks below 1000 cm-1 [35]. In this spectrum, the peak at 488 cm-1 is attributed to the zinc oxide bond [36], while the bands at 439 cm-1, 516 cm-1, and 556 cm-1 may be linked to Mn-O lattice vibrations [37]. Additionally, the small peak at 590 cm-1 corresponds to the CuO vibrational band [35]. Peaks observed at 3389 cm-1 and 1620 cm-1 indicate the presence of O-H groups originating from adsorbed water [38]. Furthermore, the bands at 1450 cm-1 and 1650 cm-1 are associated with symmetric and asymmetric vibrations of carboxylic groups [39].
In Figure 3, the FTIR spectra of CTG-ESC-011 are displayed. The peak observed at 650 cm-1 corresponds to the stretching of Fe-O bonds [40]. Additionally, the peak at 1150 cm-1 indicates the stretching of metal-hydroxyl bonds, while the presence of the carbonate vibration is attributed to the peak at 1484 cm-1 [41]. It is worth noting that the presence of O-H groups from adsorbed water molecules, which is also observed in the Select HP catalyst, is evident here at 3389 cm-1 and 1620 cm-1 [38]. Figure 4, on the other hand, illustrates the FTIR spectra of the halloysite pure, halloysite MinO, and halloysite mixed catalysts. These halloysite catalysts displayed closely positioned peak positions and intensities, with minor differences. The stretching vibrations associated with aluminum hydroxide (Al-OH) were identified at 3688 cm-1 and 3617 cm-1 [42]. Moreover, the presence of the OH peak from water was evident at 1623 cm-1, as observed previously in the Select HP and CTG-ESC-011 catalysts.
Additionally, a Si-O group stretching peak was observed at 1105 cm-1 in all three halloysite spectra [43]. The stretching vibration associated with Si-O-Si bonds was noted at 1030 cm-1 [43,44], while the vibration corresponding to the inner surface hydroxyl group was observed at 910 cm-1 [43,44,45]. Peaks at 788 cm-1 and 751 cm-1 were attributed to O–H translation vibrations of halloysite O–H units, and those identified at 530 cm-1 and 461 cm-1 represent Si-O and Al-O bonds [43,46]. Additionally, the FTIR spectra of Mn2O3 exhibited a characteristic peak at 524 cm-1, attributed to the vibrations of Mn–O stretching in both halloysite mixed and MinO. Furthermore, a peak at 1545 cm-1 corresponds to the presence of the Mn atom group within the Halloysite MinO catalyst [47].
3.3. The Analysis of Elemental Composition Verification
The chemical composition of the five commercial catalysts used for methyl mercaptan removal was determined through EDS analysis, as summarized in Table 4. Select HP exhibited a significant concentration of Zn, Cu, and Mn, whereas CTG-ESC-011 contained a higher proportion of Fe. As anticipated, the halloysite catalysts, being aluminosilicate minerals, displayed elevated levels of Si and Al. However, the three halloysite catalysts exhibited some distinctions. Halloysite pure had the most fundamental composition, whereas Halloysite MinO was a modified variant of Halloysite Pure, featuring additional Mn and Fe. In contrast, Halloysite Mixed was Halloysite pure that had been further modified with the addition of Mg and Mn. These findings corroborate the FTIR results and provide additional confirmation regarding the nature of the catalysts.
3.4. The Analysis of XPS Measurements
The survey spectra for the Select HP catalyst are presented in Figure 5, revealing the presence of several main surface elements, including Zn, Mn, Cu, Mg, Fe, Al, Cr, Ca, and O. Analysis of the Mn 2p spectra identified two distinct peaks at 642.4 eV and 655.9 eV, corresponding to MnO2 [48,49] The presence of a Mg-O bond in MgO is indicated by the Mg 2p peak at approximately 49.9 eV. Within the Al 2p region, the binding energies observed at 75.5 eV for Al 2p and 119.5 eV for Al 2s confirm the presence of Al-O bonds, indicating the presence of Al2O3. The binding energies of the Fe 2p1/2 and Fe 3s peaks, positioned at 720.1 eV and 91.3 eV, respectively, are consistent with values reported in the literature for Fe2O3 [51]. The Ca 2p3/2 peak at 348.6 eV confirms the presence of the Ca-O bond. In the O 1s region, a peak at 532.8 eV indicates the presence of hydroxyl surface groups [52] The Cr 2p3/2 peak is observed at 573.4 eV. Cu peaks were observed between 935.2 eV and 954.1 eV [53], while the peaks at 1022.9 eV and 1046.2 eV corresponded to Zn 2p3/2 and Zn 2p1/2, respectively, closely approaching the binding energy of ZnO (1021.6 eV-1022 eV) [54].
Figure 5 displays the survey spectra for the CTG-ESC-011 catalyst, revealing distinct peaks at 57 eV, 350.9 eV, 532.1 eV, 712.6 eV, and 726.3 eV. These peaks correspond to the binding energies of Fe 3p, Ca 2p1/2, O 1s, Fe2p3/2, and Fe 2p1/2, respectively. The presence of a characteristic broad shake-up satellite (identified as feature F1 in Figure 4) at 720 eV is a known characteristic of Fe2O3 [51]. The peak observed at 350.9 eV in the Ca 2p1/2 region confirms the existence of Ca-O bonds. Furthermore, the O1s spectrum exhibits a peak at 532.1 eV, corresponding to the O-H bond present in H2O.
XPS survey spectra for the three types of halloysites are depicted in Figure 6. These halloysite samples displayed characteristic peaks associated with aluminum silicates. The presence of Al-O bonds is indicated by the peak at 75.3 eV corresponding to Al 2p1/2, and the Al-O bond is further identified by the peak at 120 eV attributed to Al 2s [55,56]. The confirmation of Al-O-Si bonds is provided by the Si 2p1/2 peak at 103.4 eV [57]. Additionally, the presence of Si 2s is evident at 154.4 eV [58]. The O 1s spectrum exhibits a characteristic peak at 534.8 eV, signifying O-H bonds from water. Moreover, the Mn 2p3/2 and Mn 2p1/2 peaks, positioned at 643.6 eV and 656.4 eV, respectively, confirm the Mn2+ oxidation state, providing confirmation of the presence of manganese in the Halloysite MinO catalyst [60]
3.5. The Breakthrough Analysis – Commercial Catalysts
The efficiency of methyl mercaptan removal was investigated using various catalysts: Select HP, CTG-ESC-011, Halloysite Pure, Halloysite MinO, and Halloysite Mixed. The experimental parameters were selected based on the typical operating conditions for natural gas processing from the literature [17,59,61,62,63,64], encompassing a broad spectrum of absolute pressures ranging from 100 to 200 PSI. To simulate these conditions, an initial concentration of 100 ppm CH3SH in CH4 was employed. These experiments also encompassed diverse flow rates, ranging from 36 to 60 ml/min, and were conducted at temperatures spanning from 25°C to 75°C. The results obtained from the breakthrough experiments are summarized in Table 5, and the breakthrough curves for the removal of methyl mercaptan over time for each of the five catalysts are presented in Figure 7, Figure 8, Figure 9, Figure 10 and Figure 11. In Table 5, the breakthrough time (in minutes) represents the duration it took for the outlet concentration of methyl mercaptan and its byproducts to reach 5 ppm.
3.5.1. The Select HP
The methyl mercaptan breakthrough curves for the Select HP catalyst are depicted in Figure 7. Among the runs conducted, the longest breakthrough time occurred at 75°C, 200 PSI, and 36 ml/min, with a duration of 318 minutes. This was followed by the run at 75°C, 100 PSI, and 36 ml/min, which had a breakthrough time of 178 minutes. Higher temperatures provide more energy to the reaction, potentially enhancing its performance via chemisorption and reaction, a phenomenon supported by previous research [65,66,67] Conversely, the shortest breakthrough times were observed in runs conducted with an operational condition of 60 ml/min. The quickest breakthrough occurred at 25°C, 200 PSI, and 60 ml/min, with a breakthrough time of 65 minutes. This difference in time is attributed to the varying residence times for the reaction with the catalyst. Select HP, distinguished by its composition of mixed metal oxides, plays a pivotal role in this context. A noteworthy advantage linked to mixed metal oxides is the efficient dispersion of active sites within the catalyst. This high level of dispersion is critical, as it significantly enhances the interaction of active sites with sulfur compounds [68]
3.5.2. The CTG-ESC-011
The results derived from the catalyst performance are illustrated in Figure 8. These results unveiled intriguing insights into the impact of various parameters on the breakthrough time for methyl mercaptan removal. Among the tested parameter combinations, the most effective one was identified at 25°C, 100 PSI, with a flow rate of 36 ml/min, achieving a breakthrough time of 45 minutes. Subsequently, the next best-performing condition was observed at 25°C, 100 PSI, with a flow rate of 60 ml/min, resulting in a breakthrough time of 20 minutes.
The disparities between the experimental outcomes and the literature could be attributed to the chemical composition of the catalysts. Specifically, CTG-ESC-011 consists mainly of Fe2O3 without a mixture of other metal oxides. It is widely recognized that mixed oxides typically exhibit higher activity than single oxides in most catalytic reactions [69]. This could possibly explain why Select HP, which is a blend of metal oxides, demonstrated superior performance over this catalyst.
3.5.3. The Halloysites
Halloysite pure consistently demonstrated the poorest breakthrough results among all the catalysts. The breakthrough times exhibited almost no variations under different conditions. Specifically, at conditions of 25°C, 200 PSI, and 36 ml/min, 25°C, 200 PSI, and 60 ml/min, and 75°C, 200 PSI, and 36 ml/min, the breakthrough time was virtually instantaneous (less than 1 minute). The longest breakthrough time was observed at 75°C, 100 PSI, and 36 ml/min, with a time of 1.3 minutes. In general, higher temperatures resulted in lower concentrations of methyl mercaptan in the effluent gas, as depicted in Figure 9. This suggests that temperature has a significant influence on the removal efficiency. However, the effects of pressure and flow rate on breakthrough times were not as pronounced as temperature. For Halloysite pure, its poor performance can be attributed to the absence of active metals or compounds that are effective at catalyzing the reaction.
Halloysite MinO, as depicted in Figure 10, also exhibited relatively low efficiency in methyl mercaptan removal across various conditions, with the longest breakthrough time recorded at just 23 minutes under the conditions of 75°C, 200 PSI, and 36 ml/min.
Halloysite Mixed, as illustrated in Figure 11, demonstrated superior breakthrough times compared to the other two Halloysite catalysts under specific conditions, notably achieving an 94 minute breakthrough time at 75°C, 100 PSI, and 36 ml/min. However, its performance was notably lacking in other conditions, such as 25°C, 100 PSI, and 36 ml/min, where it exhibited zero efficiency. Halloysite catalysts primarily consist of aluminum, silicon, and oxygen. While these elements can potentially contribute to catalytic activity, they may not possess the ideal combination of active metallic species or promoters required for efficient methyl mercaptan removal.
In terms of effective removal performance based on breakthrough times, the order from highest to lowest is as follows: Select HP > Halloysite Mixed > CTG-ESC-011 > Halloysite MinO > Halloysite Pure. Their respective sulfur capacities at the optimal conditions for each catalyst are illustrated in Figure 12.
The catalyst composition sheds light on why specific catalysts excelled under particular conditions. Select HP, with its composition of Zn, Cu, and Mn oxides, emerges as the top choice for methyl mercaptan removal due to its outstanding performance. Studies have indicated that the inclusion of Cu, Zn, Mn, and Ni oxides alongside an alumina base can enhance the removal of sulfur compounds [71,72,73]. Furthermore, mixed metal oxides exhibit superior dispersion of active sites and robust metal interactions [74]. These factors may also account for the subpar performance of Halloysites, given their limited active sites.
3.6. The Breakthrough Analysis– Novel Catalysts
The sulfur adsorption capacity results of the novel catalysts impregnated with various metals (Cu, Zn, Ni, Mg, and Mn) were measured according to design matrix and the responses are listed in Table 6. The catalysts underwent testing at specific conditions, namely 25°C, 200 PSI, 36 ml/min, with an initial methyl mercaptan concentration of 200 ppm. Response Surface Methodology (RSM) using Central Composite Design (CCD) was applied to determine the optimal combination of these metals in the catalyst. Furthermore, an analysis of variance (ANOVA) was employed to identify the significant metals involved in the removal process, and the subsequent results are thoroughly examined and discussed.
The importance of Cu, Zn, Ni, and Mg oxides in the context of methyl mercaptan removal, as measured by sulfur capacity, was determined through ANOVA. To visually represent the influence of copper composition, refer to Figure 13 (a-b) and Figure 14. In the case of copper, a quadratic model was constructed, suggesting that an optimal concentration of 40% Cu is required to maximize sulfur capacity. The parabolic shape indicates that the right amount of Cu can provide an adequate number of active sites. However, excessive Cu loading may lead to the precipitation of CuO active components, which can result in the overlapping of active sites on the catalyst surface [73,85] The incorporation of copper into Halloysite pure significantly improved the performance of methyl mercaptan removal, with the most successful developed catalysts featuring higher Cu concentrations. However, magnesium exhibited a negative significance (Figure 13 b), suggesting that an increase in magnesium concentration led to a reduction in sulfur capacity. Magnesium might compete with copper and other adsorption sites on the catalyst surface. When the magnesium concentration is high, it could occupy the active sites that would otherwise be used for methyl mercaptan adsorption. This competition for adsorption sites can result in decreased sulfur capacity.
The interaction between copper and magnesium is visualized in the response surface graphs depicting sulfur capacity in methyl mercaptan removal (Figure 14). It is clear from Figure 14 that when the magnesium concentration is at 0%, the sulfur capacity increases as copper concentrations rise (up to 40%).
3.7. The Performance Summary
3.7.1. The Impact of Metal Composition on the Breakthrough Performance
The Select HP exhibited the highest performance in methyl mercaptan removal, containing 18.9% Zn, 17.6% Cu, and 19.5% Mn. To replicate these proportions and explore the impact of manganese (Mn) on catalytic efficiency for methyl mercaptan removal, these elements were impregnated onto Halloysite pure's surface. The catalyst with a composition of 33% Cu, 33% Zn, and 33% Mn (UL-Best catalyst) demonstrated a sulfur capacity of 1226 mgS per gram of catalyst, along with a breakthrough time of 131minutes. In contrast, the Select HP catalyst only achieved a 42 minutes breakthrough time under identical conditions (as depicted in Figure 15). This improvement, in comparison to the other developed catalysts, can be attributed to the presence of Mn, which enhances the dispersion and activity of Cu on Halloysite pure's surface [73].
3.7.2. The Impact of Temperature on the Breakthrough Performance
Breakthrough experiments were conducted to investigate the influence of temperature on methyl mercaptan removal using the UL-Best catalyst (33% Cu, 33% Zn, and 33% Mn) at various temperatures, including ambient, 40°C, 60°C, 75°C, and 100°C, as shown in Figure 16. The breakthrough curves demonstrated a consistent trend: as the temperature increased, the breakthrough times decreased. For instance, at ambient temperature, the breakthrough time was achieved at 131 minutes while at 100°C was achieved at 16 minutes. A study conducted by [79] using MnO2 for methyl mercaptan removal, indicated that increasing temperature led to a higher rate of methyl mercaptan decomposition into dimethyl disulfide (DMDS), which aligns with our observations of increased sulfur concentration in the breakthrough experiments as the temperature increases . A similar trend was noted in a study by [74] which used MOF-199 (a copper-based metal-organic framework) to remove methyl and ethyl mercaptan removal.
Figure 16 compares the breakthrough times for methyl mercaptan removal using both Select HP and UL-Best catalyst at different temperatures. At 25°C, the Select HP catalyst has a breakthrough time of 42 minutes, which significantly increases to 112 minutes when the temperature is raised to 75°C. UL-Best catalyst was tested at 25°C, 40°C, 60°C, 75°C, and 100°C. It exhibits breakthrough times (131 minutes, 23 minutes, 7 minutes, 32 minutes, and 16 minutes, respectively). As mentioned before, this may be attributed to higher temperatures accelerating methyl mercaptan decomposition into DMDS, which poisons the catalyst surface at elevated temperatures. It is clear that UL-Best catalyst is better at 25°C, but its performance reduces as the temperature increases. This difference in temperature behavior may be attributed to the nature of Select HP. Select HP is composed of a mix of metal oxides, containing 18.9% Zn, 17.6% Cu, and 19.5% Mn. Higher temperatures provide additional energy to the reaction, potentially enhancing its performance, this result aligns with prior research findings [65,66,67] related to H2S removal, supporting the idea that increased temperature can positively impact the catalyst's effectiveness.
The situation differs when testing Select HP for ethyl mercaptan removal. In a parallel study, Select HP was evaluated at temperatures of 25°C, 100°C, and 150°C for ethyl mercaptan breakthrough experiments. The results indicate a reduction in removal efficiency with increasing temperature, with the best performance observed at 25°C. This behavior may be also linked to the formation of disulfides. A study by [75] confirmed the conversion of ethyl mercaptan to diethyl disulfide at 150 °C. Our results align with this observation, disulfide was present at 150 °C experiment but not at ambient temperature. This could explain why Select HP performs better at ambient temperatures, as the absence of disulfides prevents the catalysts from being poisoned.
3.7.3. General Comparison
Table 7 compares the sulfur removal capacities of two catalysts, UL-Best catalyst and Select HP, with various adsorbents found in the literature for removing methyl mercaptan. Traditional zeolites, specifically NaX, 5A, and CaX, exhibited sulfur capacities of 182.8 mgS/gcat, 186.3 mgS/gcat, and 140 mgS/gcat, respectively. Furthermore, a study by [76] demonstrated that the introduction of nitrogen into raw activated carbon significantly enhanced methyl mercaptan removal. This nitrogen-enriched activated carbon achieved a substantial sulfur removal capacity of 602.1 mgS/gcat. The Table also includes data on methyl mercaptan removal using metal-organic frameworks, with MIL-53(Al) showing a sulfur capacity of 433 mgS/gcat. Notably, the 33Mn-33Cu-33Zn adsorbent exhibited an impressive sulfur capacity of 1226 mg S/g, suggesting promising prospects for further industrial applications. There is potential for even higher performance through additional research and development.
The statistical analysis pinpointed copper and magnesium as significant contributors to methyl mercaptan removal. Nevertheless, the catalyst impregnated with manganese, copper, and Zinc exhibited the highest removal efficiency among all the tested catalysts. The incorporation of manganese, copper, and zinc oxides onto the aluminum silicate surface resulted in a sulfur capacity of 1226 mg S/g catalyst under conditions of 25°C, 200 psi, 36 ml/min, and 200 ppm methyl mercaptan. This makes it the most effective catalyst among all the developed catalysts. In contrast, Select HP's sulfur capacity under the same conditions was only 389.11 mg S/g catalyst. Also, it was tested at various temperatures, including ambient, 40°C, 60°C, 75°C, and 100°C to see the effect of temperature on methyl mercaptan removal.
Figure 17 displays SEM/EDS images of Select HP before and after the breakthrough experiments. The surface structure of the Select HP catalyst appears to have maintained its integrity following exposure to methyl mercaptan. This suggests that the catalyst remains stable and doesn't undergo degradation under the specified conditions at 75°C. This stability is attributed to the fact that methyl mercaptan primarily interacts with the catalyst's active sites. Furthermore, EDS analysis (Figure 17 d) reveals a low sulfur peak, indicating the presence of sulfur compounds on the catalyst's surface, albeit in relatively small quantities. These findings suggest the adsorption of methyl mercaptan onto the Select HP surfaces or the accumulation of other sulfur species on the surface [77] proposed that the presence of sulfur on the catalyst's surface is associated with the accumulation of sulfur components, which can lead to catalyst deactivation [77]
XPS analysis unveiled the Zn 2p spectra of the Select HP catalyst before methyl mercaptan removal, displaying peaks at 1022.9 eV and 1046.2 eV, corresponding to Zn 2p3/2 and Zn 2p1/2, respectively. However, a notable shift in the binding energy of Zn 2p was observed in Figure 17b after methyl mercaptan removal. This shift indicates a surface alteration of the catalyst in the presence of methyl mercaptan, suggesting a chemical reaction occurred [78]
A similar phenomenon was observed for Cu and Mn, as depicted in Figure 18a and Figure 18c, respectively. The XPS Spectrum of S 2p in Figure 18d illustrates Select HP before and exhausted for methyl mercaptan removal. The spectrum of Select HP before removal does not display any sulfur-related peaks. Conversely, peaks at 163.9 eV and 168.9 eV emerged in the spectrum after removal, attributed to C-SH and methyl thiolate, respectively [79,80]. The presence of methyl thiolate on the catalyst surface during the removal of methyl mercaptan is an indicator of the chemical reactions that occur during the removal process. Somes studies reported that methyl thiolate can be form as an intermediate in the formation of disulfides in the catalyst surface [76]
The FT-IR results are illustrated in Figure 19 with significant alterations observed in the wave number range of 3000-2800 cm-1 following exposure to methyl mercaptan. The OH stretching vibration at 3450 cm-1, observed in both raw and spent catalyst, exhibited a decrease in absorption band strength. This reduction indicates the consumption of some hydroxyl groups as part of the reaction involving the removal of methyl mercaptan [82]. Furthermore, peaks at 1462 cm-1 and 1380 cm-1 can be attributed the -CH3 groups, indicating that the adsorbed substances on the catalyst surface contain -CH3 groups (Such as methyl thiolate or methyl mercaptan) [73,81]. Also the adsorption of methyl mercaptan is further confirmed by peaks at 1050 cm−1, resulting from the stretching vibration of Carbon sulfur bond (C–S), this implies that methyl mercaptan is attached to the catalyst, and a peak at 2352 cm-1 indicating the presence of S-H bonds [73,84]
Furthermore, two small peaks at 2921 cm-1 and 2818 cm-1 were found, indicating the presence of the methyl group of DMDS on the catalyst surface [85]. These observations are consistent with the detection of this sulfide compound in the effluent, as illustrated in Figure 20.
Therefore, it can be reasonably speculated that CH3SH is adsorbed onto the surface of Select HP, followed by decomposition by the active sites (Cu, Mn, and Zn) present in Select HP, leading to the formation of CH3SSCH3 and CH3SCH3. Subsequently, these byproducts are desorbed from the catalyst surface. This observation aligns with prior research indicating the transformation of methyl mercaptan to dimethyl disulfide and dimethyl sulfide by metal oxides [86,87] .The surface of Select HP contains many OH- and M-O bonds from (Mn, Cu, and Zn), which were the active centers for the catalytic transformation of methyl mercaptan to sulfides. Under the action of surface hydroxyl and metal oxide active sites, CH3SH is adsorbed on the surface of Select HP, and then decomposed by active sites on the Select HP surface to form Dimethyl sulfide (DMS) and Dimethyl disulfide (DMDS). The accumulation of these sulfide compounds on the catalyst's surface may contribute to its deactivation, as they tend to cover the dispersed active sites on the surface [73,82] Furthermore, [82] reported CH3SO3H as an intermediate product of the oxidation reaction, leading to catalyst deactivation, while [77,88] observed the formation of sulfate as shown in Figure 21.[13] even suggested the production of sulfonic acid. However, it is essential to note that these byproducts were not observed in our study.
4. Conclusions
1. The results of the BET analysis reveal distinctive characteristics among the commercial catalysts, emphasizing the significance of surface area, pore volume, and pore size in their adsorption capacities. CTG-ESC-011 stands out with the highest surface area at 196.74 m2/g. In contrast, Select HP and Halloysite MinO follow closely, with surface areas of 88.82 m2/g and 85.5 m2/g, respectively. Select
2. Pore size, a critical factor influencing adsorption capacity, varies across the catalysts, ranging from 108.42 Å to 163.98 Å. Notably, CTG-ESC-011 has the smallest pore size, while Halloysite Pure features the largest. Considering the molecular size of methyl mercaptan (MM) at approximately 4.37 Å, the observed pore sizes in these catalysts appear excessively large. It becomes evident that differences in methyl mercaptan removal cannot be only attributed to pore size. Other critical factors, particularly the chemical compositions of the catalysts, play a significant role in influencing varying adsorption capacities.
3. HP and CTG-ESC-011 catalysts are predominantly composed of metal oxides. Select HP contains Zn, Mn, and Cu oxides, while CTG-ESC-011 is primarily made up of Fe oxide.
4. The breakthrough experiments provided a clear performance hierarchy of the commercial catalysts, with Select HP demonstrating the highest performance, followed by CTG-ESC-011, Halloysite Mixed, Halloysite MinO, and Halloysite Pure. The outstanding performance of Select HP can be attributed to its chemical composition, primarily consisting of Cu, Mn, and Zn oxides, which significantly enhance its catalytic activity and methyl mercaptan.
5. Cu exhibited a quadratic relationship, suggesting that an optimal concentration of 40% Cu maximizes sulfur capacity, while higher Mg concentrations were associated with decreased sulfur capacity.
6. UL Best catalyst demonstrated the most effective performance in methyl mercaptan removal, achieving a sulfur capacity of 1226 mg S/g catalyst under conditions of 200 psi, 25°C, 36 ml/min, and 200 ppm CH3SH. In contrast, when tested under the same conditions, Select HP displayed a lower sulfur capacity of only 389.11 mg S/g catalyst.
7. Breakthrough experiments were carried out to investigate the influence of temperature on methyl mercaptan removal using the UL-Best catalyst (comprising 33% Cu, 33% Zn, and 33% Mn). The results consistently showed that as the temperature increased, the breakthrough times decreased. For instance, at room temperature, a breakthrough occurred at 131 minutes, whereas at 100°C, it happened within 16 minutes.
8. A comparison between the Select HP catalyst and the UL-Best catalyst at different temperatures revealed that the UL-Best catalyst consistently exhibited shorter breakthrough times at higher temperatures compared to Select HP. In contrast, Select HP demonstrated an inverse relationship with temperature, where increasing the temperature led to longer breakthrough times. It is worth noting that at 25°C, the UL-Best catalyst remained superior, with a breakthrough time of 131 minutes and a sulfur capacity of 1226 mg S/g catalyst.
Author Contributions
Conceptualization, Z.-Y.W.; methodology, S.-W.Y. and Z.-H.L.; formal analysis, S.-W.Y. and M.-X.L.; data curation, Y.Z. and W.-X.Y.; writing-original draft preparation, S.-W.Y.; writing-review and editing, S.-W.Y., J.-Y.X. and Z.-Y.W.; project administration, Z.-Y.W.; funding acquisition, Z.-Y.W. All authors have read and agreed to the published version of the manuscript.
Funding
This research was supported by the Guangdong Basic and Applied Basic Research Foundation (no. 2021A1515012342).
Acknowledgments
The authors acknowledge the financial support of the U.S. – Israel Fossil Energy Center (FEC19) administered by the BIRD Foundation and funded by the Israeli Energy Ministry and the U.S. Department of Energy for this work.
References
- Tim Gould, C. M. (2017). The environmental case for natural gas. International energy agency. https://www.iea.org/commentaries/the-environmental-case-for-natural-gas.
- Ratnasamy, C., Wagner, J. P., Spivey, S., & Weston, E. (2012). Removal of sulfur compounds from natural gas for fuel cell applications using a sequential bed system. Catalysis Today, 198(1), 233-238. [CrossRef]
- Tomei Torres, F. (2014). Addendum to the Toxicological Profile for Methyl Mercaptan. [CrossRef]
- Deshmukh, S., Jana, A., Bhattacharyya, N., Bandyopadhyay, R., & Pandey, R. A. (2014). Quantitative determination of pulp and paper industry emissions and associated odor intensity in methyl mercaptan equivalent using electronic nose. Atmospheric Environment, 82, 401-409. [CrossRef]
- Argyle, M. D., & Bartholomew, C. H. (2015). Heterogeneous Catalyst Deactivation and Regeneration: A Review. Catalysts, 5(1), 145-269.
- Luttrell, W. E., & Bobo, M. E. (2015). Methyl mercaptan. Journal of Chemical Health & Safety, 22(5), 37-39. [CrossRef]
- Yuan, Y., Gao, X., Zhou, J., Liu, G., Kuang, X., Yang, L., & Liao, R. (2022). A review: Research on corrosive sulphur in electrical power equipment. High Voltage, 7(2), 209-221. [CrossRef]
- Mahdipoor, H. R., & Dehghani Ashkezari, A. (2016). Feasibility study of a sulfur recovery unit containing mercaptans in lean acid gas feed. Journal of Natural Gas Science and Engineering, 31, 585-588. [CrossRef]
- Mokhatab, S., Poe, W. A., & Mak, J. Y. (2018). Handbook of natural gas transmission and processing: principles and practices. Gulf professional publishing.
- Tohidi, Z., Fatemi, S., & Qazvini, O. T. (2015). Mercaptan removal from natural gas by the efficient cyclic adsorption process; a simulation study. Journal of Natural Gas Science and Engineering, 26, 758-769.
- Gupta, A. K., Ibrahim, S., & Al Shoaibi, A. (2016). Advances in sulfur chemistry for treatment of acid gases. Progress in Energy and Combustion Science, 54, 65-92. [CrossRef]
- Ross, R. A., & Sood, S. P. (1977). Catalytic Oxidation of Methyl Mercaptan over Cobalt Molybdate. Product R&D, 16(2), 147-150. [CrossRef]
- Bashkova, S., Bagreev, A., & Bandosz, T. J. (2002). Adsorption of Methyl Mercaptan on Activated Carbons. Environmental Science & Technology, 36(12), 2777-2782. [CrossRef]
- Huguet, E., Coq, B., Durand, R., Leroi, C., Cadours, R., & Hulea, V. (2013). A highly efficient process for transforming methyl mercaptan into hydrocarbons and H2S on solid acid catalysts. Applied Catalysis B: Environmental, 134-135, 344-348. [CrossRef]
- Laosiripojana, N., & Assabumrungrat, S. (2011). Conversion of poisonous methanethiol to hydrogen-rich gas by chemisorption/reforming over nano-scale CeO2: The use of CeO2 as catalyst coating material. Applied Catalysis B: Environmental, 102(1), 267-275. [CrossRef]
- Cai, W., Lu, G., He, J., & Lan, Y. (2012). The adsorption feature and photocatalytic oxidation activity of K1−2xMxTiNbO5 (M=Mn, Ni) for methyl mercaptan in methane. Ceramics International, 38(4), 3167-3174. [CrossRef]
- Georgiadis, A. G., Charisiou, N. D., & Goula, M. A. (2020). Removal of Hydrogen Sulfide From Various Industrial Gases: A Review of The Most Promising Adsorbing Materials. Catalysts, 10(5).
- Thomas, B., & George, S. (2015). Production of Activated Carbon from Natural Sources. Trends in Green Chemistry, 1. [CrossRef]
- Xiao, Y., Wang, S., Wu, D., & Yuan, Q. (2008). Catalytic oxidation of hydrogen sulfide over unmodified and impregnated activated carbon. Separation and Purification Technology, 59(3), 326-332. [CrossRef]
- Bakshi H. V. (Jun, 2017). A Study on Synthesis of Synthetic Zeolites. Journal of Advances in Science and Technology, 14(1), 3. [CrossRef]
- Ozekmekci, M., Salkic, G., & Fellah, M. F. (2015). Use of zeolites for the removal of H2S: A mini-review. Fuel Processing Technology, 139, 49-60. [CrossRef]
- Vodyashkin, A. A., Sergorodceva, A. V., Kezimana, P., & Stanishevskiy, Y. M. (2023). Metal-Organic Framework (MOF)—A Universal Material for Biomedicine. International Journal of Molecular Sciences, 24(9).
- Yusuf, V. F., Malek, N. I., & Kailasa, S. K. (2022). Review on Metal–Organic Framework Classification, Synthetic Approaches, and Influencing Factors: Applications in Energy, Drug Delivery, and Wastewater Treatment. ACS Omega, 7(49), 44507-44531. [CrossRef]
- Jiao, L., Seow, J. Y. R., Skinner, W. S., Wang, Z. U., & Jiang, H.-L. (2019). Metal–organic frameworks: Structures and functional applications. Materials Today, 27, 43-68. [CrossRef]
- Gas, P.-Q. N. (2006). Natural gas processing: the crucial link between natural gas production and its transportation to market. Los Alamos, 20.
- He, H., Hu, L., Zeng, J., Huang, Y., He, C., Zhang, Q., Zhang, F., & Shu, D. (2020). Activation of persulfate by CuO-sludge-derived carbon dispersed on silicon carbide foams for odorous methyl mercaptan elimination: identification of reactive oxygen species. Environmental Science and Pollution Research, 27, 1224-1233.
- Saqer, S. M., Kondarides, D. I., & Verykios, X. E. (2011). Catalytic oxidation of toluene over binary mixtures of copper, manganese and cerium oxides supported on γ-Al2O3. Applied Catalysis B: Environmental, 103(3-4), 275-286.
- Su, H., Liu, J., Hu, Y., Ai, T., Gong, C., Lu, J., & Luo, Y. (2023). Comparative Study of α-and β-MnO2 on Methyl Mercaptan Decomposition: The Role of Oxygen Vacancies. Nanomaterials, 13(4), 775.
- Wen, Y., Zhao, S., Yi, H., Gao, F., Yu, Q., Liu, J., Tang, T., & Tang, X. (2022). Efficient catalytic oxidation of methyl mercaptan to sulfur dioxide with NiCuFe mixed metal oxides. Environmental Technology & Innovation, 26, 102252. [CrossRef]
- Yi, H., Tao, T., Zhao, S., Yu, Q., Gao, F., Zhou, Y., & Tang, X. (2020). Promoted adsorption of methyl mercaptan by γ -Al2O3 catalyst loaded with Cu/Mn. Environmental Technology & Innovation, 21, 101349. [CrossRef]
- Liu, W., Zhang, Y., Wang, S., Bai, L., Deng, Y., & Tao, J. (2021). Effect of Pore Size Distribution and Amination on Adsorption Capacities of Polymeric Adsorbents. Molecules, 26(17), 5267. https://www.mdpi.com/1420-3049/26/17/5267.
- Zhang, Y., Li, K., Sun, X., Song, X., Wang, F., Wang, C., Ning, P., & He, H. (2021). The role of H2O in the removal of methane mercaptan (CH3SH) on Cu/C-PAN catalyst. Applied Surface Science, 567, 150851. [CrossRef]
- Bashkova, S., Bagreev, A., & Bandosz, T. J. (2005). Catalytic properties of activated carbon surface in the process of adsorption/oxidation of methyl mercaptan. Catalysis Today, 99(3), 323-328. [CrossRef]
- Ma, X., Peng, S., Li, W., Liu, H., & Chen, Y. (2018). Efficient removal of low concentration methyl mercaptan by HKUST-1 membrane constructed on porous alumina granules. CrystEngComm, 20. [CrossRef]
- Juma, A. O., Arbab, E. A. A., Muiva, C. M., Lepodise, L. M., & Mola, G. T. (2017). Synthesis and characterization of CuO-NiO-ZnO mixed metal oxide nanocomposite. Journal of Alloys and Compounds, 723, 866-872. [CrossRef]
- Habibi, M. H., & Karimi, B. (2014). Application of impregnation combustion method for fabrication of nanostructure CuO/ZnO composite oxide: XRD, FESEM, DRS and FTIR study. Journal of Industrial and Engineering Chemistry, 20(4), 1566-1570. [CrossRef]
- Kang, L., Zhang, M., Liu, Z.-H., & Ooi, K. (2007). IR spectra of manganese oxides with either layered or tunnel structures. Spectrochimica Acta Part A: Molecular and Biomolecular Spectroscopy, 67(3), 864-869. [CrossRef]
- Wang, X., Jia, J., Zhao, L., & Sun, T. (2008). Mesoporous SBA-15 Supported Iron Oxide: A Potent Catalyst for Hydrogen Sulfide Removal. Water, Air, and Soil Pollution, 193(1), 247-257. [CrossRef]
- Zhao, J., Lin, Z., Zhang, J., Wu, J., Yue, Y., & Qian, G. (2022). Enhanced removal of low-concentration methyl mercaptan by synergetic effect between surface functional group and metallic site. Surfaces and Interfaces, 28, 101663. [CrossRef]
- Namduri, H., & Nasrazadani, S. (2008). Quantitative analysis of iron oxides using Fourier transform infrared spectrophotometry. Corrosion Science, 50(9), 2493-2497. [CrossRef]
- Xu, D., Jin, T., Song, L., Zhu, N., Han, L., & Hong, H. (2023). Synthesis of stable calcium carbonate nanoparticles for pH-responsive controlled drug release. Materials Letters, 333, 133635. [CrossRef]
- Zhang, Y., Ouyang, J., & Yang, H. (2014). Metal oxide nanoparticles deposited onto carbon-coated halloysite nanotubes. Applied Clay Science, 95, 252-259. [CrossRef]
- Szczepanik, B., Słomkiewicz, P., Garnuszek, M., Czech, K., Banaś, D., Kubala-Kukuś, A., & Stabrawa, I. (2015). The effect of chemical modification on the physico-chemical characteristics of halloysite: FTIR, XRF, and XRD studies. Journal of Molecular Structure, 1084, 16-22. [CrossRef]
- Bordeepong, S., Bhongsuwan, D., & Pungrassami, T. (2011). Characterization of halloysite from Thung Yai District, Nakhon Si Thammarat Province, in Southern Thailand.
- Kouser, S., Prabhu, A., Sheik, S., Prashantha, K., Nagaraja, G. K., Neetha D'souza, J., Navada, K. M., & Manasa, D. J. (2021). Chitosan functionalized halloysite nanotube/poly (caprolactone) nanocomposites for wound healing application. Applied Surface Science Advances, 6, 100158. [CrossRef]
- Bayiha, B. N., Billong, N., Yamb, E., Kaze, R. C., & Nzengwa, R. (2019). Effect of limestone dosages on some properties of geopolymer from thermally activated halloysite. Construction and Building Materials, 217, 28-35. [CrossRef]
- Kesavan, G., & Chen, S. M. (2021). Manganese oxide anchored on carbon modified halloysite nanotubes: An electrochemical platform for the determination of chloramphenicol. Colloids and Surfaces A: Physicochemical and Engineering Aspects, 615, 126243. [CrossRef]
- Peña, D. A., Uphade, B. S., & Smirniotis, P. G. (2004). TiO2-supported metal oxide catalysts for low-temperature selective catalytic reduction of NO with NH3: I. Evaluation and characterization of first row transition metals. Journal of Catalysis, 221(2), 421-431. [CrossRef]
- Stranick, M. A. (1999). MnO2 by XPS. Surface Science Spectra, 6(1), 31-38. [CrossRef]
- Park, J. E., Jo, E. S., Lee, G. B., Lee, S. E., & Hong, B.-U. (2023). Adsorption Capacity and Desorption Efficiency of Activated Carbon for Odors from Medical Waste. Molecules, 28(2), 785. https://www.mdpi.com/1420-3049/28/2/785.
- Hadnadjev, M., Vulic, T., Marinkovic-Neducin, R., Suchorski, Y., & Weiss, H. (2008). The iron oxidation state in Mg–Al–Fe mixed oxides derived from layered double hydroxides: An XPS study. Applied Surface Science, 254(14), 4297-4302. [CrossRef]
- Smith, R. D. L., Prévot, M. S., Fagan, R. D., Trudel, S., & Berlinguette, C. P. (2013). Water Oxidation Catalysis: Electrocatalytic Response to Metal Stoichiometry in Amorphous Metal Oxide Films Containing Iron, Cobalt, and Nickel. Journal of the American Chemical Society, 135(31), 11580-11586. [CrossRef]
- Liu, S., Ay, A., Luo, Q., Hu, X., Białas, K., Dutta, G., Moschou, D., & Regoutz, A. (2022). Oxidation of copper electrodes on flexible polyimide substrates for non-enzymatic glucose sensing. Materials Research Express, 9(4), 045010. [CrossRef]
- Velu, S., Suzuki, K., Munusamy, V., Barman, S., & Gopinath, C. (2005). In situ XPS investigations of Cu1-xNixZnAl-mixed metal oxide catalysts used in the oxidative steam reforming of bio-ethanol. Applied Catalysis B: Environmental, 55, 287–299. [CrossRef]
- Al-Gaashani, R., Zakaria, Y., Gladich, I., Kochkodan, V., & Lawler, J. (2022). XPS, structural and antimicrobial studies of novel functionalized halloysite nanotubes. Scientific Reports, 12(1), 21633. [CrossRef]
- Sun, P., Liu, G., Lv, D., Dong, X., Wu, J., & Wang, D. (2015). Effective activation of halloysite nanotubes by piranha solution for amine modification via silane coupling chemistry [10.1039/C5RA04444H]. RSC Advances, 5(65), 52916-52925. [CrossRef]
- Liu, M., Guo, B., Du, M., Cai, X., & Jia, D. (2007). Properties of halloysite nanotube–epoxy resin hybrids and the interfacial reactions in the systems. Nanotechnology, 18, 455703. [CrossRef]
- Kloprogge, J. T., & Wood, B. J. (2015). CHEMICAL BONDING AND ELECTRONIC STRUCTURES OF THE Al_2Si_2O_5(OH)_4 POLYMORPHS KAOLINITE, DICKITE, NACRITE, AND HALLOYSITE BY X-RAY PHOTOELECTRON PECTROSCOPY. Clay Science, 19(2), 39-44. [CrossRef]
- Mokhatab, S., Poe, W. A., & Mak, J. Y. (2019). Chapter 4 - Basic Concepts of Natural Gas Processing. In S. Mokhatab, W. A. Poe, & J. Y. Mak (Eds.), Handbook of Natural Gas Transmission and Processing (Fourth Edition) (pp. 177-189). Gulf Professional Publishing. [CrossRef]
- Dhage, P., Samokhvalov, A., McKee, M., Duin, E., & Tatarchuk, B. (2013). Reactive adsorption of hydrogen sulfide by promoted sorbents Cu-ZnO/SiO2: Active sites by experiment and simulation. Surface and Interface Analysis, 45. [CrossRef]
- Alguacil, F. J. (2023). Recent Advances in H2S Removal from Gas Streams. Applied Sciences, 13(5), 3217. https://www.mdpi.com/2076-3417/13/5/3217.
- Bergel, M., & Tierno, I. (2009). Sweetening technologies-A look at the whole picture. 24th World Gas Conf. Argentina,.
- Khabazipour, M., & Anbia, M. (2019). Removal of Hydrogen Sulfide from Gas Streams Using Porous Materials: A Review. Industrial & Engineering Chemistry Research, 58(49), 22133-22164. [CrossRef]
- Xie, Y., Bao, J., Song, X., Sun, X., Ning, P., Wang, C., Wang, F., Ma, Y., Fan, M., & Li, K. (2023). Catalysts for gaseous organic sulfur removal. Journal of Hazardous Materials, 442, 130029. [CrossRef]
- Jiang, D., Su, L., Ma, L., Yao, N., Xu, X., Tang, H., & Li, X. (2010). Cu–Zn–Al mixed metal oxides derived from hydroxycarbonate precursors for H2S removal at low temperature. Applied Surface Science, 256(10), 3216-3223. [CrossRef]
- Nabipoor H. M., Hallajisani, A. (2020). Application of Molybdenum oxide nanoparticles in H2S removal from natural gas under different operational and geometrical conditions. Journal of Petroleum Science and Engineering, 190, 107131. [CrossRef]
- Weinlaender, C., Neubauer, R., & Hochenauer, C. (2016). Low-temperature H2S removal for solid oxide fuel cell application with metal oxide adsorbents. Adsorption Science & Technology, 35(1-2), 120-136. [CrossRef]
- Li, S., Wang, D., Wu, X., & Chen, Y. (2020). Recent advance on VOCs oxidation over layered double hydroxides derived mixed metal oxides. Chinese Journal of Catalysis, 41(4), 550-560. [CrossRef]
- Wang, L., Zhang, X., He, J., Zhu, J., & Hu, L. (2022). The removal of ethyl mercaptan by Fe2O3/HNb3O8-NS composite. Inorganic Chemistry Communications, 140, 109440. [CrossRef]
- Zhang, Z., Jiang, Z., & Shangguan, W. (2016). Low-temperature catalysis for VOCs removal in technology and application: A state-of-the-art review. Catalysis Today, 264, 270-278. [CrossRef]
- Liu, Q., Ke, M., Yu, P., Liu, F., Hu, H., & Li, C. (2018). High performance removal of methyl mercaptan on metal modified activated carbon. Korean Journal of Chemical Engineering, 35(1), 137-146. [CrossRef]
- West, J., Peter Williams, B., Young, N., Rhodes, C., & Hutchings, G. J. (2001). Ni- and Zn-promotion of γ-Al2O3 for the hydrolysis of COS under mild conditions. Catalysis Communications, 2(3), 135-138. [CrossRef]
- Yi, H., Zhang, X., Tang, X., Zhao, S., Ma, C., Han, W., & Song, L. (2019). Promotional Effects of Transition Metal Modification over Al2O3 for CH3SH Catalytic Oxidation. ChemistrySelect, 4(34), 9901-9907. [CrossRef]
- Li, Y., Wang, L.-J., Fan, H.-L., Shangguan, J., Wang, H., & Mi, J. (2015). Removal of Sulfur Compounds by a Copper-Based Metal Organic Framework under Ambient Conditions. Energy & Fuels, 29(1), 298-304. [CrossRef]
- Singh, A., Krishna, V., Angerhofer, A., Do, B., MacDonald, G., & Moudgil, B. (2010). Copper Coated Silica Nanoparticles for Odor Removal. Langmuir, 26(20), 15837-15844. [CrossRef]
- Liu, Q., Ke, M., Liu, F., Yu, P., Hu, H., & Li, C. (2017). High-performance removal of methyl mercaptan by nitrogen-rich coconut shell activated carbon [10.1039/C7RA03227G]. RSC Advances, 7(37), 22892-22899. [CrossRef]
- Zhao, S., Yi, H., Tang, X., Gao, F., Zhang, B., Wang, Z., & Zuo, Y. (2015). Methyl mercaptan removal from gas streams using metal-modified activated carbon. Journal of Cleaner Production, 87, 856-861. [CrossRef]
- Feng, Q., & Wen, S. (2017). Formation of zinc sulfide species on smithsonite surfaces and its response to flotation performance. Journal of Alloys and Compounds, 709, 602-608. [CrossRef]
- Su, H., Liu, J., Hu, Y., Ai, T., Gong, C., Lu, J., & Luo, Y. (2023). Comparative Study of α-and β-MnO2 on Methyl Mercaptan Decomposition: The Role of Oxygen Vacancies. Nanomaterials, 13(4), 775.
- Yao, X., Zhou, J., & Liu, Z. (2022). Study on adsorption of low-concentration methyl mercaptan by starch-based activated carbon. Chemosphere, 302, 134901. [CrossRef]
- Soni Castro, P., Martinez Zuniga, G., Holmes, W., Buchireddy, P. R., Gang, D. D., Revellame, E., Zappi, M., & Hernandez, R. (2023). Review of the adsorbents/catalysts for the removal of sulfur compounds from natural gas. Gas Science and Engineering, 115, 205004. [CrossRef]
- Wei, G., Liu, P., Chen, D., Chen, T., Liang, X., & Chen, H. (2019). Activity of manganese oxides supported on halloysite towards the thermal catalytic oxidation of formaldehyde: Constraint from the manganese precursor. Applied Clay Science, 182, 105280. [CrossRef]
- Kim, D. J., Lee, H. I., Yie, J. E., Kim, S.-J., & Kim, J. M. (2005). Ordered mesoporous carbons: Implication of surface chemistry, pore structure and adsorption of methyl mercaptan. Carbon, 43(9), 1868-1873. [CrossRef]
- Shakirullah, M., Ahmad, W., Ahmad, I., & Ishaq, M. (2010). Oxidative desulphurization study of gasoline and kerosene: Role of some organic and inorganic oxidants. Fuel Processing Technology, 91(11), 1736-1741. [CrossRef]
- Yi, D., Huang, H., Meng, X., & Shi, L. (2014). Adsorption–desorption behavior and mechanism of dimethyl disulfide in liquid hydrocarbon streams on modified Y zeolites. Applied Catalysis B: Environmental, 148-149, 377-386. [CrossRef]
- Tamai, H., Nakamori, M., Nishikawa, M., & Shiono, T. (2011). Activated Carbons Containing Dispersed Metal Oxide Particles for Removal of Methyl Mercaptan in Air. Materials Sciences and Applications, Vol.02No.01, 4, Article 3650. [CrossRef]
- Wang, L., Wang, X., Ning, P., Liu, W., Wang, F., & Ma, Y. (2017). Selective adsorption of CH3SH on cobalt-modified activated carbon with low oxygen concentration. Journal of the Taiwan Institute of Chemical Engineers, 75, 156-163. [CrossRef]
- Kim, Y.-H., Tuan, V. A., Park, M.-K., & Lee, C.-H. (2014). Sulfur removal from municipal gas using magnesium oxides and a magnesium oxide/silicon dioxide composite. Microporous and Mesoporous Materials, 197, 299-307. [CrossRef]
Figure 1.
Experimental setup for the methyl mercaptan removal.
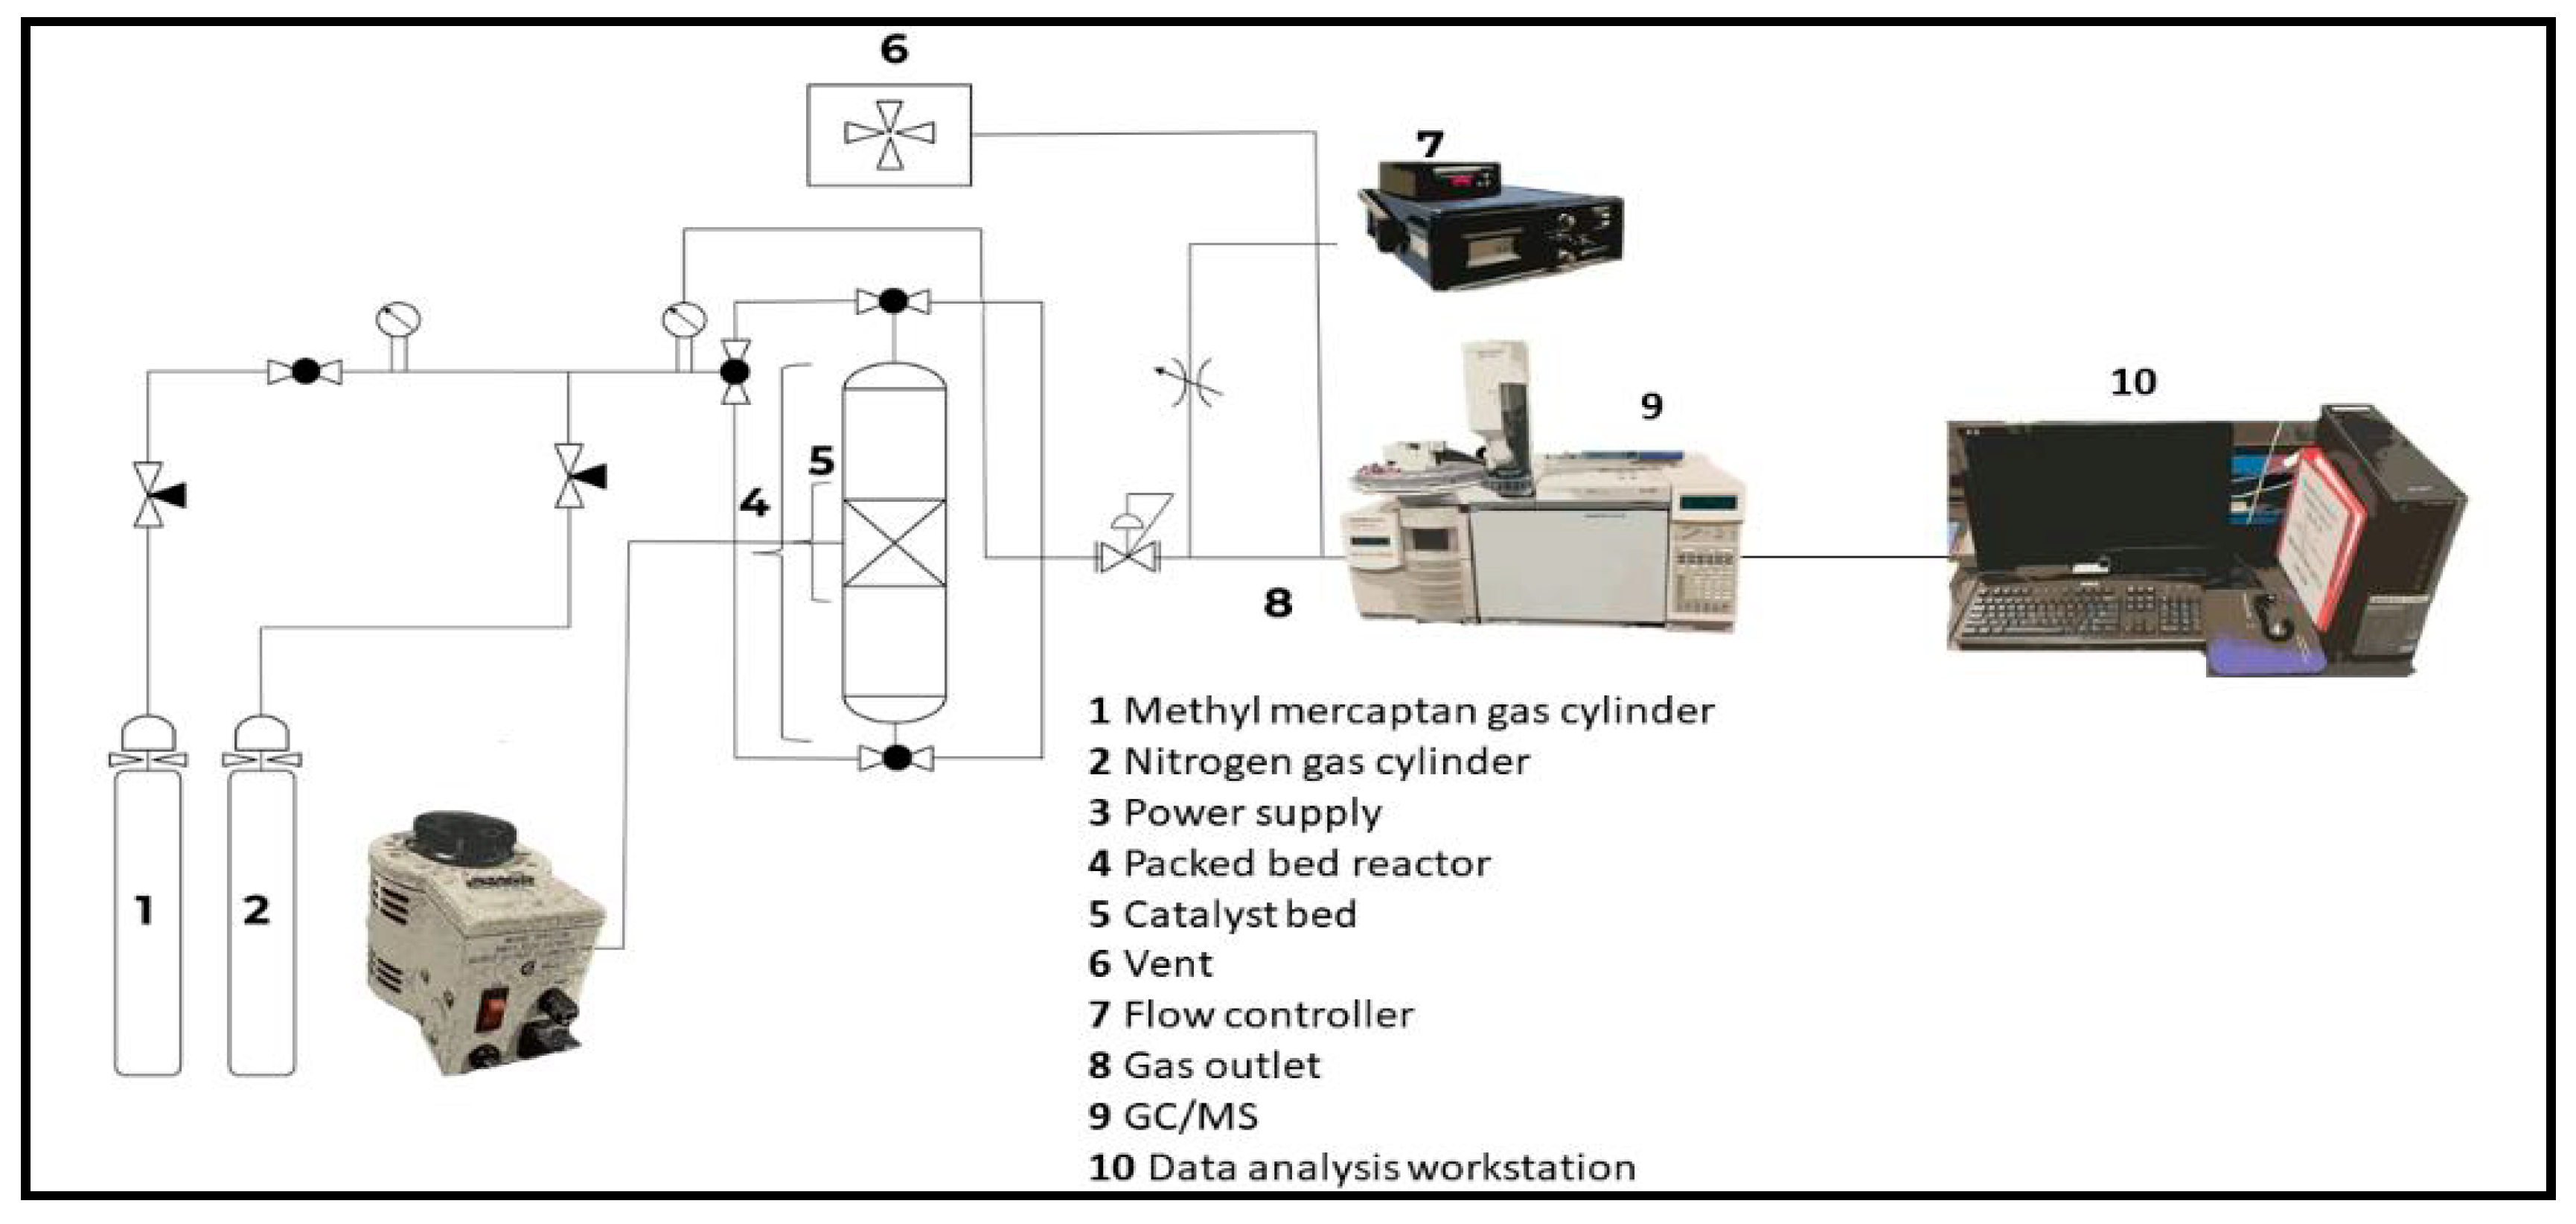
Figure 2.
Graphical representation of methyl mercaptan removal.
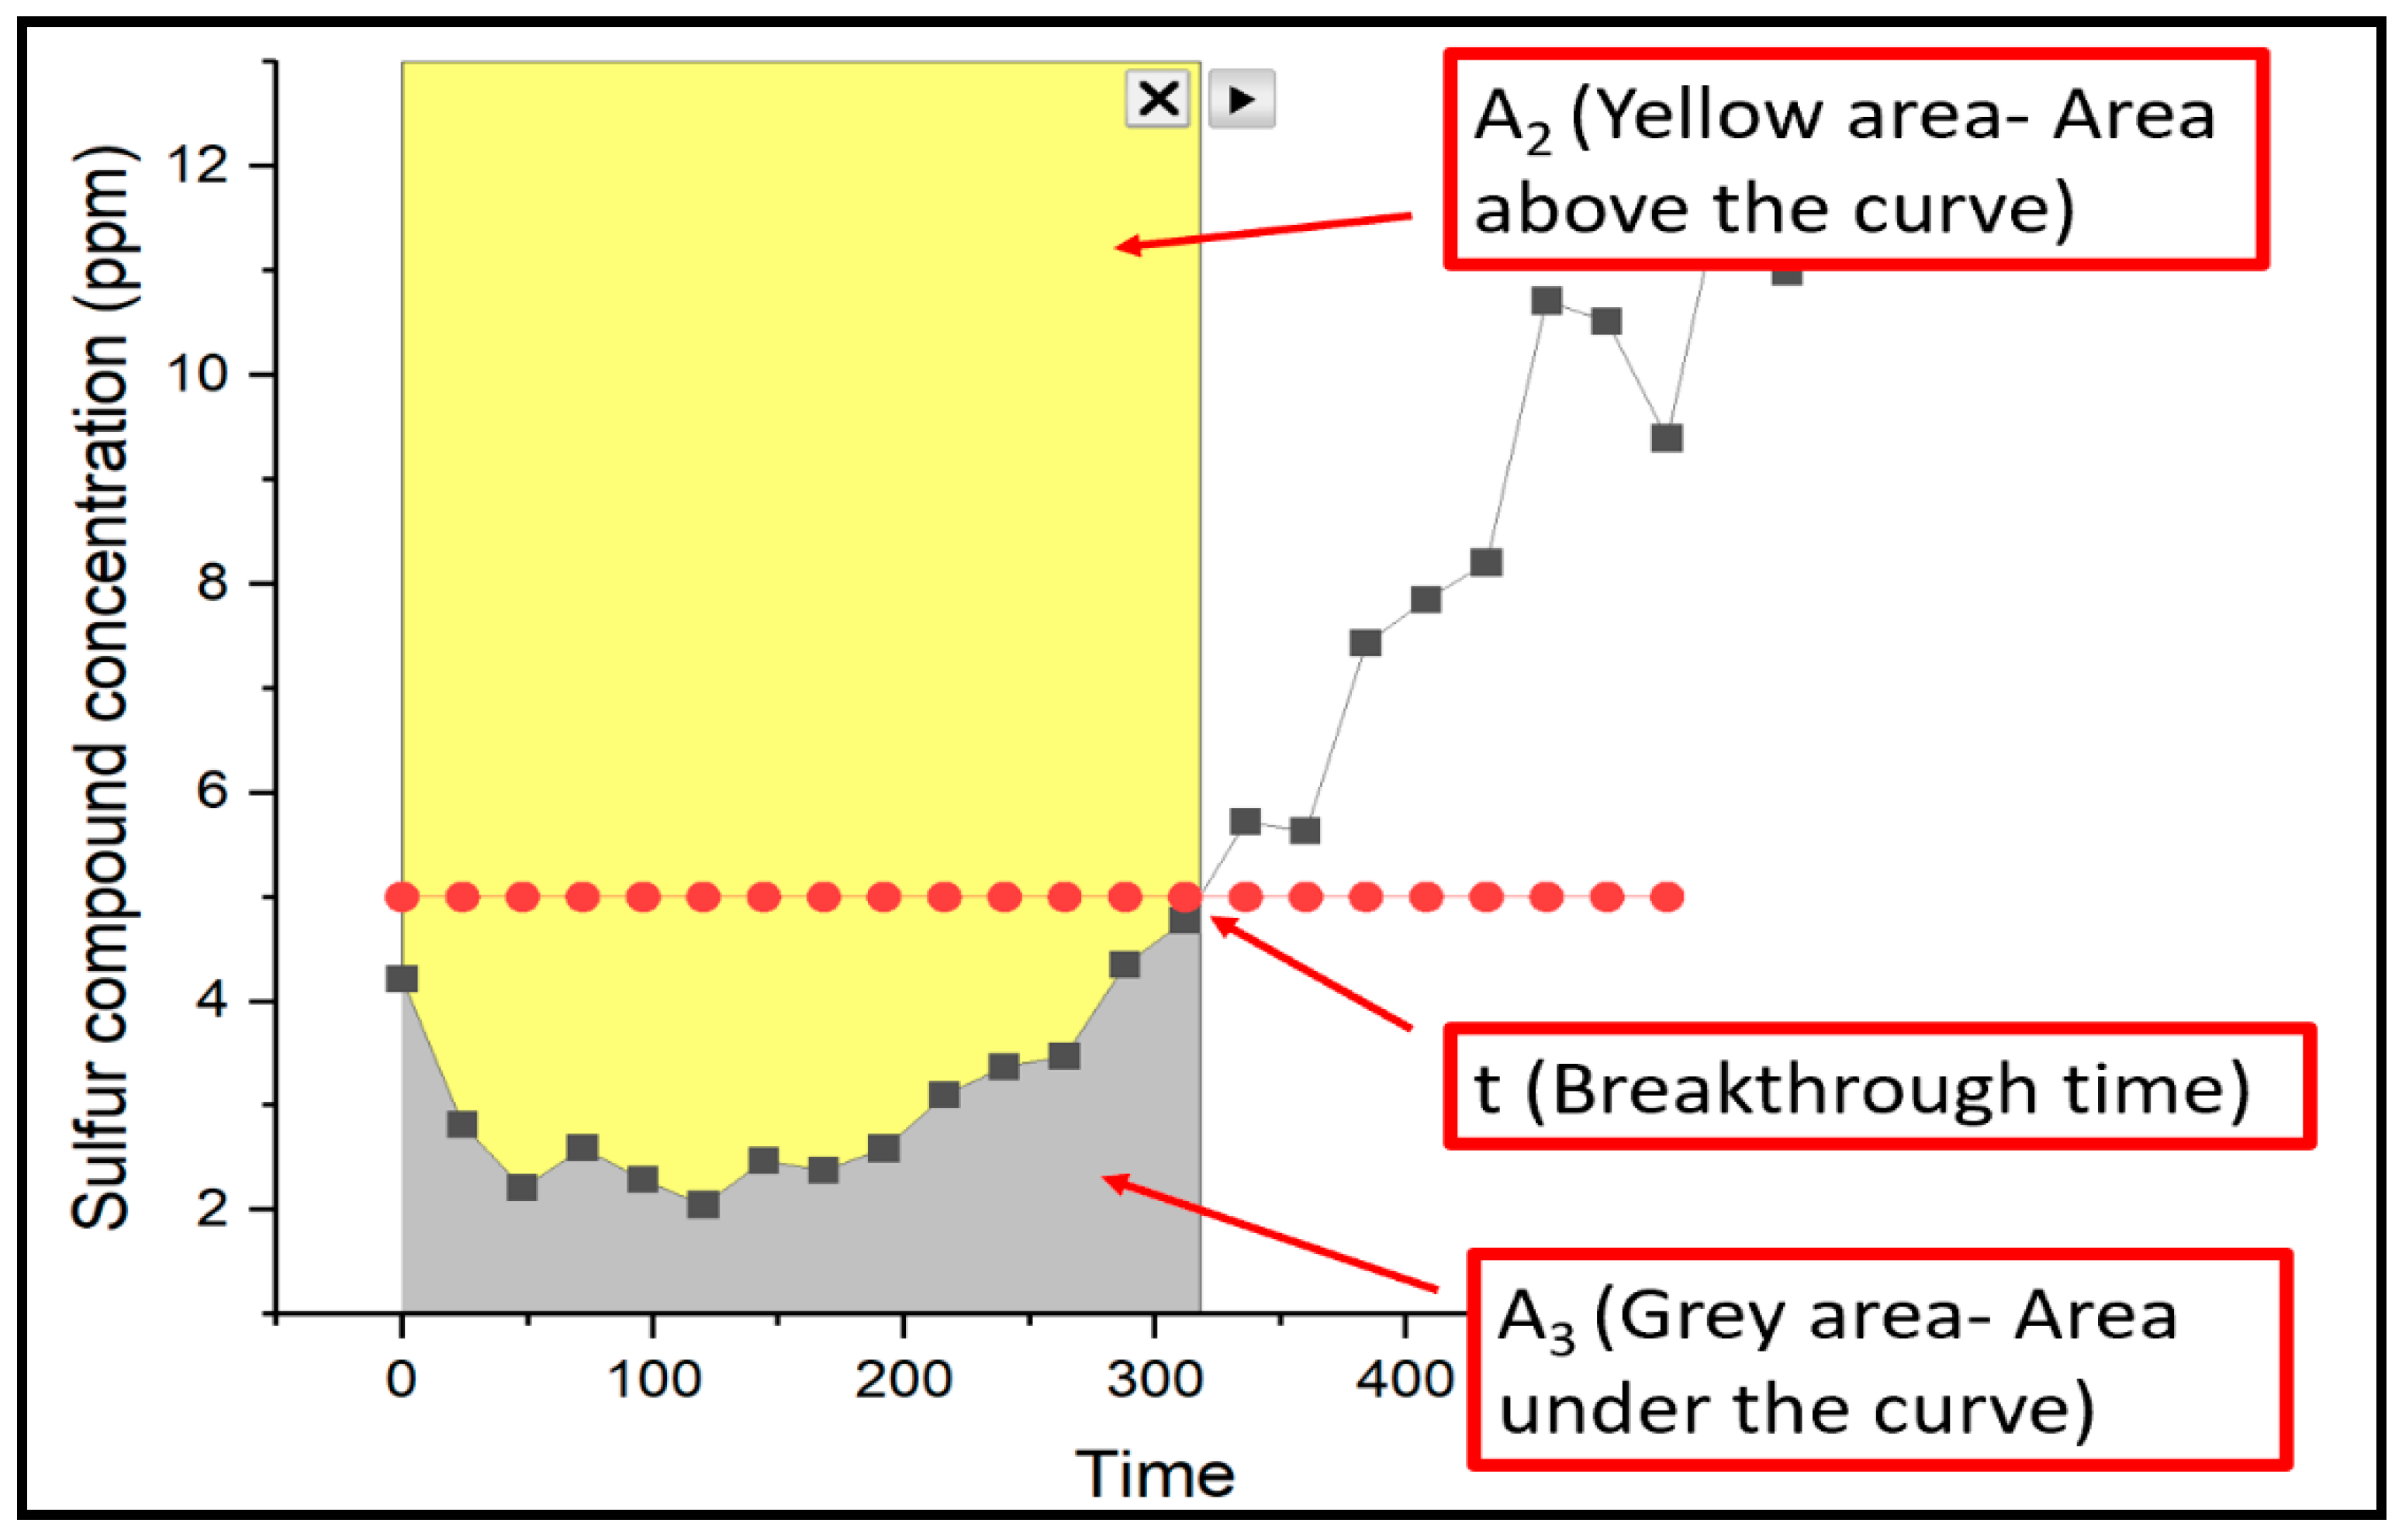
Figure 3.
FTIR spectra of the Select HP catalyst and CTG-ESC-011 catalyst.
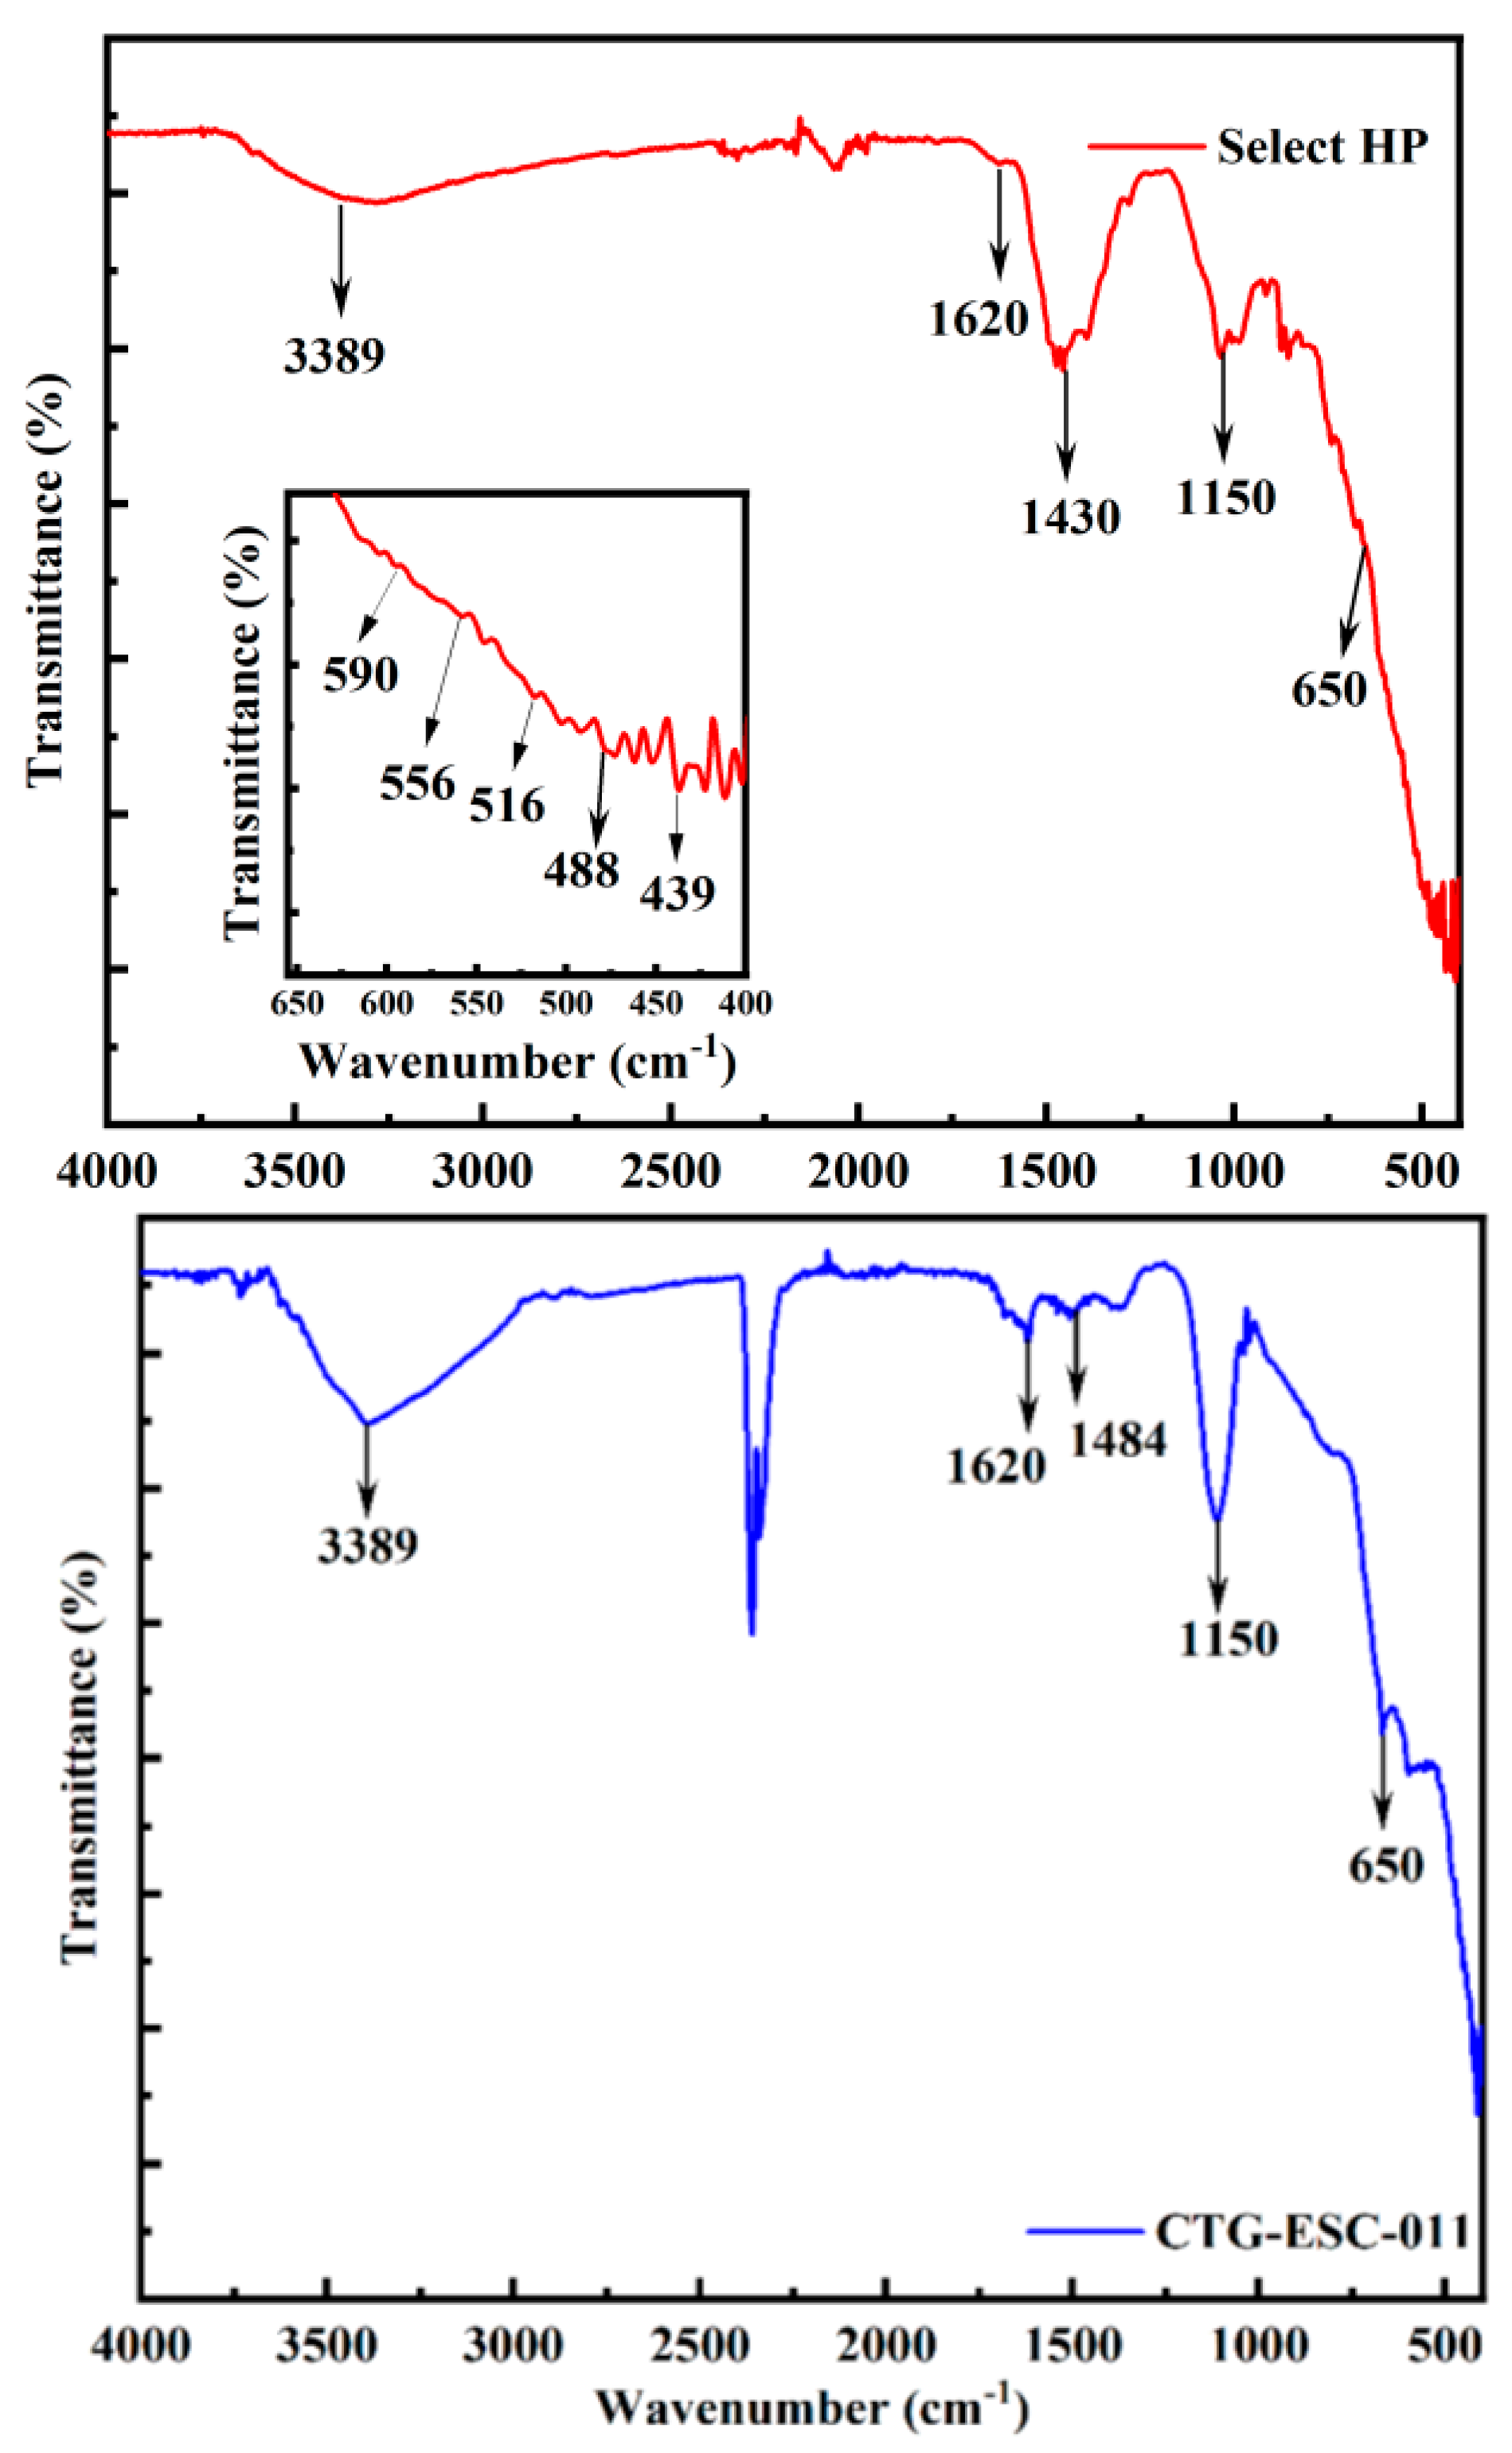
Figure 4.
FTIR spectra for (a) Halloysite pure, (b) Halloysite MinO, and (c) Halloysite Mixed.
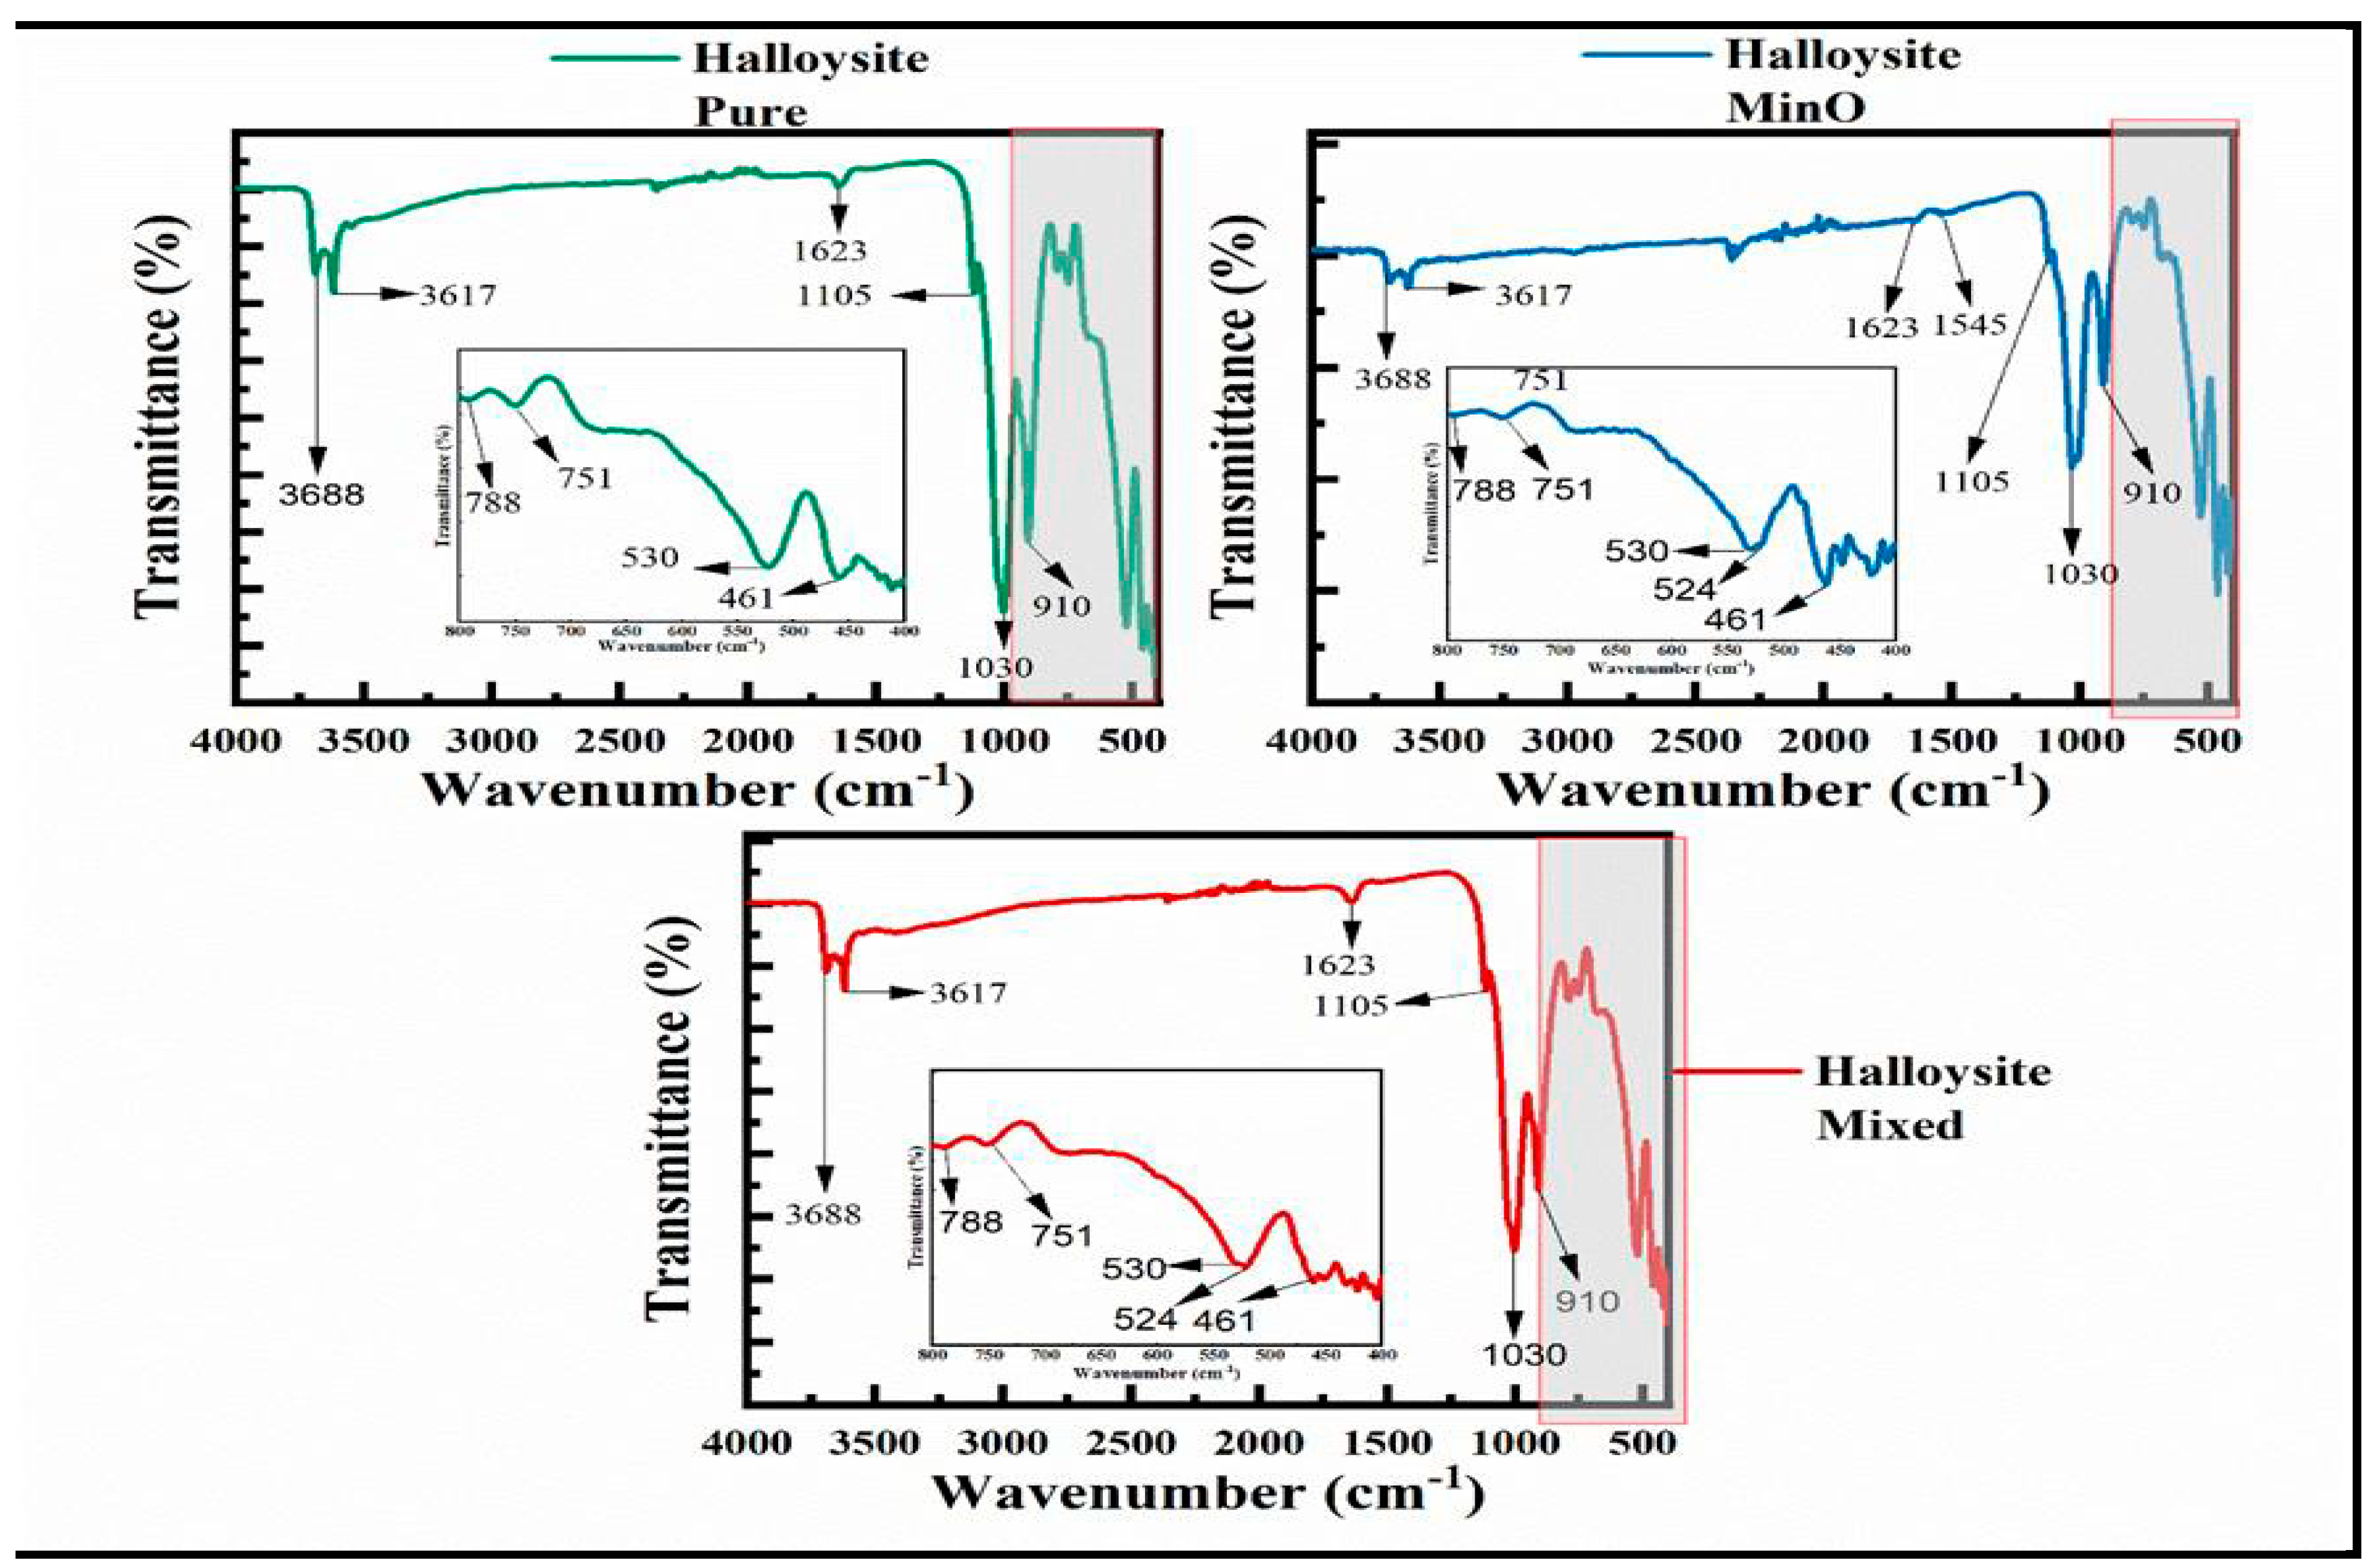
Figure 5.
XPS spectra for (a) Select HP, (b) CTG-ESC-011, and (c) Fe 2p.
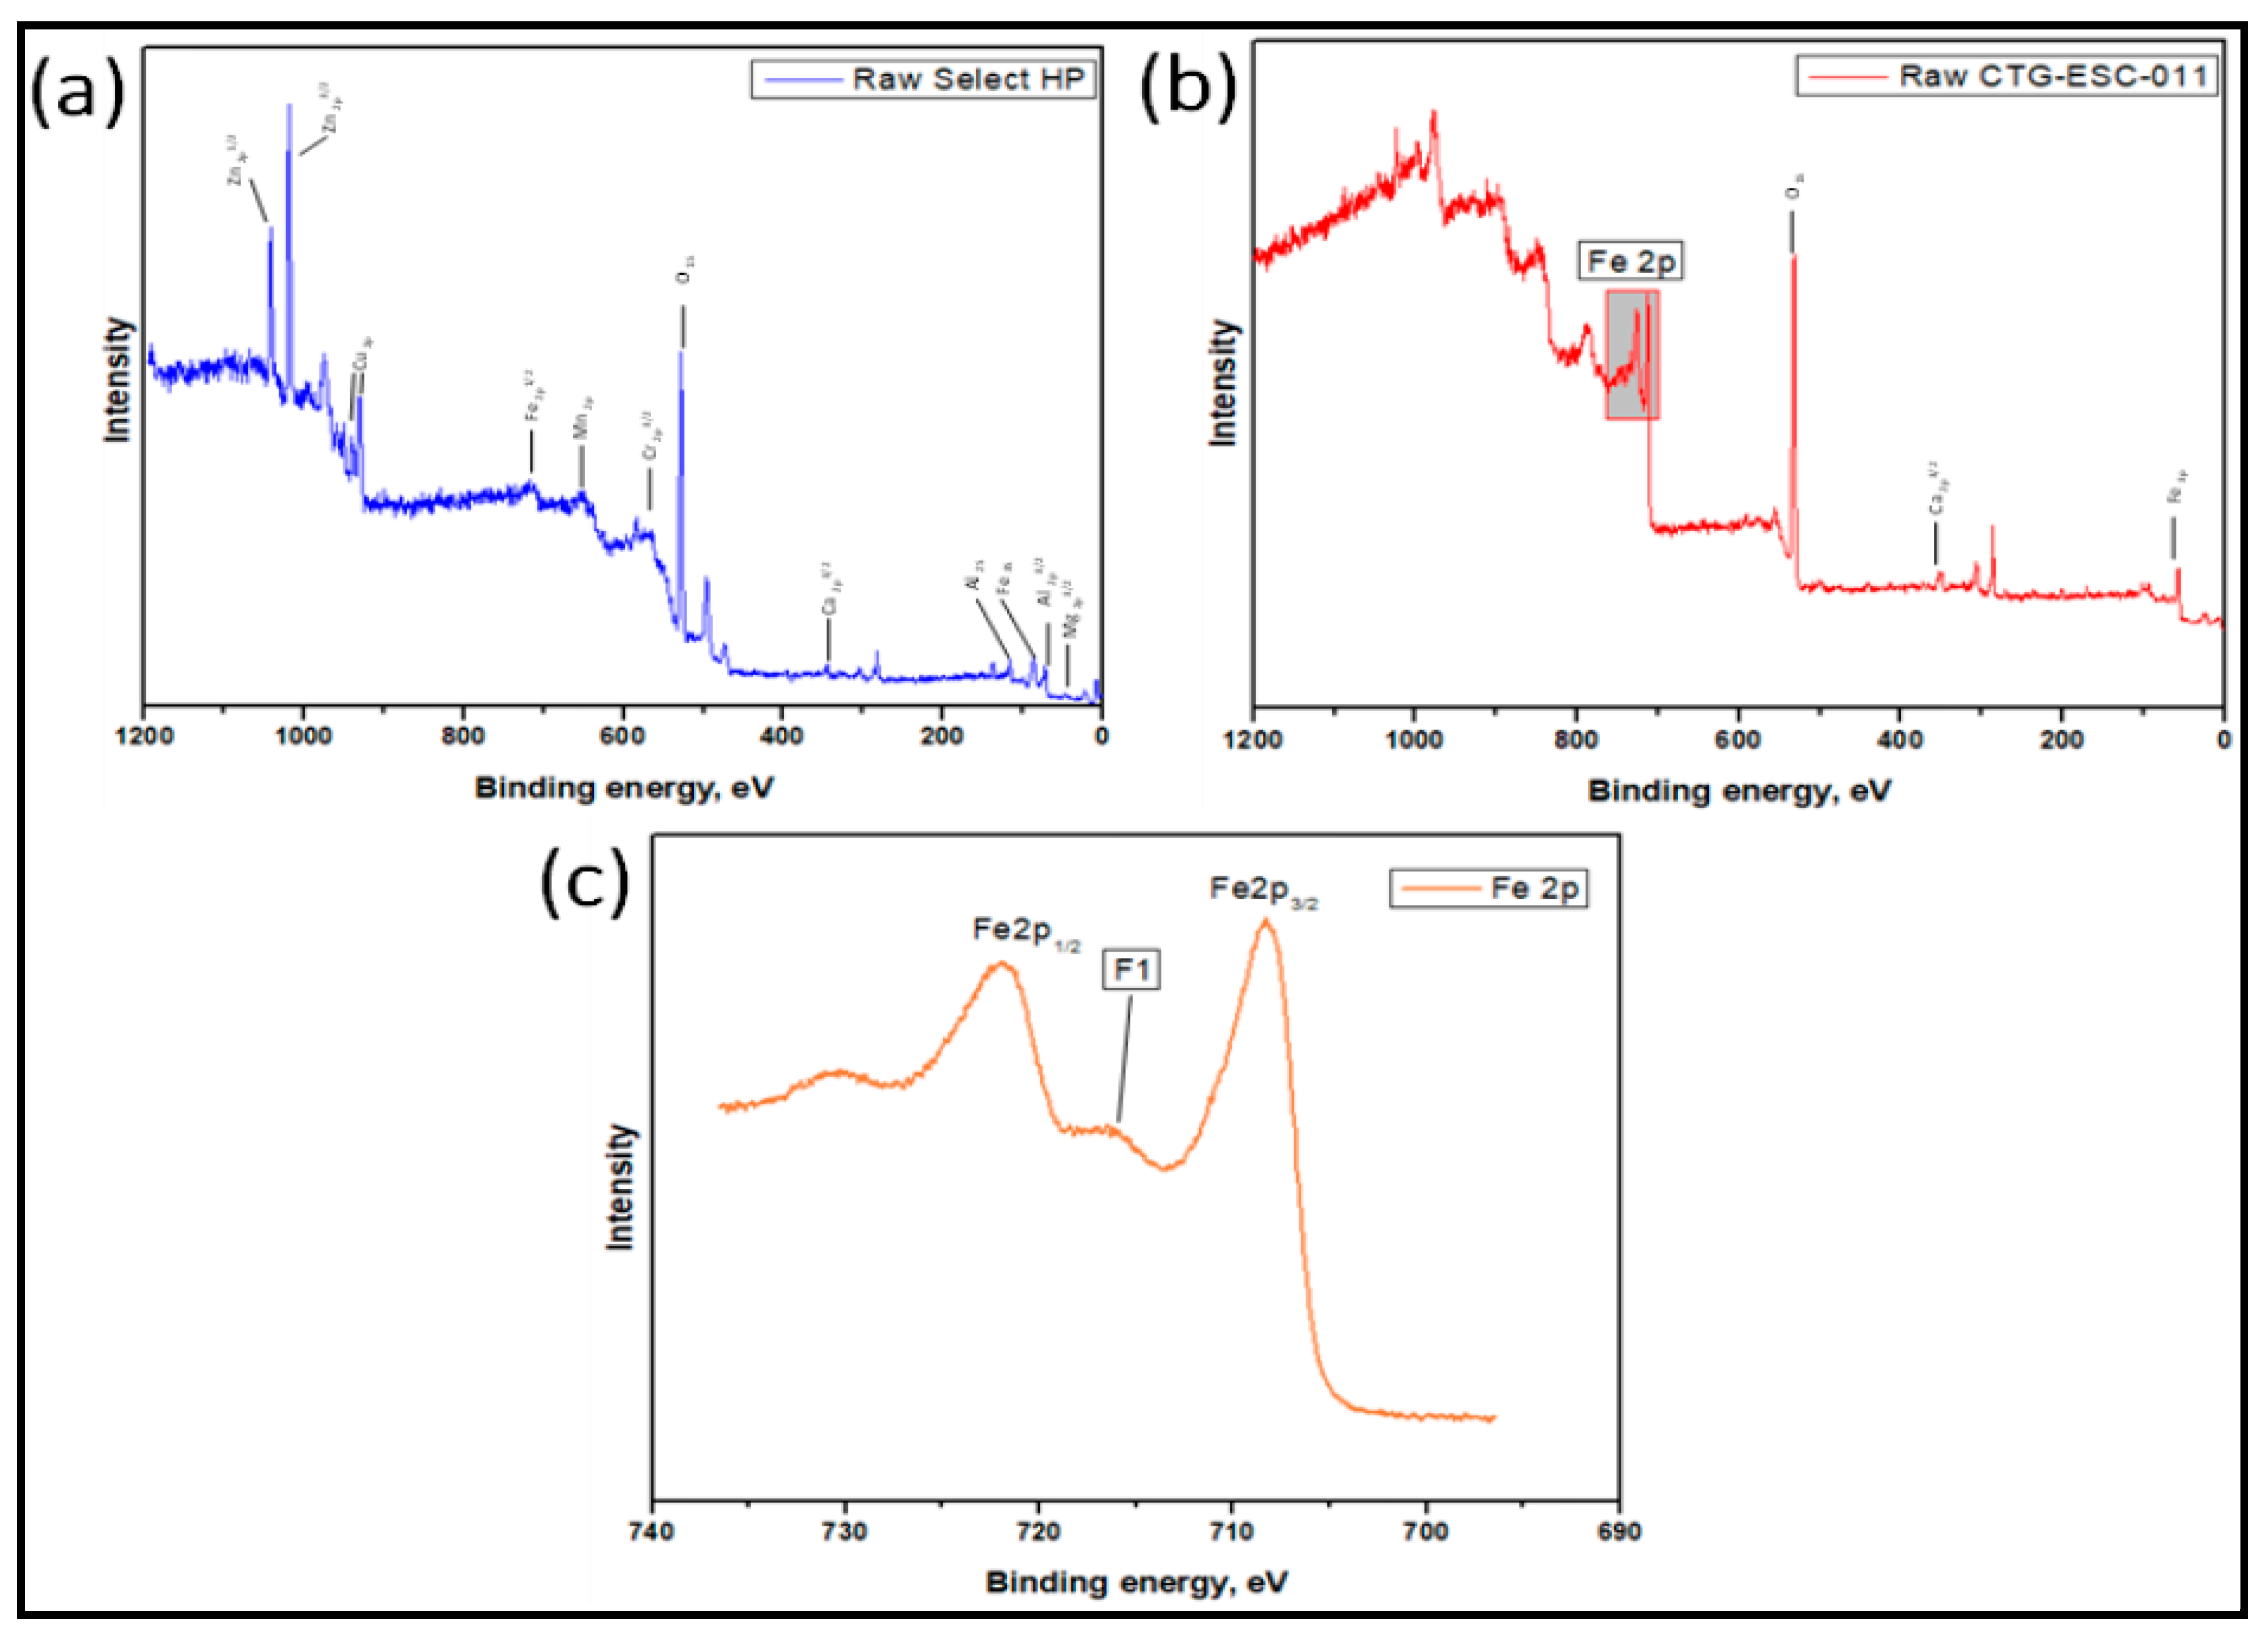
Figure 6.
XPS spectra for: (a) Halloysite MinO, (b) Halloysite Pure, and (c) Halloysite Mixed.
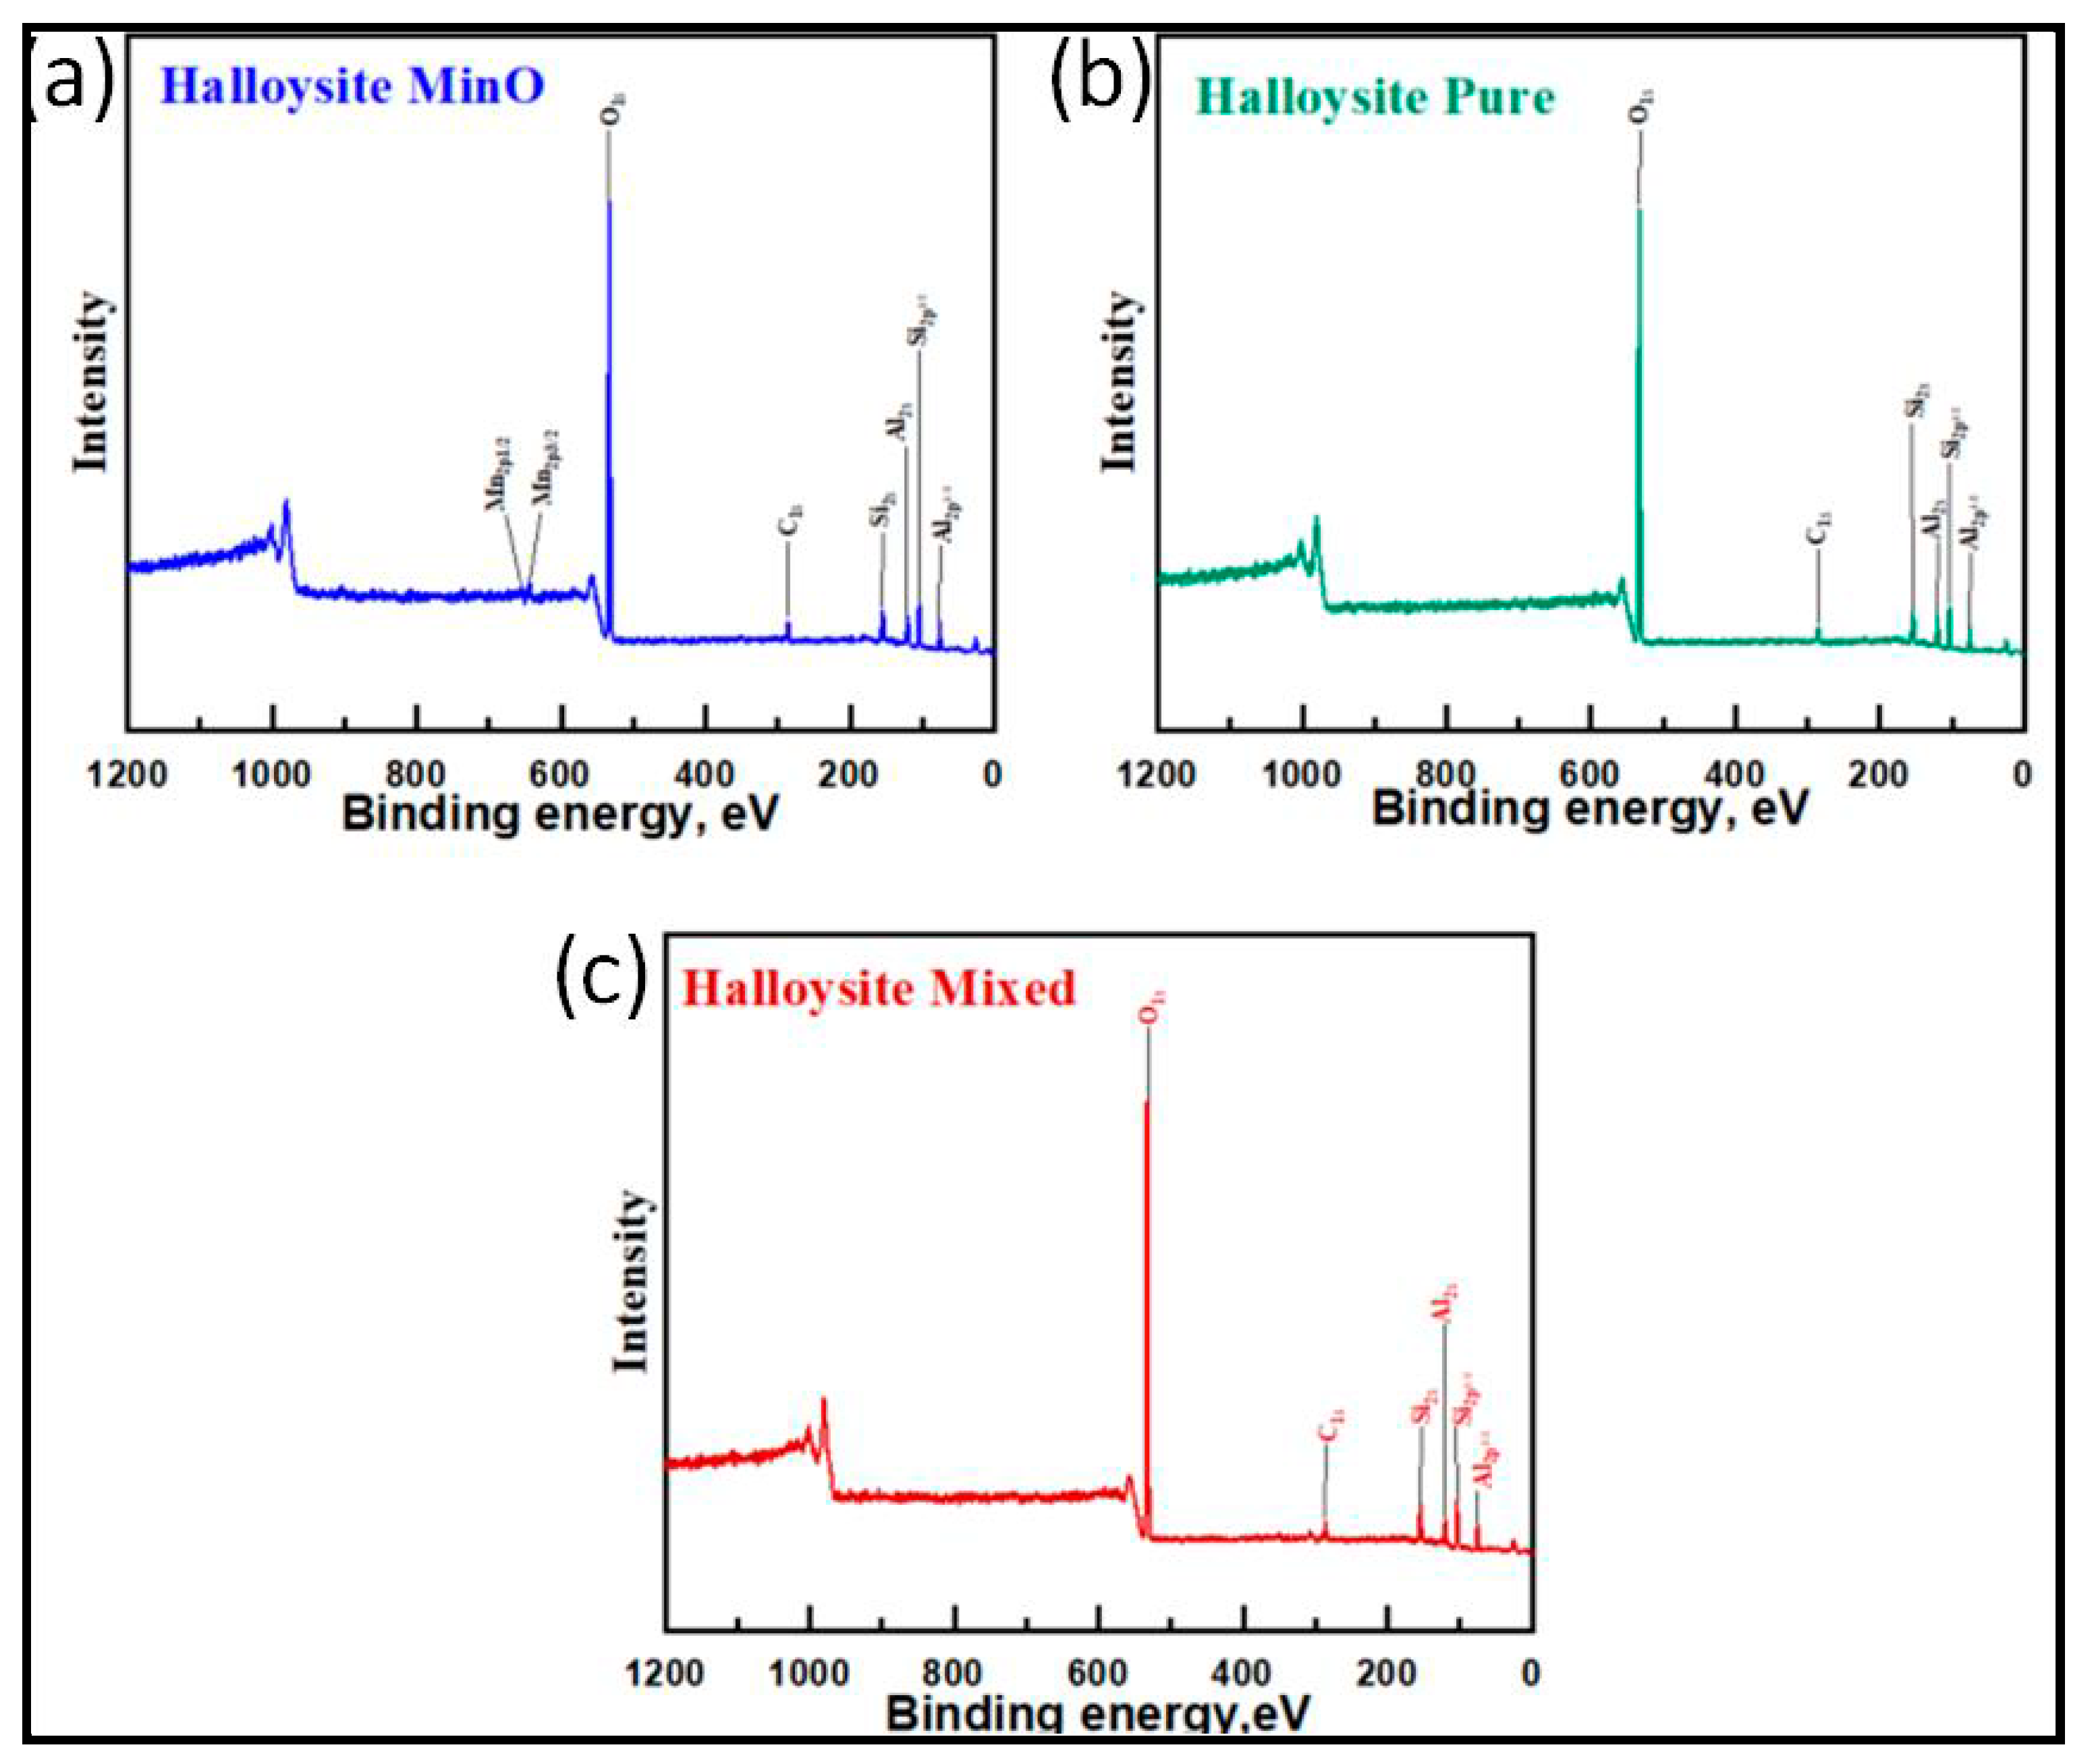
Figure 7.
Breakthrough curves for Select HP catalyst.
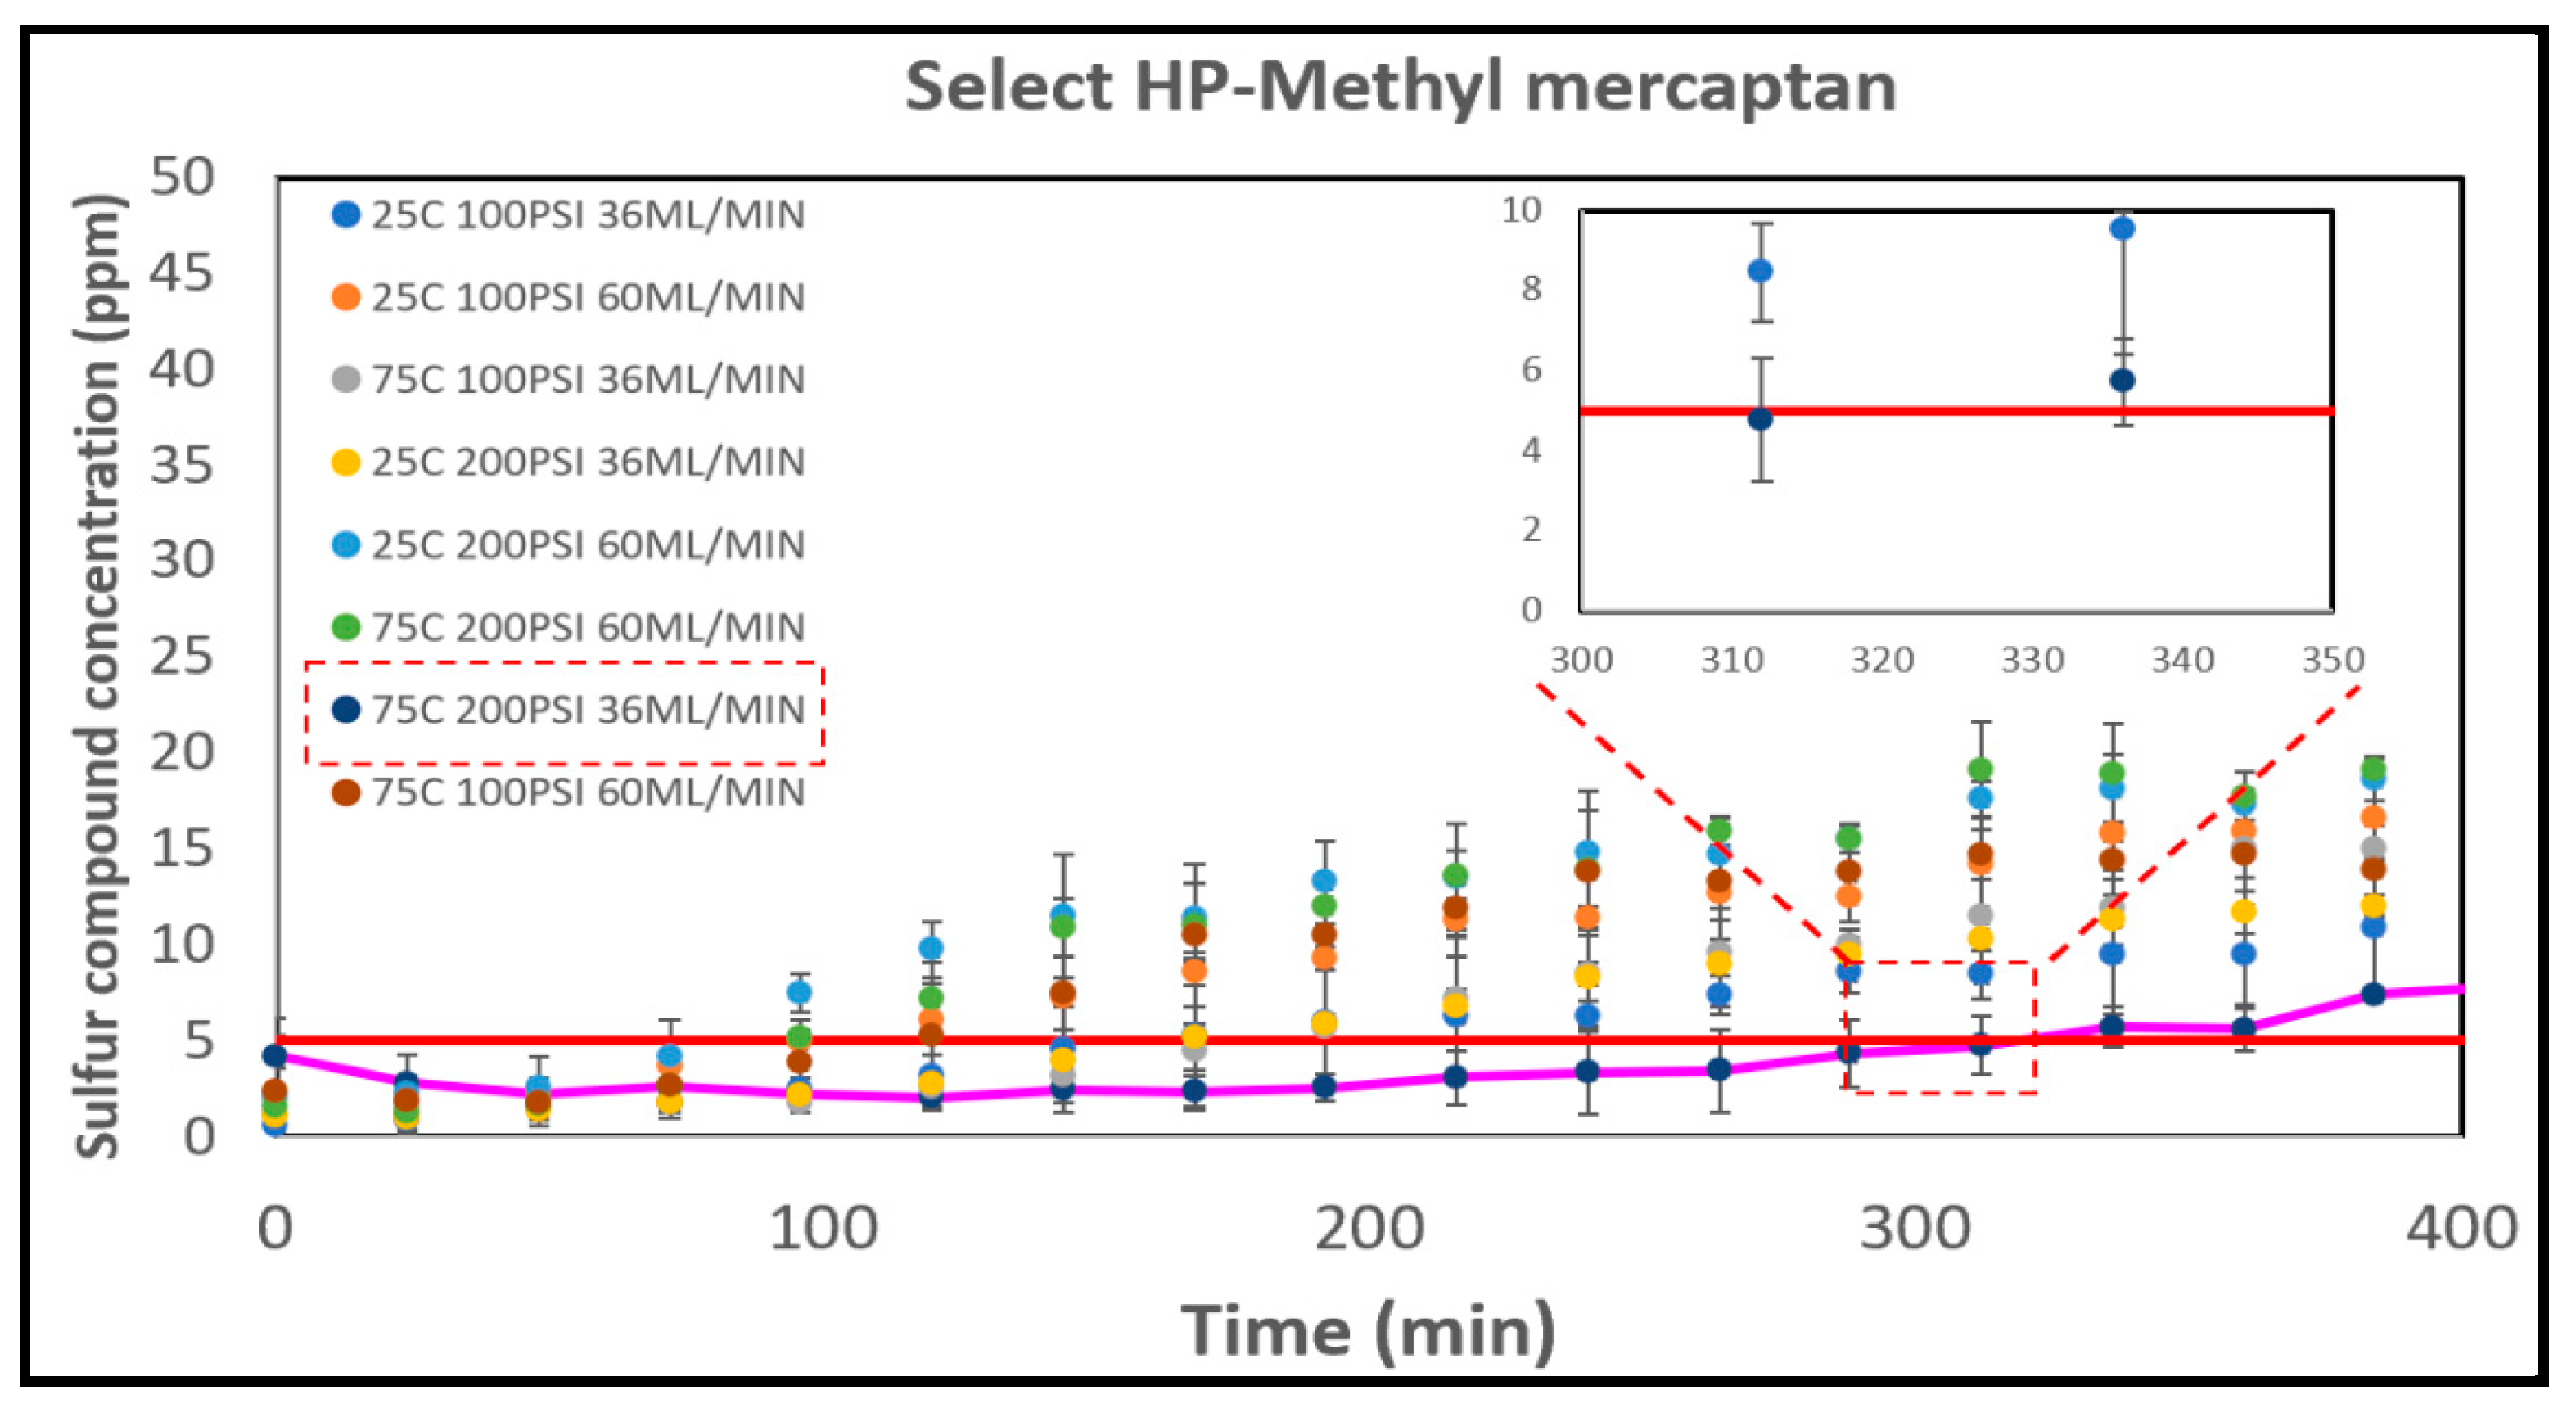
Figure 8.
Breakthrough curves for CTG-ESC-011 catalyst.
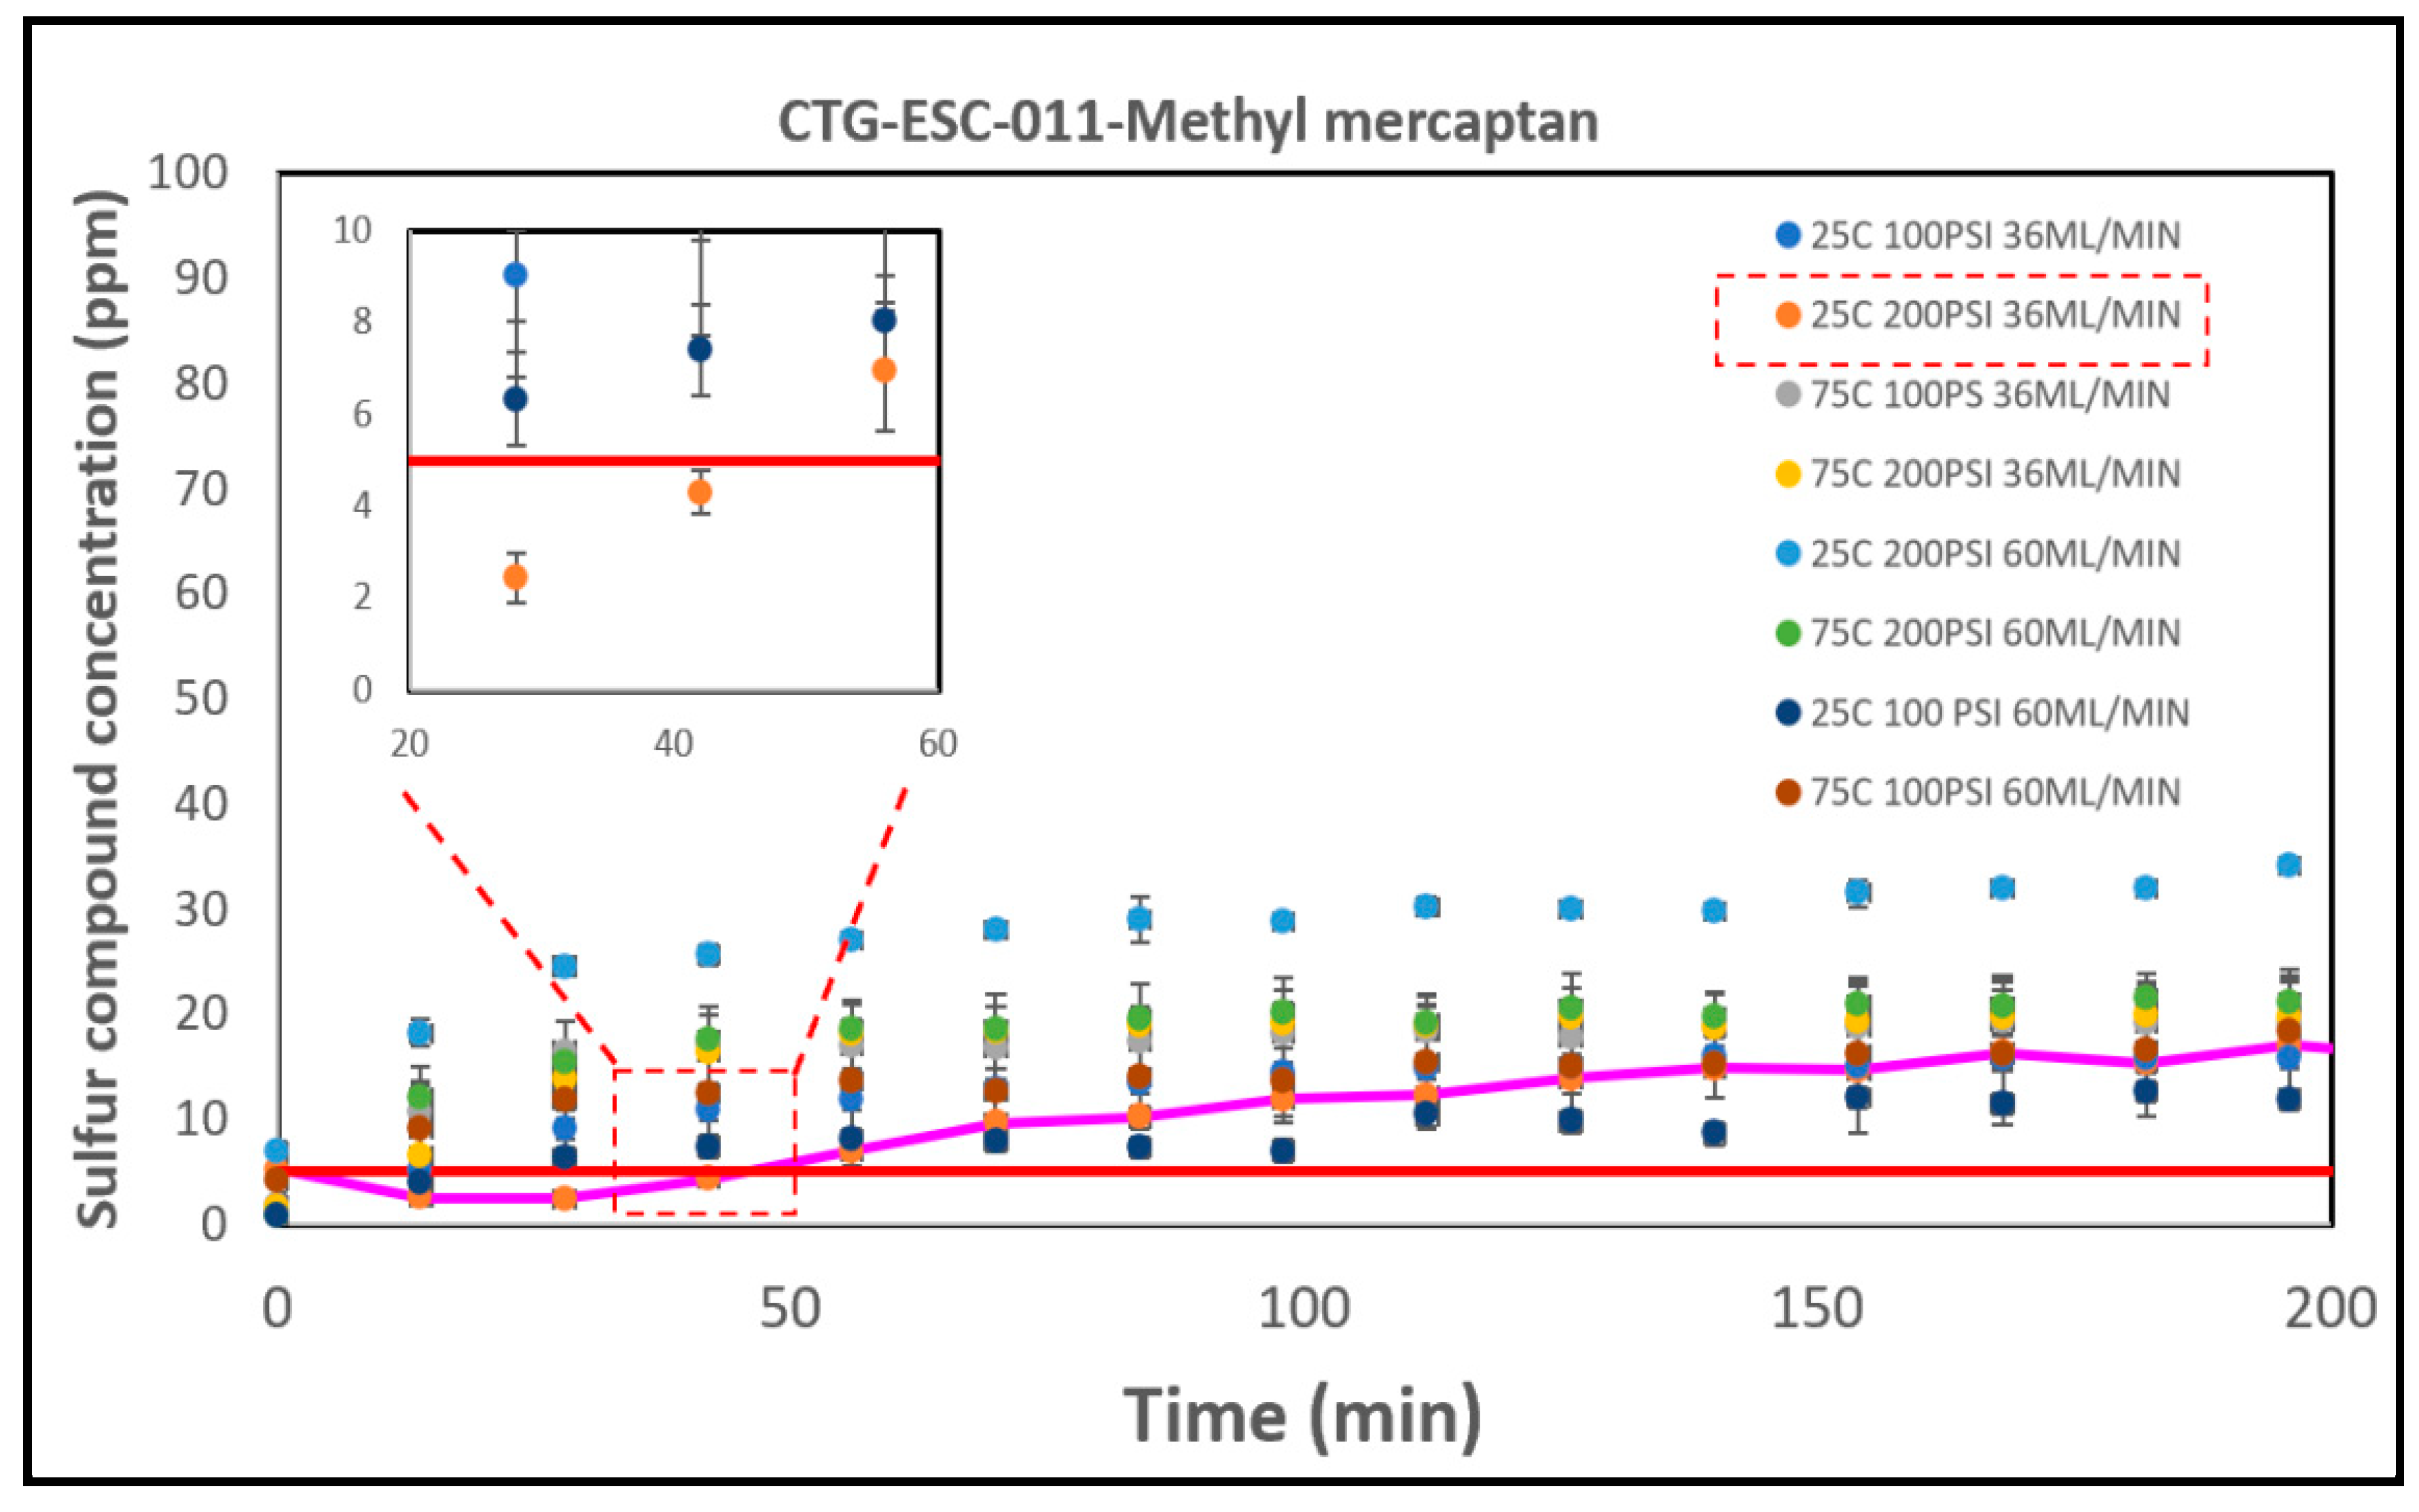
Figure 9.
Breakthrough curves for Halloysite Pure catalyst.
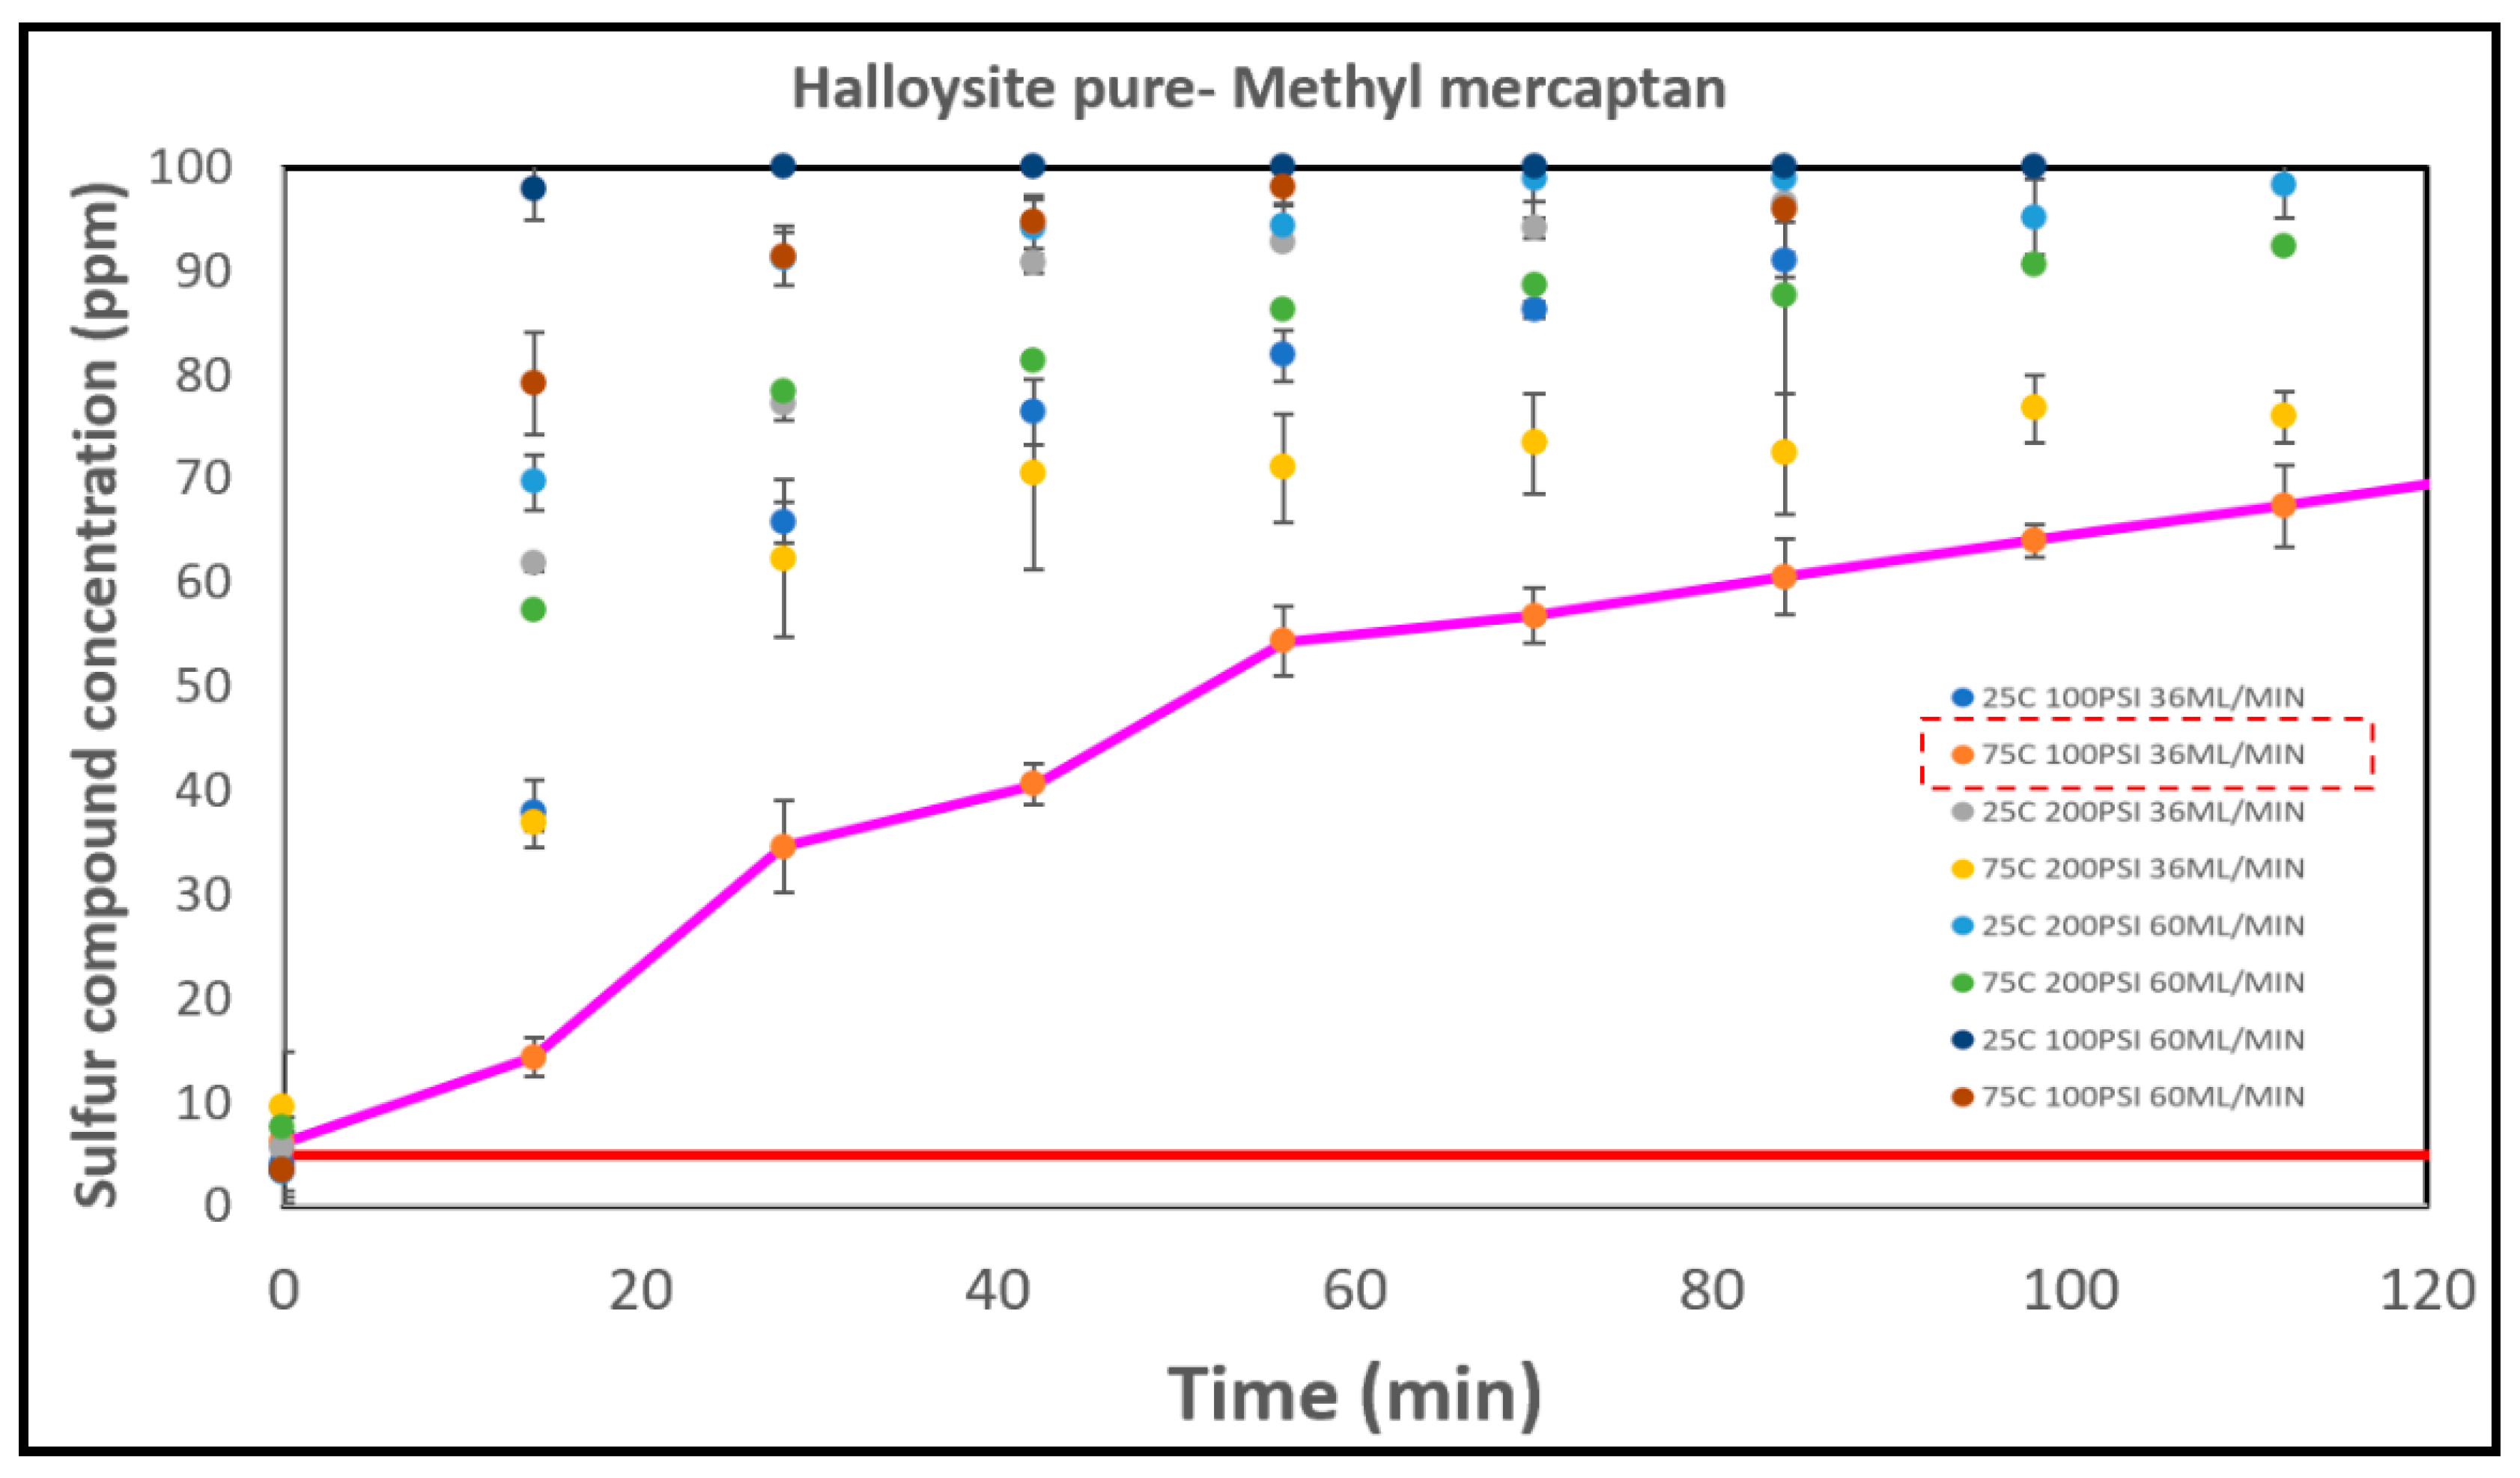
Figure 10.
Breakthrough curves for Halloysite MinO catalyst.
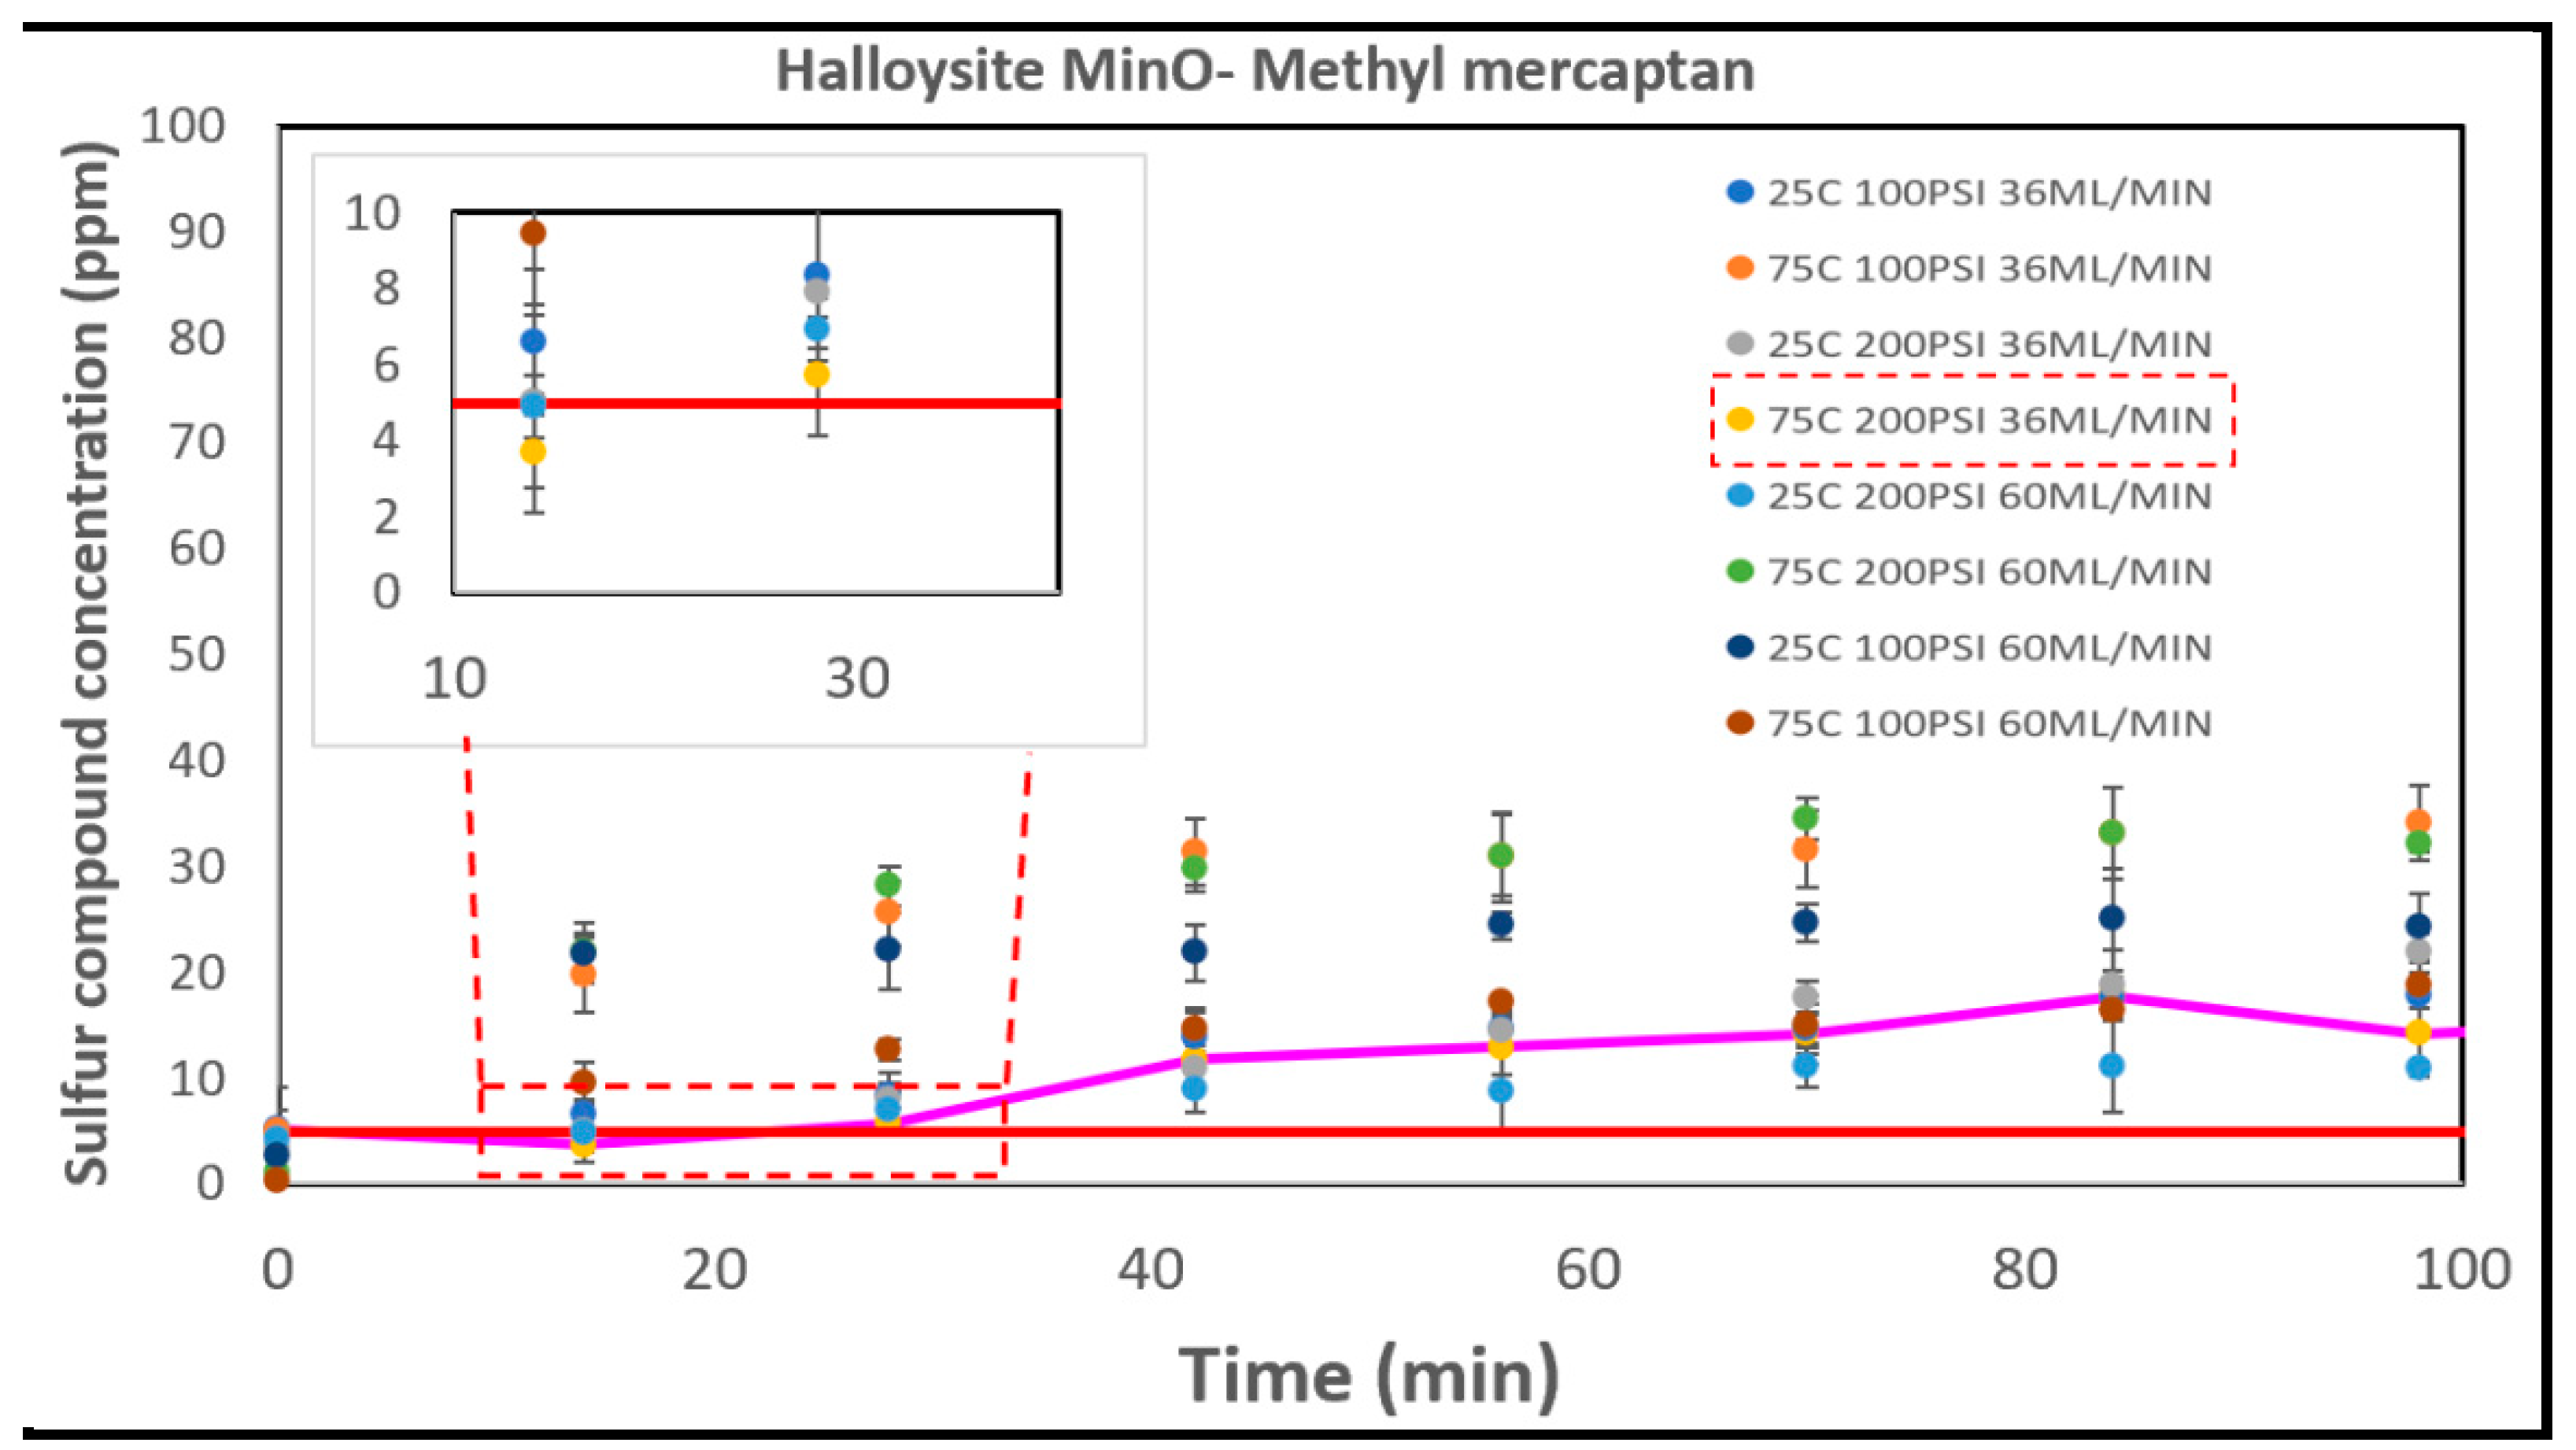
Figure 11.
Breakthrough curves for Halloysite mixed catalyst.
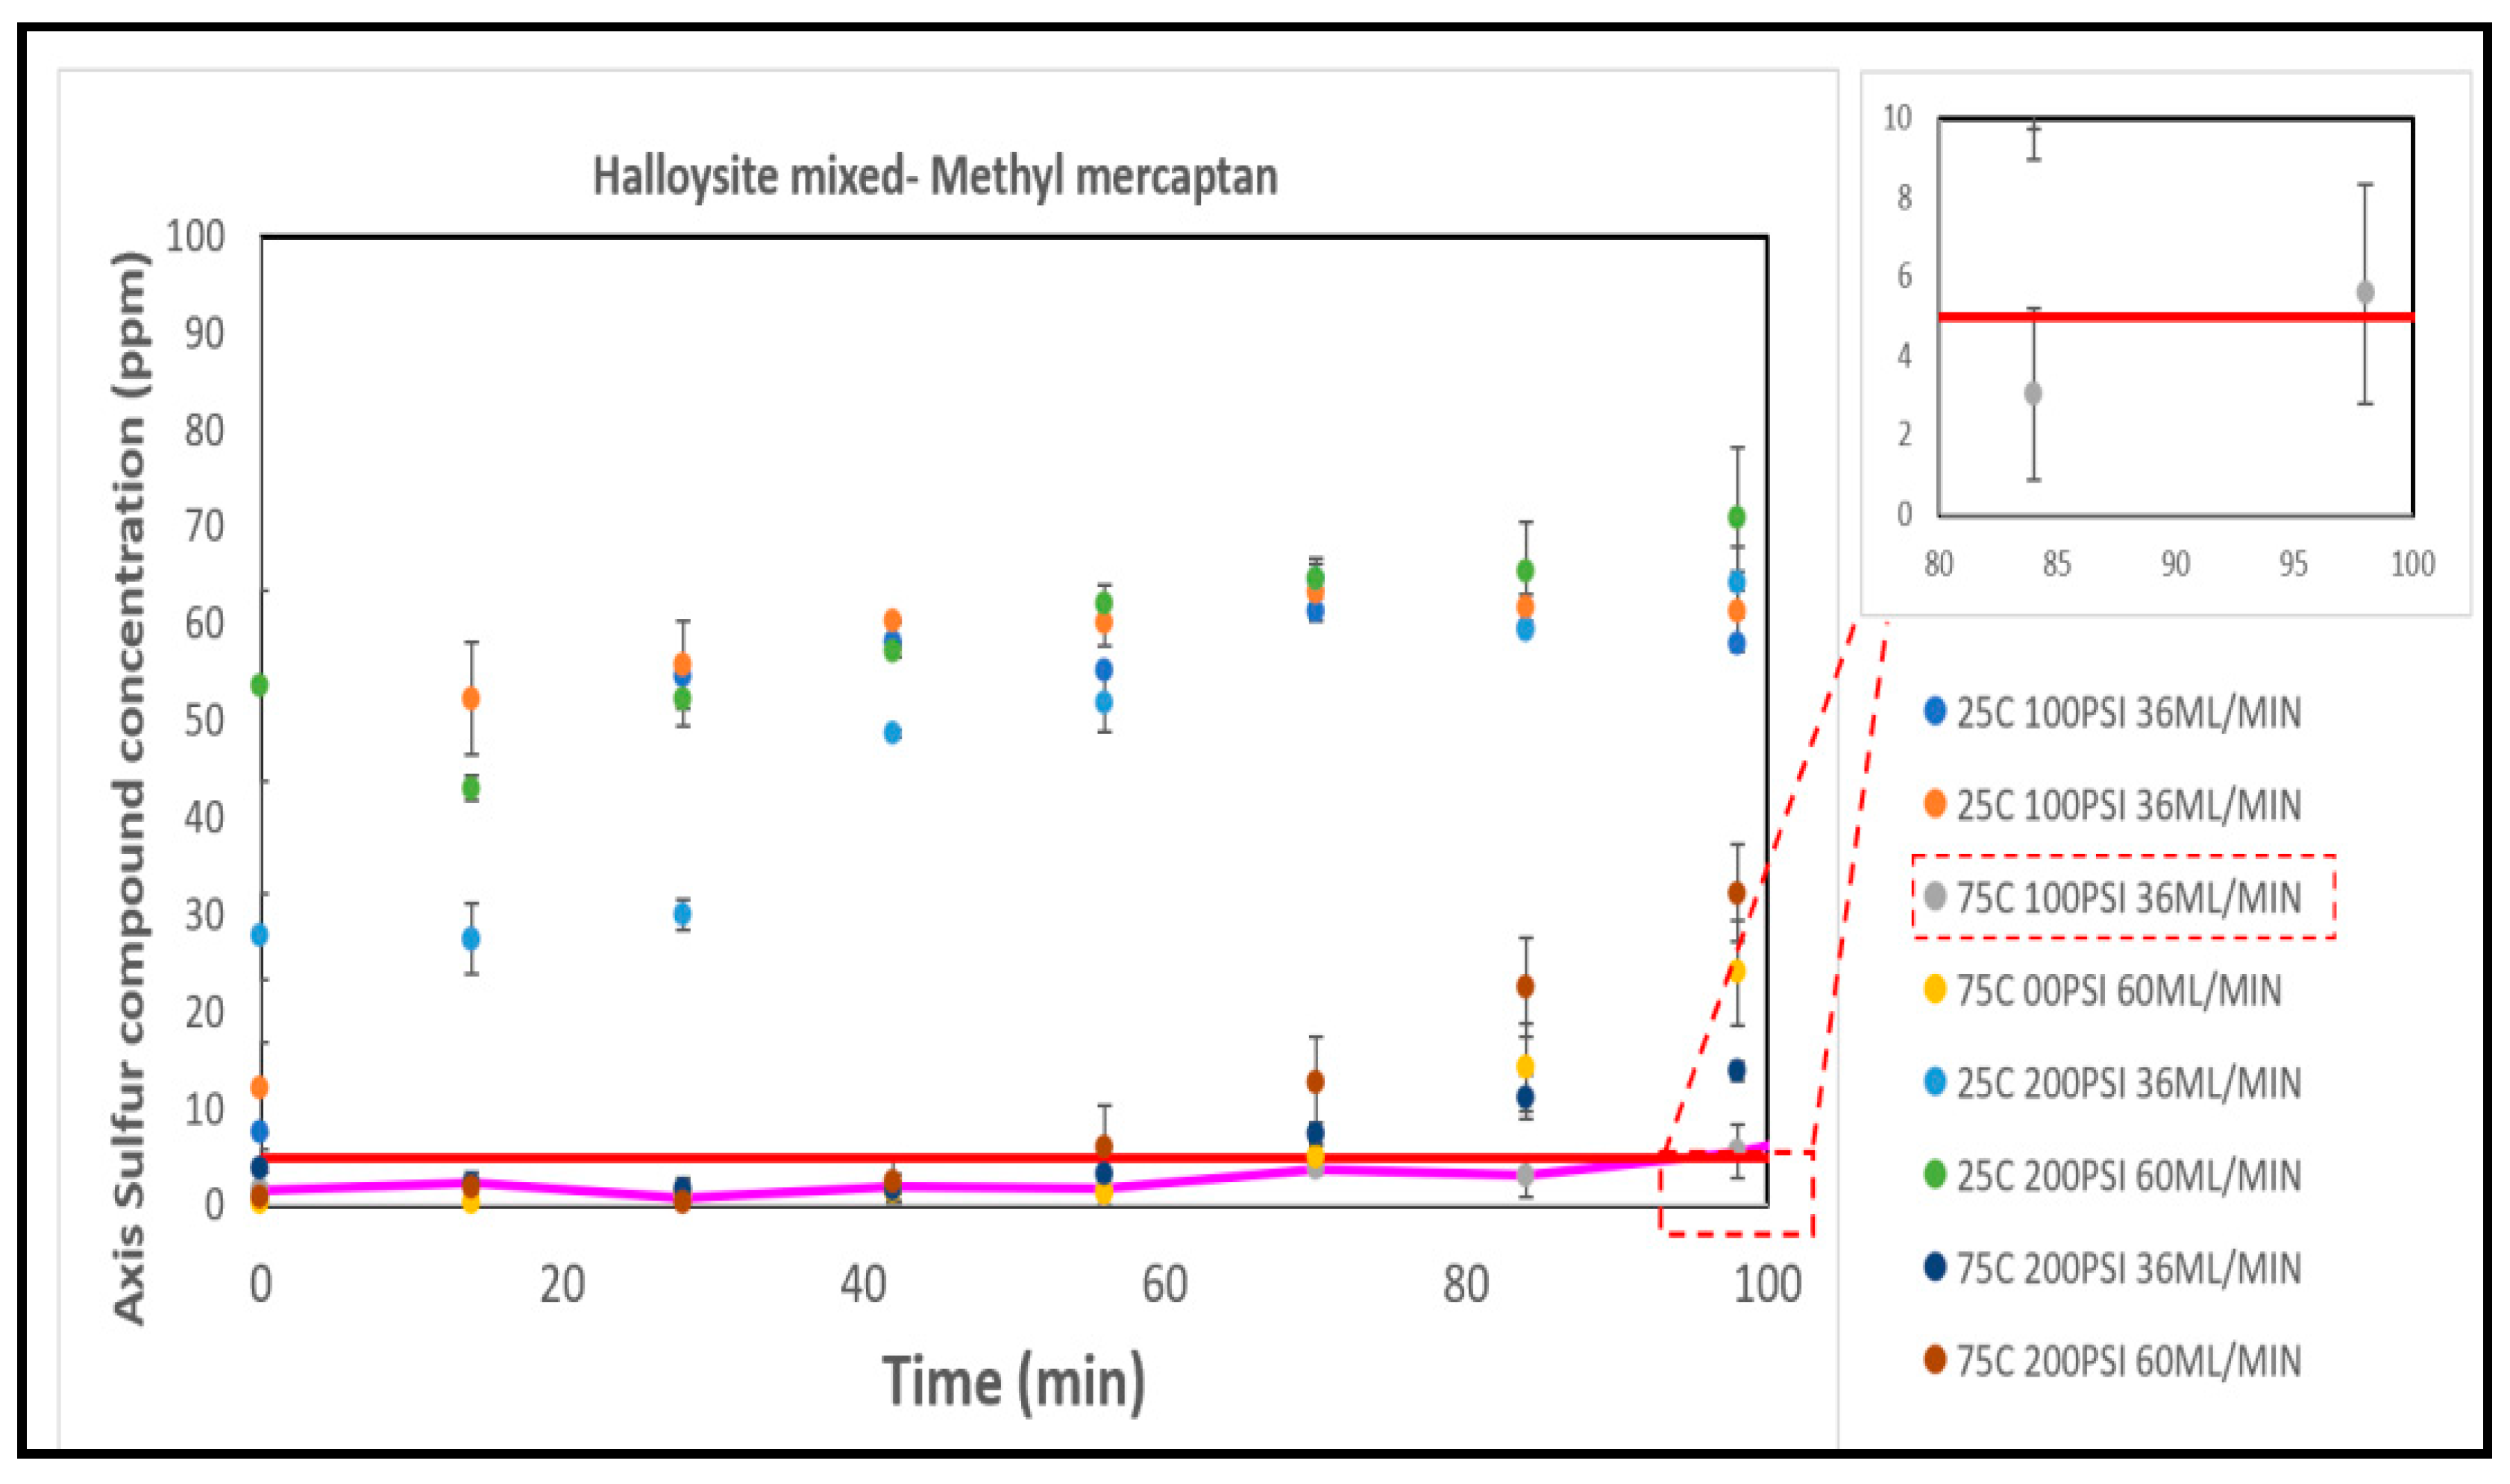
Figure 12.
(a) Best sulfur capacities for each commercial catalyst and (b) Breakthrough curves for the best results of each catalyst.
Figure 12.
(a) Best sulfur capacities for each commercial catalyst and (b) Breakthrough curves for the best results of each catalyst.
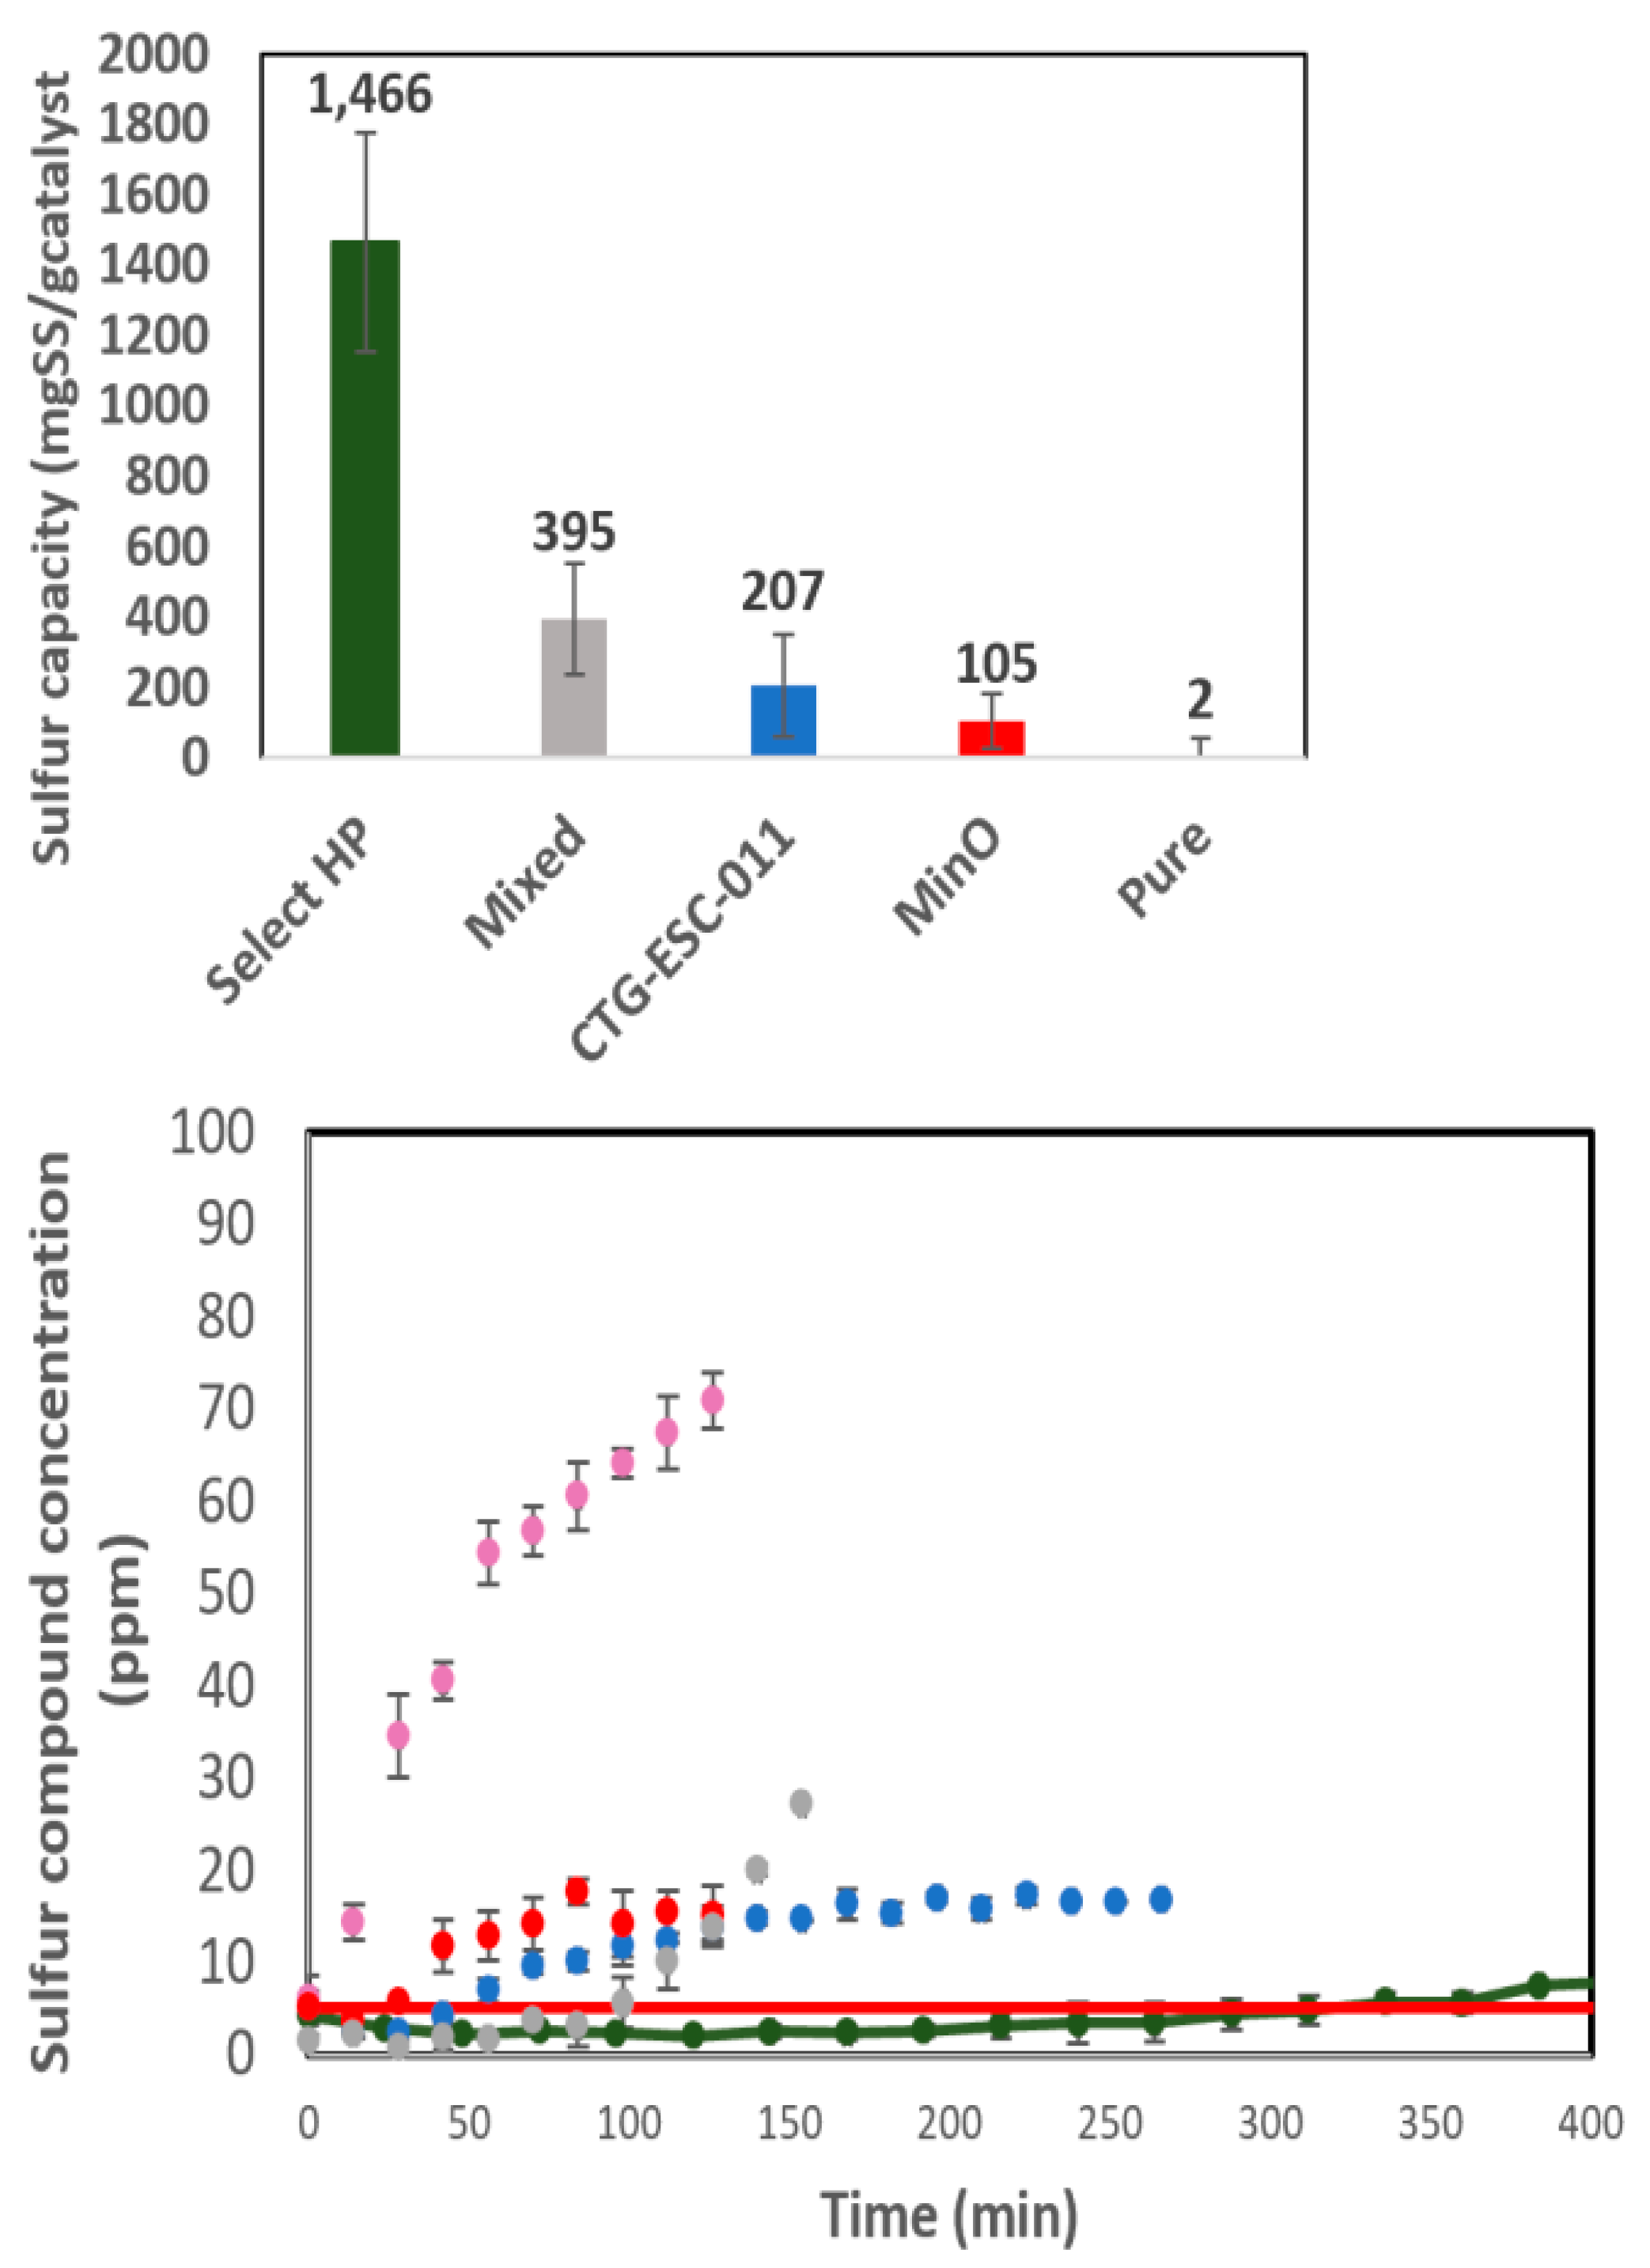
Figure 13.
(a) Cu one factor model graph for methyl mercaptan removal, and (b) Mg one factor model graph for methyl mercaptan removal.
Figure 13.
(a) Cu one factor model graph for methyl mercaptan removal, and (b) Mg one factor model graph for methyl mercaptan removal.
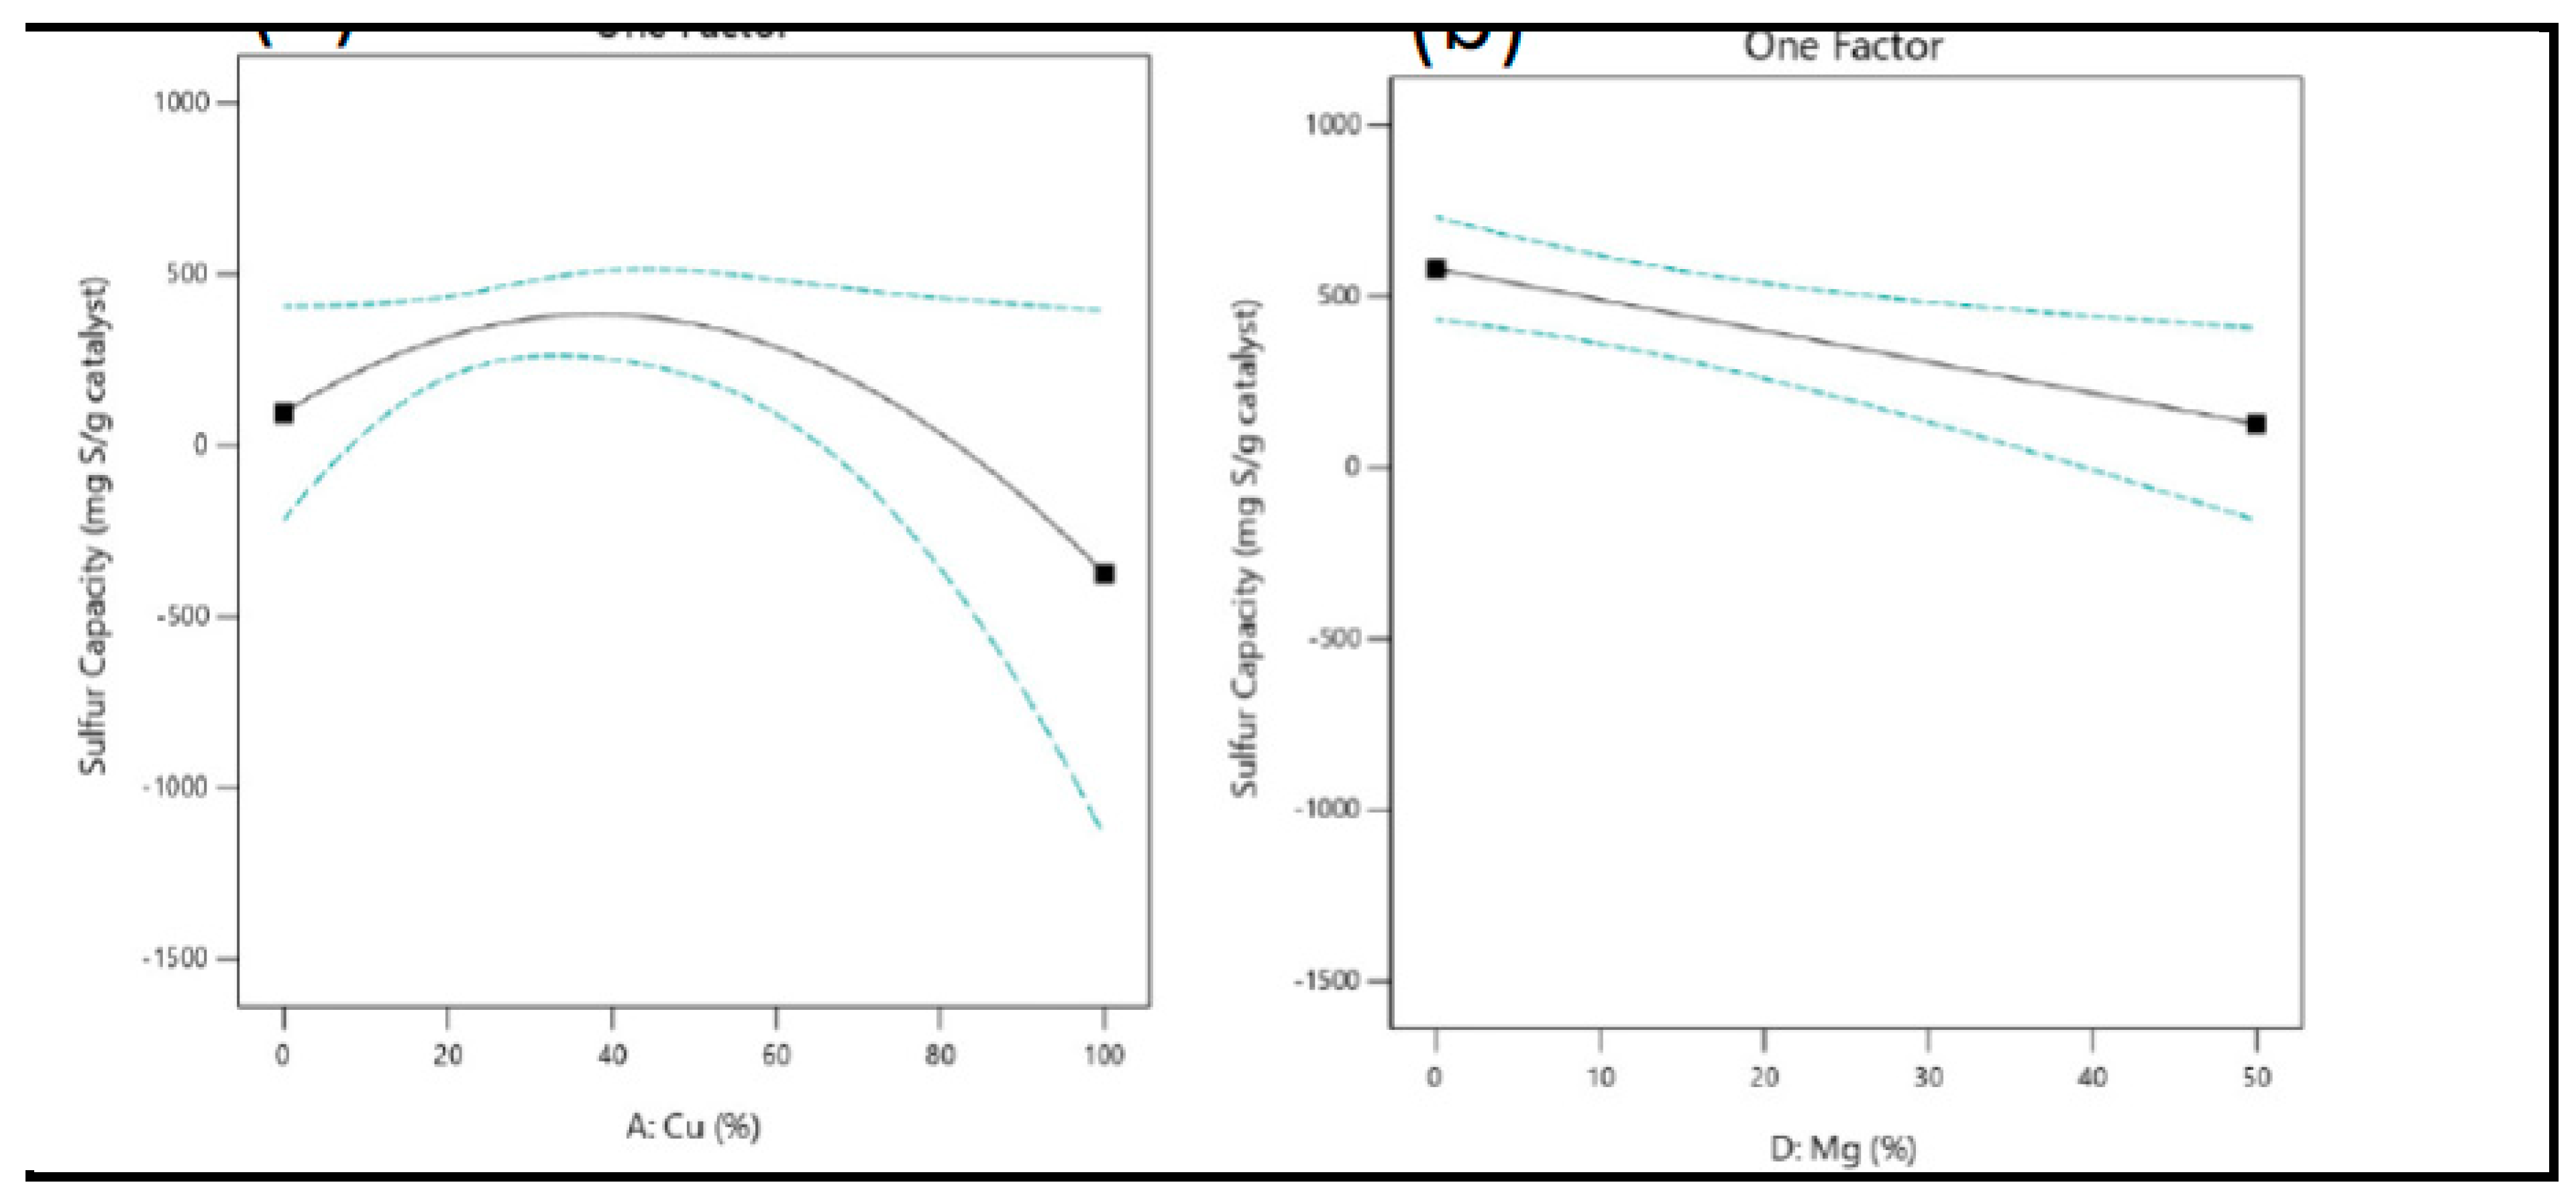
Figure 14.
3D response graph for sulfur capacity in methyl mercaptan removal versus concentrations of copper and Magnesium.
Figure 14.
3D response graph for sulfur capacity in methyl mercaptan removal versus concentrations of copper and Magnesium.
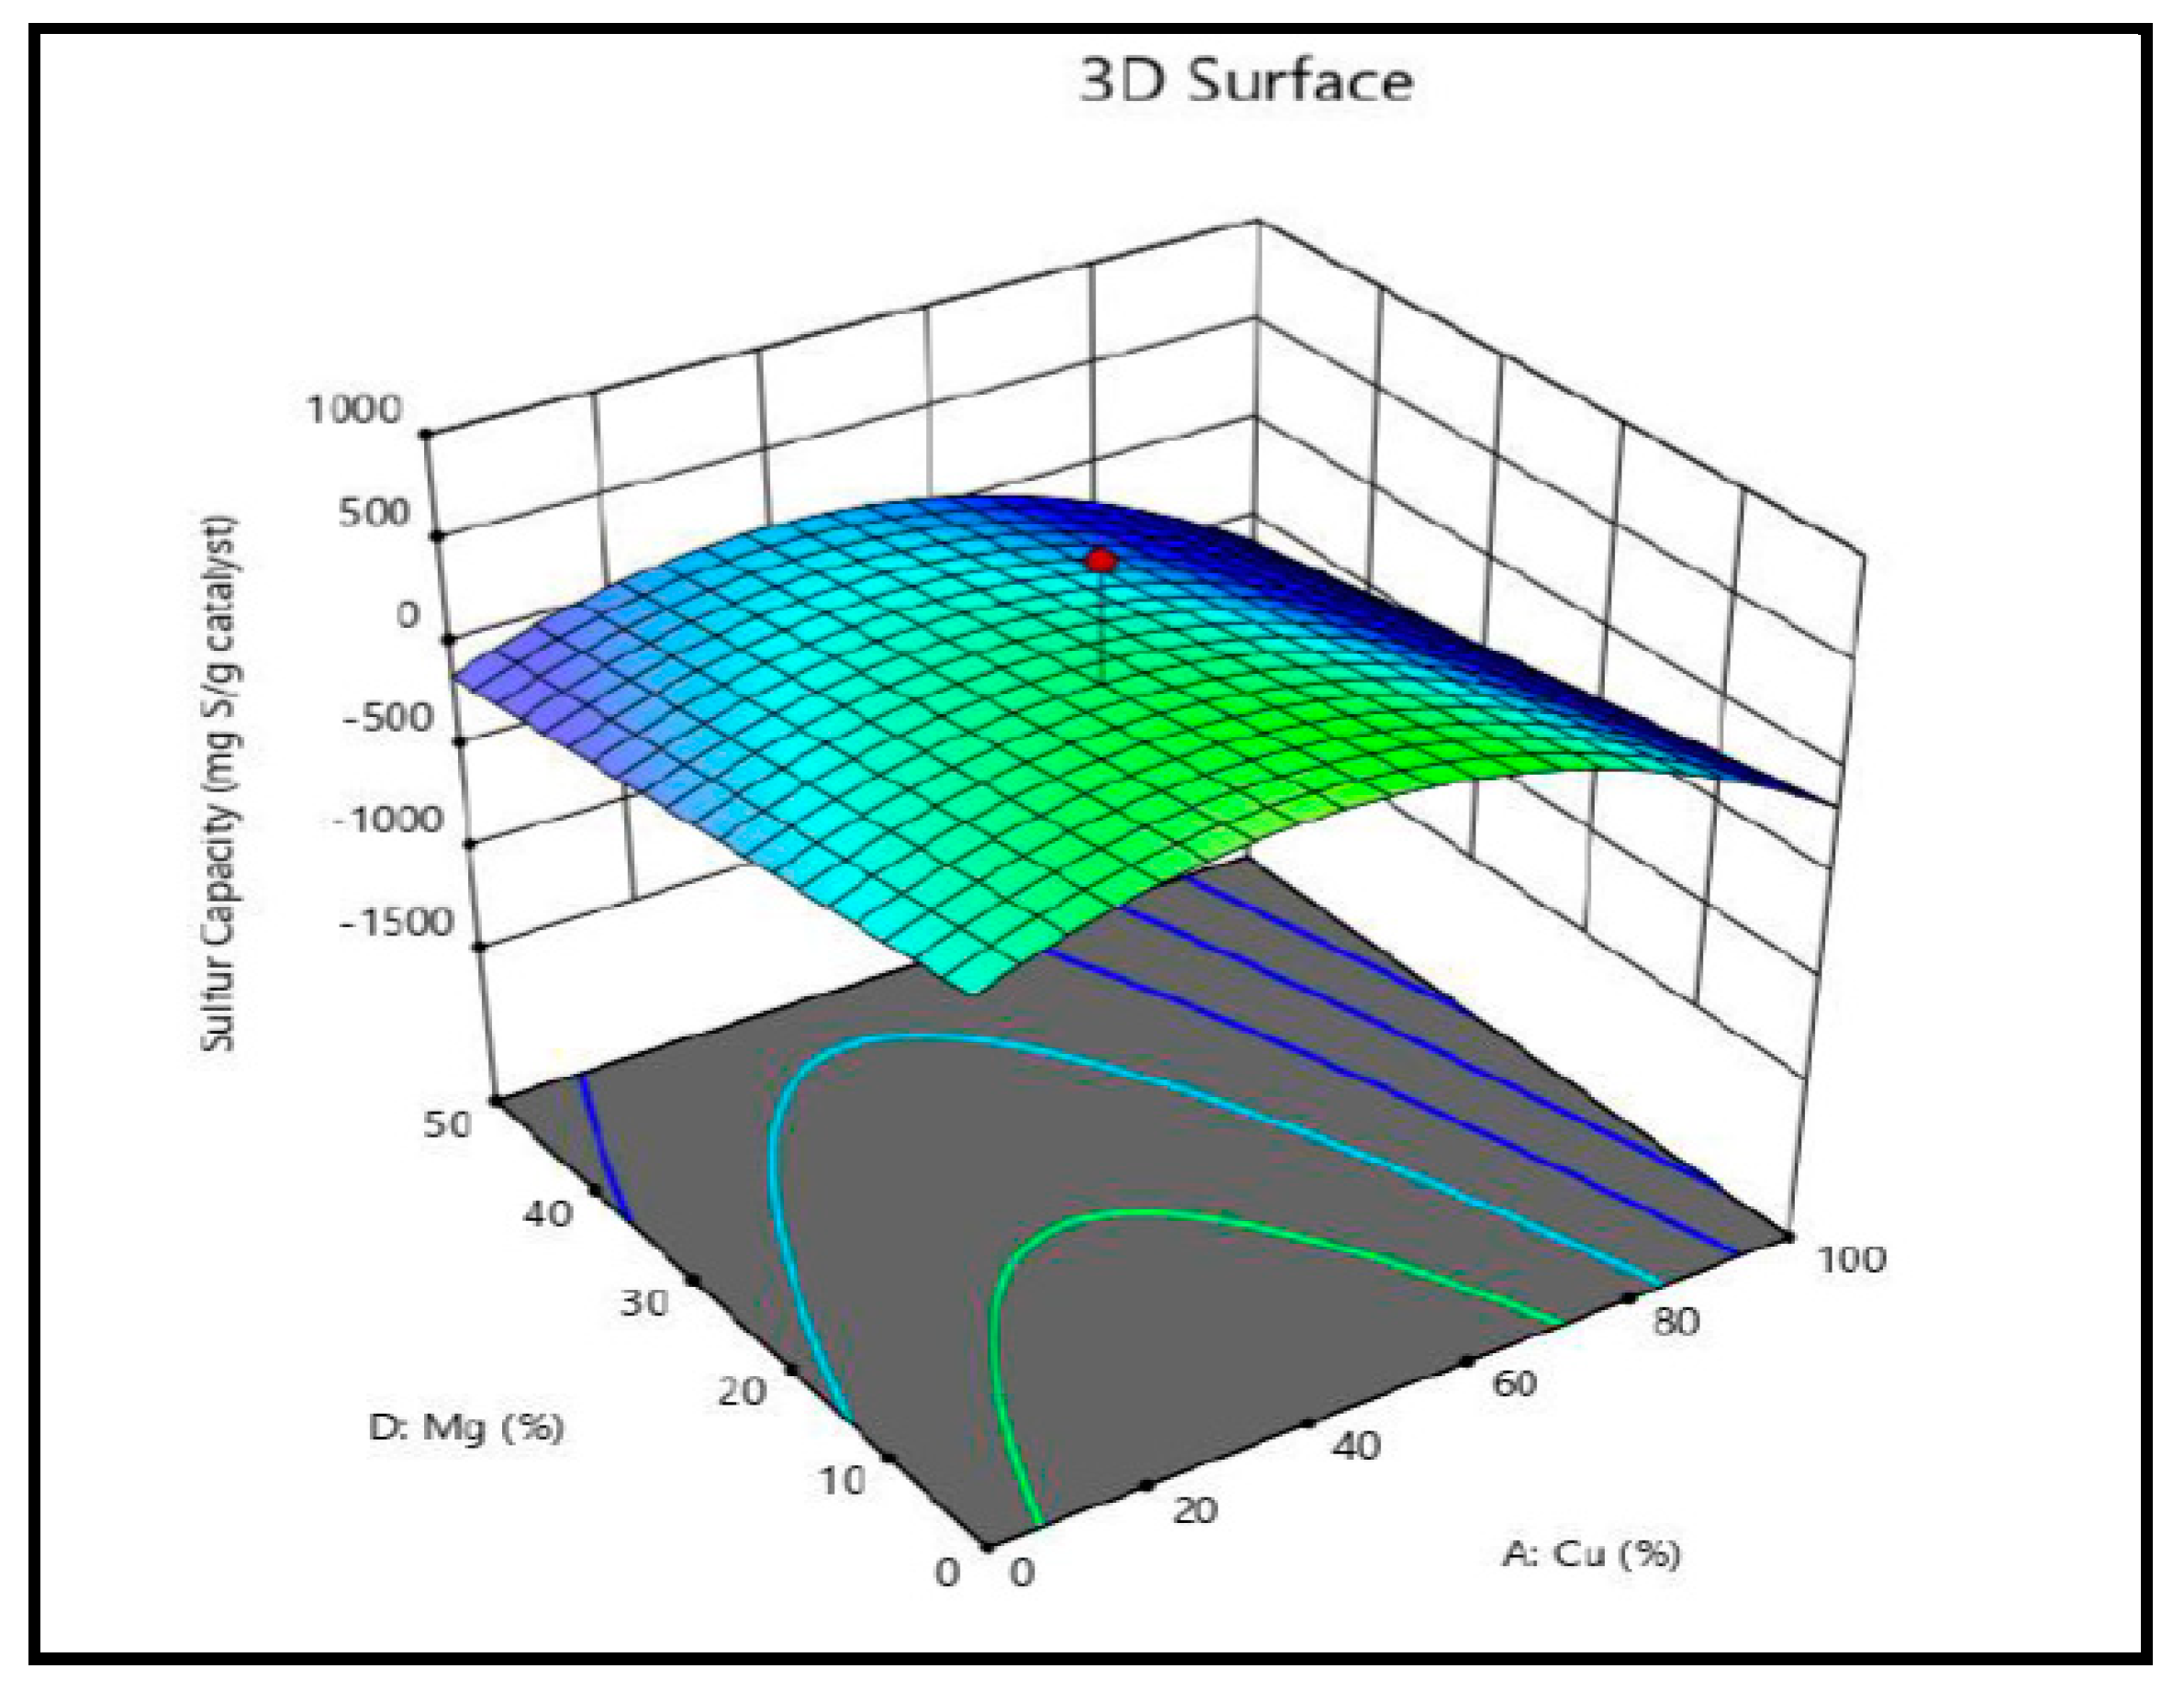
Figure 15.
Breakthrough curves for UL-Best catalyst vs Select HP at 200 psi, 25°C, 36 ml/min, and 200 ppm CH3SH.
Figure 15.
Breakthrough curves for UL-Best catalyst vs Select HP at 200 psi, 25°C, 36 ml/min, and 200 ppm CH3SH.
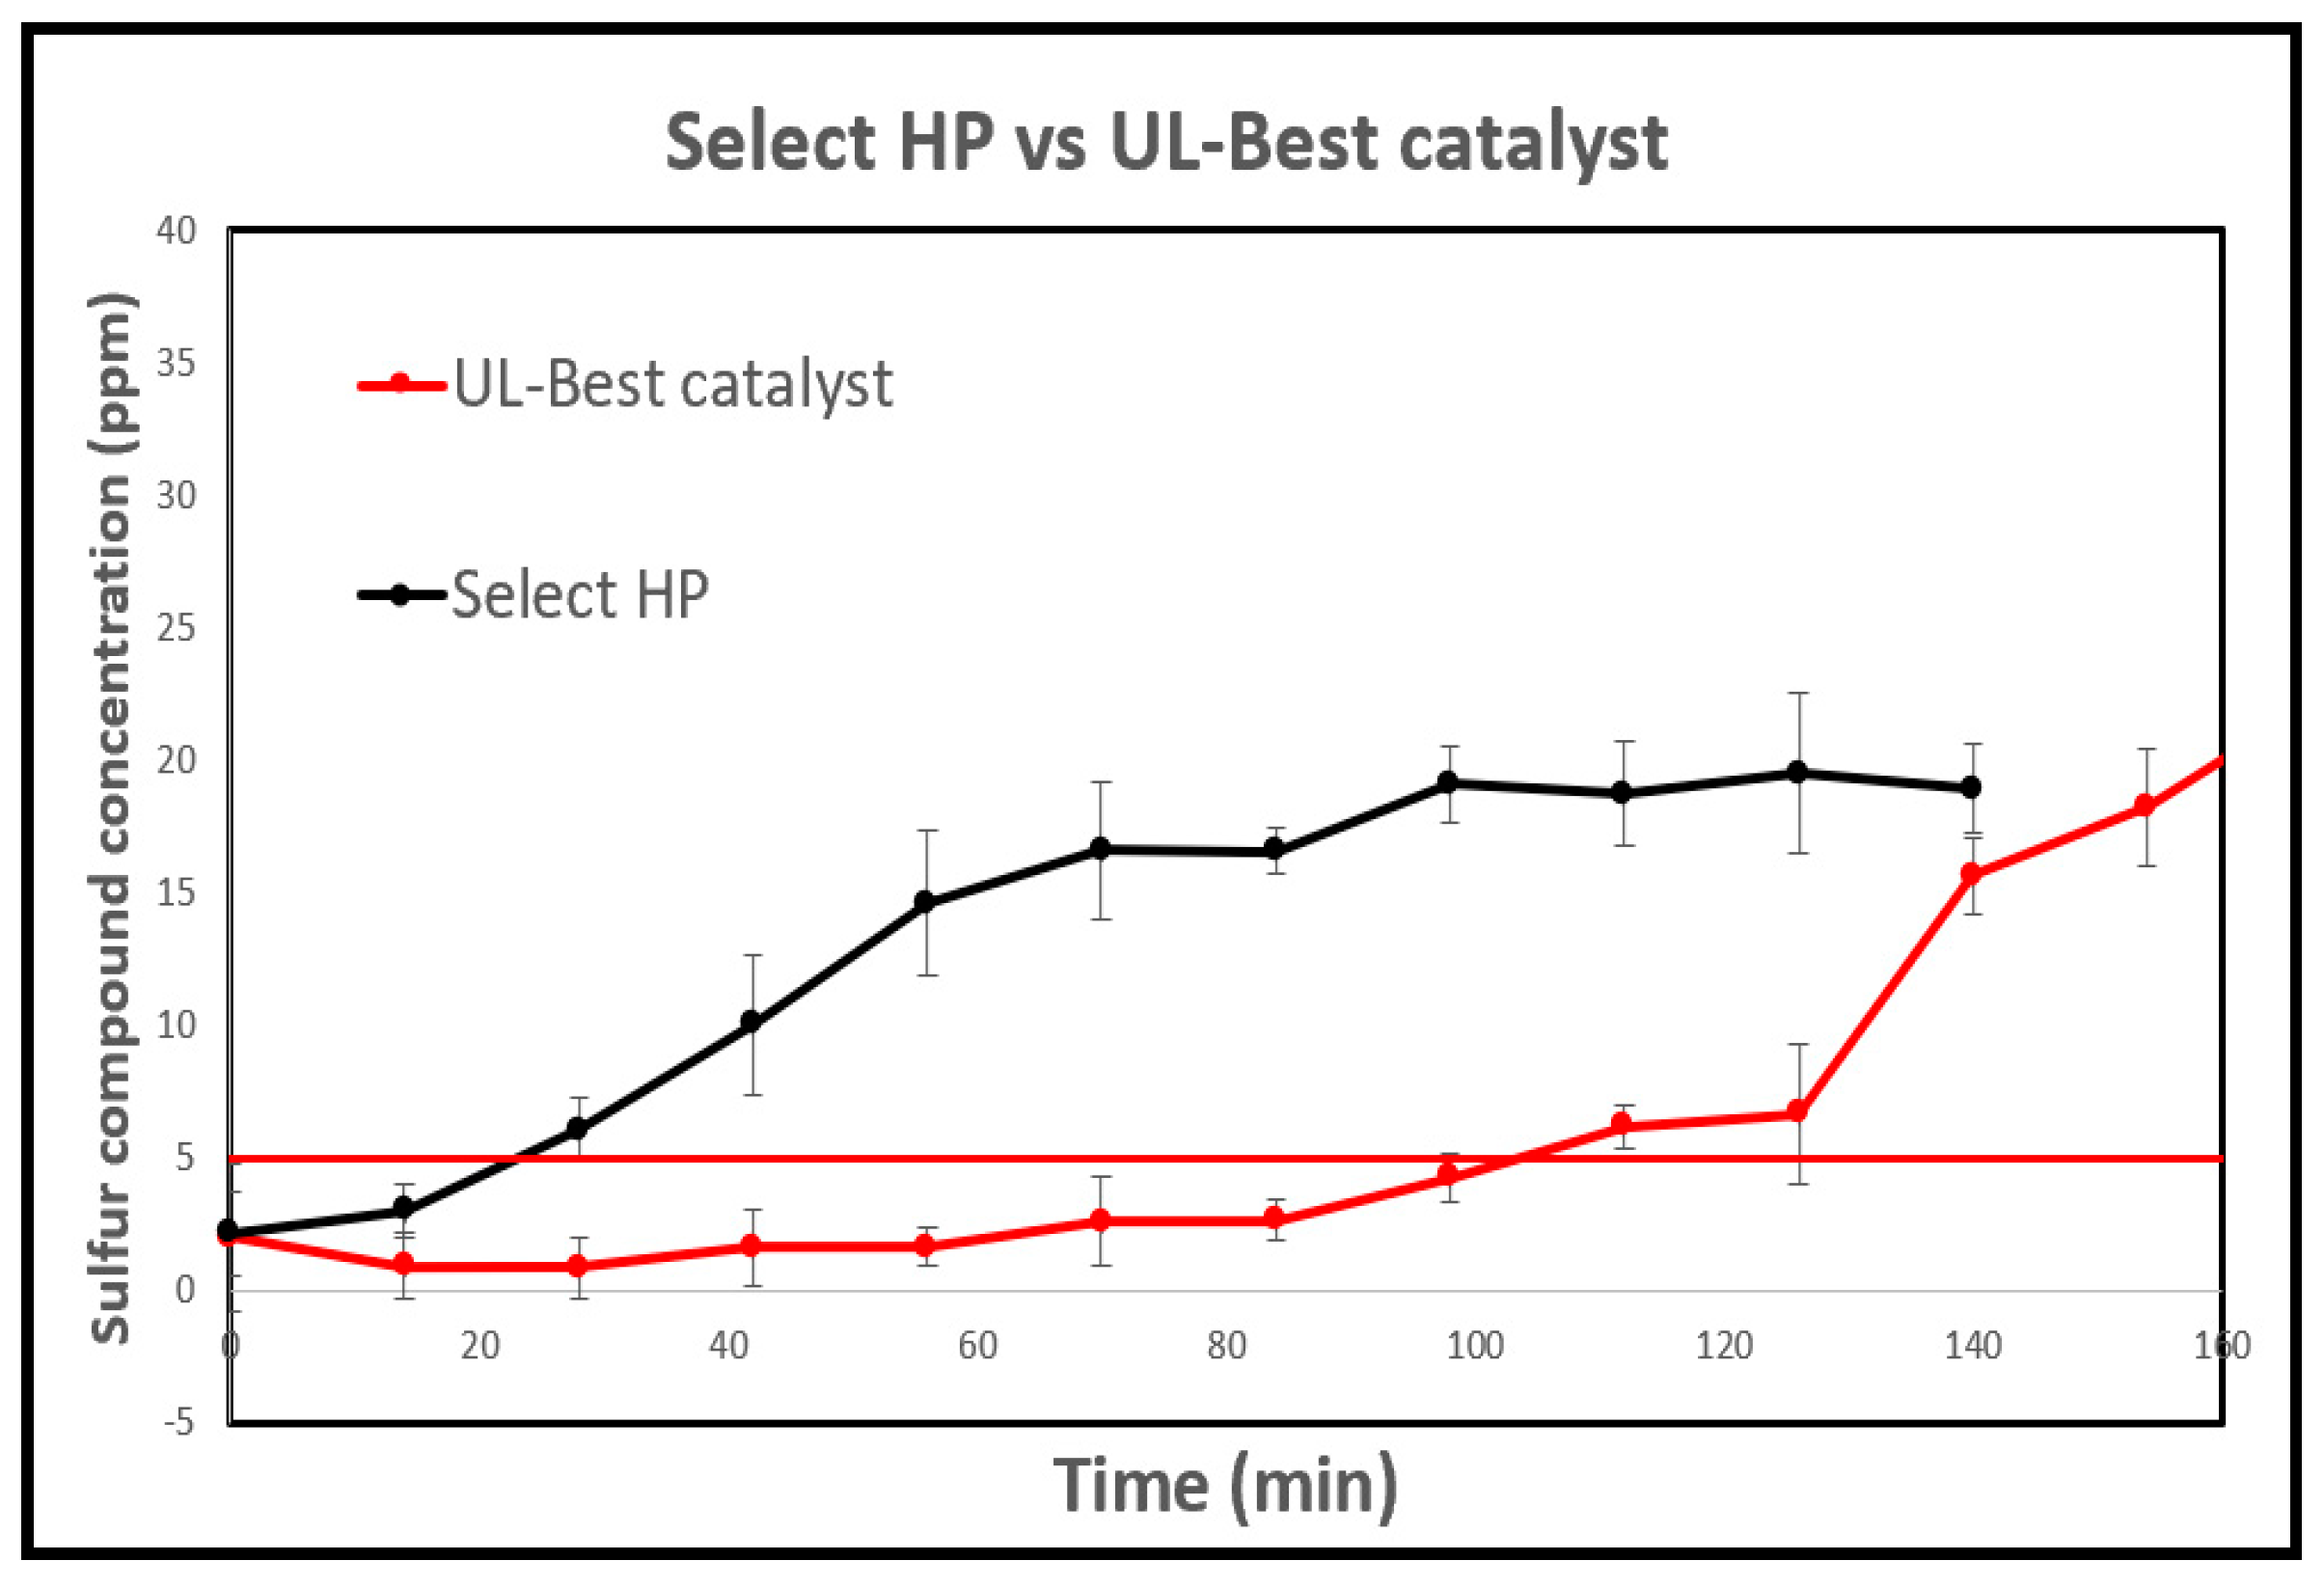
Figure 16.
Breakthrough curves for UL-Best catalyst vs Select HP at different temperatures.
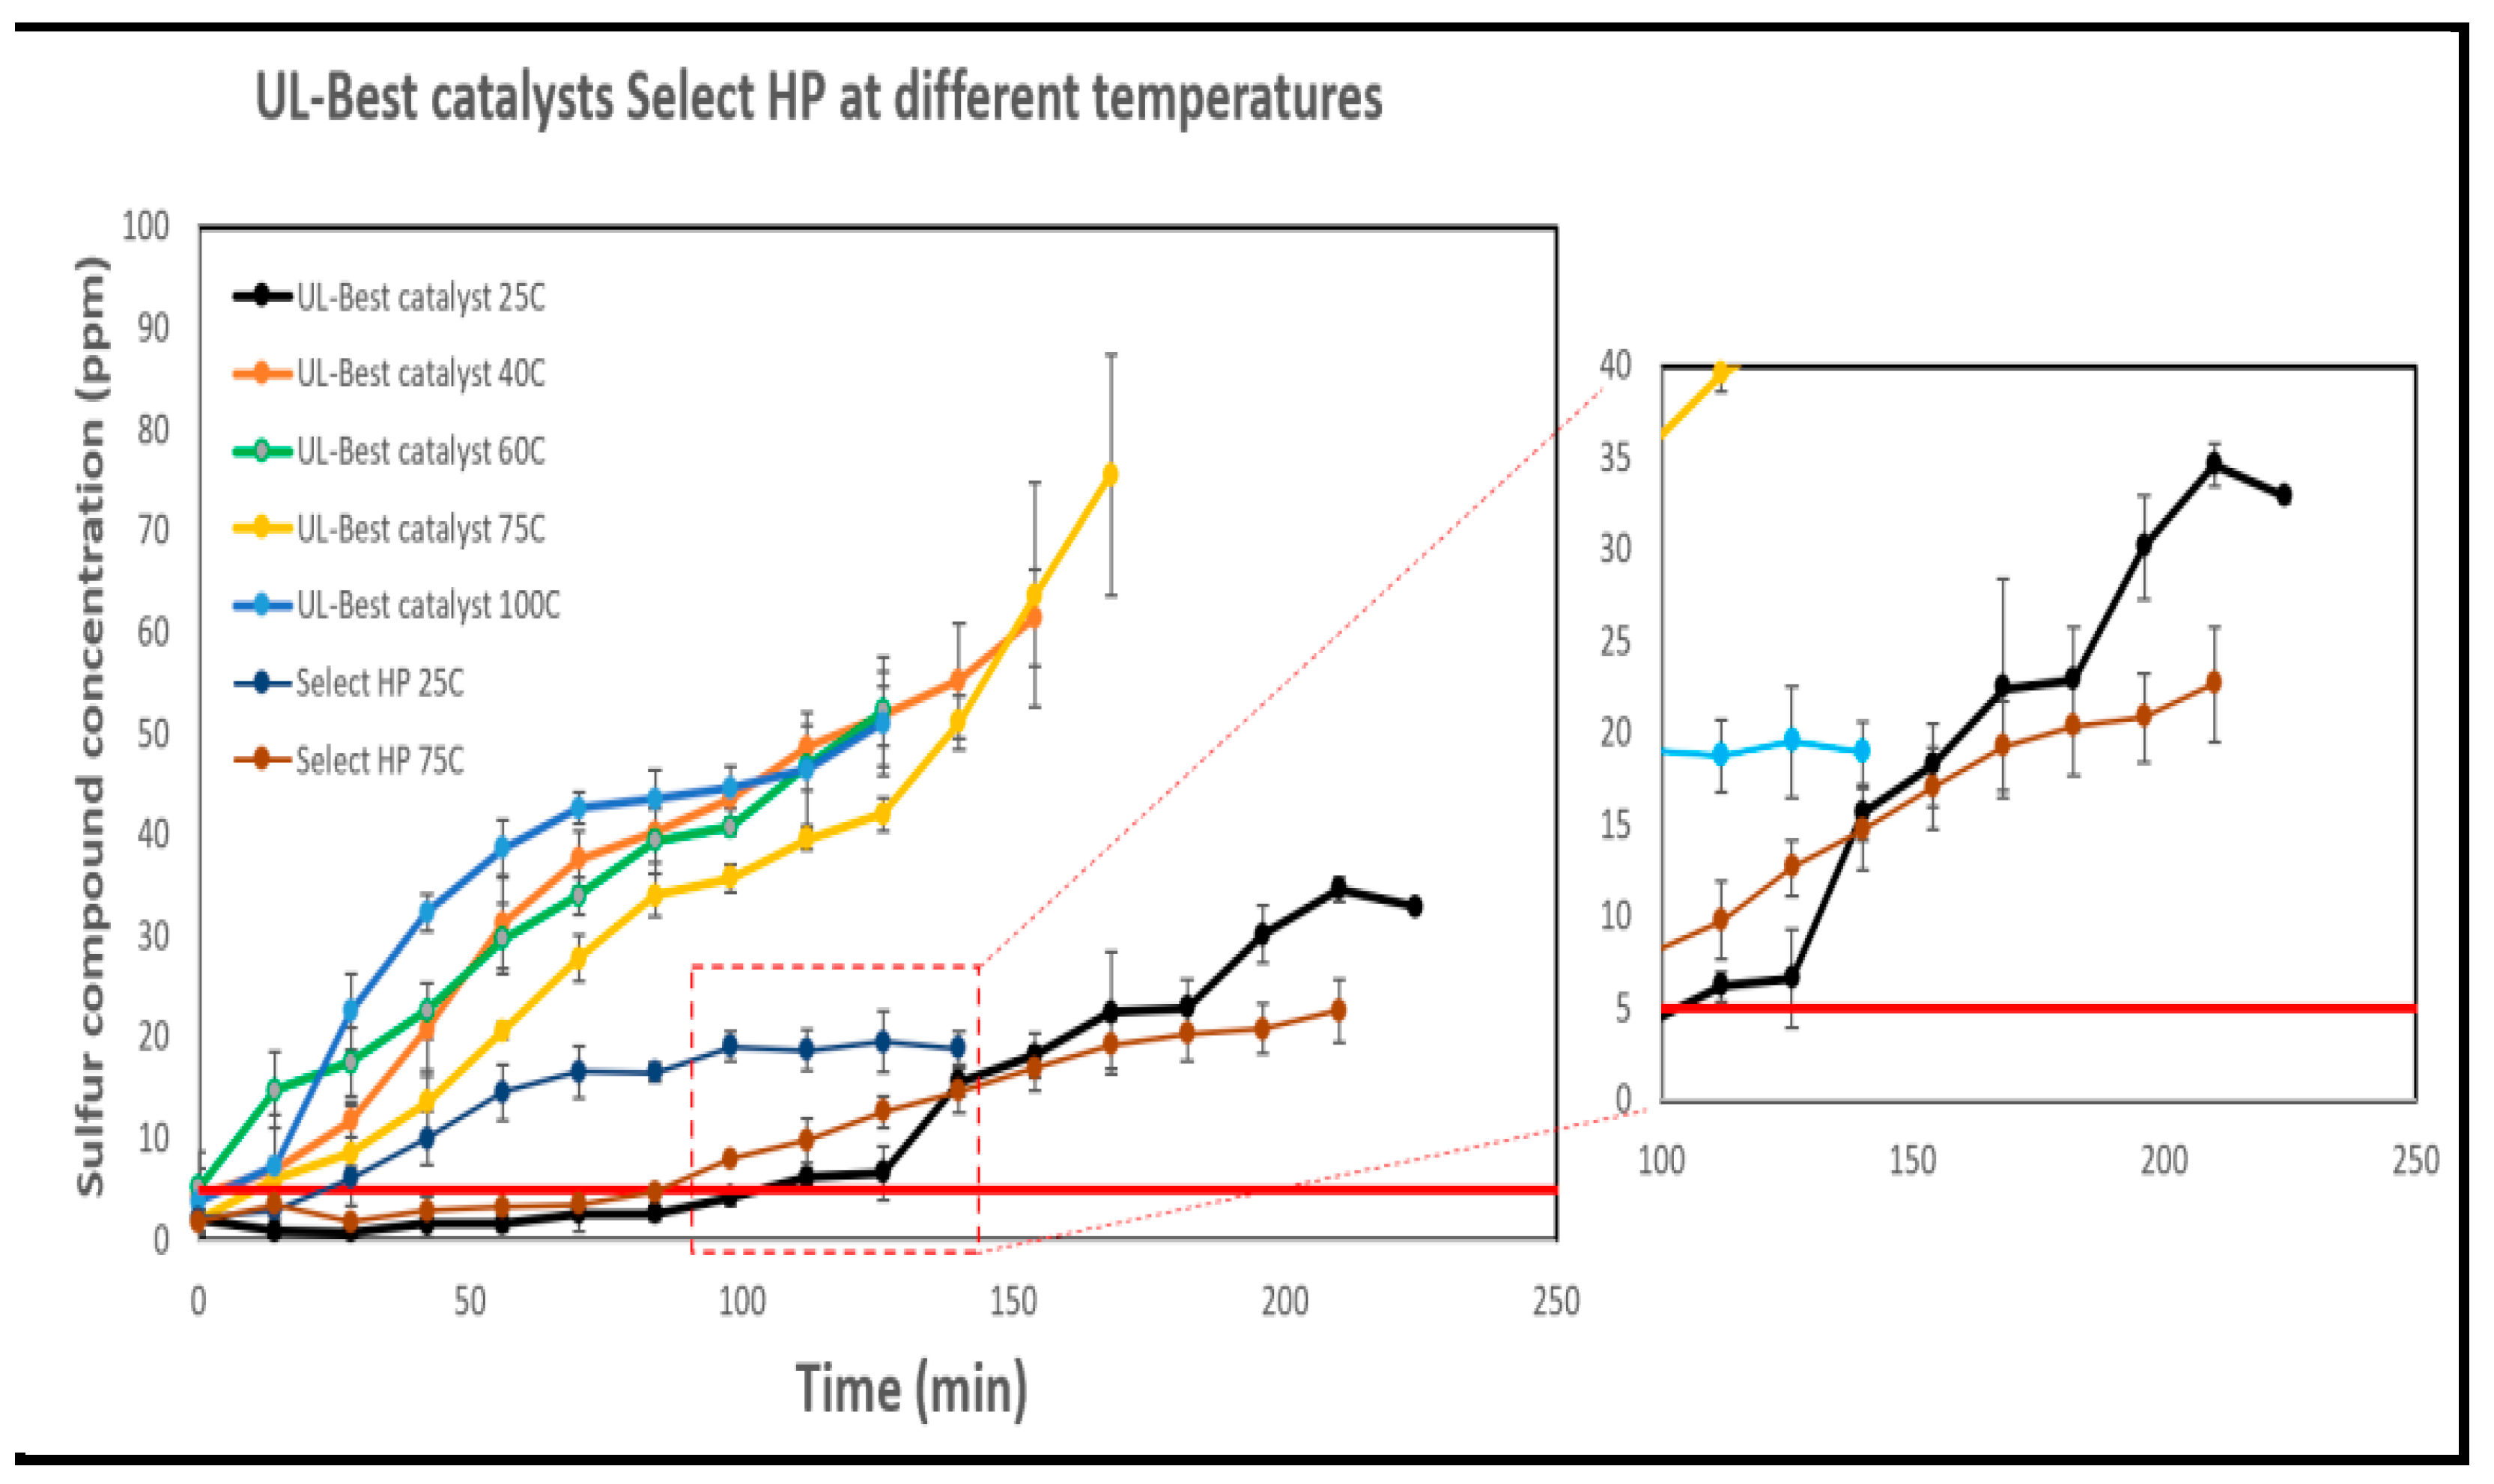
Figure 17.
SEM images and EDS spectra for (a, c) catalyst before use and (b, d) catalyst after use.
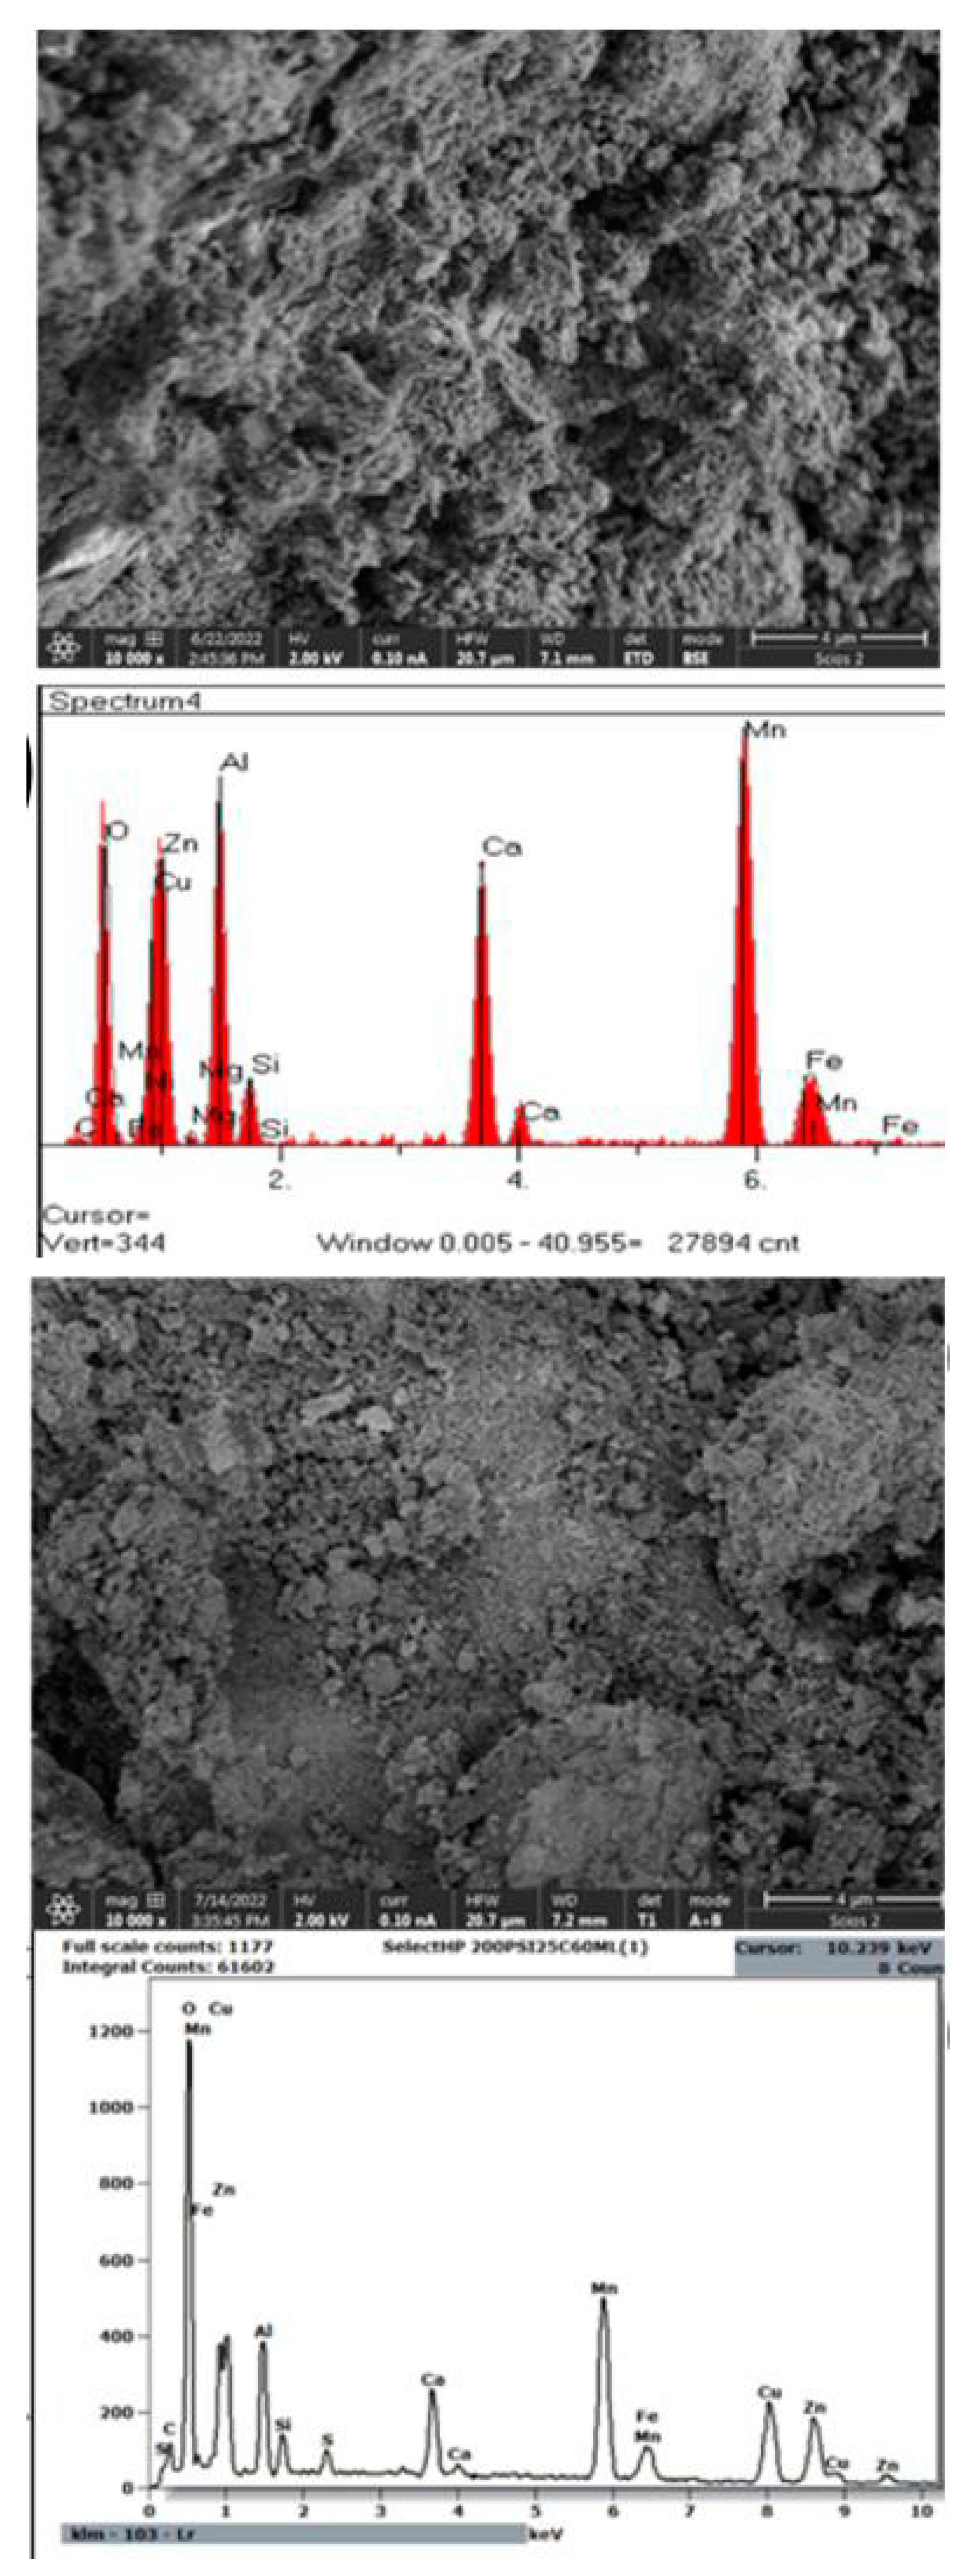
Figure 18.
Before and After XPS spectra of (a) Cu 2p, (b) Zn 2p, (c) Mn 2p, and (d) S 2p.
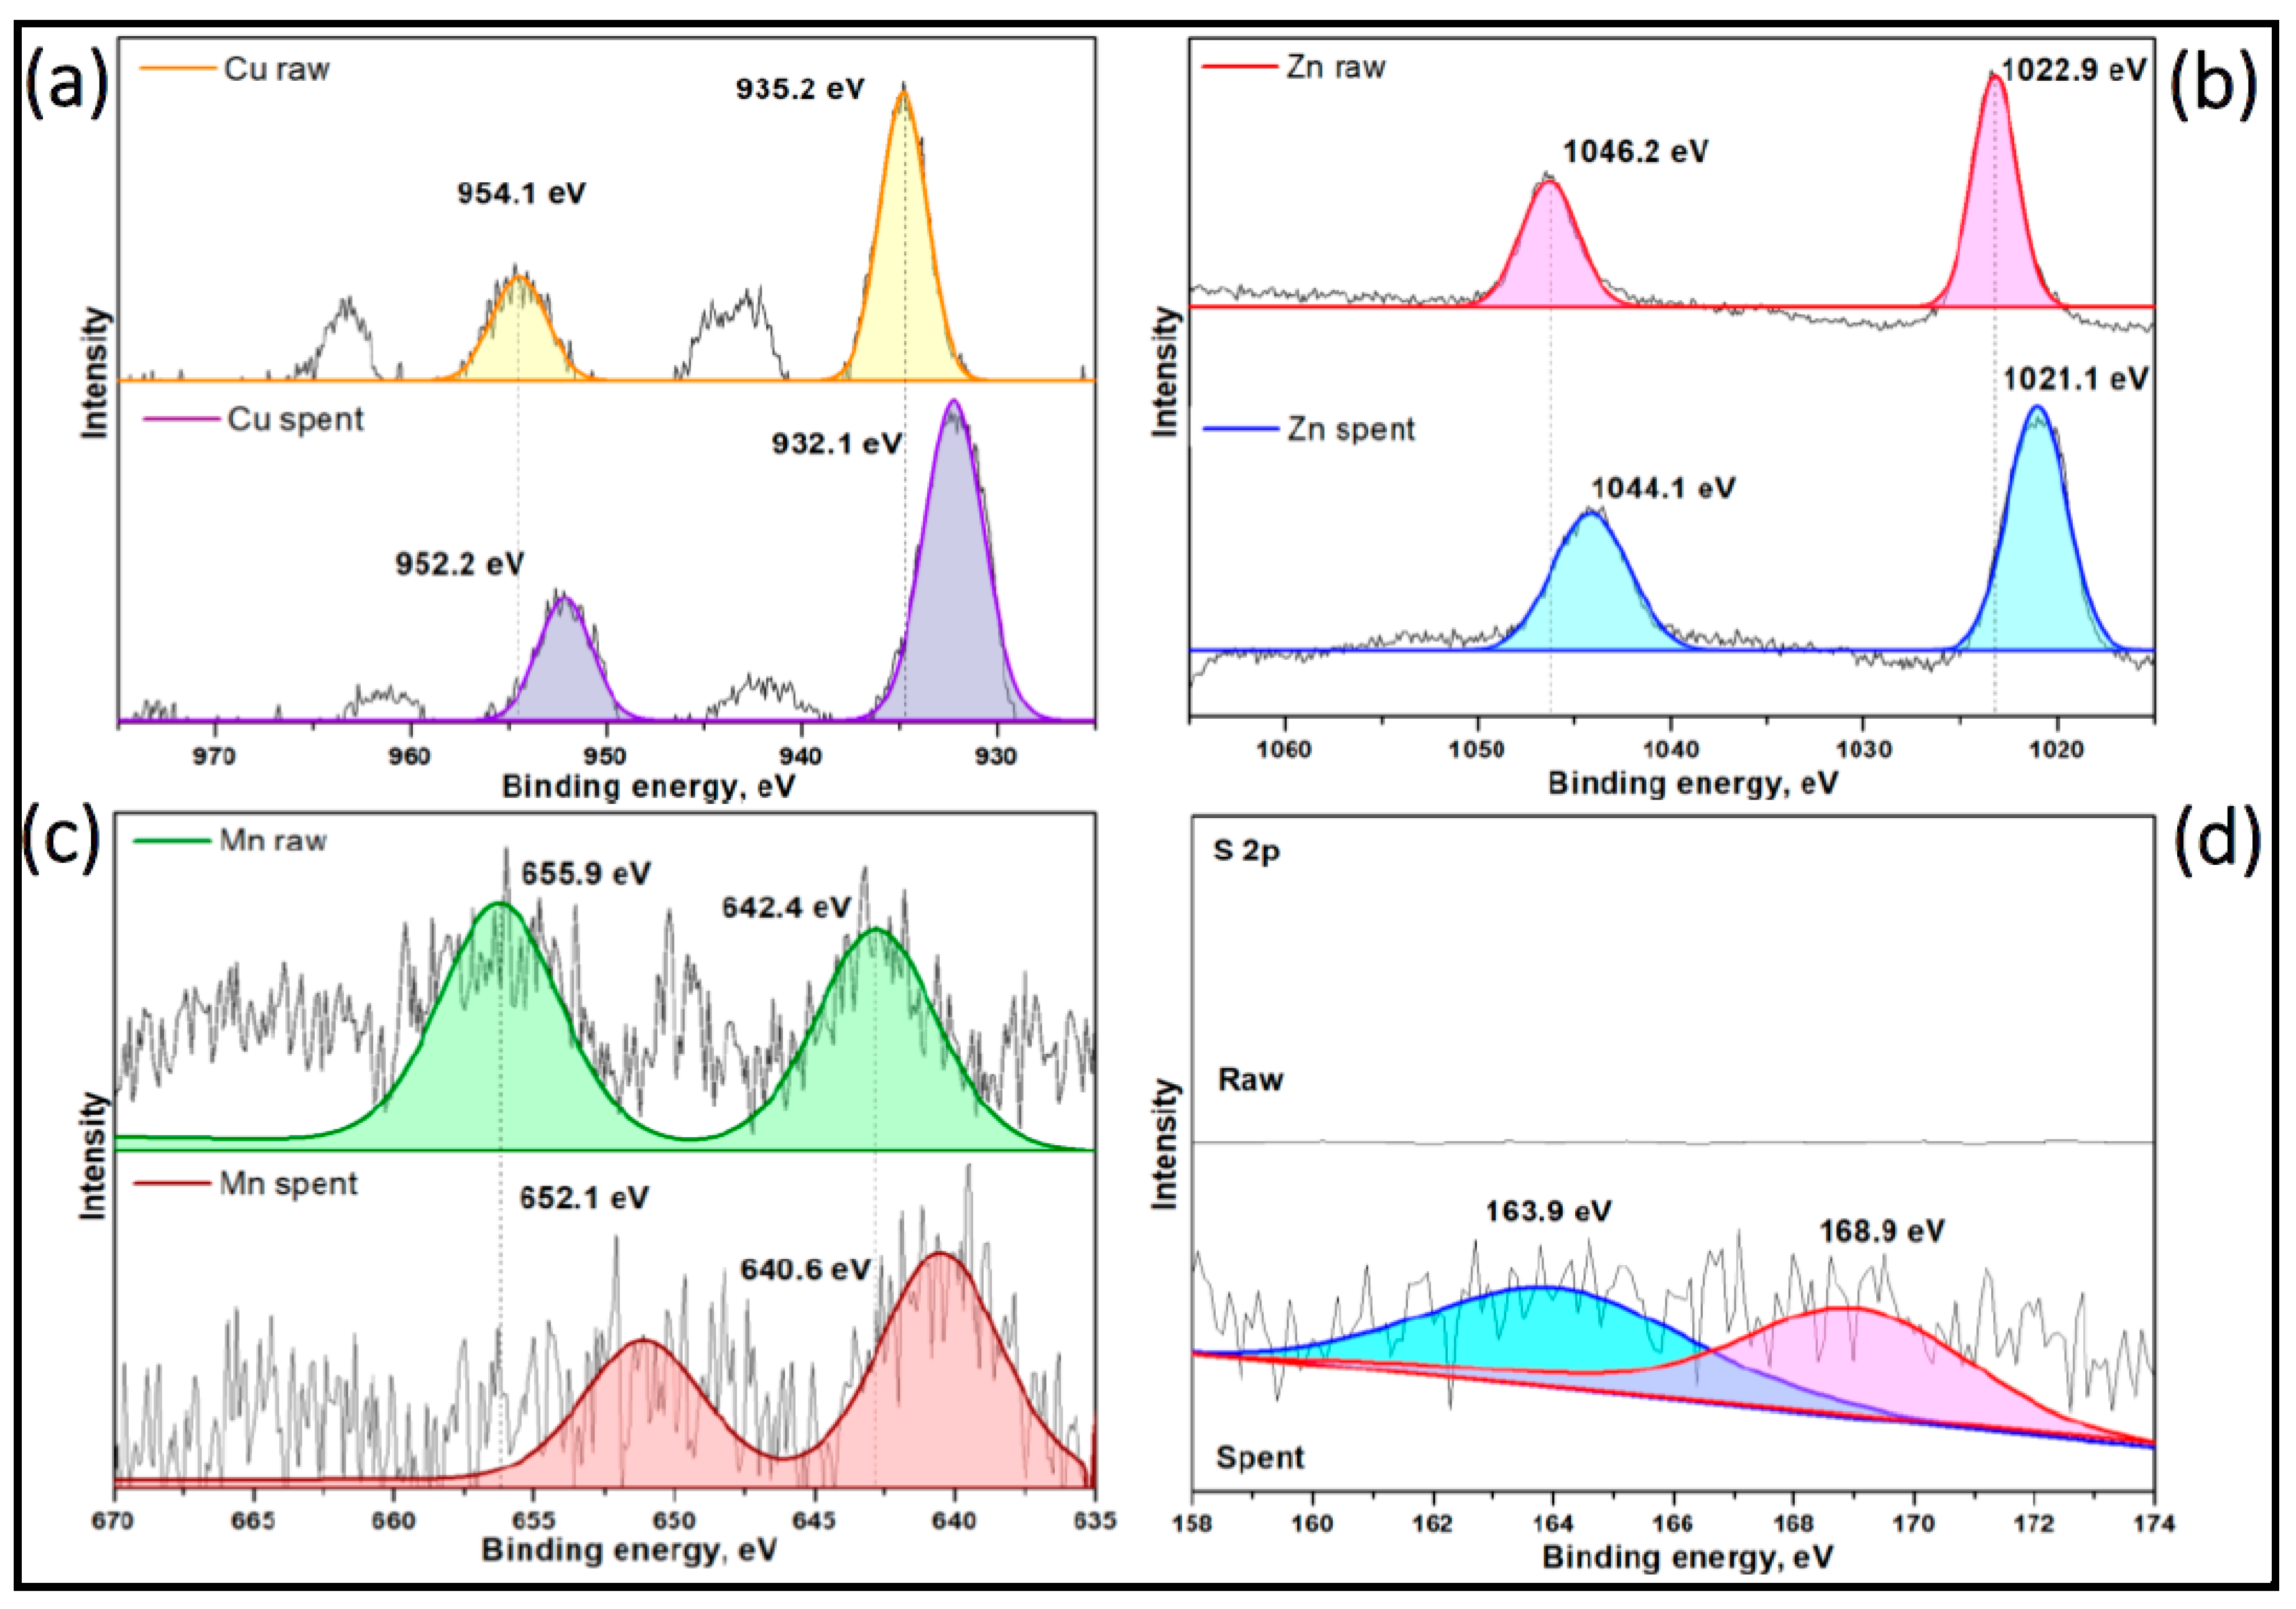
Figure 19.
FT-IR spectrum of Raw Select HP and Spent Select HP.
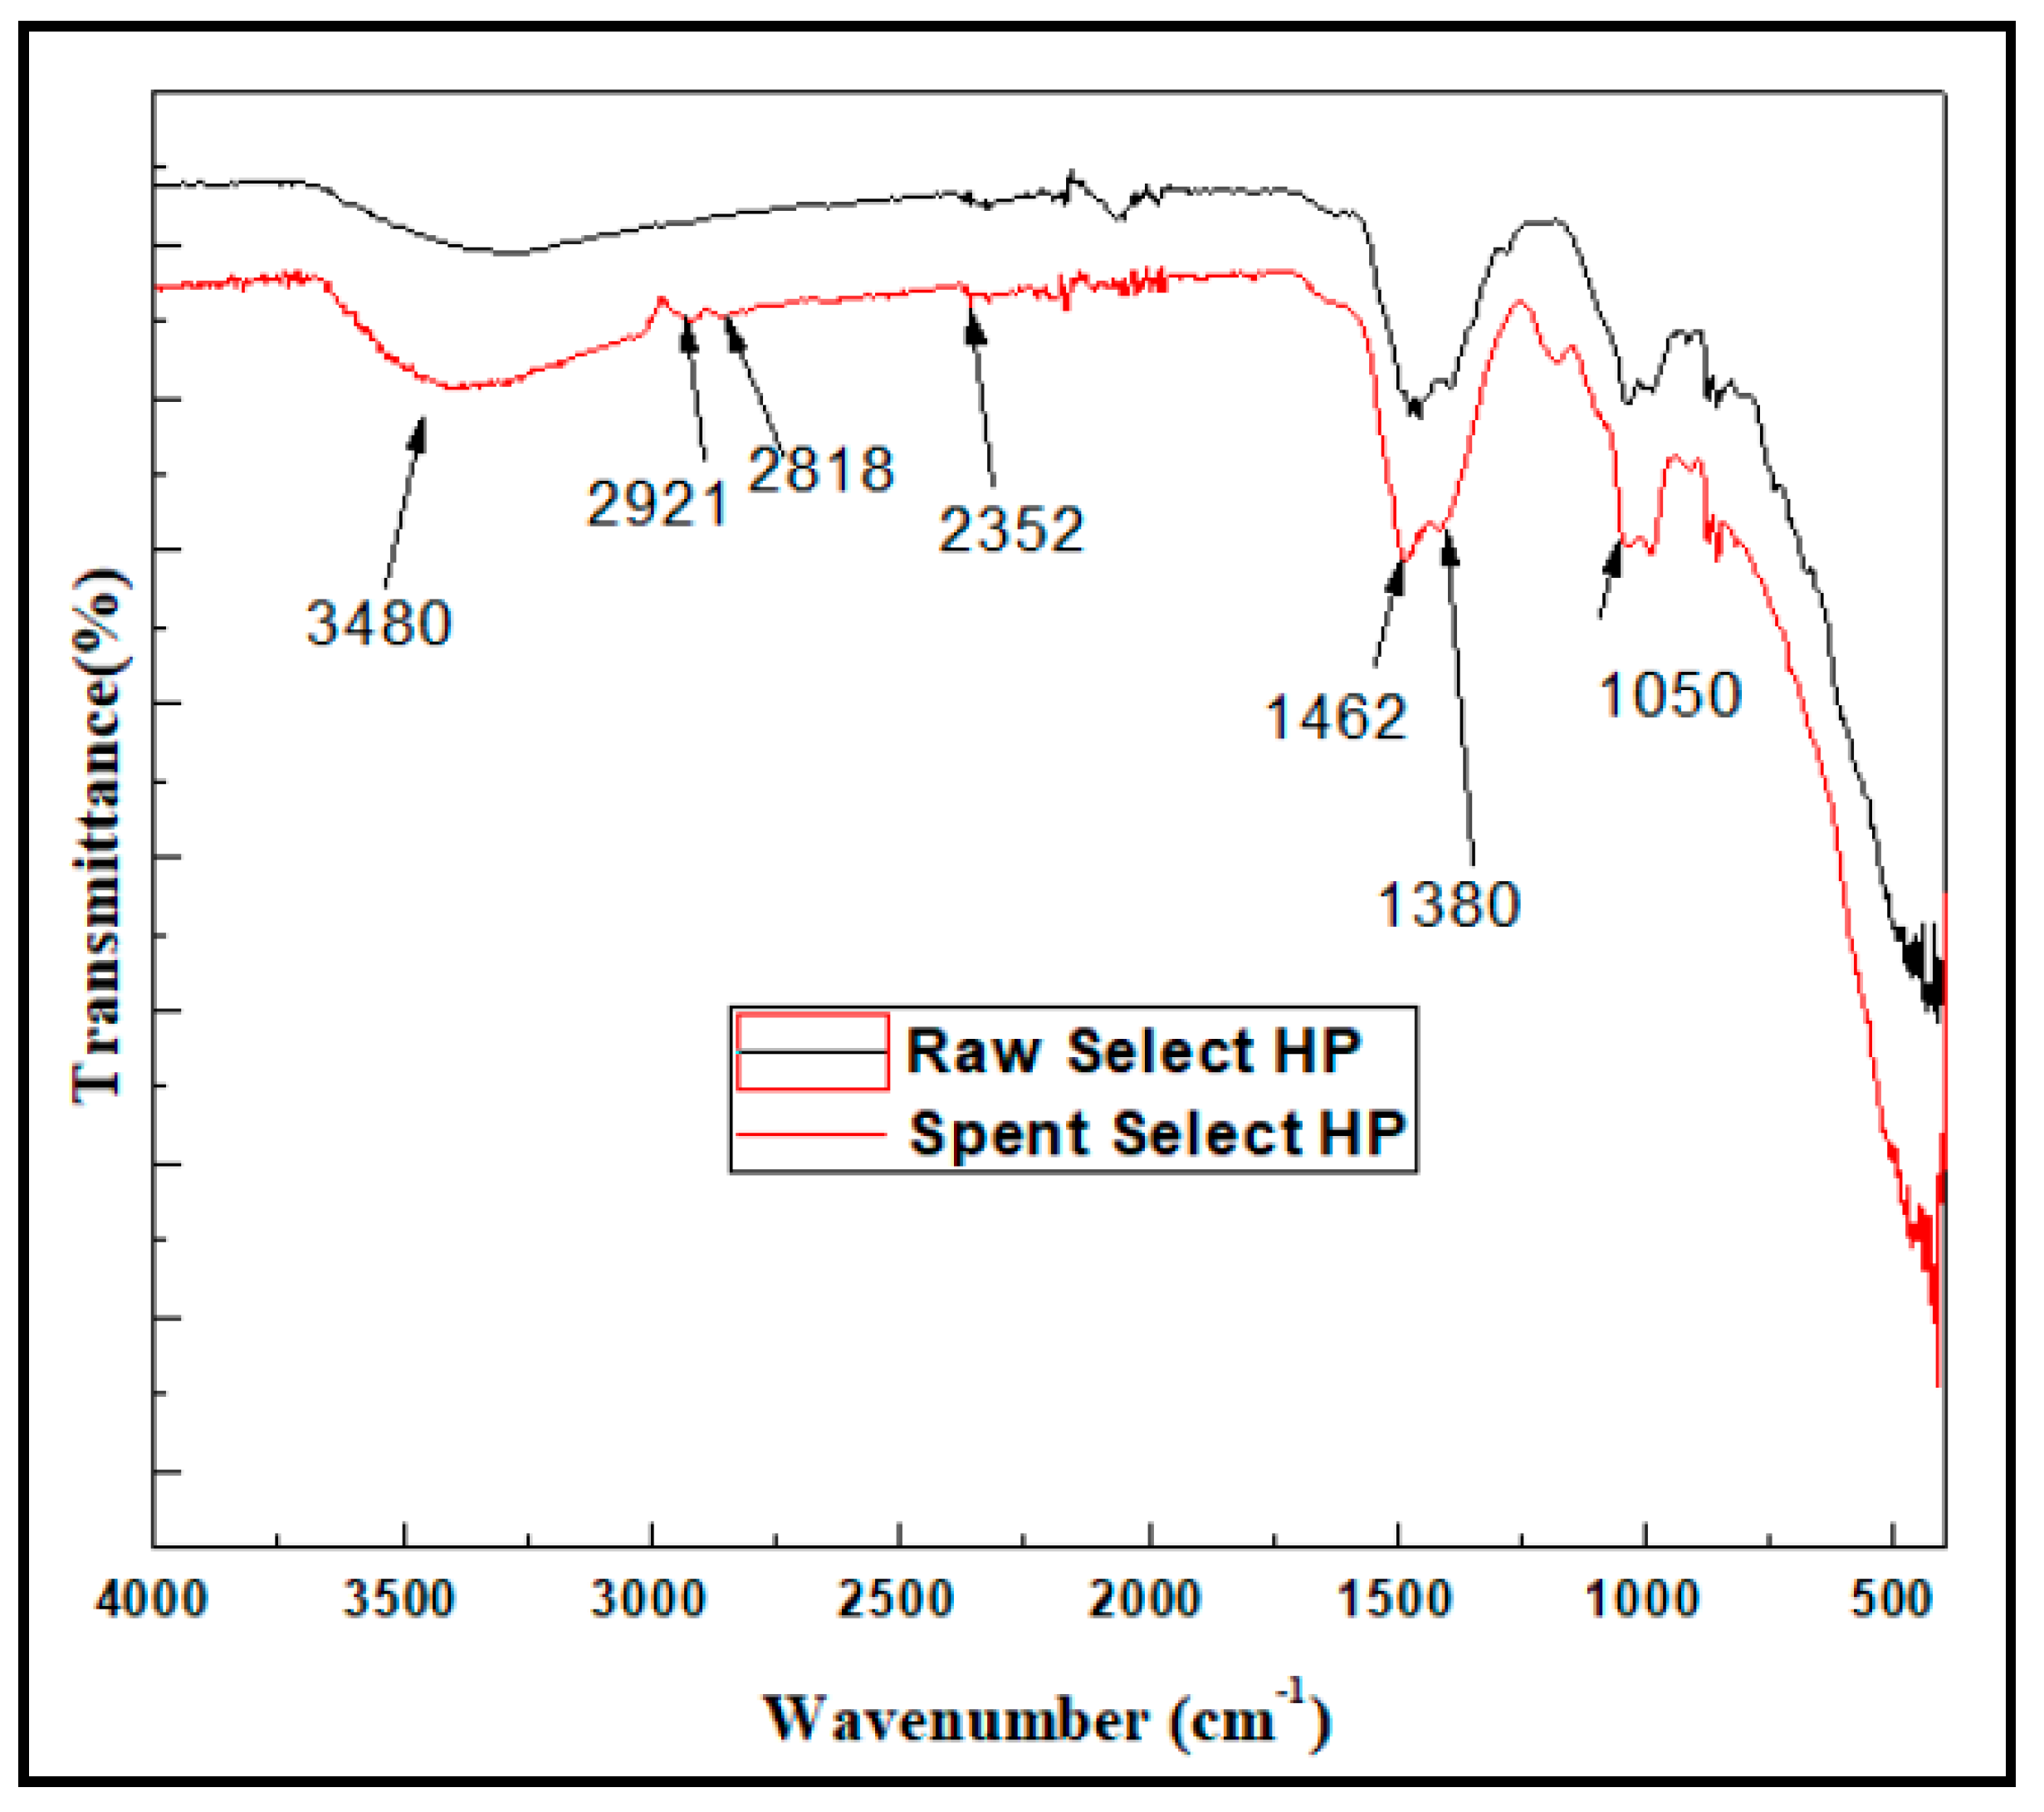
Figure 20.
Total Ion chromatogram for Select HP catalyst at 75°C, 200 PSI, 36 ml/min.
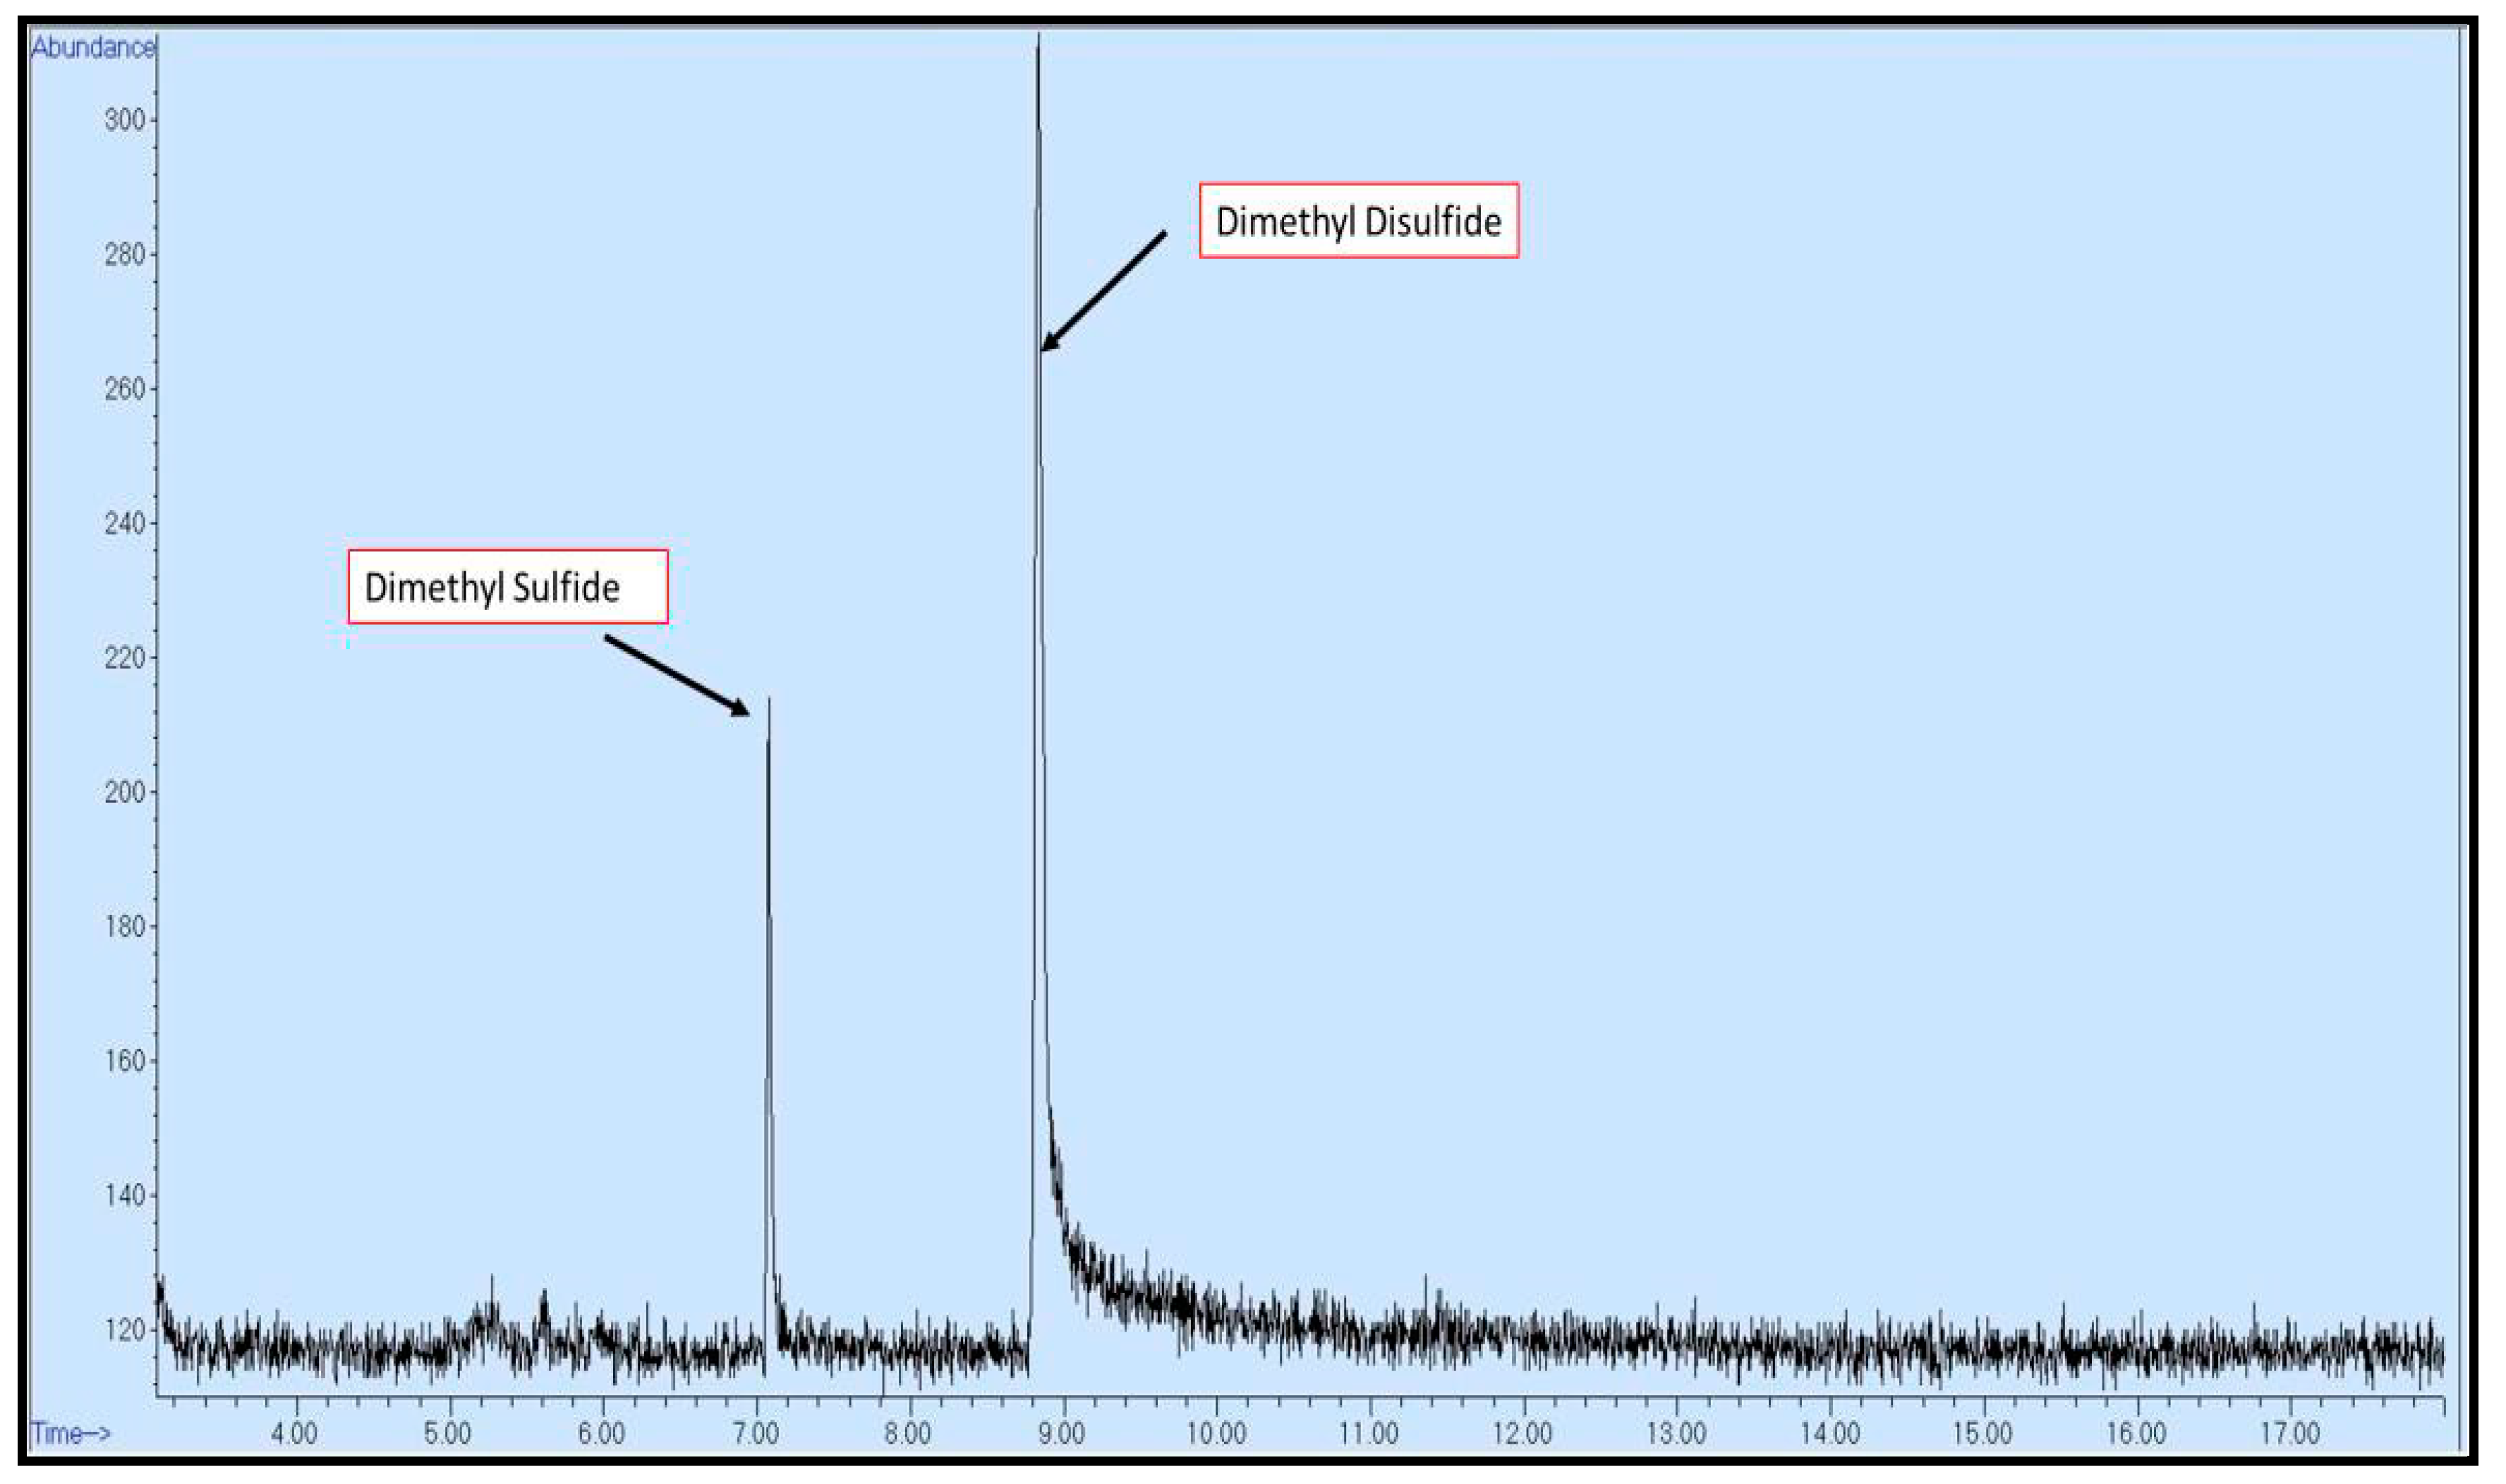
Figure 21.
Possible reaction mechanism for methyl mercaptan removal.
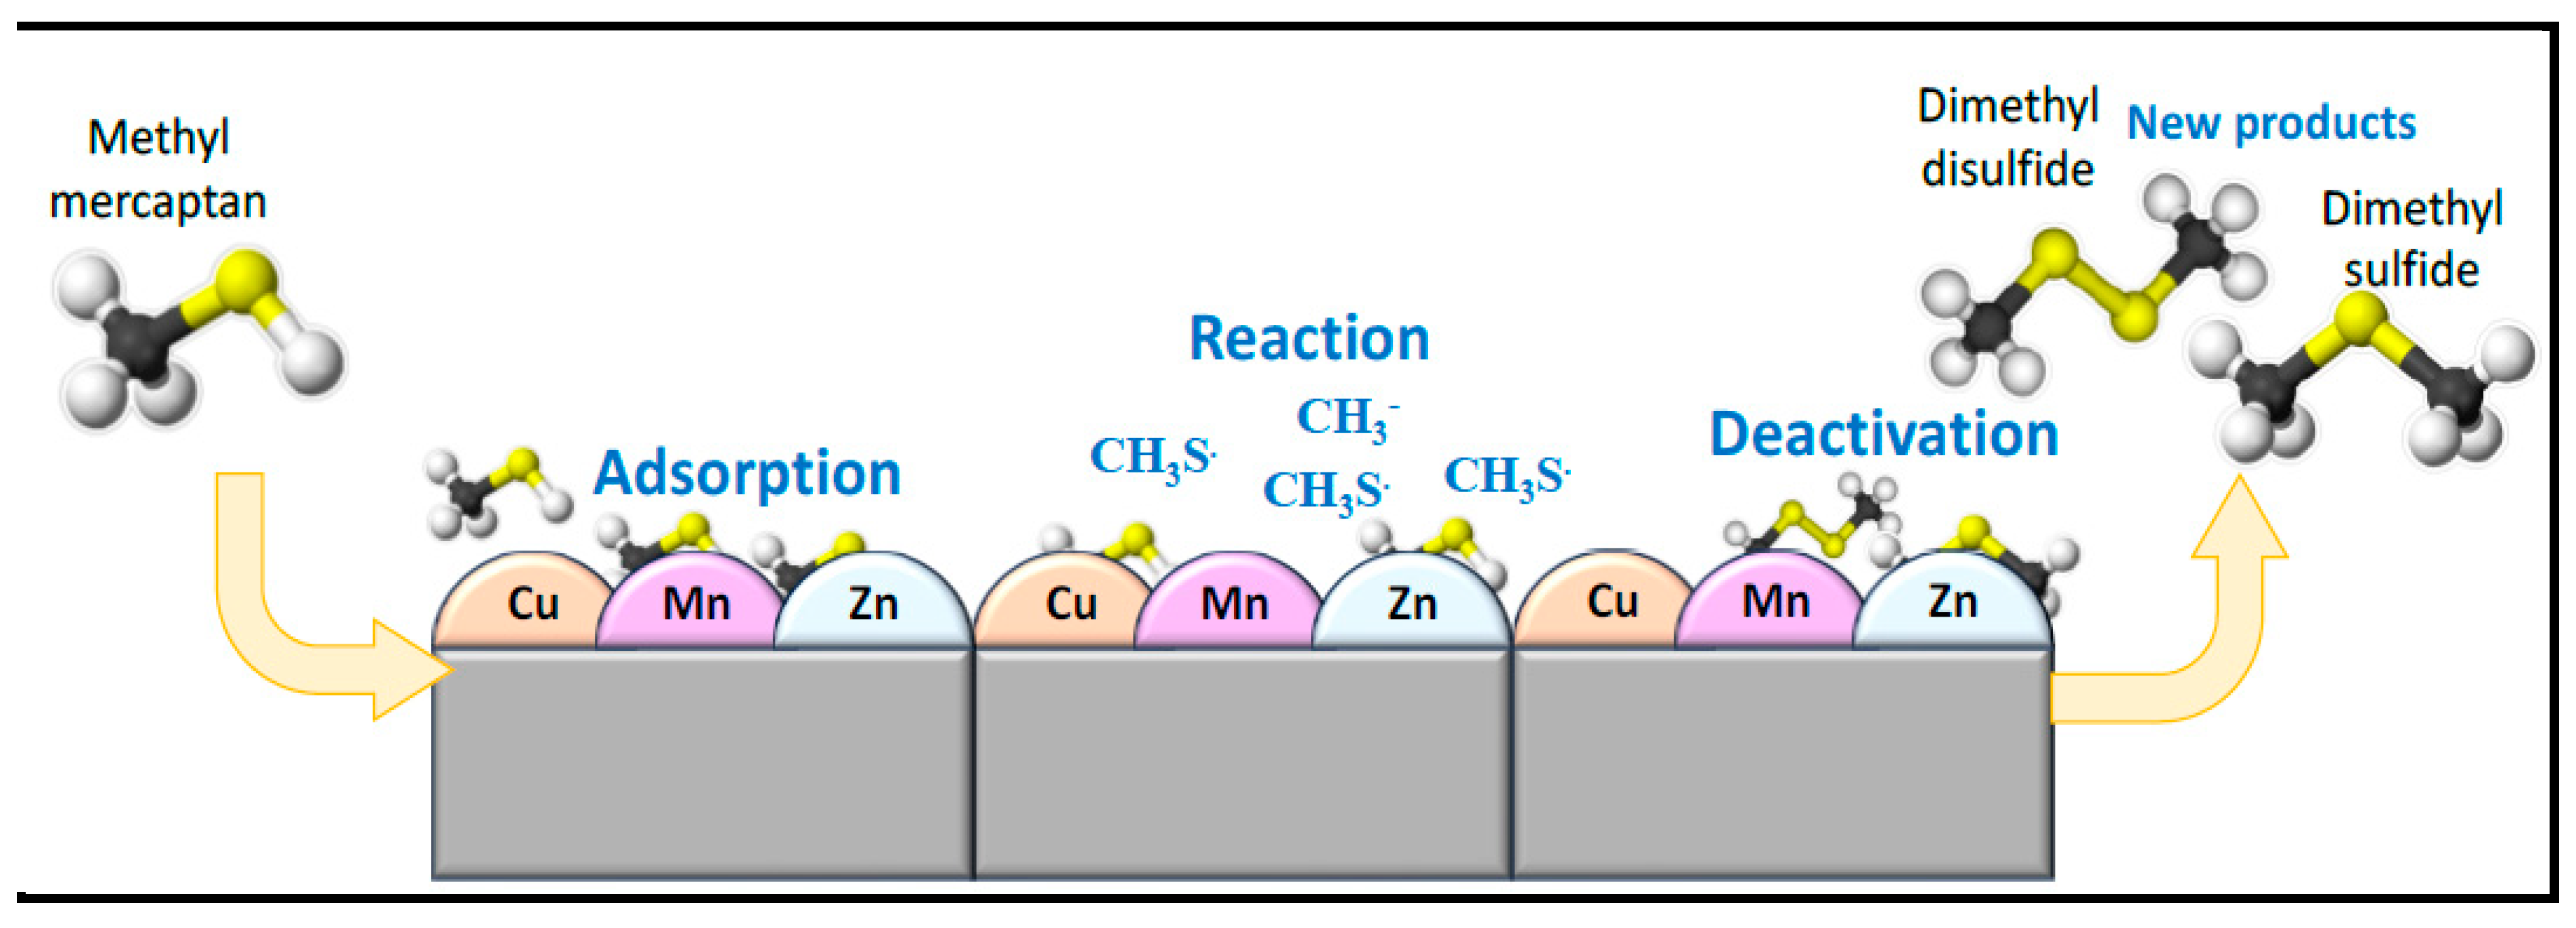

Table 1.
Experimental runs.
| Run | A (°C) | B (PSI) | C (ml/min) |
| 1 | 25 | 100 | 36 |
| 2 | 25 | 100 | 60 |
| 3 | 25 | 200 | 60 |
| 4 | 25 | 200 | 36 |
| 5 | 75 | 100 | 60 |
| 6 | 75 | 100 | 36 |
| 7 | 75 | 200 | 60 |
| 8 | 75 | 200 | 36 |
Table 2.
Surface area, Pore size and Pore volume of the 5 catalysts tested.
| Catalyst | SBET (m2/g) | vt (cm3/g) | Pore Size (A) |
|---|---|---|---|
| CTG-ESC-011 | 196.74 | 0.5 | 108.4 |
| Select HP | 88.82 | 0.27 | 137.7 |
| Halloysite pure | 51.18 | 0.21 | 163.9 |
| Halloysite mINo | 85.5 | 0.27 | 126.8 |
| Halloysite mixed | 27.63 | 0.089 | 129 |
Table 3.
Surface area, Pore size and Pore volume of the 3 best catalysts.
| Catalyst | Theretical Chemical Composition | SBET (m2.g-1) | Vt(cm3.g-1) | Pore size (A) |
|---|---|---|---|---|
| Run 08 | .4Cu-.4Zn-.2Mg | 43.26 | 0.19 | 180.29 |
| Run 016 | .286Cu-.286Zn-.286Ni-.143Mg | 29.97 | 0.14 | 198.32 |
| Run 022 | .4Cu-.4Zn-.2Ni | 43.02 | 0.16 | 158.36 |
| Halloysite | Base | 51.18 | 0.21 | 163.9 |
Table 4.
Chemical composition of the 5 raw catalysts obtained by EDS analysis.
| Compound [mass %] |
Select HP | CTG-ESG-011 | Halloysites | ||
|---|---|---|---|---|---|
| Pure | MinO | Mixed | |||
| Al | 11.4 | 0.7 | 23.5 | 23.2 | 23.9 |
| Si | 2 | 0.5 | 26.1 | 24.5 | 29.6 |
| Fe | 1.7 | 45.3 | 12.5 | 12.9 | 11.8 |
| Ca | 6.9 | 3.4 | 0.2 | 0.7 | 0.8 |
| Mg | 0.4 | 1.8 | 0 | 0 | 0.4 |
| K | 0 | 0 | 0.2 | 0 | 0.7 |
| Cl | 0 | 1.9 | 0 | 0 | 0 |
| Zn | 18.9 | 0.7 | 0 | 0 | 0 |
| Cu | 17.6 | 0 | 0 | 0 | 0 |
| Mn | 19.5 | 0.2 | 0 | 7.6 | 1.7 |
| O | 21.6 | 45.5 | 37.5 | 31.1 | 31.1 |
Table 5.
Breakthrough times for the 5 commercial catalysts.
| Operating Conditions | Catalysts Breakthrough Time (mins) | ||||||
|---|---|---|---|---|---|---|---|
| Meal oxides | Halloysites | ||||||
| Temperature (OC) | Pressure (psi) | Flowrate (ml/min) | Select HP | CTG-ESC-011 | Pure | MinO | Mixed |
| 25 | 100 | 36 | 148.14 | 22.15 | 1.3 | 6.84 | 0 |
| 25 | 100 | 60 | 97.29 | 101.41 | 0.43 | 1.7 | 0 |
| 75 | 100 | 36 | 186.45 | 8.49 | 1 | 0.344 | 85.94 |
| 25 | 200 | 36 | 224.06 | 49.06 | 0 | 23.34 | 0 |
| 25 | 200 | 60 | 65.04 | 0 | 0.48 | 31.43 | 0 |
| 75 | 200 | 60 | 96.58 | 5.31 | 0 | 2.36 | 60.58 |
| 75 | 200 | 36 | 361.66 | 16.84 | 0 | 0 | 60.48 |
| 75 | 100 | 60 | 136.04 | 20.14 | 0.54 | 8.4 | 71.65 |
Table 6.
Experimental and model predicted responses by varying the metal loading.
| Run | A:Cu (%) | B:Zn (%) | C:Ni (%) | D:Mg (%) | Bt time (minutes) | Sulfur Capacity (mg S/g catalyst) |
|---|---|---|---|---|---|---|
| 1 | 33.33 | 33.33 | 16.67 | 16.67 | 5.58 | 78.44 |
| 2 | 28.57 | 28.57 | 14.29 | 28.57 | 14.22 | 199.69 |
| 3 | 42.50 | 7.5 | 25.00 | 25 | 6 | 82.84 |
| 4 | 45.95 | 27.03 | 13.51 | 13.51 | 28.00 | 393.12 |
| 5 | 43.48 | 13.04 | 21.74 | 21.74 | 4.73 | 66.50 |
| 6 | 33.33 | 33.33 | 16.67 | 16.67 | 0.00 | 0 |
| 7 | 50.00 | 50 | 0 | 0 | 49 | 692.80 |
| 8 | 40.00 | 40 | 0 | 20 | 70 | 979.90 |
| 9 | 11.54 | 11.54 | 38.46 | 38.46 | 14.80 | 207.70 |
| 10 | 27.03 | 45.95 | 13.51 | 13.51 | 28.40 | 398.70 |
| 11 | 10 | 56.67 | 0 | 33.33 | 15.95 | 223.93 |
| 12 | 33.33 | 33.33 | 16.67 | 16.67 | 30.00 | 421.20 |
| 13 | 18.75 | 18.75 | 0 | 62.5 | 0.0 | 0 |
| 14 | 10 | 56.67 | 33.33 | 0 | 33 | 468.00 |
| 15 | 13.04 | 43.48 | 21.74 | 21.74 | 16.55 | 232.36 |
| 16 | 28.57 | 28.57 | 28.57 | 14.29 | 61.30 | 860.65 |
| 17 | 38.64 | 38.64 | 0 | 22.73 | 30.93 | 434.25 |
| 18 | 56.67 | 10 | 33.33 | 0 | 42 | 589.68 |
| 19 | 50 | 50 | 0 | 0 | 42 | 589.68 |
| 20 | 31.48 | 31.48 | 18.52 | 18.52 | 18.10 | 254.12 |
| 21 | 33.33 | 33.33 | 16.67 | 16.67 | 29.20 | 409.96 |
| 22 | 40 | 40 | 20 | 0 | 58 | 816.84 |
| 23 | 18.75 | 18.75 | 62.5 | 0 | 29 | 412.49 |
| 24 | 7.5 | 42.5 | 25 | 25 | 17 | 231.66 |
| 25 | 56.67 | 15 | 28.53 | 0 | 3 | 42.12 |
| 26 | 15.00 | 85 | 0 | 0 | 43 | 602.31 |
| 27 | 33.33 | 33.33 | 16.67 | 16.67 | 35.90 | 504.00 |
| 28 | 33.33 | 33.33 | 16.67 | 16.67 | 30.00 | 421.20 |
| 29 | 38.64 | 38.64 | 22.73 | 0 | 56 | 789 |
| 30 | 56.67 | 10 | 0 | 33.33 | 46.00 | 645.84 |
Table 7.
Experimental and model predicted responses by varying the metal loading.
| Order | Adsorbent | Composition | ToC | P atm | Sulfur cap mgs/gCat | Reference |
|---|---|---|---|---|---|---|
| Zeolites | ||||||
| 1 | 13X(NaX) | 0-2000ppm CH3SH in CH4 | 25 | 1 | 182.8 | Taheri et al, 2017 |
| 2 | 5A | 0-2000ppm CH3SH in CH4 | 25 | 1 | 186.3 | Taheri et al, 2017 |
| 3 | Silica Allumina gel | 0-2000ppm CH3SH in CH4 | 25 | 1 | 24 | Taheri et al, 2017 |
| 4 | CaX | .05% CH3SH in CH4 | 25 | 1 | 140 | Ryzhikov et al, 2011 |
| 5 | MgNaX | .05% CH3SH in CH4 | 25 | 1 | 132 | Ryzhikov et al, 2011 |
| 6 | ZnNaX | .05% CH3SH in CH4 | 25 | 1 | 115 | Ryzhikov et al, 2011 |
| Activated carbon | ||||||
| 8 | HNO3-AC | 2000ppm CH4SH | 25 | 1 | 602.1 | Liu et al, 2017 |
| 9 | AC | 50 ppm of methyl mercaptan | 25 | 1 | 1.1 | Zhao et al, 2022 |
| 10 | aAC-Fe | 50 ppm of methyl mercaptan | 25 | 1 | 13.4 | Zhao et al, 2022 |
| MOF | ||||||
| 11 | MIL-53(Al) | CH3SCH3 in methane | 25 | 1 | 433 | Taheri et al, 2017 |
| 12 | MAC-2 | 600mgm-3.CH3SCH3 | 50 | _ | 85.3 | Shi et al, 2017 |
| 13 | MAC-1 | 600mgm-3.CH3SCH3 | 50 | _ | 66.3 | Shi et al, 2017 |
| 14 | MOF-199 | 600mgm-3.CH3SCH3 | 50 | _ | 60.1 | Shi et al, 2017 |
| 15 | MAC-3 | 600mgm-3.CH3SCH3 | 50 | _ | 58.1 | Shi et al, 2017 |
| Metal Oxides | ||||||
| 16 | Select HP | 200 ppm of CH3SCH3 in methane | 25 | 13.6 | 389.1 | This work |
| 17 | .33Mn-33Cu-33Zn | 200 ppm of CH3SCH3 in methane | 25 | 13.6 | 1213 | This work |
Disclaimer/Publisher’s Note: The statements, opinions and data contained in all publications are solely those of the individual author(s) and contributor(s) and not of MDPI and/or the editor(s). MDPI and/or the editor(s) disclaim responsibility for any injury to people or property resulting from any ideas, methods, instructions or products referred to in the content. |
© 2024 by the authors. Licensee MDPI, Basel, Switzerland. This article is an open access article distributed under the terms and conditions of the Creative Commons Attribution (CC BY) license (http://creativecommons.org/licenses/by/4.0/).
Copyright: This open access article is published under a Creative Commons CC BY 4.0 license, which permit the free download, distribution, and reuse, provided that the author and preprint are cited in any reuse.


