
Submitted:
17 October 2024
Posted:
18 October 2024
You are already at the latest version
Abstract
Time overrun and tight deadlines set by the client are the critical challenges faced by the construction industry for decades. The fast-track technique was introduced to overcome these challenges. Since its introduction in 1970s, a number of construction projects have been completed on fast-track however the stakeholders still lack confidence in its implementation, mainly due to the lack of awareness of the impact that variances in cost and quality have on project duration on fast-track schedule and the lack of decision support available in this domain. This research aims at analysing the impact of cost and quality variances on project duration thereby proposing a decision support model that facilitates the decision-making process. Data was gathered from 159 construction industry professionals on a 5-point Likert scale based questionnaire. Structural equation modelling (SEM) software was used to analyse the data. 4 hypotheses were developed including the mediation analysis. The results of the analysis showed that both cost and quality variances have significant impact on variances in project duration. Moreover, the quality variance also significantly impacts the variations in project budget. The mediation analysis showed that cost variance mediates a statistically significant impact between variations in project quality and project duration. The R2 values of the proposed model indicated that 78.4% of the changes in project duration are attributed to changes in project cost and quality whereas 72.9% variations in project cost are attributed to changes in project quality. The IPMA results showed that the decisions resulting in variations in project cost have the greatest potential to enhance project performance in terms of project duration among which adopting scope freeze approach at early design stage, over-designing the facility and early procurement of long-lead-time items are the most influential decisions whereas over-extending the resources on quality related decisions may result in adverse effects on project duration which include early involvement of O&M team in design phase, early involvement of the contractor in design phase, 90% acceptable quality compromise and quality management plan submission in pre-design stage. Q2, RMSE, MAE and CVPAT values confirm that the proposed model has high out-of-sample predictability.
Keywords:
Cost Impact
; Quality Impact
; Decision Support Model
; SEM
; Fast-tracking
Introduction
The construction industry plays a pivotal role in driving economic growth, acting as a catalyst for development in both developed and developing countries [1]. This sector is not only responsible for creating the physical infrastructure that forms the backbone of a nation but also contributes significantly to job creation, income generation, and overall economic prosperity. One of the most significant contributions of the construction industry to the economy is job creation. This sector provides employment opportunities for a broad range of skills, from architects and engineers to labor and craftsmen. In the United States alone, the construction industry employed over 7 million people in 2021, according to the Bureau of Labor Statistics. This not only reduces unemployment rates but also enhances the overall standard of living of the individuals. Investments in infrastructure projects stimulate economic activity and attract foreign direct investment. Developing countries often prioritize construction projects to bridge infrastructure gaps, fostering a conducive environment for business expansion. The statistics speak volumes about the impact of the construction industry on a country's economy. According to the World Economic Forum, the construction industry contributes, on average, around 6% of the global GDP. In developed countries such as the United States and Germany, this percentage is even higher, which is around 8-10%. In countries like India and Brazil, the construction sector contributes around 8-9% to their respective GDPs. the construction industry is an indispensable driver of economic growth, contribution to GDP, job creation, and infrastructure development. Both developed and developing countries are significantly benefitted from a robust construction sector. It is essential for governments and policymakers to recognize and nurture the potential of the construction industry as a catalyst for economic prosperity and sustainable development.
However, the global construction industry is faced with a trinity of challenges that are time, cost, and quality related, which collectively pose hurdles in achieving successful project outcomes [2]. The success of construction projects depends on the complex balance among time, cost, and quality constraints. Time constraints are pivotal, as meeting deadlines is crucial for project completion and subsequent occupancy or utilization. Delays can result in financial losses, and stakeholder dissatisfaction. Despite substantial progress in construction planning and scheduling, 98% of megaprojects suffer from cost overruns exceeding 30%, and 77% are over 40% late [3]. Cost constraints are equally critical, as adherence to budget allocations ensures financial viability and sustainable project outcomes. Unforeseen expenses and budget overruns can lead to financial strain, jeopardizing the overall success of the project. Simultaneously, ensuring high-quality standards becomes a delicate aspect, as pressures to expedite timelines or adhere strictly to budget constraints may jeopardize the final product. The interconnected nature of these challenges necessitates a holistic and adaptive approach, incorporating proactive project scheduling, robust cost management, and stringent quality control measures to navigate the intricate nature of construction projects successfully. Successful construction projects deal with these constraints judiciously, employing strategic planning, efficient project management, and continuous monitoring to achieve optimal outcomes while meeting time, cost, and quality benchmarks.
Among time, cost and quality, timely completion is the most crucial aspect for all stakeholders whether it’s the client, contractor, or the consultant. Meeting deadlines is not merely a logistical consideration but a fundamental prerequisite for project completion, stakeholder satisfaction, and the realization of anticipated benefits. Delays can have cascading effects, resulting in increased costs, contractual disputes, and a diminished return on investment. Timely project delivery is particularly crucial in dynamic environments where market demands, and technological landscapes evolve rapidly. A project not delivered on time not only reflects inefficiency in planning and execution but also spoils the reputation of project stakeholders. Hence, recognizing and meticulously managing time constraints is paramount, as it is the key to ensuring the success and viability of construction endeavours. Completing a project on time allows for revenue generation and early commissioning. PMI (Project Management Institute) regarded time as a major constraint in managing projects.
PMI identifies fast-track and crashing as the two most frequently used techniques for shortening project timeline. Crashing is defined as a method used to compress the project timeline at minimum incremental cost by adding resources whereas fast-track is a schedule shortening technique in which phases usually executed in a sequence are executed parallel [4]. The problem with crashing is that it becomes uneconomical as the resources are pumped into the project to achieve shorter durations which is addressed by fast-track. It is crucial to differentiate between fast-tracking and crashing at this stage as both have the common purpose of shortening the project duration however, they differ. A few researchers such as El-far et al. [5] confused fast-tracking with crashing by mentioning that fast-track includes allocating additional resources to shorten the project timeline whereas on fast-track, reduced durations are achieved by overlapping the dependent activities conventionally planned in a sequence with same resource allocation as on conventional projects. Owing to the same fundamental difference, Prawirawati et al. [6] concluded that fast-track projects are much cost effective than projects that use crashing for schedule reduction.
In 1960s, fast-track was introduced and became widely adopted by the 1970s [7,8]. Fast-tracking is a method for shortening project timeline by performing activities concurrently that are typically done in sequence, as illustrated in the Figure 1 [9]. On fast-track projects, decision-making is the most important aspect of time saving. According to Austin et al. [10], fast-track projects are successful because of the timely and well-informed decisions. Timely decisions can lead to significant success in construction projects, while delays can have disastrous consequences. On fast-track projects, where time is a major constraint, the objectivity of the decision-making process becomes crucial. On fast-track, before decisions are made there is not much time for superfluous studies and surveys to make sure that this is absolutely the right thing to do [11]. As of now, no comprehensive decision support model exists that not only identifies and ranks the decision-making aspects but also co-relates them with the globally accepted project success indicators i.e time, cost, and quality. The lack of such a comprehensive decision support model leads to reluctance of construction industry professionals in adopting fast-track approach. In the research conducted by El-Far et al. [5], 63% of the respondents recommended using fast-track approach on construction projects whereas 28% were neutral and only 9% opposed it.
Research Motivation
This research was inspired by the work done by El-Far et al. [5], Cho and Hastak [12] & Alhomadi et al. [13] in the domain of fast-track construction. Cho and Hastak [12] proposed a time and cost optimized model using genetic algorithm which lacked the quality related aspects of fast-track construction. Moreover, they reported that their model cannot ensure fast-track success, moreover, a computer-based application using several decision criteria is required for the successful implementation of fast-track projects. Alhomadi et al. [13] mentioned that to enhance the predictability of fast-track projects, further research is needed on the relationship between predictability indices and fast-tracking. According to El-Far et al. [5], further study is necessary which analyses predictability indices using data from finished fast-track projects. Incorporating actual data will enhance the accuracy of predictability ratings. Alhomadi et al. [13] concluded that it is crucial to examine the factors that impact real-world project predictability. Additional research is needed to gain a better understanding of the relationship between fast-track projects and their predictability indices, which would enhance project success. This research not only addresses the shortcomings of previous models but also accounts for the future directions suggested by various researchers.
Research Questions
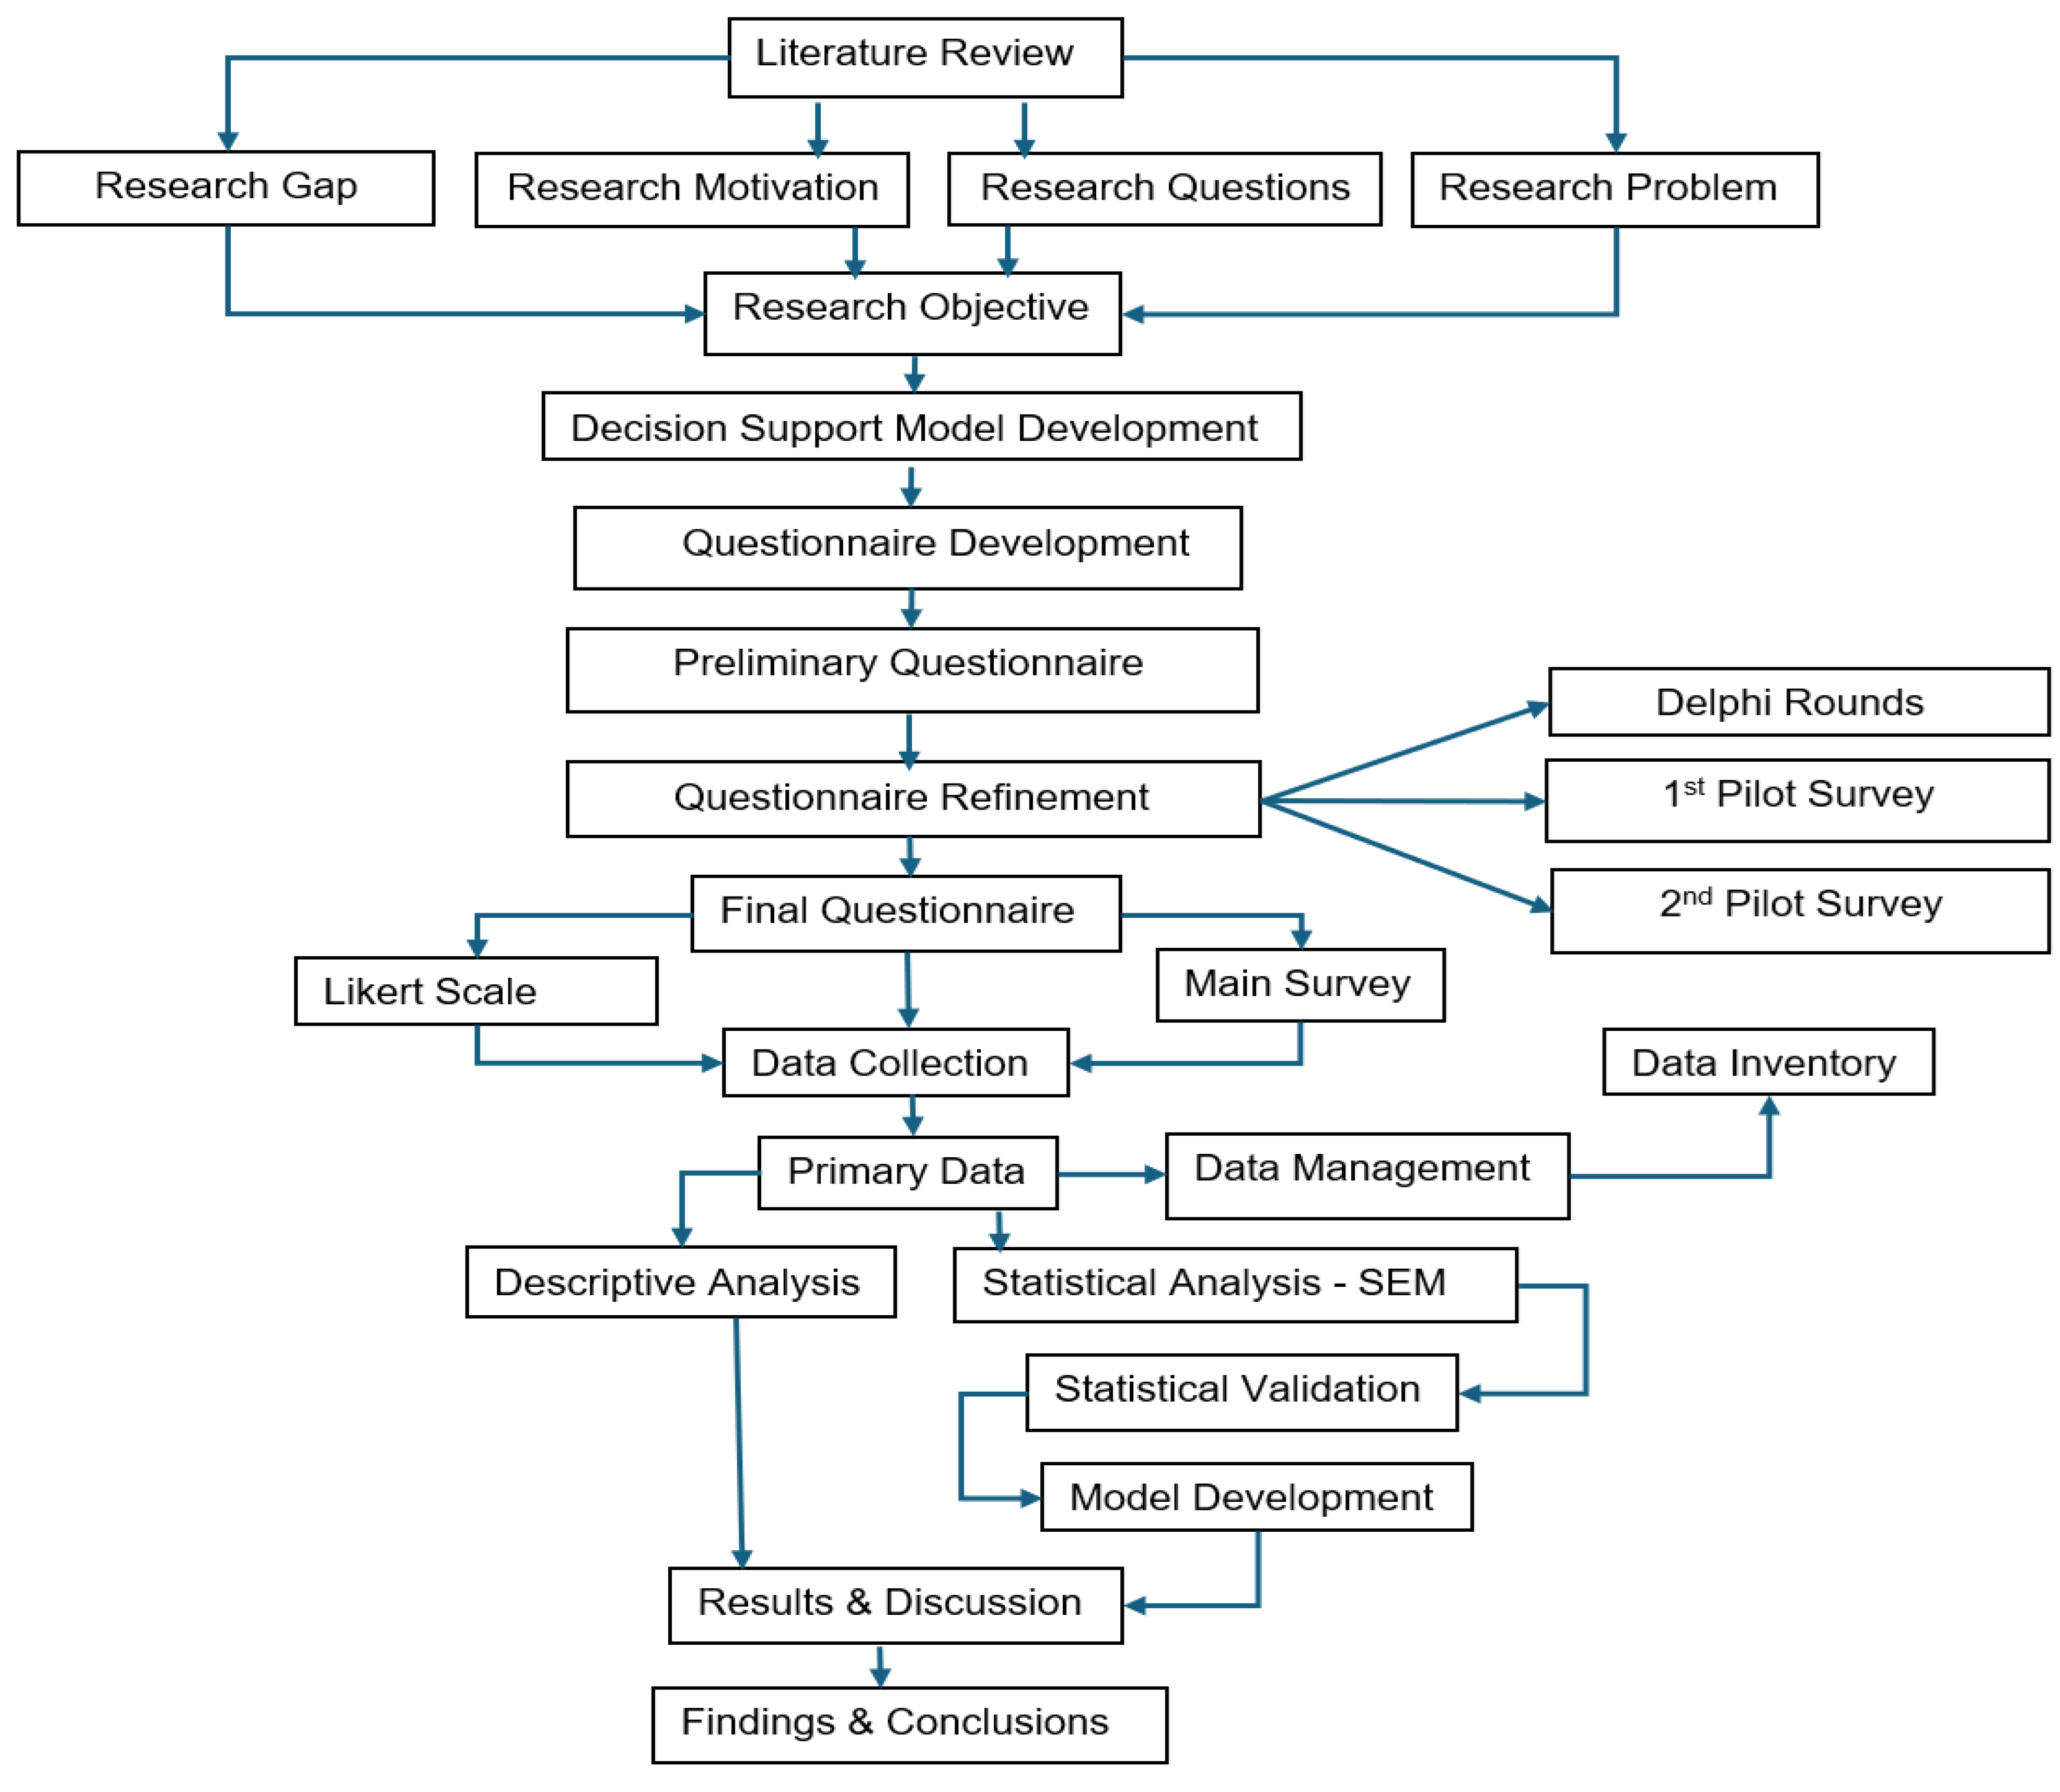
Research questions define the specific areas of inquiry and determine the scope of the study. These questions are formulated based on the research problem and are designed to address the key issues, gaps, or areas of interest within that topic. Figure 2 shows the basic framework of this research. The present study focuses on finding answers to the following research questions:
- What is the impact of variations in cost and quality on the duration of fast-track projects?
- How does the variation in project quality influence the variations in project cost for projects on fast-track schedule?
- How do the time, cost and quality related decisions on fast-track projects impact the corresponding KPIs i.e., project duration, budget and quality respectively?
- What is the impact of cost and quality related decisions on variations in project duration on fast-track projects?
Literature Review
The global construction output reflects the industry's overall scale. In 2020, the total global construction output was estimated to be around $11.4 trillion [14]. Construction activities involve substantial investments. According to a report by the European Investment Bank, the construction sector accounted for approximately 40% of total investments in the European Union [15]. The housing sector is a key component of the construction industry. In the United States, in 2020, the total value of construction put in place for residential buildings amounted to approximately $647 billion [16]. In 2019-2020 Pakistan Economic Survey reported that the construction industry is valued at Rs. 279 Bn, which is 10% to 13% of GDP. [17]. According to Asiedu et al. [18], construction projects must be finished on schedule, within budget, and to the specified quality standards. Among the three, time is the most crucial indicator of project success as in 2016, 70% of construction projects globally encountered time delays, with overruns ranging from 10% to 30% of the planned schedule. [19]. Project acceleration by schedule compression becomes necessary when its deadline fails to align with the dates desired by clients and unforeseen events result in the project delay [20]. Ballesteros-Perez et al. [21] mentioned that for compressing project duration, fast-track and crashing are the most frequently used schedule shortening techniques. Committing additional resources to an activity with the goal of decreasing its duration is crashing whereas fast-tracking a schedule involves partially overlapping critical activities, with the intention of shortening the overall project duration. In comparison, fast-tracking is highly cost effective. The results showed that using genetic algorithm (GA) on a fictious project of 200 days and with a total cost of 10,000 monetary units (m.u.), fast-track projects have lesser average compression cost/ day (7.81 m.u.) as compared to crashing (15.61 m.u.) and combination of fast-tracking and crashing (11.48 m.u.).
Fast-Track and Its Impact on Project KPI
The research community extensively defined fast-track technique in their own words however the central idea is the same as defined by PMI, fast-track is a schedule compression method in which activities or phases normally done in sequence are performed in parallel for at least a portion of their duration [21,22] in other words, the activities are overlapped (Figure 1) [23,24]. The purpose is to reduce the construction duration by commencing parts of work as soon as they are designed even though other parts of the project were not designed yet [25]. Fast-track method is intended to save time by passing the traditional sequence of documentation, tendering and construction [26]. Other terminologies used in the literature that are synonym to fast-track are concurrent engineering, parallel engineering, phased construction, flash-tracking and agile project management [10,21,22,26,27]. The existing literature extensively discusses the universally accepted project KPI i.e., quality, cost and time in the context of fast-track approach [13,26,28]. One of the most common challenges in project management is determining whether or not a project is successful. Traditionally, the project management metrics of time, cost and quality have been the most important factors in defining the success of a project. Many researchers have argued that fast-track projects are less predictable with regards to time, cost and quality [21]. The focus of fast-track technique is to shorten the project duration which can adversely impact other project objectives [1].
Fast-Track’s Impact on Time
The difference between actual duration and planned duration is called time variance which serves as an indicator of fast-track project’s predictability [5]. Kasim et al. [29] reported that with fast-track, projects can be completed in less than 70% of the planned time. As per Alhomadi et al. [13], under fast-track, the duration required to finish a project is 50-75% shorter than the timeframe for a traditional project.There is no doubt that fast-track approach saves tremendous time compared with traditional delivery method [8,30]. Attar et al. [31] & Khoueiry et al. [32] reported in their research that as compared to traditional construction, fast-track was able to reduce the project duration by 18%, 25% and 30% respectively [33]. Alternatively, increased overlapping in design and construction, according to Pena-Mora and Li [34], can lead to more changes compared to the conventional projects, resulting in delays that negate the time savings achieved through the increased overlap. Table 1 shows the time related decision criteria identified from literature that effect the project timeline.
Fast-Track’s Impact on Project Cost
El-far et al. [5] regarded cost variance as a success indicator on fast-track projects. With regards to fast-track’s impact on project cost, the research community seems divided. However, most of the researchers believe that fast-track projects result in cost overrun due to a large number of changes, error, omissions and reworks. Moazzami et al. [41] reported that although site modification issues and reworks are not specifically related to fast-track approach, however their occurrence is comparatively higher in this technique. Due to the increase in potential changes and reworks on fast-track projects, the project cost increases [21]. Fast-tracking gives the owner a less than an optimal design and a costly construction [42]. Kasim et al. [29] reported that fast-track can result in unpredictable increase in project cost. The fast-track method may lead to higher construction costs because of the shortened duration, which could make project owners reluctant to use it for their construction projects [7]. However, there are some researchers who reported that when properly applied, fast-track method produces the shortest economic program. The fast-track method may offer an advantage over the traditional sequential construction approach regarding life cycle costs, due to earlier occupancy and reduced overhead expenses [11,43]. Pena-Mora and Li [34] concluded that fast-track may result in cheaper construction. With regards to project budget under fast-track technique, there are no additional project costs [28]. According to Lalu et al. [39], considerable time saving (9.09%) and cost saving 0.41% (Rp. 49.8 million) of the contract amount was achieved when Muhamadiyah General Hospital, Ponorogo, Indonesia was fast-tracked with no project acceleration cost. Egbelakin et al. [44] reported that fast-track construction provides opportunities to counter the risks of inflation and cost escalation that are presently plaguing the construction industry. Fast-track delivery significantly reduces inflation and interest costs [36]. According to Elvin [45], fast-track technique executed through streamlined processes can result in decreased duration resulting in reduced finances. Further, once project phases are executed simultaneously, uncommitted resources on one phase are shifted to another, which will decrease the project budget and enhance payback period, organizational performance and cash flow. Table 2 shows the project cost related decision criteria identified from the literature.
Fast-Track’s Impact in Quality
Besides time and cost, quality is also a measure of fast-track project predictability [13]. With regards to quality and maintenance, completing the project with high standards to extend its maintenance period is preferable so that maintenance cost decreases [5]. Reworks, change orders, defects, deviations or omissions are a measure of quality variance. Fast-track projects have less time for optimization [11]. In fast-track, the facility is designed to meet certain criteria after which no further work is done. Project quality may be adversely affected by the accelerated nature of fast-track approach [13]. Speed is a requisite for fast-track approach and quality management practices function against speed. The construction phase commences before design completion, therefore maintaining quality on fast-track projects is very difficult [2]. Projects that are rushed without adequate planning may lead to numerous changes as a management response. However, these adjustments can result in increased rework and lower quality due to the subsequent revisions. [23]. Since the focus is on finishing the project as early as possible and handling multiple tasks simultaneously, fast-tracking often overlooks quality standards [5]. El-Far et al. [5] further reported that stakeholders prioritize completing the project with possibly the best quality with minimum costs, as quality is the most critical factor from the owner's perspective. Table 3 shows the quality related decision criteria identified from the literature.
Decision-Making on Fast-Track Projects
Accelerating a project through fast-track is a major decision, and construction professionals are often not aware of its implications [36]. On a fast-track project, the overlapping decision is basically a trade-off between time savings and increased cost [37]. Fast-track requires project owners to take complex decisions and exhibit firm discipline [30]. Tengler [27] reported that within the next few years, the only restraint on fast-track projects may well be the prospective owner's decision-making capability. Srour et al. [33] emphasized that the construction sector lacked a computer aided model for decision making pertaining to activity overlap. However, a few decision support tools for fast-track projects were found in the literature, but they only focused on a specific aspect of fast-track approach and lacked comprehensiveness. Khoueiry et al. [32] presented a decision support tool which was based on activity schedule optimization for fast-track projects. Russell & Ranasinghe [43] presented a deterministic analysis framework that permits the computation of an upper bound on the constant dollar expenditure that should be made to fast-track a project to achieve a specified duration. Hossain & Chua [58] proposed an optimization strategy for design and construction phase overlap employing the idea of downstream sensitivity and upstream evaluation parameters and developed a simulation based framework to determine project performance with regards to project duration and anticipated rework. Bogus et al. [37] proposed a framework for overlapping dependent design activities on a fast-track project which can assist the project managers in making better decisions on when and how much to overlap the sequential activities. The decision-making model proposed by Cho & Hastak [12] is only a time and cost optimization model and neglects the quality variance aspect of fast-track projects. This model cannot ensure the success of fast-track application. Moreover, it also fails to provide insight into the actual decision aspects encountered on such projects. The model focuses only on work packages related to design and construction, neglecting the decision-making aspects such as procurement, finances and economic feasibility, contracting, management etc. Furthermore, the proposed model does not explicitly identify work packages and randomly terms them as DWPk and CWPnm which fails to provide an in depth understanding of the decision-making scenarios encountered by the stakeholders. Moreover, development of a computer aided framework that encompasses several decision criteria is crucial. All these decision frameworks focus only on one aspect of fast-tracking, either its information flow, overlapping design activities, reducing reworks or financial considerations. The model proposed in this research overcomes the shortfalls of existing models for fast-track projects by incorporating the fundamental indicators of project success i.e., time, cost and quality variances. Moreover, this model uses the real life decision criteria to ensure the successful application of fast-track methodology on buildings.
Structural Equation Modeling—SEM
SEM is a 2nd generation multivariate statistical technique used for experimental, non-experimental research, cross-sectional and longitudinal data [59]. SEM can be used for risk analysis, model predictions, enhance decision support and other applications. SEM describes and tests relationships between the latent variables and the observed variables [60]. Variance-based SEM (PLS-SEM) and covariance-based SEM (CB-SEM) are the two main methods [61]. SEM analysis comprises two models, measurement and structural model. Measurement model studies the relationships among the constructs and their indicators whereas the structural model enables the analysis of interrelationships among the constructs [62]. In measurement model, we assess the convergent and discriminant validity. Degree of agreement among two or more manifest variables used to define a construct is called Convergent Validity [63]. Discriminant validity is the measure of a construct which clearly differs from other constructs [64]. Collinearity means that two or more indicators in a model are highly correlated triggering type II errors (i.e., false negatives) [65]. Xiong et al. [66] used chi-square/df (degrees of freedom), goodness-of-fit index (GFI), normed fit index (NFI) and standardized root-mean squared residual (SRMR) to assess the model fit in their study. For endogenous variables, the R2 value is the most essential evaluation in PLS-SEM [67]. R2 represents the variance in endogenous variables that can be attributed to the exogenous variables attached to them [68]. f2 is used to ascertain the impact of the removed exogeneous construct on the endogenous constructs [69]. Predictive validity assessment is an essential part of any structural model [70]. AL-Khatib and Ramayah [71] assessed the out-of-sample prediction of their model with the PLSpredict algorithm (cross-validation procedure) using Q2, RMSE and MAE. Zhao et al. [72] developed a SEM model for testing the relationship between project cost and its influential factors in New Zealand’s construction sector. Li et al. [73] used SEM to develop a framework for “bid or no bid” decision process in international construction projects. Eybpoosh et al. [74] used SEM to study the interrelationship and total effect of vulnerability factors and risk paths on cost overrun in Turkish construction industry. Li et al. [75] used SEM for diffusion prediction of prefabricated construction technology under multi-factor coupling.
Conceptual Model Development
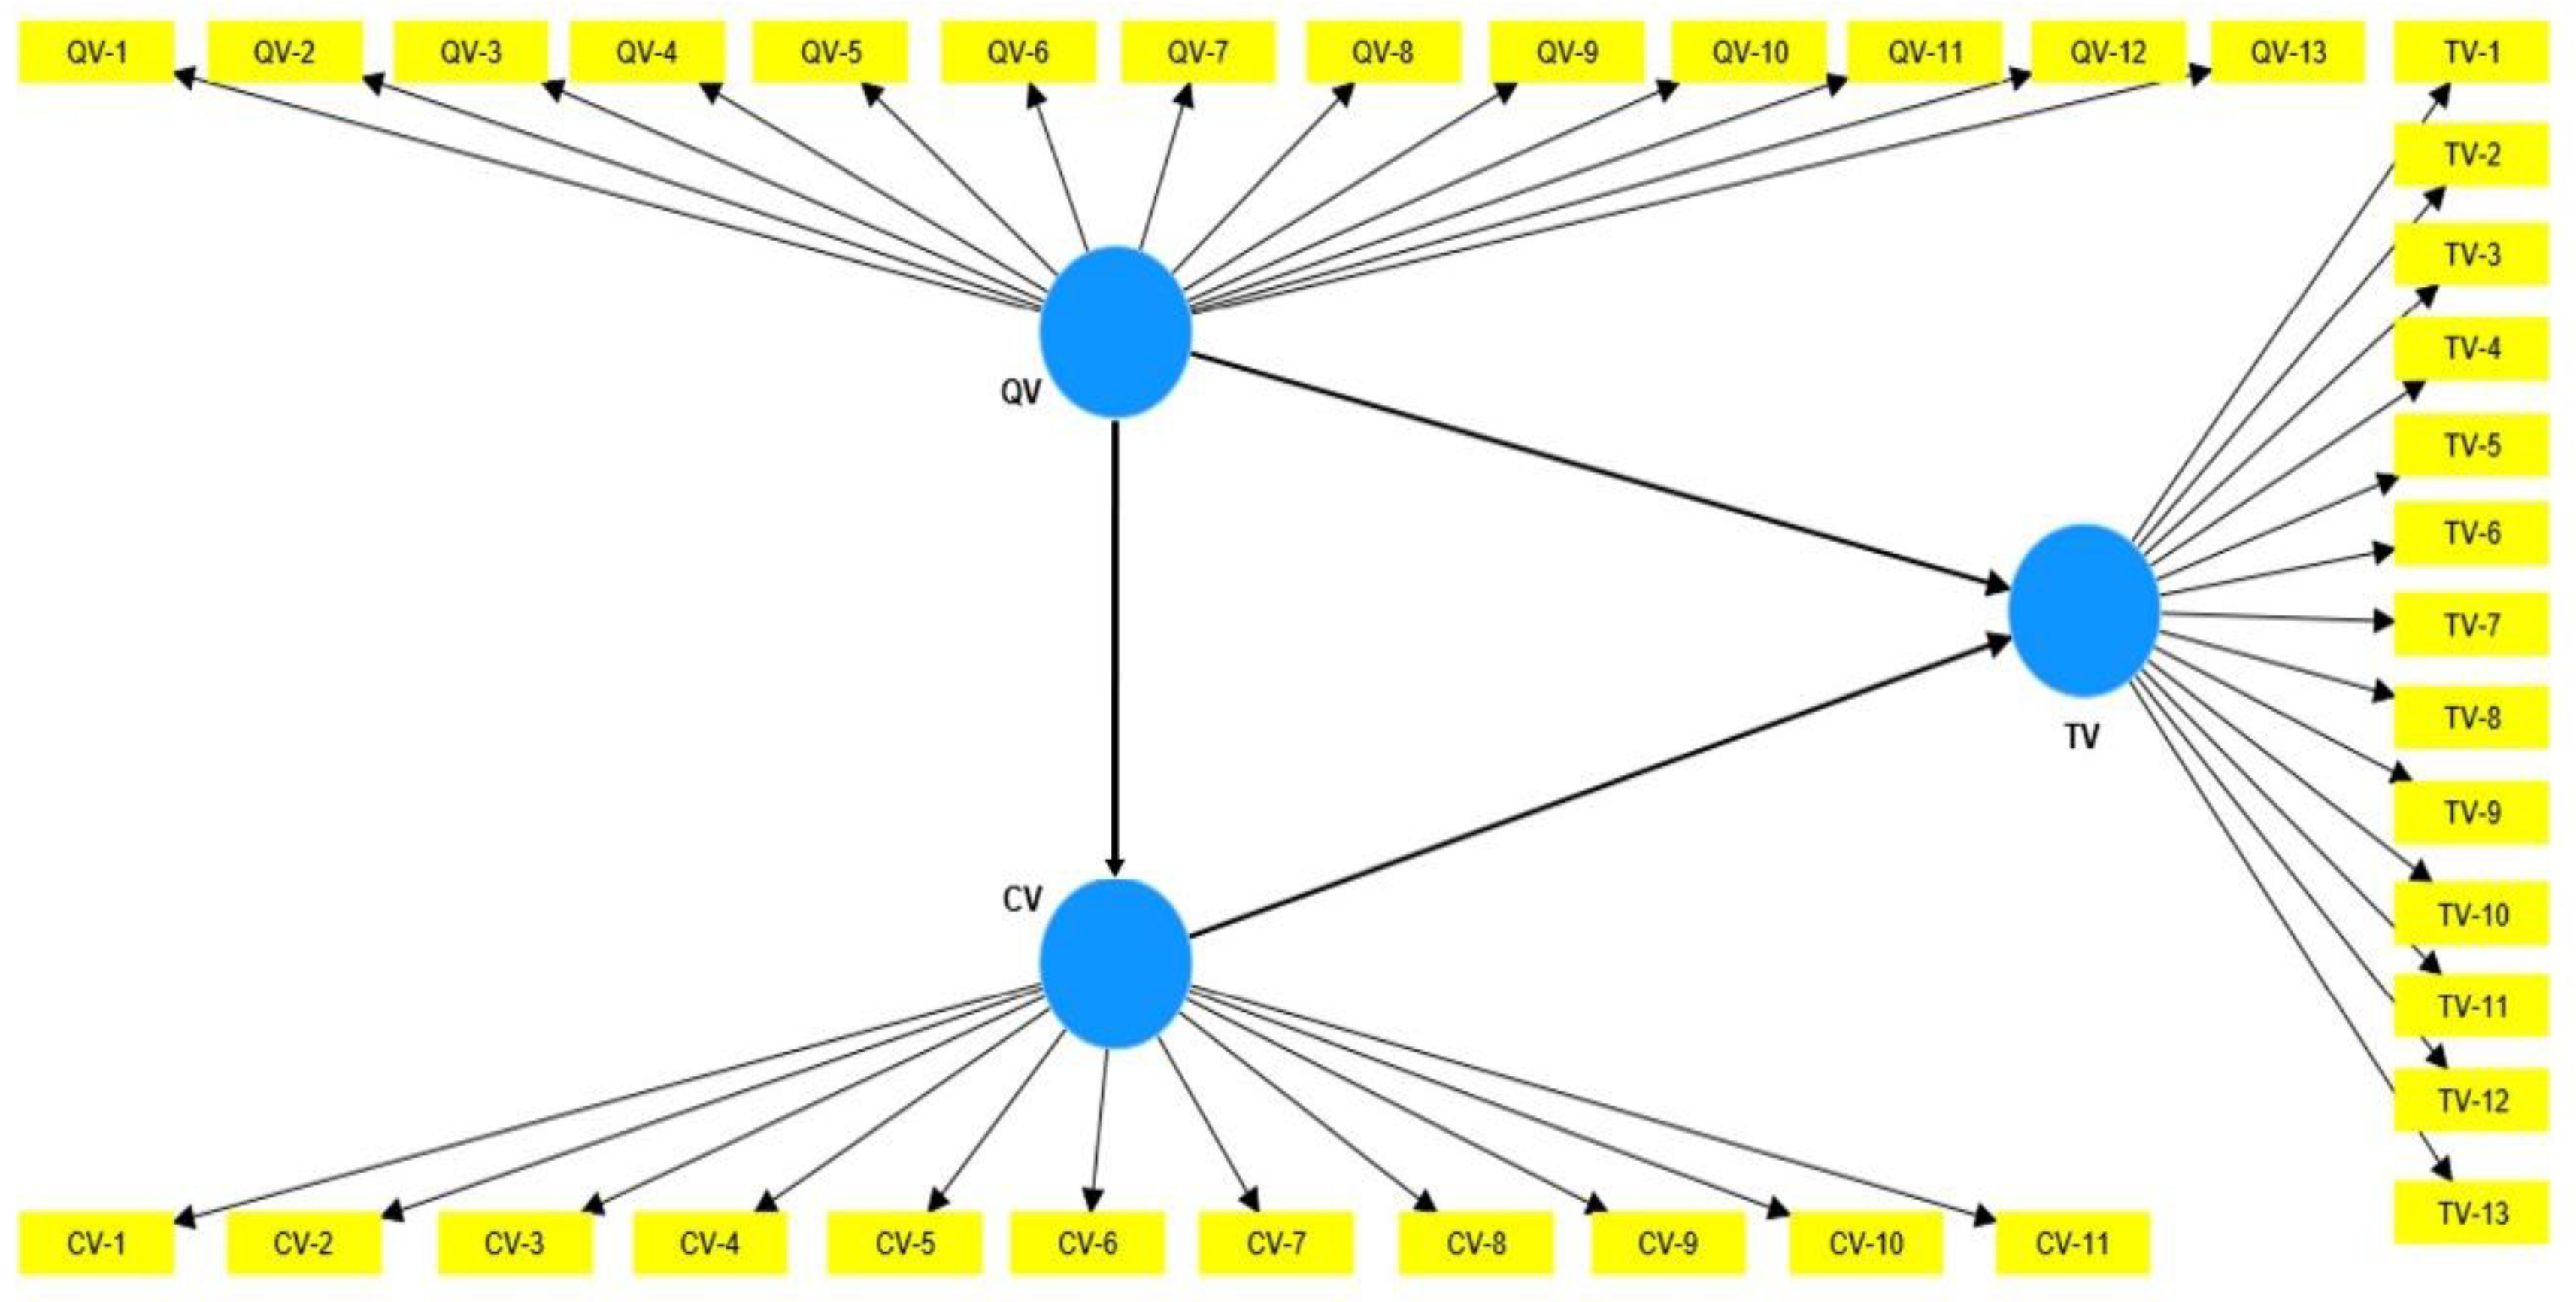
Literature review provided a conceptual basis and helped in identifying the research gap for further exploration. Literature review resulted in the identification of the decision-making criteria as were further used to develop a conceptual model between the decision-making criteria (indicators) for fast-track projects and the latent constructs i.e., time, cost and quality variances was developed as shown in Figure 3. The conceptual model consists of a network of constructs and indicators that provides a detailed understanding of how the exogenous constructs could influence the endogenous constructs.
Figure 3.
Conceptual Model for Fast-Track High-Rise Projects.
Research Methodology
Figure 4.
Research Design.
In this regard, articles related to the research scope, were identified, and then filtered thus narrowing down to the most relevant ones. Initially, an extensive literature review was conducted:- 157 research papers from google scholar and internet sources were reviewed, out of which 85 have been included in this research. Initially, 41 decision criteria were initially identified from the literature which were reduced to 37 after Delphi process and pilot surveys. According to the existing literature and opinion of the experts these decision criteria (indicators) were separately grouped under time, cost and quality variance (constructs) in the model. For fast-track projects, success is evaluated by time which is a fundamental parameter [1], therefore time was selected as the target latent variable.
Delphi Process
The preliminary questionnaire comprising of the indicators and constructs identified from the literature, comprised of 3 parts i.e., demographic information, respondent’s general familiarity with fast-track and a 5-point Likert’s scale with 1 for very low impact and 5 for very high impact. The preliminary questionnaire was refined using the Delphi technique. Delphi technique is a structured communication method used to gather opinions from a group of experts on a particular topic. It is a qualitative research method that aims to achieve consensus of opinions through a series of iterations. In this regard, 10 construction industry experts were asked to furnish their opinion about the contents of the questionnaire and in the 3rd round consensus among all the experts was achieved. The questionnaire was refined as per the consensus and used for the pilot survey. Figure 5 and Table 4 outline the Delphi process and the details of the experts who took part in the Delphi rounds.
Pilot Survey
A pilot study is a small-scale preliminary investigation conducted before the main research study. It serves as a trial run to test and refine the research methods, procedures, instruments, and data analysis techniques that will be used in the full-scale study. In the pilot survey following aspects were considered:
- The professionals should have adequate experience on projects related to the study.
- It was preferred that the experts were currently executing a relevant project.
- The expert panel should be a blend of stakeholders i.e., clients, contractors, and consultants.
- The experts should have adequate qualifications related to the field of this study.
On the basis of the above, input received from the experts should be adequate in number to earmark the deficiencies and improvements needed for refinement of the questionnaire. The preliminary questionnaire was sent to 31 professionals from Pakistan’s construction industry and 3 professors of SEM in the US and Pakistan. The contents of the preliminary questionnaire were highly appreciated by the respondents, however, they suggested to remove two decision criteria. Based on their suggestions, the preliminary questionnaire was refined into a final questionnaire which was used for the main survey.
Coding Scheme
A coding scheme is required for feeding the latent and the manifest variables to the SEM software. Table 5 shows the coding used for representing the latent and the manifest variables.
Data Collection
Sample Size
The sample size for SEM lacks consensus among the researchers. Some researchers suggest that the sample size should be between 100 to 400 whereas studies in construction management have used smaller sample sizes [62]. [l-Mekhlafietal., [64] suggested that sample size for SEM must not exceed 100. This study used Daniels Priori online calculator [76], to find the minimum sample size required against 95% confidence interval, 0.3 effect size and 80% statistical power. The minimum sample size calculated by the calculator was 137. Refined questionnaires comprising of 37 decision criteria, and 3 latent variables were self-administered to 217 construction industry professionals in Lahore, Karachi, Islamabad, and Rawalpindi (being hub of high-rise construction), 176 were received, indicating a response rate 81.1%. Keeping in view the respondent’s familiarity with fast-track concept (identified in part 2 of the questionnaire), only 159 questionnaires were made part of this research.

Statistical Analysis—SEM
Statistical analysis is a data analysis process that helps draw meaningful conclusions from raw and unstructured data. The data analysis techniques available in the existing literature are regression, SEM, neural networks, fuzzy logic and system dynamics. Amongst all, only neural networks, fuzzy logic and SEM can study the relationship among the latent variables. Neural networks are powerful for capturing complexity, fuzzy logic is useful for handling uncertainty, and SEM is designed for studying relationships among latent variables with a focus on testing the hypothesis and interpreting the model that is the prime focus of this paper therefore SEM was selected, outlined in Figure 6. First, the data was screened for outliers, missing values and data distribution [77]. The data is normally distributed if the skewness and kurtosis values are between -2 and +2 [78]. Then the data was checked for common method bias (CMB), CMB is especially problematic when information is gained through self-administered questionnaires [63], survey-based approach and cross-sectional variables [71]. To rule out CMB, Harman’s one-factor test was conducted in SPSS [79]. Further, this study used smart PLS4 SEM software for statistical analysis. PLS-SEM was preferred over CB-SEM as PLS-SEM performs better for predicting purposes [63]. PLS-SEM does not require large sample size as required in CB-SEM [77]. When hypotheses are to be tested with comparatively small sample size, the PLS-SEM is preferred [80]. First, we assessed the measurement model and then the structural model. In the measurement model, the internal consistency was assessed using Cronbach’s Alpha and composite reliability, for which the values should be ≥ 0.7 and convergent validity using average variance extracted which should be ≥ 0.5 [59]. To establish the discriminant validity, Fornell and Larcker Criterion and Heterotrait-Monotrait ratio (HTMT) were used. The HTMT value should be < 0.85 and Fornell & Larcker criterion requires that the square root of the average variance extracted by a construct must be greater with itself than any other construct [70]. Moreover, indicators with outer loading < 0.7 were eliminated from the model [81]. Before conducting the path analysis, variance inflation factor (VIF) was checked to rule-out multi-collinearity, the VIF values should be < 3.5 [70]. After assessing the internal consistency and validity, the model fit was assessed [59]. To establish model fit, the ideal squared root mean residual (SRMR) cut-off is 0.08 [82], normed fit index (NFI) value should be ≥ 0.8 [83], Chi-square/df should be ≤ 3 [59] and Goodness of fit index (GFI) ≥ 0.1 is considered small, ≥ 0.25 is moderate, while ≥ 0.36 is good [84]. Degrees of freedom (df) and GFI for this model were calculated using equation 1 [66] and equation 2 [83] respectively, where “p” represents number of manifest variables and “q” represents number of latent variables in Equation 1.
df = p (p+1)/2 – q
After the measurement model, structural model was evaluated using path analysis for which bootstrapping procedure was used. The main purpose of evaluating the structural model is to test the hypotheses using path coefficients (β) and p-values [84]. Path coefficients (β) ≥ 0 indicate a direct and positive relationship whereas β ≤ 0 indicates a direct and adverse relationship, zero indicates that there is no direct relationship between the variables [69]. Moreover, β-value between 0.1- 0.3 show weak impact, between 0.3-0.5 moderate impact and 0.5-1.0 strong influence [85], while the p-value for 95% confidence level should be < 0.05 for establishing statistical significance. Explanatory power of the model was assessed using R2 and f2 [63,69]. f2 ≥ 0.02, ≥ 0.15 and ≥ 0.35 indicate small, medium, and enormous impact of the exogenous constructs on the endogenous construct [85]. The out-of-sample predictability of the model was assessed with the PLSpredict algorithm (cross-validation procedure) using Q2, RMSE and MAE [71]. The key criterion for assessing the predictive relevance of the model is Q2 > 0 [61]. Moreover, PLSpredict compares PLS-SEM_RMSE values with LM_RMSE and PLS-SEM_MAE values with LM_MAE values. Cross validation predictive ability test (CVPAT) is an alternative to PLSpredict for prediction-oriented assessment of PLS-SEM model. CVPAT uses indicator average (IA) and liner model (LM) as a benchmark for comparing the average loss values of PLS-SEM. The difference of average loss values should be significantly less than zero to substantiate better predictive capabilities of the model and p-value < 0.05 to the support the hypothesis that predictive ability of PLS-SEM is better than IA and LM. Importance Performance Map Analysis (IPMA) was used to rank and assess the importance against the performance of each indicator and each construct (SV, CV, and QV) on the target variable (TV). IPMA extends the finds of PLS-SEM by evaluating the performance of the exogeneous latent variables and indicators on the target latent variable. IPMA conducts twofold assessment of importance and performance which is critical for decision making [69].
Results and Discussion
Demographic Analysis (Descriptive)
The 159 respondents consist of construction industry professionals who are clients (43), contractors (75), and consultants (41). These respondents vary in experience and qualification however all of them have the experience of working on fast-track projects in either Dubai, Qatar, Saudi Arabia or in Pakistan. Demographic analysis shows that most of the respondents have a bachelor’s degree, 37% of the respondents hold a master’s degree, 16% of the respondents have a diploma of associate engineer, 6 respondents have a PhD in civil engineering and 2 respondents were chartered accountants.
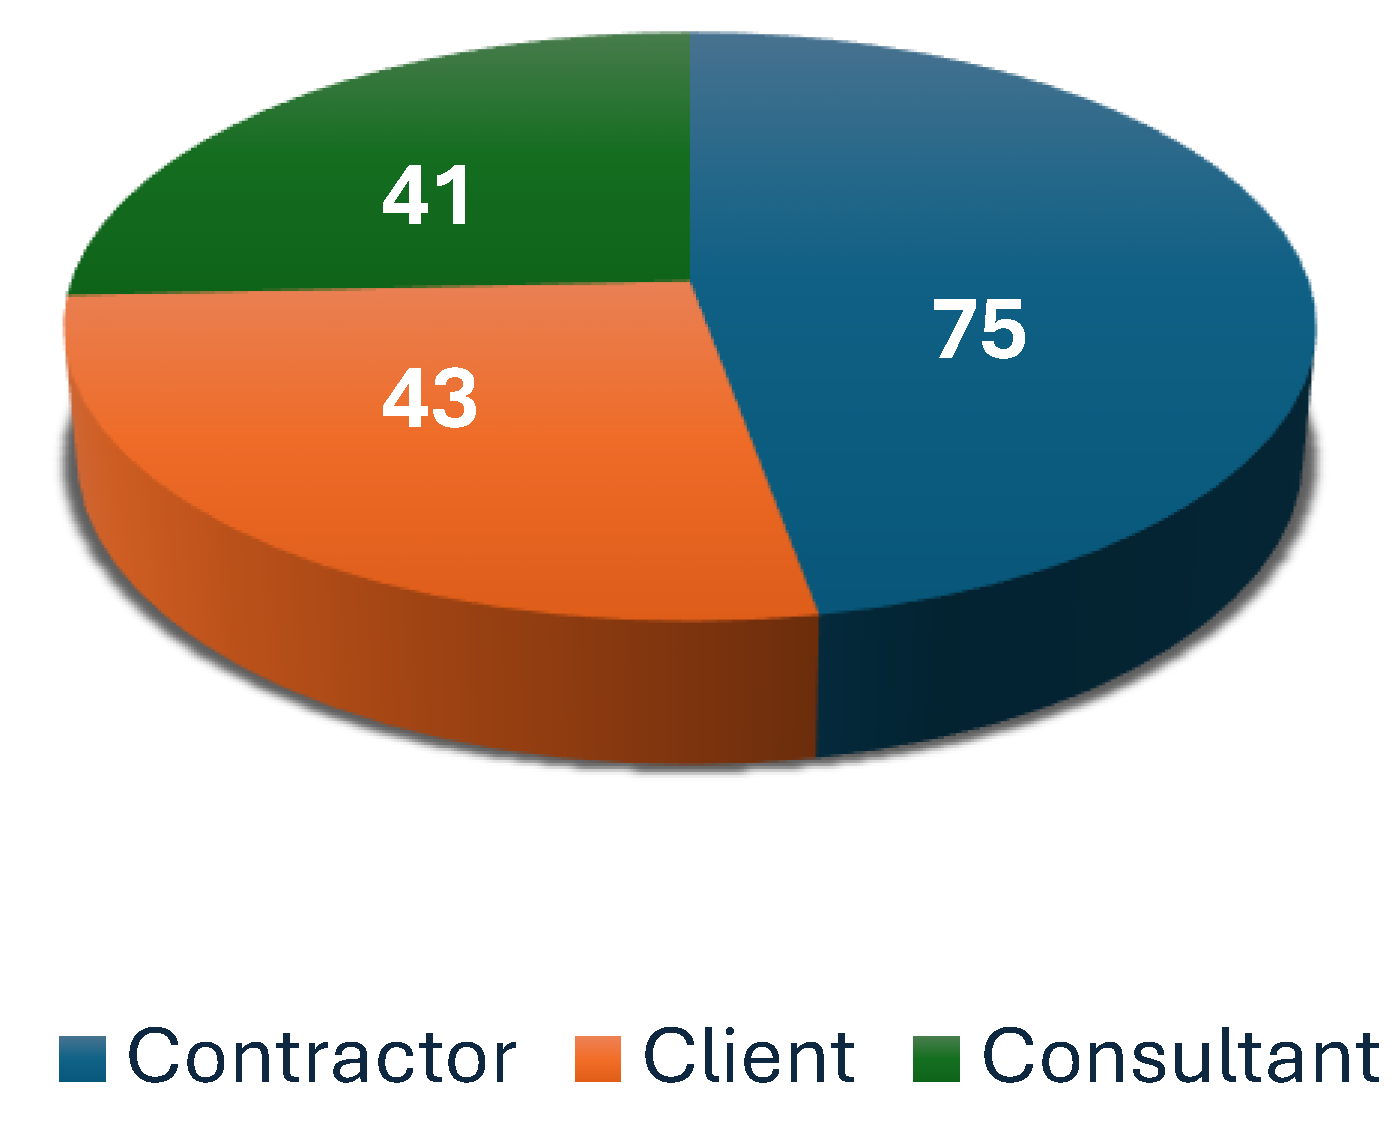
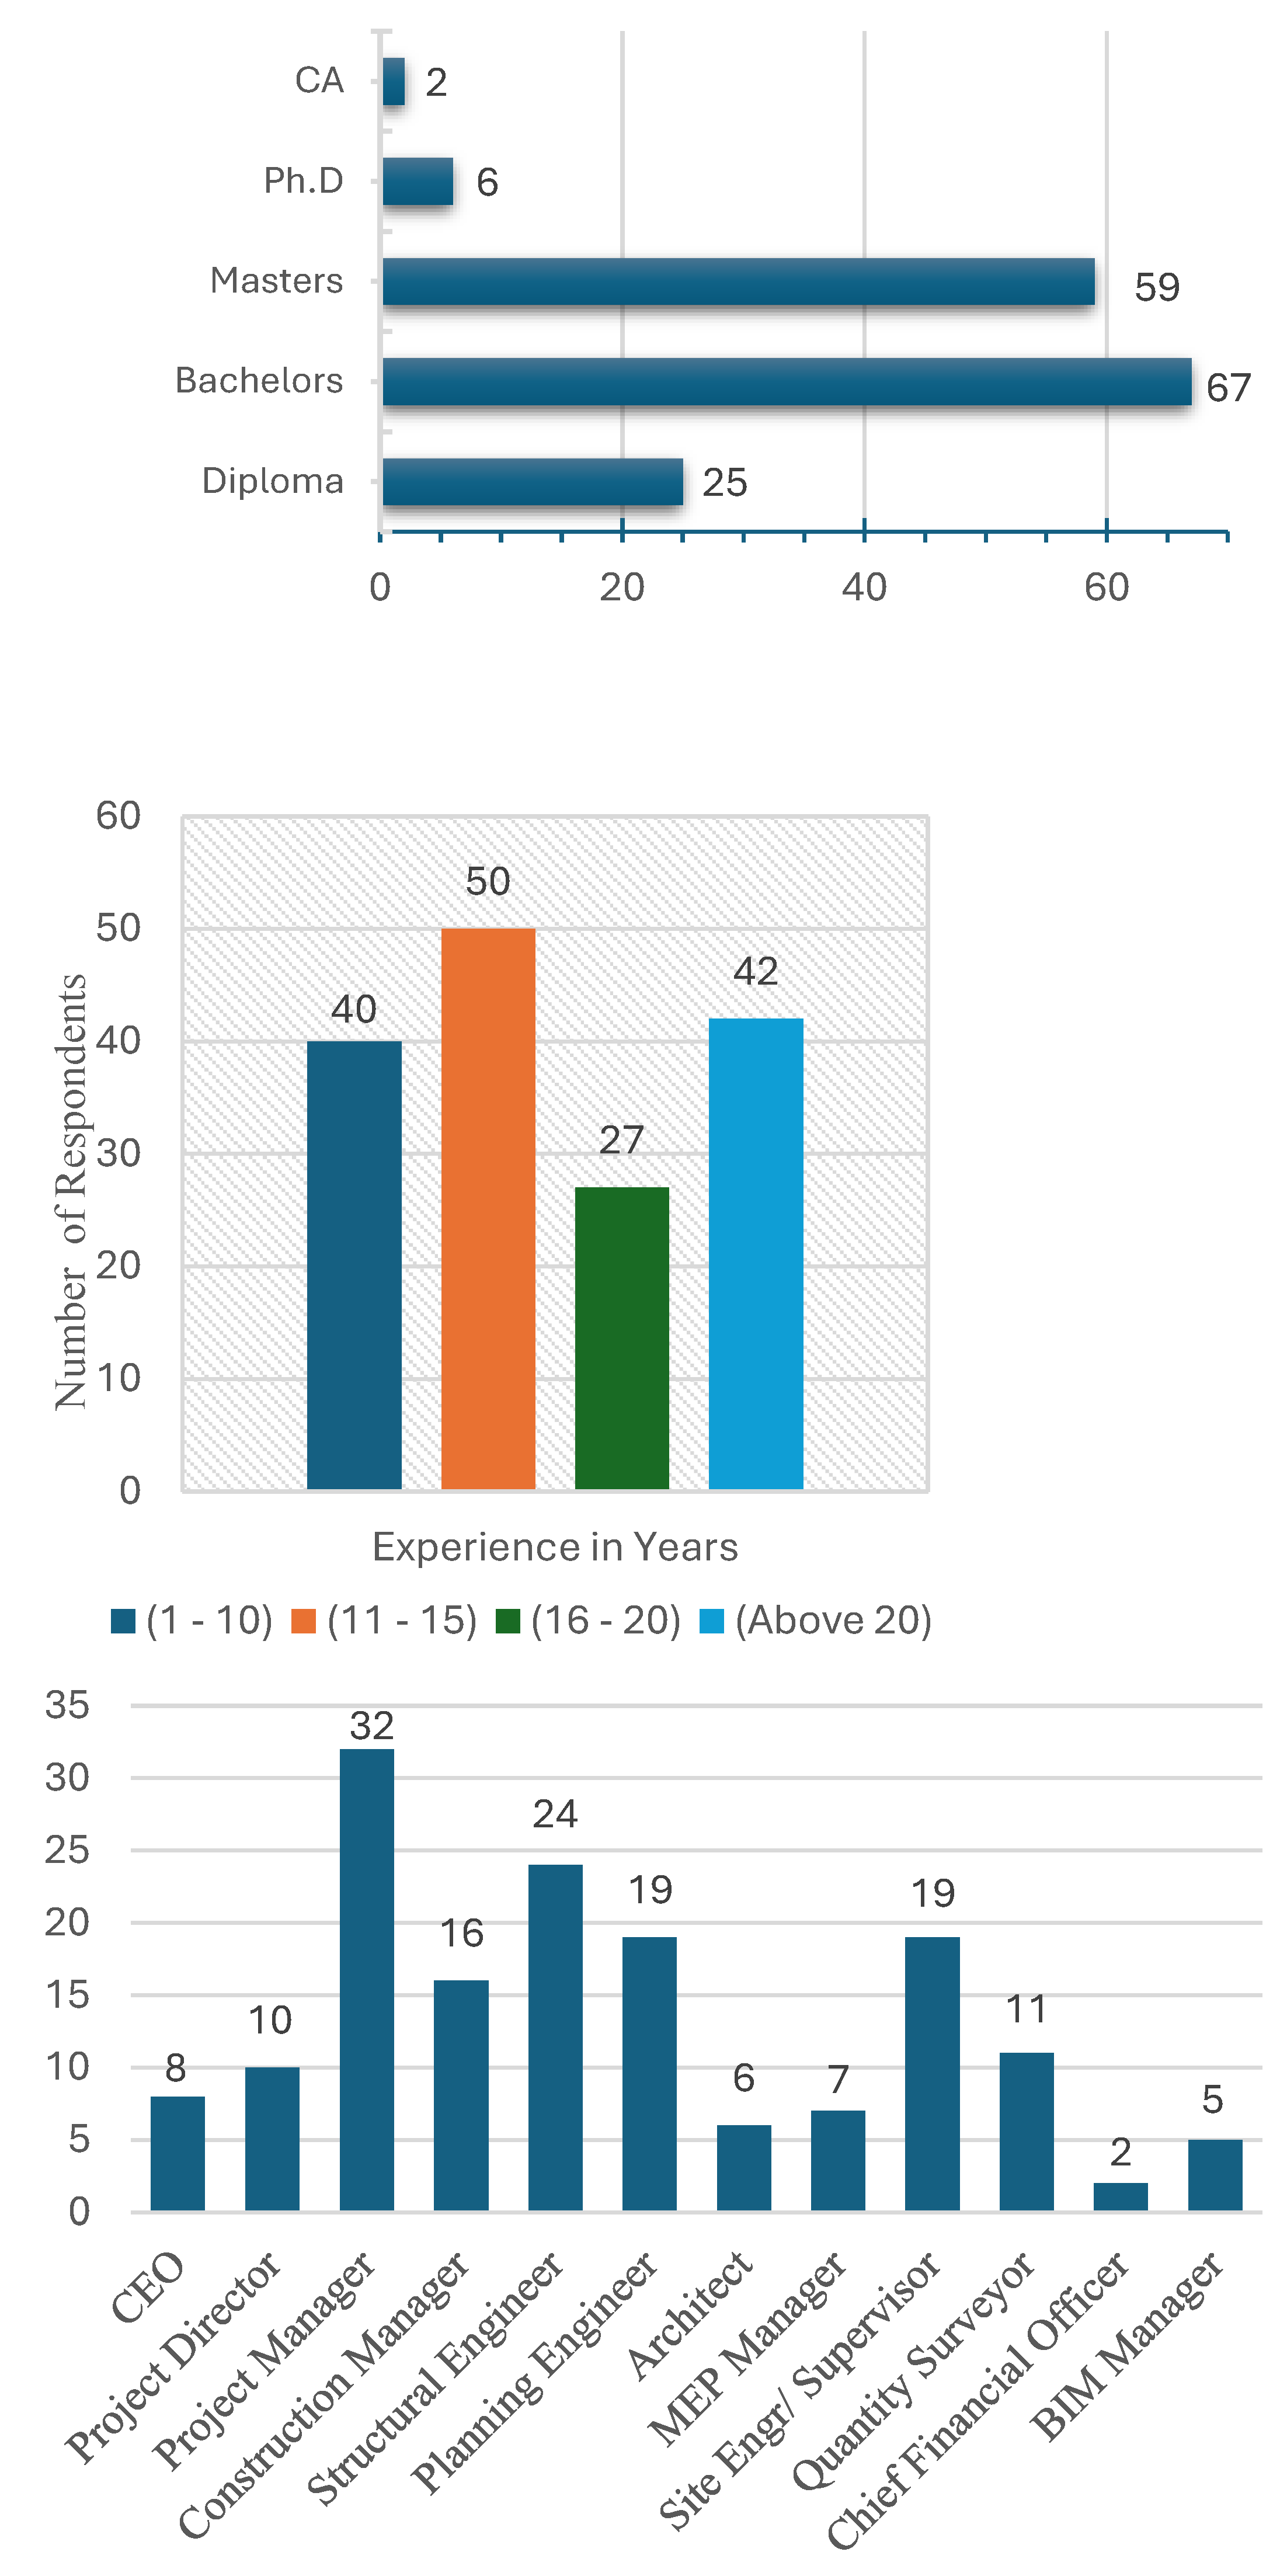
42 respondents had a vast experience of more than 20 years, and they provided valuable insight into the decision support aspects on fast-track projects and also highlighted the need for evaluating the impact of quality and cost on project duration on fast-track projects. The distribution of respondents as per their role in the industry are also shown in the demographic analysis.
Statistical Analysis
Data Screening.Table 6 shows that all the observed values were as per the range of the Likert scale, no outliers and missing values were observed. Skewness and kurtosis values were between -2 and +2 hence data was normally distributed as reflected in table 6. Harman’s one-factor test was used to rule out common method bias (CMB) showing that the first indicator accounted for 38.43% of the overall variance which is < 50% thus CMB is not influencing the outcome of the study [63].
Measurement Model (CFA)
Composite reliability (ρ_c) and Cronbach’s Alpha (α) are used to establish internal consistency and reliability of the constructs. Values for all the constructs were greater than 0.7 thus internal consistency and reliability is established. The convergent validity of the constructs was assessed using Average variance extracted (AVE). The AVE values of all the constructs were greater than 0.5 less quality variance which also improved after eliminating the indicators with factor loadings less than 0.7 (Figure 7) thus establishing convergent validity for the constructs. All the values are shown in Table 6.
The discriminant validity of the constructs was established using the Fornell and Larcker criterion and the HTMT ratio. The Fornell and Larcker criterion suggests that the correlation value for a construct with itself should be greater than other constructs and the HTMT values for the constructs should be less than 0.85 implying that the constructs are empirically and statistically different thus establishing discriminant validity. Table 7 shows the Fornell and Larcker criterion values and HTMT values establishing discriminant validity.
Multicollinearity amongst the constructs was assessed using variance inflation factor (VIF). Multicollinearity refers to the high correlation between independent variables in the model that can cause issues such as inflated standard errors and difficulties in interpreting the individual contributions of variables. Table 8 shows that the VIF values for all the constructs are < 3.5 thus verifying that multicollinearity does not exist in the model.
Model Fit
Model fit refers to the degree to which a statistical model accurately represents the observed data. In SEM, model fit is used to assess how well the hypothesized model aligns with the empirical data. A good model fit indicates that the model provides a reasonable explanation for the observed data, while poor model fit suggests that the model may need modification to better represent the existing relationships. The SRMR and NFI values of the model were 0.65 < 0.85 and 0.801 which is between 0.6 to 1.0 respectively and that of the GFI and chi-square/df were 0.651 > 0.36 and 2.16 < 3.0 respectively thus verifying a good model fit hence the model is appropriate for the next phase of statistical analysis i.e., path analysis.
Structural Model (Path Analysis)
Path analysis is a statistical technique that allows the researchers to model the direct and indirect effects of variables on each other, providing a visual representation of the hypothesized relationships. The results of hypotheses testing and β (path coefficient) values in Table 9 and Table 10 provide a useful insight into the cost-quality impact on project duration which are discussed as follows.
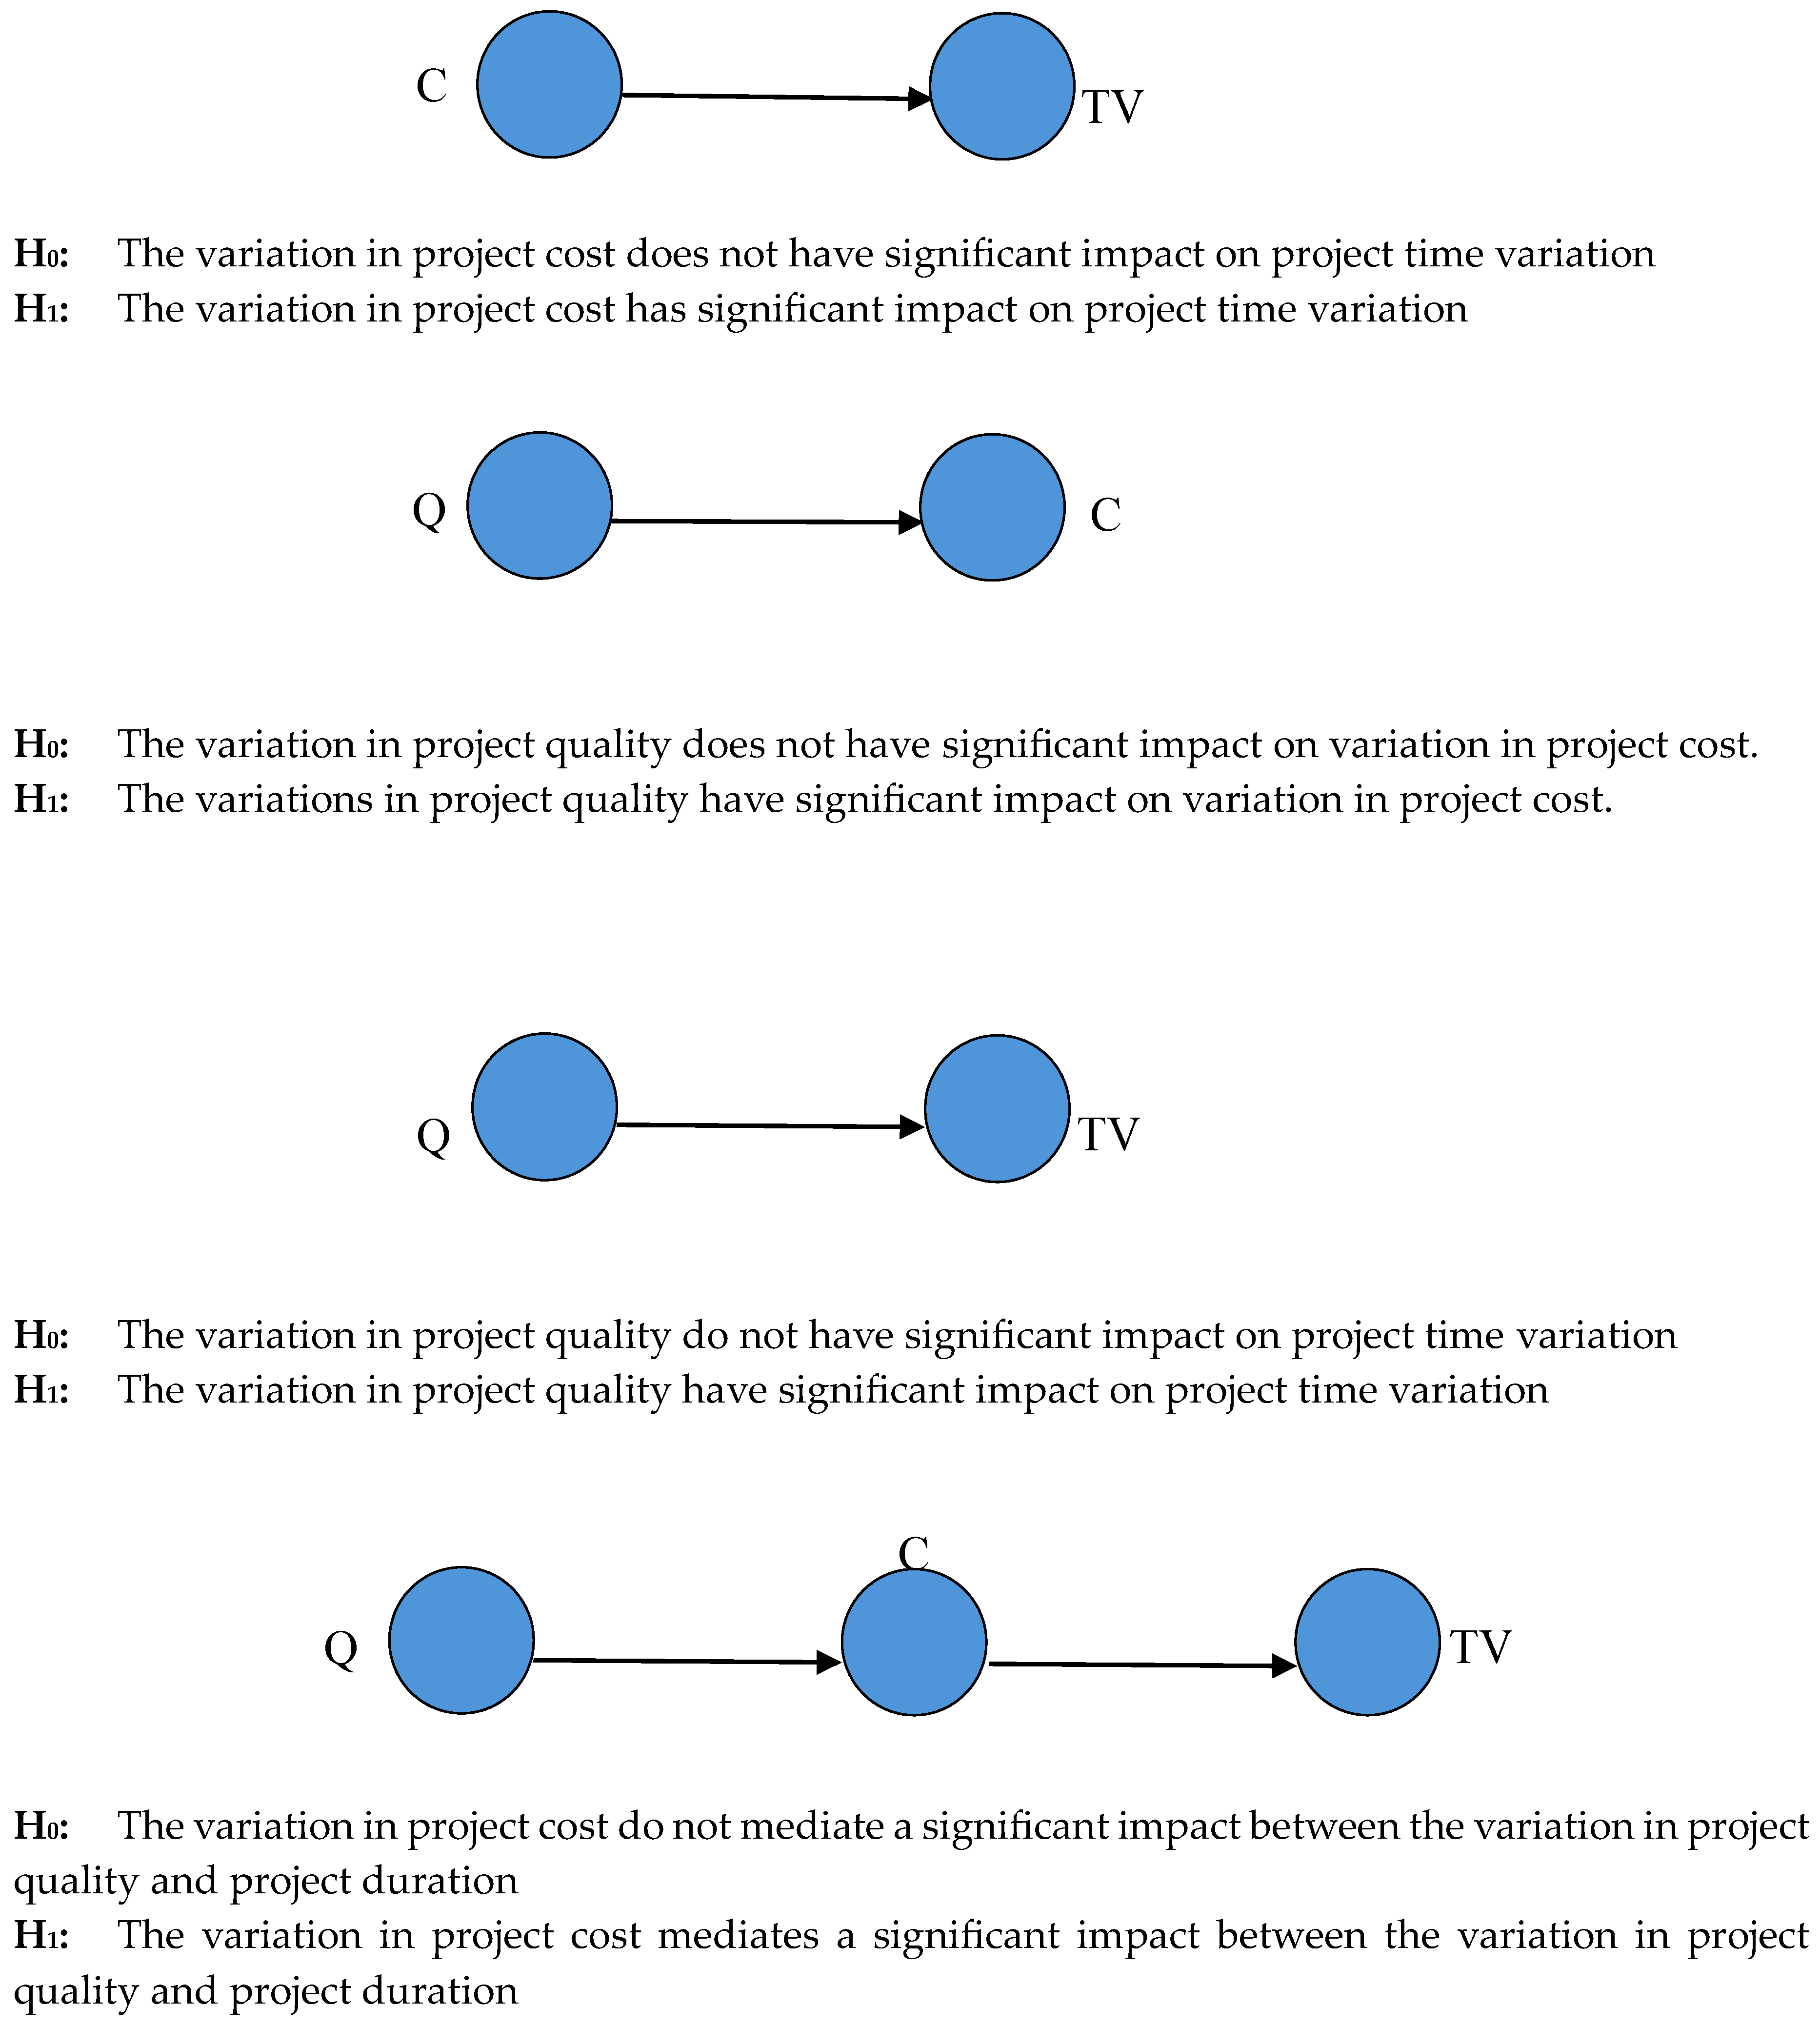
Hypothesis 1
With β = 0.664 and p-value < 0.05, the variation in project cost has a strong positive and a significant relation with variation in project duration therefore H1 is accepted. The hypothesis revealed that 1-unit increase in project cost will increase the project duration by 0.664-units.
Hypothesis 2
With β = 0.615 and p-value < 0.05, variance in project quality has a strong positive relation with project cost variance and the relation is significant hence null hypothesis (Ho) is rejected and alternate hypothesis (H1) is accepted. The hypothesis suggests that with 1-unit variation in quality, the project cost will variate by 0.615-units.
Hypothesis 3
With β = 0.722 and p-value < 0.05, quality variations have a strong positive and a significant relation with time variation therefore null hypothesis is rejected and alternate hypothesis (H1) is accepted. The hypothesis results indicate that if the quality of a project deteriorates by 1-unit, the project duration will increase by 0.722-units.
Hypothesis 4 (Mediation Analysis)
The β value 0.561 and p-value > 0.05 indicate that cost variance mediates a strong positive and a significant relation between quality variation and project duration thus null hypothesis is rejected and alternate hypothesis (H1) is accepted. The hypothesis reveal that if the project quality deteriorates by 1-unit, the project duration will increase by 0.561-units through project cost variance.
Explanatory Power of the Model
The hypothesized model (Figure 7) should be able to accurately describe and account for the observed patterns and relationships among variables in the data and this ability of the model is known as its explanatory power. The coefficient of determination (R2) and f2 are used to assess the explanatory power of the model. In Figure 7, the R2 for TV is 0.784 hence 78.4% of the changes in project duration are attributable to changes in project cost and quality. Similarly, R2 for CV is 0.729 hence 72.9% of the variation in project cost is attributable to variation in project quality. f2 is the extension of R2 which is used to indicate the proportion of variance in an endogenous variable that is uniquely explained by a specific exogenous variable. f2 values in table 8 indicate that cost variance has an enormous effect on project duration (0.604) and quality variance has an enormous impact on project cost (0.362) whereas quality variance has a medium impact on time variance (0.213).
Predictive Relevance of the Structural Model
The model’s ability to predict outcomes with the data that were not used to estimate the model is called its predictive relevance. Table 11 shows that all the values of Q2 are > 0 thus predictive relevance of the model is established. Similarly, all the PLS_RMSE and PLS_MAE values are less than LM_RMSE and LM_MAE values therefore the model has high out-of-sample predictability.
Another predictive relevance method is the CVPAT (Cross Validation Predictive ability test), in which the dataset is divided into training and testing sets. The model is estimated on the training set, and its predictive performance is evaluated on the testing set. This helps estimate how well the model would perform on new data. The CVPAT results in Table 12 show that all the values of average loss difference are negative for both IA and LM moreover the p-values are < 0.05 which supports the hypothesis that predictive ability of PLS-SEM is better than IA and LM thus indicating high out-of-sample predictive power of this decision-making model.
Importance-Performance Map Analysis – IPMA
IPMA results in Figure 8 and Table 13 show that CV with highest performance (89.124%) and importance (0.641) lies in first quadrant suggesting to continue time and resource allocation to decisions that lead to cost variation such that 1-unit improvement in project cost will result in 0.684-unit improvement in project duration. Although QV is performing well at 77.383% but its importance as per the stakeholders is -0.018 placing it in the fourth quadrant implying overkilling of time and resources which is counter-productive, indicating that on fast-track projects efforts to improve the quality by 1-unit will result in adverse effects (-0.018) on project duration. Similarly, at the indicator level, IPMA helps a decision-maker in knowing which decision criterion requires the most and the least time and resources. Figure 9 and Table 14 clearly show that CV-6, CV-7, CV-2, CV-3, CV-1 respectively have the highest performance and importance whereas QV-10, QV-11QV-12, QV-9 have counter-productive effects on project duration on fast-track projects which is also supported by the literature that over-extending the resources to achieve quality on fast-track is the least desired aspect.
Research Findings
The research revealed that both cost and quality variations significantly impact project duration in fast-track construction projects. The analysis found a strong positive relationship between cost increases and extended project duration, with a path coefficient of 0.664 (p < 0.05). Similarly, quality deterioration was associated with a notable increase in project duration, with a coefficient of 0.722 (p < 0.05). Additionally, cost variance was positively related to quality variance (β = 0.615, p < 0.05), indicating that lower quality contributes to higher costs. Mediation analysis showed that cost variance significantly mediates the relationship between quality variations and project duration, with a coefficient of 0.561 (p < 0.05). This suggests that changes in cost play a key role in how quality variations affect project timelines. The model demonstrated a high explanatory power with R² values of 0.784 for project duration and 0.729 for cost variance, confirming its robustness and accuracy in capturing the relationships among the variables. The f 2 values indicate large effect size of variations in project cost and quality on project duration on fast-track schedule whereas variance in project quality has a moderate effect on variations in project cost. IPMA suggests that decisions related to variations in project cost are the most important on fast-track projects as compared to quality related ones and are placed in quadrant-I of IPMA which means that these decisions represent opportunities to achieve superior level of target construct that is project duration. However, the quality relate decisions are placed in quadrant-IV which means that the respondents perceive the quality related decision as good performer but their importance according to the stakeholders in the fast-track construction domain is very low. At the indicator level, CV-6 (Early Procurement of Long-Lead-Time Items), CV-7 (Implement scope freeze approach during early design stage) and CV-2 (Over-designing the facility) are the best performing and the most the important decision criteria that contribute towards enhancing fast-track project performance in term of achieving shorter duration. Moreover, QV-10 (90% acceptable quality compromise), QV-11 (Early contractor involvement during design stage), QV-12 (Involving O&M personnel early in the design stage) and QV-9 (Submit Quality Management Plan during pre-design phase) are the decision criteria which are performing very well towards the target variable, but their importance is very less which indicates that over-extending the resources on these criteria will negatively impact the fast-track project performance.
Conclusions
The research commenced with a need to analyze the impact of cost and quality variances on variations in project duration for fast-track projects which could ultimately support the decision-making process. The proposed model addresses this need by identifying, ranking, and evaluating each decision-making criteria according to its impact on time, cost and quality variances. Moreover, this model also evaluates the impact of variations in cost and quality on the target variable i.e., time variance or project duration for fast-track building projects. PLS-SEM provided the sound basis for the development of this model through statistical analysis by evaluating the interrelationship amongst the latent and observed variables. 37 decision criteria were shortlisted after literature review, Delphi process and pilot survey which were assigned to respective latent variables (time, cost and quality variances) after consultation with industry experts. The data collected on 5-point Likert scale was statistically analyzed using SEM. 4 hypothesis were tested along with mediation analysis which provided statistical evidence of the impact of exogenous latent variables on endogenous latent variable and confirmed that variations in cost and quality have a statistically positive significant relation with variations in project duration on fast-track projects. The hypothesis and the IPMA results conclude that variations in project cost (+ive cash-flow or -ive cash-flow) has the greatest impact on project duration and decisions related to project cost are the most crucial and require deliberation. Moreover, the focus on quality optimization decisions will have counter-productive impact on project duration. The proposed model has a good model-fit with high out-of-sample predictability, making it a universally applicable model for fast-track high-rise projects. This model is amongst those very few models in construction management that have established out-of-sample predictability using CVPAT along with Q2, RMSE and MAE. This decision support model will assist the professionals in delivering a fast-track building project in the shortest time with lowest cost and highest quality.
Author Contributions
For research articles with several authors, a short paragraph specifying their individual contributions must be provided. Conceptualization, Ishtiaq Hassan; methodology, Shuja Safdar; software, Mustafa Sultan; validation, Ishtiaq Hassan and Shuja Safdar; formal analysis, Mustafa Sultan; data curation, Mustafa Sultan; writing—original draft preparation, Ishtiaq Hassan and Mustafa Sultan; writing—review and editing, Mustafa Sultan; supervision, Ishtiaq Hassan. All authors agree to the published version of the manuscript.
Funding
This research received no external funding.
Conflicts of Interest
The authors declare no conflicts of interest.
References
- Rasul, N.; Malik MS, A.; Bakhtawar, B.; Thaheem, M.J. (2021). Risk assessment of fast-track projects: a systems-based approach. International Journal of Construction Management, 1099. [Google Scholar]
- Emuze, F.; Oladokun, M. (2020). Exploring the Quality Management Methods Adopted by Contractors in Fast-Track Construction Projects in Eastern Cape. The Construction Industry in the Fourth Industrial Revolution: Proceedings of 11th Construction Industry Development Board (CIDB) Postgraduate Research Conference 11.
- Taghaddos, M.; Mousaei, A.; Taghaddos, H.; Hermann, U.; Mohamed, Y.; AbouRizk, S. (2024). Optimized variable resource allocation framework for scheduling of fast-track industrial construction projects. Automation in Construction, 158, 105208. [CrossRef]
- Project Management Institute. (2023). A guide to the project management body of knowledge (PMBOK® guide) (7th ed.). Project Management Institute.
- El-Far, M.E.; Kotb, M.; Sabry, R. (2023). Controlling fast-track construction method variables (time, cost and quality). Infrastructure Asset Management, 40, 1–10. [CrossRef]
- Prawirawati, R.; Suharyanto, A.; Pujiraharjo, A. (2022). Comparison of What If, Fast-Track, and Crash Methods for Acceleration Of Project Delay. Rekayasa Sipil, 16, 101–109.
- Cho, K.; Hyun, C.; Koo, K.; Hong, T. (2010). Partnering process model for public-sector fast-track design-build projects in Korea. Journal of management in engineering, 26(1),19-29. [CrossRef]
- Skaik, S. (2014, January). Beware fast tracking complex high rise buildings. In Mastering Complex Projects Conference (pp. 270-282).
- Mubarak, S. A. (2015). Construction project scheduling and control. John Wiley & Sons.
- Austin, R.B.; Pishdad-Bozorgi, P.; de la Garza, J.M. (2016). Identifying and prioritizing best practices to achieve flash track projects. Journal of construction engineering and management, 142(2), 04015077. [CrossRef]
- Williams, G.V. (1995). Fast track pros and cons: Considerations for industrial projects. Journal of management in engineering, 11, 24–32. [CrossRef]
- Cho, K.; Hastak, M. (2013). Time and cost–optimized decision support model for fast-track projects. Journal of construction engineering and management, 139(1), 90-101. [CrossRef]
- Alhomadi, A.A.; Dehghan, R.; Ruwanpura, J.Y. (2011). The predictability of fast-track projects. Procedia engineering, 14, 1966-1972. [CrossRef]
- Alhumayani, H. The feasibility of 3D printing technology as a new construction method for houses in Saudi Arabia (Doctoral dissertation, Cardiff University).
- European Investment Bank. (2018). Investment Report 2018/2019: Retooling Europe's Economy. Retrieved from https://www.eib.org/en/publications/investment-report-2018.
- Hartley, C.; Perry, M.; Rogers, L. (2021). A Preliminary Analysis of US and State-Level Results From the 2020 Census. US Census Bureau.
- Memon, A.H.; Memon, A.Q.; Khahro, S.H.; Javed, Y. (2023). Investigation of Project Delays: Towards a Sustainable Construction Industry. Sustainability, 15(2), 1457.
- Asiedu, R.O.; Adaku, E.; Owusu-Manu, D.G. Beyond the causes: Rethinking mitigating measures to avert cost and time overruns in construction projects. Constr. Innov. 2017, 17, 363–380. [Google Scholar] [CrossRef]
- Gebrehiwet, T.; Luo, H. Analysis of delay impact on construction project based on RII and correlation coefficient: Empirical study. Procedia Eng. 2017, 196, 366–374. [Google Scholar] [CrossRef]
- Jeunet, J. (2024). Project acceleration using temporary workers with heterogeneous efficiency: optimal and best recruitment policies. International Journal of Production Research, 1–18. [CrossRef]
- Ballesteros-Pérez, P. (2017). Modelling the boundaries of project fast-tracking. Automation in Construction, 84, 231–241. [CrossRef]
- Dehghan, R.; Ruwanpura, J. (2011). The mechanism of design activity overlapping in construction projects and the time-cost tradeoff function. Procedia engineering, 14, 1959-1965. [CrossRef]
- Abdelbary, M.; Edkins, A.; Dorra, E.M. (2020). Reducing CRR in fast-track projects through BIM. Journal of Information Technology in Construction, 25.
- Dehghan, R.; Ruwnapura, J.Y. (2014). Model of trade-off between overlapping and rework of design activities. Journal of construction engineering and management, 140, 04013043. [CrossRef]
- Laryea, S.; Watermeyer, R. (2020). Managing uncertainty in fast-track construction projects: case study from South Africa. Proceedings of the Institution of Civil Engineers-Management, Procurement and Law, 173(2), 49-63. [CrossRef]
- Khatale, S.; Aher, M. (2017). Cost And Risk Analysis And Its Control Of Fast Track Construction To Sadhugram In Kumbhmela 2015 At Nashik.
- Tengler, M. T. (1973). Fast-track method saves time, cuts costs in construction. Hospital Topics, 51, 21–24. [CrossRef]
- Heriyanto, T. ; Kustamar; Setyobudarso, H. (2020). Application of the Fast Track Method to Accelerate the Development of the Chapel of the St. Thomas.
- Kasim, N.; Anumba, C.; Dainty, A. (2005). Improving materials management practices on fast-track construction projects. 21st Annual ARCOM Conference, University of London.
- Wearne, S. (1984). Fast-track project direction. International Journal of Project Management, 2, 240–241.
- AAttar, M.A. Boudjakdji, N. Bhuiyan, K. Grine, S. Kenai, A. Aoubed, Integrating numerical tools in underground construction process, Engineering Construction and Architectural Management 6 (4) (2009) 376–391.
- Khoueiry, Y.; Srour, I.; Yassine, A. (2013). An optimization-based model for maximizing the benefits of fast-track construction. Journal of the Operational Research, 64, 1137–1146. [CrossRef]
- Srour, I.M.; Abdul-Malak, M.-A.U.; Yassine, A.A.; Ramadan, M. (2013). A methodology for scheduling overlapped design activities based on dependency information. Automation in Construction, 29, 1–11. [CrossRef]
- Peña-Mora, F.; Li, M. (2001). Dynamic planning and control methodology for DB fast-track construction projects. Journal of construction engineering and management, 127, 1–17.
- Kalach, M.; Abdul-Malak, M.-A.; Srour, I. (2021). BIM-enabled streaming of changes and potential claims induced by fast-tracking design-build projects. Journal of Legal Affairs and Dispute Resolution in Engineering and Construction, 13, 04520042. [CrossRef]
- Fazio, P.; Moselhi, O.; Theberge, P.; Revay, S. (1988). Design impact of construction fast-track. Construction Management and Economics, 6(3), 195-208. [CrossRef]
- Bogus, S.M.; Molenaar, K.R.; Diekmann, J.E. (2006). Strategies for overlapping dependent design activities. Construction Management and Economics, 24(8), 829-837. [CrossRef]
- Squires, W.R.; Murphy, M.J. (1983). The impact of fast track construction and construction management on subcontractors. Law and Contemporary Problems, 46(1), 55-67. [CrossRef]
- Lalu, M.; Tiong, I.; Shidqul, A.M. (2019). Application of fast track method to accelerate project implementation time in the hospital construction. International Journal of Scientific Engineering and Science, 3(11), 49-53.
- Dey, P. K. (2000). Managing projects in fast track–A case of public sector organization in India. International Journal of Public Sector Management, 13(7), 588-609. [CrossRef]
- Moazzami, M.; Dehghan, R.; Ruwanpura, J. (2011). Contractual risks in fast-track projects. Procedia engineering, 14, 2552-2557. [CrossRef]
- Tighe, J. J. (1991). Benefits of fast tracking are a myth. International Journal of Project Management, 9, 49–51.
- Russell, A.D.; Ranasinghe, M. (1991). Decision framework for fast-track construction: A deterministic analysis. Construction Management and Economics, 9, 467–479. [CrossRef]
- Egbelakin, T.; Ogunmakinde, O.E.; Teshich, B.; Omotayo, T. (2021). Managing fast-track construction project in Qatar: challenges and opportunities. Buildings, 11, 640. [CrossRef]
- Elvin, G. (2007). Integrated practice in architecture: mastering design-build, fast-track, and building information modeling. John Wiley & Sons.
- Park, M. (1999). Robust control of cost impact on fast-tracking building construction projects Massachusetts Institute of Technology.
- Das, K. (2018). Strategies of fast-track mode of construction. Int. Res. J. Eng. Technol, 5, 4995–4999.
- Deshpande, A.S.; Salem, O.M.; Miller, R.A. (2012). Analysis of the higher-order partial correlation between CII best practices and performance of the design phase in fast-track industrial projects. Journal of construction engineering and management, 138, 716–724. [CrossRef]
- Arefazar, Y.; Nazari, A.; Hafezi, M.R.; Maghool SA, H. (2022). Prioritizing agile project management strategies as a change management tool in construction projects. International Journal of Construction Management, 22(4), 678-689. [CrossRef]
- Kalirajan, S.; Vishnuram, B. ; G. (2010). Fast-track Construction - The Need Of The Hour.
- Bouhmoud, H.; Loudyi, D. (2022). BIM framework, potential and challenges. International Journal of Information Science and Technology, 5, 24–35.
- Malik, Q.; Nasir, A.R.; Muhammad, R.; Thaheem, M.J.; Ullah, F.; Khan KI, A.; Hassan, M.U. (2021). BIMp-Chart—A Global Decision Support System for Measuring BIM Implementation Level in Construction Organizations. Sustainability, 13, 9270. [CrossRef]
- Loudyi, D.; Azhar, S. (2022). BIM for Fast-track Construction under COVID-19 Circumstances: A Comparative Case Study in the African Context.
- Vijayan, D.; Johny, M.A. (2019). A Study of Implementing Lean & Fast-tracking in Construction Project Management. International Research Journal of Engineering and Technology.
- Kim, H.S.; Hwang, J.Y.; Kang, H.J.; Park, S.M.; Lee, J.H.; Kang, L.S. (2022). Application Method of Phase Division of Fast Track for Construction Project with Complex Structures. KSCE Journal of Civil and Environmental Engineering Research, 42, 95–105.
- de la Garza, J.M.; Pishdad-Bozorgi, P. (2018). Workflow process model for flash track projects. Journal of construction engineering and management, 144, 06018001.
- Alp, N.; Stack, B. (2012). Scope management and change control process study for project-based companies in the construction and engineering industries. 2012 Proceedings of PICMET'12: Technology Management for Emerging Technologies.
- Hossain, M.; Chua, D. (2014). Overlapping design and construction activities and an optimization approach to minimize rework. International Journal of Project Management, 32, 983–994. [CrossRef]
- Dash, G.; Paul, J. (2021). CB-SEM vs PLS-SEM methods for research in social sciences and technology forecasting. Technological Forecasting and Social Change, 173, 121092. 1210. [Google Scholar] [CrossRef]
- Memon, M.A.; Ramayah, T.; Cheah, J.-H.; Chuah, F.; Cham, T.H. (2021). PLS-SEM statistical programs: a review. Journal of Applied Structural Equation Modeling, 5(1), 1-14.
- Ali, A.H.; Kineber, A.F.; Elyamany, A.; Ibrahim, A.H.; Daoud, A.O. (2023). Modelling the role of modular construction's critical success factors in the overall sustainable success of Egyptian housing projects. Journal of Building Engineering, 71, 106467.
- Molwus, J.J.; Erdogan, B.; Ogunlana, S. (2017). Using SEM to understand the relationships among critical success factors for stakeholder management in construction. Engineering, construction and architectural management, 24(3), 426-450.
- Kineber Massoud, M.; Hamed, M.; Qaralleh, T. Kineber Massoud, M.; Hamed, M.; Qaralleh, T. (2023). Exploring Sustainable Interior Design Implementation Barriers: A Partial Least Structural Equation Modeling Approach. Sustainability, 15(5), 4663. [CrossRef]
- Al-Mekhlafi, A.-B.A.; Isha AS, N.; Chileshe, N.; Abdulrab, M.; Ajmal, M. (2021). Impact of safety culture implementation on driving performance among oil and gas tanker drivers: a partial least squares structural equation modelling approach. Sustainability, 13(16), 8886.
- Hair Jr, J. F. , Hult GT, M.; Ringle, C.M.; Sarstedt, M.; Danks, N.P.; Ray, S.; Hair, J.F.; Hult GT, M.; Ringle, C.M.; Sarstedt, M. (2021). Evaluation of formative measurement models. Partial Least Squares Structural Equation Modeling Using R: A Workbook, 91-113.
- Xiong, B.; Skitmore, M.; Xia, B. (2015). A critical review of structural equation modeling applications in construction research. Automation in Construction, 49, 59–70. [CrossRef]
- Kineber, Hamed, Alyanbaawi, Elmansoury, & Daoud. (2023). Decision making model for identifying the cyber technology implementation benefits for sustainable residential building: a mathematical PLS-SEM approach. Sustainability, 15, 2458.
- Rosli, M.F.; Muhammad Tamyez, P.F.; Zahari, A.R. (2023). The effects of suitability and acceptability of lean principles in the flow of waste management on construction project performance. International Journal of Construction Management, 23, 114–125. [CrossRef]
- Attia, E.-A.; Alarjani, A.; Uddin, M.S.; Kineber, A.F. (2023). Examining the influence of sustainable construction supply chain drivers on sustainable building projects using mathematical structural equation modeling approach. Sustainability, 15(13), 10671. [CrossRef]
- Waqar, A.; Othman, I.; Pomares, J.C. (2023). Impact of 3D printing on the overall project success of residential construction projects using structural equation modelling. International Journal of Environmental Research and Public Health, 20(5), 3800. [CrossRef]
- AL-Khatib, A.W.; Ramayah, T. (2023). Big data analytics capabilities and supply chain performance: testing a moderated mediation model using partial least squares approach. Business Process Management Journal, 29, 393–412. [CrossRef]
- Zhao, L.; Wang, B.; Mbachu, J.; Liu, Z. (2019). New Zealand building project cost and its influential factors: A SEM approach. Advances in Civil Engineering, 2019.
- Zeng, N.; Liu, Y.; Gong, P.; Hertogh, M.; König, M. (2021). Do right PLS and do PLS right: A critical review of the application of PLS-SEM in construction management research. Frontiers of Engineering Management, 8, 356–369. [CrossRef]
- Eybpoosh, M.; Dikmen, I.; Talat Birgonul, M. (2011). Identification of risk paths in international construction projects using structural equation modeling. Journal of construction engineering and management, 137(12), 1164-1175. [CrossRef]
- Li, T.; Li, Z.; Dou, Y. (2023). Diffusion prediction of prefabricated construction technology under multi-factor coupling. Building Research & Information, 51, 333–353. [CrossRef]
- Soper, D. D. (2024). A-priori Sample Size Calculator for Structural Equation Models. Dr. Daniel Soper. Retrieved 23 November 2023 from https://www.danielsoper.com/statcalc/default.aspx.
- Hasegawa, Y.; Lau, S.-K. (2022). Comprehensive audio-visual environmental effects on residential soundscapes and satisfaction: Partial least square structural equation modeling approach. Landscape and urban planning, 220, 104351. [CrossRef]
- Paraschi, E.P.; Georgopoulos, A.; Papanikou, M. (2022). Safety and security implications of crisis-driven austerity HRM practices in commercial aviation: a structural equation modelling approach. Safety science, 147, 105570. [CrossRef]
- Kineber, A.F.; Oke, A.E.; Alyanbaawi, A.; Abubakar, A.S.; Hamed, M.M. (2022). Exploring the Cloud Computing Implementation Drivers for Sustainable Construction Projects—A Structural Equation Modeling Approach. Sustainability, 14(22), 14789. [CrossRef]
- Adabre, M.A.; Chan, A.P.; Edwards, D.J.; Adinyira, E. (2021). Assessing critical risk factors (CRFs) to sustainable housing: The perspective of a sub-Saharan African country. Journal of Building Engineering, 41, 102385. [CrossRef]
- Ringle, C.M.; Sarstedt, M.; Sinkovics, N.; Sinkovics, R.R. (2023). A perspective on using partial least squares structural equation modelling in data articles. Data in Brief, 48, 10907. [CrossRef]
- Chopra, A.; Sahoo, C.K.; Patel, G. (2023). Exploring the relationship between employer branding and talent retention: the mediation effect of employee engagement. International Journal of Organizational Analysis. [CrossRef]
- Aghimien, D.; Aigbavboa, C.; Matabane, K. (2023). Dynamic capabilities for construction organizations in the fourth industrial revolution era. International Journal of Construction Management, 23, 855–864. [CrossRef]
- Akter, S.; D'ambra, J.; Ray, P. (2011). An evaluation of PLS based complex models: the roles of power analysis, predictive relevance and GoF index.
- Kumar, P.; Islam, M.A.; Pillai, R.; Sharif, T. (2023). Analysing the behavioural, psychological, and demographic determinants of financial decision making of household investors. Heliyon, 9. [CrossRef]
Figure 1.
Overlapping Mechanism [9].
Figure 1.
Overlapping Mechanism [9].
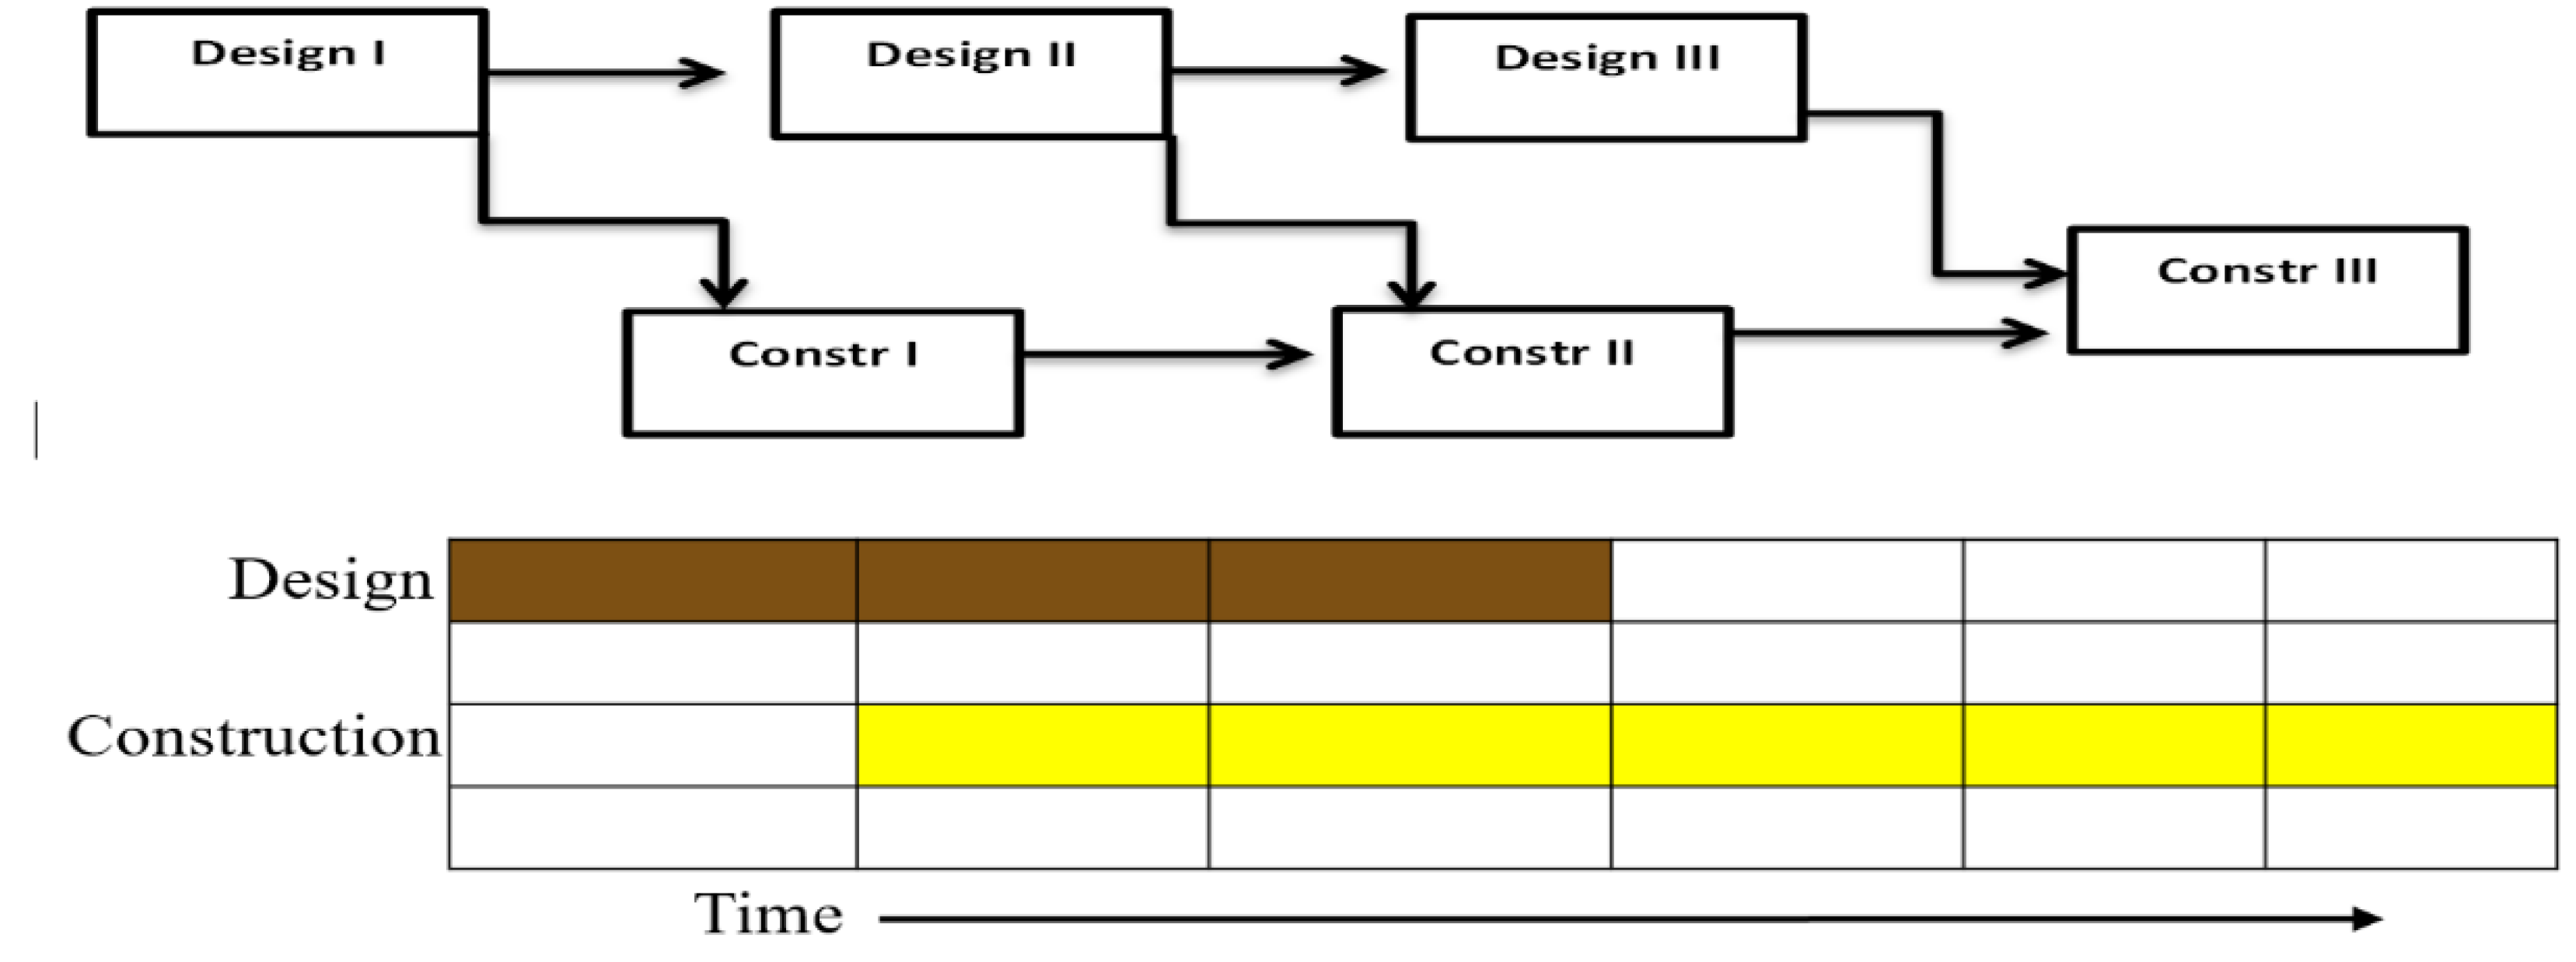
Figure 2.
Relationship between the latent constructs (time, cost and quality variance).
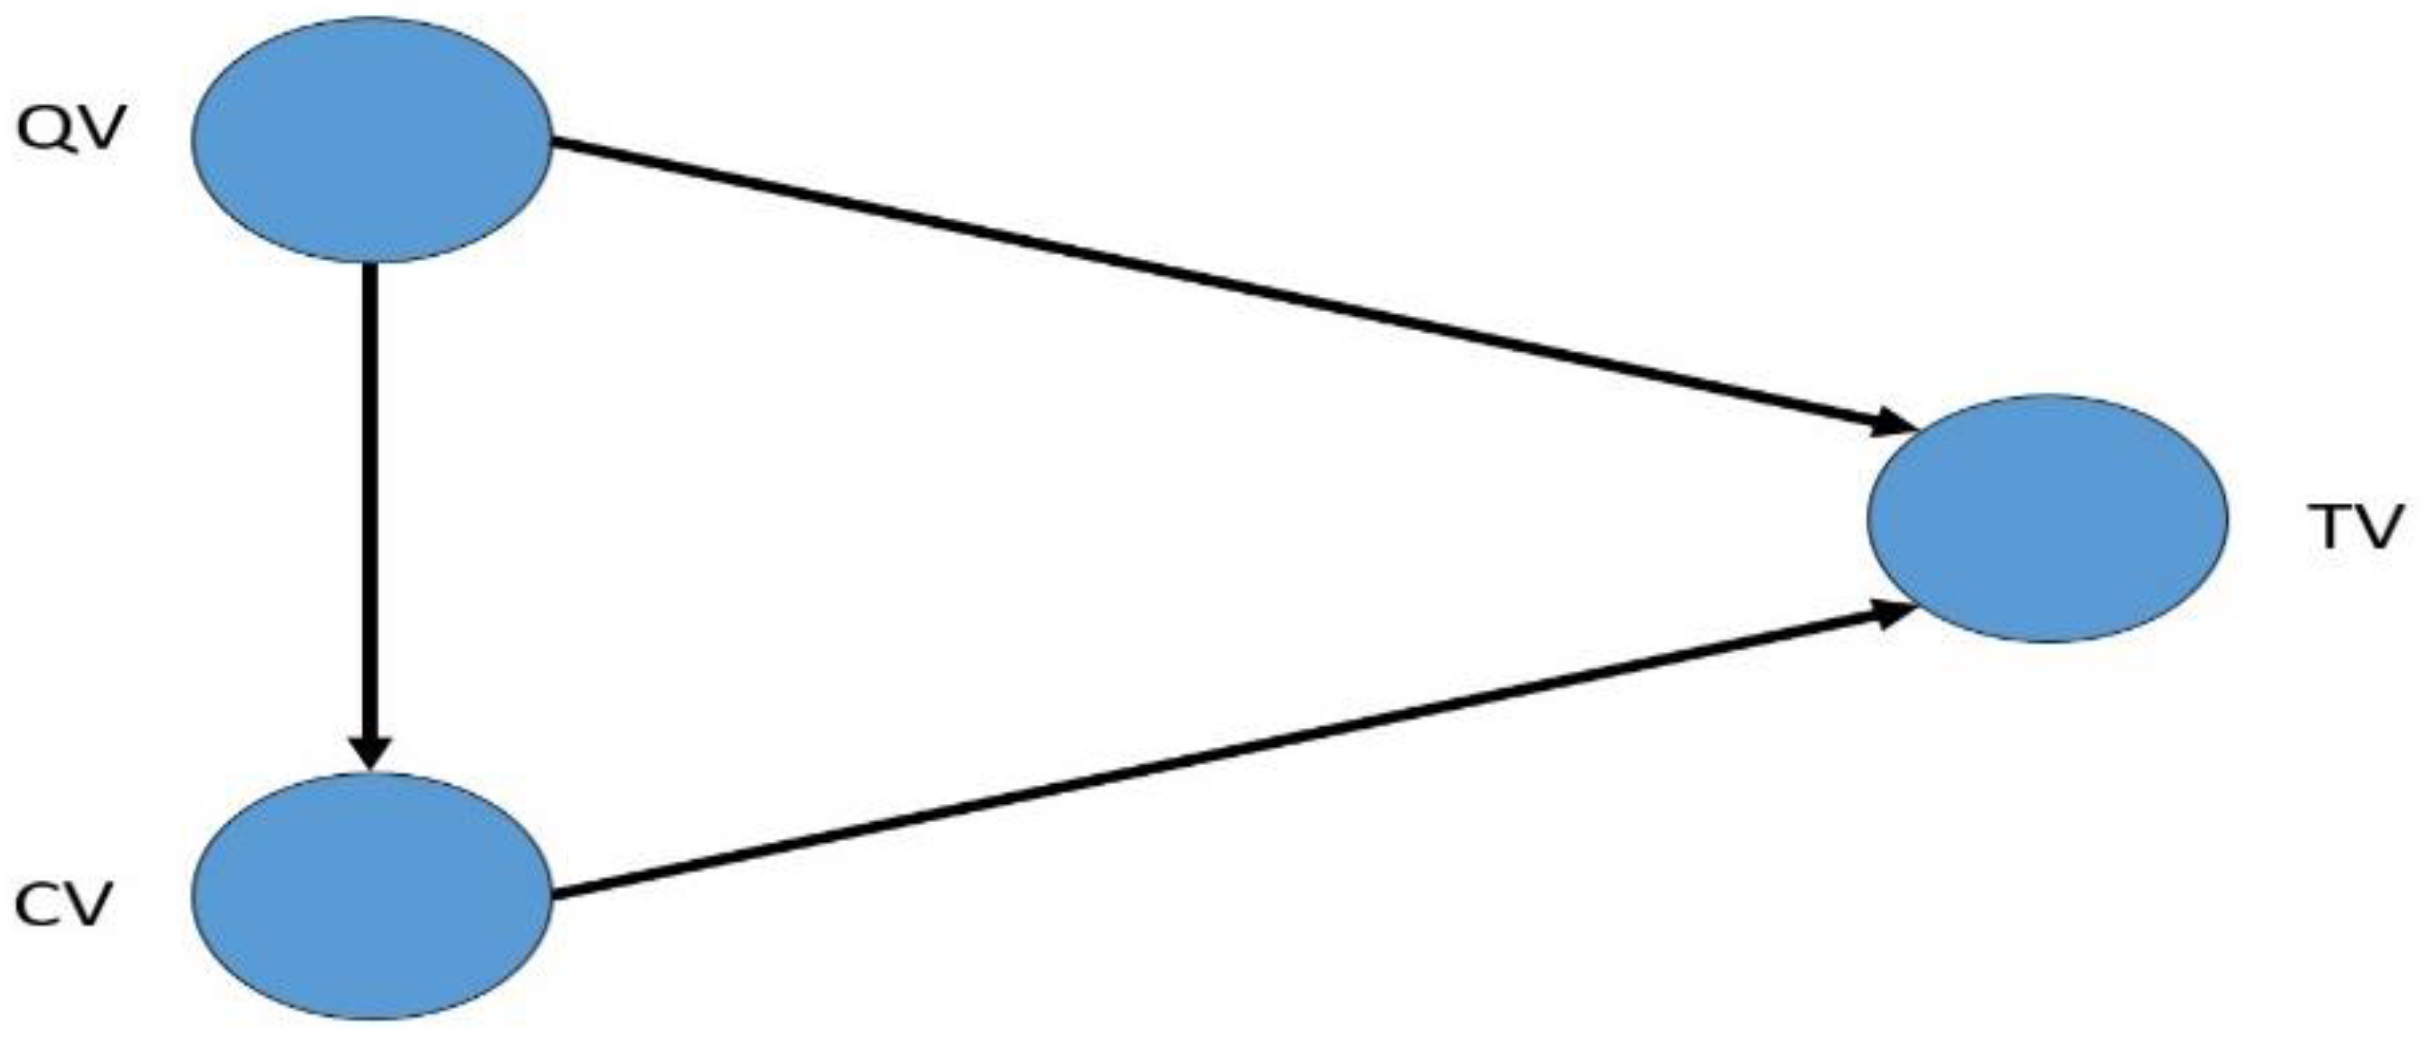
Figure 5.
Delphi Process.
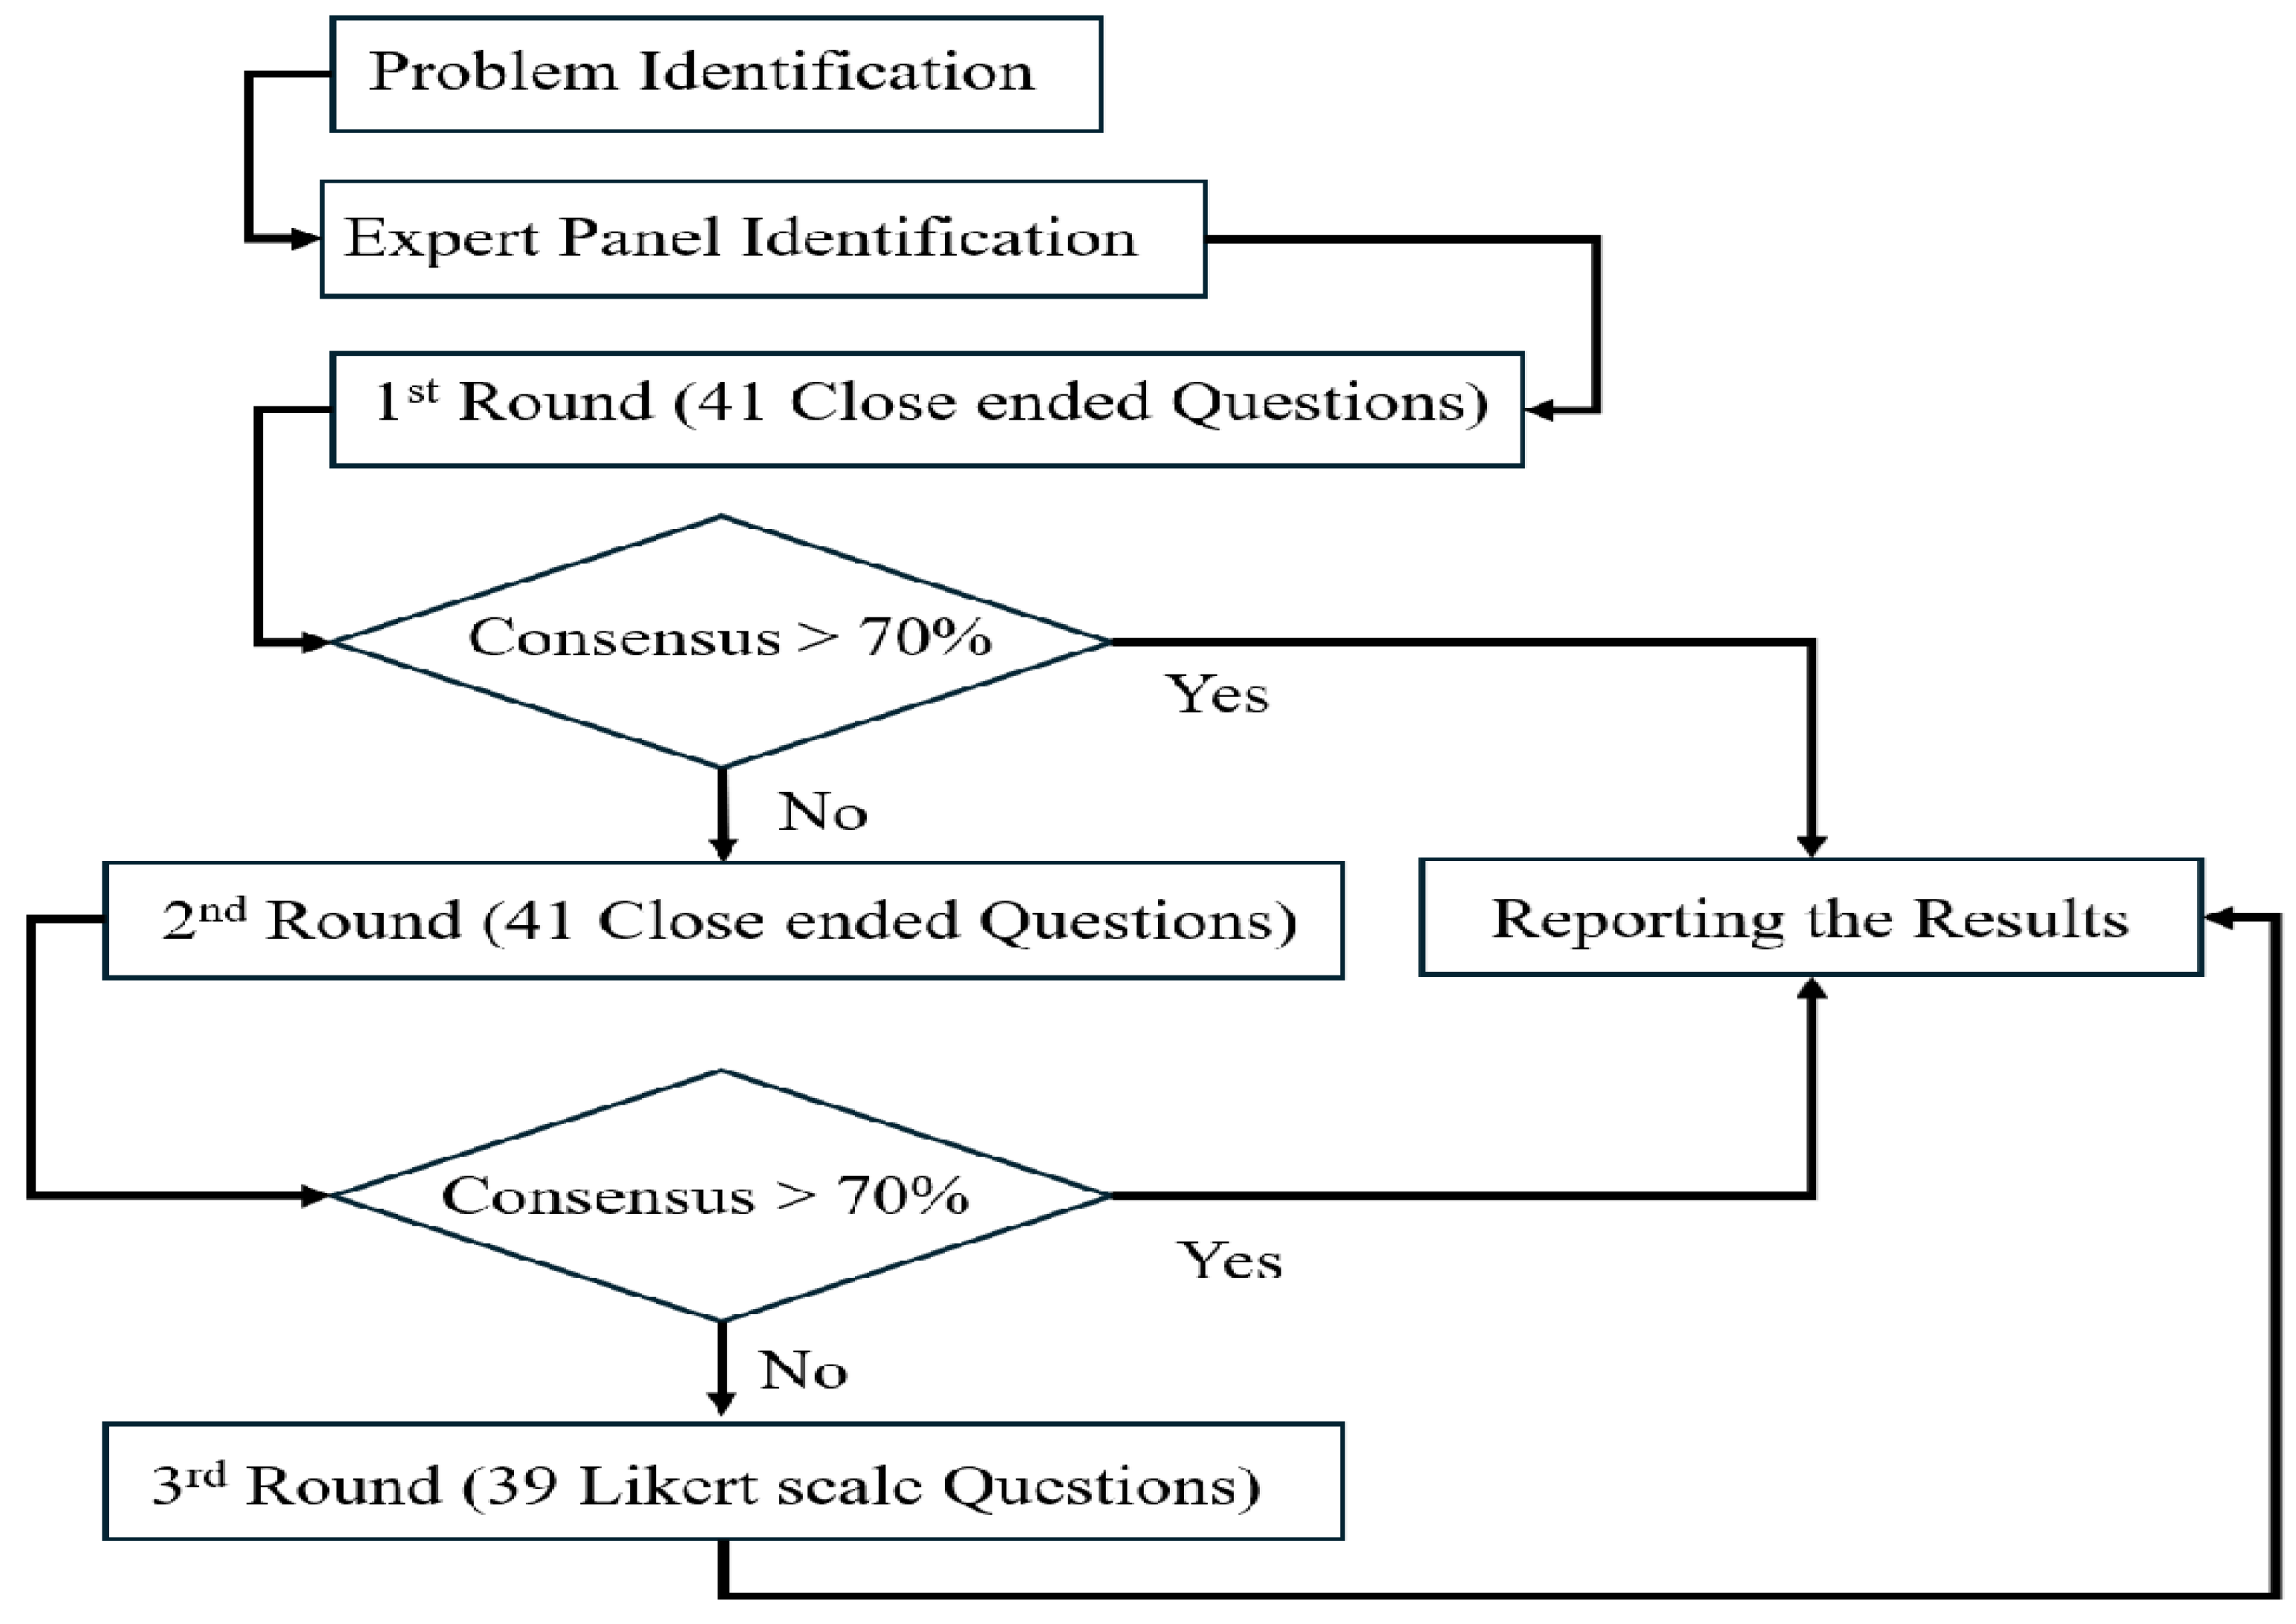
Figure 6.
SEM Flowchart.
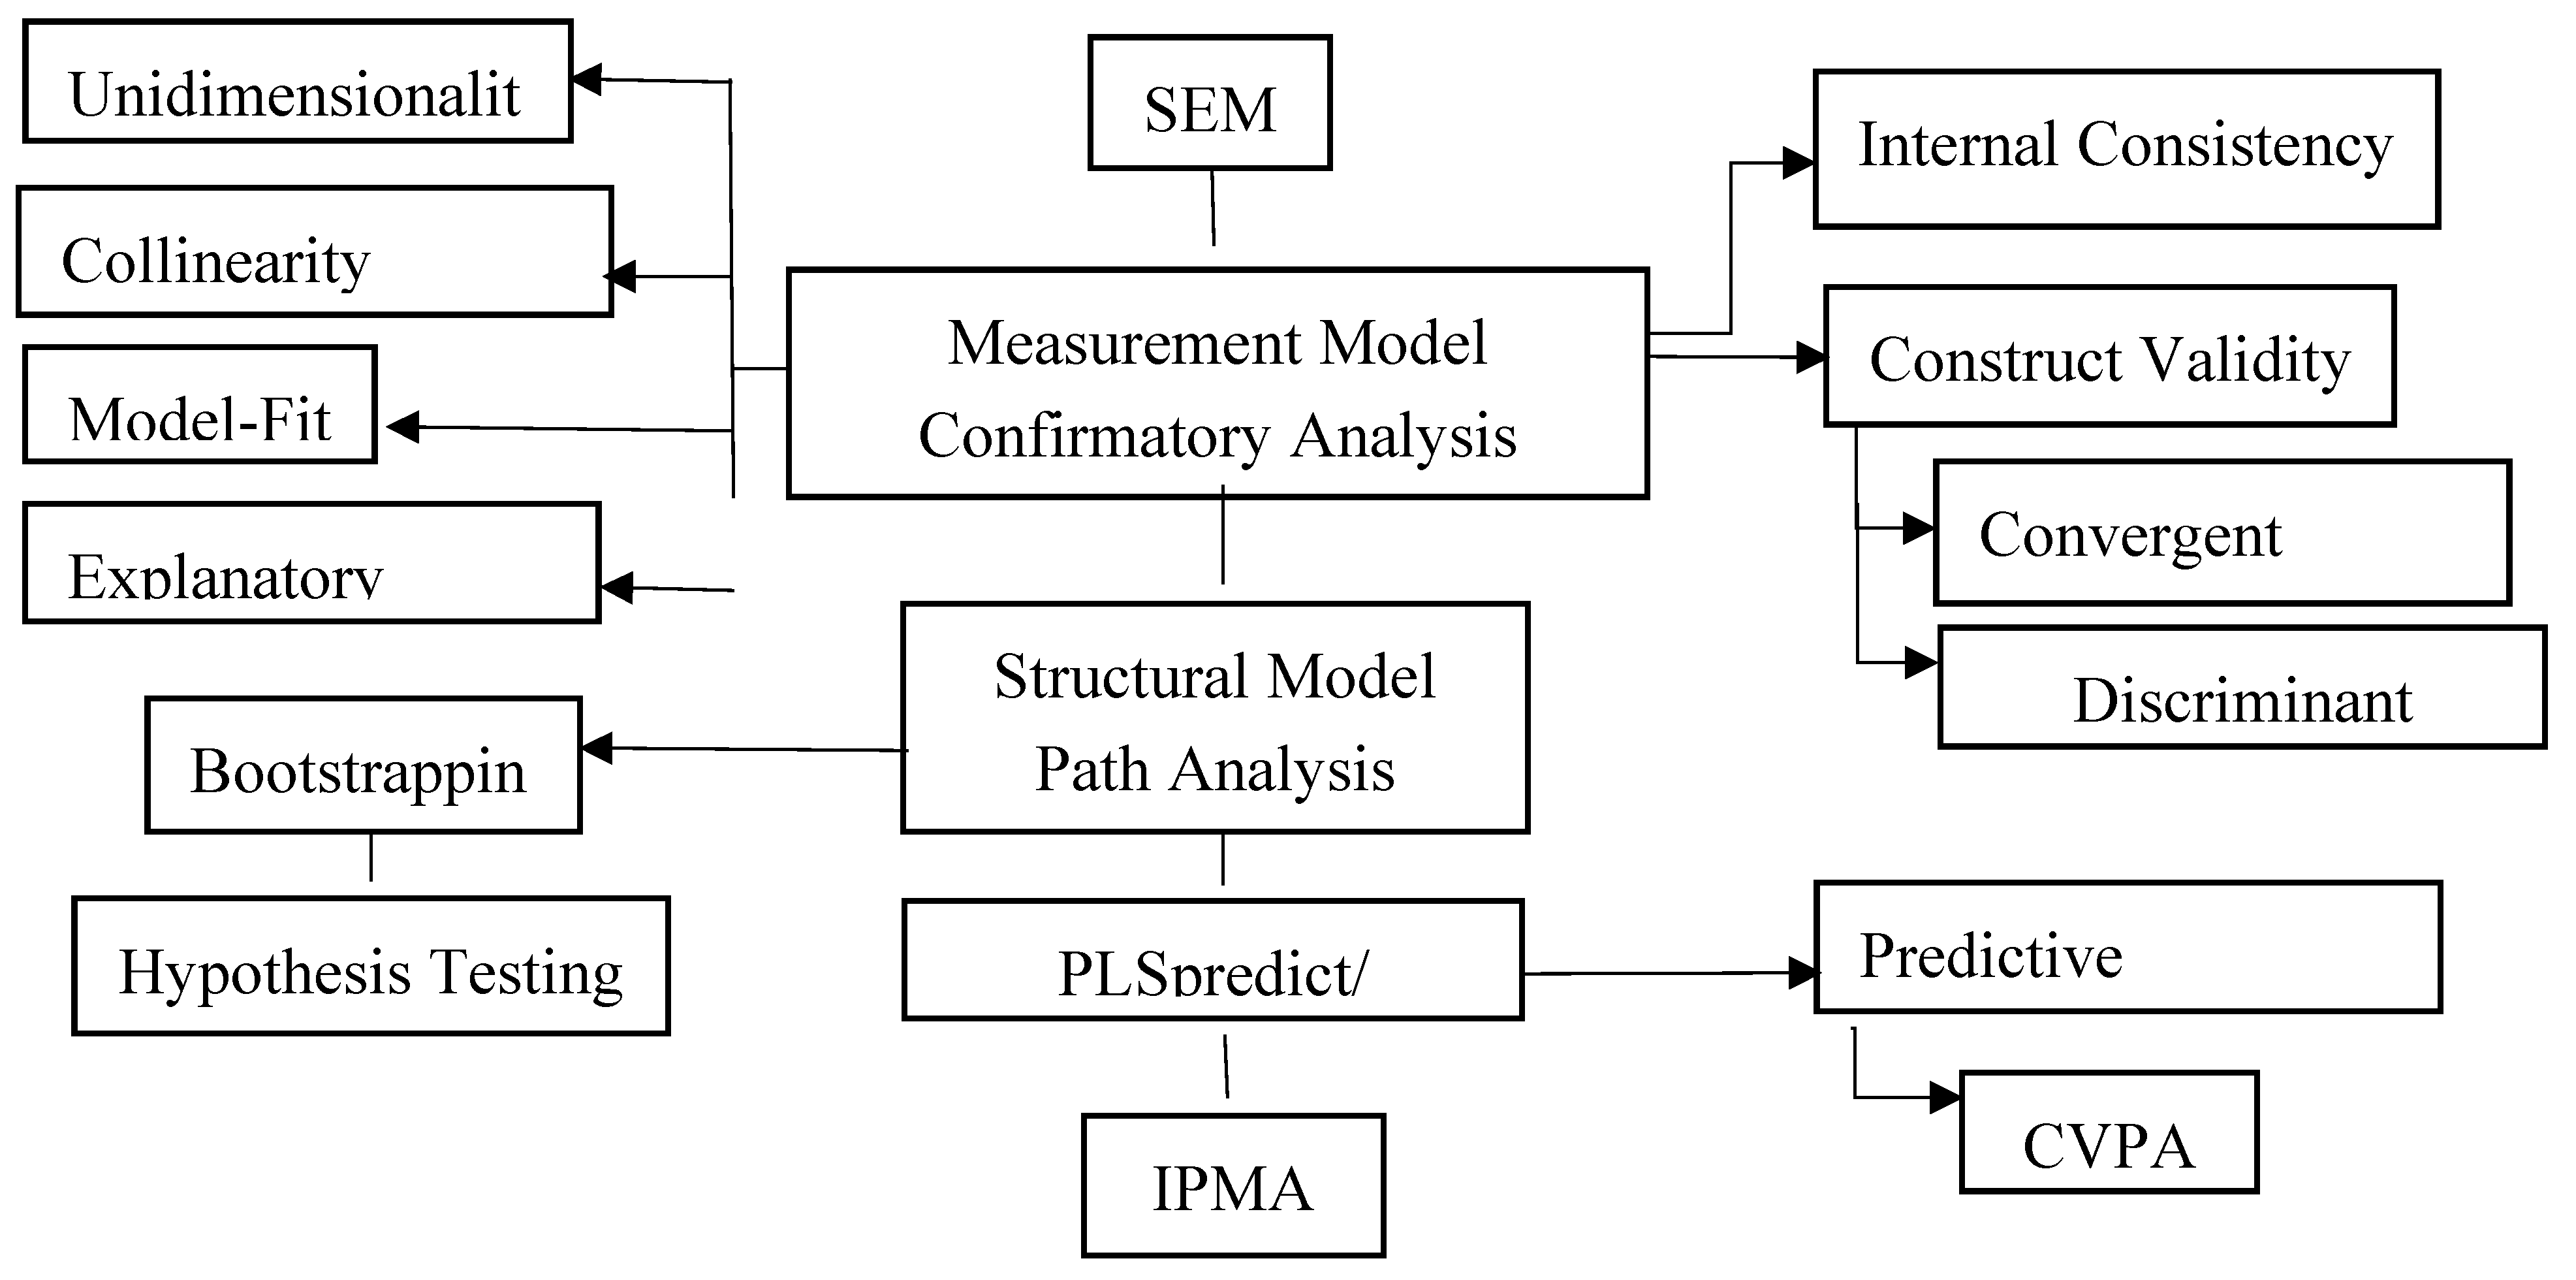
Figure 7.
Modified Model showing the p-values.
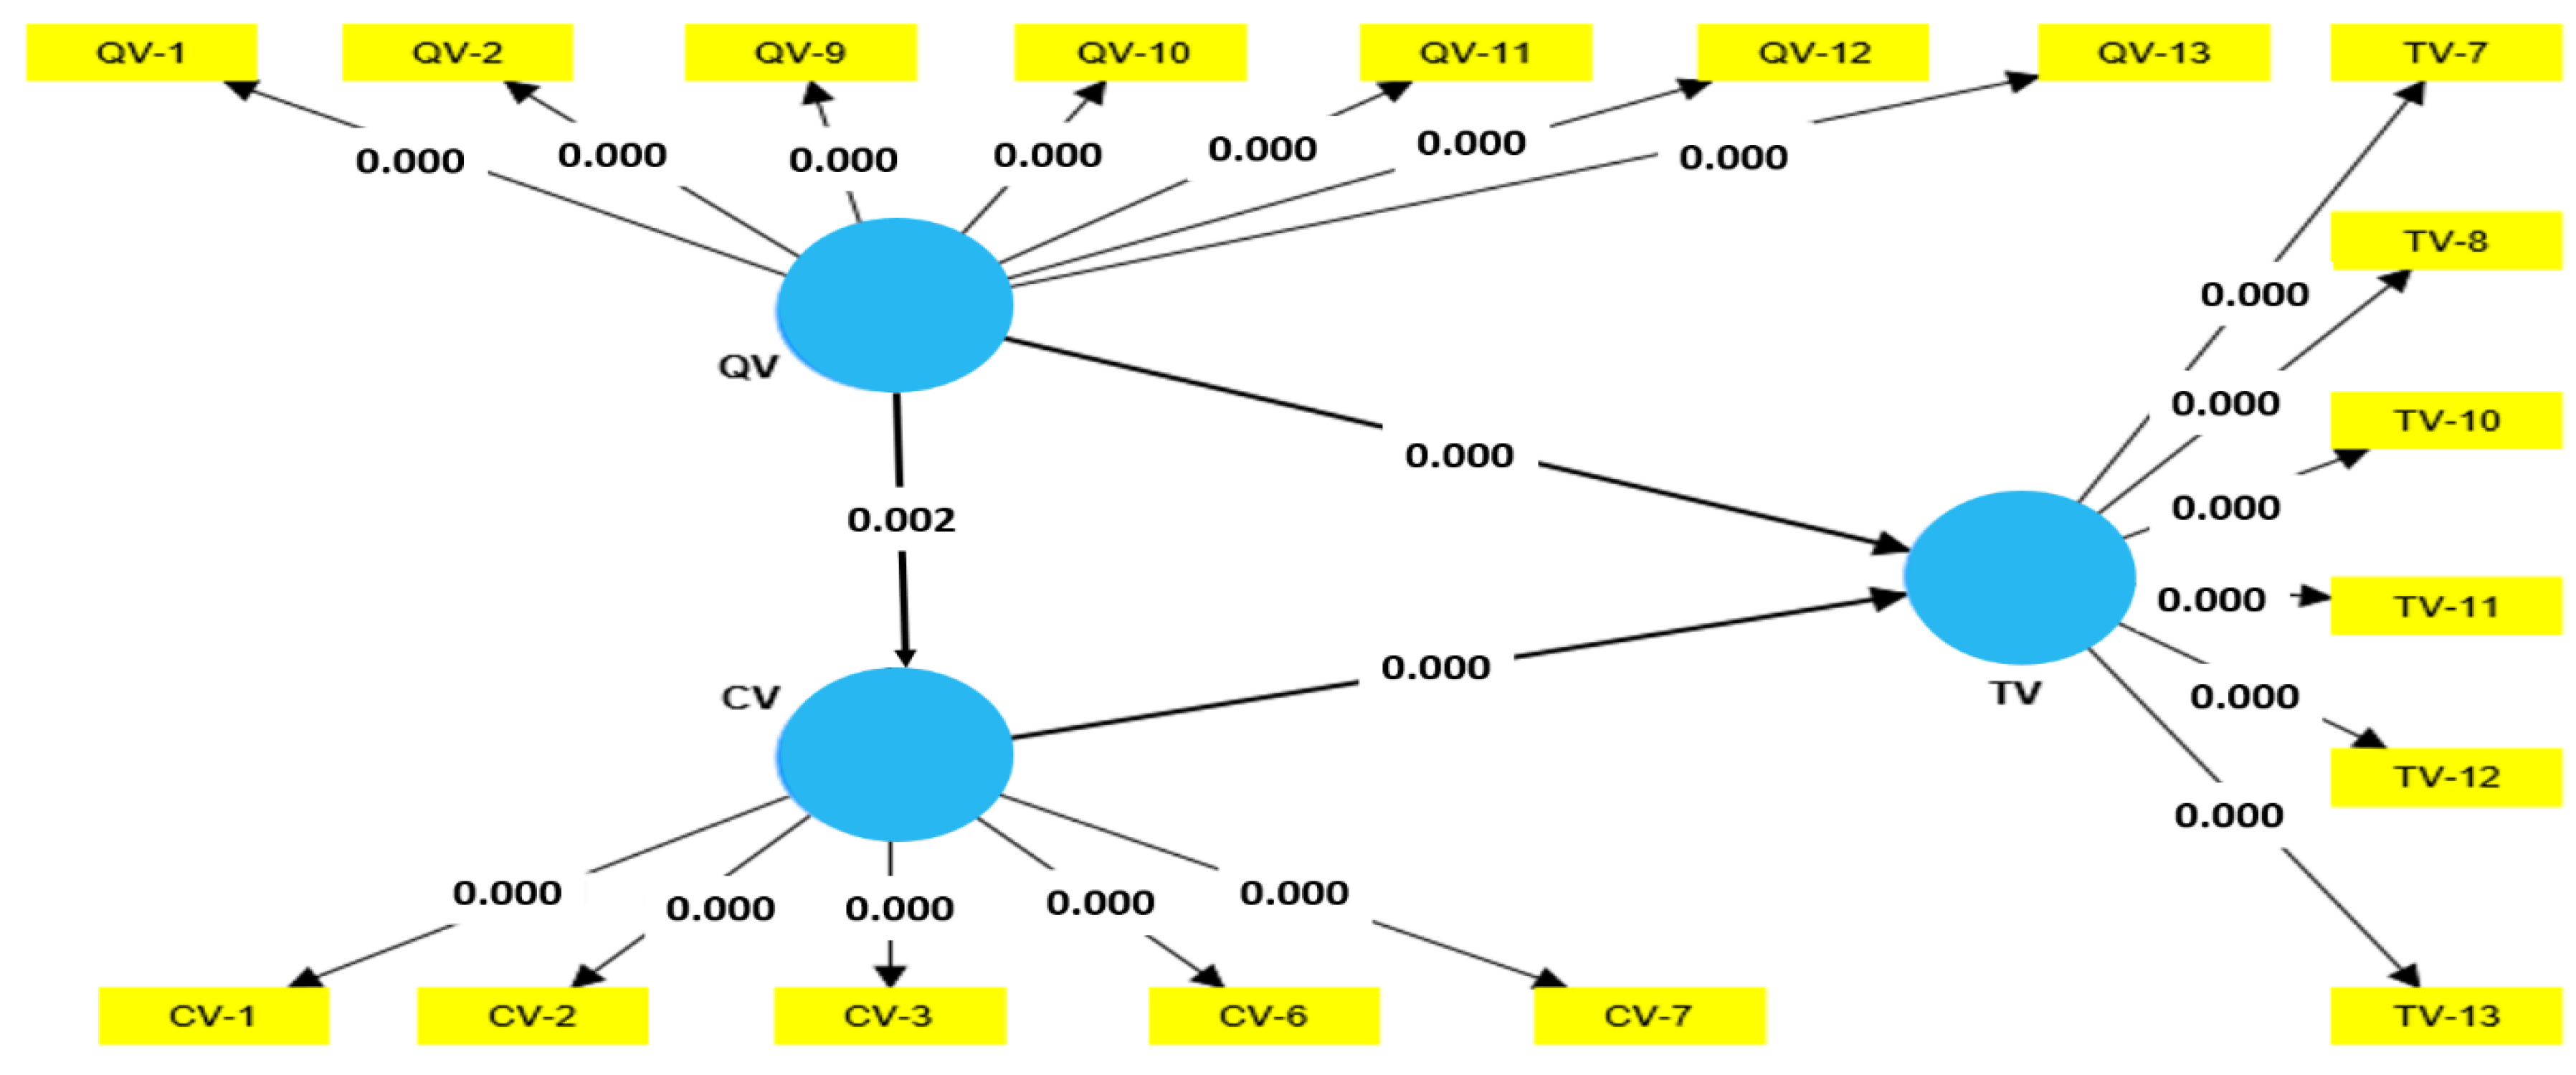
Figure 7.
Hypothesized Model showing outer Loadings, path coefficients and R2 values.
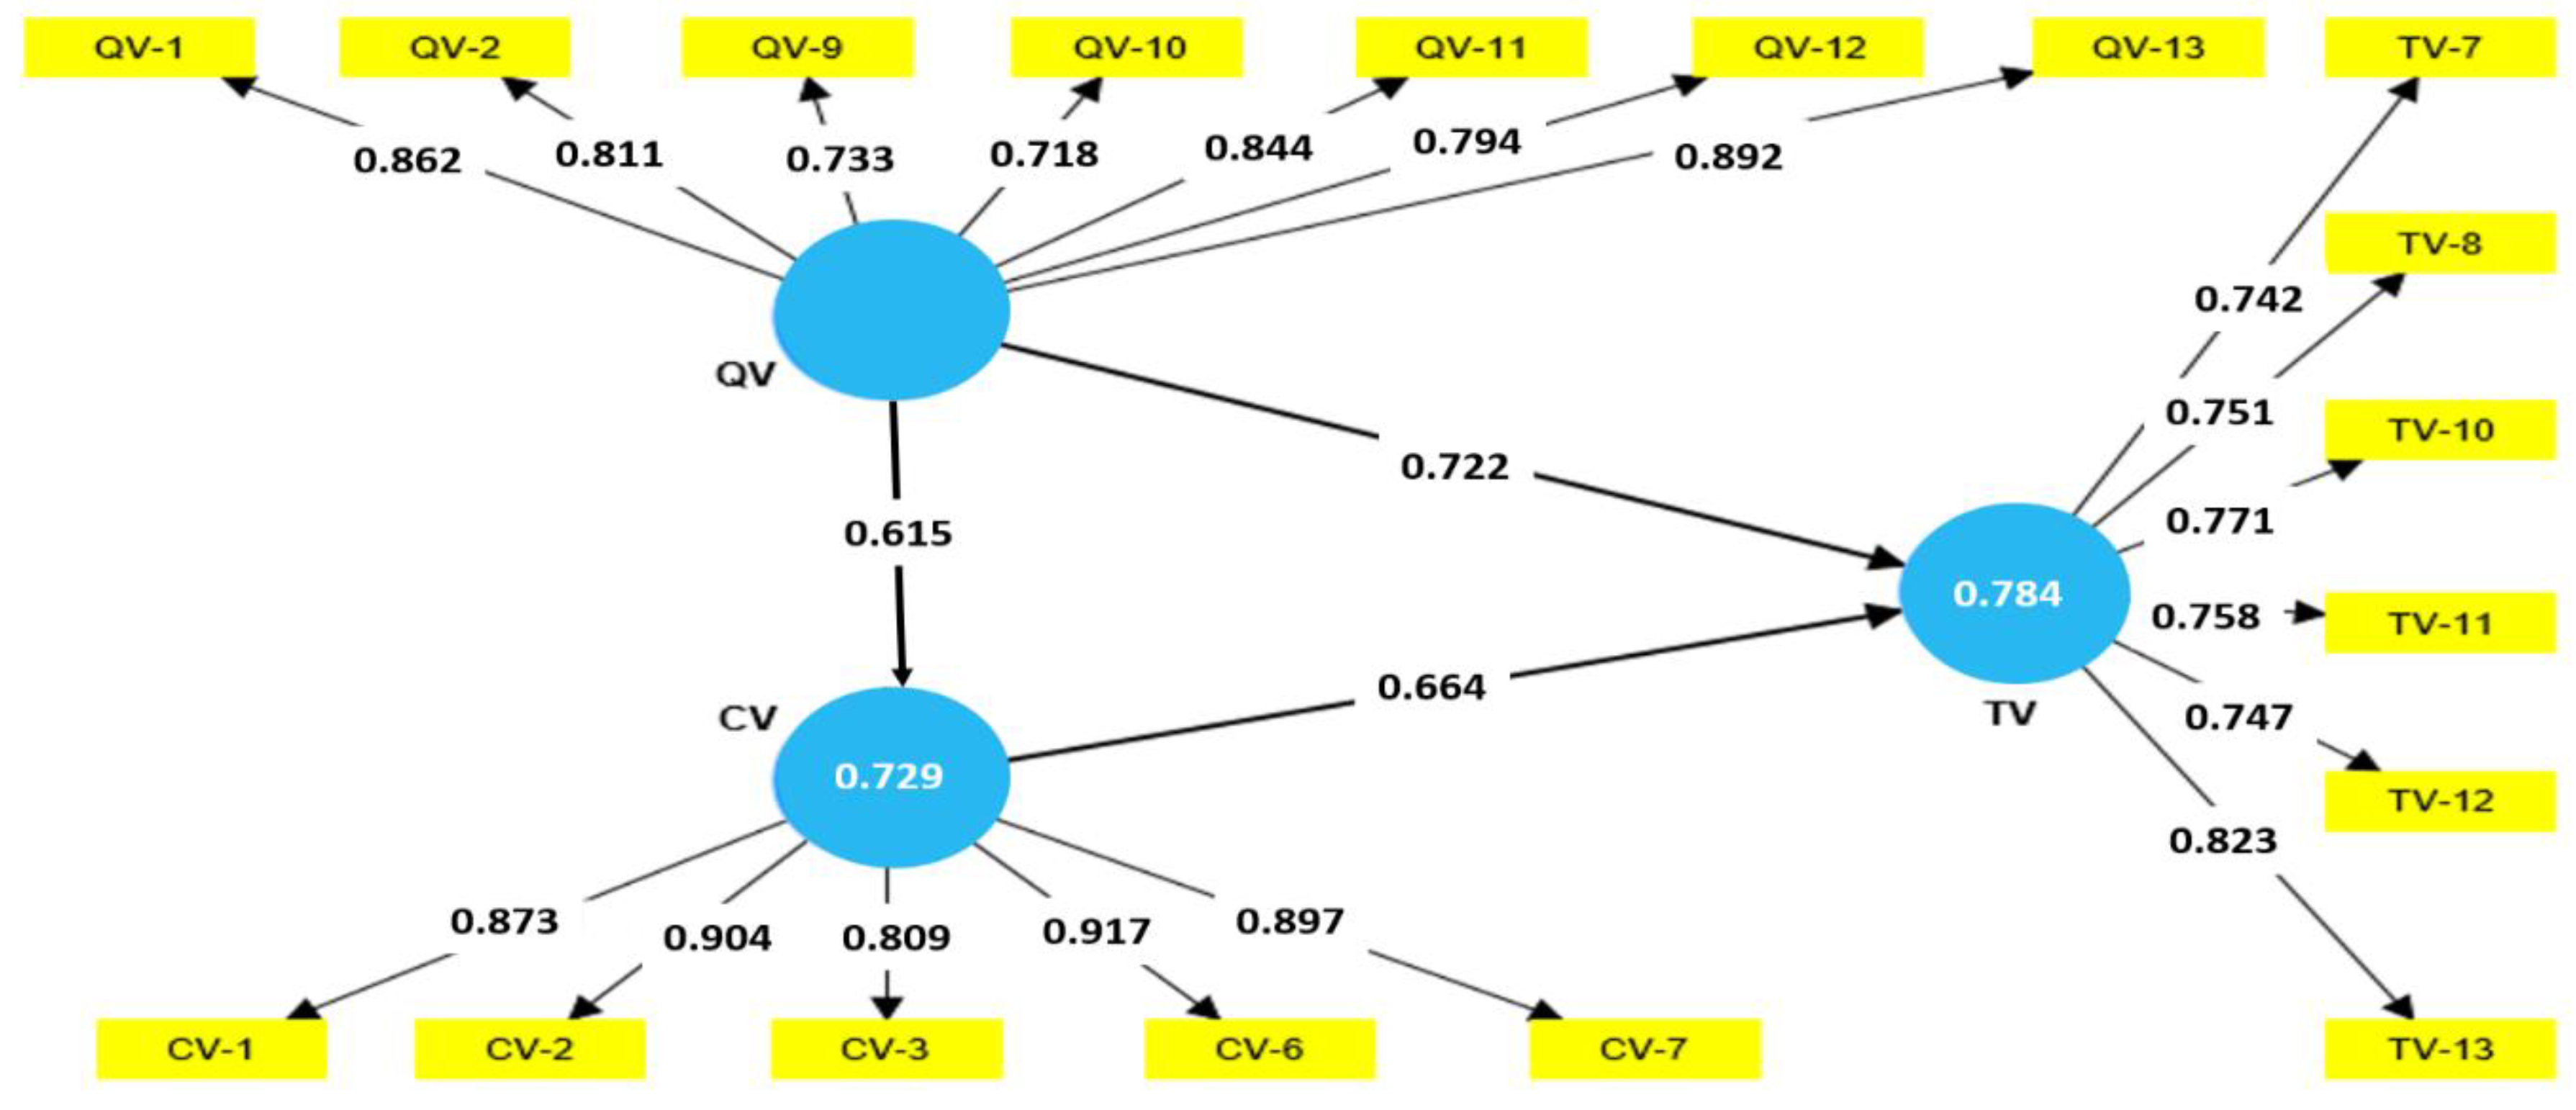
Figure 8.
Importance-Performance Map Analysis-Constructs.
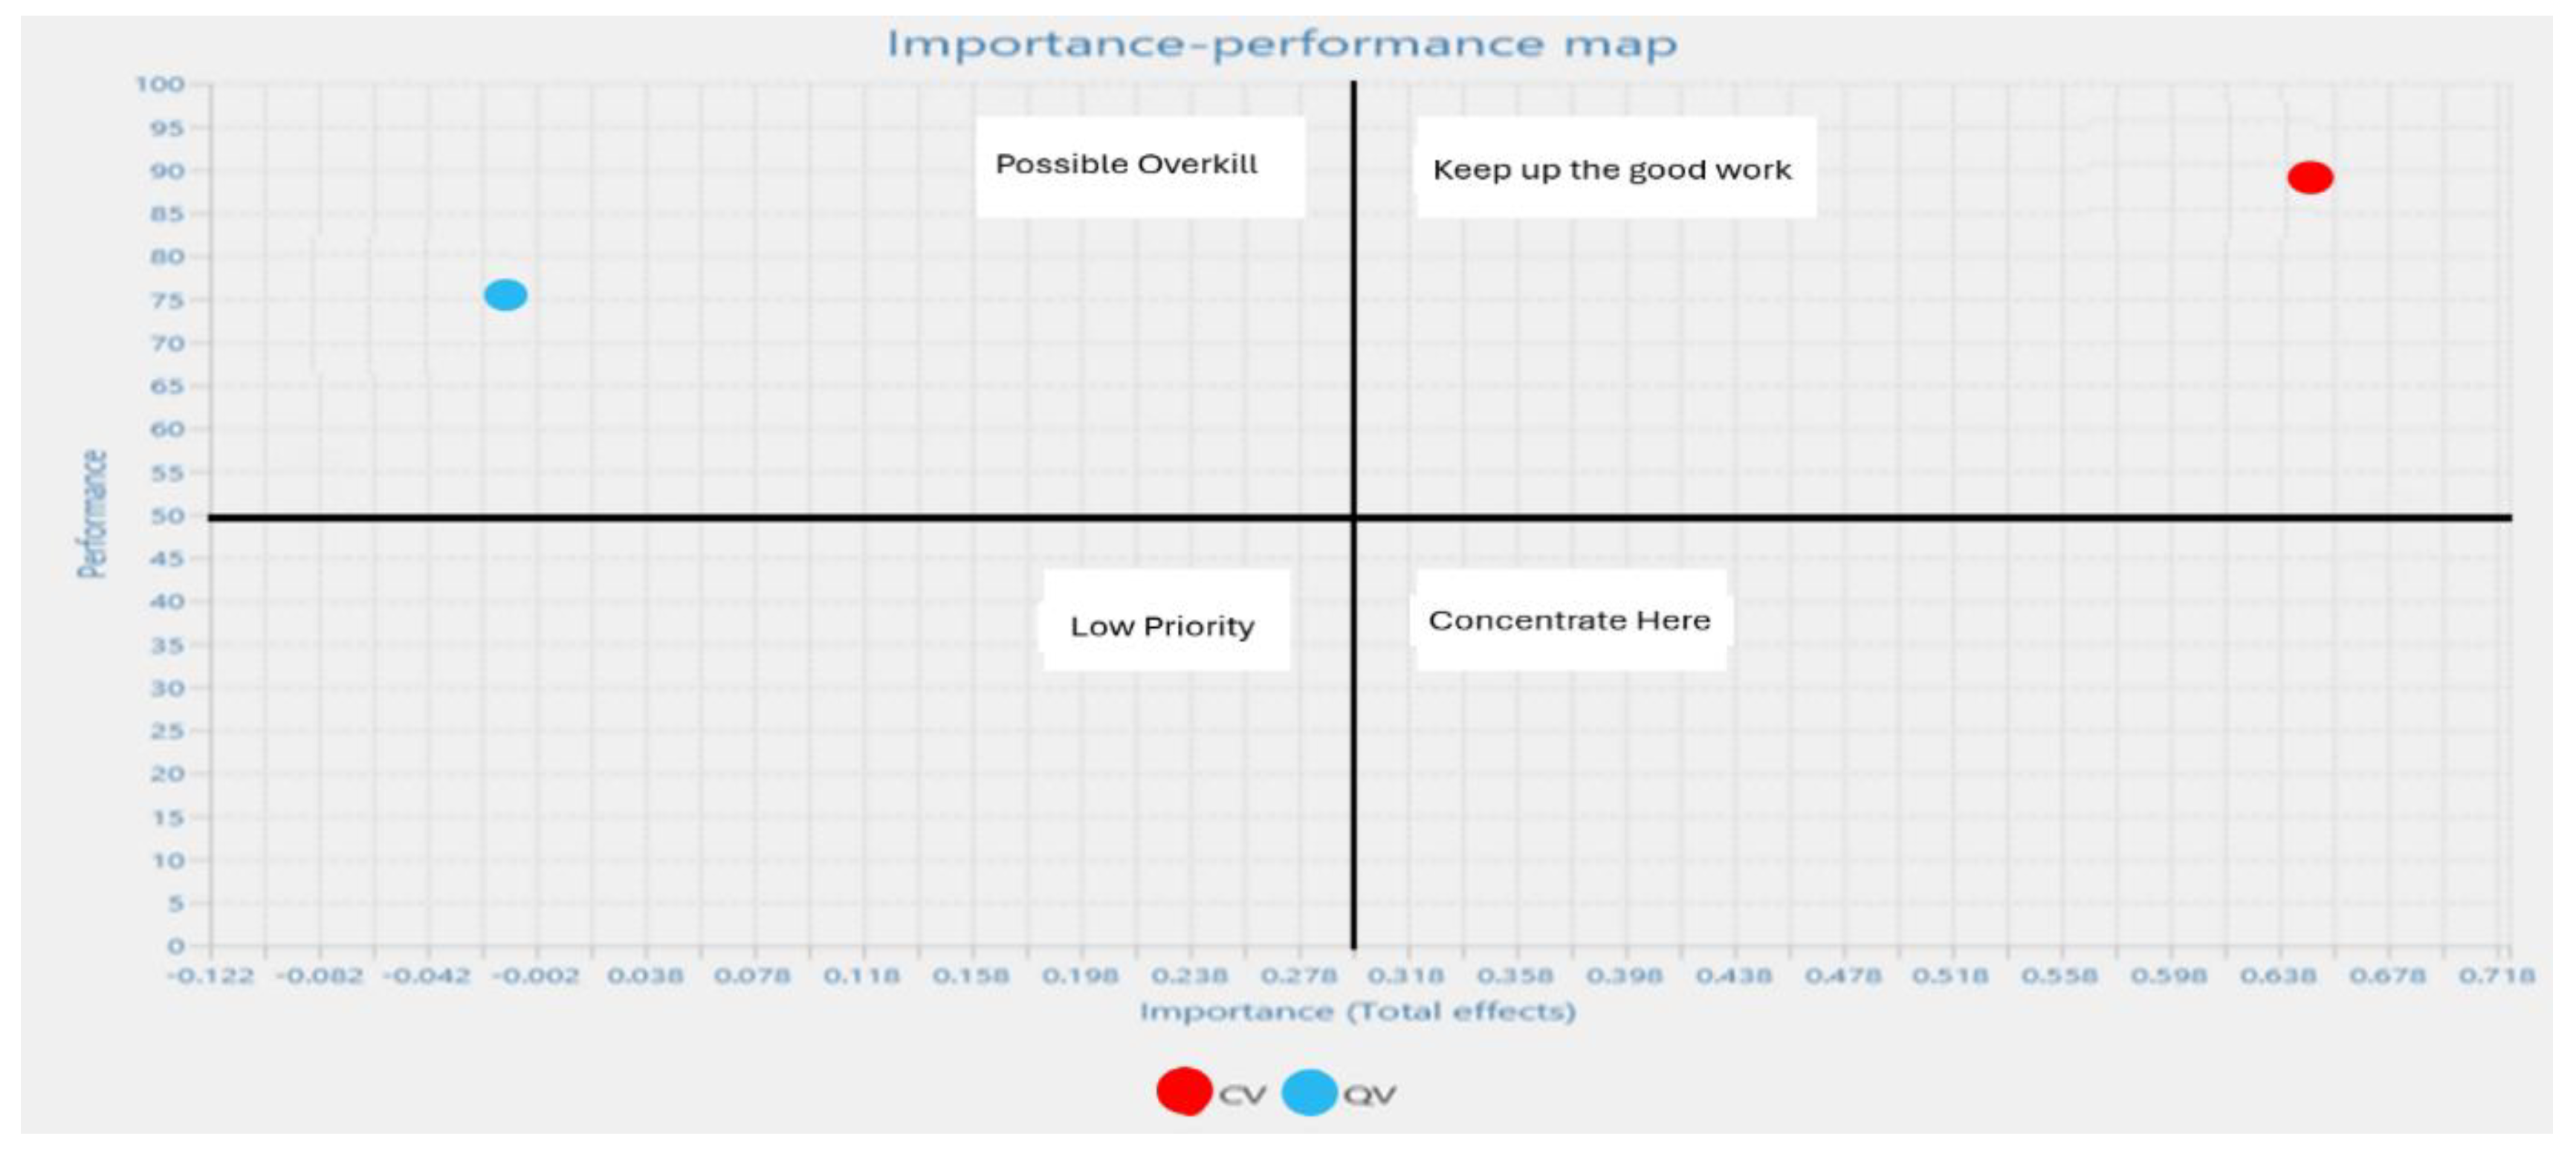
Figure 9.
Importance-Performance Map Analysis – Indicators.
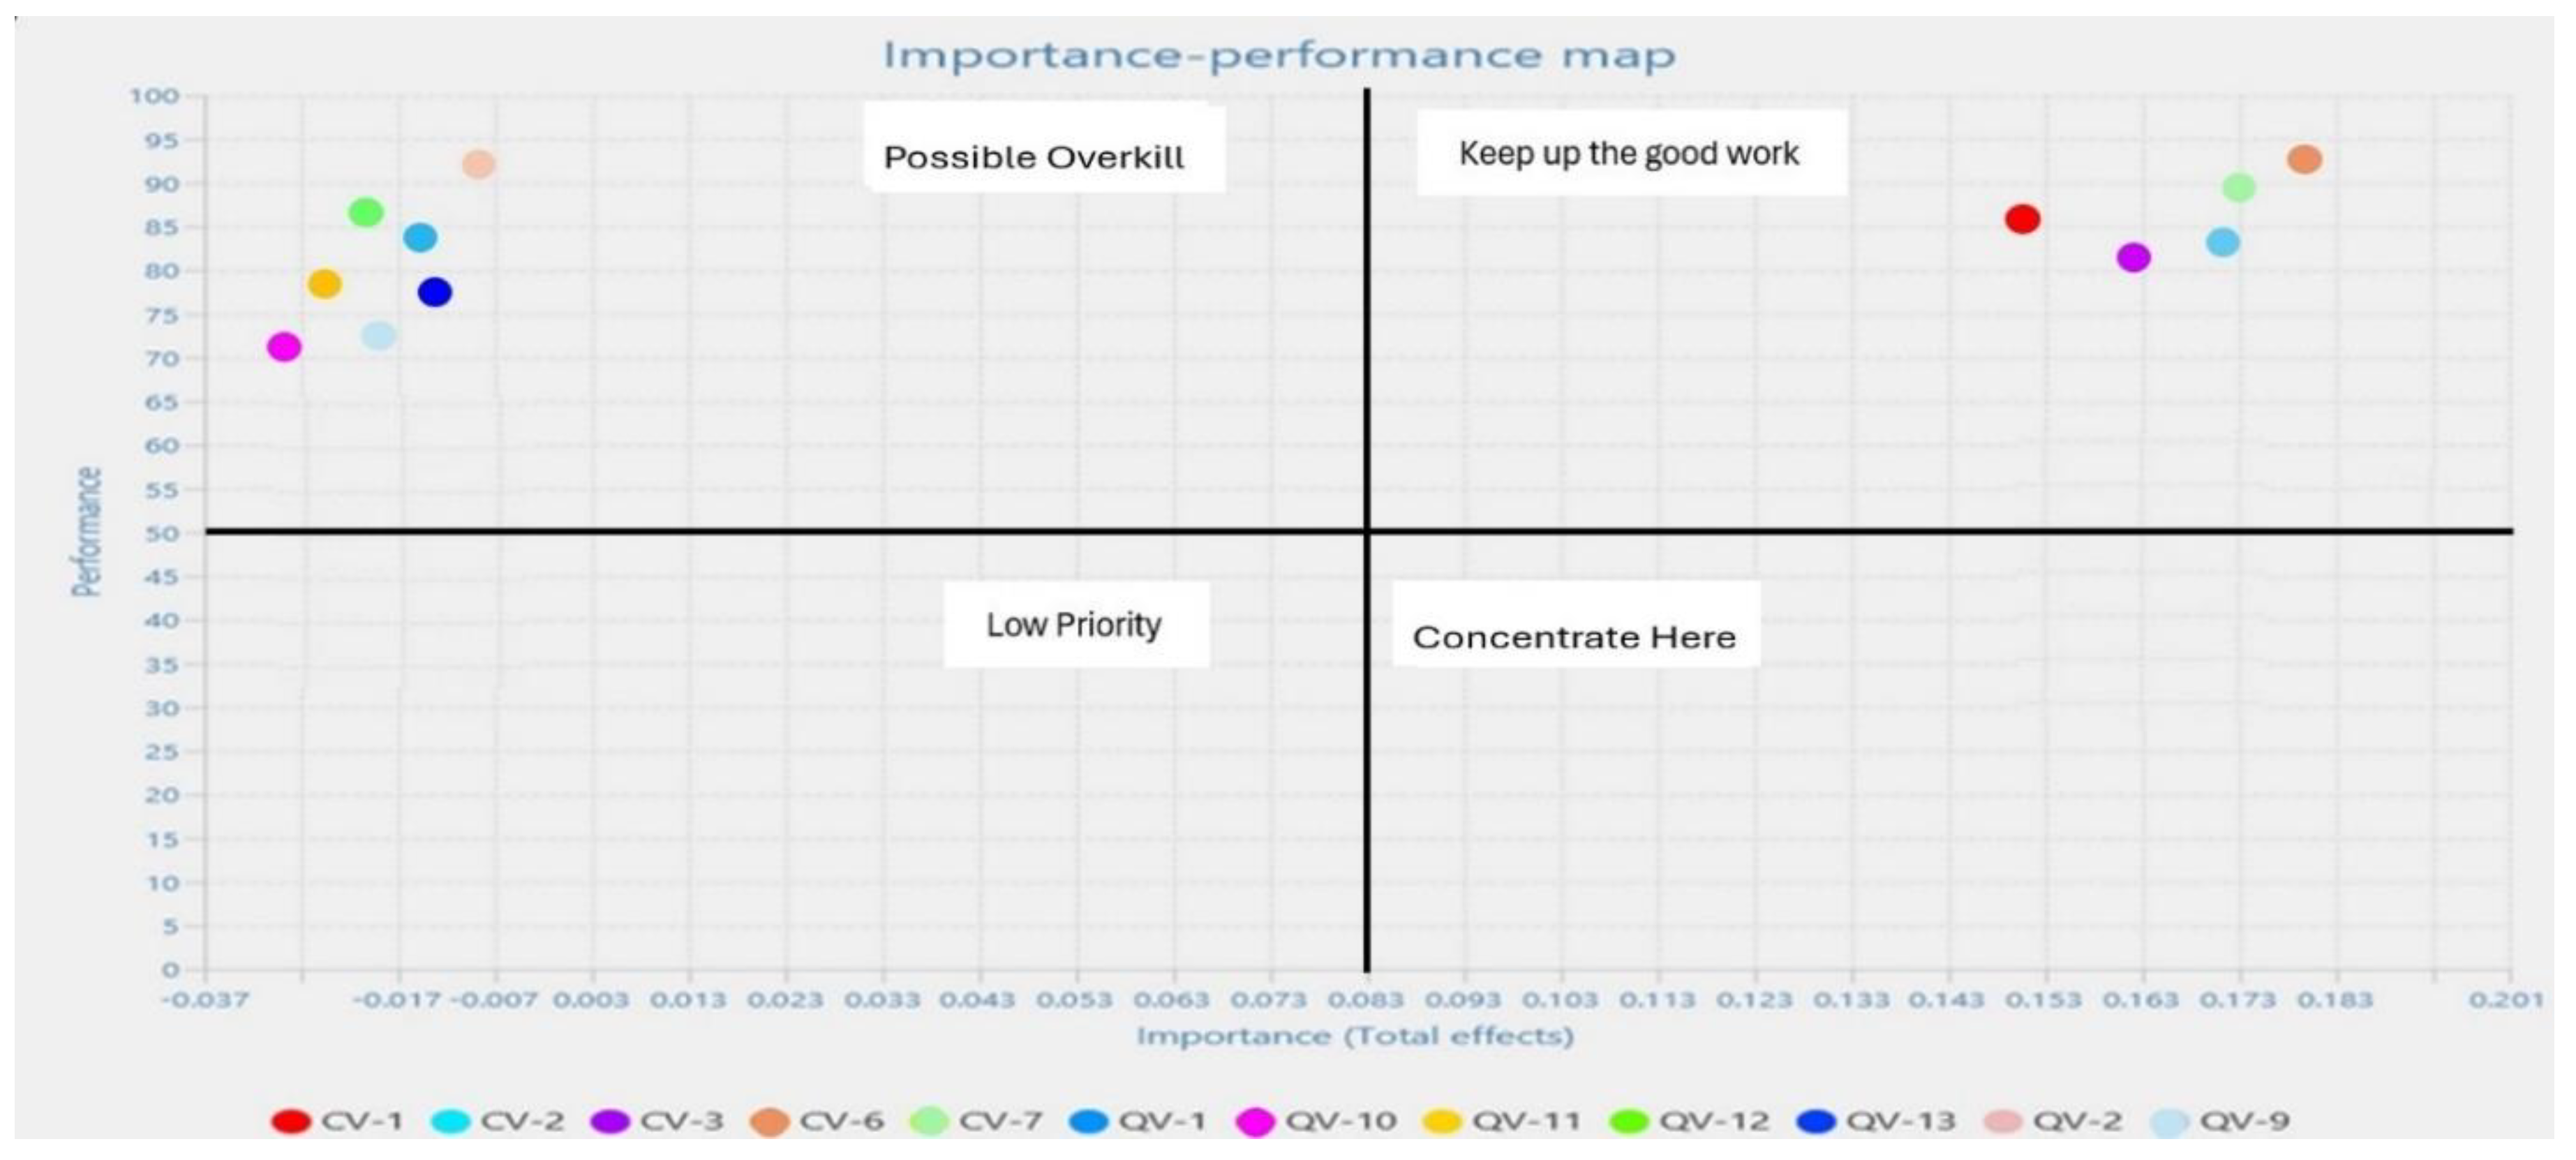

Table 1.
Time related decision criteria for Fast-track Projects.
| Time Related Decision Criteria (Indicators) | References |
|---|---|
| Adopt Pre-fabrication and Modularization | [2,10,11,27,29] |
| Secure Early Permits/ Approvals | [7,8,10] |
| Imposing penalties for delays | [10,11] |
| Awarding Early contract for enabling works | [8,35] |
| Implement design-construction interface management plan | [7,36] |
| Adopt an effective dispute resolution technique | [29] |
| Client to retain design-construction interface management responsibilities | [25] |
| Limit the design optimization process | [11,37] |
| Fast-track application to industrial/ commercial buildings that are high profit & time critical) else than residential buildings | [7,12,23] |
| Decision regarding optimal level of overlap among phases | [13,21,22,24,38] |
| Prefer critical path over non-critical for fast-tracking | [6,7,10,28,39] |
| Announce incentives/ bonus for early completion | [9,11,40] |
| Select the most suited project delivery method and contractual Strategy | [1,2,36,41] |
Table 2.
Cost related decision criteria for fast-track projects.
| Cost Related Decision Criteria (Indicators) | References |
|---|---|
| Client Authorizing “Extras” | [38] |
| Over-designing the facility | [5,37,42,46] |
| Limit cost increase to 120% of the conventional projects | [5,47] |
| Implement an effective Change Management Plan | [35,44,48,49] |
| Contingency allocations by the owner | [11,44] |
| Early Procurement of Long-Lead-Time Items | [7,10,11] |
| During early design stage implement scope freeze approach | [10,33,37,44] |
| Value Engineering Implementation | [25] |
| Resource management plan Implementation | [3] |
| Evaluate client’s financial strength | [7,40,50] |
| Compliance with site safety regulations | [1,10,44] |
Table 3.
Quality related decision criteria for fast-track projects.
| Quality Related Decisions Criteria (Indicators) | References |
|---|---|
| Implement effective communication mechanism | [7,11,36,47] |
| Constructability review during design stage (BIM) | [48,51,52,53] |
| Delegate authority to project level | [10] |
| Prototyping the facility | [37] |
| Lean Construction implementation | [10,54] |
| Contractor pre-qualification Strategy implementation | [1,7,10] |
| Implement Front End Planning (FEP) | [10,23,35,48] |
| Fast-track application to complex high-rise | [8,33,36,55] |
| Submit Quality Management Plan during pre-design phase | [2] |
| Limiting the quality compromise to 90% | [5] |
| Early contractor involvement during design stage | [2,7,10,29] |
| Involving O&M personnel early in the design stage | [56] |
| Organizational restructuring (Experienced Team) | [2,10,11,40,57] |
Table 4.
Frequency Analysis of Delphi Experts with Experience in Fast-tracking.
| Respondents | Qualification | Experience |
|---|---|---|
| Project Manager | BE (Civ) | 16 Yrs |
| Project Manager | MS (PM) | 13 Yrs |
| Construction Manager | BE (Civ) | 27 Yrs |
| Structural Engineer | MS (Structures) | 19 Yrs |
| Construction Manager | MS (CE&M) | 16 Yrs |
| Project Manager | MS (PM) | 14 Yrs |
| Architect | MS (Architecture) | 15 Yrs |
| Project Planner | BE (Civ) | 25 yrs |
| Construction Manager | MS (CE&M) | 18 Yrs |
| Structural Engineer | MS (Structures) | 19 Yrs |
Table 5.
Coding Scheme of the Latent variables and the indicators.
| Latent Variable | Decision Criteria (Indicators) | Code |
|---|---|---|
| Cost Variance (CV) | Client Authorizing “Extras” | CV-1 |
| Over-designing the facility | CV-2 | |
| Limit cost increase to 120% of the conventional projects | CV-3 | |
| Implement an effective Change Management Plan | CV-4 | |
| Contingency allocations by the owner | CV-5 | |
| Early Procurement of Long-Lead-Time Items | CV-6 | |
| Implement scope freeze approach during early design stage | CV-7 | |
| Value Engineering Implementation | CV-8 | |
| Resource management plan Implementation | CV-9 | |
| Evaluate client’s financial strength | CV-10 | |
| Compliance with site safety regulations | CV-11 | |
| Quality Variance (QV) | Implement effective communication mechanism | QV-1 |
| Constructability review during design stage (BIM) | QV-2 | |
| Delegate authority to project level | QV-3 | |
| Prototyping the facility | QV-4 | |
| Implement Lean Construction | QV-5 | |
| Adopt contractor pre-qualification Strategy | QV-6 | |
| Implement Front End Planning (FEP) | QV-7 | |
| Fast-track application to complex high-rise | QV-8 | |
| Submit Quality Management Plan during pre-design phase | QV-9 | |
| Limiting the quality compromise to 90% | QV-10 | |
| Early contractor involvement during design stage | QV-11 | |
| Involving O&M personnel early in the design stage | QV-12 | |
| Organizational restructuring (Experienced Team) | QV-13 | |
| Time Variance (TV) | Adopt Pre-fabrication and Modularization | TV-1 |
| Secure Early Permits/ Approvals | TV-2 | |
| Imposing penalties for delays | TV-3 | |
| Awarding Early contract for enabling works | TV-4 | |
| Implement design-construction interface management plan | TV-5 | |
| Adopt an effective dispute resolution technique | TV-6 | |
| Client to retain design-construction interface management responsibilities | TV-7 | |
| Limit the design optimization process | TV-8 | |
| Fast-track application to industrial/ commercial buildings that are high profit & time critical) else than residential buildings | TV-9 | |
| Decision regarding optimal level of overlap among phases | TV-10 | |
| Prefer critical path over non-critical for fast-tracking | TV-11 | |
| Announce incentives/ bonus for early completion | TV-12 | |
| Select the most suited project delivery method and contractual Strategy | TV-13 |
Table 6.
Descriptive Statistics and Normality Test Results.
| Name | No | Type | Missing Value | Mean | Median | Scale min | Scale max | Observed min | Observed max | Standard deviation | Excess kurtosis | Skewness | Cramér-von Mises p value |
|---|---|---|---|---|---|---|---|---|---|---|---|---|---|
| SV-1 | 0 | MET | 0 | 3.61 | 4 | 1 | 5 | 1 | 5 | 1.288 | -0.942 | -0.523 | 0.00 |
| SV-2 | 1 | MET | 0 | 3.465 | 4 | 1 | 5 | 1 | 5 | 1.368 | -1.134 | -0.41 | 0.00 |
| SV-5 | 2 | MET | 0 | 3.352 | 4 | 1 | 5 | 1 | 5 | 1.313 | -1.238 | -0.221 | 0.00 |
| SV-9 | 3 | MET | 0 | 2.925 | 3 | 1 | 5 | 1 | 5 | 1.376 | -1.322 | -0.038 | 0.00 |
| SV-10 | 4 | MET | 0 | 3.314 | 4 | 1 | 5 | 1 | 5 | 1.388 | -1.154 | -0.365 | 0.00 |
| TV-7 | 5 | MET | 0 | 2.792 | 3 | 1 | 5 | 1 | 5 | 1.269 | -1.169 | 0.025 | 0.00 |
| TV-8 | 6 | MET | 0 | 2.673 | 2 | 1 | 5 | 1 | 5 | 1.325 | -1.069 | 0.326 | 0.00 |
| TV-10 | 7 | MET | 0 | 2.635 | 2 | 1 | 5 | 1 | 5 | 1.425 | -1.216 | 0.388 | 0.00 |
| TV-11 | 8 | MET | 0 | 3.025 | 3 | 1 | 5 | 1 | 5 | 1.453 | -1.418 | -0.019 | 0.00 |
| TV-12 | 9 | MET | 0 | 2.893 | 3 | 1 | 5 | 1 | 5 | 1.421 | -1.361 | 0.111 | 0.00 |
| TV-13 | 10 | MET | 0 | 2.579 | 2 | 1 | 5 | 1 | 5 | 1.56 | -1.477 | 0.385 | 0.00 |
| Name | No | Type | Missing Value | Mean | Median | Scale min | Scale max |
Observed min | Observed max | Standard deviation | Excess kurtosis | Skewness | Cramér-von Mises p value |
| QV-1 | 11 | MET | 0 | 3.447 | 4 | 1 | 5 | 1 | 5 | 1.528 | -1.33 | -0.453 | 0.00 |
| QV-2 | 12 | MET | 0 | 2.484 | 2 | 1 | 5 | 1 | 5 | 1.391 | -1.236 | 0.429 | 0.00 |
| QV-9 | 13 | MET | 0 | 2.906 | 3 | 1 | 5 | 1 | 5 | 1.453 | -1.344 | 0.091 | 0.00 |
| QV-10 | 14 | MET | 0 | 3.321 | 3 | 1 | 5 | 1 | 5 | 1.338 | -1.17 | -0.207 | 0.00 |
| QV-11 | 15 | MET | 0 | 3.182 | 3 | 1 | 5 | 1 | 5 | 1.378 | -1.198 | -0.216 | 0.00 |
| QV-12 | 16 | MET | 0 | 2.899 | 3 | 1 | 5 | 1 | 5 | 1.433 | -1.393 | -0.042 | 0.00 |
| QV-13 | 17 | MET | 0 | 3.39 | 4 | 1 | 5 | 1 | 5 | 1.336 | -1.025 | -0.377 | 0.00 |
| CV-1 | 18 | MET | 0 | 2.491 | 2 | 1 | 5 | 1 | 5 | 1.228 | -0.553 | 0.68 | 0.00 |
| CV-2 | 19 | MET | 0 | 3.182 | 3 | 1 | 5 | 1 | 5 | 1.364 | -1.244 | -0.14 | 0.00 |
| CV-3 | 20 | MET | 0 | 2.346 | 2 | 1 | 5 | 1 | 5 | 1.317 | -0.377 | 0.872 | 0.00 |
| CV-6 | 21 | MET | 0 | 2.931 | 3 | 1 | 5 | 1 | 5 | 1.406 | -1.293 | 0.097 | 0.00 |
| CV-7 | 22 | MET | 0 | 3.409 | 4 | 1 | 5 | 1 | 5 | 1.45 | -1.327 | -0.329 | 0.00 |
Table 7.
Internal consistency and convergent validity statistics.
|
Constructs |
Code |
Cronbach’s Alpha (α) | Composite Reliability (ρ_c) | (AVE) | |
|---|---|---|---|---|---|
| Initial | Modified | ||||
| Cost Variance | CV | 0.864 | 0.902 | 0.581 | 0.648 |
| Quality Variance | QV | 0.928 | 0.939 | 0.493 | 0.690 |
| Time Variance | TV | 0.891 | 0.917 | 0.534 | 0.650 |
Table 8.
Discriminant Validity.
| CV | QV | TV | HTMT | ||
|---|---|---|---|---|---|
| CV | 0.805 | QV ↔ CV | 0.113 | ||
| QV | 0.115 | 0.831 | TV ↔ CV | 0.771 | |
| TV | 0.684 | 0.003 | 0.806 | TV ↔ QV | 0.074 |
Table 9.
Multicollinearity and f-square values.
| VIF | f-square (f2) | |
|---|---|---|
| CV → TV | 1.013 | 0.604 |
| QV→ CV | 1.000 | 0.362 |
| QV → TV | 1.013 | 0.213 |
Table 10.
Direct Effects.
| Original Sample (O) | Sample Mean (M) | Standard Deviation (STDEV) | T Statistics (O/STDEV) | p-values | Decision | |
|---|---|---|---|---|---|---|
| H1 CV→TV | 0.664 | 0.665 | 0.045 | 14.755 | 0.000 < 0.05 | Accepted |
| H2 QV→CV | 0.615 | 0.616 | 0.121 | 5.082 | 0.002 < 0.05 | Accepted |
| H3 QV→TV | 0.722 | 0.723 | 0.080 | 9.025 | 0.000 < 0.05 | Accepted |
Table 11.
Indirect Effects (Mediation Analysis).
| Original Sample(O) | Sample Mean (M) | Standard Deviation | T Statistics (O/STDEV | p-value | Decision | |
|---|---|---|---|---|---|---|
| H4 QV→CV→TV | 0.561 | 0.563 | 0.151 | 3.715 | 0.004 < 0.05 |
Accepted |
Table 12.
Manifest Variable (MV) Prediction Summary.
| Q²-predict | PLS-SEM_RMSE | PLS-SEM_MAE | LM_RMSE | LM_MAE | |
|---|---|---|---|---|---|
| QV-1 | 0.403 | 0.948 | 0.751 | 0.953 | 0.772 |
| QV-10 | 0.572 | 0.898 | 0.712 | 0.916 | 0.731 |
| QV-11 | 0.270 | 1.133 | 0.881 | 1.180 | 0.923 |
| QV-12 | 0.372 | 1.121 | 0.898 | 1.144 | 0.915 |
| QV-13 | 0.377 | 1.151 | 0.927 | 1.172 | 0.952 |
| QV-2 | 0.566 | 0.978 | 0.732 | 0.983 | 0.743 |
| QV-9 | 0.275 | 1.122 | 0.817 | 1.132 | 0.878 |
| TV-10 | 0.341 | 1.064 | 0.903 | 1.118 | 0.916 |
| TV-11 | 0.505 | 1.030 | 0.819 | 1.061 | 0.831 |
| TV-12 | 0.475 | 1.038 | 0.807 | 1.065 | 0.815 |
| TV-13 | 0.271 | 1.340 | 1.107 | 1.381 | 1.136 |
| TV-7 | 0.335 | 1.043 | 0.838 | 1.071 | 0.857 |
| TV-8 | 0.382 | 1.049 | 0.845 | 1.104 | 0.862 |
Table 13.
CVPAT-Difference of Average Loss values for PLS-SEM vs IA and LM.
| Indicator Average (IA) | Linear Model (LM) | |||||
|---|---|---|---|---|---|---|
| Average loss difference | t value | p-value | Average loss difference | t value | p-value | |
| QV | -0.742 | 7.963 | 0.000 | -0.048 | 1.989 | 0.047 |
| TV | -0.776 | 7.277 | 0.000 | -0.052 | 2.023 | 0.029 |
| Overall | -0.761 | 8.932 | 0.000 | -0.050 | 2.148 | 0.033 |
Table 14.
Importance Performance Map Analysis values - Constructs.
| Constructs | Importance | Performance |
|---|---|---|
| CV | 0.641 | 89.124 |
| QV | -0.018 | 77.383 |
Table 15.
Importance-Performance Map Analysis values - Indicators.
| Indicators | Importance for TV | MV Performance |
|---|---|---|
| CV-1 | 0.149 | 86.441 |
| CV-2 | 0.169 | 84.258 |
| CV-3 | 0.160 | 81.659 |
| CV-6 | 0.180 | 94.662 |
| CV-7 | 0.171 | 89.428 |
| QV-1 | -0.015 | 84.279 |
| QV-10 | -0.029 | 71.237 |
| QV-11 | -0.024 | 88.756 |
| QV-12 | -0.021 | 87.466 |
| QV-13 | -0.011 | 77.287 |
| QV-2 | -0.009 | 92.210 |
| QV-9 | -0.019 | 72.851 |
Disclaimer/Publisher’s Note: The statements, opinions and data contained in all publications are solely those of the individual author(s) and contributor(s) and not of MDPI and/or the editor(s). MDPI and/or the editor(s) disclaim responsibility for any injury to people or property resulting from any ideas, methods, instructions or products referred to in the content. |
© 2024 by the authors. Licensee MDPI, Basel, Switzerland. This article is an open access article distributed under the terms and conditions of the Creative Commons Attribution (CC BY) license (http://creativecommons.org/licenses/by/4.0/).
Copyright: This open access article is published under a Creative Commons CC BY 4.0 license, which permit the free download, distribution, and reuse, provided that the author and preprint are cited in any reuse.


