
Submitted:
17 October 2024
Posted:
17 October 2024
You are already at the latest version
Abstract
Cultivation is advocated as a solution for sustainable exploitation of medicinal plants. Understanding environmental factors influencing plant species distribution will eliminate the introduction of medicinal plants indiscriminately to inappropriate cultivation regions. The study investigated environmental conditions for the distribution of Artemisia afra and mapped out potential areas for its cultivation in South Africa. Soil samples were collected in the Free State Province in South Africa for analysis. To identify suitable environmental conditions for the natural distribution of A. afra, the South African National Botanical Institute database and physically collected Global Positioning System points were used in maximum entropy model. Monthly long-term average interpolated weather surfaces were used to estimate the effect of climate change on future climate suitability for A. afra distribution. Sixty-one percent of soil samples from different A. afra populations were clay loam soils with slightly acidic to neutral pH. The carbon source utilization, Shannon Weaver Index, and species richness were positively correlated to one group of fourteen soil samples, and species evenness was positively correlated to the second group, consisting of four samples. Climate change will only affect the distribution of A. afra in the very long term. The current study provides critical information for identifying suitable cultivation areas for A. afra, while supporting conservation efforts from an ecological point.
Keywords:
MaxEnt
; maximum entropy model
; medicinal plant
; soil microbiology
1. Introduction
Artemisia afra (Jacq. ex Willd.) is a medicinal plant that has traditionally been used to treat colds. Several studies found that A. afra extracts could be used to treat and/or manage tuberculosis, cancer, and for SARS-CoV-2 inhibition [1,2,3,4]. The wide medicinal use of A. afra has resulted in increased harvesting pressure on its wild populations and will have a long-term impact on its natural ecosystem. Artemisia afra plants, which are woody perennial herbs, can grow to a height of 2 meters and have finely divided, alternately arranged, silver-grey to light green, oval-shaped leaves [5].
Climate change and other human factors such as land-use reallocation to human settlement, habitat destruction, and over-exploitation of medicinal plants due to growing demands have led to the extinction or threatened state of many medicinal plants. An increasing number of medicinal plant species continues to record an ever-increasing demand. Thus, it was indicated that farmers and scientists could not keep up with the demands for artemisinin, for example, which is derived from Artemisia annua [6]. Habitat restoration and cultivation of medicinal plants have been advocated as an ecological measure for the conservation of endangered medicinal plants [7] or as a solution for the sustainable exploitation of medicinal plants, which will ensure that the market needs are met without the depletion of natural resources [8]. However, it is not desirable to introduce medicinal plant species indiscriminately to inappropriate cultivation regions [7] as this may negatively affect crop productivity and quality [8]. The mentioned risks, coupled with the sometimes-low incentive to grow medicinal plants compared to wild harvesting, could discourage farmers from cultivating these plants.
One of the important questions in the conservation of medicinal plants or natural plant biodiversity in general, is: “What controls the distribution of plant species?” or “What environmental factors mostly determine a plant community structure?” [9,10]. An answer to these questions will facilitate the development of relevant strategies for the conservation of various medicinal plants. Understanding how environmental factors influence plant species distribution and diversity is a long-standing challenge in ecological studies [11]. This is more urgent now that climate change is forcing species to ‘track’ suitable climatic conditions and shift their distribution ranges [9]. Environmental factors such as temperature, solar radiation, precipitation, and soil properties play an important role in the distribution of plant species [7,10]. While climate has a direct effect on plant growth and development, soils provide nutrients and water, and both climate and soil influence plant distribution [11,12]. Solar radiation is one of the important environmental factors required for plant growth and development [13], as it affects crop transpiration and soil evaporation, which in turn, influences soil water availability and plant water demands [9]. Although climate exerted the strongest influence on species distribution in the European Alps, its influence declined at higher altitudes [11]. Zhang et al. [7] also reported that climate had more influence than soil factors on the habitat distribution of Scutellaria baicalensis. The analysis of suitable regions for the cultivation of medicinal plants has been extensively dependent on traditional experiences based on the observation of one or a few climatic factors [14], and this can introduce risks to the productivity and quality of medicinal plants [7,8]. Currently, there is a need to develop effective methods to analyse the suitability of an agroecological region for cultivation and such methods should be based on the geographical distribution of wild populations of the medicinal plant species [14].
Ecological modelling to know and understand the suitable habitat for distribution of medicinal plants, the environmental factors that are decisive for that habitat distribution and the formation of active ingredients in medicinal plants are critical for the selection of cultivation sites [7]. For these methods or models to be effective, they need to be based on the geographical distribution of wild populations and take into consideration the climatic and soil factors influencing medicinal plant growth [14]. Tshwene-Mauchaza and Aguirre-Gutiérrez [15] used the Species Distribution Model (SDM), a technique that relies on associating species occurrence data with climate and environmental predictors to predict variables suitable for species distribution. The results of their study suggested that rainfall and soil moisture played an important role in determining plant distribution [15]. The MaxEnt modelling approach is sometimes preferred over the SDM as it can efficiently handle complex interactions between species presence records and environmental predictors while providing accurate predictions with a small number of presence records [9]. It is a general-purpose model for making predictions or inferences [16], using environmental variables extracted from presence-only data to predict the distribution of species [17]. The advantage of the Maxent model is that it has better prediction capabilities, and the stability is not affected by small sample deviations and fewer samples [18].
Temperature and soil clay content were found to be the most important environmental variables for predicting species distribution along an elevation gradient in the Himalayan tropical montane [9]. While employing the MaxEnt model to predict the environmental factors suitable for the selection of cultivation sites for Scutellaria baicalensis in China, [7] reported altitude, temperature, precipitation, and soil pH as the factors influencing the species distribution. Using the canonical correspondence analysis (CCA) and variation partitioning tests to determine environmental variables that mostly influenced the distribution of 244 selected plant species in a moist temperate zone, Rahman et al. [10] indicated that altitude, slope, temperature, soil potassium (K) and phosphorus (P), pH, electrical conductivity (EC), organic matter, and soil particle structure were among the environmental variables that drive plant distribution. Soil microbiology is another important aspect as soil microbes break down or decompose organic matter and thus contribute to the nutrient cycle [19]. Soil pH, nutrient availability, and toxicity are some of the factors that influence soil microbiology.
Knowing the natural environmental conditions where A. afra grows in the wild, will help understand and identify suitable regions for its commercial cultivation. This will help reduce the risk of poor productivity and reduced quality of the plant material. The objective of this study was to identify suitable climatic and soil conditions for the cultivation of A. afra and to map out potential areas for its cultivation in South Africa.
2. Materials and Methods
2.1. Soil Sampling
Soil samples were collected from three populations of A. afra, which were five kilometers or more apart, in Maluti-A-Phofung local municipality in the Free State Province, South Africa (Figure 1). Three samples (three individual plants and their soils) were randomly taken from each population using a 150mm Johnson bucket soil auger. At each sampling point, top- (0-15 cm) and sub-soil (15-30 cm) samples were taken for chemical, biological and physical analysis. Thus, a total of 18 soil samples were collected from the three populations for analysis [20]. The samples were immediately stored in a cooler box and transported to the Agricultural Research Council’s (ARC) laboratories for analysis. The samples were collected during the late winter season (August 2022).
2.2. Soil Microbiology, Physical and Chemical Analysis
The soil samples were analyzed at the ARC - Plant Health and Protection campus (Roodeplaat, Pretoria) for carbon source utilization (microbial functional diversity), enzyme activities, and the total microbial count. The methods described by Mofokeng et al. [21] were adapted for this study.
The biology carbon source utilization was conducted on soil samples that were homogenized and suspended in a saline buffer. Thereafter, 150 μl of the aqueous suspensions were pipetted into 96 well Biolog microplates, which were subsequently incubated at 26 °C for one week. The rate of colour change (pattern development) in each well was read using Biolog MicroLogTM, for optical density (OD) measurements, and recorded every 24 hours for seven days or until a constant reading. Data from each plate reading were normalized by subtracting the control values from the values of each microplate well, and the microbial response in each well was quantified by the average well colour development (AWCD) before statistical analysis. The determined specific utilization of carbon sources included group substrates such as carbohydrates, amino acids, polymers, and carboxylic acids. The optical density of 0.25 was used as a threshold for a positive response and the Shannon Weaver index (H’) value, the species richness and evenness were calculated. The species richness is the number of microbial species present in a sample and the evenness is the proportion of each species. The Shannon Weaver Index is used to quantify the functional diversity of soil microbial populations based on the amount of different carbon sources utilized in the Biolog microplates.
The phosphatase activity was determined as the amount of p-nitrophenol (μl p-nitrophenol/g soil) produced after incubation of the soil samples with appropriate reagents and reading of the optical density of the culture filtrates. Similarly, β-glucosidase activity was determined using different reagents. The total microbial count was determined by suspending soil samples in saline buffer, followed by serial dilutions and spread plating of 100 μl aliquot on nutrient agar media. The plates were then incubated for 24-48 hours and the resulting colonies were counted to determine the colony formation (units · g soil).
The chemical properties of the soil samples were determined in a laboratory at the ARC Natural Resources and Engineering, Soil Climate and Water campus (Arcadia, Pretoria), following the standard laboratory procedure for various macro- and micro-elements. Similarly, the particle size distribution was determined at the same laboratory for sand, silt, and clay content.
2.3. Mapping of Artemisia Afra Distribution and Potential Regions for Cultivation
To identify the suitable climatic conditions for the natural areas of growth and distribution of A. afra, the South African National Botanical Institute (SANBI) database (Plants of Southern Africa, POSA database, http://posa.sanbi.org/) was consulted for the quarter degree squares (QDS) of the natural populations. Using the information from the SANBI database, literature search, and personal communications, different regions in three provinces were visited for the physical collection of GPS points. Sixty-five GPS coordinates (covering 17 QDS) were collected, while 213 QDS locations recorded in the SANBI database were used in the study.
The maximum entropy model (MaxEnt model, version 3.4.4) was used to create maps of suitable areas for the growth and cultivation of A. afra. The following environmental variables were used for the predictions: maximum and minimum temperatures of the coolest and warmest months (max and min tx, max and min tn), mean maximum and minimum humidity (hx, hn), rainfall, average soil clay %, and the average soil depth. To estimate the effect of climate change on climate suitability for distribution of A. afra, monthly long-term average interpolated weather surfaces were derived from the ARC Weather Station Network for the period 1991-2020. The network consists of about 520 active automatic weather stations covering South Africa and the data is recorded in Agrometeorology Staff records of 2023. The averages of six different dynamically downscaled Coupled Global Climate Model (CGCM) projections of future climate change were used for the periods 2021-2050 and 2051-2080. All the CGCM simulations from the A2 Special Report on Emissions Scenarios (SRES) were downscaled for the period 1961-2100 [22]. The CGCMs that were downscaled are:
- GFDL-CM2.0 from the National Oceanic and Atmospheric Administration (NOAA)
- GFDL-CM2.1 of NOAA
- ECHAM5/MPI-Ocean Model from Germany
- UKMO-HadCM3 from the United Kingdom
- MIROC3.2-medres from the Japanese Agency for Marine-Earth Science and Technology (JAMSTEC)
- CSIRO Mark3.5 from Australia
Finally, the median values of changes from the current situation (1991-2020) to the periods of 2021-2050 and 2051-2080 were applied to the long-term average surfaces that were derived from the ARC weather station network.
Average topsoil clay percentage and average soil depth were derived from the ARC Land Type Information System, which includes the land type maps and memoirs containing soil and terrain inventories in paper or electronic formats (Land Type Survey Staff records of 1972 – 2006). Land types are areas with homogeneous terrain, macroclimate, and soil pattern, and delineated at a 1:250 000 scale. The percentage distribution of various soil attributes is linked to the following terrain units: crests, scarps, mid slopes, foot slopes, and valley bottoms.
The performance of the MaxEnt model was evaluated based on the computed receiver operating characteristics (ROC) curve and the area under the curve (AUC) [18]. The advantage of ROC analysis, which has been applied to a variety of classification problems in machine learning and evaluation of species distribution models, is that the AUC provides a single measure of model performance, independent of any particular choice of thresholds [16]. The MaxEnt model software has other functions, which were used to evaluate the relative importance of the environmental factors to the species distribution [23]. They include the permutation importance value, which is independent of the specific algorithm path of the software and only depends on the final results of the model, and the percentage contribution degree of each environmental variable, which depends on random enumerated variable values on the training point (existence point and background value) and the resulting decrease in the training AUC value [23].
Data on carbon source utilization were subjected to non-parametric statistical analyses using STATISTICA software (StatSoft, Inc ©). Soil microbial diversity and activity were analyzed using Principal Component Analysis (PCA) and cluster analyses (vertical hierarchical tree plots). One-way analysis of variance (ANOVA) was used to determine significant differences between the different samples. Homogenous grouping with Fisher Least Significant Difference (LSD) was determined and calculated with the confidence level set at p < 0.05.
3. Results
3.1. Soil Physical and Chemical Properties
The soil collected from three sites where A. afra grows naturally in the eastern part of the Free State Province showed variations in the clay, silt and sand content (Table 1). The clay content ranged from a low of 11% to a high of 38%, the silt content ranged from 19 to 30%, and the sand content ranged from 34 to 67%. The total sand percentage, when the top- and sub-soil contents are added together, was highest in plant population 1 sample 2 (Pp1 SP2). The soils ranged from loam, sandy loam, through sandy clay loam to clay loam soils. However, 61% of the samples were classified as clay loam soils, 17% as sandy loam, another 17% as sandy clay loam, and the last 5% as loam soils.
The pH of all the samples was slightly acidic to neutral as they ranged from 5.3 to 6.86 on the pH scale (Table 2). Only one sample had a pH of 5.3 and this was in the subsoil, whereas the rest had a pH in the region of 6 moving closer to 7. There were slight increases or changes in the content of other chemical properties, except for the ammonium content which varied from 1.6 to 6.9 mg · kg-1 between the soil samples. The ammonium form of nitrogen was mostly higher than the nitrate form.
3.2. Soil Microbiology
The highest C-source utilization by microbial communities, as indicated by the average well-colour development (AWCD), was recorded for samples Pp1 SP2 sub, Pp1 SP2 top, and Pp1 SP1 top (Table 3). The lowest C-source utilization was recorded for samples Pp3 SP1 top, Pp3 SP2 sub, Pp2 SP2 top, and Pp3 SP2 top. Samples Pp3 SP1 sub, Pp2 SP3 top, Pp1 SP3 top, and Pp2 SP1 sub showed no significant differences in C-source utilization when compared to Pp1 SP2 top and Pp1 SP1 top.
Significant differences were recorded in the Shannon Weaver Diversity Index (H’), where samples Pp1 SP2 top, Pp1 SP2 sub and Pp1 SP1 top, showed a significantly higher H’ compared to Pp3 SP2 sub, Pp3 SP1 top, and Pp2 SP2 top. When compared to all other samples, sample Pp3 SP2 top recorded a significantly lower H’. Similarly, samples Pp1 SP2 sub and Pp1 SP2 top showed significantly higher species richness (S), compared to samples Pp3 SP2 top and sub which showed the lowest richness. Samples Pp1 SP1 sub and Pp3 SP3 sub were the only samples that recorded significantly lower evenness compared to sample Pp3 SP2 sub.
Two enzyme activities of the soil microbial communities tested were β-glucosidase and phosphatase activities, in order to have an indication of the microbial activities in terms of carbon (C) and phosphorous (P) cycling, respectively. Although no significant differences were recorded, variations between the soil microbial communities of the different samples were observed and the majority of the samples expressed a high β-glucosidase enzyme activity (μg p –nitrophenol · g-1 soil). The lowest β-glucosidase activity was recorded with samples Pp1 SP3 sub, Pp2 SP1 sub, Pp2 SP3 sub and Pp3 SP2 sub. In terms of phosphatase enzyme activity, microbial communities of all soil samples exhibited similar activity and expressed high phosphatase activity (μg p –nitrophenol · g-1 soil). However, the Pp2 SP3 sub and Pp3 SP2 sub recorded the lowest expression of phosphatase activity.
Samples Pp1 SP2 top and Pp1 SP2 sub, exhibited significantly higher utilization of amino acids, carbohydrates and carboxylic acids compared to samples Pp2 SP 2 top, Pp3 SP1 top, Pp3 SP2 top, and Pp3 SP2 sub (Table 4). However, samples Pp1 SP2 sub and Pp2 SP3 top expressed significantly higher utilization of polymers compared to sample Pp1 SP3 sub, Pp2 SP2 top, Pp3 SP 1 top, Pp3 SP1 sub, Pp3 SP2 top, Pp3 SP2 sub, and Pp3 SP3 sub. In the case of amines, only sample Pp1 SP2 top exhibited significantly higher utilization compared to samples Pp2 SP2 top, Pp2 SP3 sub, Pp3 SP1 top, Pp3 SP2 top, and Pp3 SP3 sub. Based on the total bacterial count result as a microbial indicator of soil health, four soil samples, Pp1 SP2 sub, Pp2 SP1 sub, Pp2 SP2 sub, Pp3 SP3 top had the highest bacterial count, indicated as the average number of colonies.
The total microbial load (bacterial count) expressed in cfu · g-1, exhibited in some samples were higher than those expected in normal healthy soils. Four soil samples, Pp1 SP2 sub, Pp2 SP1 sub, Pp2 SP2 sub, and Pp3 SP3 top had the highest bacterial count. The principal component analysis explained 91.77% of the variations among the factors and grouped the soil samples that had similar C-source utilization patterns into two major groups in which soil samples Pp3 SP2 sub, Pp2 SP2 top, Pp3 SP1 top and Pp3 SP2 top with the lowest scores for the attributes measured were grouped together, as compared to the rest of the samples (Figure 2A). Similar groupings are also indicated on the hierarchical clustering dissimilarity chart in Figure 2B.
3.3. Mapping of Potentially Suitable Areas for Artemisia Afra Cultivation
3.3.1. Mapping Using the Maxent Model
Figure 3 shows the natural distribution of A. afra, indicated on the SANBI database as represented by the green circles, and the physically collected point represented by the red circles. The map shows a wide distribution of the species in South Africa, with very few populations recorded in the Northern Cape province (close to the Free State province border).
The MaxEnt model further shows that the Northern Cape province was less suitable (very low probability of suitability) for A. afra growth. The areas with the highest probability of suitability for growth and cultivation of A. afra, which were optimal to sub-optimal, were mainly recorded in the Eastern Cape, KwaZulu-Natal, and Mpumalanga provinces. The Free State, Gauteng, Limpopo and Western Cape provinces had sub-optimal to moderate areas, which may represent moderate probability of suitability for the growth and cultivation of A. afra. The future predictions (Figure 3B, C) shows that there will not be major changes in the distribution of A. afra from 2021-2050; however, changes are expected from 2051-2080. Most of the areas that showed optimal to suboptimal environmental suitability for distribution of A. afra will change from suboptimal to moderate and moderate to marginal, in the period 2051-2080.
The results of the evaluation of the model performance are given in Figure 4. The area under the curve (AUC) value of the training data, used to create the predictive model, and the test data, which assesses the model accuracy, were 0.836 and 0.903, indicating that the MaxEnt performed excellent modelling as an AUC value of 0.75 is considered to be reliably accurate [17].
Table 5 gives estimates of the relative percentage contribution of each environmental variable to the MaxEnt model. The long-term average annual rainfall (62%), highest long-term average monthly maximum temperature (21.5%), and average soil depth (7.5%) were the environmental variables that played a significant role in the prediction. Similarly, the permutation importance showed long-term average annual rainfall, highest long-term average monthly maximum temperature, and average soil depth as the environmental factors that contribute more to the MaxEnt model. It is important to note that because this is a predictive model, this estimate of importance does not imply directionality nor causality.
4. Discussion
Chemotypic variations between and within wild populations of A. afra have been reported by many researchers. These variations are between populations across countries, within a country, and even within a region [24,25,26] and they have a great effect on the selection of favourable chemotypes for commercial development. Oyedeji et al. [26] observed that environmental conditions play a significant role in the synthesis of essential oils in A. afra. However, the relationship between environmental factors and the A. afra chemotypes has not been previously reported. Different medicinal plants have different optimum soil conditions for their survival. For example, Radix isatidis grows well in slightly acidic to slightly alkaline, loose sandy loam or light sandy soils with 60-80% moisture content, whereas Baphicacanthus cusia prefers acidic to neutral sandy or loam soils with 22 – 33% soil moisture content [12].
Although the soil’s physical properties in the current study indicated that A. afra can adapt to a wide range of soils, most of the soil samples collected from the three different A. afra populations were clay loam soils as they contained 30-40% clay, 20-40% sand and lower levels of silt. Maharjan et al. [9] indicated that soil clay content was among the most important environmental variables for predicting species distribution along elevation gradient in the Himalayan tropical montane. Most of the samples did not record substantial changes in the particle size distribution between the top- and the sub-soil. Similarly, no substantial changes in the organic matter content were recorded between the top and sub-soil samples. Organic matter is a major source of nutrients and microbial energy in the soil, and it holds water, promotes soil aggregation, and improves infiltration and water-use efficiency [27]. The organic matter content varied from 0.04 to 1.26%, an indication of a very low organic matter content, which is characteristic of most South African soils [28]. The non-substantial variation in the organic matter content could be due to the similar soil texture of the samples, which was mostly clay loam. While there is a paucity of information on A. afra growth in different soils, A. annua plants cultivated in clay loam soils grew significantly taller and had significantly more branches, with thicker stems than those grown in sandy loam soils [29]. The fresh and dry biomass yields were also higher in plants grown in clay loam soils compared to those grown in sandy loam soils [29]. However, the artemisinin (%) and the essential oil contents (%) were higher in A. annua plants grown in sandy loam soils compared to those in clay loam soils, and this could have been due to the nutrient and water stress in the more sandy soil [29].
Soil pH, on the other hand, also regulates soil nutrient availability, organic matter turnover and many other processes in the soil [28]. The pH of the soil samples was slightly acidic (5.5 to 6.5 on pH scale). All the macro-nutrients (N, P, K, Ca and Mg) are available for uptake at this range and the range should be suitable for most plants. At low pH, the micro/trace elements are soluble due to high desorption, and the adsorption increases with an increase in pH, thus the trace elements become less soluble leading to low concentrations in the soil solution [30]. Hansen-Quartey et al. [31] compared soil samples from a patch where A. afra grows to the ones collected where A. afra does not grow, and they reported no significant differences in organic carbon, pH, Ca, Mg, K and Na. The clay content of the soil samples could be an advantage as it reduces the chances of leaching out of nutrients, especially N, Ca and Mg [28,32]. Zhang et al. [7] reported soil pH as one of the environmental factors that affect the suitability for cultivation of Scutellaria baicalensis in China.
Artemisia afra plants grown in a hydroponics system at pH of 5.5, 6.5 and 7.5 recorded no significant differences in total dry weight, shoot dry weight and root dry weight; however, these parameters were significantly decreased at pH of 4.5 and 8.5 [33]. This could be an indication that A. afra doesn’t grow well in acidic or alkaline soils, and the soil pH of the collected samples was within the favourable pH range. Soils with high sand content (˃85%) have a low pH in the region of 4.5 to 5.5, and they have low water-holding capacity, and low plant nutrient content [32]. Soil pH plays a critical role in the variation of microorganisms’ community structure and diversity, and thus controls the process of decomposition and nitrification [28]. Soil pH is also essential for the proper functioning of enzymatic activity in the soil, and it secondarily regulates enzymes through its effect on the microbes that produce them [30]; but it also has an effect on microbial diversity in the soil [34]. The lack of significant differences in the β-glucosidase and phosphatase activities between the soil samples in the current study could have been due to the close range in pH, which was 5.5 to 6.5, which could have been a suitable range for the β-glucosidase and phosphatase activities. The optimum pH for β-glucosidase activity was found to be between 4 and 6 in tropical rainforests [35], and between 4.5 and 6.5 for the phosphatase activity [34]. The β-glucosidase activity was confined to an acidic pH range with negligible activity in the alkaline range, whereas the phosphomonoesterase activity was found in the acid pH range (4-5) and in the alkaline pH range (9.5-11.5) [35].
Among all variables examined in another study [36], soil pH was the best predictor of soil bacterial diversity and richness, and environmental factors such as temperature and evapotranspiration had a minor effect on soil bacterial diversity. Similarly, soil pH was found to alter the composition and diversity of soil bacteria [37]. Soils with a pH of 6.8 recorded a bacterial richness 60% higher than soils with a pH value of 5.1, and soil with pH of 5.5 recorded a bacterial richness 26% higher than those with a pH value of 4.1 [36]. Will et al. [38] reported no significant correlation between changes in the abundance of the dominant acido-bacterial subgroups and other phylogenetic groups, with soil pH and one of the reasons advanced was that the pH values of all soil samples collected were near neutral. Rousk et al. [39] also reported insignificant differences in bacterial community composition when soil pH values were above 6.8. The medium to slightly acidic pH range of the samples analyzed in the current work could explain the lack of significant difference in the AWCD, except for a few samples that recorded a significantly lower AWCD. Samples Pp2 SP2 top, Pp3 SP1 top, Pp3 SP2 top, and Pp3 SP2 sub recorded significantly lower AWCD, although the pH values were still within the 5.5 to 6.5 range. However, no significant differences were recorded for the microbial species evenness, and for the richness only sample Pp3 SP2 sub recorded significantly lower values, while for the Shannon Weaver Index, samples Pp3 SP2 top and sub recorded significantly lower values. The results indicate that there were mostly the same number of microbial species, in similar proportions, and they were mostly all similarly active in all the samples.
The major group of carbon sources utilized as indicated by the AWCD showed significant differences in the utilization of five major carbon sources. The highest AWCD was detected for the utilization of amino acids and polymers by the microbial communities of sample Pp1 S2 sub (amino acids 1.91 and polymers 1.85). Followed by this, a high rate of amino acid utilization was also recorded for Pp1 S2 top (1.78), Pp3 S1 sub (1.71), Pp1 S1 top (1.63), and Pp2 S1 sub (1.65). Sample Pp3 S2 sub had the lowest utilization rates of all the five groups of carbon sources. The carbon source utilization, the Shannon Weaver Index and species richness, were positively correlated to one group of the soil samples and the species evenness was positively correlated to the second group, which consisted of samples Pp3 S2 sub, Pp2 S2 top, Pp3 S1 top and Pp3 S2 top. The principal component analysis explained 91.77% of the variations and evenness was identified as contributing 9.34%, whereas carbon source utilization, Shannon weaver index and species richness contributed 82.43%.
The MaxEnt model identified areas with the highest probability of suitability for growth and cultivation of A. afra and these areas are mainly warm temperate areas with dry winters and hot to cool summers, to areas with warm temperate climates that are fully humid with hot to cool summers according to the Köppen-Geiger climate classification described in another study [40]. The SANBI database indicated the natural occurrence of A. afra in eight of the nine South African Provinces. The only population recorded in the Northern Cape Province was close to the Free State Province border, which could have been the only marginally suitable area in the province. The MaxEnt model also showed that the Northern Cape Province has very few areas with marginal suitability for A. afra growth. The annual rainfall in the Northern Cape, may not be suitable for A. afra. The MaxEnt model predicted average annual rainfall as one of the important factors for the distribution of A. afra, followed by temperature and soil depth. The areas identified in the MaxEnt model as suitable for A. afra, have an average annual rainfall ranging from ˃1500 mm to 500 mm, according to the map of South Africa’s annual rainfall across water management areas as described by [41]. The future predictions show that climate change will only have an effect on the distribution of A. afra from the period 2051-2080. Tshabalala et al. [17] reported that habitat distribution of a number of medicinal plants was mainly affected by precipitation-based variables. Similarly, it has been reported that temperature and precipitation were the main factors that affected the Maxent prediction results for Codonopsis pilosula in China [23]. The major factors that can be expected to affect A. afra populations could be habitat destruction due to agricultural development, human settlement, and environmental pollution. The AUC values were between 0.836 and 0.903 when the model was evaluated, showing that it was very good in predicting the distribution of A. afra, as it was closer to 1 [23]. The AUC values of 0-0.5 indicates a very poor prediction, 0.6-0.7 a poor prediction, 07-08 a fair prediction, 0.8-0.9 a good prediction, and 0.9-1 indicates an excellent prediction [18].
5. Conclusions
The results from the study suggest that annual rainfall, temperature, and soil depth are the most significant environmental variables that affect the distribution of A. afra and suitability of an area for the species cultivation. Soil pH also seems to be critical as the soil samples had a pH value in the region of moderately to slightly acidic. The preference of the species for grasslands with higher annual rainfall, suggests a need for studies on water use of A. afra. The most suitable areas that can be recommended for cultivation of A. afra are mainly in the Mpumalanga, Gauteng, KwaZulu-Natal, Eastern Cape, Free State, Limpopo, Western Cape and North West provinces, listed in order of environmental suitability.
The study was successful in predicting suitable climatic and soil conditions for the distribution, and growth; as well as in mapping potential areas for the cultivation of A. afra. Although the MaxEnt model was validated using AUC values, there is still a level of uncertainty regarding the distribution of the species because the model considerably relies on parameter settings and can result in biased estimations, incorrect inference, and poor performance. Other technologies will be critical in further identifying natural populations of A. afra, verifying the results of the MaxEnt model, and monitoring the wild populations. The results of the study are critical in advising potential growers of the species who may be in marginal or non-suitable regions, as this may result in crop failure or increased input costs. The predictions for future distribution of A. afra suggests that conservation management should focus on human effects more than climate change.
Author Contributions
MMM: Conceptualization, Visualization, Methodology, Investigation, Original Draft Preparation; HLW: Methodology, Software, Investigation; HTA: Visualization, Investigation, Original Draft Preparation; SOA: Supervision, Validation, Review & Editing; NAA: Methodology, Review & Editing; SH-G: Resources, Review & Editing; CPdP: Validation, Review & Editing.
Funding
This research was funded by the Water Research Commission (South Africa) [grant number: C2022/2023-00921].
Data Availability Statement
All relevant data are included in the manuscript.
Conflicts of Interest
The authors declare no conflicts of interest. The funders had no role in the design of the study; in the collection, analyses, or interpretation of data; in the writing of the manuscript; or in the decision to publish the results.
References
- Martini, C.M. , Zhang, T., Williams, J.T., Abramovitch, R.B., Weathers, P.J., Shell, S.S. Artemisia annua and Artemisia afra extracts exhibit strong bactericidal activity against Mycobacterium tuberculosis. J. Ethnopharmacol. 2020, 262, 113191. [Google Scholar] [CrossRef] [PubMed]
- Daddy, B. , Lutgen, P., Gisenya, P. Breakthrough against tuberculosis: high efficacy Artemisia afra infusions. Pharm. Pharmacol. Int. J. 2021, 9, 58–62. [Google Scholar]
- Nie, C. , Trimpert, J., Moon, S., Haag, R., Gilmore, K., Kaufer, B.B., Seeberger, P.H. In vitro efficacy of Artemisia extracts against SARS-CoV-2. Virol. J. 2021, 18, 182. [Google Scholar] [CrossRef]
- Spies, L. , Koekemoer, T.C., Sowemimo, A.A., Goosen, E.D., Van de Venter, M. Caspase-dependent apoptosis is induced by Artemisia afra Jacq. ex Willd in a mitochondria-dependent manner after G2/M arrest. S. Afr. J. Bot. 2013, 84, 104–109. [Google Scholar]
- Shinyuy, L.M. , Loe, G.E., Jansen, O., Mamede, L., Ledoux, A., Noukimi, S.F., Abenwie, S.N., Ghogomu, S.M., Souopgui, J., Robert, A., Deyemer, K., Frederich, M. Secondary metabolites isolated from Artemisia afra and Artemisia annua and their anti-malarial, anti-inflammatory and immunomodulating properties—pharmacokinetics and pharmacodynamics: a review. Metabolites 2023, 13, 613. [Google Scholar] [CrossRef]
- Van Noorden, R. Demand for malarial drug soars. Nature 2010, 466, 672–673. [Google Scholar]
- Zhang, L. , Cao, B., Bai, C., Li, G. & Mao, M. Predicting suitable cultivation regions of medicinal plants with Maxent modeling and fuzzy logics: a case study of Scutellaria baicalensis in China. Environ. Earth Sci. 2016, 75, 361. [Google Scholar] [CrossRef]
- Bariotakis, M. , Georgescu, L., Laina, D., Oikonomou, J., Ntagounakis, G., Koufaki, M.-I., Souma, M., Choreftakis, M., Zormpa, O.G., Smykal, P., Sourvinos, G., Lionis, C., Castanas, E., Karousou, R., Pirintos, S.A. From wild harvest towards precision agriculture: use of ecological niche modelling to direct potential cultivation of wild medicinal plants in Crete. Sci. Total Environ. 2019, 694, 133681. [Google Scholar] [CrossRef]
- Maharjan, S.K. , Sterck, F.J., Raes, N., Poorter, L. Temperature and soils predict the distribution of plant species along the Himalayan elevation gradient. J. Trop. Ecol. 2022, 38, 58–70. [Google Scholar]
- Rahman, I.U. , Hart, R.E., Ijaz, F., Afzal, A., Iqbal, Z., Calixto, E.S., Abd_Allah, E.F., Alqawari, A.A., Hashem, A., Al-Arjani, A.B.F., Kausar, R., Haq, S.M. Environmental variables drive plant species composition and distribution in the moist temperate forests of Northwestern Himalaya, Pakistan. Plos One 2022, 17, e0260687. [Google Scholar] [CrossRef]
- Chauvier, Y. , Thuiller, W., Brun, P., Lavergne, S., Descombes, P., Karger, D.N., Renaud, J., Zimmermann, N.E. Influence of climate, soil, and land cover on plant species distribution in the European Alps. Ecol. Monogr. 2021, 91, e01433. [Google Scholar]
- Chen, G. , Wang, S., Huang, X., Hong, J., Du, L., Zhang, L., Ye, L. Environmental factors affecting growth and development of Banlangen (Radix isatidis) in China. Afr. J. Plant Sci. 2015, 9, 421–426. [Google Scholar]
- Ncube, B. , Finnie, J.F., Van Staden, J. Quality from the field: the impact of environmental factors as quality determinants in medicinal plants. S. Afr. J. Bot. 2012, 82, 11–20. [Google Scholar]
- Wu, J. , Li, X., Huang, L., Meng, X., Hu, H., Luo, L., Chen, S. A new GIS model for ecologically suitable distributions of medicinal plants. Chin. Med. 2019, 14, 4. [Google Scholar] [CrossRef]
- Tshwene-Mauchaza, B. , Aguirre-Gutiérrez, J. Climatic drivers of plant species distribution across spatial grains in southern Africa tropical forests. Front. For. Glob. Change 2019, 2, 69. [Google Scholar] [CrossRef]
- Phillips, S.J. , Anderson, R.P., Schapire, R.E. Maximum entropy modelling of species geographic distributions. Ecol. Model. 2006, 190, 231–259. [Google Scholar]
- Tshabalala, T. , Mutanga, O., Abdel-Rahman, E.M. Predicting the geographical distribution shift of medicinal plants in South Africa due to climate change. Conservation 2022, 2, 694–708. [Google Scholar] [CrossRef]
- Zhao, Y. , Zhao, M., Zhang, L., Wang, C., Xu, Y. Predicting possible distribution of tea (Camellia sinensis L.) under climate change scenarios using MaxEnt Model in China. Agriculture 2021, 11, 1122. [Google Scholar] [CrossRef]
- Sullivan, T.S., Barth, V., Lewis, R.W. Soil acidity impacts beneficial soil microorganisms. Soil acidification series, Washington State University 2017, FS247E, www.ext.wsu.edu.
- Ntalo, M. , Ravhuhali, K.E., Moyo, B., Mmbi, N.E., Mokoboki, K.H. Physical and chemical properties of the soils in selected communal property associations of South Africa. PeerJ 2022, 10, e13960. [Google Scholar] [CrossRef]
- Mofokeng, M.M. , Habig, J., Amoo, S.O., du Plooy, C.P., Mashela, P.W., Moeletsi, M.E., Venter, S., Araya, H. Differences in soil microbial communities and enzyme activity due to the application of bioslurry under cultivation. S. Afr. J. Plant Soil 2020, 37, 283–291. [Google Scholar] [CrossRef]
- Engelbrecht, F.A. , Bopape, M. J. High-resolution projected climate futures for southern Africa. In proceedings of the 27th Annual Conference of the South African Society for Atmospheric Sciences, Hartebeeshoek, South Africa, September 2011, ISBN 978-0-620-47333-0.
- Yan, H. , He, J., Xu, X., Yao, X., Wang, G., Tang, L., Feng, L., Zou, L., Gu, X., Qu, Y., Qu, L. Prediction of potentially suitable distributions of Codonopsis pilosula in China based on an optimized MaxEnt Model. Front. Ecol. Evol. 2021, 9, 773396. [Google Scholar] [CrossRef]
- Viljoen, A.M. , Van Vuuren, S.F., Gwebu, T., Demirci, B., Bașer, K.H.C. The geographical variation and antimicrobial activity of African wormwood (Artemisia afra Jacq.) essential oil. J. Essent. Oil Res. 2006, 18, 19–25. [Google Scholar] [CrossRef]
- Kane, N.F. , Kyama, M.C., Nganga, J.K., Hassanali, A., Diallo, M., Kimani, F.T. Comparison of phytochemical profiles and antimalarial activities of Artemisia afra plant collected from five countries in Africa. S. Afr. J. Bot. 2019, 125, 126–133. [Google Scholar]
- Oyedeji, A.O. , Afolayan, A.J., Hutchings, A. Compositional variation of the essential oils of Artemisia afra Jacq. from three provinces in South Africa – a case study of its safety. Nat. Prod. Commun. 2009, 4, 849–852. [Google Scholar] [PubMed]
- Du Preez, C.C. , Van Huyssteen, C.W., Mnkeni, P.N.S. Land use and soil organic matter in South Africa 1: a review on spatial variability and the influence of rangeland stock production. S. Afr. J. Sci. 2011, 107, Art. #354. [Google Scholar]
- Zhou, W. , Han, G., Liu, M., Li, X. Effects of soil pH and texture on soil carbon and nitrogen in soil profiles under different land uses in Mun River Basin, Northeast Thailand. PeerJ 2019, 7, e7880. [Google Scholar] [CrossRef]
- Omer, E.A. , Abou Hussein, E.A, Hendawy, S.F., El-din, E., Azza, A., El-Gendy, A.G. Effect of soil type and seasonal variation on growth, yield, essential oil and artemisinin content of Artemisia annua L. Int. Res. J. Hortic. 2013, 1, 15–27. [Google Scholar] [CrossRef]
- Neina, D. The role of soil pH in plant nutrition and soil remediation. Appl. Environ. Soil Sci. 2019, Article ID 5794869. [CrossRef]
- Hansen-Quartey, J.H. Soil properties as influenced by cultivation of the aromatic shrub Artemisia afra. S. Afr. J. Plant Soil 1998, 15, 14–18. [Google Scholar]
- Sukitprapanon, T.-S., Jantamenchai, M., Tulaphikat, D., Vityakon, P. Nutrient composition of diverse organic residues and their long-term effects on available nutrients in a tropical sandy soil. Heliyon 2020, 6, e05601. [CrossRef]
- Koehorst, R. , Laubscher, C.P., Ndakidemi, P.A. Growth response of Artemisia afra Jacq. to different pH levels in a closed hydroponics system. J. Med. Plants Res. 2010, 4, 1617–1623. [Google Scholar]
- Sinsabaugh, R.L. , Lauber, C., Weintraub, M.N., Ahmed, B., Allison, S.D., Crenshaw, C., Contosta, A.R., Cusack, D., Frey, S., Gallo, M.E., Gartner, T.B., Hobbie, S.E., Holland, K., Keeler, B.L., Powers, J.S., Stursova, M., Takacs-Vesbach, C., Waldrop, M.P., Wallenstein, M.D., Zak, D.R., Zeglin, L.H. Stoichiometry of soil enzyme activity at global scale. Ecol. Lett. 2008, 11, 1252–1264. [Google Scholar]
- Turner, B.L. Variation in pH optima of hydrolytic enzyme activities in tropical rain forest soils. Appl. Environ. Microbiol. 2010, 76, 6485–6493. [Google Scholar] [PubMed]
- Fierer, N. , Jackson, R.B. The diversity and biogeography of soil bacterial communities. PNAS 2006, 103, 626–631. [Google Scholar] [CrossRef] [PubMed]
- Hartman, W.H. , Richardson, C.J., Vilgalys, R., Bruland, G.L. Environmental and anthropogenic controls over bacterial communities in wetland soils. PNAS 2008, 105, 17842–17847. [Google Scholar] [CrossRef]
- Will, C. , Thürmer, A., Wollherr, A., Nacke, H., Herold, N., Schrumpf, M., Gutknecht, J., Wubet, T., Buscot, F., Daniel, R. Horizon-specific bacterial community composition of German grassland soils, as revealed by pyrosequencing-based analysis of 16S rRNA genes. Appl. Environ. Microbiol. 2010, 76, 6751–6759. [Google Scholar] [CrossRef]
- Rousk, J. , Bååth, E., Brookes, P.C., Lauber, C.L., Lozupone, C., Caporaso, J.G., Knight, R., Fierer, N. Soil bacterial and fungal communities across a pH gradient in an arable soil. The ISME J. 2010, 4, 1340–1351. [Google Scholar]
- Conradie, D.C.U. South Africa’s climatic zones: today, tomorrow. In proceeding of the International Green Building Conference and Exhibition, Sandton, South Africa, July 25-26 2012. [Google Scholar]
- Cole, M.J. , Bailey, R.M., Cullis, J.D.S., New, M.G. Spatial inequality in water access and water use in South Africa. Water Policy 2018, 20, 37–52. [Google Scholar] [CrossRef]
Figure 1.
Map of South Africa, Free State Province and the Maluti-A-Phofung municipality where soil samples for the different Artemisia afra populations were collected.
Figure 1.
Map of South Africa, Free State Province and the Maluti-A-Phofung municipality where soil samples for the different Artemisia afra populations were collected.
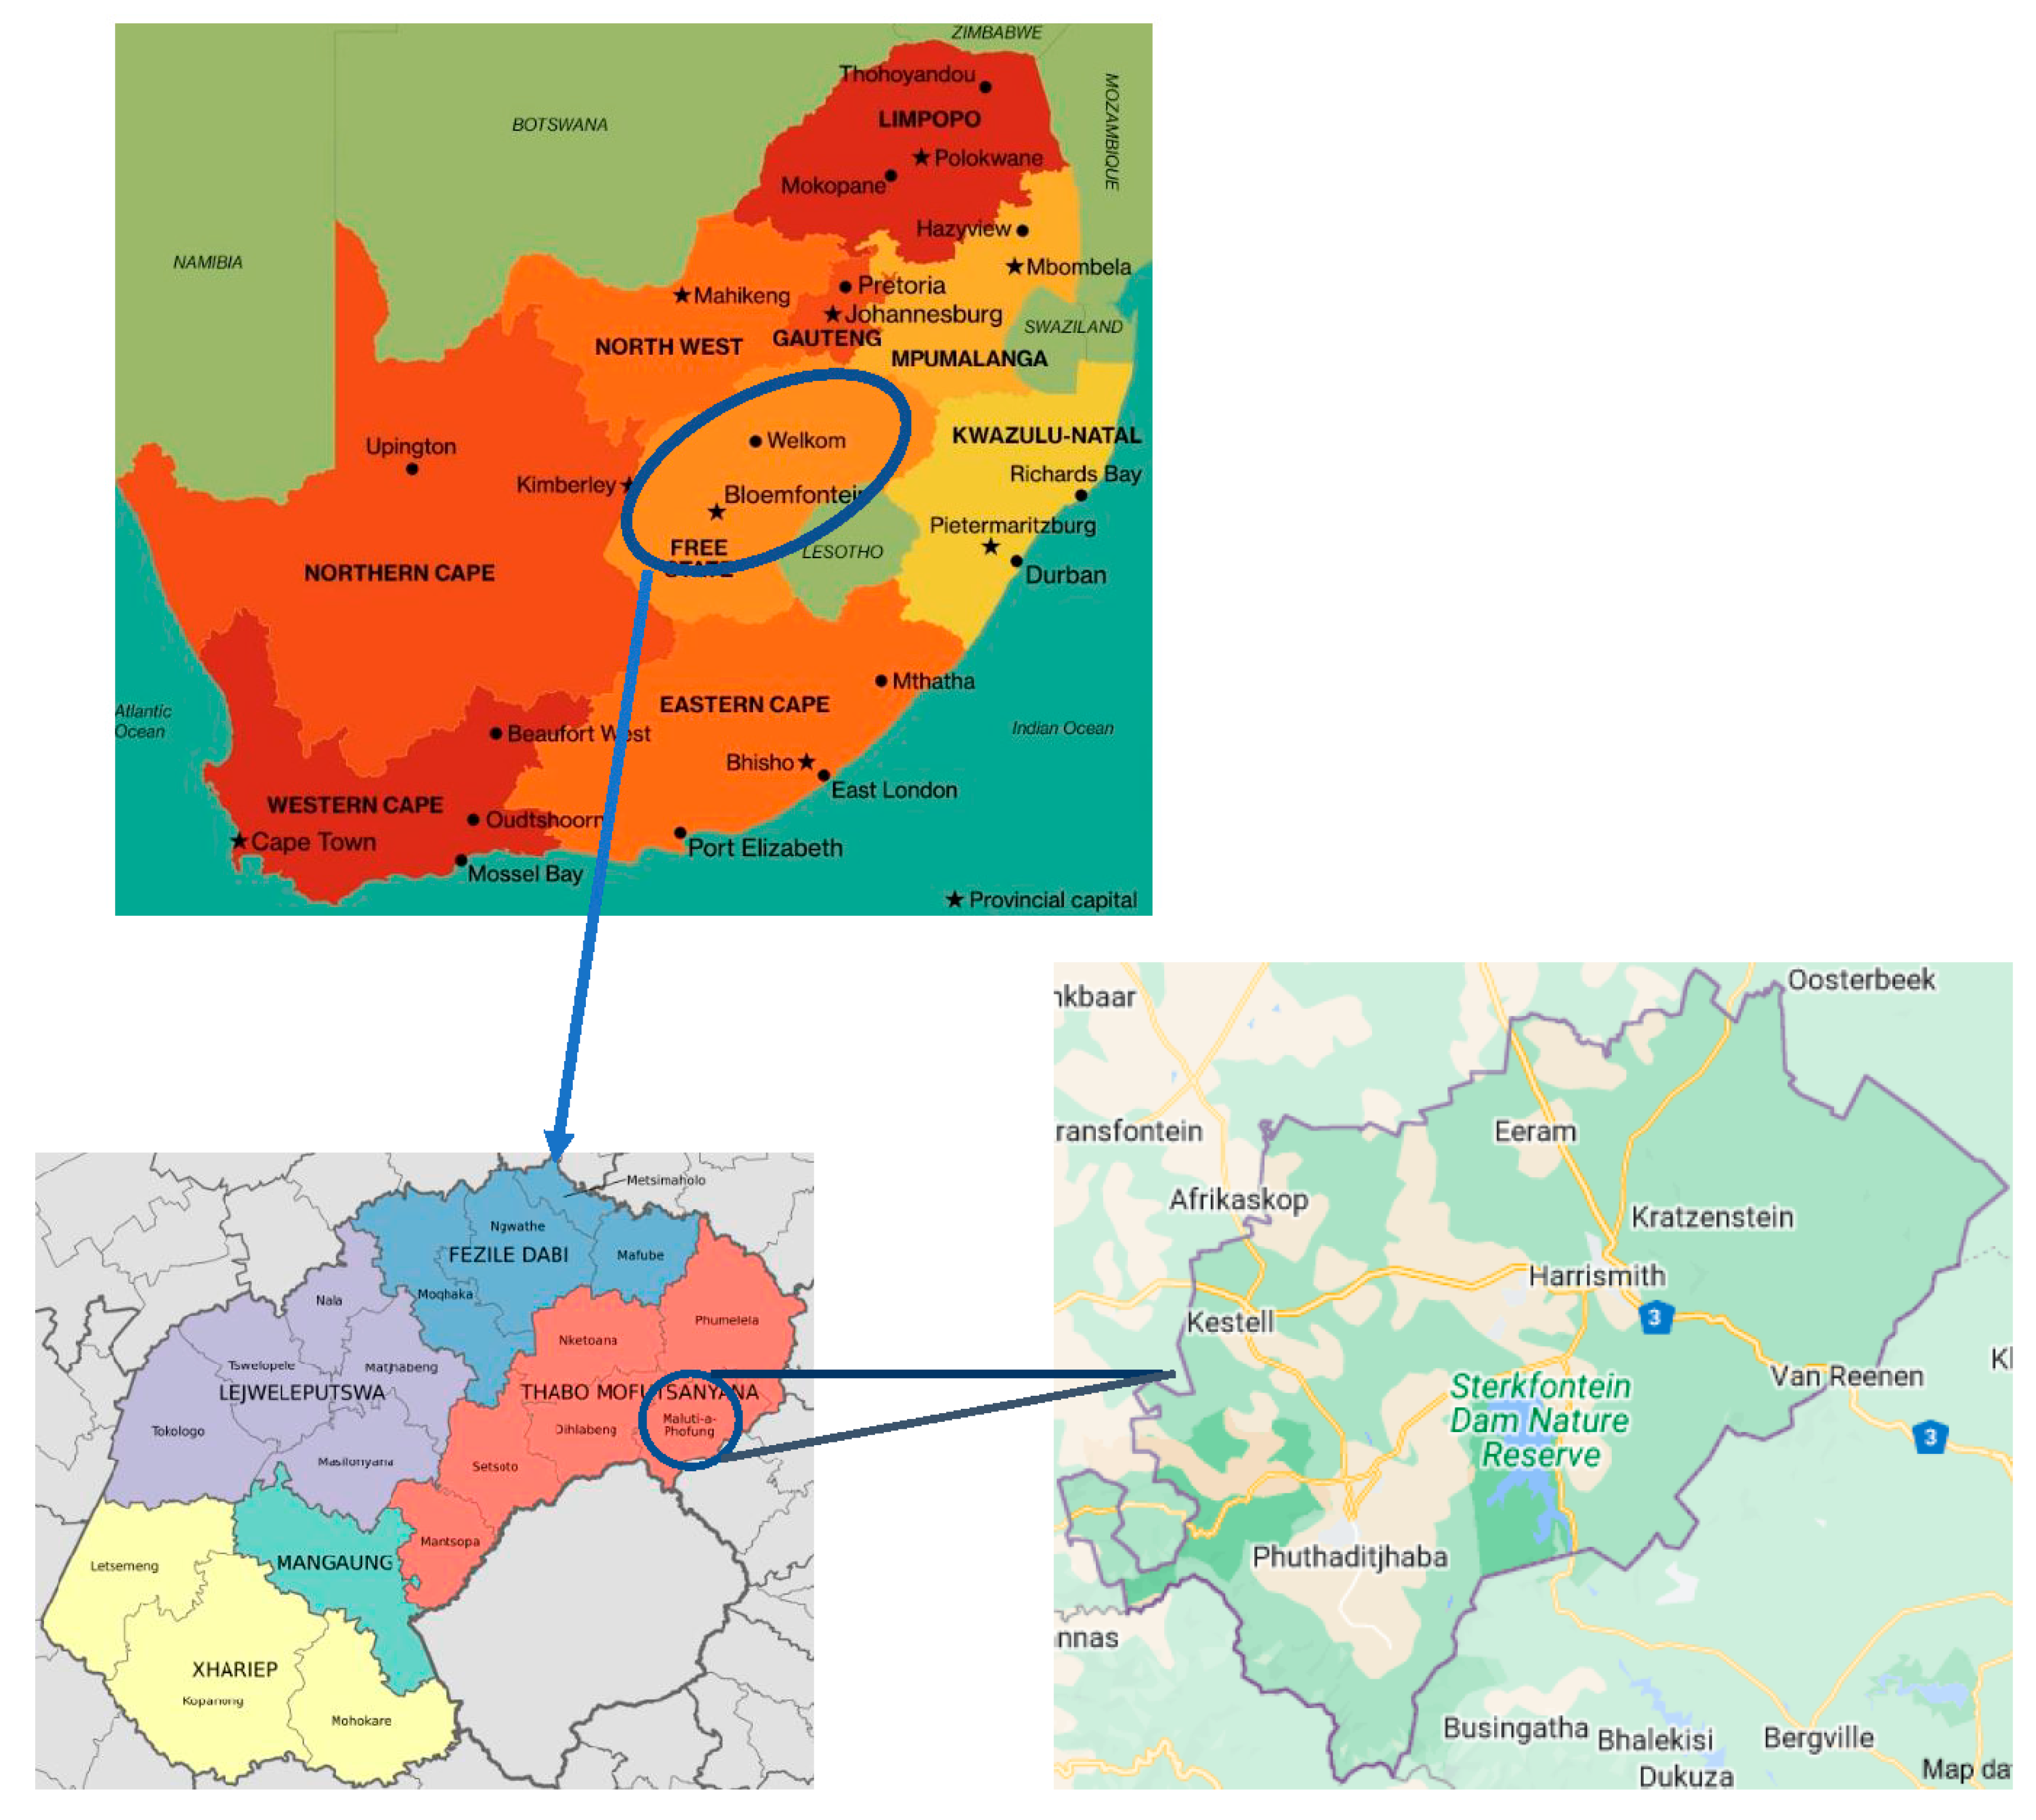
Figure 2.
The principal component analysis (A) and the dendogram (B) explaining the contributing factors to the variation between soil samples collected from different Artemisia afra populations.
Figure 2.
The principal component analysis (A) and the dendogram (B) explaining the contributing factors to the variation between soil samples collected from different Artemisia afra populations.
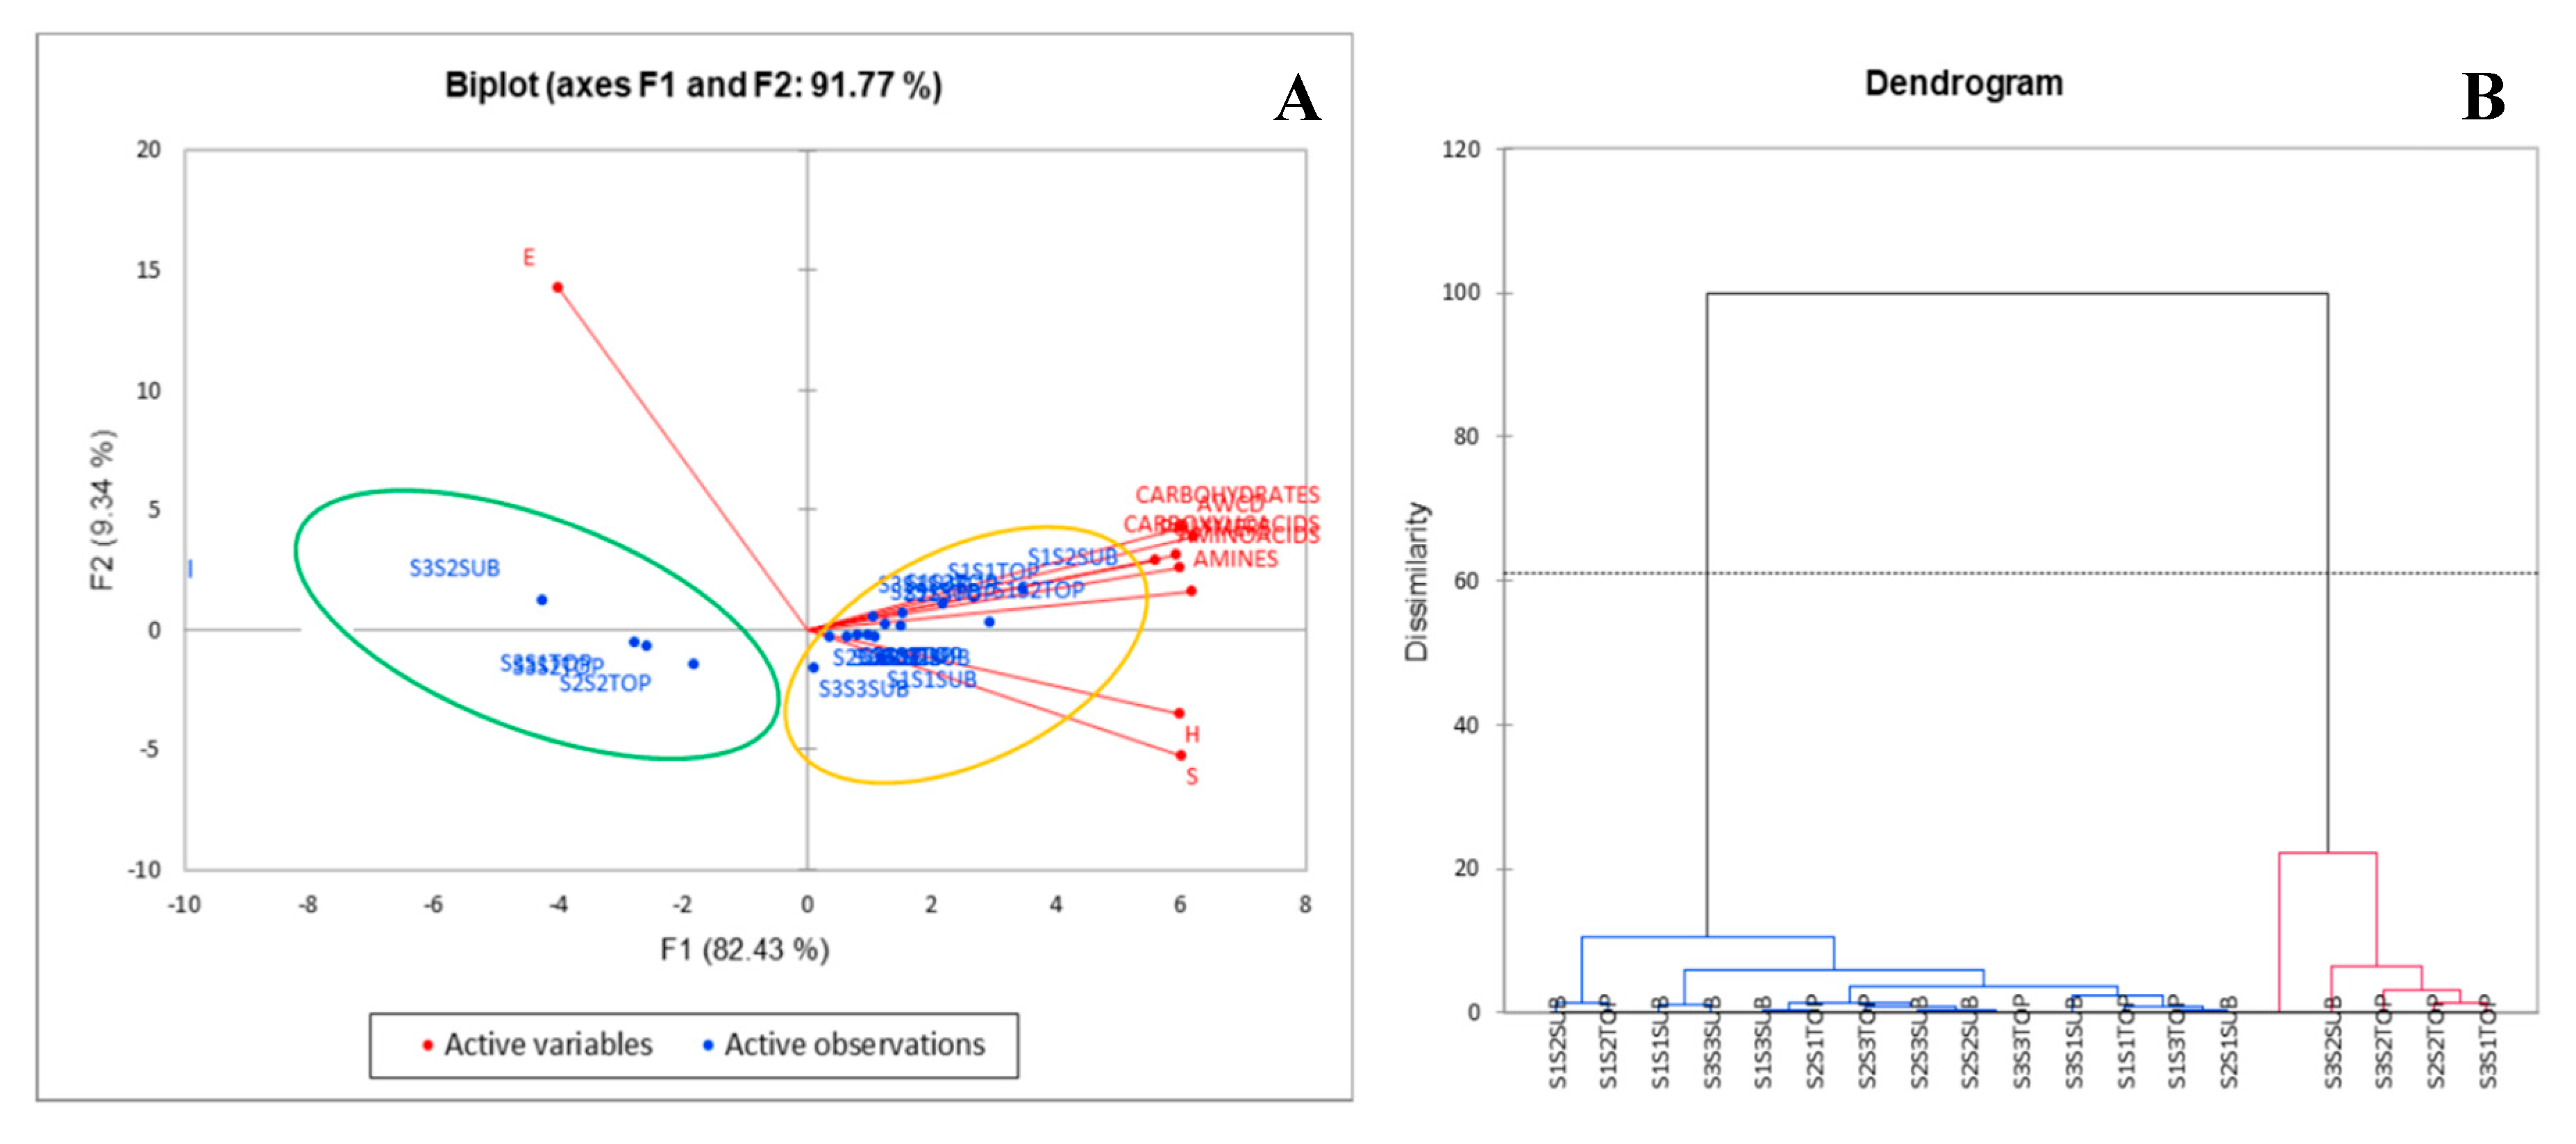
Figure 3.
Map of South Africa showing the natural distribution of Artemisia afra as per the SANBI records (green circles), the physically collected coordinates (red circles) and the environmental suitability predictions for the growth of A. afra (A), the prediction of future distribution of A. afra from 2021-2050 (B) and 2051-2080 (C).
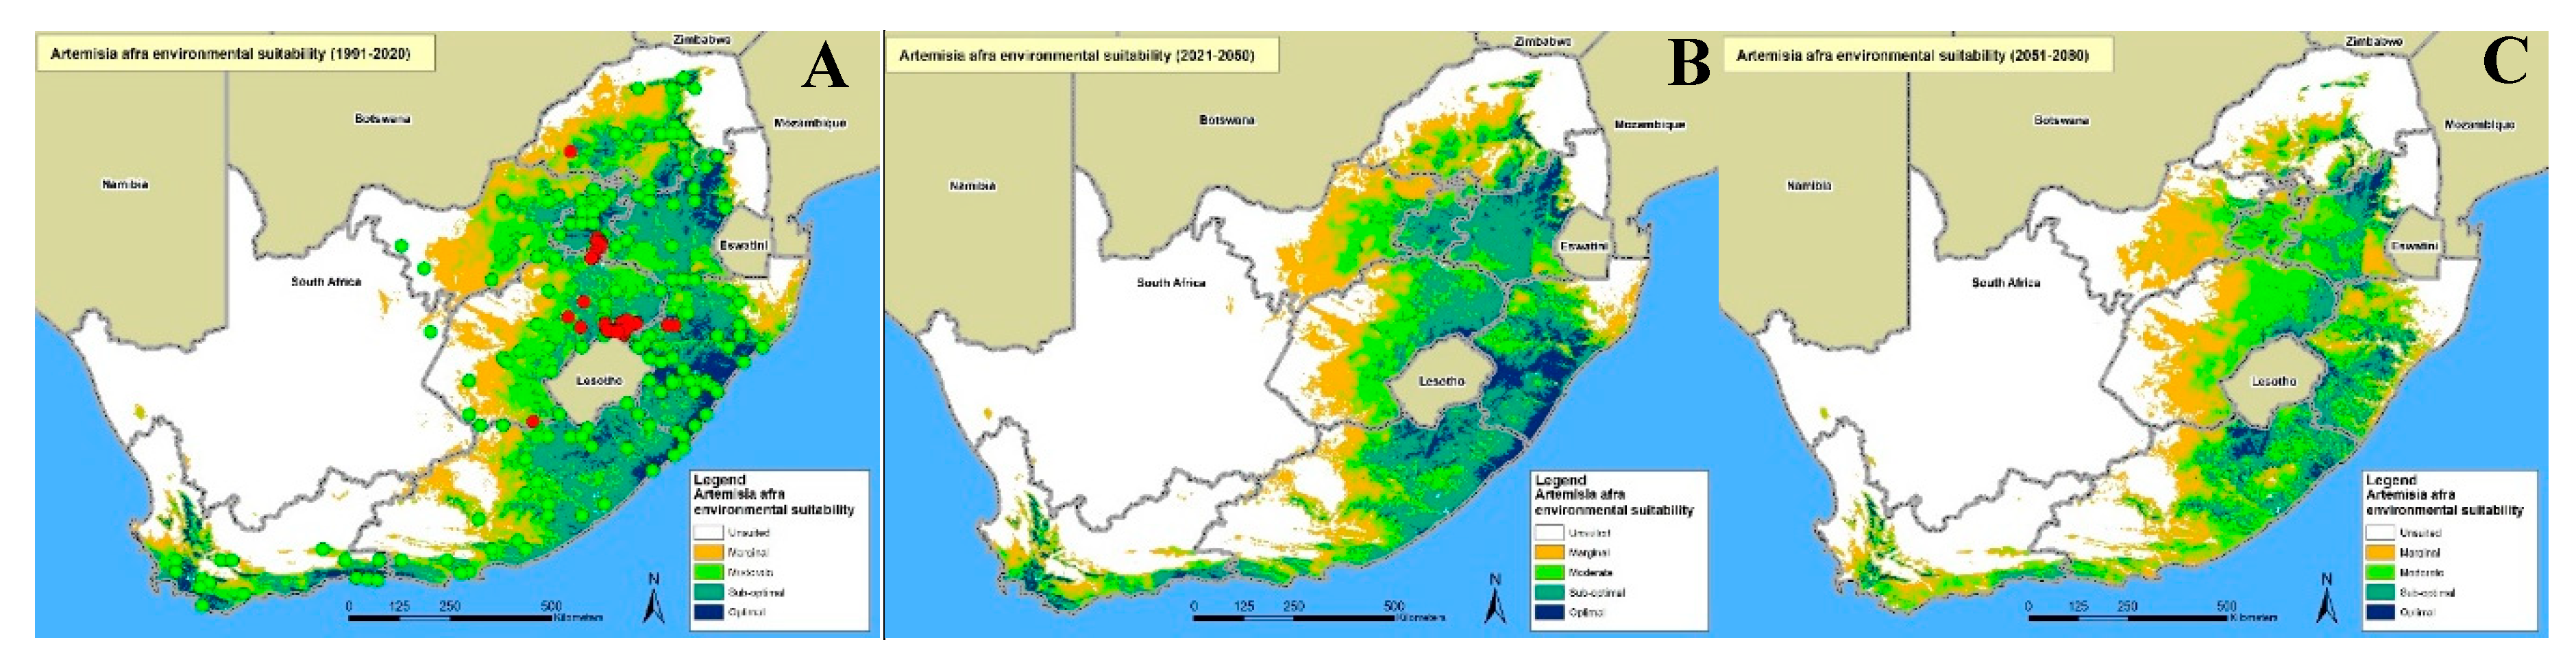
Figure 4.
The performance of the MaxEnt model using the computed receiver operating characteristics, with specific focus on the area under the curve (AUC).
Figure 4.
The performance of the MaxEnt model using the computed receiver operating characteristics, with specific focus on the area under the curve (AUC).
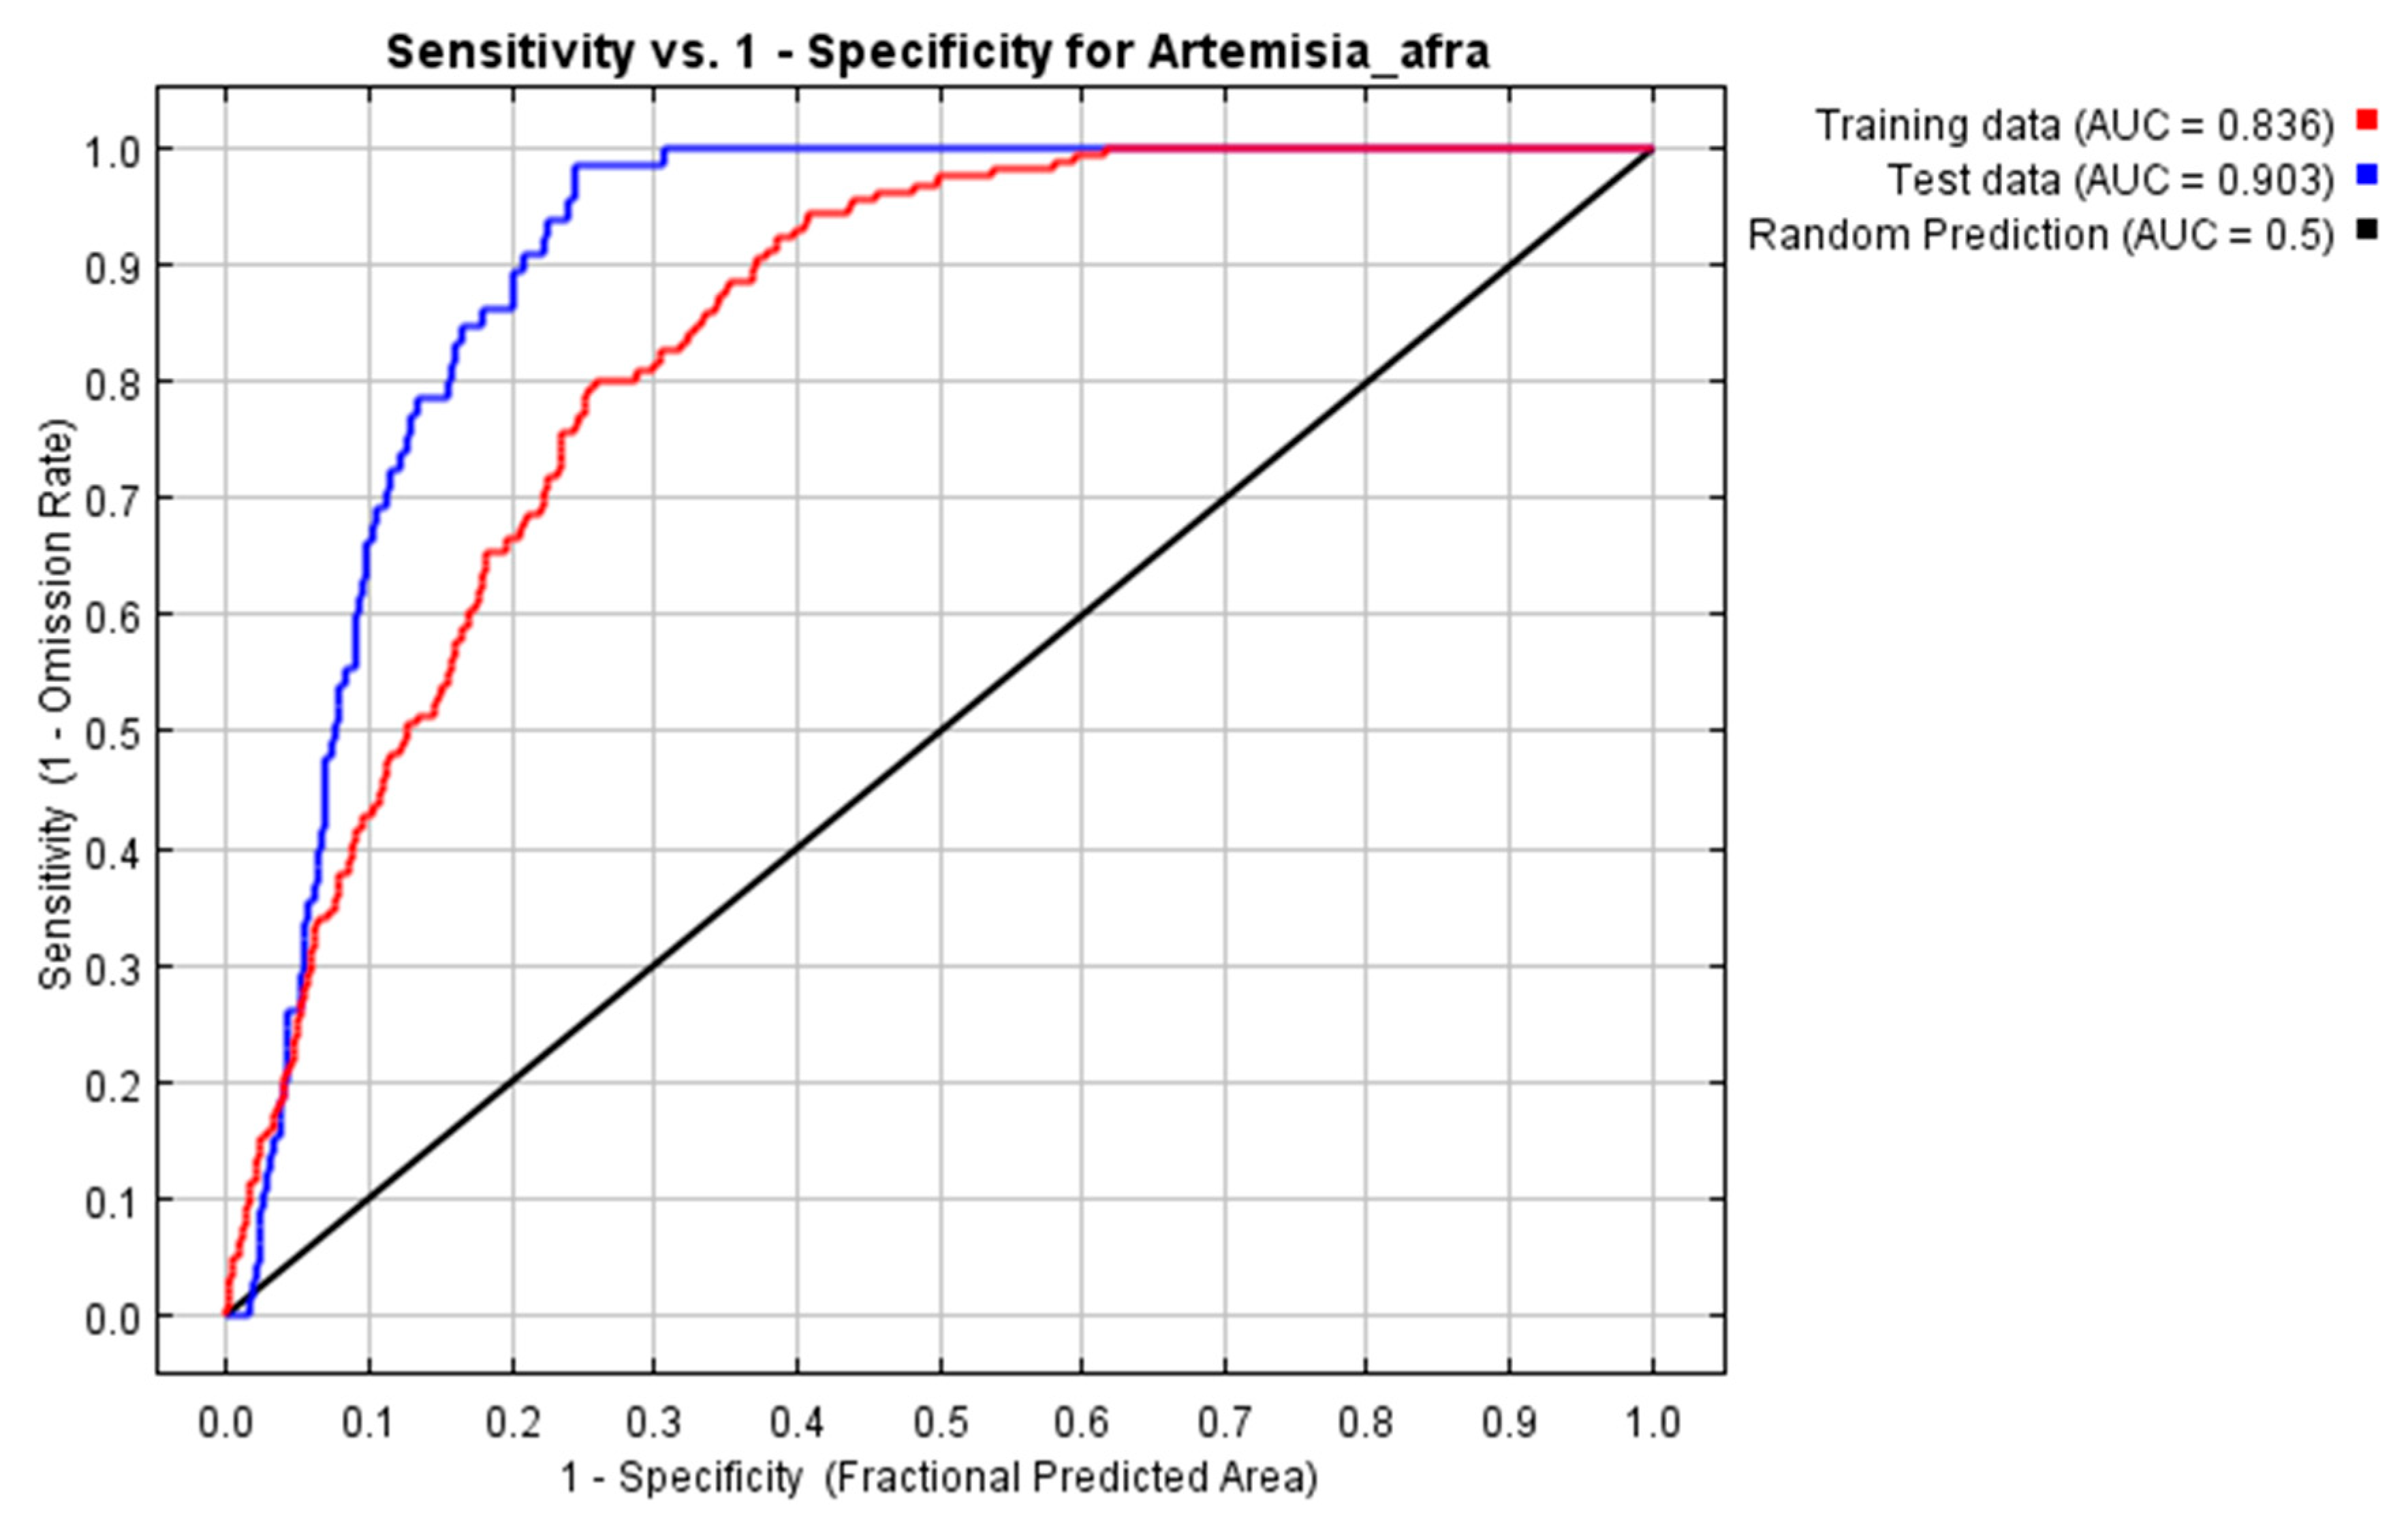

Table 1.
Particle size distribution of soil samples collected from Artemisia afra populations in the eastern part of the Free State Province.
Table 1.
Particle size distribution of soil samples collected from Artemisia afra populations in the eastern part of the Free State Province.
| Sand (%) | Silt (%) | Clay (%) | |||||
|---|---|---|---|---|---|---|---|
| Sample ID | Coarse 2-0.5 |
Medium 0.5-0.25 |
Fine 0.25-0.106 |
Very Fine 0.106-0.05 |
Coarse 0.05-0.02 |
Fine 0.02-0.002 |
<0.002 |
| mm | |||||||
| Pp1 SP1 top | 3.1 | 5.0 | 20.1 | 12.1 | 12.8 | 14.6 | 31.3 |
| Pp1 SP1 sub | 0.6 | 2.9 | 19.0 | 11.9 | 11.4 | 14.9 | 38.1 |
| Pp1 SP2 top | 16.1 | 12.6 | 22.7 | 15.1 | 9.4 | 10.0 | 13.2 |
| Pp1 SP2 sub | 22.3 | 9.6 | 20.2 | 14.6 | 12.2 | 9.4 | 10.7 |
| Pp1 SP3 top | 6.3 | 5.6 | 22.6 | 11.2 | 11.0 | 18.8 | 23.7 |
| Pp1 SP3 sub | 6.4 | 3.2 | 17.1 | 10.3 | 10.2 | 20.8 | 30.7 |
| Pp2 SP1 top | 11.6 | 5.3 | 11.9 | 12.7 | 13.5 | 14.9 | 28.6 |
| Pp2 SP1 sub | 2.7 | 7.7 | 20.2 | 20.6 | 12.8 | 12.6 | 22.1 |
| Pp2 SP2 top | 8.0 | 8.2 | 13.8 | 15.3 | 12.1 | 14.3 | 27.3 |
| Pp2 SP2 sub | 5.6 | 6.6 | 12.6 | 16.0 | 13.1 | 16.4 | 28.4 |
| Pp2 SP3 top | 22.0 | 10.2 | 17.7 | 13.4 | 12.3 | 9.3 | 13.9 |
| Pp2 SP3 sub | 12.2 | 7.9 | 14.8 | 15.0 | 11.1 | 13.4 | 24.4 |
| Pp3 SP1 top | 3.6 | 4.1 | 18.4 | 13.4 | 10.1 | 17.2 | 32.0 |
| Pp3 SP1 sub | 3.9 | 3.0 | 17.7 | 12.8 | 11.2 | 19.9 | 30.5 |
| Pp3 SP2 top | 4.6 | 6.1 | 21.2 | 14.5 | 11.6 | 14.4 | 26.6 |
| Pp3 SP2 sub | 4.3 | 6.4 | 22.9 | 14.3 | 10.4 | 14.1 | 26.4 |
| Pp3 SP3 top | 4.2 | 6.0 | 18.7 | 12.9 | 12.1 | 17.7 | 27.6 |
| Pp3 SP3 sub | 4.6 | 6.6 | 19.0 | 13.1 | 10.1 | 15.2 | 30.3 |
Pp1 SP1 top – Population 1, sample 1 topsoil; Pp1 SP1 sub – Population 1, sample 1 subsoil; Pp1 SP2 top – Population 1, sample 2 topsoil; Pp1 SP2 sub – Population 1, sample 2 subsoil; Pp1 SP3 top – Population 1, sample 3 topsoil; Pp1 SP3 sub – Population 1, sample 3 subsoil; Pp2 SP1 top – Population 2, sample 1 topsoil; Pp2 SP1 sub – Population 2, sample 1 subsoil; Pp2 SP2 top – Population 2, sample 2 topsoil; Pp2 SP2 sub – Population 2, sample 2 subsoil; Pp2 SP3 top – Population 2, sample 3 topsoil; Pp2 SP3 sub – Population 2, sample 3 subsoil; Pp3 SP1 top – Population 3, sample 1 topsoil; Pp3 SP1 sub – Population 3, sample 1 subsoil; Pp3 SP2 top – Population 3, sample 2 topsoil; Pp3 SP2 sub – Population 3, sample 2 subsoil; Pp3 SP3 top – Population 3, sample 3 topsoil; Pp3 SP3 sub – Population 3, sample 3 subsoil.
Table 2.
The chemical properties of soils collected from natural populations of Artemisia afra in the eastern part of the Free State Province.
Table 2.
The chemical properties of soils collected from natural populations of Artemisia afra in the eastern part of the Free State Province.
| Sample ID | Total P | Total N | N-NO3 | N-NH4 | P | K | Na | Ca | Mg | CEC | pH | OM |
|---|---|---|---|---|---|---|---|---|---|---|---|---|
| ppm | mg/kg | cmol(+)/kg | H2O | % | ||||||||
| Pp1 SP1 top | 4.67 | 0.131 | 0.70 | 6.67 | 1.79 | 277 | 15.6 | 2300 | 532 | 23.19 | 6.66 | 0.050 |
| Pp1 SP1 sub | 4.44 | 0.120 | 0.71 | 5.07 | 0.42 | 210 | 44.4 | 2300 | 651 | 33.04 | 5.95 | 0.074 |
| Pp1 SP2 top | 5.06 | 0.120 | 1.03 | 4.60 | 1.63 | 223 | 15.3 | 1720 | 502 | 25.35 | 5.3 | 1.264 |
| Pp1 SP2 sub | 5.46 | 0.113 | 1.67 | 4.84 | 2.06 | 265 | 23.9 | 1560 | 428 | 21.02 | 5.91 | 0.098 |
| Pp1 SP3 top | 5.08 | 0.162 | 0.59 | 3.75 | 4.02 | 458 | 7.92 | 2130 | 525 | 21.89 | 6.72 | 0.068 |
| Pp1 SP3 sub | 3.79 | 0.096 | 0.83 | 3.36 | 1.28 | 263 | 14.6 | 2560 | 700 | 26.42 | 6.29 | 0.049 |
| Pp2 SP1 top | 4.32 | 0.067 | 0.63 | 2.19 | 0.38 | 390 | 14.6 | 3340 | 1240 | 36.79 | 6.48 | 0.059 |
| Pp2 SP1 sub | 3.74 | 0.067 | 1.18 | 6.91 | 0.06 | 140 | 19.3 | 2700 | 988 | 35.52 | 6.70 | 0.048 |
| Pp2 SP2 top | 4.13 | 0.089 | 0.64 | 3.47 | 1.36 | 317 | 18.7 | 3060 | 1080 | 33.61 | 6.22 | 0.060 |
| Pp2 SP2 sub | 3.94 | 0.071 | 0.73 | 5.11 | 0.70 | 251 | 22.2 | 3470 | 1110 | 34.86 | 6.59 | 0.057 |
| Pp2 SP3 top | 5.43 | 0.090 | 1.60 | 8.25 | 1.29 | 196 | 44.9 | 2090 | 653 | 23.14 | 6.66 | 0.841 |
| Pp2 SP3 sub | 3.92 | 0.067 | 0.84 | 5.20 | 0.13 | 147 | 25.4 | 2900 | 990 | 33.11 | 6.86 | 0.055 |
| Pp3 SP1 top | 4.32 | 0.152 | 1.33 | 3.43 | 0.67 | 409 | 8.16 | 1300 | 648 | 23.35 | 6.15 | 0.062 |
| Pp3 SP1 sub | 4.33 | 0.151 | 1.67 | 3.27 | 0.44 | 334 | 10.0 | 1310 | 660 | 17.99 | 6.04 | 0.058 |
| Pp3 SP2 top | 4.32 | 0.115 | 1.71 | 1.60 | 0.79 | 284 | 20.9 | 1220 | 586 | 21.70 | 6.50 | 0.047 |
| Pp3 SP2 sub | 4.02 | 0.096 | 1.47 | 2.61 | 0.49 | 190 | 22.4 | 982 | 529 | 20.39 | 6.24 | 0.042 |
| Pp3 SP3 top | 4.31 | 0.155 | 2.25 | 5.40 | 1.09 | 405 | 7.8 | 1320 | 638 | 20.54 | 6.21 | 0.065 |
| Pp3 SP3 sub | 3.96 | 0.121 | 0.74 | 4.94 | 0.26 | 189 | 12.3 | 1320 | 747 | 26.61 | 6.06 | 0.049 |
Pp1 SP1 top – Population 1, sample 1 topsoil; Pp1 SP1 sub – Population 1, sample 1 subsoil; Pp1 SP2 top – Population 1, sample 2 topsoil; Pp1 SP2 sub – Population 1, sample 2 subsoil; Pp1 SP3 top – Population 1, sample 3 topsoil; Pp1 SP3 sub – Population 1, sample 3 subsoil; Pp2 SP1 top – Population 2, sample 1 topsoil; Pp2 SP1 sub – Population 2, sample 1 subsoil; Pp2 SP2 top – Population 2, sample 2 topsoil; Pp2 SP2 sub – Population 2, sample 2 subsoil; Pp2 SP3 top – Population 2, sample 3 topsoil; Pp2 SP3 sub – Population 2, sample 3 subsoil; Pp3 SP1 top – Population 3, sample 1 topsoil; Pp3 SP1 sub – Population 3, sample 1 subsoil; Pp3 SP2 top – Population 3, sample 2 topsoil; Pp3 SP2 sub – Population 3, sample 2 subsoil; Pp3 SP3 top – Population 3, sample 3 topsoil; Pp3 SP3 sub – Population 3, sample 3 subsoil.
Table 3.
The functional diversity and enzyme activities of different soil samples collected from Artemisia afra populations.
Table 3.
The functional diversity and enzyme activities of different soil samples collected from Artemisia afra populations.
| Sample ID | Carbon Source Utilization (Functional diversity) | Enzyme Activities | ||||
|---|---|---|---|---|---|---|
| zAWCD | Shannon Weaver Index (H’) | Richness (S) | Evenness | β-glucosidase | Phosphatase | |
| Pp1 SP1 top | 1.547abc | 3.36a | 29.33ab | 0.994abc | 19.51 | 92.13 |
| Pp1 SP1 sub | 1.316cde | 3.33abc | 29.66ab | 0.982c | 16.79 | 99.56 |
| Pp1 SP2 top | 1.614ab | 3.38a | 30.66a | 0.988bc | 36.58 | 93.46 |
| Pp1 SP2 sub | 1.753a | 3.36a | 30.33a | 0.995abc | 30.35 | 99.86 |
| Pp1 SP3 top | 1.453bcd | 3.34abc | 29.00ab | 0.993abc | 25.76 | 93.15 |
| Pp1 SP3 sub | 1.279de | 3.35ab | 29.66ab | 0.991abc | 14.59 | 91.11 |
| Pp2 SP1 top | 1.296de | 3.35ab | 29.66ab | 0.991abc | 19.99 | 106.20 |
| Pp2 SP1 sub | 1.385b-e | 3.34abc | 29.00ab | 0.991abc | 13.44 | 102.81 |
| Pp2 SP2 top | 0.941g | 3.26cd | 27.33abc | 0.988bc | 17.05 | 98.19 |
| Pp2 SP2 sub | 1.355cde | 3.34abc | 29.33ab | 0.988bc | 25.31 | 96.94 |
| Pp2 SP3 top | 1.444bcd | 3.33abc | 29.00ab | 0.984abc | 25.54 | 99.73 |
| Pp2 SP3 sub | 1.284de | 3.29bcd | 28.00ab | 0.988abc | 11.97 | 87.55 |
| Pp3 SP1 top | 0.841g | 3.25d | 26.00bc | 0.996abc | 21.70 | 101.82 |
| Pp3 SP1 sub | 1.425bcd | 3.28bcd | 27.33abc | 0.992abc | 18.33 | 92.16 |
| Pp3 SP2 top | 0.995fg | 3.05e | 23.66c | 0.989abc | 18.53 | 90.31 |
| Pp3 SP2 sub | 0.847g | 3.02e | 19.33d | 1.004ab | 14.84 | 88.24 |
| Pp3 SP3 top | 1.359cde | 3.33abc | 29.00ab | 0.988abc | 15.28 | 90.04 |
| Pp3 SP3 sub | 1.186ef | 3.28bcd | 28.33ab | 0.982c | 17.36 | 95.81 |
| LSD0.05 | 0.236 | 0.081 | 3.69 | 0.019 | ||
Pp1 SP1 top – Population 1, sample 1 topsoil; Pp1 SP1 sub – Population 1, sample 1 subsoil; Pp1 SP2 top – Population 1, sample 2 topsoil; Pp1 SP2 sub – Population 1, sample 2 subsoil; Pp1 SP3 top – Population 1, sample 3 topsoil; Pp1 SP3 sub – Population 1, sample 3 subsoil; Pp2 SP1 top – Population 2, sample 1 topsoil; Pp2 SP1 sub – Population 2, sample 1 subsoil; Pp2 SP2 top – Population 2, sample 2 topsoil; Pp2 SP2 sub – Population 2, sample 2 subsoil; Pp2 SP3 top – Population 2, sample 3 topsoil; Pp2 SP3 sub – Population 2, sample 3 subsoil; Pp3 SP1 top – Population 3, sample 1 topsoil; Pp3 SP1 sub – Population 3, sample 1 subsoil; Pp3 SP2 top – Population 3, sample 2 topsoil; Pp3 SP2 sub – Population 3, sample 2 subsoil; Pp3 SP3 top – Population 3, sample 3 topsoil; Pp3 SP3 sub – Population 3, sample 3 subsoil. Values within a column with different letters indicate significant difference (p < 0.05). zAWCD – average well colour development.
Table 4.
The specific carbon source utilization and the total microbial load of different soil samples collected from different Artemisia afra populations.
Table 4.
The specific carbon source utilization and the total microbial load of different soil samples collected from different Artemisia afra populations.
| Sample ID | Amino acids | Carbohydrates | Carboxylic acids | Polymers | Amines | Avg. No. of colonies | Colony forming units (CFU g-1) |
|---|---|---|---|---|---|---|---|
| Pp1 SP1 top | 1.628abc | 1.579a-d | 1.381abc | 1.689ab | 1.609ab | 17(10)6 | 1.7 x 10⁸ |
| Pp1 SP1 sub | 1.502bcd | 1.299cde | 1.189c-f | 1.313b-e | 1.417a-c | 5(10)6 | 5.0 x 10⁸ |
| Pp1 SP2 top | 1.778ab | 1.626ab | 1.521ab | 1.547a-d | 1.619a | 95(10)6 | 9.5 x 10⁶ |
| Pp1 SP2 sub | 1.912a | 1.766a | 1.626a | 1.858a | 1.586ab | 19(10)6 | 1.9 x 10⁸ |
| Pp1 SP3 top | 1.576a-d | 1.434def | 1.338a-d | 1.604ab | 1.402a-c | 13(10)6 | 1.3 x 10⁸ |
| Pp1 SP3 sub | 1.445bcd | 1.249ef | 1.219b-e | 1.230b-e | 1.276a-c | 27(10)6 | 2.7 x 10⁸ |
| Pp2 SP1 top | 1.385cd | 1.265def | 1.171c-f | 1.527a-d | 1.294a-c | 55(10)4 | 5.5 x 10⁶ |
| Pp2 SP1 sub | 1.647abc | 1.347b-f | 1.176c-f | 1.566a-c | 1.372a-c | 300(10)7 | 3 x 10¹⁰ |
| Pp2 SP2 top | 0.957ef | 0.888gh | 0.906fg | 1.211b-e | 0.768fg | 13(10)6 | 1.3 x 10⁸ |
| Pp2 SP2 sub | 1.542bcd | 1.461a-e | 1.063d-f | 1.526a-d | 1.240a-e | 39(10)7 | 3.9 x 10⁹ |
| Pp2 SP3 top | 1.487bcd | 1.580a-d | 1.134c-f | 1.835a | 1.259a-d | 13(10)6 | 1.3 x 10⁸ |
| Pp2 SP3 sub | 1.439bcd | 1.336b-f | 1.079c-f | 1.503a-d | 1.045c-f | 12(10)6 | 1.2 x 10⁸ |
| Pp3 SP1 top | 0.981ef | 0.769hi | 0.721g | 1.093c-e | 0.805efg | 45(10)4 | 4.5 x 10⁶ |
| Pp3 SP1 sub | 1.708abc | 1.616abc | 1.159c-f | 1.508de | 1.542ab | 300(10)7 | 3.0 x 10¹⁰ |
| Pp3 SP2 top | 1.273de | 0.740hi | 0.975e-g | 0.859ef | 0.823d-g | 33(10)4 | 3.3 x 10⁶ |
| Pp3 SP2 sub | 1.032e | 0.698hi | 0.948e-g | 0.840ef | 1.542ab | 24(10)4 | 2.4 x 10⁶ |
| Pp3 SP3 top | 1.481bc | 1.444a-e | 1.161c-f | 1.498a-d | 1.191a-f | 14(10)7 | 1.4 x 10⁹ |
| Pp3 SP3 sub | 1.560bcd | 1.110fg | 1.128c-f | 0.961e | 1.161b-f | 10(10)4 | 1.0 x 10⁶ |
| LSD0.05 | 0.339 | 0.342 | 0.308 | 0.500 | 0.451 |
Pp1 SP1 top – Population 1, sample 1 topsoil; Pp1 SP1 sub – Population 1, sample 1 subsoil; Pp1 SP2 top – Population 1, sample 2 topsoil; Pp1 SP2 sub – Population 1, sample 2 subsoil; Pp1 SP3 top – Population 1, sample 3 topsoil; Pp1 SP3 sub – Population 1, sample 3 subsoil; Pp2 SP1 top – Population 2, sample 1 topsoil; Pp2 SP1 sub – Population 2, sample 1 subsoil; Pp2 SP2 top – Population 2, sample 2 topsoil; Pp2 SP2 sub – Population 2, sample 2 subsoil; Pp2 SP3 top – Population 2, sample 3 topsoil; Pp2 SP3 sub – Population 2, sample 3 subsoil; Pp3 SP1 top – Population 3, sample 1 topsoil; Pp3 SP1 sub – Population 3, sample 1 subsoil; Pp3 SP2 top – Population 3, sample 2 topsoil; Pp3 SP2 sub – Population 3, sample 2 subsoil; Pp3 SP3 top – Population 3, sample 3 topsoil; Pp3 SP3 sub – Population 3, sample 3 subsoil. Values within a column with different letters indicate significant difference (p < 0.05).
Table 5.
Relative percentage contribution of each environmental variable to the MaxEnt model predictions of environmental suitability for the growth of Artemisia afra.
Table 5.
Relative percentage contribution of each environmental variable to the MaxEnt model predictions of environmental suitability for the growth of Artemisia afra.
| Environmental variable | Percentage contribution | Permutation importance |
|---|---|---|
| Long term average annual rainfall | 62.0% | 41.0% |
| Highest long-term average monthly maximum temperature | 21.5% | 26.1% |
| Average soil depth | 7.5% | 11.1% |
| Lowest long-term average monthly maximum temperature | 3.6% | 5.3% |
| Long-term average monthly minimum relative humidity | 2.0% | 4.2% |
| Lowest long-term average monthly minimum temperature | 1.1% | 1.9% |
| Highest long-term average monthly minimum temperature | 1.0% | 6.7% |
| Average soil clay% | 1.0% | 2.8% |
| Long-term average monthly maximum relative humidity | 0.4% | 0.7% |
Disclaimer/Publisher’s Note: The statements, opinions and data contained in all publications are solely those of the individual author(s) and contributor(s) and not of MDPI and/or the editor(s). MDPI and/or the editor(s) disclaim responsibility for any injury to people or property resulting from any ideas, methods, instructions or products referred to in the content. |
© 2024 by the authors. Licensee MDPI, Basel, Switzerland. This article is an open access article distributed under the terms and conditions of the Creative Commons Attribution (CC BY) license (https://creativecommons.org/licenses/by/4.0/).
Copyright: This open access article is published under a Creative Commons CC BY 4.0 license, which permit the free download, distribution, and reuse, provided that the author and preprint are cited in any reuse.


