
Submitted:
12 October 2024
Posted:
14 October 2024
You are already at the latest version
Abstract
Agroclimatic indicators help convey information about climate variability and change in terms that are meaningful to the agricultural sector. This study evaluated climate projections for Angola, particularly for provinces with higher agrarian potential. To this end, a set of 15 predefined agroclimatic indicators in 2041–2070 and 2071–2099, under the anthropogenic forcing scenarios RCP4 and RCP8, were compared with the historical period 1981–2010 as a baseline. Data were extracted within the geographic window of longitudes 10–24°E and latitudes 4–18°S and from five climate model chain experiments, namely MIROC-ESM-CHEM, HadGEM2-ES, IPSL-CM5A-LR, GFDL-ESM2M and NorESM1-M. The averages of the set of agroclimatic indicators, as well as their differences between historical and future periods, are discussed concerning the likely implications for agriculture in Angola. The results show significant increases in average daily maximum (2–3°C) and minimum (2–3°C) temperatures in Angola. For the future, a generally significant reduction in precipitation (and its associated indicators) is expected in all areas of Angola, with the southwest region (Namibe and Huíla) recording the most pronounced decrease, up to 300 mm, while the maximum number of consecutive dry days will increase across the country and especially in the northeast of the country. A widespread increase in temperatures is expected, which could lead to hot and dry conditions in Angola that could lead to more frequent, intense and prolonged extreme events, such as tropical nights, maximum number of consecutive summer days, warm and wet days and Warm spell duration index periods. These changes can seriously affect agriculture, water resources and ecosystems in Angola, thus requiring adaptation strategies to reduce risks and adverse effects, while ensuring the sustainability of the country's natural resources and guaranteeing its food security.
Keywords:
climate projections
; agroclimatic indicators
; temperature
; precipitation
; weather and climate extremes
; Angola
1. Introduction
Climate change is leading to significant damage and irreversible losses in a wide range of socioeconomic systems and ecosystems. The increase in extreme weather and climate events has been exposing millions of people to food and water insecurity, with the most significant adverse impacts observed over Africa, Asia, Central and South America, the Least Developed Country Islands and the Arctic, and globally for Indigenous Peoples, small-scale food producers, and low-income households [1].
Climate change is expected to significantly impact the global environment, economy, and society, especially in African countries, due to the dependence of many vital sectors on weather and climate variability (e.g., agriculture) and their low adaptation capacity [2]. Increasing trends of hot extremes and extreme precipitation events have been found in many regions of Southern Africa (e.g., South Africa, Namibia, Angola, Mozambique, Zimbabwe, Zambia), accompanied by a general decrease in annual precipitation. Furthermore, there has been a notable increase in the frequency of droughts in many areas worldwide, while this trend is expected to persist in the future, even if global warming is stabilised at 2°C [3]. In Southern Africa, the demand for food continues to increase due to rapid population growth and urbanisation. Southern Africa's population is estimated at 224 million and is projected to rise to 241 million by 2050. As with the rest of the developing world, this region must double its food production to meet the growing demand, both in quality and quantity [4], which is a major challenge for ensuring food security and safety.
Angola is amongst the most vulnerable countries to climate change and, more specifically, its southern region has suffered recurrent periods of pronounced droughts and has experienced a severe and very prolonged drought in the last decade, with conditions described as the worst in 40 years [3,5]. Therefore, climate change impacts are not just a future threat but are already ongoing in this country. A state-of-the-art climate impact assessment produced within the framework of the Climate and Development Report of the Country of Angola (CCDR) corroborates that warming has augmented significantly in recent years. The average annual temperature has increased by 1.4°C since 1951 and is expected to continue rising [5]. An increase in maximum and minimum temperatures, accompanied by significant modifications in the regional precipitation patterns is expected [5].
Concerning the agricultural sector, the ramifications of climate change on crops are multiple, encompassing alterations in temperature and precipitation during growing seasons, phenology, thermal forcing of plant physiological processes, soil-plant interactions, pest and disease dynamics, variations in atmospheric carbon dioxide levels and plant gas exchanges, and modifications in yields and nutritional quality of crops, among others [6,7,8]. Southern Africa, including Angola, where almost 95% of agriculture is rainfed [9], where irrigation is frequently not feasible because of low water availability and/or economic costs, is characterized by agricultural sectors that are becoming increasingly vulnerable to climate change [4,6,10,11,12] due to its low adaptive capacity to warmer and drier climates [13]. Southern Africa is indeed expected to be the region that will suffer the most, as around 60% of its population lives in marginalized and socioeconomically fragile rural areas [14,15].
Overall, Angola's agriculture is largely exposed and very vulnerable to climate change. A significant reduction in total annual precipitation, number of rainy days, and days of intense rainfall is expected all across the country [5]. This suggests lower water availability, especially in the southern region, with an increase in maximum, minimum, and average daily temperatures, projected to increase by 2–3°C [5]. Further, increases in the frequency of occurrence of hot humid days and the duration of heat waves are projected, indicating that Angola will face more extreme weather events. It is widely accepted that increased occurrence of extremes, including periods of severe droughts, heavy precipitation, or heat/water stress, are challenging for agricultural production [16]. These extremes will thereby have detrimental impacts on agricultural productivity, threatening the already fragile agricultural sector and regional food security. Temperature and precipitation are commonly considered the two most important indicators of climate change also for agriculture. Nevertheless, additional atmospheric variables, which are not always available or reliable, such as humidity, wind speed, cloudiness, solar radiation flux, and evaporation, can also be useful in assessing climate change impacts [17].
Some models show that agricultural productivity in Angola will be up to 7% lower by 2050 than in a scenario without climate damage. Many Angolans vulnerable to falling into poverty live in areas of high climate change exposure, making it more difficult for the country to achieve its poverty reduction goals [5].
Agroclimatic indicators, in particular, serve as valuable tools in assessing the impacts of climate change on crops. These indicators allow a better assessment of climate change, variability, extremes, and their impacts on crops, allowing us to anticipate and respond to changes in climate conditions, such as heat stress, drought, and excessive humidity [18,19,20]. Hence, in this study, a selection of agroclimatic indicators under climate change scenarios is analysed to provide key information for the adaptation of agricultural areas in Angola. This is essential to anticipate and minimize the risk of climate change through the implementation of timely and suitable adaptation measures, namely adjusting agricultural cultivation techniques to future climatic conditions [21].
2. Materials and Methods
2.1 Datasets
This study adopted a comprehensive approach to analyse agroclimatic indicators in Angola, focusing on their recent past and future spatial patterns and values, to infer the likely impacts on the country’s agricultural sector. The selected 15 agroclimatic indicators (Table 1) were retrieved from the agroclimatic dataset of the Copernicus Climate Change Service (C3S) platform, with global coverage at a horizontal resolution of 0.5° latitude × 0.5° longitude (~55 km grid spacing), spanning from 1951 to 2099. Depending on the indicator, they are available at various time scales (daily, 10-day, season, and annual) [22]. Of the 15 agroclimatic indicators, the maximum number of consecutive dry days, the maximum number of consecutive summer days, the maximum number of consecutive wet days, warm and wet days, and the warm spell duration index are available at the season resolution, whereas the remaining indicators are available at the 10-day temporal resolution. Input data was provided through the Intersectoral Impact Model Intercomparison Project (ISIMIP) Fast Track product, which contains bias-corrected daily climate data from CMIP5 General Circulation Models, covering the full period of 1951–2099. Agroclimatic indicators were generated using the WFDEI methodology (Watch Forcing Data applied to ERA-Interim) for the climatological period 1981-2010 [22].
Historical data from the ERA-Interim Reanalysis (ECMWF) are considered as a baseline, whilst climate projections are based on the Representative Concentration Pathway (RCP) 4.5 and 8.5 anthropogenic emission scenarios. Future projections were analysed for two periods, 2041–2070 (medium-range future) and 2071–2099 (long-range future), under RCP4.5 and RCP8.5, and thus compared with the ERA-Interim Reanalysis historical period (1981–2010). To ensure the robustness of the predictions, five global climate model chain experiments were used: MIROC-ESM-CHEM (JAMSTEC, Japan), IPSL-CM5A-LR (IPSL, France), NorESM1-M (NCC, Norway), HadGEM2-ES (UK Met Office, United Kingdom), and GFDL-ESM2M (NOAA, USA). Ensemble means were then computed to resolve inter-model variability, reducing uncertainty and increasing the reliability of climate predictions. For the different agroclimatic indicators, absolute/relative differences between future and historical periods were calculated, allowing the identification of robust changes. The results were analysed by regions (provinces) of Angola, highlighting the heterogeneity of regional climate change signals and their likely impacts on agriculture.
2.2. Study Area Characterization
Angola is a large country, with a total area of 1,246,700 km2. Located in Southern Africa, the Republic of Angola is bordered to the north and northeast by the Democratic Republic of Congo, to the east by Zambia, to the south by Namibia and to the west by the South Atlantic Ocean (Figure 1a). Furthermore, it covers the enclave of Cabinda, which borders the Republic of Congo to the north [3,23]. Angola is divided into administrative regions (so-called provinces), as shown in Figure 1b. In the southwestern provinces of Huila, Huambo, Benguela, Cuanza Sul and Bié, agriculture is a prominent activity, illustrated by the cropland cover areas in Figure 1c. Vast areas of the country are covered by savanna, shrubland, grassland, tropical forest or bare land. Most of the cropland regions are located on Angola’s central plateau, with elevations above 1000 m (Figure 1d), thus having high-elevation cooler climates than in the rest of the country.
Overall, Angola’s climates are characterized by hot humid summers and mild dry winters. The cold Benguela eastern boundary current (EBC), the high-elevation central plateau, and the location and strength of the Intertropical Convergence Zone (ITCZ) are key factors that determine regional climates. Together, these characteristics generate a strong north-south climate gradient. Angola is dominated by three climatic zones based on the Köppen classification: a hot and humid tropical zone in the north, a subtropical climate in the central plateau, and a desert climate in the Southwest [24]. The three types of climate mentioned above have a profound impact on the local ecosystems and socioeconomic activities.
The climate of the hot and humid tropical zone in the North is typical of regions close to the equator, where temperature and humidity are high throughout the year. Precipitation is frequent and abundant, generally concentrated in a well-defined hot rainy season [25]. The more moderate subtropical/tropical climates in the central plateau are found in higher-elevation areas. They have milder temperatures than the low tropical zones, with a clear distinction between the dry and rainy seasons, but the temperature variation between the seasons is moderate [26]. The sub-arid/arid climates in the southwest feature extremely high diurnal temperatures and relatively low nocturnal temperatures, with very low annual precipitation amounts (almost zero precipitation along the southernmost coast). In this area, air humidity is typically very low off the coast, being vegetation sparse and adapted to arid/desertic conditions [27]. As such, the northeast of Angola is the wettest region, while sub-arid/arid conditions prevail in the south and west [28,29]. Precipitation varies between less than 20 mm annually in the very southwest to more than 1600 mm in the northwest and northeast [2,28]. The winter season (June, July, and August) is commonly the driest throughout the country, with generally scarce precipitation. Although the rainy season occurs between October and May, the summer months (December, January and February) are responsible for the bulk of annual precipitation [29].
2.3. Impact of Agroclimatic Indicators on Crop Yield Cultures
The main crops in Angola, such as corn (Zea mays), sorghum (Sorghum bicolor), millet (Pennisetum glaucum), beans (Phaseolus vulgaris), cassava (Manihot esculenta), and potatoes (Solanum tuberosum), play a fundamental role in the country's food security and rural development [30]. Knowledge of the climatic requirements for each crop is essential for planning production sustainably, ensuring agricultural resilience in the face of climate variations [31].
Temperature and precipitation are considered the two most important indicators of climate change for agriculture [12,17,32,33,34]. These two climatic variables have a significant effect on crops and their yields. Rainfall affects e.g. agricultural production in terms of photosynthesis and leaf area, while temperature affects e.g. the length of the growing season through thermal forcing [5].
The increase in temperature directly accelerates plant/crop development, and its phenology, whereas the decline in seasonal precipitation contributes to increased evapotranspiration, which together may trigger crop water stress [9,35]. In areas where temperatures are already close to crop physiological thresholds, such as tropical dry regions, higher temperatures can be particularly detrimental, exacerbating crop heat stress and excessive water loss through evapotranspiration [36]. Air temperature and soil moisture (largely dependent on precipitation) determine the length of the growing season and control crop development and water needs. Higher temperatures generally shorten frost periods, promoting cultivation in cold-climate marginal farmland. However, higher temperatures shorten the crop cycle and reduce crop yields in arid and semi-arid areas, owing to increased crop water stress [37]. The warming foreseen under climate change may lead to several negative effects on plant growth and phenology [20]. Precipitation is the primary source of all freshwater resources and controls the soil moisture level, which is a key factor for crop growth and development. Furthermore, precipitation is the main contributor to yield variability, as it is much more irregular than crop potential evapotranspiration, which determines crop water needs [37]. The effects of precipitation on crop productivity are defined by the occurrence of water deficits in the soil profile that do not meet evaporative demand. Short-term water deficits and drought reduce the growth and production of e.g. cereals and are often the main cause of crop losses [20].
The soil humidity can also affect crop growth in two ways. First, it can directly affect it by changing plant water content. Second, it can indirectly affect leaf growth, photosynthesis, pollination, and disease probability [17]. Humidity can also affect photosynthesis, altering evapotranspiration. When air humidity levels are excessively low, high transpiration rates may lead to severe water stress, particularly under high temperatures.
3. Results
3.1. Agroclimatic Projections for Angola
3.1.1. Precipitation-Related Indices
A set of 15 agroclimatic indicators were used to assess the effects of climate change in Angola. These indicators are mainly selected due to their close connection with factors that affect agricultural productivity. These factors can directly affect climate suitability for growing a given crop, as well as cultural practices (e.g., irrigation).
The following precipitation-related agroclimatic indicators are analysed herein: precipitation sum (RR), number of wet days (RR1), and simple daily intensity index (SDII). Figure 2 presents maps for historical and future climate data, based on the RCP8.5 scenario (Figure S1 in Supplementary Material is similar to Figure 2, but for RCP4.5). The data is split into the following periods: 1981–2010 (historical), 2041–2070 (mid-range future), and the difference between the two periods (Figure S2 shows the corresponding results for the long-range period, 2071–2100). In general, these indicators have a sharp southwest-northeast gradient and are characterised by strong seasonality, thus reflecting the aforementioned spatial pattern and temporal regime of precipitation in Angola [3].
For RR (Figure 2a-c) and during the historical period, Angola's north, northeast, and centre experienced high amounts of precipitation. In the north, the province of Uíge stands out; in the northeast, the province of Lunda Norte and a part of Lunda Sul, with precipitation around 1400 mm. In central Angola, Huambo, Bié, and a part of southern Cuanza, we have rainfall between 1000-1400mm. In contrast, the south of Angola had lower precipitation amounts, mainly the province of Namibe, with precipitation below 200mm; for Cunene, Cuando Cubango, and Huíla, precipitation varies from 400 mm to 600 mm. The projections indicate that, in most parts of the country, there are no significant changes in RR. The exception is in some regions of the coastal provinces (Benguela and Cuanza Sul) and the province of Cuanza Norte, and this reduction will be most significant in Cuanza Norte, Cuanza Sul, southern parts of Benguela, northern parts of Namibe, and Huíla ranging from 200 to 400 mm. On the other hand, projections show a slight increase of 100 mm in precipitation sum in some parts of the north of the country, particularly in Malanje and Lunda Norte provinces.
For the historical period, northern and northeastern Angola showed a high (RR1), with more than 210 per year (Figure 2d-f). In contrast, southern Angola recorded fewer RR1, with less than 120 per year. In this region, the province of Namibe stands out with less than 30 wet days, as it is an arid/desertic climate province. Projections also indicate a reduction in the RR1 in several regions of the country, specifically in the north, coast and Northeast regions, reaching values of up to 40 days. In southern Angola, the provinces of Namibe and Huíla are expected to record a slight increase in the RR1, ranging from 10 to 20 days.
During the historical period, in the south of the country (Huíla, and Namibe) revealed a high SDII, varying from 8 to 12 mm/day. On the other hand, some provinces, both inland (Cunene and Cuando Cubango) and coastal (Bengo and Luanda), experience low values of this index (4-5 mm). Projections suggest small changes in this agroclimatic indicator in several parts of the country, but a slight increase of 2 mm/day will be expected in the northern and northeastern regions. In comparison, there will be a significant reduction in the SDII of 2 mm/day in the south, specifically in Namibe, Huíla, and part of Benguela in the south and Cuanza Norte in the north.
Figure 3 presents maps with historical and future climate data, based on the RCP8.5 scenario, of the following precipitation-related agroclimatic indicators: heavy precipitation days (R10mm); very heavy precipitation days (R20mm); maximum number of consecutive wet days (CWD), and maximum number of consecutive dry days (CDD).
During the historical period, the lowest R10mm was observed in the southern and coastal provinces of Angola reaching values below 5 days in some regions. On the other hand, in the future, the R10mm should be reduced by up to 20 days in a large part of the country, especially in the south, centre and northwest of Angola. On the other hand, a significant increase of this indicator of about 15 days in the northeast of the country, specifically in the province of Lunda Norte, and a slight increase of 10 days in some parts of the provinces of Uíge and Malanje.
Most of the country recorded very low values of R20mm, which may not exceed 1 day in some coastal areas of the provinces of Namibe, Benguela, and Luanda. In contrast, the mountainous region of Huila and Huambo, as well as the southern part of Benguela, showed significantly higher values, around 12 days (Figure 3d-f). Projections point to an increase of 2 to 4 days in days of R20mm in the north and northeast regions, that is, in some parts of the provinces of Bengo, Uíge, Lunda Norte, and Lunda Sul. On the other hand, the province of Huíla and parts of Benguela and Namibe will have a reduction of 6 to 8 days of R20mm.
Regarding the CWD and for both the historical period and the future, there is a strong southwest-northeast gradient (Figure 3g-h) that divides the country into almost two distinct parts. While the southwestern part has the lowest CWD values, the northeastern part has the highest CWD values. However, there is a slight difference between these two periods (Figure 3i), especially in the centre and extreme northwest of the country, where there is an increase in the future period of CWD values greater than 15 days in the provinces of Cabinda and Zaire, in the north, and Huambo and Bié, in the centre.
Both for the historical period and for the future, there is a notable similarity between the CDD in the southern and central provinces of the country, where this agroclimatic indicator reaches a value greater than 92 days. In some northern and northeastern provinces, the CDD ranges from 56 to 79. Projections indicate an increase in CDD in the northern and northeastern regions and a significant increase in the Cabinda and Cuanza Norte province of up to 30 days. There is also an increase in the provinces of Cabinda, Uíge and some parts of the provinces of Zaire, Lunda Norte and Malanje, while the other provinces maintain the pattern (Figure 3j-l).
3.1.2. Temperature-Related Indices
Temperature-related agroclimatic indicators are now analyzed, namely, the mean of daily mean temperature (TG), mean of daily maximum temperature (TX), mean of daily minimum temperature (TN), and biologically effective degree days (BEDD). Figure 4 presents maps with historical and future climate data in different regions, based on the RCP 8.5 scenario. The data is divided into three periods: 1981–2010 (historical), 2041–2070 (future), and the difference between the two periods.
In the historical period, the TG values were observed in the southern and central regions, ranging from 21 to 22°C. In contrast, the northern and coastal regions recorded higher TG values, ranging from 24°C to 25°C (Figure 4a-c). Projections show a slight increase in this agroclimatic indicator in all regions of the country, a more pronounced increase of 2.1 to 2.4°C in the coastal, central and northern provinces of Angola and may reach a value of greater than 2.8°C in the extreme north of Uíge and Zaire. It is worth noting that, compared to the other provinces, the province of Cuando Cubango will register the smallest increase in this indicator of about 1.6°C.
During the historical period, the provinces of Huambo, Bié, Namibe, parts of Cuanza Sul and Huíla presented the lowest TX, ranging between 22–26°C. The other provinces registered slightly higher values, ranging between 27–32°C, especially in Cunene, Cuando Cubango, and Lunda Norte (Figure 4d-f). An increase in values of TX is predicted in all regions. In fact, a significant increase of 3.2 to 3.8 °C will be observed in the central (Bié and Huambo) and southern (Huíla, Cunene, and Cuando Cubango) regions and in the province of Moxico in eastern Angola. The northern region has already had higher maximum temperatures in the historical period, and a slight increase is expected in the future in coastal areas, ranging from 2.2 to 2.6°C.
Concerning the TN and during the historical period (Figure 4g-i), the lowest values, ranging between 13 and 15°C were observed in the southern and central regions, while the highest values of TN, varying between 19 and 22°C were located in the northern coastal regions. Projections indicate an increase of the values of this agroclimatic indictor in all inland regions of the country, more significant (2.9 to 3.2°C) in the central (Bié and Huambo) and southern (Huíla, Cunene, and Cuando Cubango) regions and the Moxico province in eastern Angola. On the other hand, the coastal provinces will experience a slightly increase in TN of about 2.2°C.
Similarly, to TN, the BEDD registered, during the historical period, the lowest values in the southwestern and central regions with values ranging between 6500 and 7000°C. For the same period, the coastal provinces in the north of the country observed the highest values of this agroclimatic indicator, ranging from 8500 to 9000°C (Figure 4j-l). The projections indicate: i) greater increases in this indicator in the northern provinces (Uíge, Zaire, and Cuanza Norte) and central provinces (Cuanza Sul, Malange, and Huambo); ii) moderate increases in the central inland provinces (Lunda Sul and Moxico); and iii) less significant increases in the southern provinces (Cunene and Cuando Cubango.
Figure 5 shows the agroclimatic indicators: Tropical nights (TR); maximum number of consecutive summer days (CSU); warm and wet days (WW), and warm spell duration index (WSDI).
During the historical period, the agroclimatic parameter related to TR indicate values less than or equal to 10 days in practically the entire country. The exception is observed in the extreme northwest and central coastal zones (Cabinda, Zaire, Luanda, Bengo, Kwanza Sul, and Benguela), where the values vary between 200 and 300 days. (Figure 5a-c). Projections indicate an increase in this agroclimatic indicator in almost all regions of the country, less pronounced in the Huila, Huambo Cuanza Sul and Bié provinces reaching an increase of about 30 days. On the other hand, the northern provinces will experience higher values of TR with an increase of about 180 days.
In the historical period and throughout Angola, the CSU presented high values ranging between 80 and more than 90 days. The exception was observed in the central and southwest regions, in Huambo and part of the provinces of Cuanza Sul, Huíla, and Namibe, which recorded the lowest values between 10-40 days. The small values of CSU were also observed in Uíge and Cuanza in the north of the country reaching 45 days. (Figure 5d-f). Projections indicate that there will be a widespread increase in this agroclimatic parameter, and this increase will be more pronounced in areas where the historical CSU values were low.
In the historical period and concerning the WW indicator , the southern, the central and some north-western (Luanda, Bengo and Cuanza Norte) provinces experienced fewer hot and humid days (<4 days). The remaining regions registered a slightly higher number of about 9 days (Figure 5g-i). Projections indicate a very high increase in this indicator in all provinces, not significant in the south, about 5 to 15 days, and highly pronounced in the central and northern regions, reaching impressive values ranging from 40 to 45 days.
The WSDI indicator is more significant in the southern and central inland provinces, with maximum values greater than 5 days in some regions. As for the WW indicator, projections of WSDI show a very large increase in the country, more pronounced in the north and coast, with some regions recording impressive values up to 64 days.
3.2. Summary of the Main Climate Change Impacts
To summarize the aforementioned results, Table 2 outlines the main climate impacts for each region separately, highlighting the most affected provinces and the relevant agroclimatic indicators.
The selection of the provinces mentioned in Table 2 was based on various climatic and agronomic factors, specific to each region of Angola considering the projected impacts of climate change.
It is worth noting that projections indicate a generalized increase in the temperature and its associated agroclimatic indicators throughout the country with emphasis on WW and WSDI. The significant increase in the latter indicator could be harmful to crops because may potentially affect yields during reproductive growth, by reducing the amount of time in which the male (tassel) and female (silk flower) flowering periods, mainly corn [38]. On the other hand, it is important to note that projections indicate a large increase in the CSU in the central and south-western provinces, which extends to Cuanza Norte and Uíge, combined with a slight increase in TR.
Regarding the indicators associated with precipitation, and analyzing the future period, there is a certain geographical continuity in these parameters. On the one hand, there will be a generalized reduction in these indicators in the southwest, southeast, central, coastal and Cuanza Norte regions and, on the other hand, there will be a noticeable increase in these indicators in the remaining north and northeastern regions. However, there are certain particularities to some of these indicators, especially: i) a generalized decrease/increase in the RR1/SDII indicator in all the central regions and the north of the country, and an increase/decrease in this indicator in the southwest region; ii) a large increase in the CWD indicator in the central region (Huambo and Bié) and the far north of the country in the northwest region (Cabinda and Zaire).
According to future projections, the provinces in the southwest of the country are expected to suffer significantly from the impacts of climate change, particularly a huge reduction in precipitation and an increase in temperature. These adverse weather conditions are particularly worrying for agriculture, which plays an important role in the local economy. A particular highlight is the province of Huíla, known for its agricultural capacity, making it especially vulnerable to reduced water availability.
The central region, the largest agricultural producer in Angola, plays a crucial role in the country's food security. However, on the one hand, projections indicate a significant increase in CWD which will highly and positively impact agriculture, but on the other hand, an increase in the temperature and all associated indicators could alter negatively agricultural regimes and crop cycles.
The northeast and northwestern regions, stand out as an important agricultural area of the country. Although the projections in these regions indicate a considerable increase in precipitation and SDII, they also indicate a significant reduction in RR1 and an increase in CDD.
The coastal provinces were included in the table due to their importance in the climatic context. As shown in Figure 1-c), Benguela, Cuanza Sul, and Bengo are provinces with some level of agricultural production. The climate in coastal regions directly influences the country's overall climate, impacting precipitation, temperature, and wind patterns [39]. Projections indicate a widespread reduction in precipitation and RR1, with the rare exception of a part of Bengo, which will experience a slight increase in R20mm. These areas are also vulnerable to sea level rise, coastal erosion, and other climate-related impacts [40].
Finally, the region formed by the province of Cuanza Norte is a particular case compared to its neighbouring provinces, with distinct agroclimatic indicators. In fact, Cuanza Norte will experience a drastic fall in all parameters associated with the precipitation, especially RR, RR1 and R10mm and, in contrast, a huge increase in the CDD indicator.
3.3. Potential Impacts of Climate Change on Crops in Angola
The rate of plant growth and physiological development largely depends on the environmental temperature around the plant, while each species has a specific thermal suitability range (thermal niche) that can be roughly represented by lower (restricted) and upper limit (anapta) temperatures [41]. Similar considerations can be made for suitable precipitation ranges, which are particularly relevant for rainfed crops, as for irrigated crops precipitation deficits can be largely offset.
Therefore, combining the data in Table 3, which presents the temperature and precipitation ranges for the different main crops in Angola, with the results listed in Table 2 on the agroclimatic indicators in the RCP8.5 scenario, for the periods 2041-2070 and 271-2099, some areas of Angola will be considered suitable, restricted, and unsuitable for the cultivation of these crops, referring to the suitability of climatic conditions for ideal growth and development.
The temperature range was considered:
Suitable: one where the crop develops optimally, promoting healthy growth, flowering, fruiting, and maximum yield [45]. These conditions ensure the plant can complete its life cycle without significant thermal stress.
Restricted: This temperature range still allows crop growth but with some limitations. Plants may experience some heat stress, resulting in suboptimal growth, lower yield, or lower final product quality. This range includes temperatures that are slightly lower or higher than ideal [45].
Unsuitable: those temperature ranges that seriously harm or make crop growth impossible. These extreme temperatures can cause significant damage to plants, preventing proper development, drastically reducing yield, or even killing the plant [45].
Similarly, precipitation is considered [45]:
Suitable: this range of precipitation provides the optimal amount of water for the crop to develop healthily and robustly. It supports the plant through its entire growth cycle, ensuring sufficient water for germination, growth, flowering, fruiting, and ultimately achieving maximum yield. This range avoids both drought stress and waterlogging, which can adversely affect plant health and productivity.
Restricted: precipitation in this range allows crops to grow but with some limitations. While the plants may survive, they may experience periods of water stress, either from too little or too much water. This can lead to suboptimal growth, lower yield, or reduced final product quality. This range includes precipitation levels slightly below or above the ideal range, causing moderate plant stress.
Unsuitable: this range of precipitation is a hindrance to crop growth. It includes levels that can severely impede or even halt crop development. Extremely low precipitation can lead to drought conditions, causing water stress that can stunt growth, reduce yields significantly, or even kill the plants. Conversely, excessively high precipitation can result in waterlogging, root damage, increased susceptibility to diseases, and, ultimately, crop failure. These extreme precipitation levels prevent proper plant development and drastically reduce yield, if not lead to complete crop loss.
Given the agroclimatic characteristics described for Cuanza Norte, with a drastic decrease in precipitation-related parameters (such as RR, RR1, and R10mm) and an increase in the CDD (Consecutive Dry Days) indicator, crops that are more resilient to lower rainfall and drought conditions would be the most suitable. From the provided Table 4, the following crops would be recommended:
Sorghum (Sorghum bicolour) – Suitable temperature range of 20–35°C and a precipitation range of 400–600 mm/year. Sorghum is known for its drought tolerance, making it an ideal choice for regions with decreasing rainfall and extended dry periods.
Millet (Pennisetum glaucum) – With a suitable temperature range of 25–35°C and a precipitation requirement of 200–600 mm/year, millet is another highly drought-resistant crop, suitable for the dry conditions in Cuanza Norte.
Therefore, to relate Table 2 and Table 3 of crops' thermal suitability and precipitation ranges with the analyzed agroclimatic indicators of the regions of Angola, we will consider how climate impacts affect the suitability of growing these crops in each area (Table 4). The Southwestern and Southeastern regions are characterized by low precipitation and high climate variability, and projections indicate a slight reduction/no significant reduction in precipitation in the southwest/southeast and a generalized increase in temperature and its associated indicators, making the regions more suitable for drought-tolerant crops such as sorghum and millet. Projections for central regions indicate a slight increase in precipitation, and generalized increases in temperatures and, consequently, may be challenging for sensitive crops (Bean and Potato) but can still support corn, beans and potatoes with proper management. The northwest and northeast regions are usually hot areas throughout the year with a large amount of precipitation and projections indicate a slight increase/decrease in precipitation in the northwest/northeast and a general increase in temperature. These future conditions make this region ideal for crops that require a large amount of water, such as cassava and corn, despite the risk of evapotranspiration and stress water due to high temperatures. Similar to the southern provinces, the coastal region is characterized by low annual precipitation and will experience a widespread reduction in this parameter and a widespread increase in temperature and its associated agroclimatic indicators. As this region will maintain a low amount of precipitation in the future, it will be suitable for sorghum and millet, while high temperatures can limit other crops. Lastly, the Cuanza Norte region will experience a significant reduction in precipitation and all its associated agroclimatic indicators. As in the other regions, Cuanza Norte will also experience a general increase in temperature, making this region suitable for crops such as sorghum, millet and potatoes.
4. Discussion and Conclusions
The study analyzed the impacts of climate change in Angola, focusing on agroclimatic indices based on precipitation and temperature. Precipitation indices included precipitation sum, RR, number of wet days, RR1, simple daily intensity index for wet days, SDII, number of heavy precipitation days and number of very heavy precipitation days, R10mm and R20mm, respectively, maximum number of consecutive wet days, CWD, and maximum number of consecutive dry days, CDD. Temperature indices included the means of daily mean, TG, maximum, TX, and minimum, TN, temperatures, biologically effective degree days, BEDD, number of tropical nights, TR, maximum number of consecutive summer days, CSU, number of warm and wet days, WW, and warm spell duration index, WSDI.
This study highlights a projected reduction in total annual precipitation (RR) across much of Angola, particularly in the coastal and southern provinces [3,46]. Precipitation is expected to decrease by up to 300 mm in the southeast and 200 mm in the northeast. A significant increase in the maximum number of consecutive dry days (CDD) is anticipated in the southwest and southeast regions [3,51], indicating longer periods without rainfall, which is expected to impact agricultural production in these areas. Conversely, the southwest is the only region predicted to experience an increase of 10 to 30 wet days (RR1), while it will tend to decrease in the other provinces [3]. In the northeast, moderate increases in total precipitation (1200–1650 mm) are expected, along with a rise in R10mm and R20mm days. However, this is accompanied by a decrease in up to 40 wet days in provinces like Uíge and Malanje. In the central region (Huambo and Bié), precipitation is expected to slightly increase [2], ranging from 1200 to 1400 mm, with a rise in CWD, though R10mm and R20mm will decrease. This will have mixed implications for agriculture, as more wet days could benefit rainfed farming, whereas a decrease in heavy rainfall might reduce the risks of flooding, with obvious detrimental impacts on crops. In the northwest (Cabinda, Zaire, and Uíge), a slight reduction in precipitation is expected [2], particularly in Cabinda and Zaire. Uíge, however, will experience a small increase in intense precipitation days.
Temperature projections indicate a consistent increase in all regions of Angola. Increases in TG, TX and TN are expected. The highest increases will be in the southwest and southeast, whereas the lowest increases are projected for the coastal zones [3,46]. The province of Uíge is expected to register an increase of up to 2.8°C in TG, while Huíla, Cunene and Cuando Cubango could register an increase of up to 3.8°C in TX. Furthermore, TN is predicted to increase by up to 3.2°C in Huíla and Cunene. The province of Uíge is expected to record an increase of up to 2.8°C in TG, while Huíla, Cunene and Cuando Cubango may undergo an increase of up to 3.8°C in TX. Furthermore, TN is predicted to increase by up to 3.2°C in Huíla and Cunene [3]. The increase in BEDD will be particularly noticeable, with Uíge expected to record a rise of up to 950°C. The central and coastal provinces will also experience widespread temperature increases, impacting crops that rely on cooler and stable conditions. The projections for (CSU) point to significant increases, mostly in the central and southwestern provinces, such as Huambo and Bié, as well as in Cuanza Norte and Uíge. This indicates prolonged periods of heat, which can stress crops and exacerbate drought and water stress conditions. The number of warm and wet days, WW, and warm spell duration index, WSDI, are also expected to rise throughout the country, with more pronounced effects in the northeast and northwest [3].
Changes in the agroclimatic indicators, such as the increase in CDD and CSU, suggest a higher risk of drought and water stress conditions, particularly in the southern and southwestern regions. This will likely impact drought-sensitive crops like corn (Zea mays) and beans (Phaseolus vulgaris), which thrive in moderate temperature and precipitation conditions. These crops will face stress from both reduced rainfall and rising temperatures (water and heat stress), leading to decreased yields and potential crop failure in certain areas [3]. As abnormally low precipitation can cause sudden droughts in agriculture [18,48], this decrease in precipitation, combined with rising temperatures, can exacerbate soil moisture losses, which can limit crop growth [49]. Reductions in CWD, which may also be manifested by reductions in precipitation along with increases in CDD, have implications for the onset of the rainy season in Angola and are likely to occur, particularly in areas of traditional rainfed agriculture [29,50].
Water scarcity and land fragmentation have decreased farmers' incomes and, ultimately, they will have to change their practices and crops. Furthermore, crop diseases can be triggered in extreme weather conditions [51]. On the other hand, drought, an increasingly prevalent consequence of climate change, causes physiological and biochemical changes in corn crops, including reduced photosynthesis, decreased water absorption, and deficiency in nutrient absorption. These changes can result in stunted growth, reduced plant height, fewer tillers, and crop failures, ultimately reducing yields and affecting food security, livelihoods, and the local economies [49]. Ongoing climate research indicates that areas already susceptible to drought will likely be subject to more intense and prolonged periods of drought conditions in the future [52]. Therefore, this could further aggravate social, environmental, and economic stress and agricultural production in Angola, particularly in the southwest and southeast regions.
The aforementioned projected climate changes in Angola will have a direct impact on agriculture, namely on the main crops that play a fundamental role in the country's food security and rural development, mainly corn (Zea mays), sorghum (Sorghum bicolour), millet (Pennisetum glaucum), beans (Phaseolus vulgaris), cassava (Manihot esculenta) and potato (Solanum tuberosum). Corn will be a crop that, according to projections, may not be suitable for cultivation in the southwest, southeast and coastal regions, due to reduced precipitation and increased temperatures. To mitigate these impacts, it will be critical to prioritize climate-resilient crops, such as sorghum and millet, in areas where precipitation is expected to decrease, i.e. in the southwest, southeast, and coastal areas, while investment in adaptative strategies, such as improved water management systems and agricultural diversification, should be fostered. The cultivation of corn and beans will be suitable in the northwest, northeast and central regions, whilst cassava, an important source of carbohydrates, is particularly suitable for the agroclimatic conditions of the north and northeast regions, with higher rainfall. Potatoes, grown in areas with milder temperatures, are also an essential crop in the same regions but can be threatened by excessively warm conditions. Overall, the increase in CDD and the reduction in RR1 in the main agricultural provinces, such as Benguela, Huambo, Bié, Malanje, Cuanza Sul and Huíla suggest that traditional rainfed agriculture will become less viable.
Therefore, the projected warming is foreseen to trigger heat and water stress in crops, which may lead to a reduction in agricultural productivity, especially for crops sensitive to these abiotic stresses. To warrant food security, it is thus urging the implementation of climate-smart agricultural practices in Angola, respecting the natural resources' sustainability while maintaining the socioeconomic viability of agriculture under changing climates and societal demands.
Supplementary Materials
The following supporting information can be downloaded at preprints.org, Figure S1: title; Table S1: title; Video S1: title.
Author Contributions
João A. Santos and Malik Amraoui, critical review of intellectual content; João A. Santos, project supervision, obtaining financing. All authors: Approve the final version of the manuscript.
Funding
This research was funded by National Funds by FCT—Portuguese Foundation for Science and Technology, under the project UIDB/04033/2020 and LA/P/0126/2020 (https://doi.org/10.54499/UIDB/04033/2020).
Data Availability Declaration
The original contributions presented in the study are included in the article and data referring to the period 2071-2099 are included in the supplementary material, further queries can be directed to the corresponding author(s).
Acknowledgments
The authors acknowledge the use of climate datasets that were obtained from the Copernicus Climate Data Store (2024), the CDO software, and the QGIS version 3.36.1.
Conflicts of Interest
The authors declare no conflicts of interest.
References
- IPCC. Climate Change 2023 Synthesis Report. Ipcc, 2023. 2023;13: 35–115.
- Carvalho SCP, Santos FD, Pulquério M. Climate change scenarios for Angola: an analysis of precipitation and temperature projections using four RCMs. Int J Climatol. 2017;37: 3398–3412. [CrossRef]
- Pinto I, de Perez EC, Jaime C, Wolski P, van Aardenne L, Jjemba E, et al. Climate change projections from a multi-model ensemble of CORDEX and CMIPs over Angola. Environ Res Clim. 2023;2: 035007. [CrossRef]
- Mutengwa CS, Mnkeni P, Kondwakwenda A. Climate-Smart Agriculture and Food Security in Southern Africa: A Review of the Vulnerability of Smallholder Agriculture and Food Security to Climate Change. Sustain. 2023;15. [CrossRef]
- Correia CDN, Amraoui M, Santos A. Analysis of the Impacts of Climate Change on Agriculture in Angola : Systematic Literature Review. Agronomy. 2024;14: 783. [CrossRef]
- Mpandeli S, Naidoo D, Mabhaudhi T, Nhemachena C, Nhamo L, Liphadzi S, et al. Climate change adaptation through the water-energy-food nexus in Southern Africa. Int J Environ Res Public Health. 2018;15: 1–19. [CrossRef]
- Hawkins P, Geza W, Mabaudhi T, Queenan K, Dangour A, Scheelbeek P, et al. Adaptações alimentares e agrícolas à seca entre pequenos agricultores na África do Sul : Um estudo qualitativo Machine Translated by Google. 2022;35: 1–12.
- H, Y. Uma revisão sobre a relação entre mudanças climáticas e agricultura. J Earth Sci Clim Change. 2015;07. [CrossRef]
- Nhemachena CCR, Nhamo L, Matchaya G, Nhemachena CCR, Muchara B, Karuaihe ST, et al. Climate change impacts on water and agriculture sectors in southern africa: Threats and opportunities for sustainable development. Water (Switzerland). 2020;12: 1–17. [CrossRef]
- Thomas DSG, Twyman C, Osbahr H, Hewitson B. Adaptation to climate change and variability: Farmer responses to intra-seasonal precipitation trends in South Africa. Clim Change. 2007;83: 301–322. [CrossRef]
- Usman MT, Archer E, Johnston P, Tadross M. A conceptual framework for enhancing the utility of rainfall hazard forecasts for agriculture in marginal environments. Nat Hazards. 2005;34: 111–129. [CrossRef]
- Thomas N, Nigam S. Twentieth-century climate change over Africa: Seasonal hydroclimate trends and sahara desert expansion. J Clim. 2018;31: 3349–3370. [CrossRef]
- Cudjoe GP, Antwi-Agyei P, Gyampoh BA. The effect of climate variability on maize production in the ejura-sekyedumase municipality, ghana. Climate. 2021;9. [CrossRef]
- Choruma DJ, Akamagwuna FC, Odume NO. Simulating the Impacts of Climate Change on Maize Yields Using EPIC: A Case Study in the Eastern Cape Province of South Africa. Agric. 2022;12. [CrossRef]
- Nhamo L, Mabhaudhi T, Modi AT. Preparedness or repeated short-term relief aid? Building drought resilience through early warning in southern africa. Water SA. 2019;45: 75–85. [CrossRef]
- Donmez C, Schmidt M, Cilek A, Grosse M, Paul C, Hierold W, et al. Climate change impacts on long-term field experiments in Germany. Agric Syst. 2023;205: 103578. [CrossRef]
- Zhang P, Zhang J, Chen M. Economic impacts of climate change on agriculture: The importance of additional climatic variables other than temperature and precipitation. J Environ Econ Manage. 2017;83: 8–31. [CrossRef]
- Olasehinde DA, Adeniran KA, Ogunrinde AT, Abioye OM, Okunola AA. Assessment of Selected Agroclimatic Indices on Maize Yield Forecasting Under Climate Change in Nigeria. IOP Conf Ser Earth Environ Sci. 2024;1342. [CrossRef]
- Ceglar A, Yang C, Toreti A, Santos JA, Pasqui M, Ponti L, et al. Co-designed agro-climate indicators identify different future climate effects for grape and olive across Europe. Clim Serv. 2024;34. [CrossRef]
- Hatfield JL, Dold C. Climate Change Impacts on Corn Phenology and Productivity. Corn - Prod Hum Heal Chang Clim. 2018. [CrossRef]
- Eka Suranny L, Gravitiani E, Rahardjo M. Impact of climate change on the agriculture sector and its adaptation strategies. IOP Conf Ser Earth Environ Sci. 2022;1016. [CrossRef]
- Nobakht, M. , Beavis, P., O’Hara, S., Hutjes, R. S. Agroclimatic indicators from 1951 to 2099 derived from climate projections. Copernicus Climate Change Service (C3S) Climate Data Storage (CDS). 2019. [CrossRef]
- Biastoch A, Rühs S, Ivanciu I, Schwarzkopf FU, Veitch J, Reason C, et al. The Agulhas Current System as an Important Driver for Oceanic and Terrestrial Climate. 2024. [CrossRef]
- Abahous H, Bouchaou L, Chehbouni A. Global climate pattern impacts on long-term olive yields in northwestern africa: Case from Souss-Massa region. Sustain. 2021;13: 1–12. [CrossRef]
- Dai XG, Wang P. A new classification of large-scale climate regimes around the Tibetan Plateau based on seasonal circulation patterns. Adv Clim Chang Res. 2017;8: 26–36. [CrossRef]
- Zhang X, Xu X, Li X, Cui P, Zheng D. A new scheme of climate-vegetation regionalization in the Hengduan Mountains Region. Sci China Earth Sci. 2024;67: 751–768. [CrossRef]
- Bäumle R, Purtschert R, Mueller P, Krekeler T, Zappala JC, Matsumoto T, et al. New insights into the flow dynamics of a deep freshwater aquifer in the semi-arid and saline Cuvelai-Etosha Basin, Northern Namibia: Results of a multi-environmental tracer study. J Hydrol Reg Stud. 2024;52: 1–20. [CrossRef]
- Huntley BJ, Russo V. Biodiversity of Angola. Biodiversity of Angola. 2019. [CrossRef]
- Soares PMM, Careto JAM, Lima DCA. Future extreme and compound events in Angola: CORDEX-Africa regional climate modelling projections. Weather Clim Extrem. 2024;45. [CrossRef]
- MINAGRIP. Relatório De Resultados Da Campanha Agrícola 2019/2020. 2020.
- Matthews RB, Rivington M, Muhammed S, Newton AC, Hallett PD. Adapting crops and cropping systems to future climates to ensure food security: The role of crop modelling. Glob Food Sec. 2013;2: 24–28. [CrossRef]
- Mupangwa W, Chipindu L, Ncube B, Mkuhlani S, Nhantumbo N, Masvaya E, et al. Temporal Changes in Minimum and Maximum Temperatures at Selected Locations of Southern Africa. Climate. 2023;11. [CrossRef]
- Asafu-Adjaye, J. The economic impacts of climate change on agriculture in Africa. J Afr Econ. 2014;23. [CrossRef]
- Egbebiyi TS, Lennard C, Crespo O, Mukwenha P, Lawal S, Quagraine K. Assessing future spatio-temporal changes in crop suitability and planting season over West Africa: Using the concept of crop-climate departure. Climate. 2019;7. [CrossRef]
- Petrovic G, Ivanovi T, Kneževic D, Radosavac A, Obhodaš I. Avaliação do impacto das alterações climáticas na produção de milho na Sérvia. 2023.
- Gornall J, Betts R, Burke E, Clark R, Camp J, Willett K, et al. Implications of climate change for agricultural productivity in the early twenty-first century. Philos Trans R Soc B Biol Sci. 2010;365: 2973–2989. [CrossRef]
- Calzadilla A, Zhu T, Rehdanz K, Sj R, Ringler C. Recursos Hídricos e Economia Alterações climáticas e agricultura : Impactos e opções de adaptação na África do Sul. 2014;5: 24–48.
- Siebers MH, Slattery RA, Yendrek CR, Locke AM, Drag D, Ainsworth EA, et al. Simulated heat waves during maize reproductive stages alter reproductive growth but have no lasting effect when applied during vegetative stages. Agric Ecosyst Environ. 2017;240: 162–170. [CrossRef]
- Huntley, BJ. Ecosystem Processes and Dynamics in Mesic Savannas. Ecology of Angola. 2023. [CrossRef]
- Cain A, Cain A. Climate Change and Land Markets in Coastal Cities of Angola. 2015 World Bank Conf L Poverty, World Bank - Washingt DC, March 23-27. 2015.
- Hatfield JL, Prueger JH. Temperature extremes: Effect on plant growth and development. Weather Clim Extrem. 2015;10: 4–10. [CrossRef]
- Songre-Ouattara LT, Bationo F, Parkouda C, Dao A, Bassole IHN, Diawara B. Qualité des grains et aptitude à la transformation : cas des variétés de Sorghum bicolor, Pennisetumg laucum et Zea mays en usage en Afrique de l’Ouest. Int J Biol Chem Sci. 2016;9: 2819. [CrossRef]
- Bandeira AH, Luis S, Medeiros P, Emygdio BM, Biondo JC, Grazielle N, et al. LOW BASE TEMPERATURE (Tb) AND THERMAL DEMAND OF SWEET SORGHUM GENOTYPES. 2016; 240–250.
- Hatfield JL, Boote KJ, Kimball BA, Ziska LH, Izaurralde RC, Ort D, et al. Climate impacts on agriculture: Implications for crop production. Agron J. 2011;103: 351–370. [CrossRef]
- Lorençone JA, de Oliveira Aparecido LE, Lorençone PA, Torsoni GB, de Lima RF, Chiquitto AG, et al. Climate change and its alterations on annatto (Bixa orellana L.) climate zoning in Brazil. Theor Appl Climatol. 2024;155: 2473–2497. [CrossRef]
- Lourenco M, Woodborne S, Fitchett JM. Drought history and vegetation response in the Angolan Highlands. Theor Appl Climatol. 2023;151: 115–131. [CrossRef]
- Chivangulula FM, Amraoui M, Pereira MG. The Drought Regime in Southern Africa: A Systematic Review. Climate. 2023;11: 1–23. [CrossRef]
- Black, E. Global Change in Agricultural Flash Drought over the 21st Century. Adv Atmos Sci. 2024;41: 209–220. [CrossRef]
- Makuya V, Tesfuhuney W, Moeletsi ME, Bello Z. Assessing the Impact of Agricultural Drought on Yield over Maize Growing Areas, Free State Province, South Africa, Using the SPI and SPEI. Sustain. 2024;16: 1–24. [CrossRef]
- Moses O, Blamey RC, Reason CJC. Drought metrics and temperature extremes over the Okavango River basin, southern Africa, and links with the Botswana high. Int J Climatol. 2023;43: 6463–6483. [CrossRef]
- Bint-e-Mehmood D, Awan JA, Farah H. Modelling temperature and precipitation variabilities over semi-arid region of Pakistan under RCP 4.5 and 8.5 emission scenarios. Model Earth Syst Environ. 2024;10: 143–155. [CrossRef]
- del Pozo A, Brunel-Saldias N, Engler A, Ortega-Farias S, Acevedo-Opazo C, Lobos GA, et al. Climate change impacts and adaptation strategies of agriculture in Mediterranean-climate regions (MCRs). Sustain. 2019;11: 1–16. [CrossRef]
- Saavedra M, Junquas C, Espinoza JC, Silva Y. Impacts of topography and land use changes on the air surface temperature and precipitation over the central Peruvian Andes. Atmos Res. 2020;234: 104711. [CrossRef]
- Feidas H, Karagiannidis A, Keppas S, Vaitis M, Kontos T, Zanis P, et al. Modeling and mapping temperature and precipitation climate data in Greece using topographical and geographical parameters. Theor Appl Climatol. 2014;118: 133–146. [CrossRef]
Figure 1.
Map of Southern Africa: a) The geographical location of Angola on the African continent is highlighted in red; b) The map of Angola with its provinces; c) Map of land use and coverage in Angola for the year 2021; d) Angola elevation map.
Figure 1.
Map of Southern Africa: a) The geographical location of Angola on the African continent is highlighted in red; b) The map of Angola with its provinces; c) Map of land use and coverage in Angola for the year 2021; d) Angola elevation map.
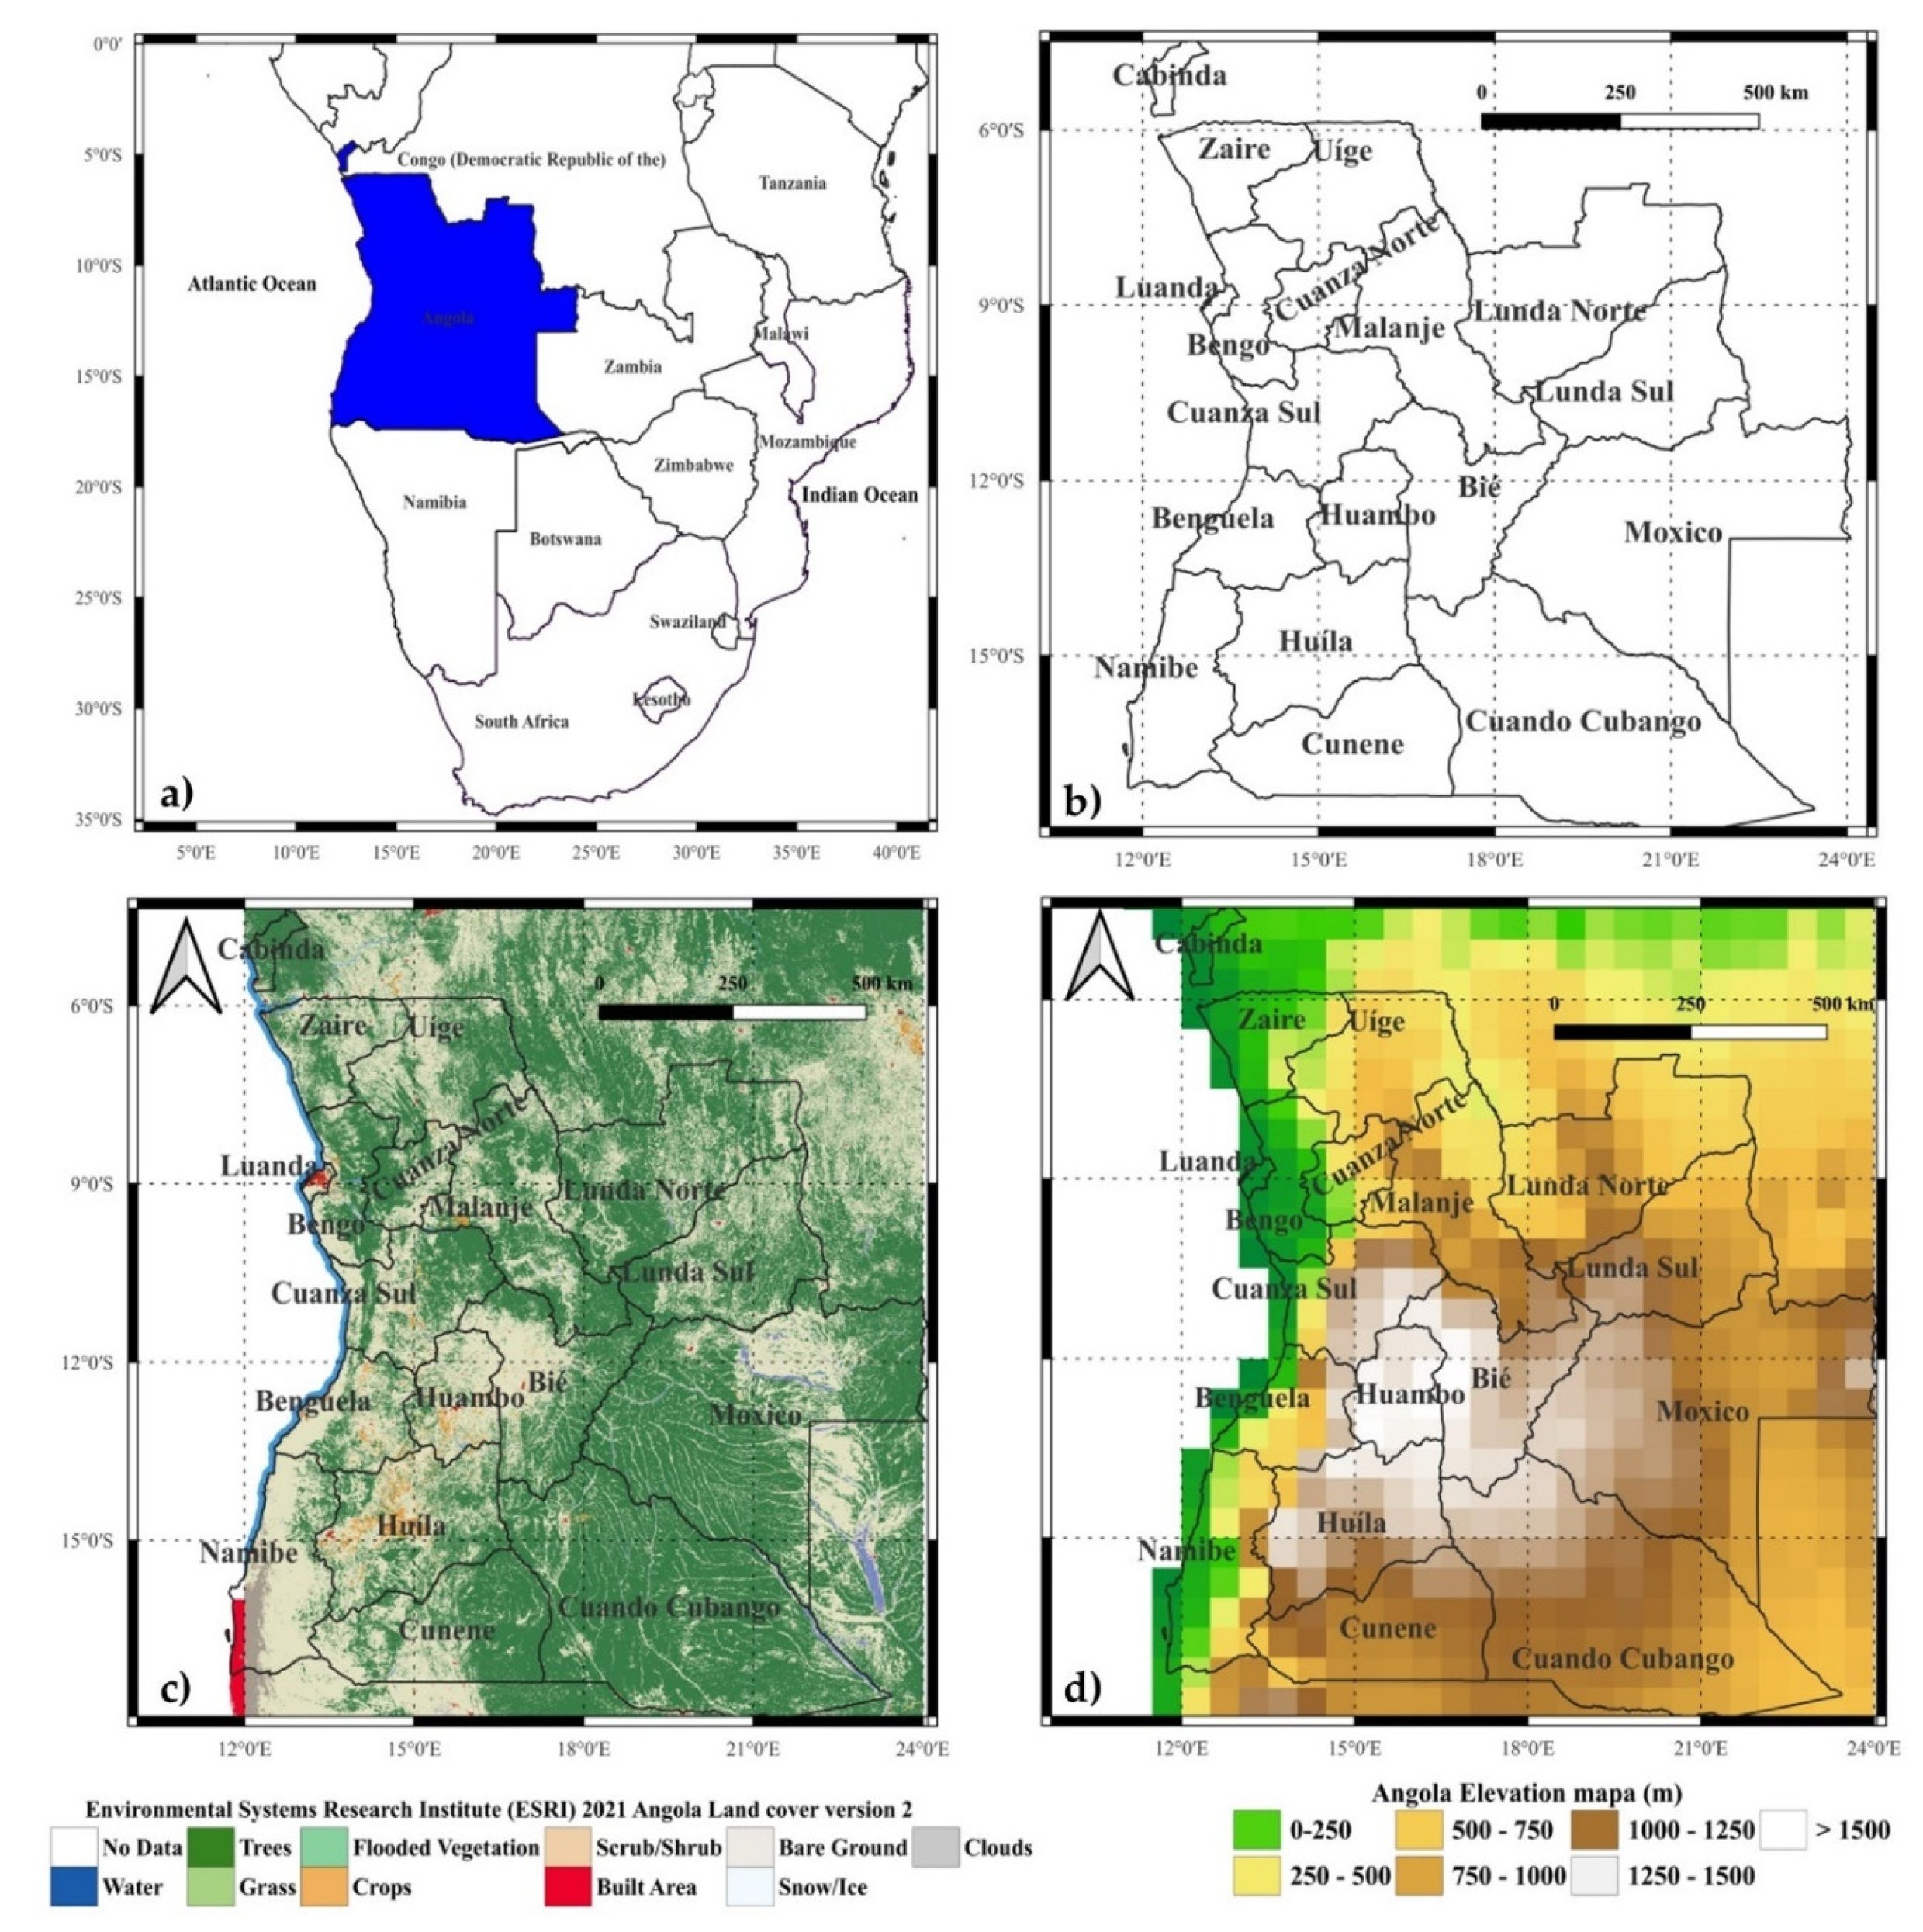
Figure 2.
Climate means of the outlined agroclimatic indicators (RR: Precipitation sum; RR1: Wet days; SDII: simple daily Intensity index for wet days) for the historical period 1981–2010 (left panels), the 5-member ensemble mean projections for the future period 2041-2070 under RCP8.5 (mid panels), and the corresponding differences (future minus historical period). See respective legends for scales and units.

Figure 3.
Climate means of the outlined agroclimatic indicators (R10mm: Heavy precipitation days; R20mm: very heavy precipitation; CWD: maximum number of consecutive wet days; CDD: maximum number of consecutive dry days) for the historical period 1981–2010 (left panels), the 5-member ensemble mean projections for the future period 2041-2070 under RCP8.5 (mid panels), and the corresponding differences (future minus historical period). See respective legends for scales and units.
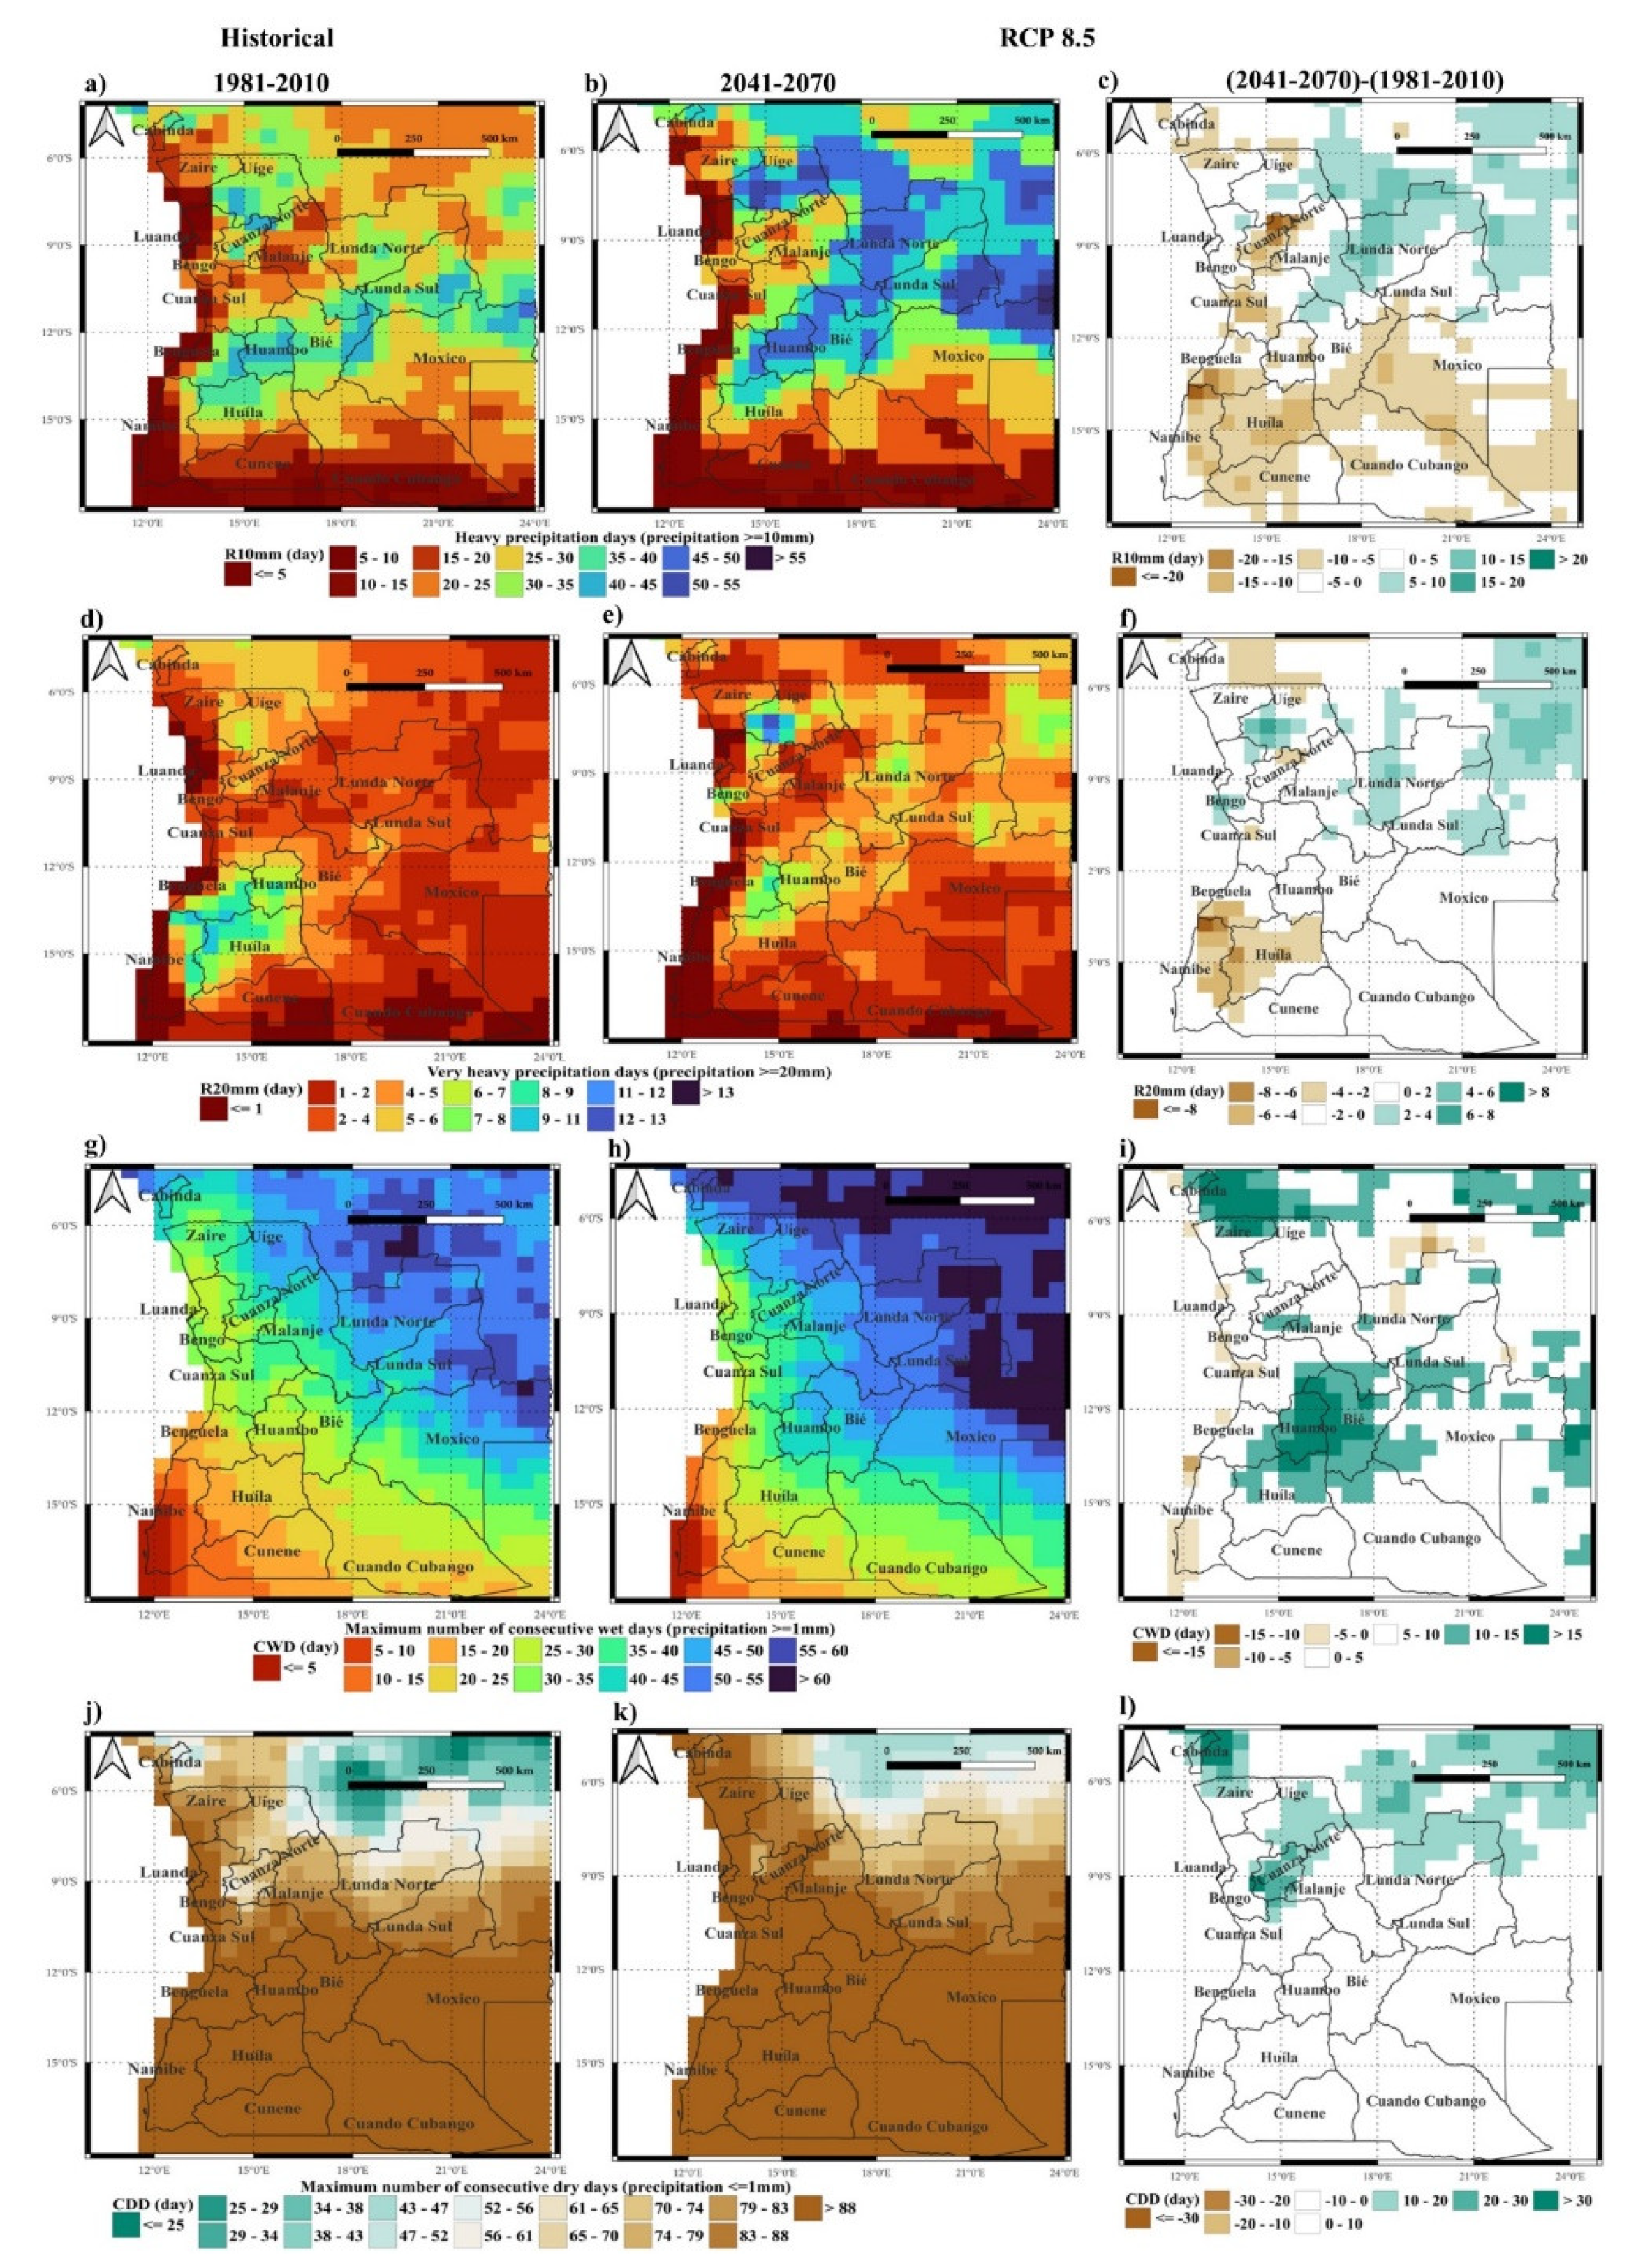
Figure 4.
Climate means of the outlined agroclimatic indicators (TG: Mean of daily mean temperature; TX: Mean of daily maximum temperature; TN: Mean of daily minimum temperature; BEDD: Biologically effective degree days) for the historical period 1981–2010 (left panels), the 5-member ensemble mean projections for the future period 2041–2070 under RCP8.5 (mid panels), and the corresponding differences (future minus historical period). See respective legends for scales and units.
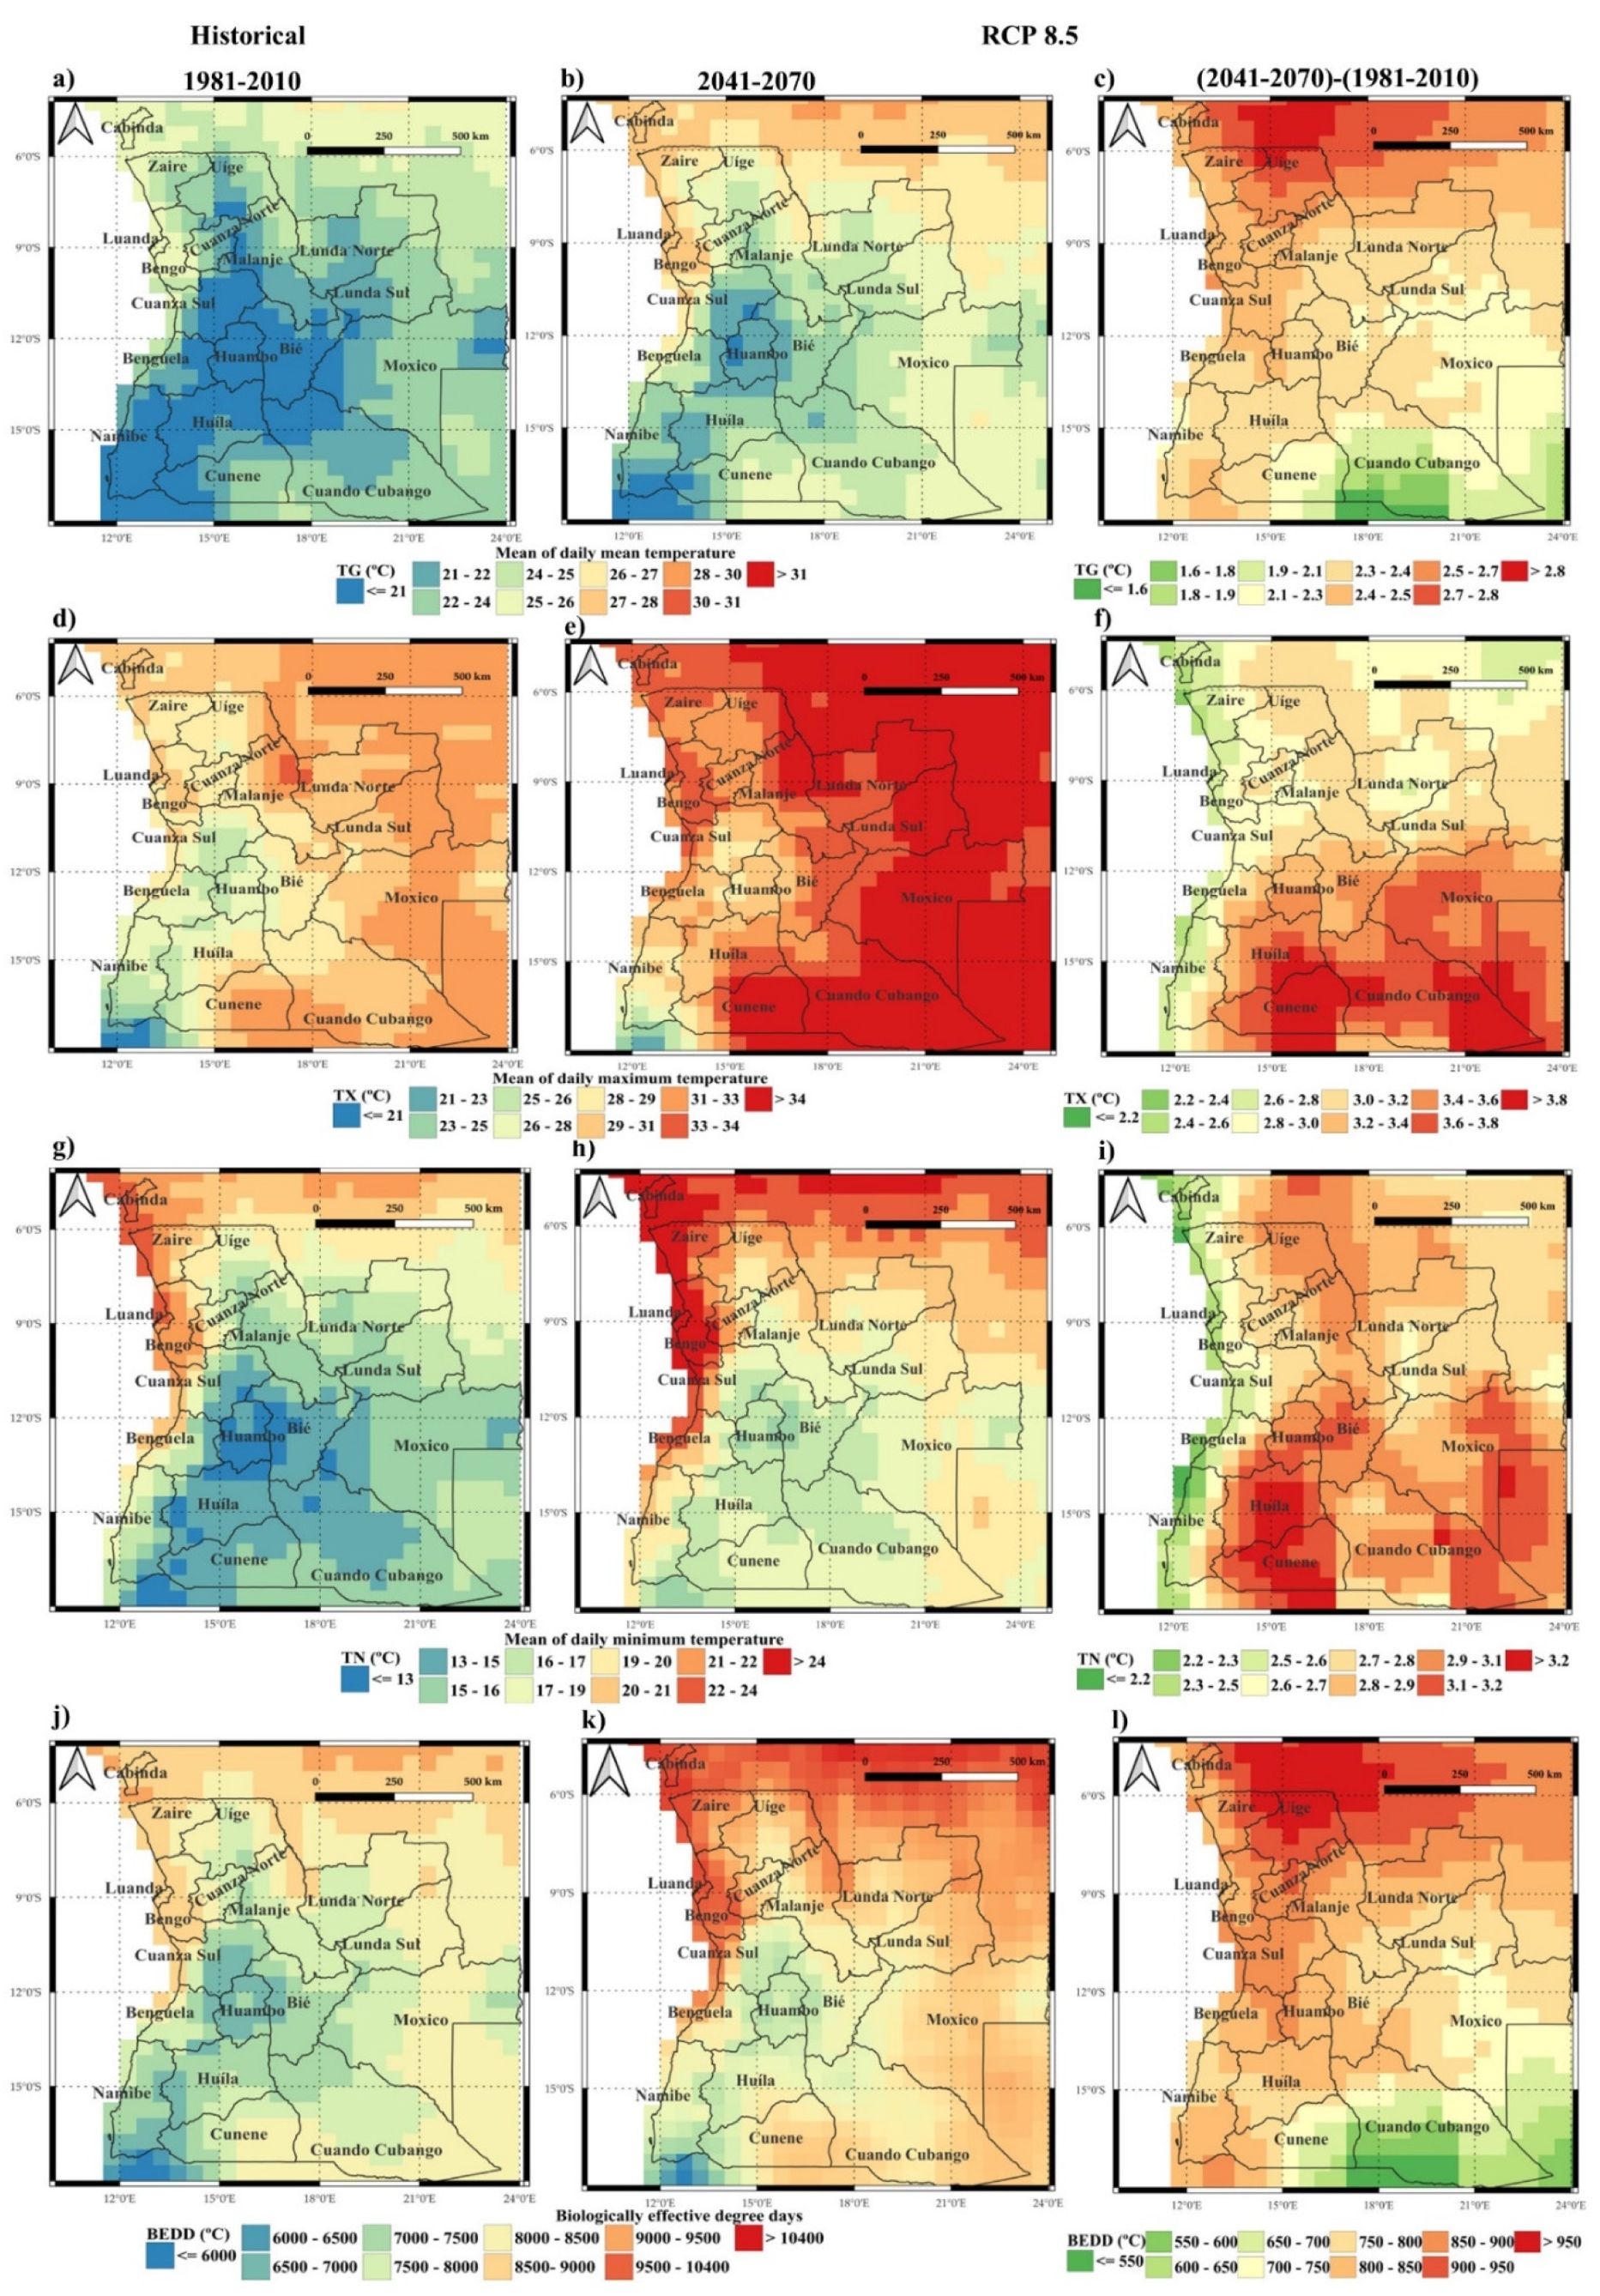
Figure 5.
Climate means of the outlined agroclimatic indicators (TR: Tropical nights; CSU: maximum number of consecutive summer days; WW: warm and wet days; WSDI: warm spell duration index for the historical period 1981–2010 (left panels), the 5-member ensemble mean projections for the future period 2071-2099 under RCP8.5 (mid panels), and the corresponding differences (future minus historical period). See respective legends for scales and units.
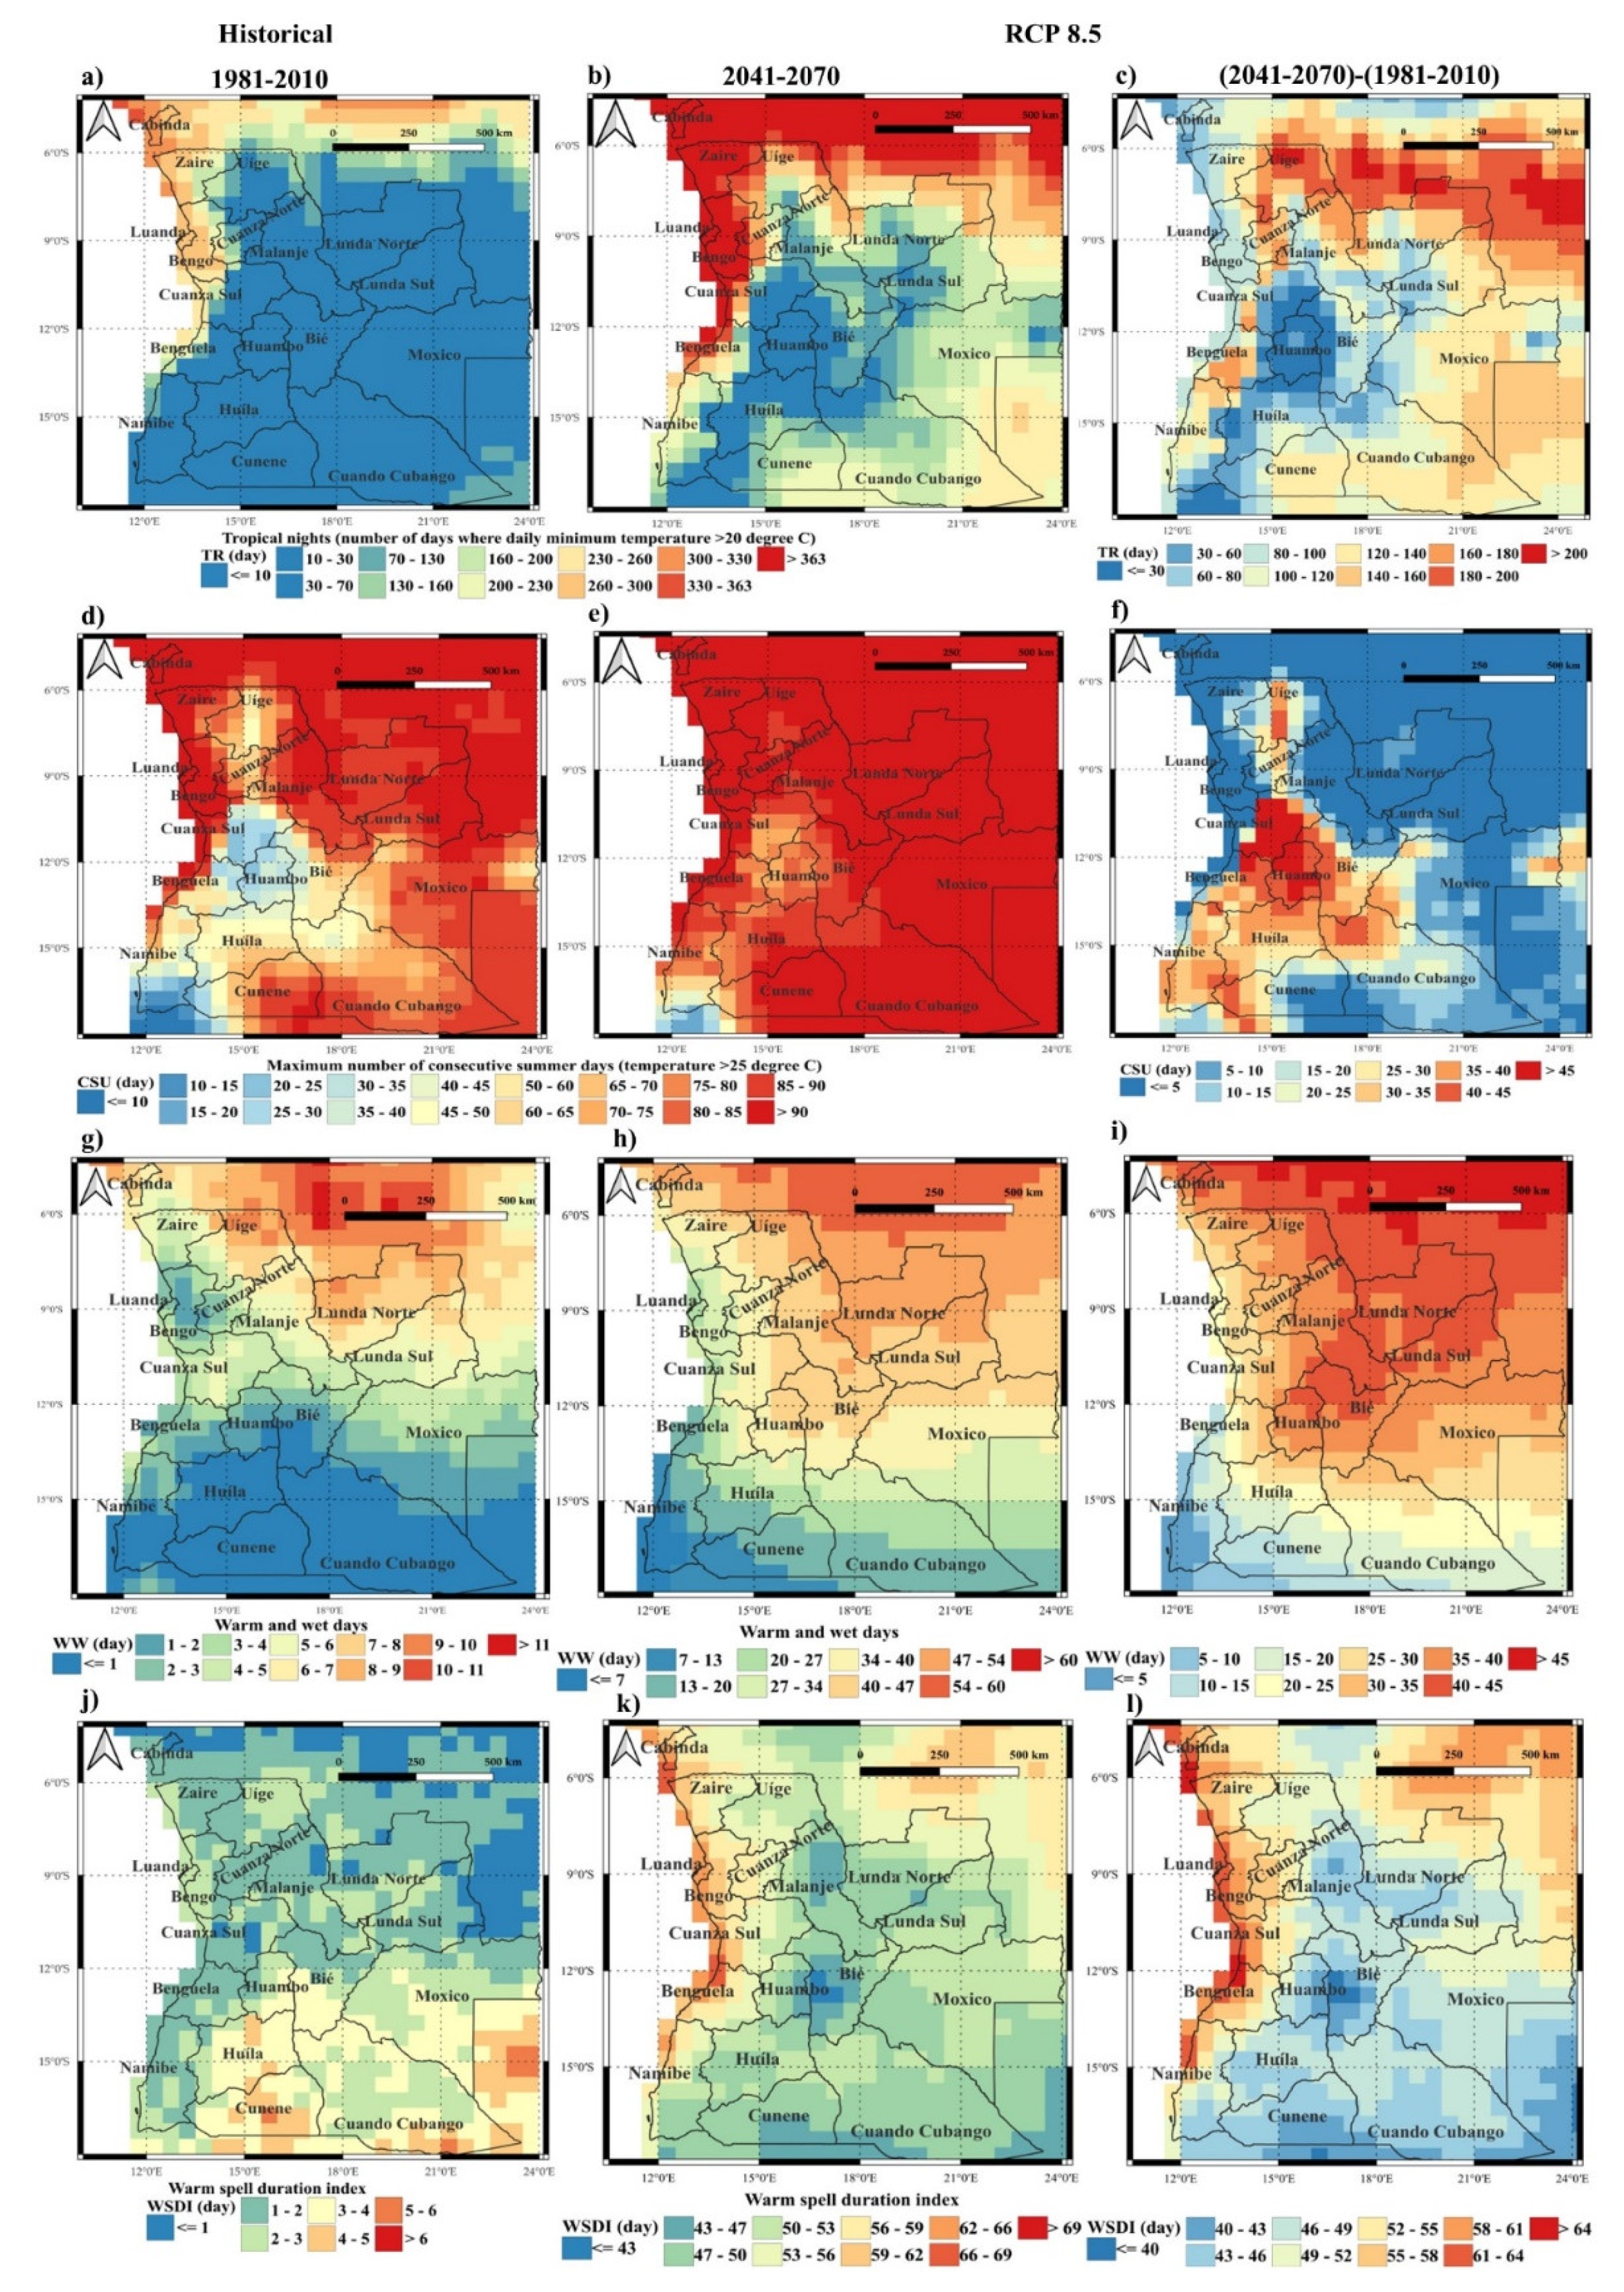

Table 1.
Agroclimatic indicators [22].
Table 1.
Agroclimatic indicators [22].
| Nº | Name | symbol | Units | Description |
|---|---|---|---|---|
| 1 | Biologically effective degree days | BEDD | °C | Sum of daily mean temperatures (TG) above 10°C and less than 30°C, over 10 days. |
| 2 | Heavy precipitation days | R10mm | day | Number of days per 10 days when RR > 10mm, where RR is the daily precipitation sum. This indicator provides information on crop damage and runoff losses. |
| 3 | Maximum number of consecutive dry days | CDD | day | Longest consecutive days when RR < 1mm, where RR is the daily precipitation sum. This indicator is used for drought monitoring. |
| 4 | Maximum number of consecutive summer days | CSU | day | Longest consecutive days when TX > 25°C, where TX is the daily maximum temperature. This indicator provides information on drought stress or on optimal growth for C4 crops (crops that use the C4 carbon fixation pathway, e.g. maize). |
| 5 | Maximum number of consecutive wet days | CWD | day | Longest consecutive days when RR > 1mm, where RR is the daily precipitation sum. This indicator provides information on drought, oxygen stress, and crop growth (i.e. less radiation interception during rainy days). |
| 6 | Mean of daily maximum temperature | TX | °C | Mean value of TX over 10 days, where TX is the daily maximum temperature. This indicator provides information on long-term climate variability and change. |
| 7 | Mean of daily mean temperature | TG | °C | Mean value of TG over 10 days, where TG is the daily mean temperature. This indicator provides information on long-term climate variability and change. |
| 8 | Mean of daily minimum temperature | TN | °C | Mean value of TN over 10 days, where TN is the daily minimum temperature. This indicator provides information on long-term climate variability and change. |
| 9 | Precipitation sum | RR | mm | The sum of RR over 10 days, where RR is the daily precipitation sum. This indicator provides information on possible water shortage or excess. |
| 10 | Simple daily intensity index | SDII | mm | Mean of RR over 10 days in which RR > 1mm (wet days), where RR is the daily precipitation sum. This indicator provides information on possible runoff losses. |
| 11 | Tropical nights | TR | day | Number of days per 10 days when TN > 20°C, where TN is the daily minimum temperature. This indicator indicates the occurrence of various pests. |
| 12 | Very heavy precipitation days | R20mm | day | Number of days per 10 days when RR > 20mm, where RR is the daily precipitation sum. This indicator provides information on crop damage and runoff losses. |
| 13 | Warm and wet days | WW | day | number of days per 10 days when TG > TG75th and RR > RR75th; where TG is the daily mean temperature, TG75th is the calendar day 75th percentile, RR is the daily precipitation sum and RR75th is the 75th percentile of precipitation on wet days. |
| 14 | Warm spell duration index | WSDI | day | Number of days per season with at least 6 consecutive days when TX > TX90th, where TX is the daily maximum temperature and TX90th is the calendar day 90th percentile. |
| 15 | Wet days | RR1 | day | Number of days per 10 days when RR > 1mm, where RR is the daily precipitation sum. This indicator provides information on intercepted reduction. |
Table 2.
Main impacts in the provinces of the southern, central, northern, coastal, and eastern regions of Angola.
Table 2.
Main impacts in the provinces of the southern, central, northern, coastal, and eastern regions of Angola.
| Region | Provinces | Agroclimatic indicators (Future) |
Main impacts (projection) |
|---|---|---|---|
| Southwest | Namibe, Huíla | RR: reduction Namibe 200–400mm Huíla: 400–1000mm RR1: increase, Namibe: 30–60 days Huíla: 60–120 days SDII: reduction (–2–0 mm/wet day) R10mm, R20mm: reduction CWD: reduction in Namibe increase in Huila CDD: no significant changes TG, TX, TN, BEDD: generalized increase TR, CSU, WW, WSDI: increase |
Significant reduction in precipitation; Reduction in R10mm and R20mm; Increase in RR1; Increase in CDD Generalised increase in temperatures (TG,TX,TN and BEDD); Slight increase in the (TR); Large increase in CSU, WW and WSDI |
| southeast |
Cunene, Cuando Cubango Moxico |
RR: no significant changes (400–800 mm) RR1: reduction Cunene: no significant changes Cuando Cubango: 90–120 days Moxico: 120–150 days SDII: slight increase 1–2 mm R10mm: slight reduction (5–20 days) R20mm: no significant changes (1–4 days) CWD: Cunene: no significant changes Cuando Cubango and Moxico: slight increase of about 10 days CDD: no significant changes TG, TX, TN, BEDD: generalized increase, less pronounced for TG and BEDD in Cunene and Cuando Cubango. TR: increase of 10 days in the east of the three provinces and of about 200 days in the remaining regions CSU: increase in the entire region (85 days) WW, WSDI: strong increase 13–40 for WW 43–50 for WSDI |
There is slight reduction in precipitation;Slight reduction in the number of wet days;No significant changes in consecutive dry days; widespread increase in temperatures (and associated indicators);A significant increase in the TR, WW, and WSDI. |
| Center | Huambo, Bié |
RR: slight increase (1200–1400mm) RR1: no significant changes SDII: no significant changes Slight increase in north of Bié R10mm: reduction (30–50 mm) R20mm: no significant changes CWD: significant increase (35–55 days) CDD: no significant changes TG, TX, TN, BEDD: increase CSU, WW, WSDI: strong increase TR: increase (30–70) days |
Slight increase in precipitation in some areas;Reduction in R10mm; No changes in RR1 and CDD;Significant increase in the CWD;Widespread increase in temperatures (and associated indicators), except for a reduction in TR. |
| Northeast | Malanje Lunda Norte Lunda Sul |
RR: slight increase Malanje (1200–1600mm) Lunda Norte (1400–1650mm) Lunda Sul has no significant changes RR1: reduction (180–270 days) SDII: slight increase of 6–7 mm R10mm, R20mm: increase CWD: slight increase mainly in the south of the provinces CDD: slight increase in Lunda Norte and Malanje (70–92) days TG, TX, TN, BEDD: slight increase WW, TR, WSDI: increase CSU: slight increase |
Slight increase in precipitation;Reduction in RR1, a slight increase in the CWD, and an increase in CDD; Slight widespread increase in temperatures (and associated indicators). |
| Northwest | Cabinda Zaire Uíge |
RR: slight reduction Cabinda no significant changes Zaire (600–1200mm) Uíge (1200–1600mm) RR1: reduction (150–270 days) SDII: slight increase of 6–9 mm R10mm: no significant changes R20mm increase in Uíge (5–12 days) no significant changes in Cabinda and Zaire CWD: increase in Cabinda and Zaire (30–50 days) CDD: increase (65–92 days) TG and BEDD significant increase, TG: increase in Cabinda and Zaire (24–270C), BEDD (950-10400 0C) TG: increase in Uíge (24–260C), BEDD (800–900 0C) TX and TN slight increase TX: increase (29–320C), and TN (>24 0C) increase in Cabinda and Zaire TN: increase in Uíge (19–21°C) TR: Increase in Cabinda and Zaire (330–363) and a significant increase in Uíge (130–330) WW and WSDI: significant increase. CSU: no significant changes in Cabinda and Zaire and a huge increase in Uíge (85–90 days) |
Slight increase in precipitation in some areas;Reduction in wet days, increase in the CWD, especially in Cabinda and north of Zaire, and a generalized increase in CDD; Slight widespread increase in TG, TX, TN, BEDD and TR; Significant increase in WW, WSDI and CSU. |
| Central Coast | Luanda, Benguela, Cuanza Sul, Bengo | RR: reduction No significant changes in Luanda and Bengo (600–800) Benguela (400–1000mm) Cuanza sul (400–1000mm) RR1: reduction (90–120 days) SDII: increase 1–2 mm Increase in Luanda and Bengo 4–8 mm Benguela reduction 4–7 mm Cuanza sul no significant changes R10mm: No significant changes in Bengo and Luanda Reduction in Cuanza Sul and Benguela (5–30 days) R20mm reduction Slight increase in Bengo (1–6 days) No significant changes in Luanda and Cuanza Sul A slight reduction in Benguela (1–8 days) CWD: No significant changes CDD: no significant changes TG and BEDD: significant increase, TX and TN: slight increase TR, WW and WSDI increase CSU: a slight increase except for the interior of Cuanza Sul |
Widespread reduction in precipitation;Reduction in RR1, no significant changes in CWD and CDD;Widespread increase in temperatures (and associated indicators). |
| Cuanza Norte | Cuanza Norte | RR: reduction (800–1000 mm) RR1: reduction (120 days) SDII: slight reduction in the north -4–6 mm/wet day R10mm: significant reduction (20–30 days) R20mm slight reduction (1–5 days) CWD: slight increase (35–45 days) CDD: increase (92 days) TG, TX, TN and BEDD increase CSU, WW and WSDI increase TR: generalized increase, more pronounced in the western zone (260–300 days). |
Significant reduction in precipitation;Reduction in the RR1 and a slight increase in CWD;Increase in CDD; Increase in the TR; Significant increase in CSU, WW, and WSDI. Widespread increase in temperatures (and associated indicators). |
Table 3.
Indicative temperature and precipitation suitability ranges of Angola's main crops based on the outlined literature.
Table 3.
Indicative temperature and precipitation suitability ranges of Angola's main crops based on the outlined literature.
| Culture | Author(s) | Suitable Temperature (°C) | Restricted Temperature (°C) | Anapta temperature (°C) | Suitable Precipitation (mm/year) | Restricted Precipitation (mm/year) | Unsuitable Precipitation (mm/year) |
|---|---|---|---|---|---|---|---|
| Corn (Zea mays) | [42,43,44] | 20–30 | 10–20 / 30 – 35 | < 10 / > 35 | 500–800 | 400–500 / 800– 1200 | < 400 / > 1200 |
| Sorghum (Sorghum bicolor) | [42,43] | 20–35 | 15–20 / 35–40 | < 15 / > 40 | 400–600 | 300–400 / 600–800 | < 300 / > 800 |
| Millet (Pennisetum glaucum) | [42,43] | 25–35 | 20–25 / 35–40 | < 20 / > 40 | 200–600 | 100–200 / 600– 800 | < 100 / > 800 |
| Bean (Phaseolus vulgaris) | [42,43,44] | 18–24 | 15 – 18 / 24–30 | < 15 / > 30 | 500–800 | 400–500 / 800– 1200 | < 400 / > 1200 |
| Cassava (Manihot esculenta) | [42,43] | 25–29 | 20–25 / 29–35 | < 20 / > 35 | 1000–1500 | 600–1000 / 1500–2000 | < 600 / > 2000 |
| Potato (Solanum tuberosum) | [42,43] | 15–20 | 10 –15 / 20–25 | < 10 / > 25 | 500–750 | 400–500 / 750– 1000 | < 400 / > 1000 |
Table 4.
Agroclimatic indicators for optimal crop selection in different regions of Angola.
| Culture | Suitable daily mean temperature (°C) |
Suitable Precipitation sum (mm/year) | Most Suitable Region |
|---|---|---|---|
| Corn (Zea mays) | 20–30 | 500–800 | Northwest, Northeast and Center |
| Sorghum (Sorghum bicolor) | 20–35 | 400–600 | Southwest, Southeast and Coastal |
| Millet (Pennisetum glaucum) | 25–35 | 200–600 | Southwest, Southeast and Coastal |
| Bean | 18–24 | 500–800 | Northwest, Northeast and Center |
| Cassava (Manihot esculenta) | 25–29 | 1000–1500 | Northwest, Northeast and Center |
| Potato (Solanum tuberosum) | 15–20 | 500–750 | Northwest, Northeast and Center |
Disclaimer/Publisher’s Note: The statements, opinions and data contained in all publications are solely those of the individual author(s) and contributor(s) and not of MDPI and/or the editor(s). MDPI and/or the editor(s) disclaim responsibility for any injury to people or property resulting from any ideas, methods, instructions or products referred to in the content. |
© 2024 by the authors. Licensee MDPI, Basel, Switzerland. This article is an open access article distributed under the terms and conditions of the Creative Commons Attribution (CC BY) license (http://creativecommons.org/licenses/by/4.0/).
Copyright: This open access article is published under a Creative Commons CC BY 4.0 license, which permit the free download, distribution, and reuse, provided that the author and preprint are cited in any reuse.


