
Submitted:
29 October 2025
Posted:
03 November 2025
You are already at the latest version
Abstract
The Boudenib Oasis in southeastern Morocco depends heavily on its limited water resources for domestic use and agriculture. However, climate change is expected to intensify water scarcity through changes in precipitation and evapotranspiration (ET). This study assesses the potential impacts of climate change on precipitation (P) and evapotranspiration in the Guir watershed using the Soil and Water Assessment Tool Plus (SWAT+). Historical (1984–2015) and future (2070–2100) simulations were conducted under the high-emission Representative Concentration Pathway (RCP8.5), driven by five bias-corrected global climate models (GCMs): GFDL-ESM4, IPSL-CM6A-LR, MPI-ESM1-2-HR, MRI-ESM2-0, and UKESM1-0-LL. Model outputs show a projected decline in annual precipitation of approximately 25–30%, from an average of 380 mm during the historical period to about 280 mm by 2100, and a reduction in ET of 15–20%, from roughly 380 mm to 314 mm. Despite uncertainties inherent in climate projections, consistent multi-model agreement increases confidence in these results. This study represents one of the first applications of SWAT+ in southeastern Morocco, providing new insights into hydrological responses to climate change in data-scarce arid environments. The findings highlight the urgent need for adaptive water management, integration of traditional systems such as khettaras, and sustainable land-use planning to strengthen resilience under future climate conditions.
Keywords:
climate change
; SWAT+
; precipitation
; evapotranspiration
; RCP8.5
; Guir watershed
; Morocco
; hydrological modelling
1. Introduction
Precipitation in Morocco exhibits significant spatial variability, characterized by a sharp north–south gradient (Figure 1). Rainfall decreases from the humid northern regions to the arid southeast, as illustrated in the rainfall distribution map of Morocco [1]. Integrated water resources management remains one of the most pressing challenges in southeastern Morocco, particularly in the Boudenib Oasis. In recent decades, Morocco has experienced a decrease of approximately 15% in annual rainfall compared to past periods, reflecting the broader effects of climate change [2]. This decline poses a major threat to water resources, especially in developing African countries where agriculture is the main economic sector [2]. Consequently, water scarcity has emerged as a critical issue that requires urgent attention from policymakers and stakeholders.
Oases in Morocco occupy about 15% of the national territory [2] and play a vital role in both economic and social development. However, their sustainability is increasingly under pressure from demographic growth, economic expansion, and the impacts of climate change, which together have degraded ecosystem quality [2]. The Boudenib Oasis, extending over nearly 200 km, represents a significant natural and cultural heritage area due to its importance in supporting agriculture, livestock, and local livelihoods. Water availability underpins both ecological balance and socio-economic stability, making the oasis particularly vulnerable to drought and hydrological stress.
Part of the UNESCO Biosphere Reserve, the Boudenib Oasis depends on limited surface water and groundwater resources to sustain its population and agricultural systems. As surface water has become increasingly scarce, groundwater (GW) extraction has intensified, confirmed by field observations and discussions with local residents who report growing dependence on wells and boreholes. The oasis also suffers from land degradation caused by deforestation and over-harvesting [3], while floods and drought events have become more frequent. Irrigation is supported by a dense network of canals derived from river systems. Since the late 14th century, irrigation water in the northern part of the oasis was also supplied through khettaras—subterranean channels that tap perched aquifers [3].
Since the early 1970s, many khettaras in the region have experienced a gradual decline, with numerous systems drying up and being abandoned within two decades [2]. This reduction is primarily attributed to the construction of the Hassan Adakhil Dam and the creation of its reservoir [3]. The dam’s regulation of river flow has resulted in intermittent downstream discharge, with many channels carrying water only seasonally. Excessive groundwater abstraction for agricultural and domestic use, coupled with increasing drought frequency, has further aggravated this situation. Farmers have been slow to adopt efficient irrigation technologies, such as drip systems, while traditional surface irrigation remains dominant. The Hassan Adakhil Reservoir, located near Errachidia, relies on inflows from the mountain catchments; however, in recent years, its storage levels have frequently fallen below minimum capacity due to reduced rainfall and increased variability—both consequences of climate change [3].
Previous studies in the oases of Tafilalet and the wider southeastern region of Morocco have reported similar challenges, particularly regarding water availability, agricultural productivity, and socio-economic stability [3]. These studies demonstrated declining surface-water availability linked to increased evaporation, altered precipitation, and overexploitation of groundwater resources [3]. Agricultural production—especially for water-demanding crops such as date palms—has been increasingly threatened by water scarcity and the slow adoption of water-efficient irrigation technologies [3]. These pressures have contributed to food insecurity and rural outmigration, as populations seek better living conditions [4]. Climate projections for the region indicate further temperature increases and reduced rainfall, exacerbating water scarcity and desertification [5]. Such changes may also degrade ecosystem services, including soil fertility and biodiversity, which are vital for sustaining oasis agriculture [6].
Globally, climate projections suggest that temperatures in the Mediterranean basin could increase by 2–3 °C by 2050, accompanied by a 20–30% reduction in precipitation [7]. Most models for North Africa also project a consistent decline in rainfall combined with rising temperatures, particularly across Morocco [8]. These climatic shifts are expected to alter hydrological processes in mountainous regions, leading to earlier snowmelt, reduced spring runoff, and increased uncertainty in water-resource availability [9].
While previous research has mainly focused on the Tafilalet Oasis, this study investigates the impacts of climate change on the Boudenib Oasis using advanced hydrological modeling techniques. The objective is to assess the hydrological response of the Guir watershed to future climate conditions through the application of a conceptual hydrological model. The selection of an appropriate model depends heavily on data availability, which also influences the accuracy of future projections. Reliable hydrological models require long-term observations to understand the relationships between climatic variables and hydrological processes. However, in developing regions with sparse monitoring networks, the application of complex, physically based models are constrained by the lack of data necessary for calibration and validation [9].
In this study, climate change impacts were analyzed using the Soil and Water Assessment Tool Plus (SWAT+), a physically based hydrological model. SWAT+ allows the evaluation of hydrological parameters such as precipitation (P) and evapotranspiration (ET), both of which directly influence surface-water availability in arid regions. Historical and future P and ET scenarios were derived from five commonly used Global Climate Models (GCMs), where historical simulations (1984–2015) were compared to future projections (2070–2100) under the RCP8.5 scenario. Analyses were performed at the Hydrological Response Unit (HRU) scale to assess spatial variability.
Time-series simulations were generated at two temporal resolutions—annual averages and yearly variability—based on recommendations from the climate modelling literature, which emphasize analysing both scales to capture interannual variations in precipitation and evapotranspiration dynamics. Meteorological data were available on an annual basis, making annual averages (AA) the most appropriate choice for evaluating long-term climatic impacts. Seasonal data, by contrast, can obscure important interannual fluctuations that are crucial for understanding water availability and agricultural productivity. Using annual averages for P and ET provides a more reliable assessment of how climate change may influence water resources and the timing of agricultural cycles in the oasis.
The overarching objective of this research is to predict the evolution of rainfall and its implications for date-palm cultivation, as well as to estimate the projected changes in evapotranspiration caused by climate change. The results aim to inform regional authorities on sustainable water management strategies and guide future governance approaches based on real-time population and agricultural needs. Furthermore, this study underscores the importance of integrating traditional systems such as khettaras with modern water-saving techniques to strengthen climate resilience. By combining scientific modelling with local knowledge, effective adaptation strategies can be developed to enhance the sustainability of fragile oasis ecosystems and the communities that depend on them.
In this study, SWAT+ was applied to evaluate the potential impacts of climate change on precipitation and evapotranspiration in the Guir watershed. The model was forced with bias-corrected outputs from five GCMs—GFDL-ESM4, IPSL-CM6A-LR, MPI-ESM1-2-HR, MRI-ESM2-0, and UKESM1-0-LL—under the high-emission Representative Concentration Pathway 8.5 (RCP 8.5) scenario [26]. Historical (1984–2015) and future (2070–2100) simulations were compared to quantify projected changes in mean annual P and ET and to analyze spatial patterns of hydrological stress across Hydrological Response Units (HRUs).
This research addresses three main questions:
How will projected climate change modify the spatial and temporal patterns of precipitation and evapotranspiration in the Guir watershed?
What magnitude of change is expected in annual P and ET by 2100 relative to the historical baseline?
What are the implications of these changes for surface-water and groundwater resources that sustain the Boudenib Oasis ecosystem?
By integrating multi-model climate projections with a process-based hydrological model, this study provides one of the first quantitative assessments of climate-change impacts on P and ET in southeastern Morocco using SWAT+. The results will contribute to developing adaptive water-management strategies, rehabilitating traditional irrigation systems such as khettaras, and improving the resilience of oasis ecosystems under future climate conditions.
2. Materials and Methods:
2.1. Study Area: Guir Catchment
The Guir watershed, located in southeastern Morocco, forms part of the broader Ziz–Guir hydrological system. It is bounded to the north by the mountains of Ich N’oubiraz, Ichou Almou, Tziba, Asdad, Tiwdersine, Adrar N’Tassiwant, Al’Agba Tamaqrante, and Tioudadine (1,629 m a.s.l.); to the west by the mountains of Golt, Dhart N’bou Ichalmiwne, Bine El Kroun, and the Ziz watershed; to the south by the Garet Ziar hills (altitude > 1,000 m); and to the east by the Lakhdar, Bou Ihdoumene, and Larwiya Lakbira mountains (altitude > 1,020 m) [10].
The basin features diverse topography comprising mountains, valleys, plateaus, and desert landscapes. Depressions and intermontane valleys form limited but productive zones where shallow groundwater allows agricultural activity. Toward the east, the landscape transitions into the Sahara Desert, characterized by sand dunes and rocky plateaus. Topography exerts a strong influence on hydrological processes: steep slopes in the upper basin promote rapid surface runoff, whereas the lowlands experience poor water retention and severe aridity [11].
Soils in the Guir watershed are predominantly arid and weakly developed, with significant variability linked to topography and climatic conditions. Sandy soils dominate the eastern sector and are highly prone to erosion, while more fertile alluvial deposits occur along the Guir River, supporting irrigated agriculture. Clay and loam soils within valley bottoms show moderate fertility but limited capacity to retain water. Saline soils are also present in low-lying areas, resulting from intense evaporation and water scarcity. Overall, soil fertility is low, and sustainable cultivation depends on irrigation access and water resource management.
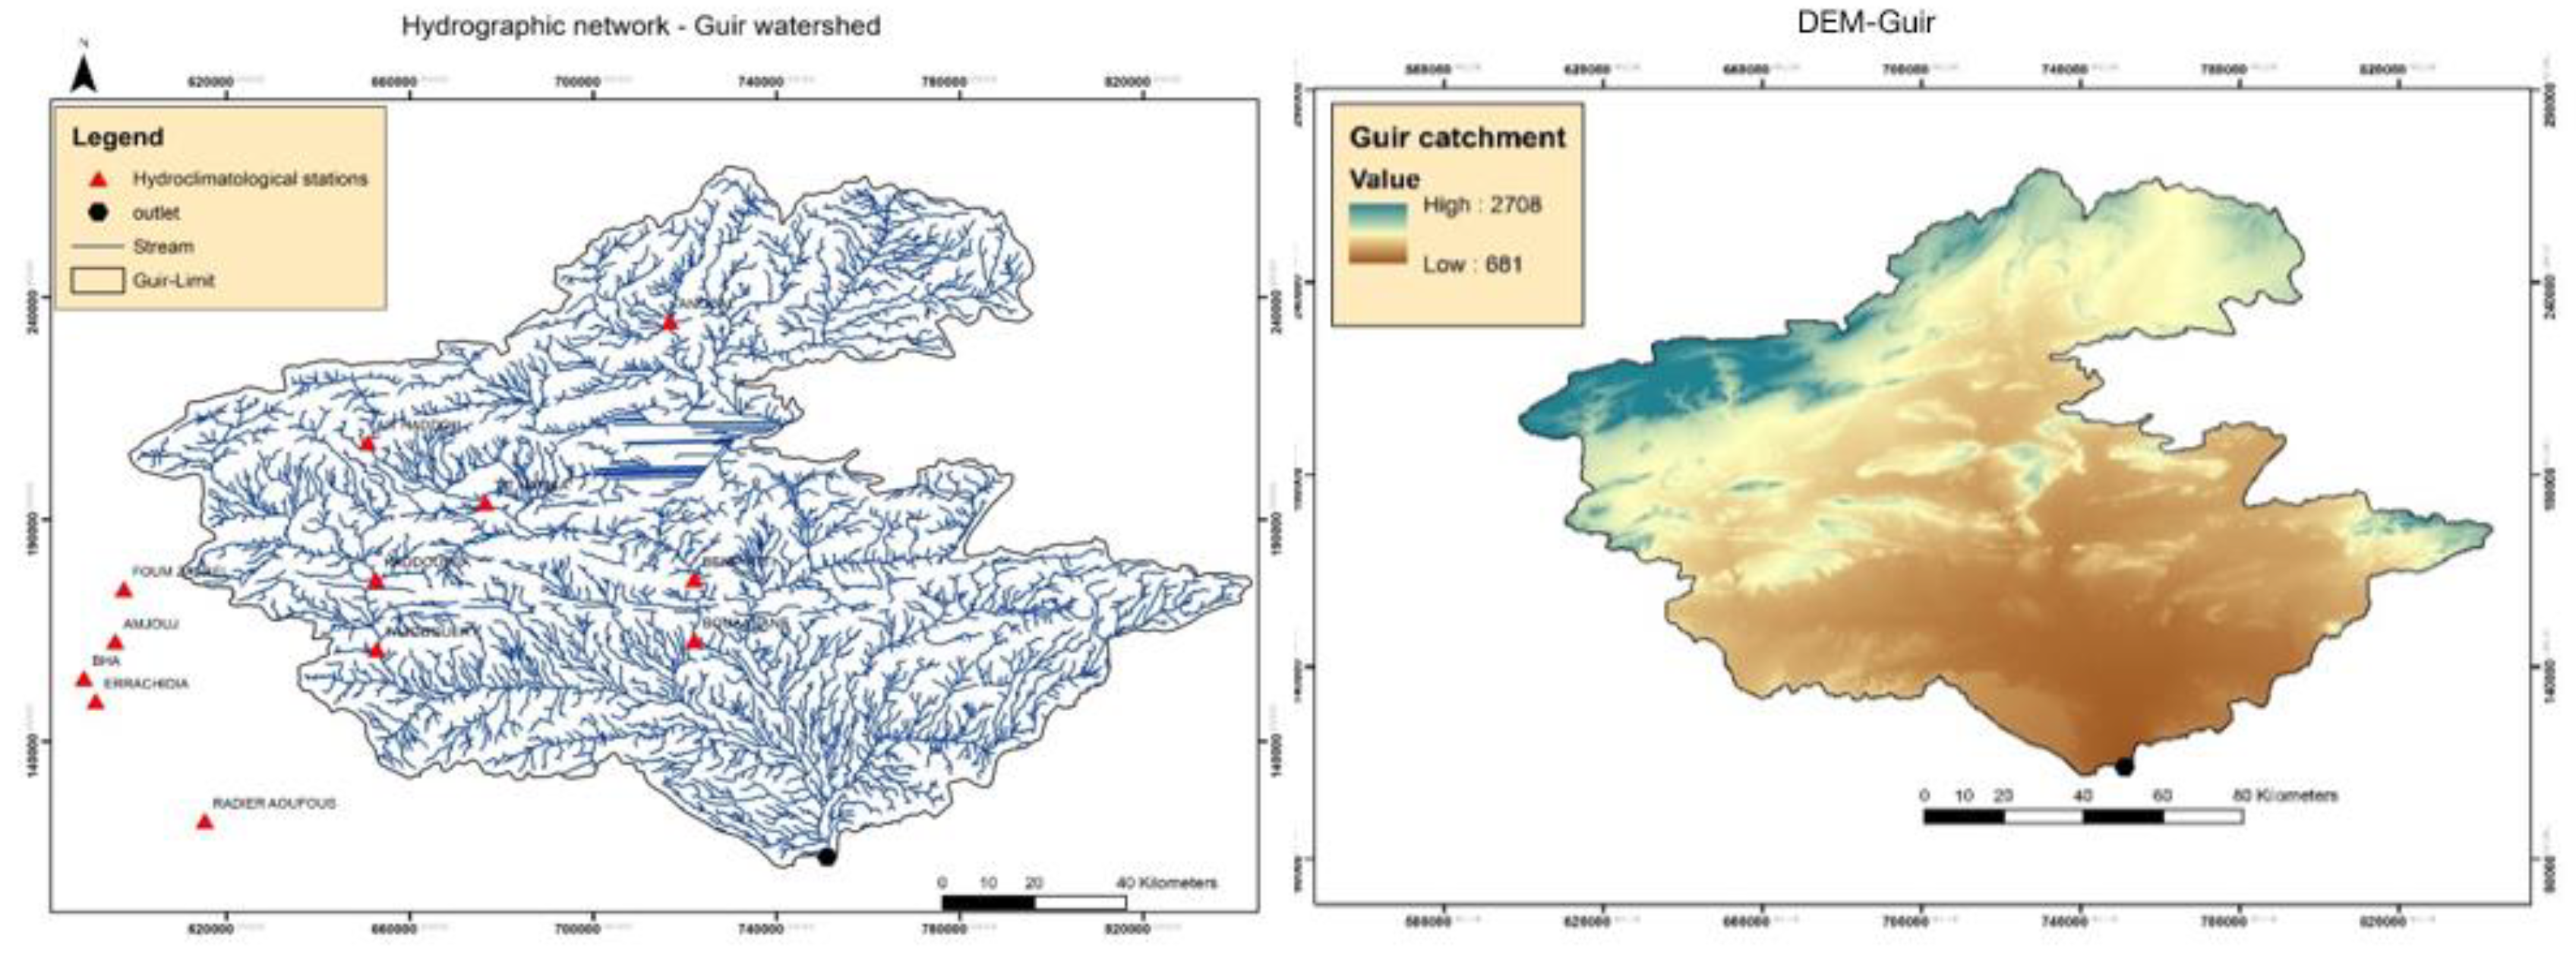
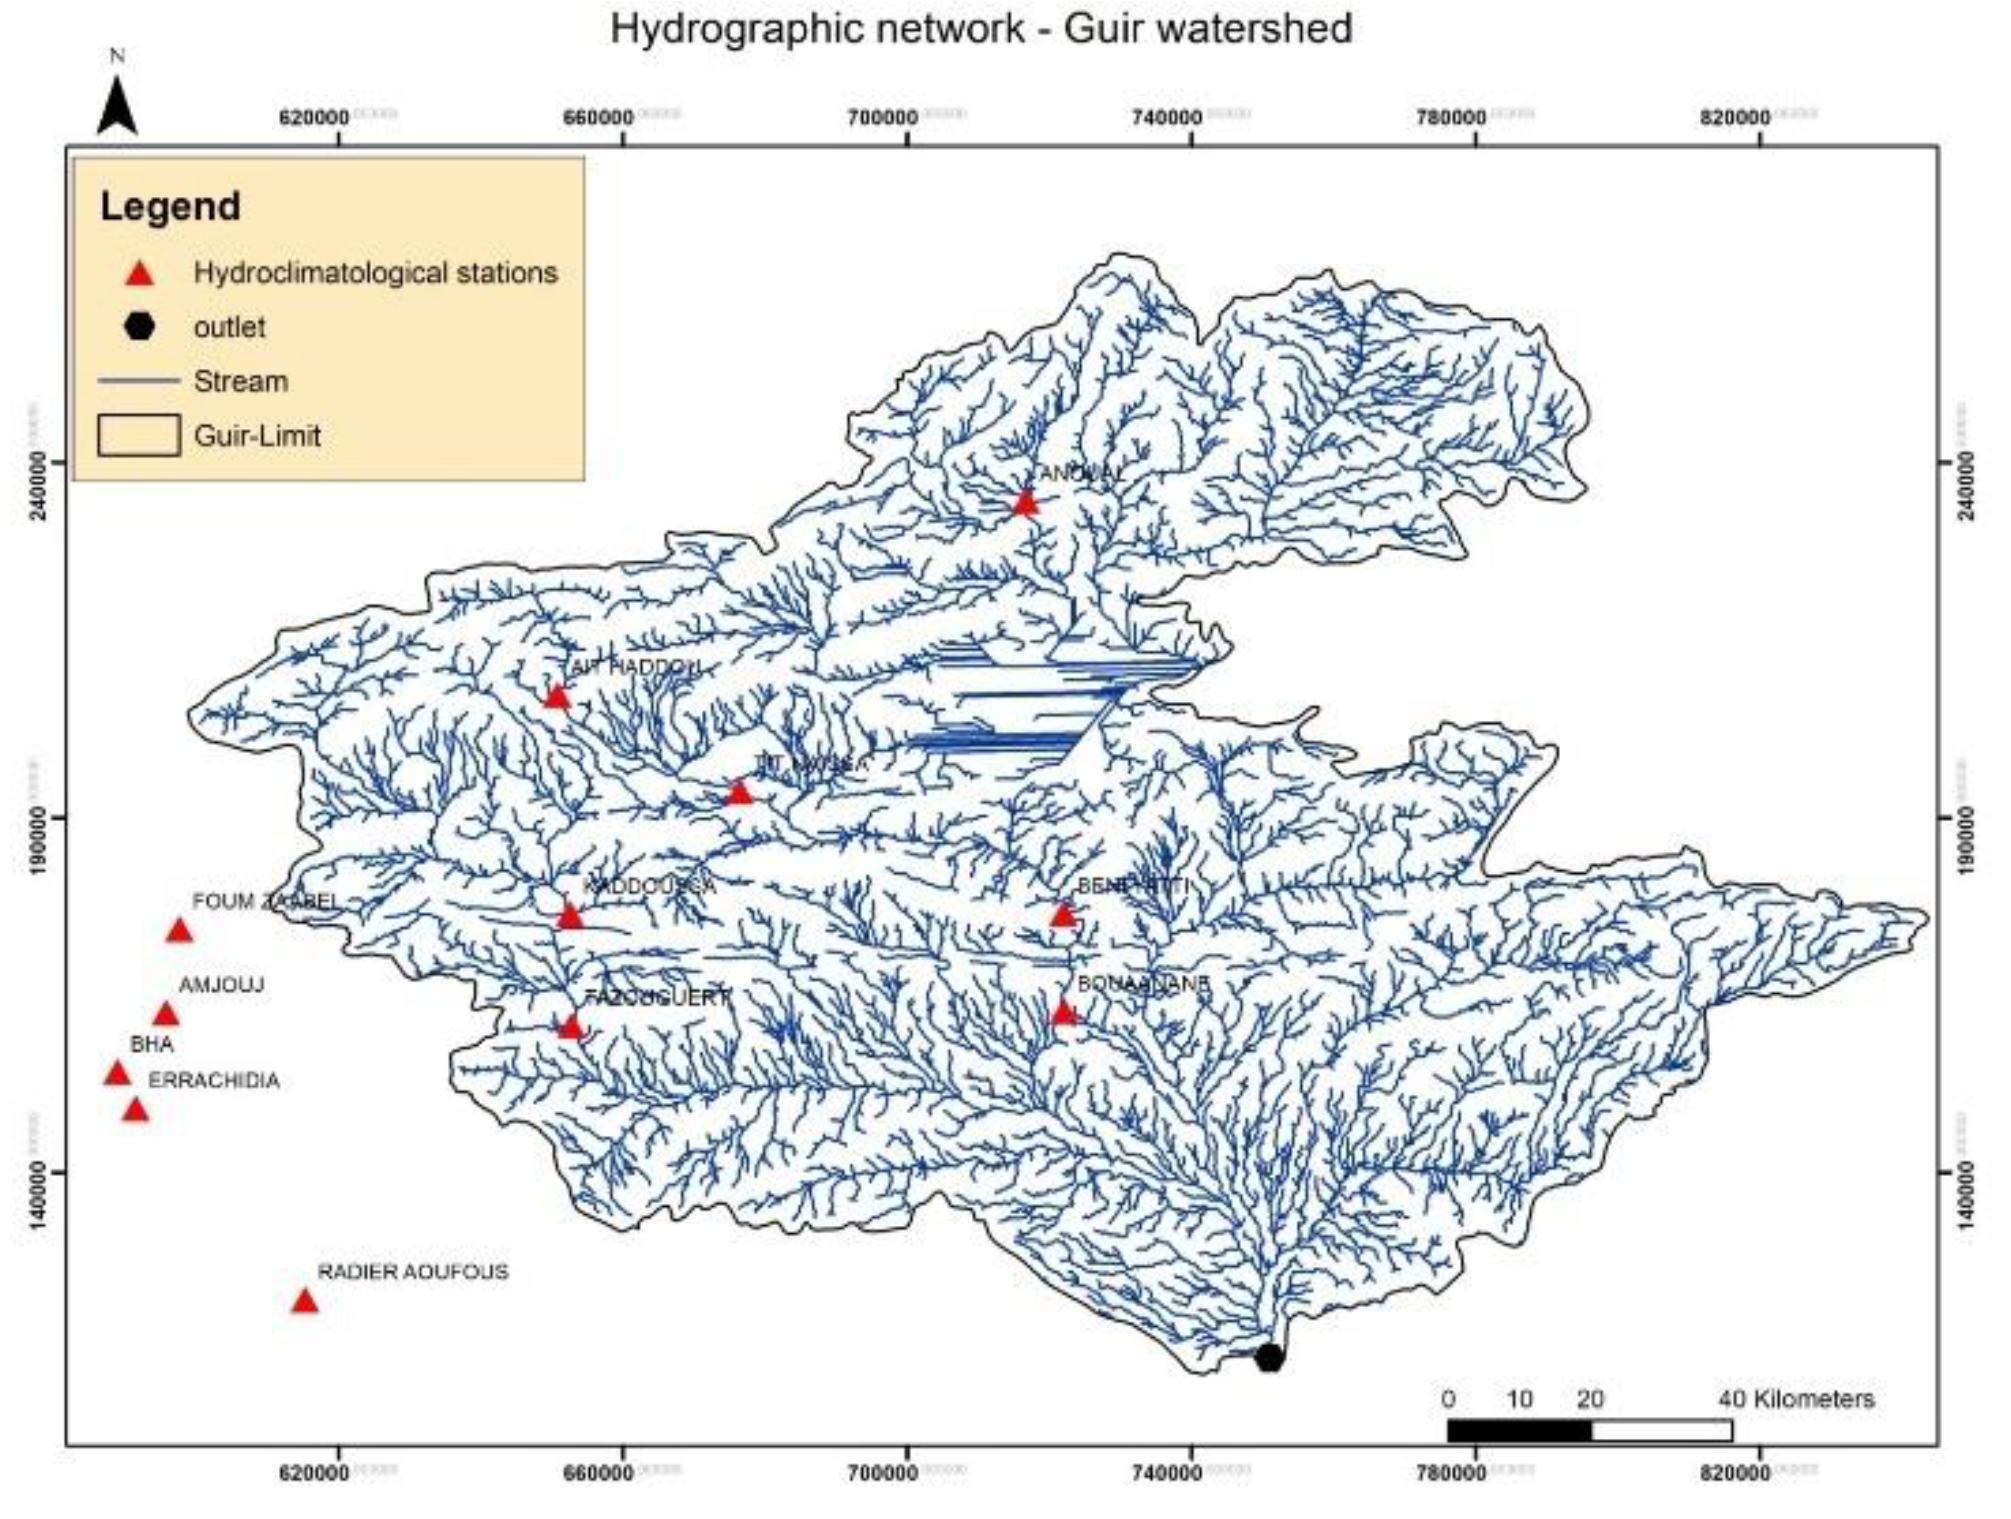
The hydrographic network of the Boudenib Oasis is sustained by the Guir and Bouanane river catchments (Figure 2). These rivers originate in the High Atlas Mountains and continue eastward toward Algerian territory. They feed rivers, canals, and khettaras (traditional subterranean irrigation channels), which play a vital role in sustaining date palm groves and other crops [12]. The Guir catchment covers approximately 19,000 km², with multiple hydrometric and climatological stations used for surface-water monitoring. Average annual precipitation is about 400 mm yr⁻¹, and only 5 % of the basin’s total area is devoted to agriculture.
The upper basin of the Guir watershed lies within a semi-desert bioclimatic zone, where temperatures exhibit pronounced seasonal variation, with hot summers and cold winters. The rainfall regime is marked by two distinct rainy seasons—autumn and spring (Figure 3)—with mean annual precipitation of ≈ 250 mm in the upper basin and ≈ 112 mm downstream [13,14].
The climate of the study area is classified as semi-desert (Saharan) with a strong continental influence [15]. Rainfall is irregular and unevenly distributed throughout the year. Rainy periods generally occur in October–November, January–February, and April–May, (figure4), while the remaining months are dry for five months or more [15]. Despite the overall rainfall deficit, several perennial sources help sustain streamflow (Figure 3). The Aït N’Aissa River, the main tributary of the Bouanane, receives significant inflows from perennial springs, ensuring a sustainable baseflow. The Guir and Bouanane rivers converge within the Errachidia–Boudenib basin, and the Guir subsequently exits Moroccan territory downstream of Aïn Chouater [15].
Figure 4.
(A) rainfall vs monthly temperature (2018) (B) Actual rainfall vs evaporation and evapotranspiration (2018) [13].
Figure 4.
(A) rainfall vs monthly temperature (2018) (B) Actual rainfall vs evaporation and evapotranspiration (2018) [13].
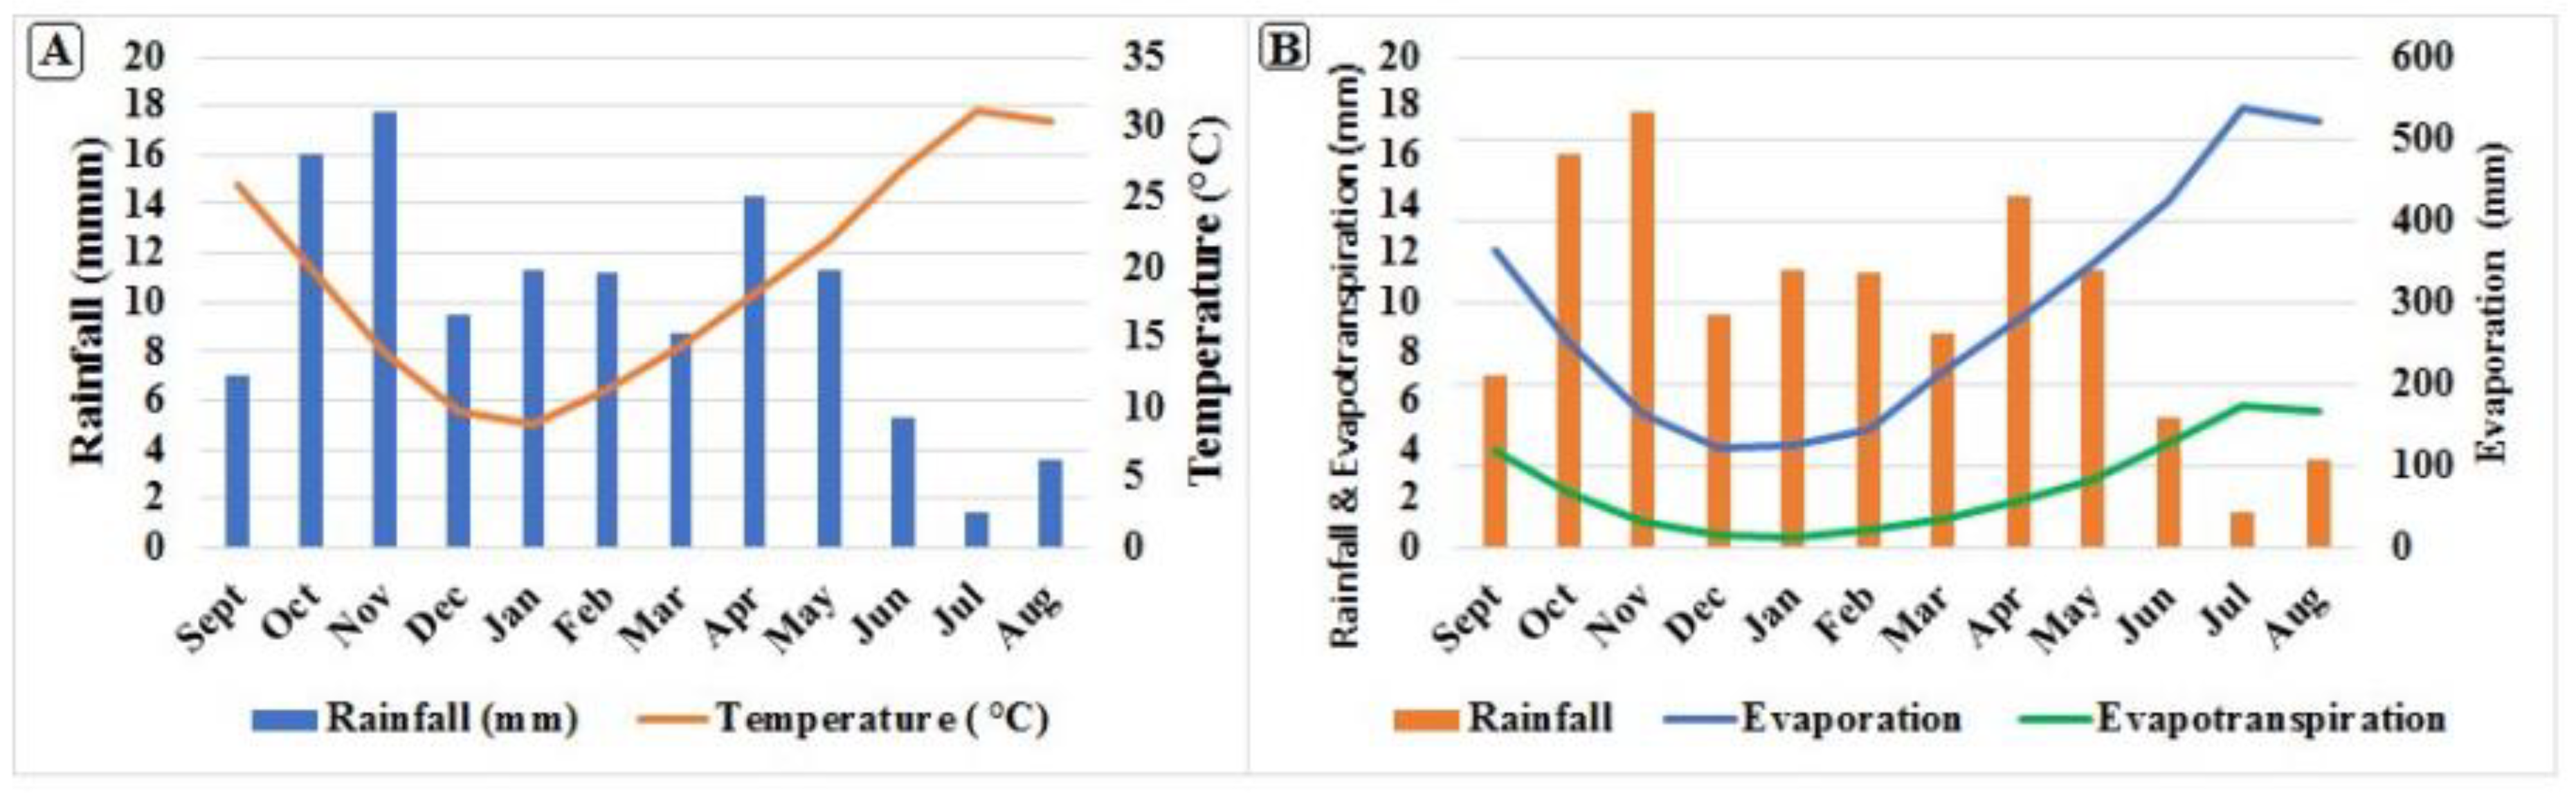
Meteorological records reveal high interannual rainfall variability. The periods 1997–2002 and 2005 were characterized by markedly dry conditions, with total precipitation far below the long-term average, whereas 1994–1996 and 2009 recorded higher rainfall totals, exceeding 1,000 mm at most stations in the basin [13]. The rainfall regime is highly variable, and annual deficits may reach up to 90 % (figure5), resulting in rapid depletion of both surface- and groundwater resources [13].
Figure 5.
DEM and the hydrographic network of GUIR watershed.
Prolonged lack of precipitation leads to meteorological drought, and when these deficits extend to rivers and aquifers, they cause hydrological drought due to reduced discharge and groundwater levels [10,16]. Such conditions can further evolve into socioeconomic drought, when water shortages significantly affect local livelihoods and economies (World Meteorological Organization, 1990).
Long-term climate analyses in Morocco indicate increasing spatial and temporal variability in precipitation, rising average temperatures, and more frequent droughts over recent decades [17,18]. These observed trends underscore the vulnerability of the Guir watershed to climate change and the need for improved hydrological modelling to support sustainable water resource management in this arid region.
2.2. Methodology and Datasets
2.2.1. SWAT+ Model Set Up
To investigate the hydrological response of the Guir watershed to climate change (CC), we set up a SWAT model that was subsequently driven by an ensemble of bias-adjusted global climate models to simulate the hydrological cycle under a range of CC scenarios [19].
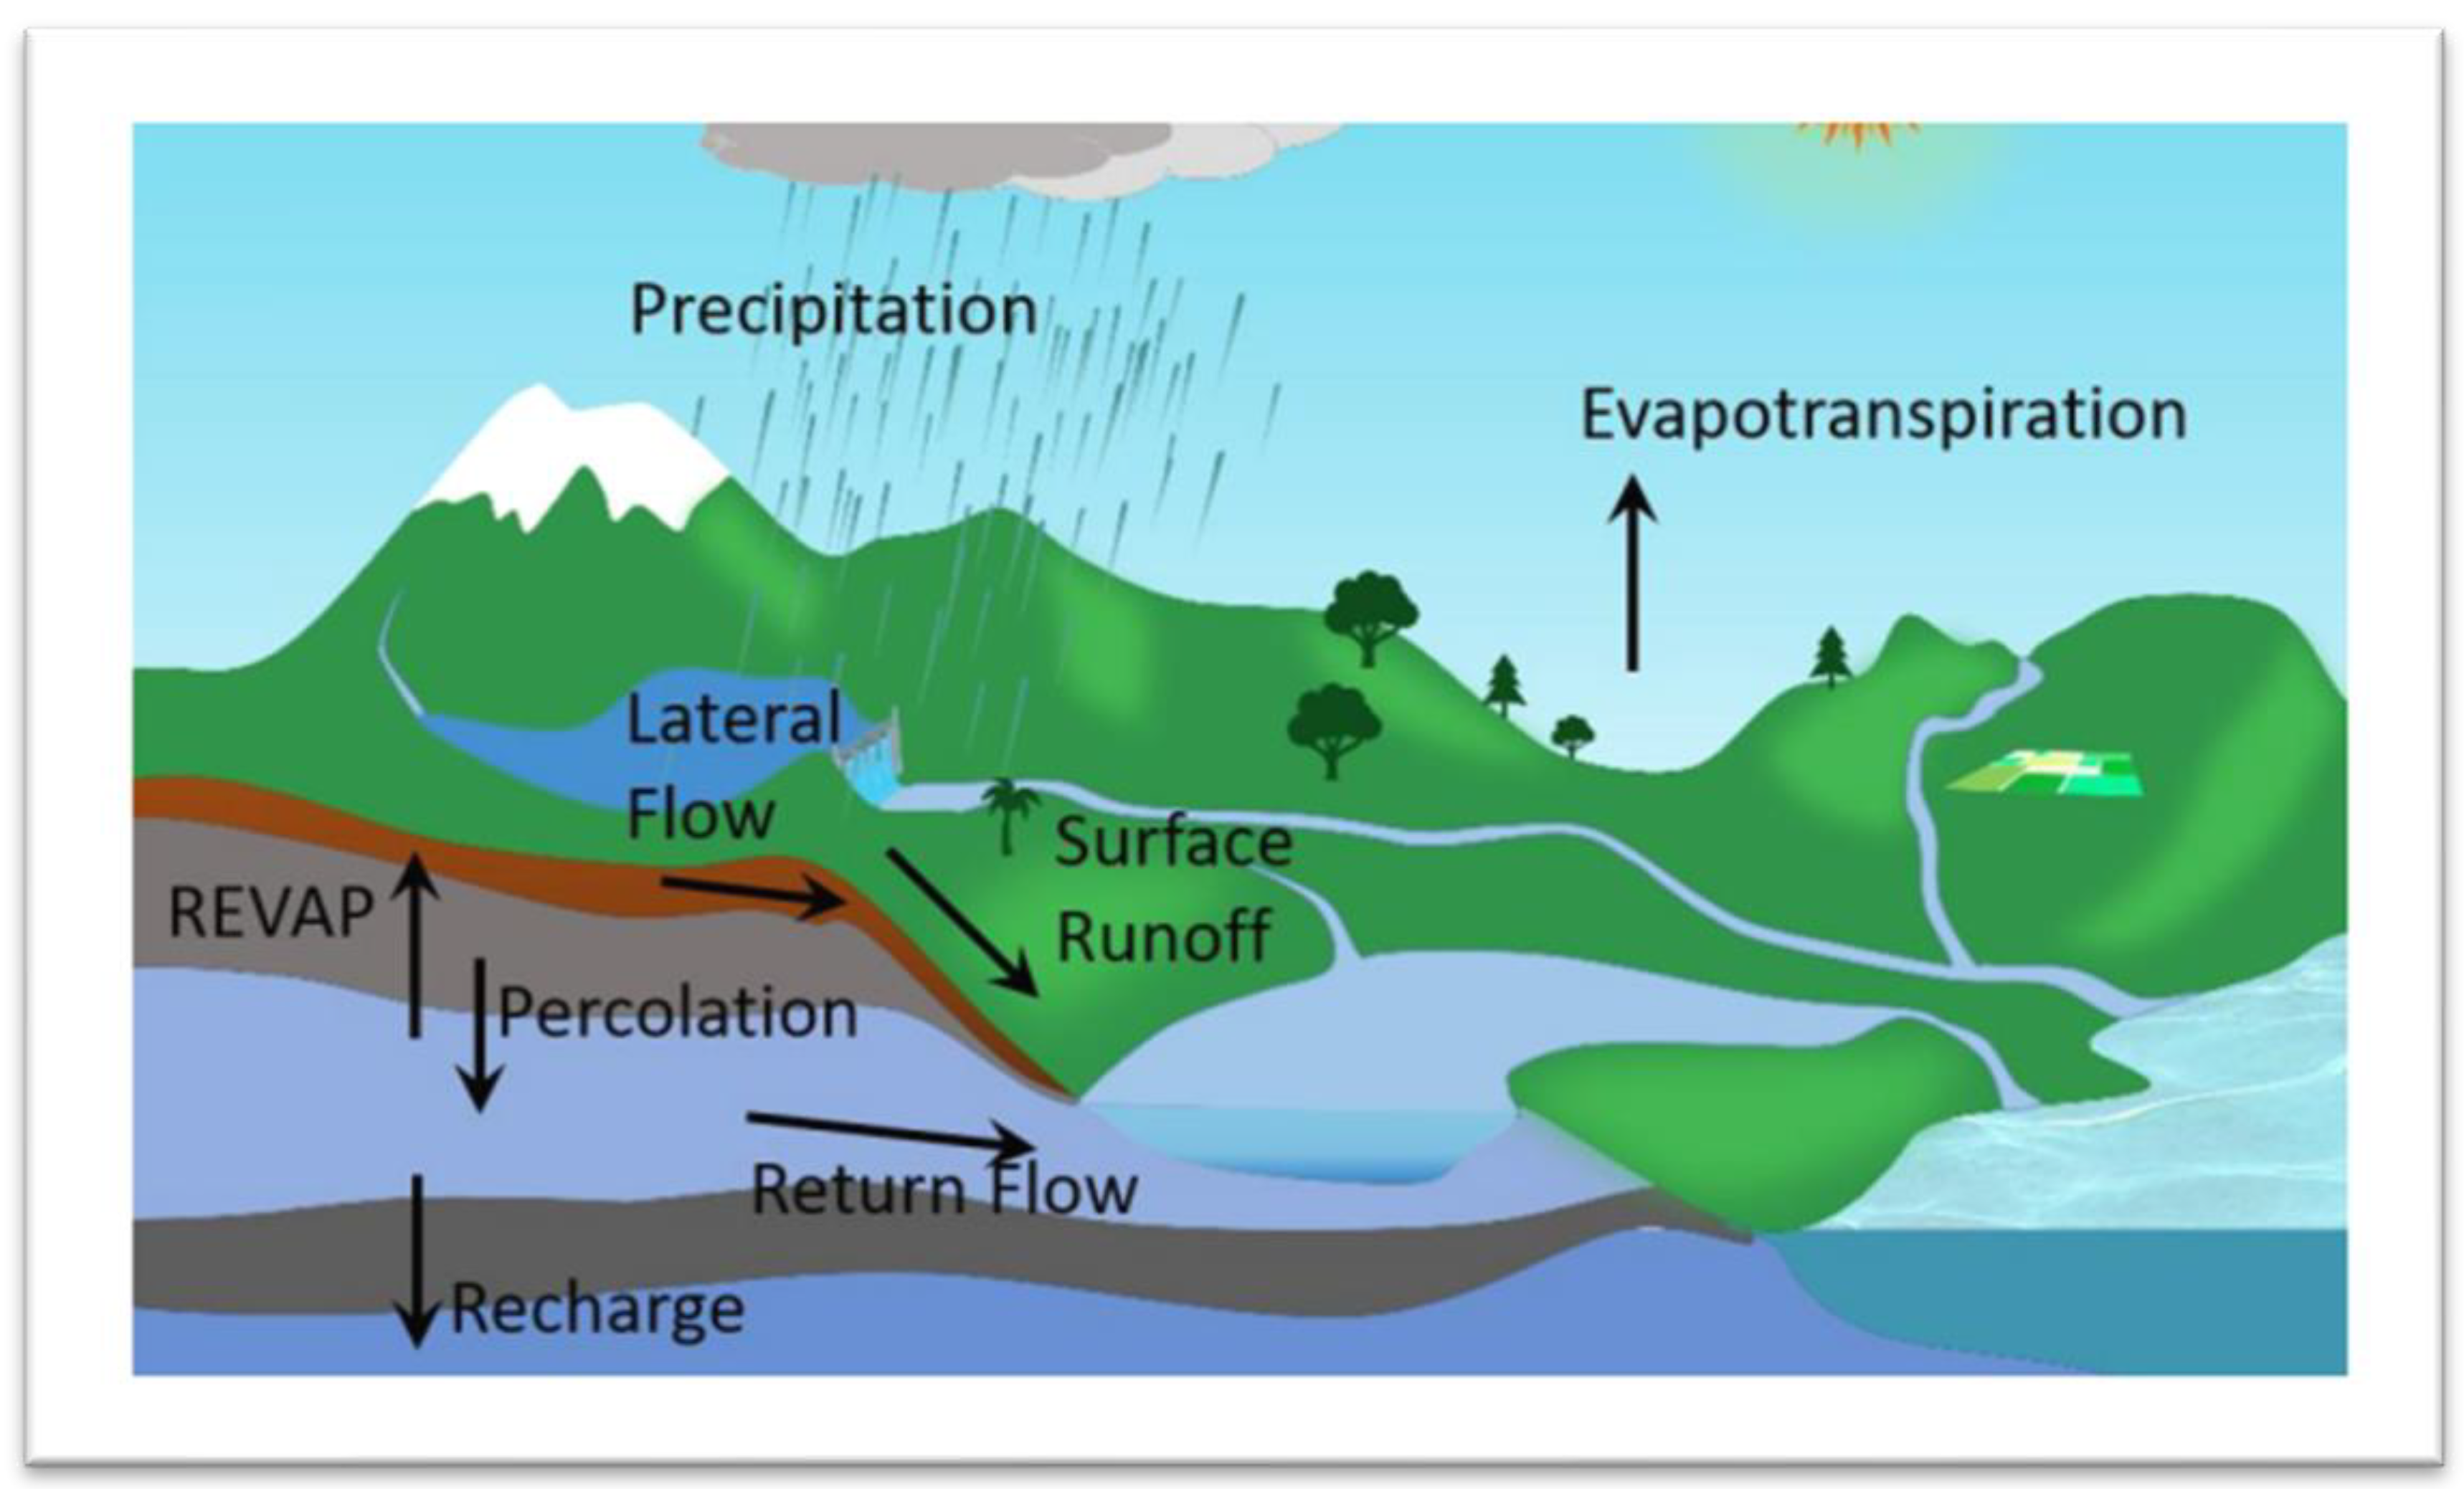
In SWAT, a watershed is divided into sub-basins based on topography, and each sub-basin is further subdivided into Hydrologic Response Units (HRUs), which represent unique combinations of soil, land use, and slope [20]. Calculations are performed at the HRU level, where water, nutrients, and sediment fluxes are computed independently(figure6), aggregated at the sub-basin scale, and then routed through the channel network toward the main outlet [21].
The Soil and Water Assessment Tool (SWAT) [21] is a time-continuous, process-based catchment hydrological model (CHM) that simulates the impact of land management on water, sediment, and agricultural chemical yields in large, complex watersheds. SWAT represents hydrological processes using the governing equations of motion [22]. It estimates evapotranspiration (ET) using the Penman–Monteith, Priestley–Taylor, or Hargreaves methods, while surface runoff and infiltration are computed using the Soil Conservation Service (SCS) Curve Number [23] and Green and Ampt methods [24].
Figure 6.
Schematic representation of the SWAT model water balance (REVAP is a process whereby water moves from the shallow aquifer into the overlying unsaturated zone).([19]).
Figure 6.
Schematic representation of the SWAT model water balance (REVAP is a process whereby water moves from the shallow aquifer into the overlying unsaturated zone).([19]).
SWAT relies on the physical characteristics of the catchment to assess the impact of land use, soil, topography, and management practices on hydrological processes [19]. The model requires data on soil, weather, land use, management, and topography as inputs.
SWAT+ Model Configuration:
SWAT+ is a revised and extended version of SWAT that offers enhanced flexibility in defining spatial units and management operations(figure7). It applies at the catchment scale to simulate both surface-water quantity and quality. SWAT+ improves representation of landscape processes, overland flow routing, and floodplain interactions, enabling a more detailed analysis of hydrological connectivity [21]. Decision tables in SWAT+ allow the implementation of complex conditional management rules (e.g., crop types, irrigation triggers, or reservoir operations) based on environmental or operational thresholds [25]. These tables and management schedules increase the model’s flexibility in simulating land and water management practices compared with traditional hydrological models.
While SWAT+ uses the same fundamental equations as SWAT, it introduces several structural enhancements:
SQLite database architecture (instead of Access), facilitating large data handling.
Connect files to improve spatial linkage between model components; and Landscape Units (LSUs) to separate upland processes from floodplain and wetland dynamics [21].
In this study, SWAT+ was used instead of the original SWAT for two main reasons:
- it manages large datasets more efficiently due to its SQLite-based structure, and
- it incorporates a plant community module that allows simulation of multiple crop types (e.g., date palms) within the same HRU.
The inclusion of decision tables and management schedules enhanced the model’s flexibility in representing basin-scale agricultural and irrigation practices. The crop parameter database was updated to include palm trees as a new vegetation class, ensuring the model could simulate oasis ecosystems based on LU–LC management tables.
Model Implementation and Spatial Discretization:
The model was developed using the QGIS SWAT+ (QSWAT+) interface, operating at a daily time step. QSWAT+ extends QSWAT functionalities with improved creation of LSUs and spatial configuration flexibility. The model was parameterized using the Shuttle Radar Topography Mission (SRTM) Digital Elevation Model (DEM) [26].
The Guir watershed was discretized into 13 sub-basins, 49,688 HRUs, and 300 LSUs, with a threshold drainage area corresponding to 19,000 km². This spatial configuration allowed the model to capture fine-scale variability in topography, soil, and land use across the catchment.
Hydrological Process Representation:
The hydrological cycle in SWAT and SWAT+ is governed by the water balance equation (1) [20]:
where SW is the soil water content, “t” is time in days, and Rday, Qsurf, Ea, Wseep and Qgw are respectively, daily amounts of precipitation, surface runoff, evapotranspiration, water entering the vadose zone from the soil profile, and return flow (all units are in mm).
SWtSW_tSWt: soil water content at time t (mm);
SW0SW_0SW0: initial soil water content (mm);
RdayR_{day}Rday: daily precipitation (mm);
QsurfQ_{surf}Qsurf: surface runoff (mm);
EaE_aEa: evapotranspiration (mm);
WseepW_{seep}Wseep: percolation from soil to vadose zone (mm);
QgwQ_{gw}Qgw: return flow (mm).
A more general form of the water balance equation (2) is:
where SWt and SWo are the final and initial soil water content, respectively (mm/day); Vi is the amount of precipitation (mm/day); Qi is the amount of surface runoff (mm/day); Ei is the amount of ET (mm/day); Pi is the amount of percolation (mm/day); QRi is the amount of return flow (mm/day); and ∆t is change in time (day) and i is the index.
Land-Use Data Integration:
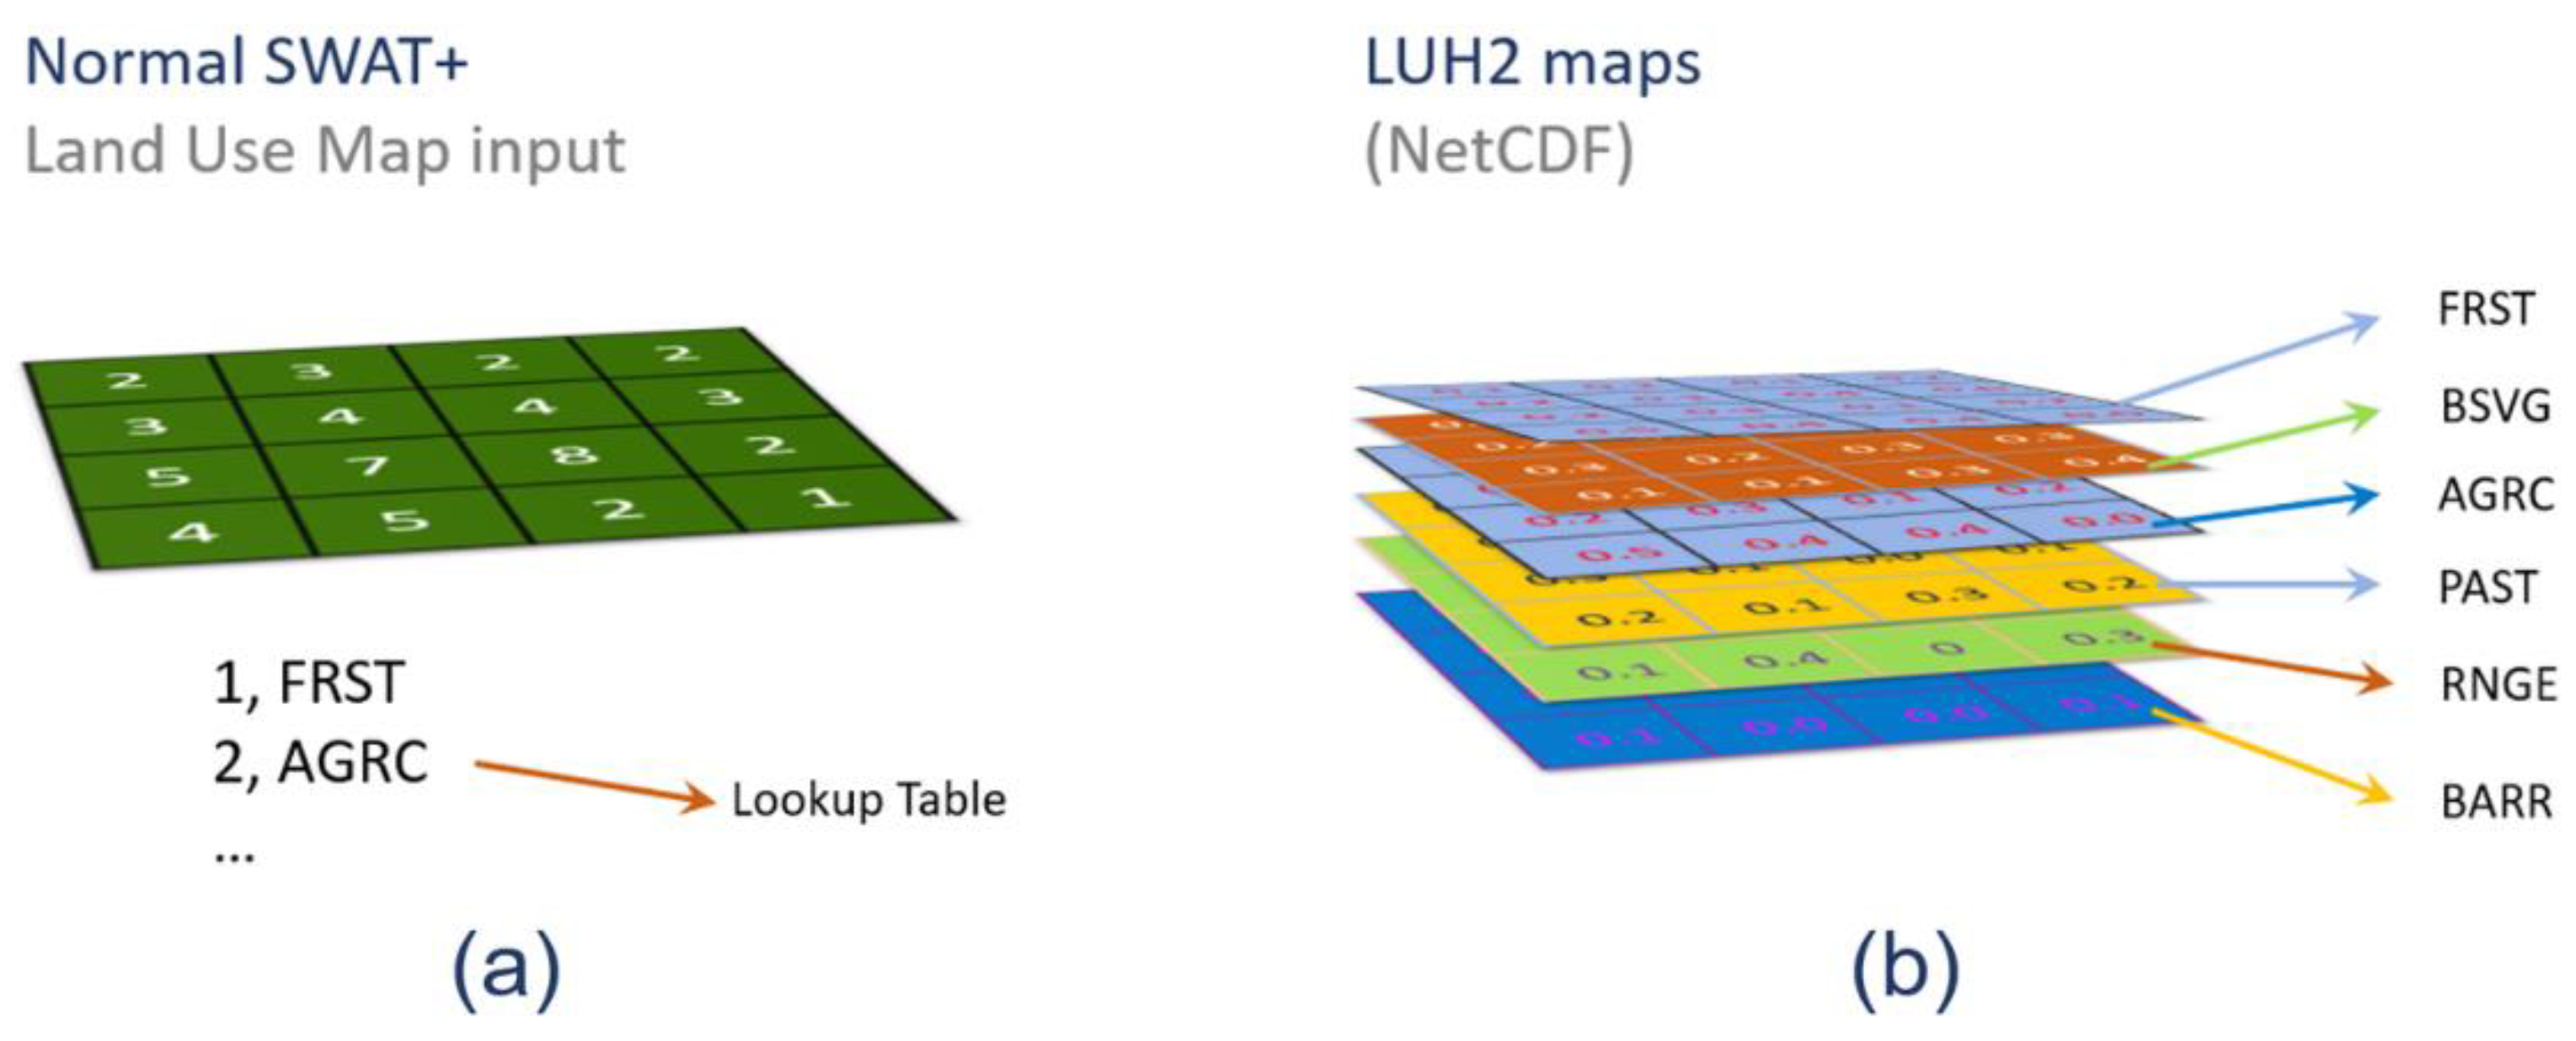
Land-use information was derived from the Land-Use Harmonization Project 2 (LUH2) dataset [26]. Since LUH2 data are provided in NetCDF format, where each layer represents the proportional area of a specific land-use class, the dataset could not be directly imported into QSWAT+.
To integrate LUH2 data, the QSWAT+ code was modified to include routines capable of reading NetCDF files. A placeholder raster matching the LUH2 grid dimensions was created to define HRUs. Each raster cell was assigned a unique identifier, ensuring one-to-one correspondence with LUH2 pixels. Initial HRUs were later subdivided according to the land-use proportions in the LUH2 dataset, allowing fractional representation of mixed land uses within each pixel.
Figure 7.
Contrast between the raster format accepted by QSWAT+ interface and the Format of Land Use data from the Land Use Harmonisation Project 2 (LUH2) [26,41].
Model Objectives and Applications
Hydrological models such as SWAT and SWAT+ are widely used to generate future climate change scenarios and to quantify water resources under different climatic and land-use conditions [19].
The objective of this study is to quantify the potential impacts of climate change on two key hydrological parameters—precipitation (P) and actual evapotranspiration (ETR)—in the Guir catchment. These two parameters, previously simulated using SWAT+, are essential for assessing surface-water availability for palm-tree irrigation.
2.2.2. Global Datasets and Inputs Used for SWAT+ Model and Climate Change Scenarios
For the modelling period, 31-year simulations were conducted for both the historical period (1984–2015) and the future period (2070–2100). The input datasets used in the SWAT+ model were all freely available and are summarized as follows:
- (a)
- Digital Elevation Model (DEM):
The topographic data were obtained from the Shuttle Radar Topography Mission (SRTM) [35] (available at: http://dwtkns.com/srtm). The DEM was used to delineate the watershed and define drainage patterns and sub-basin boundaries.
- (b) Land Use/Land Cover:
Land-use data were acquired from the European Space Agency (ESA) WorldCover dataset at 20 m resolution (https://esa-worldcover.org/en). The map was used to define vegetation and land-use classes within the Guir watershed for HRU generation.
- (c) Soil Data:
Soil information with a spatial resolution of 250 m × 250 m was obtained from the Africa Soil Information Service (AfSIS) [27]. Detailed soil hydraulic properties required for SWAT+ were derived from AfSIS data using Saxton and Rawls (2006) pedotransfer functions [28].
- (d) Meteorological Data (Historical Period):
Daily weather forcing data were taken from the EartH2Observe, WFDEI and ERA-Interim data Merged and Bias-corrected for ISIMIP (EWEMBI) dataset (Lange, 2016), available through the Inter-Sectoral Impact Model Intercomparison Project (ISIMIP). The dataset provides daily records of precipitation (kg m⁻² s⁻¹), minimum and maximum temperature (K), solar radiation (W m⁻²), wind speed, and relative humidity (%) from 1979 to 2016, at a 0.5° spatial resolution.
Although this coarse resolution may not capture fine-scale topographic variability, it remains adequate for large catchment-scale hydrological modelling [28].
The SWAT+ model was generated using these global datasets for the period 2014–2018, based on data from seven meteorological stations in the Guir watershed(figure8) [16]. Due to limited availability of discharge data, calibration focused on precipitation and evapotranspiration (ET) variables.
- (e) Climate Change Scenarios (Future Period):
Future climate projections were obtained through ISIMIP3b, using bias-corrected outputs from five CMIP5 global climate models (GCMs):
GFDL-ESM2M, HadGEM2-ES, IPSL-CM5A-LR, MIROC5, and NorESM1-M [29].
Daily weather forcing variables (precipitation and temperature) were obtained at 0.25° resolution over the West Africa domain for the period 1981–2014 (reference) and the projection period 2070–2100, under the Representative Concentration Pathway (RCP 6.0).
These data were bias-corrected to match the statistical properties of the historical EWEMBI forcing, ensuring consistency with SWAT+ input formats.
Figure 8.
Meteorological stations used in SWAT+ model and climate change scenarios (Guir watershed).
Figure 8.
Meteorological stations used in SWAT+ model and climate change scenarios (Guir watershed).
Given the uncertainty inherent in coarse-resolution climate data and the lack of observed runoff series, hydrological simulations were evaluated at an annual time step. This approach reduces the propagation of daily-scale errors, particularly for precipitation (P) and evapotranspiration (ET) outputs.
2.2.3. Scenarios Setup
To assess the potential impacts of climate change (CC) on hydrological processes in the Guir watershed, 31-year simulations were performed for two distinct periods: historical (1984–2015) and future (2070–2100), with a one-year model warm-up.
Climate forcing data were obtained from Global Climate Models (GCMs), whose outputs are freely accessible through various climate data portals. Although some regional climate datasets (e.g., CORDEX) are available, their spatial resolution is often coarse for small-scale hydrological applications. Previous studies in the Tafilalet oasis region have used CORDEX data with limited local representation.
For this study, forcing data were derived from five bias-adjusted GCMs under the Coupled Model Intercomparison Project Phase 6 (CMIP6):
GFDL-ESM4, IPSL-CM6A-LR, MPI-ESM1-2-HR, MRI-ESM2-0, and UKESM1-0-LL, for both historical and future simulations under the Representative Concentration Pathway (RCP) 8.5).
RCP 8.5 represents a high-emission scenario characterized by minimal mitigation efforts and continuous greenhouse gas growth. This scenario is widely used to evaluate worst-case climate impacts, including extreme temperature increases, reduced precipitation, and rising sea levels. It provides a critical reference for assessing end-of-century risks (2070–2100) and developing adaptation strategies aligned with global policy frameworks, such as the Paris Agreement.
The selected GCMs represent five independent global institutions, offering structural diversity and methodological robustness. Their inclusion enhances the comprehensiveness of the analysis by reducing institutional bias and ensuring a broader representation of potential climate responses. These models have been validated in previous studies and are recommended for regional applications due to their reliable performance and data availability within the CMIP6 archive.
In total, 10 model simulations were conducted (Table 1) (five for the historical period and five for the future RCP 8.5 scenario), using EWEMBI global meteorological forcing as baseline input data for bias correction [29].
Scenarios methodology:
SWAT+ (Rev. 65) was employed to simulate both historical and future climate scenarios. Python scripting was used to automate the modelling workflow — including data preprocessing, simulation execution, and output post-processing — to enhance reproducibility and minimize manual errors.
The EWEMBI dataset [29], originally processed for ISIMIP2a, provides global meteorological data at 0.5° spatial resolution and daily temporal scale from 1979 onwards. It includes variables such as near-surface temperature, precipitation, relative humidity, specific humidity, air pressure, and snowfall. This dataset served as a foundation for bias-correcting GCM data and ensuring compatibility with the ISIMIP protocol.
Since the ISIMIP meteorological data were used as inputs for the SWAT+ model, the datasets were reformatted to align with SWAT+ input file structures.
For each GCM (both historical and RCP 8.5 scenarios), the meteorological files were automatically transformed via Python scripts to match the required SWAT+ “.txtinout” format.
The default SWAT+ model folder for the Guir watershed was duplicated across all GCM runs, and the corresponding weather data were replaced for each simulation (historical and RCP 8.5).
This enabled consistent execution of the 10 climate-driven simulations, generating separate hydrological outputs for each model configuration.
The simulations were run at yearly and annual-average temporal resolutions with fixed parameters:
Warm-up period: 1 year
Hydrological parameters: Precipitation (P), Evapotranspiration (ET), Runoff, Irrigation
Time period: Historical (1984–2015) and Future (2070–2100)
Although the full suite of hydrological outputs was produced, this study focuses specifically on precipitation (P) and actual evapotranspiration (ET) to quantify the projected impacts of climate change on surface-water availability in the Guir watershed.
3. Results and Discussion
3.1. Simulation of CC Impact on Precipitation P
The SWAT+ model was used to simulate the response of key hydrological parameters in the Guir watershed under changing climatic conditions. The model was configured to process outputs at two temporal resolutions—annual averages and yearly time steps—to capture both long-term climatic trends and inter-annual variability.
Although the model computes a wide range of hydrological processes, this study focuses primarily on precipitation (P) and actual evapotranspiration (ET), as these variables are fundamental to understanding the hydrological response to climate change (CC) in arid and semi-arid regions.
To assess the influence of climate change on precipitation patterns, simulations were performed using an ensemble of five bias-adjusted Global Climate Models (GCMs) under the Representative Concentration Pathway (RCP) 8.5 scenario. Each model was applied to both historical (1984–2015) and future (2070–2100) periods. This multi-model ensemble approach enables the evaluation of spatial and temporal variability in projected precipitation and provides a more robust estimation of potential CC impacts by accounting for inter-model uncertainty.
The resulting simulations reveal projected shifts in precipitation intensity, frequency, and distribution within the Guir watershed. By comparing historical and future model outputs at both annual and yearly time resolutions, the analysis captures both the overall climatic trend and short-term variability, offering a comprehensive picture of how rainfall dynamics may evolve under a high-emission climate trajectory.
These findings contribute to a more detailed understanding of the hydrological sensitivity of the Guir watershed to future climatic changes, emphasizing the importance of temporal resolution when assessing water resource vulnerabilities in arid regions.
3.1.1. Historical Yearly P
Figure 9.
Yearly Historical P using GFDL scenario for the period 1985-2015.
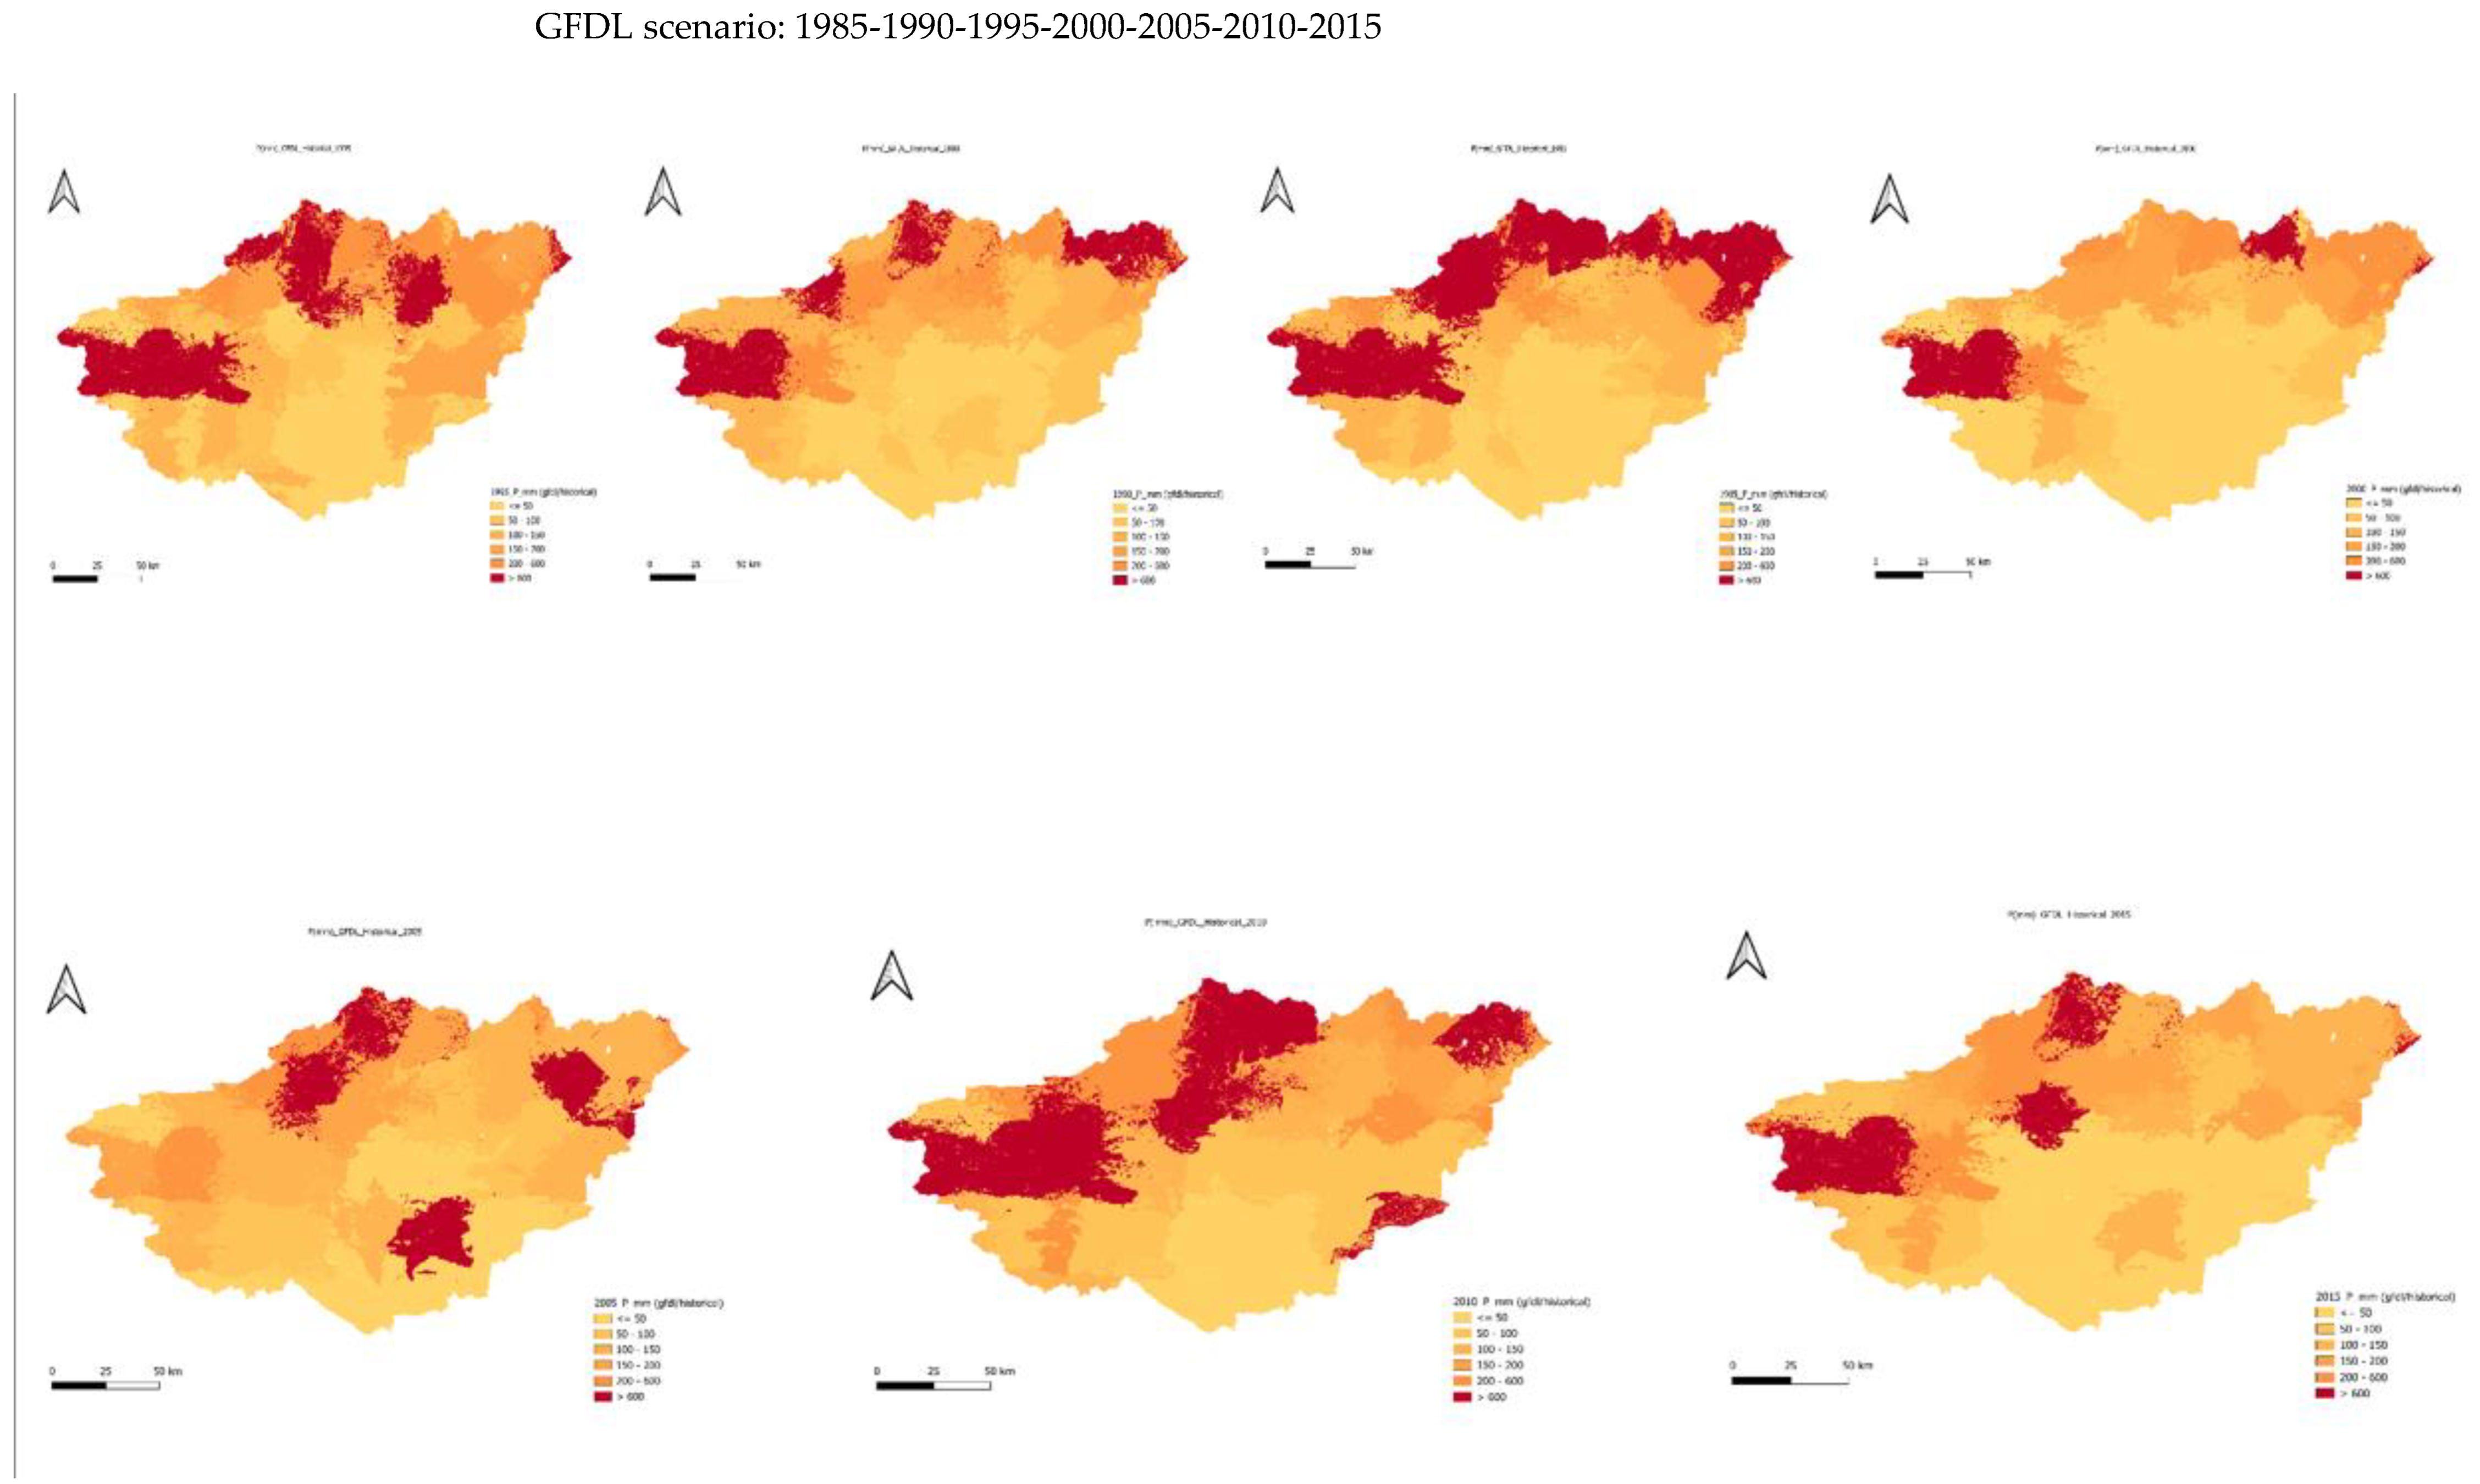
Figure 10.
Yearly Historical P using IPSL scenario for the period 1985-2015.
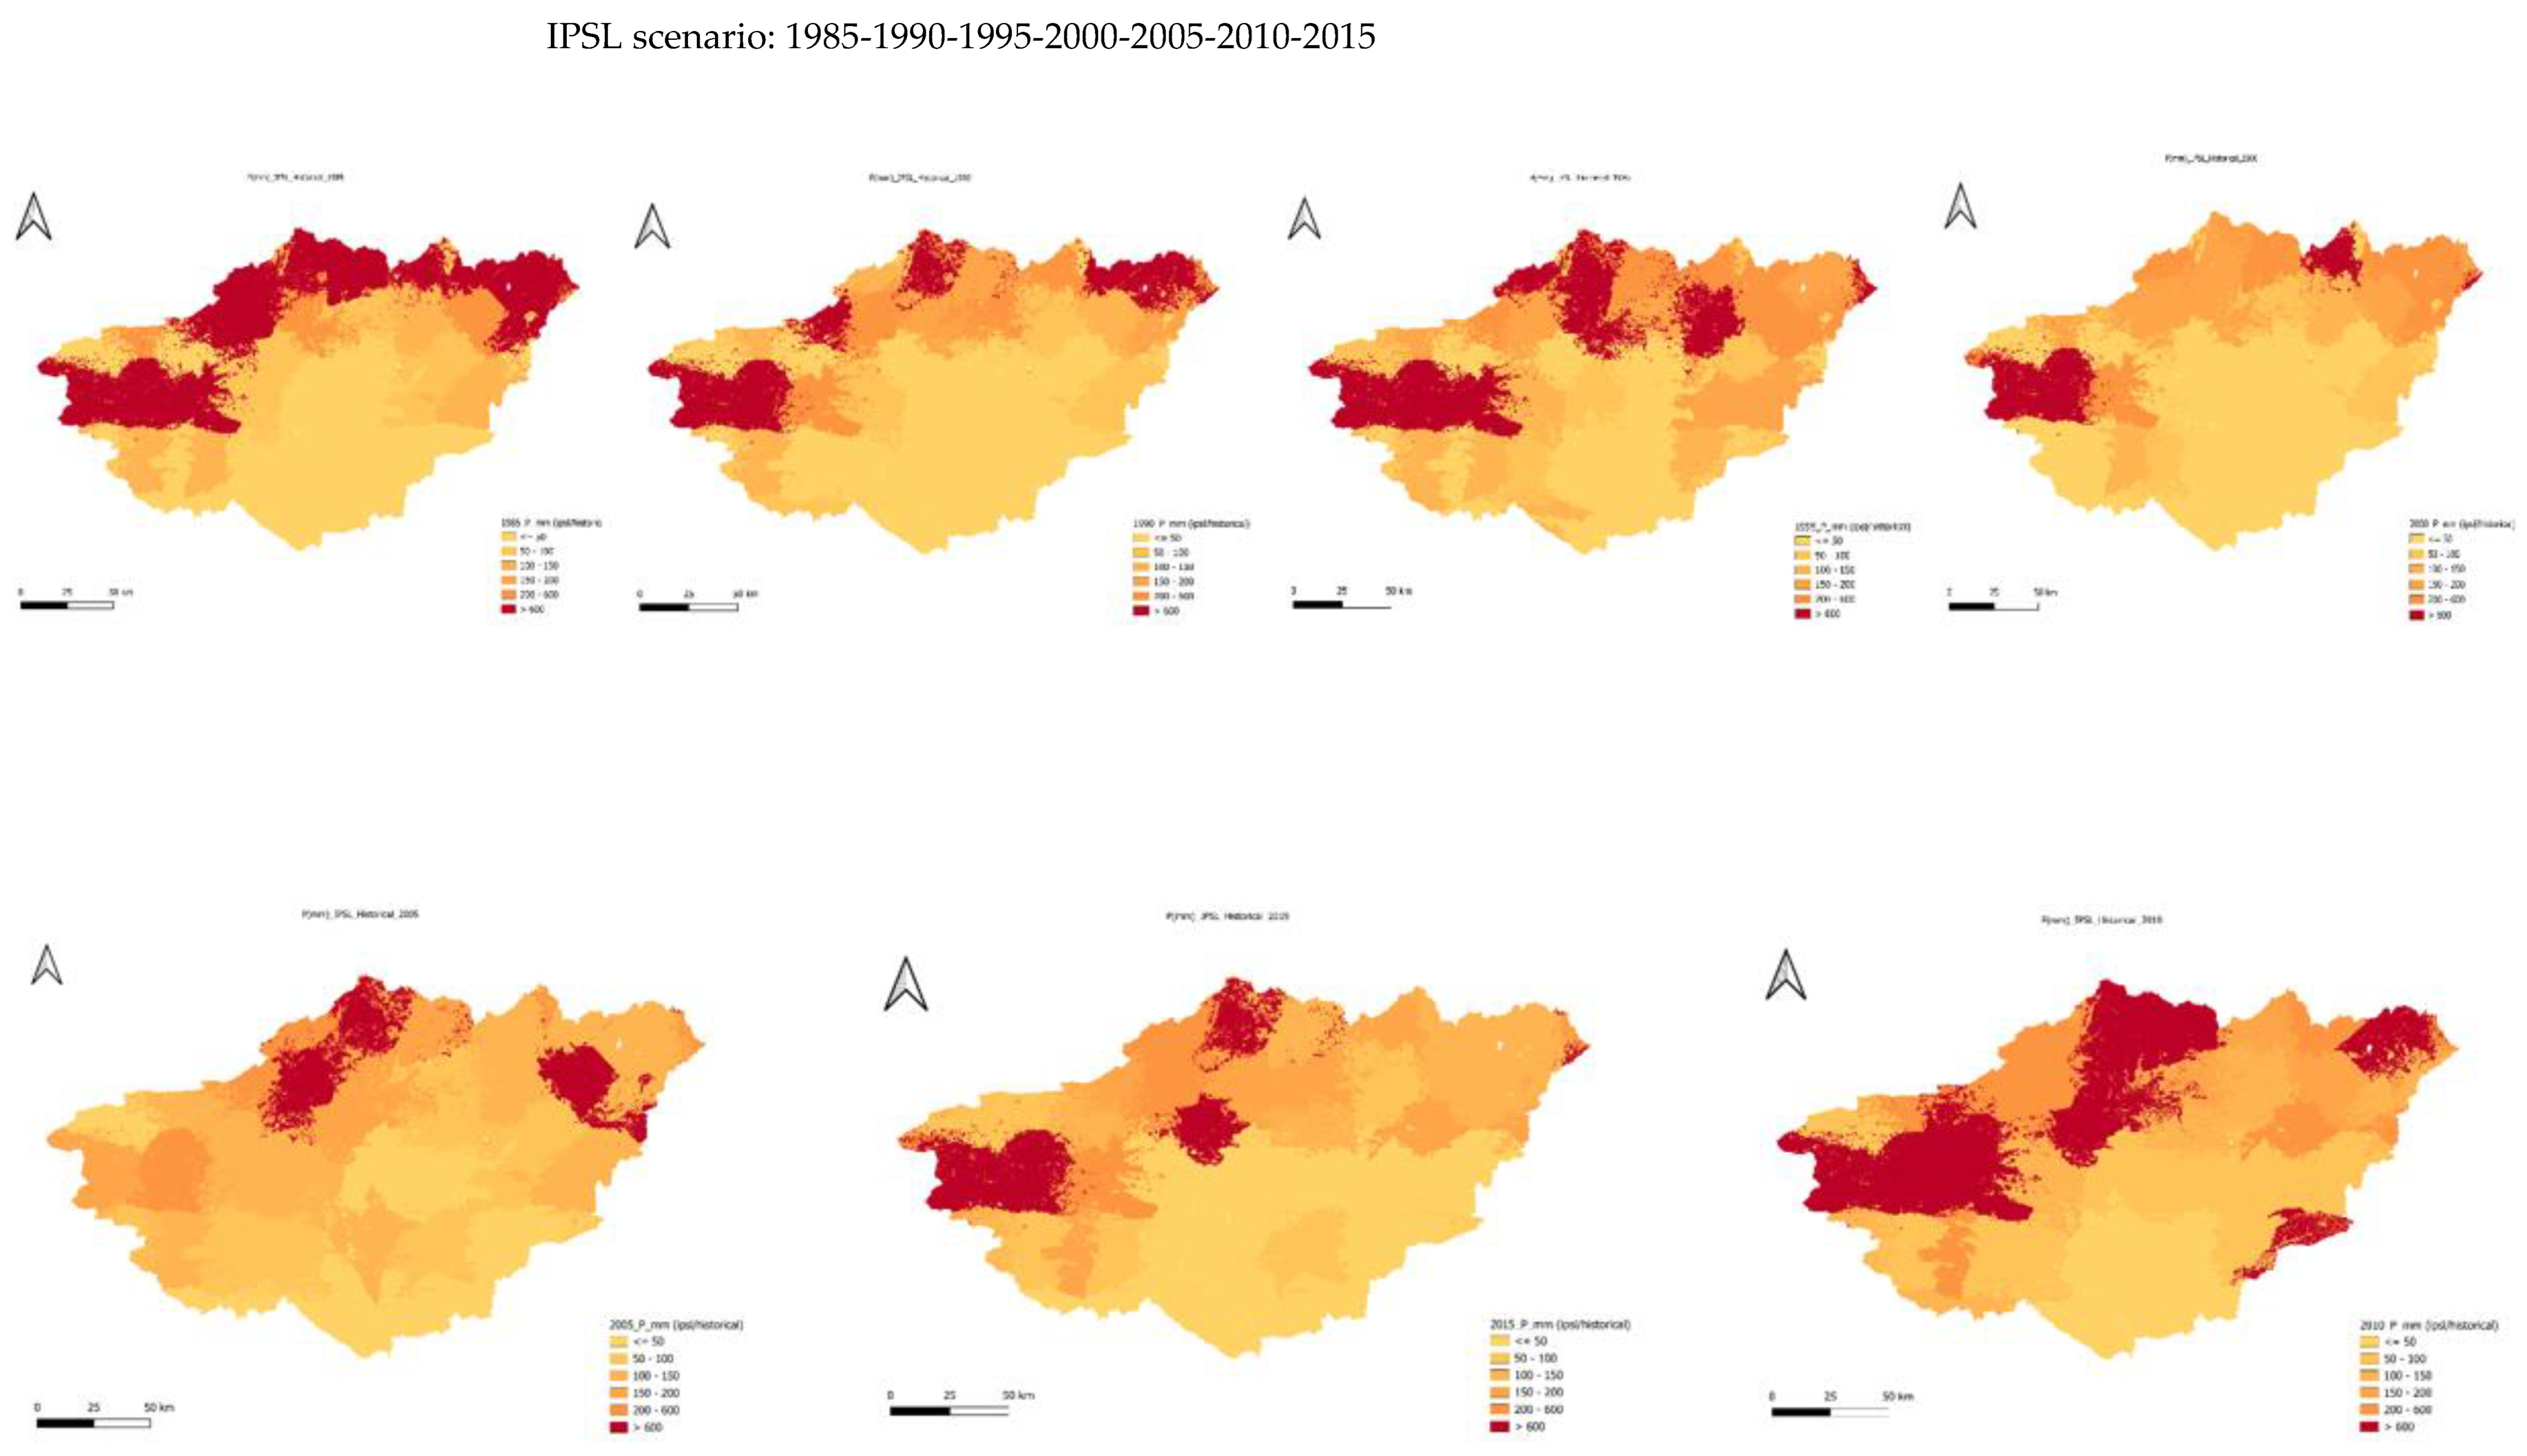
Figure 11.
Yearly Historical P using MPI scenario for the period 1985-2015.
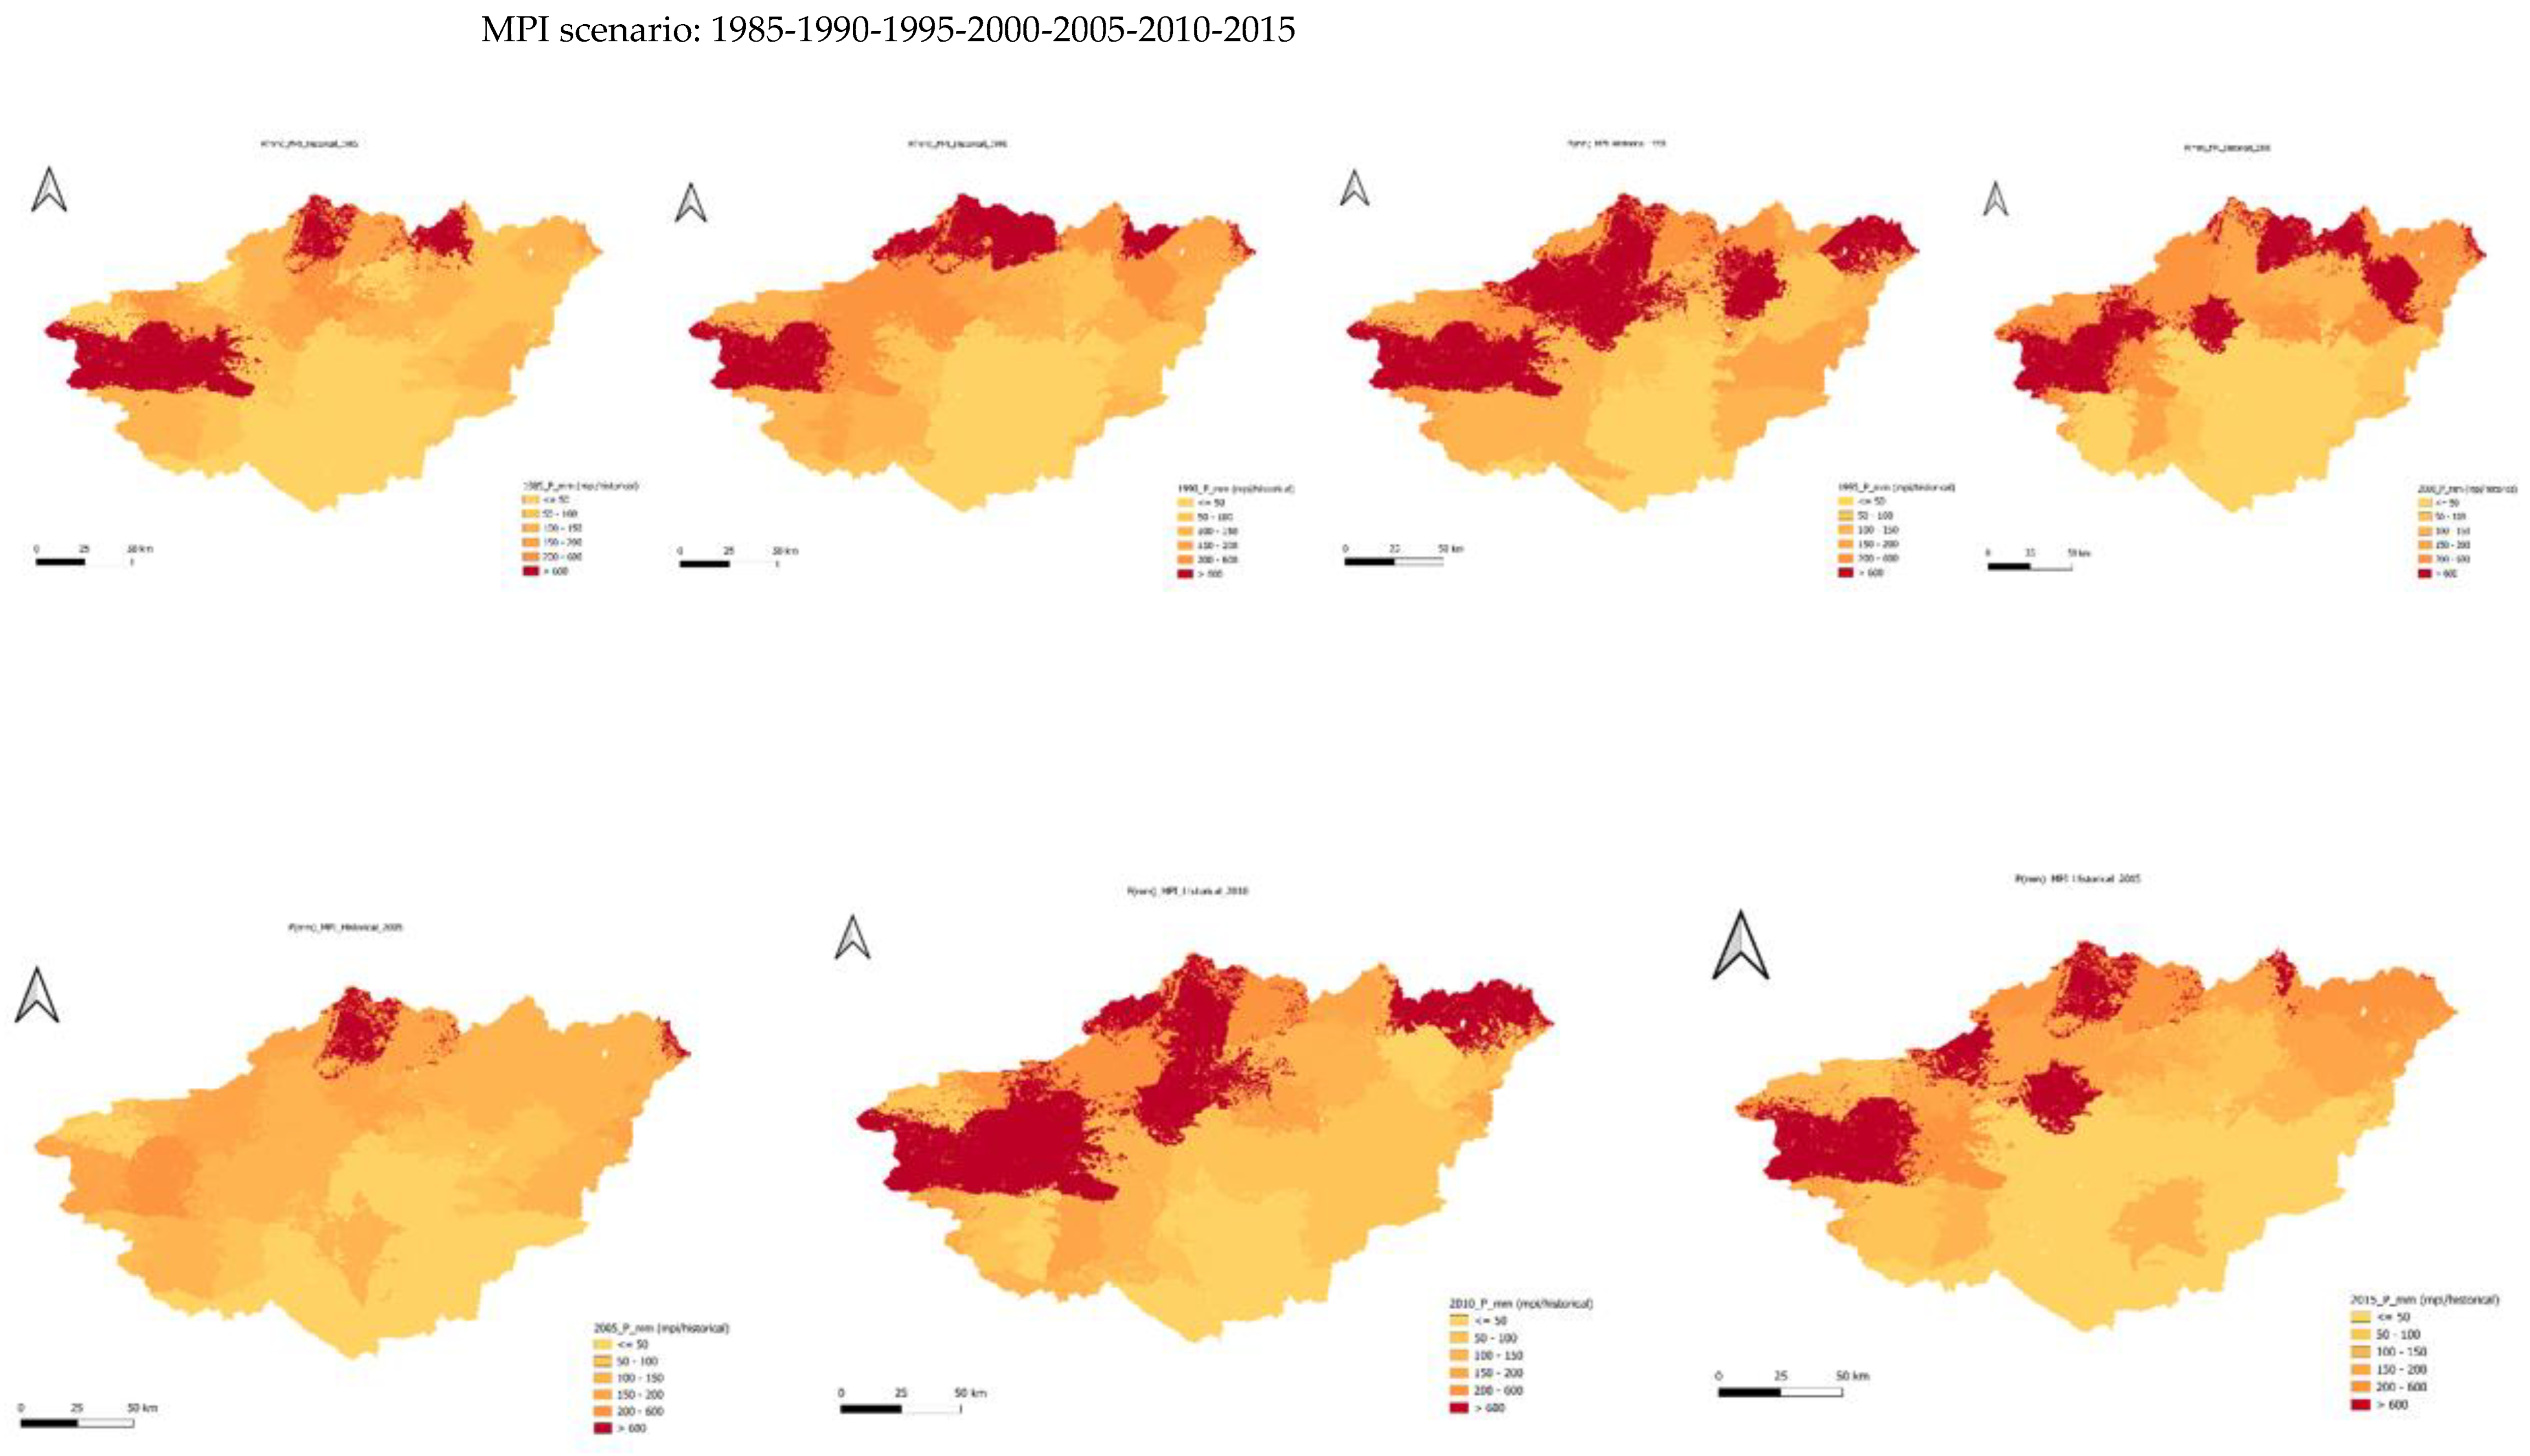
Figure 12.
Yearly Historical P using MRI scenario for the period 1985-2015.
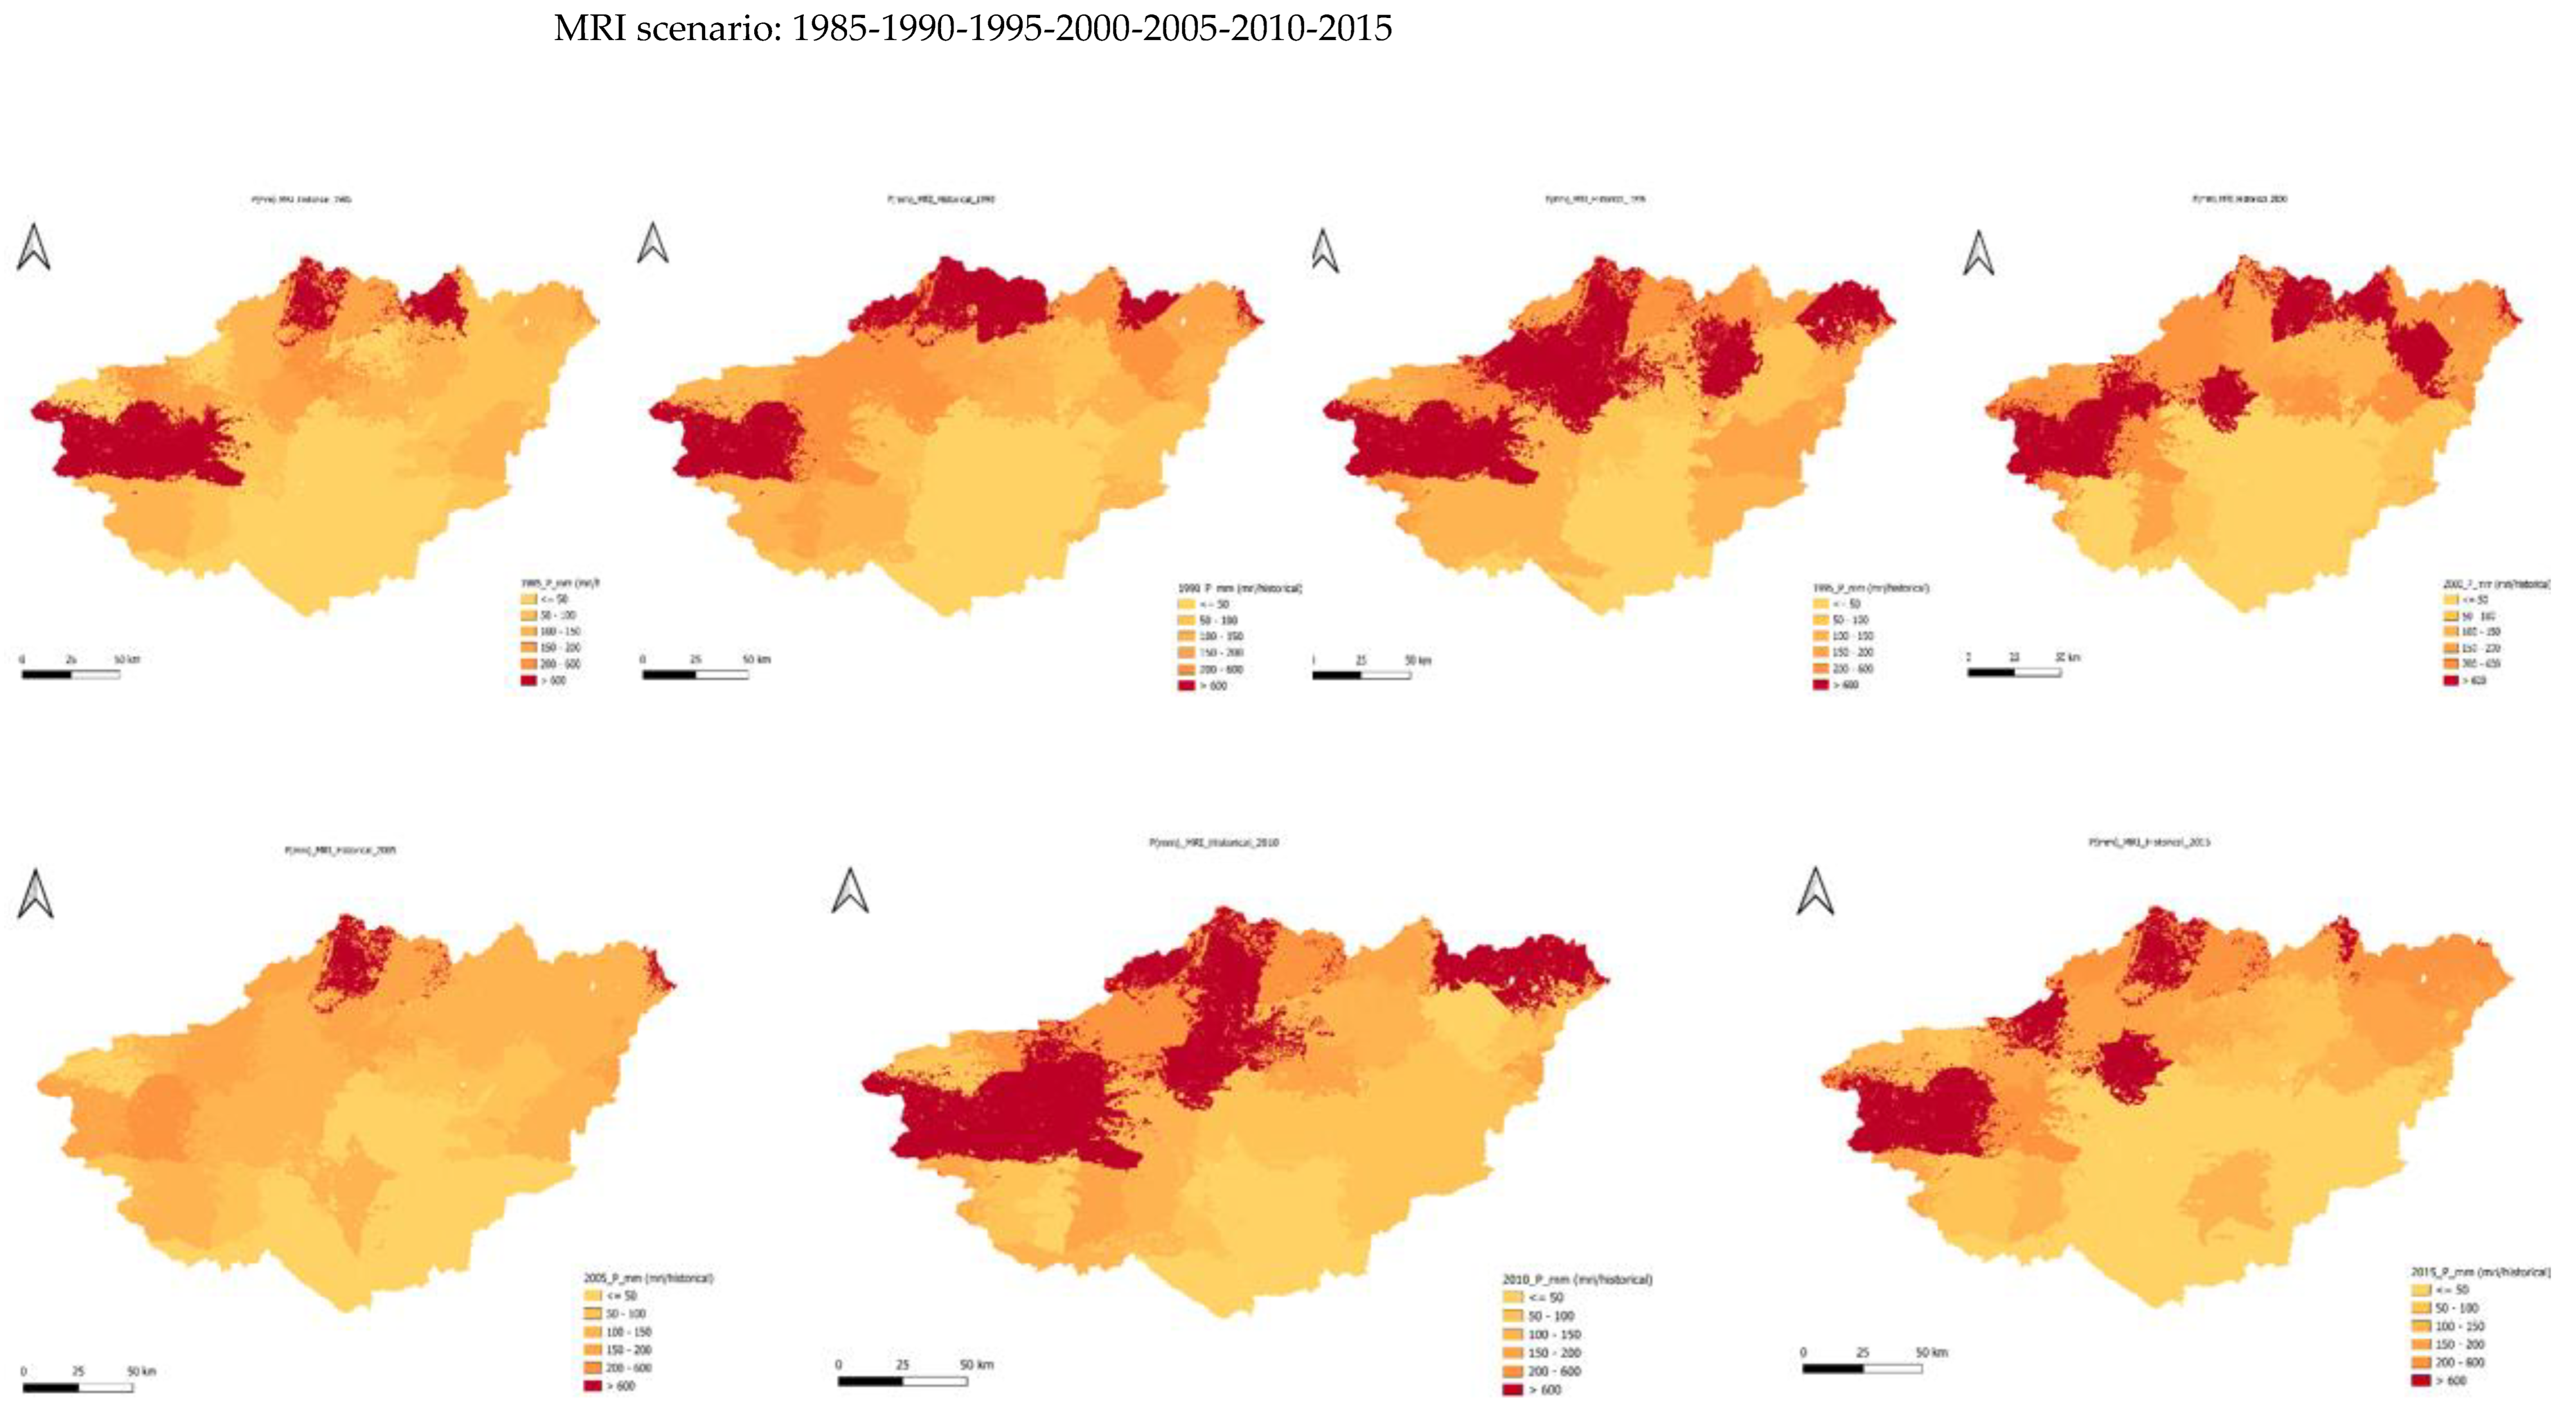
Figure 13.
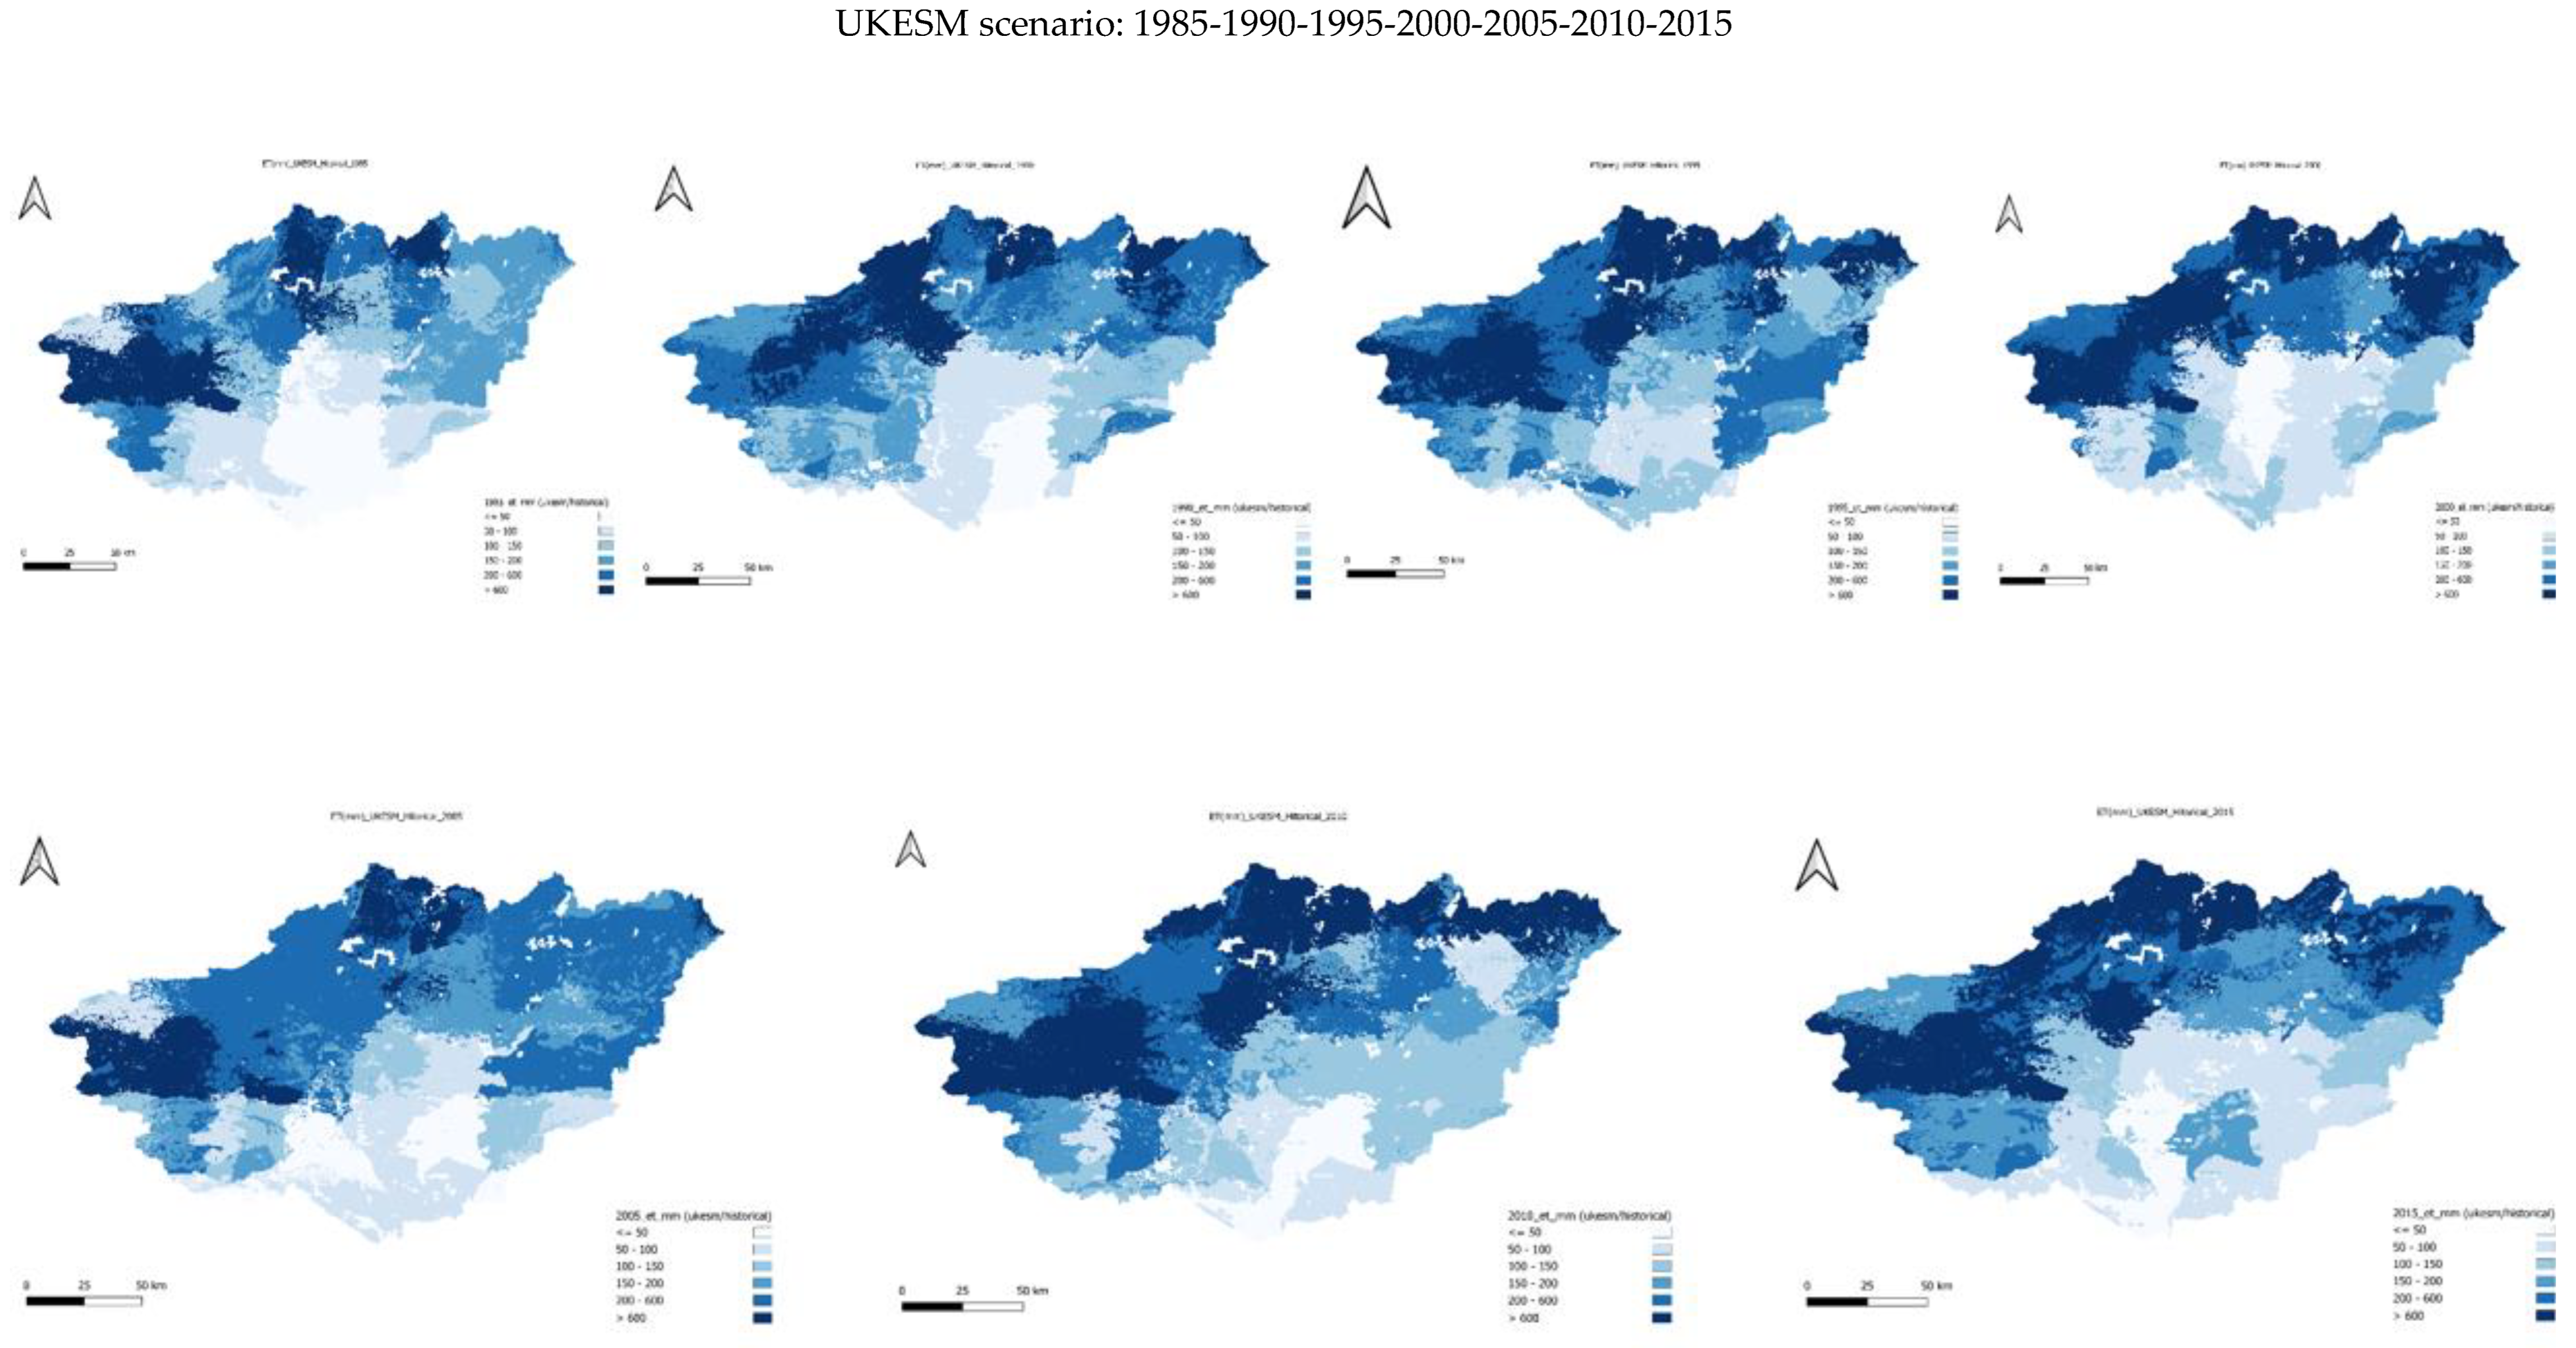
Yearly Historical P using UKESM scenario for the period 1985-2015.
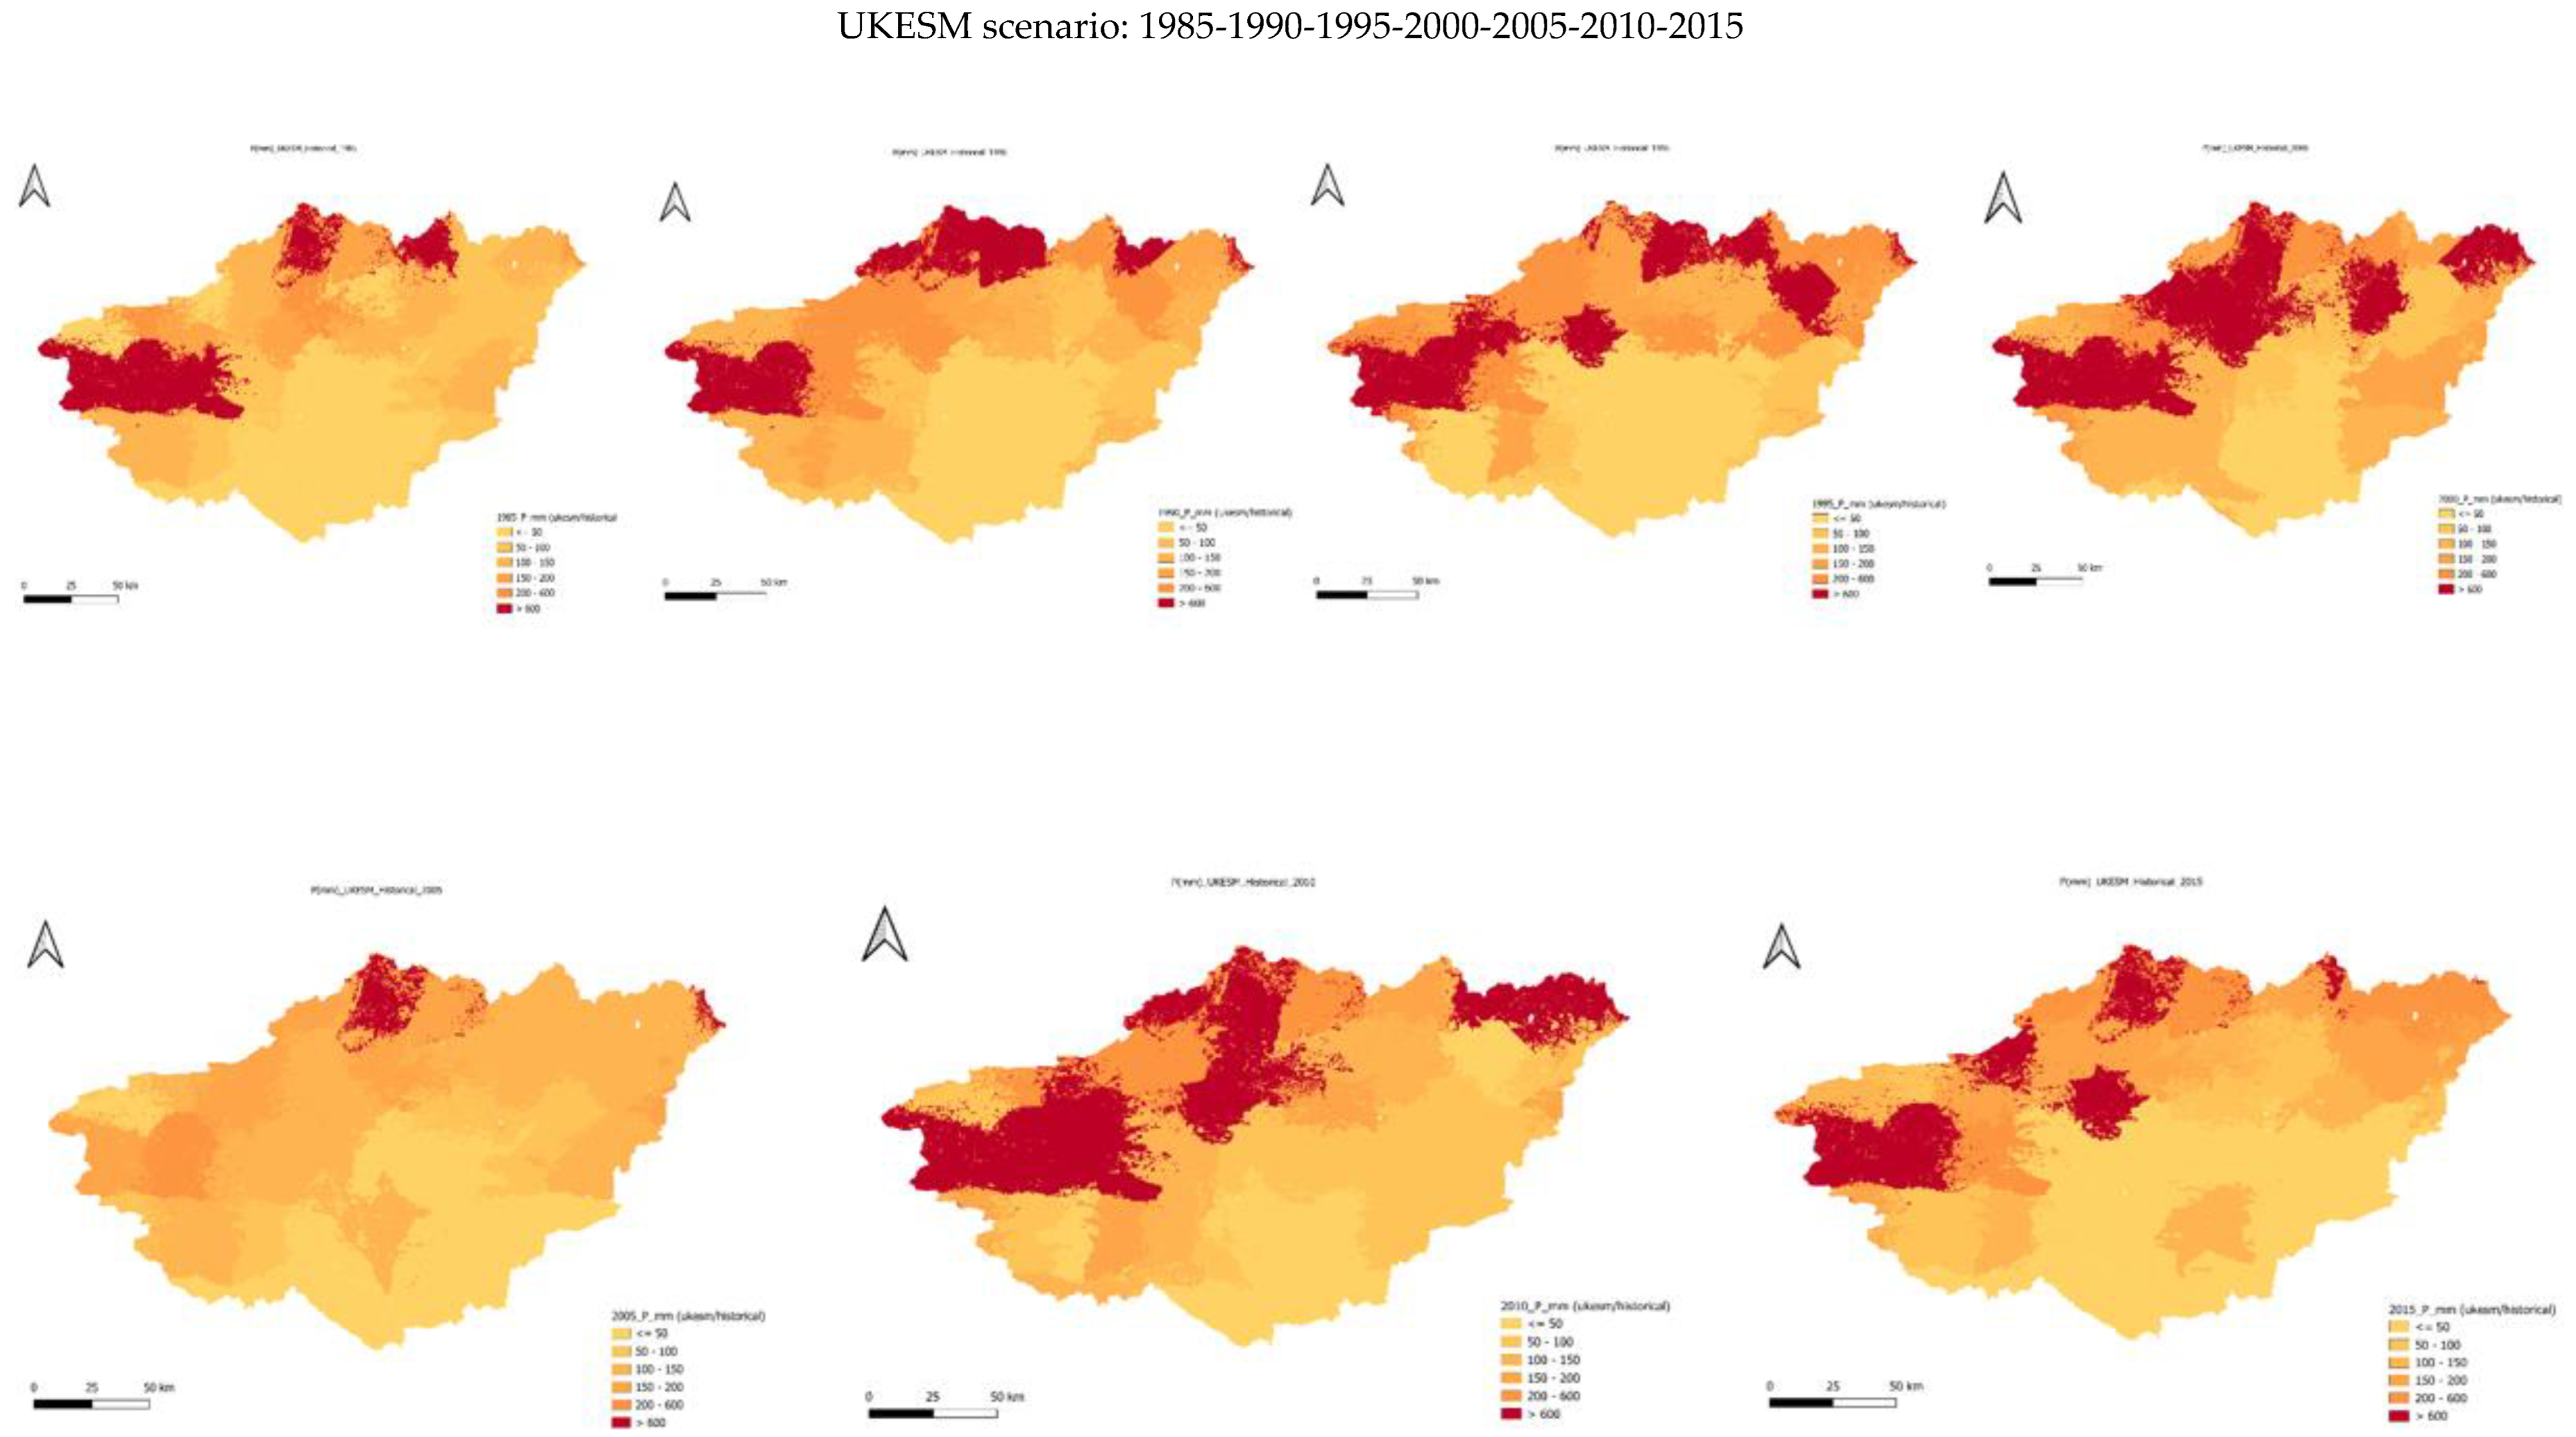
The spatial and temporal distribution of historical precipitation (P) across the Guir watershed was simulated using SWAT+, driven by the five bias-adjusted Global Climate Models (GCMs) described in the methodology. The simulations span the 1985–2015 period and capture the year-to-year variability in precipitation under historical climate conditions.
The results, presented in five-year intervals, illustrate the temporal evolution of rainfall across the basin. These maps highlight distinct spatial gradients, with higher precipitation levels typically observed in the northern and upstream zones and a progressive decline toward the southern and downstream areas, consistent with the basin’s semi-arid to arid climatic transition.
Such patterns provide a valuable baseline for assessing subsequent deviations under future climate scenarios and for evaluating how precipitation variability influences surface-water availability and agricultural potential within the oasis ecosystem.
Figure 9, Figure 10, Figure 11, Figure 12 and Figure 13 illustrate the spatial and temporal variability of annual precipitation in the Guir basin over the 1985–2015 period, simulated using five global climate models (GFDL, IPSL, MPI, MRI, and UKESM). Across all models, the maps reveal a consistent spatial gradient, with precipitation decreasing from north to south. The highest precipitation values (dark red areas, >400 mm yr⁻¹) are concentrated in the northern and northeastern sectors of the basin—mainly along the Atlas Mountain ranges—while the southern areas, including the Boudenib oasis, show markedly lower precipitation (<150 mm yr⁻¹).
This spatial distribution is strongly influenced by the basin’s topography. Orographic uplift along the northern mountain front enhances condensation and precipitation, whereas the leeward southern regions remain arid due to the rain-shadow effect. This pattern is persistent across all GCMs, suggesting that topographic control dominates over inter-model differences.
Temporally, the 30-year sequence of maps shows fluctuations in precipitation intensity and extent. Periods such as 1990, 2000, and 2010 exhibit notable spatial contraction of high-precipitation zones, particularly under the GFDL and MPI models, corresponding to drier years. In contrast, years like 1995, 2005, and 2015 demonstrate broader and more intense precipitation zones, especially in the GFDL and IPSL outputs, indicating interannual wet anomalies possibly linked to large-scale atmospheric oscillations.
Overall, historical simulations indicate a slight upward trend in mean annual precipitation across the basin, with averages increasing from approximately 380 mm yr⁻¹ in the mid-1980s to nearly 490 mm yr⁻¹ by 2015. This moderate rise suggests enhanced rainfall variability, characterized by longer and more intense rainy seasons interspersed with extended dry spells. Such variability can lead to hydrological extremes—both droughts and flash floods—especially in the lower basin, where infiltration and storage capacities are limited.
While the increase in precipitation can locally improve soil moisture and crop productivity—as evidenced by higher yields in 2015, when winter cereal production increased by nearly 70%—it also raises the risk of soil erosion, sediment transport, and surface flooding. Hence, despite the apparent benefits, the projected variability emphasizes the need for adaptive water management strategies in the Guir basin’s agricultural zones.
3.1.2. RCP8.5 Yearly P
Figure 14.
Yearly RCP P using GFDL scenario for the period 2071-2100.
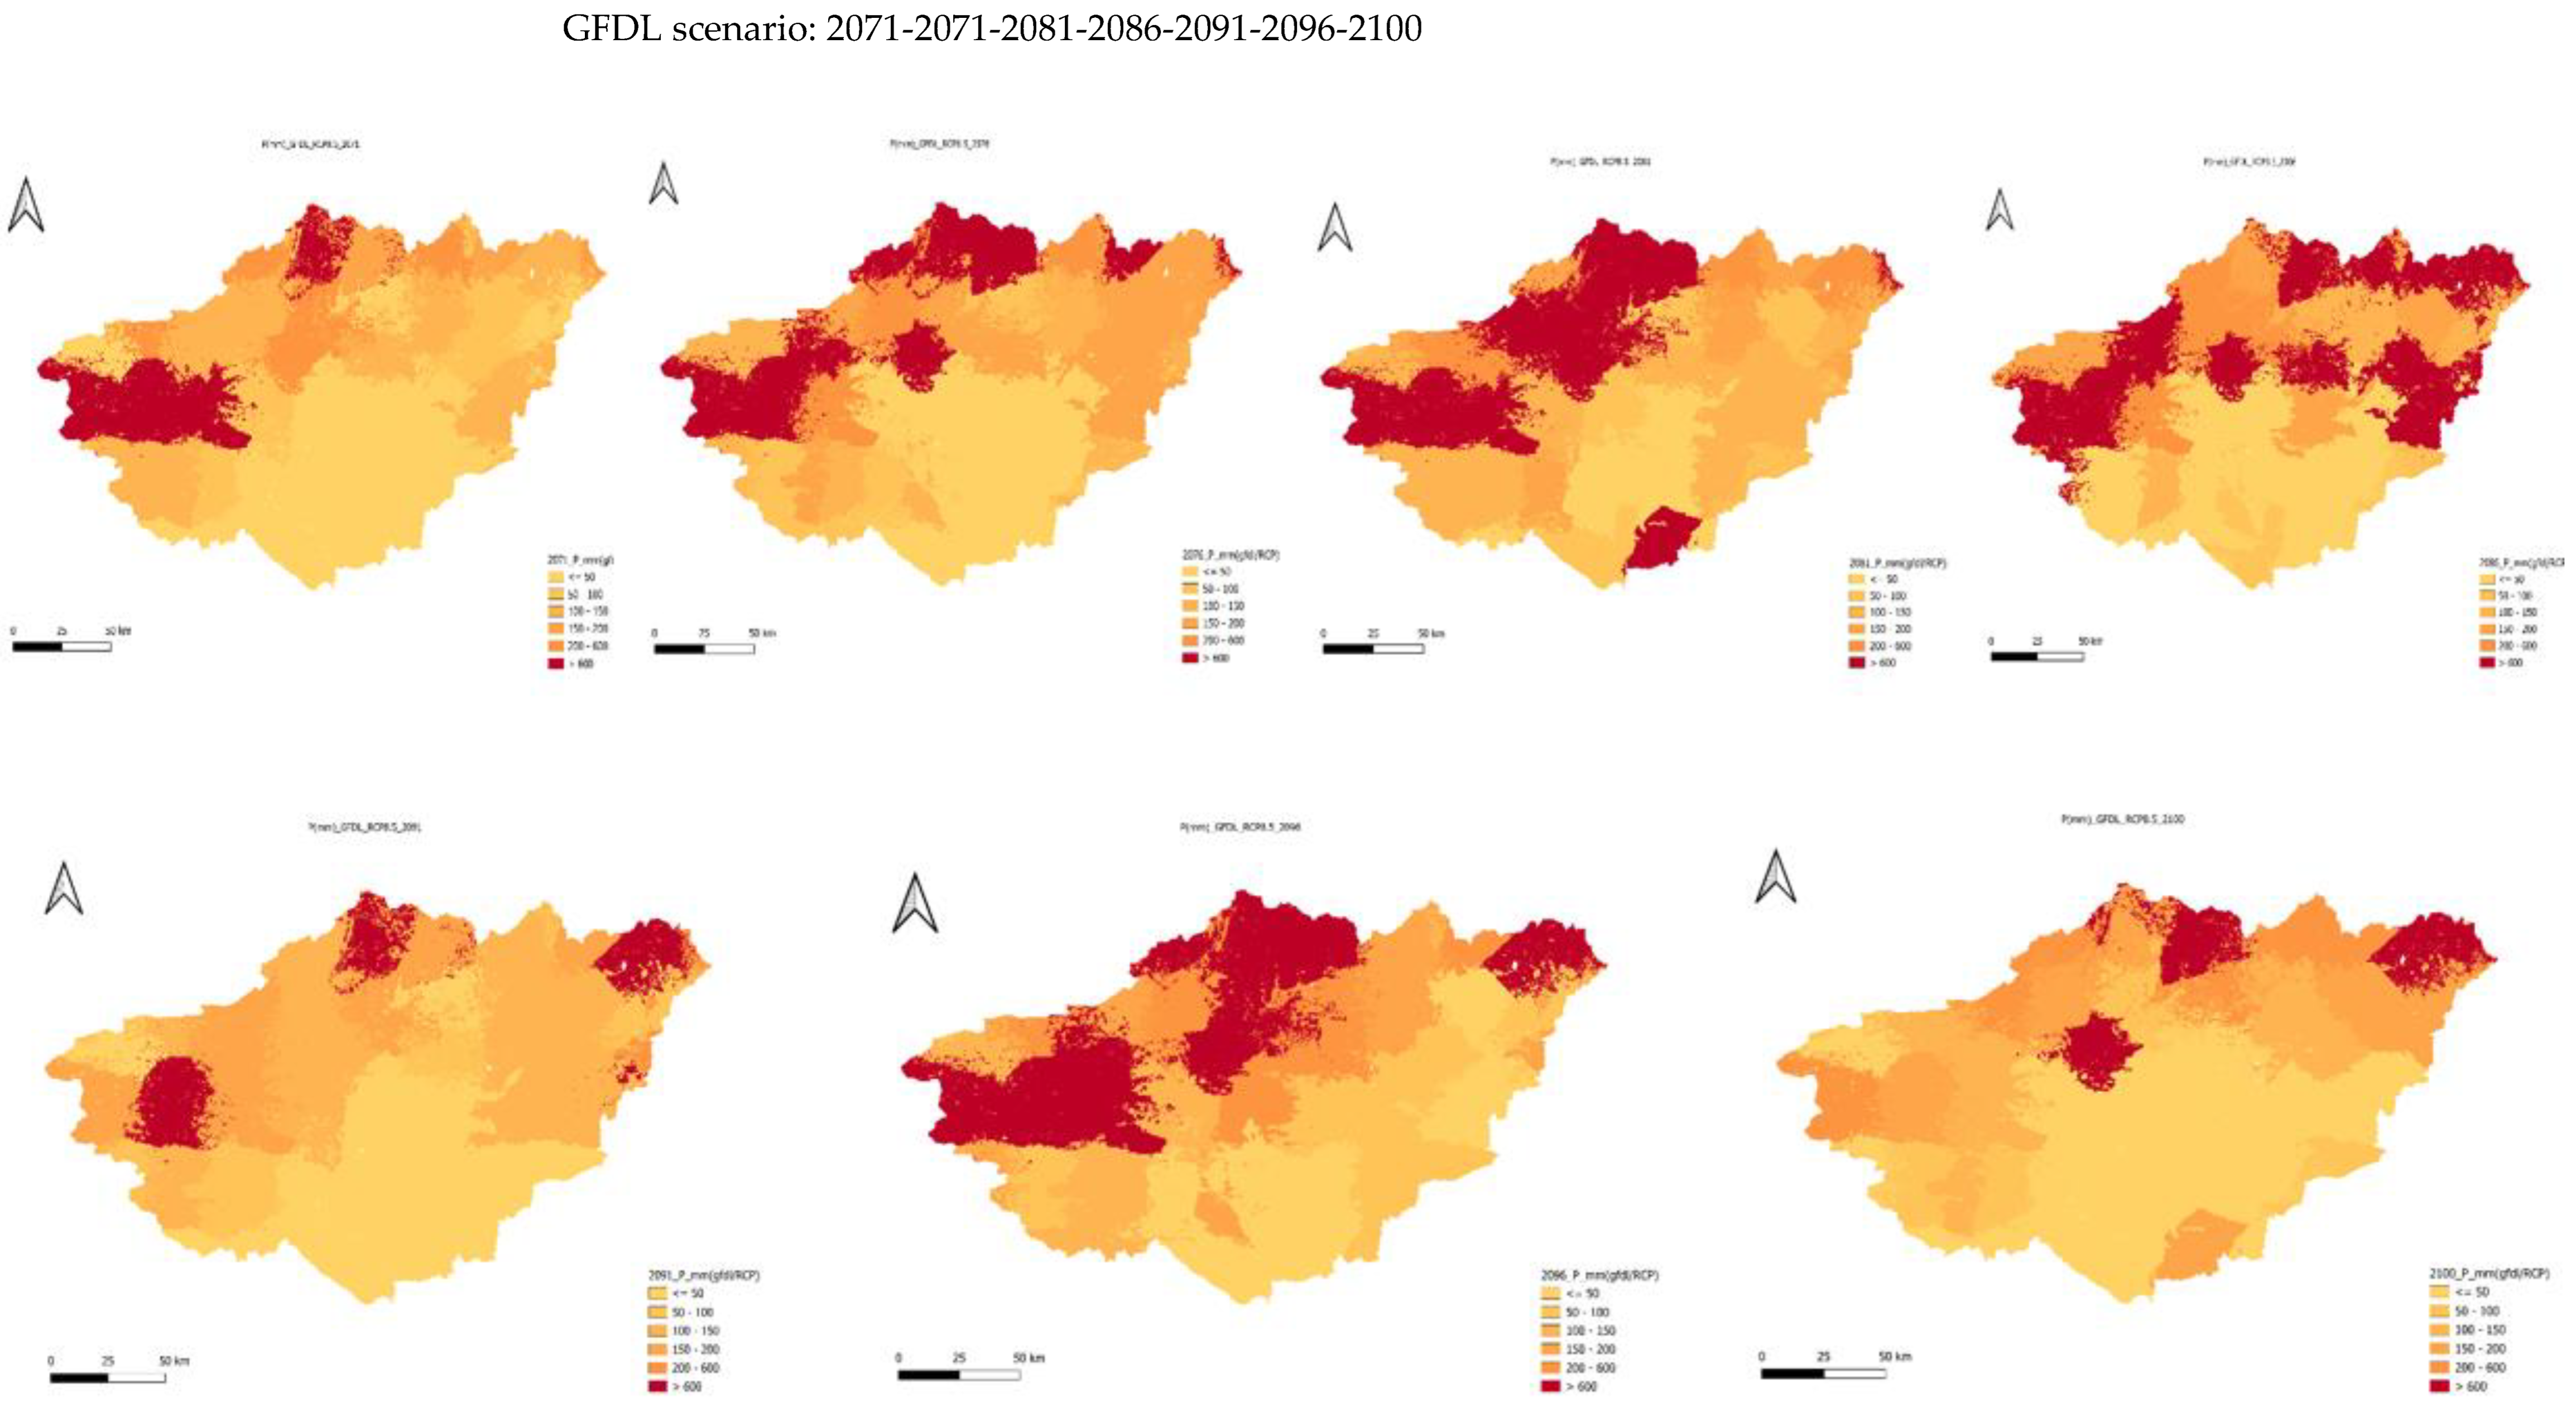
Figure 15.
Yearly RCP P using IPSL scenario for the period 2071-2100.
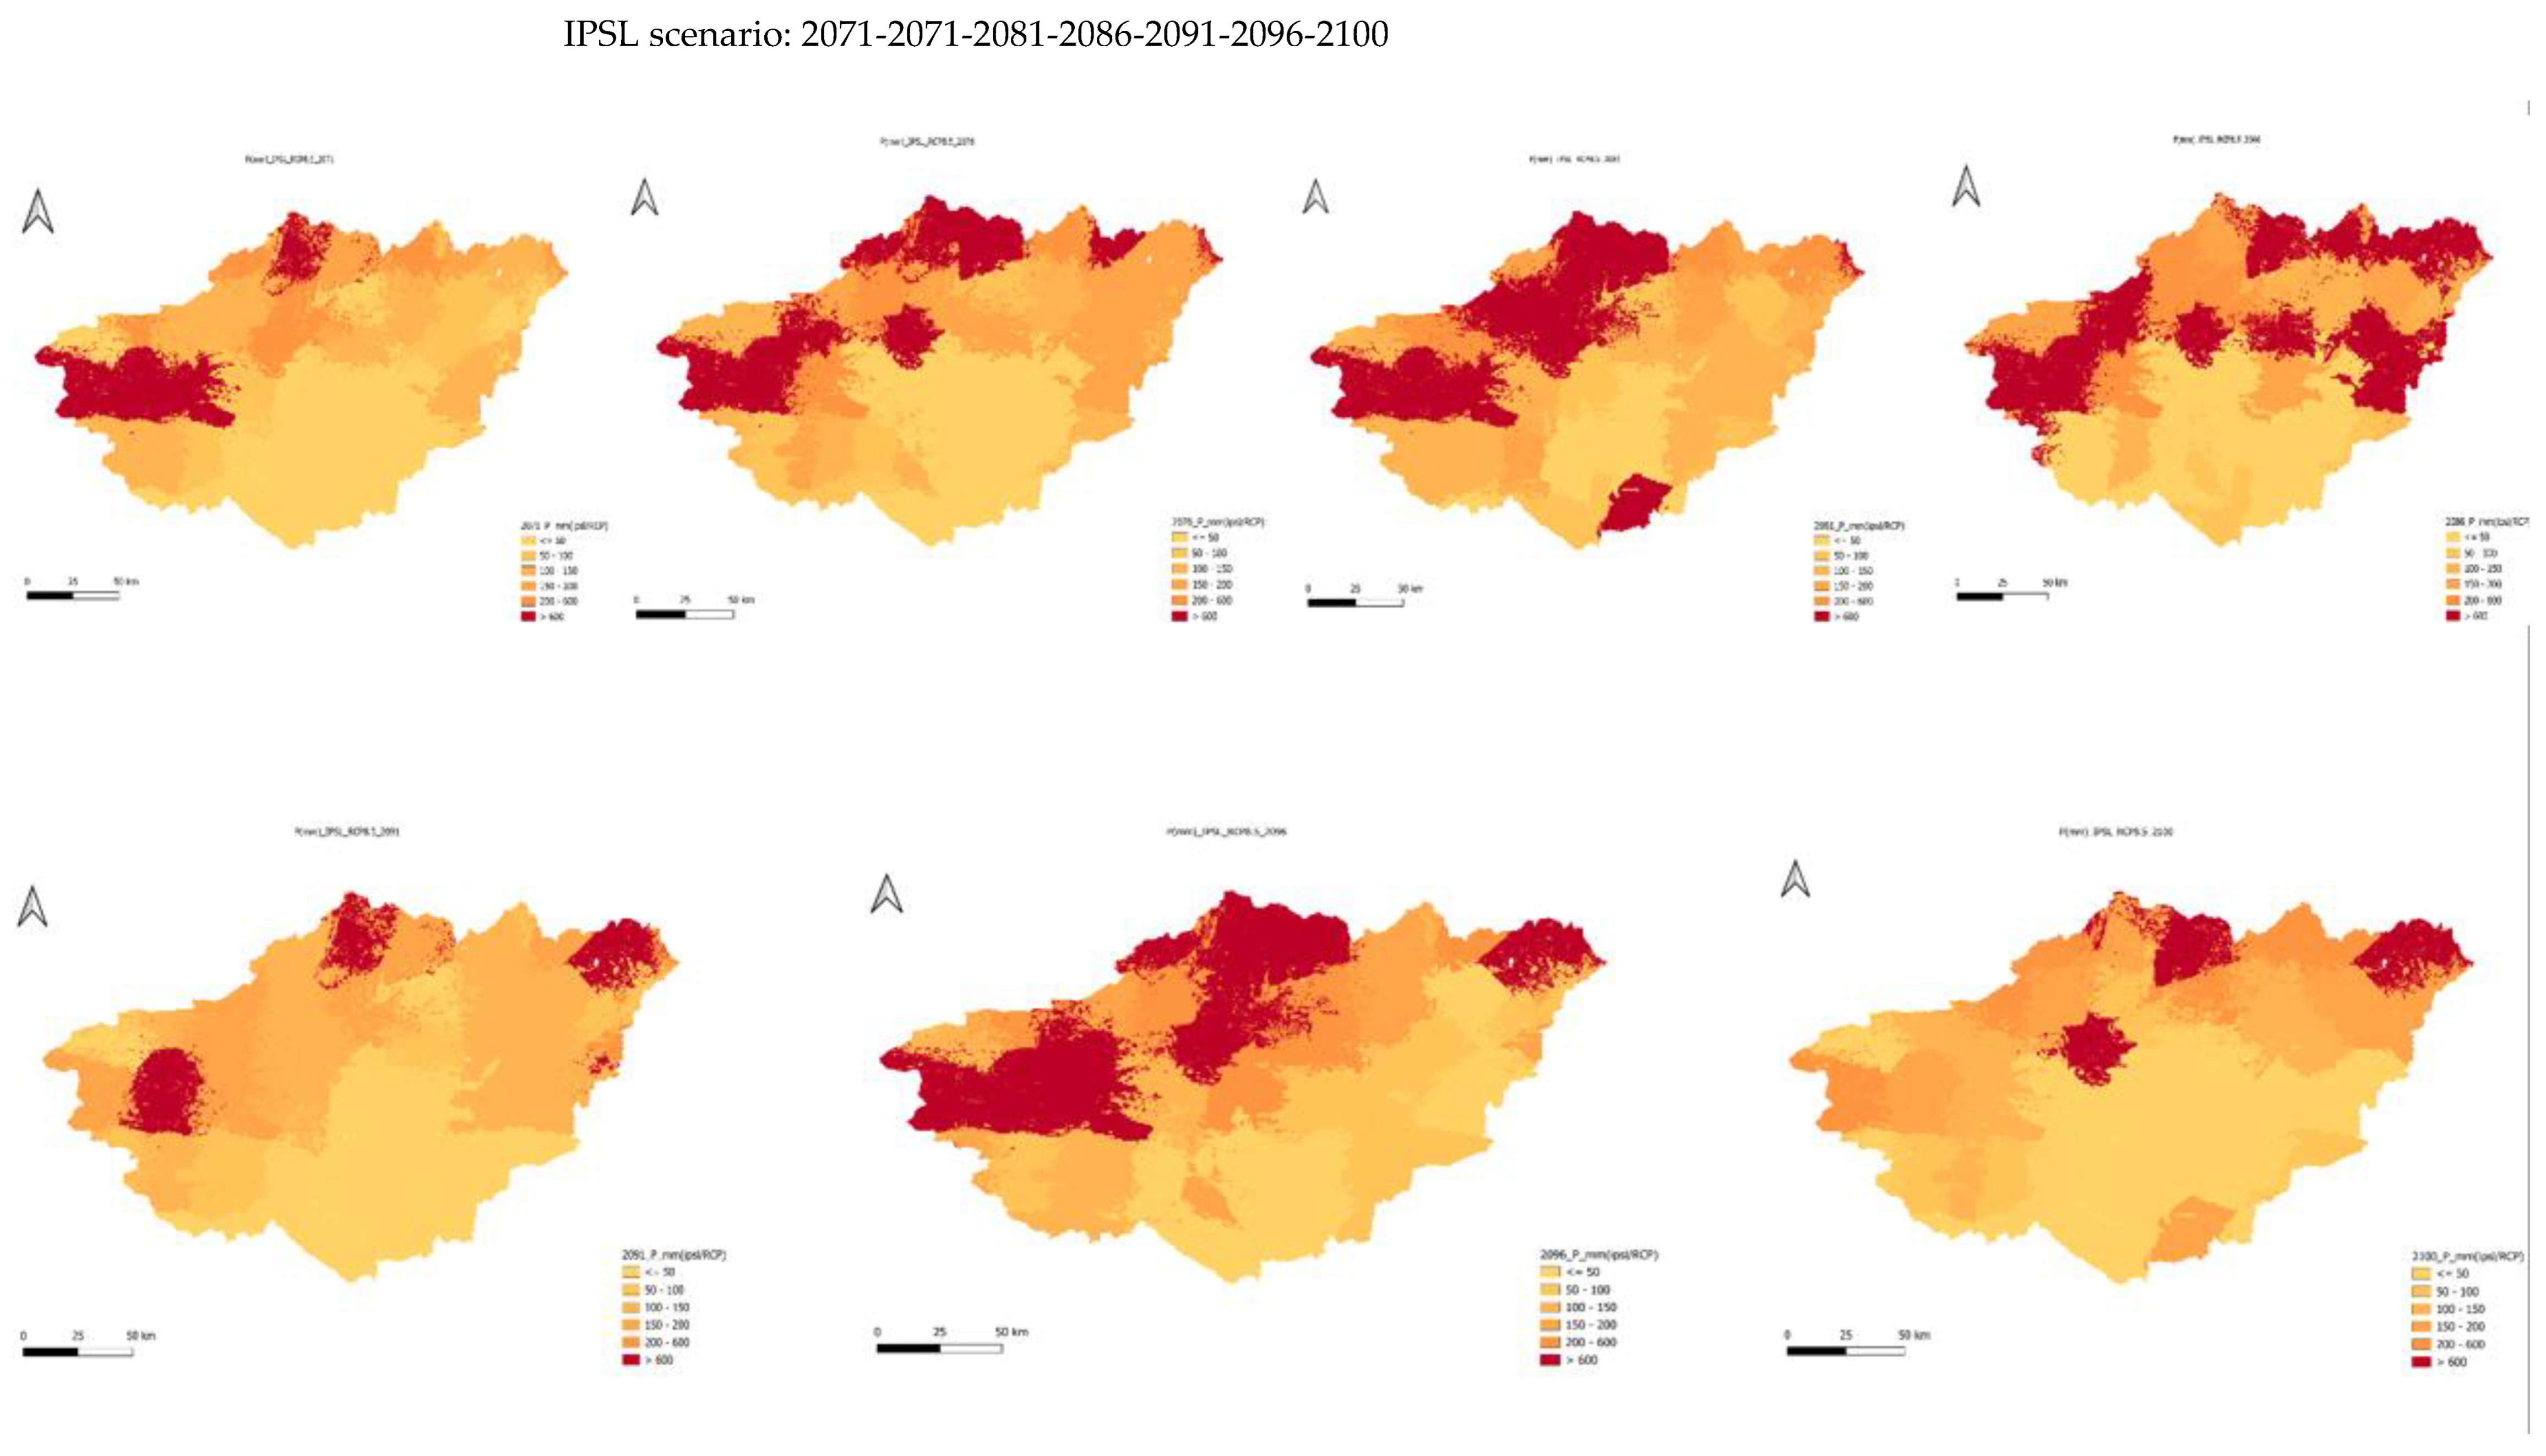
Figure 16.
Yearly RCP P using MPI scenario for the period 2071-2100.
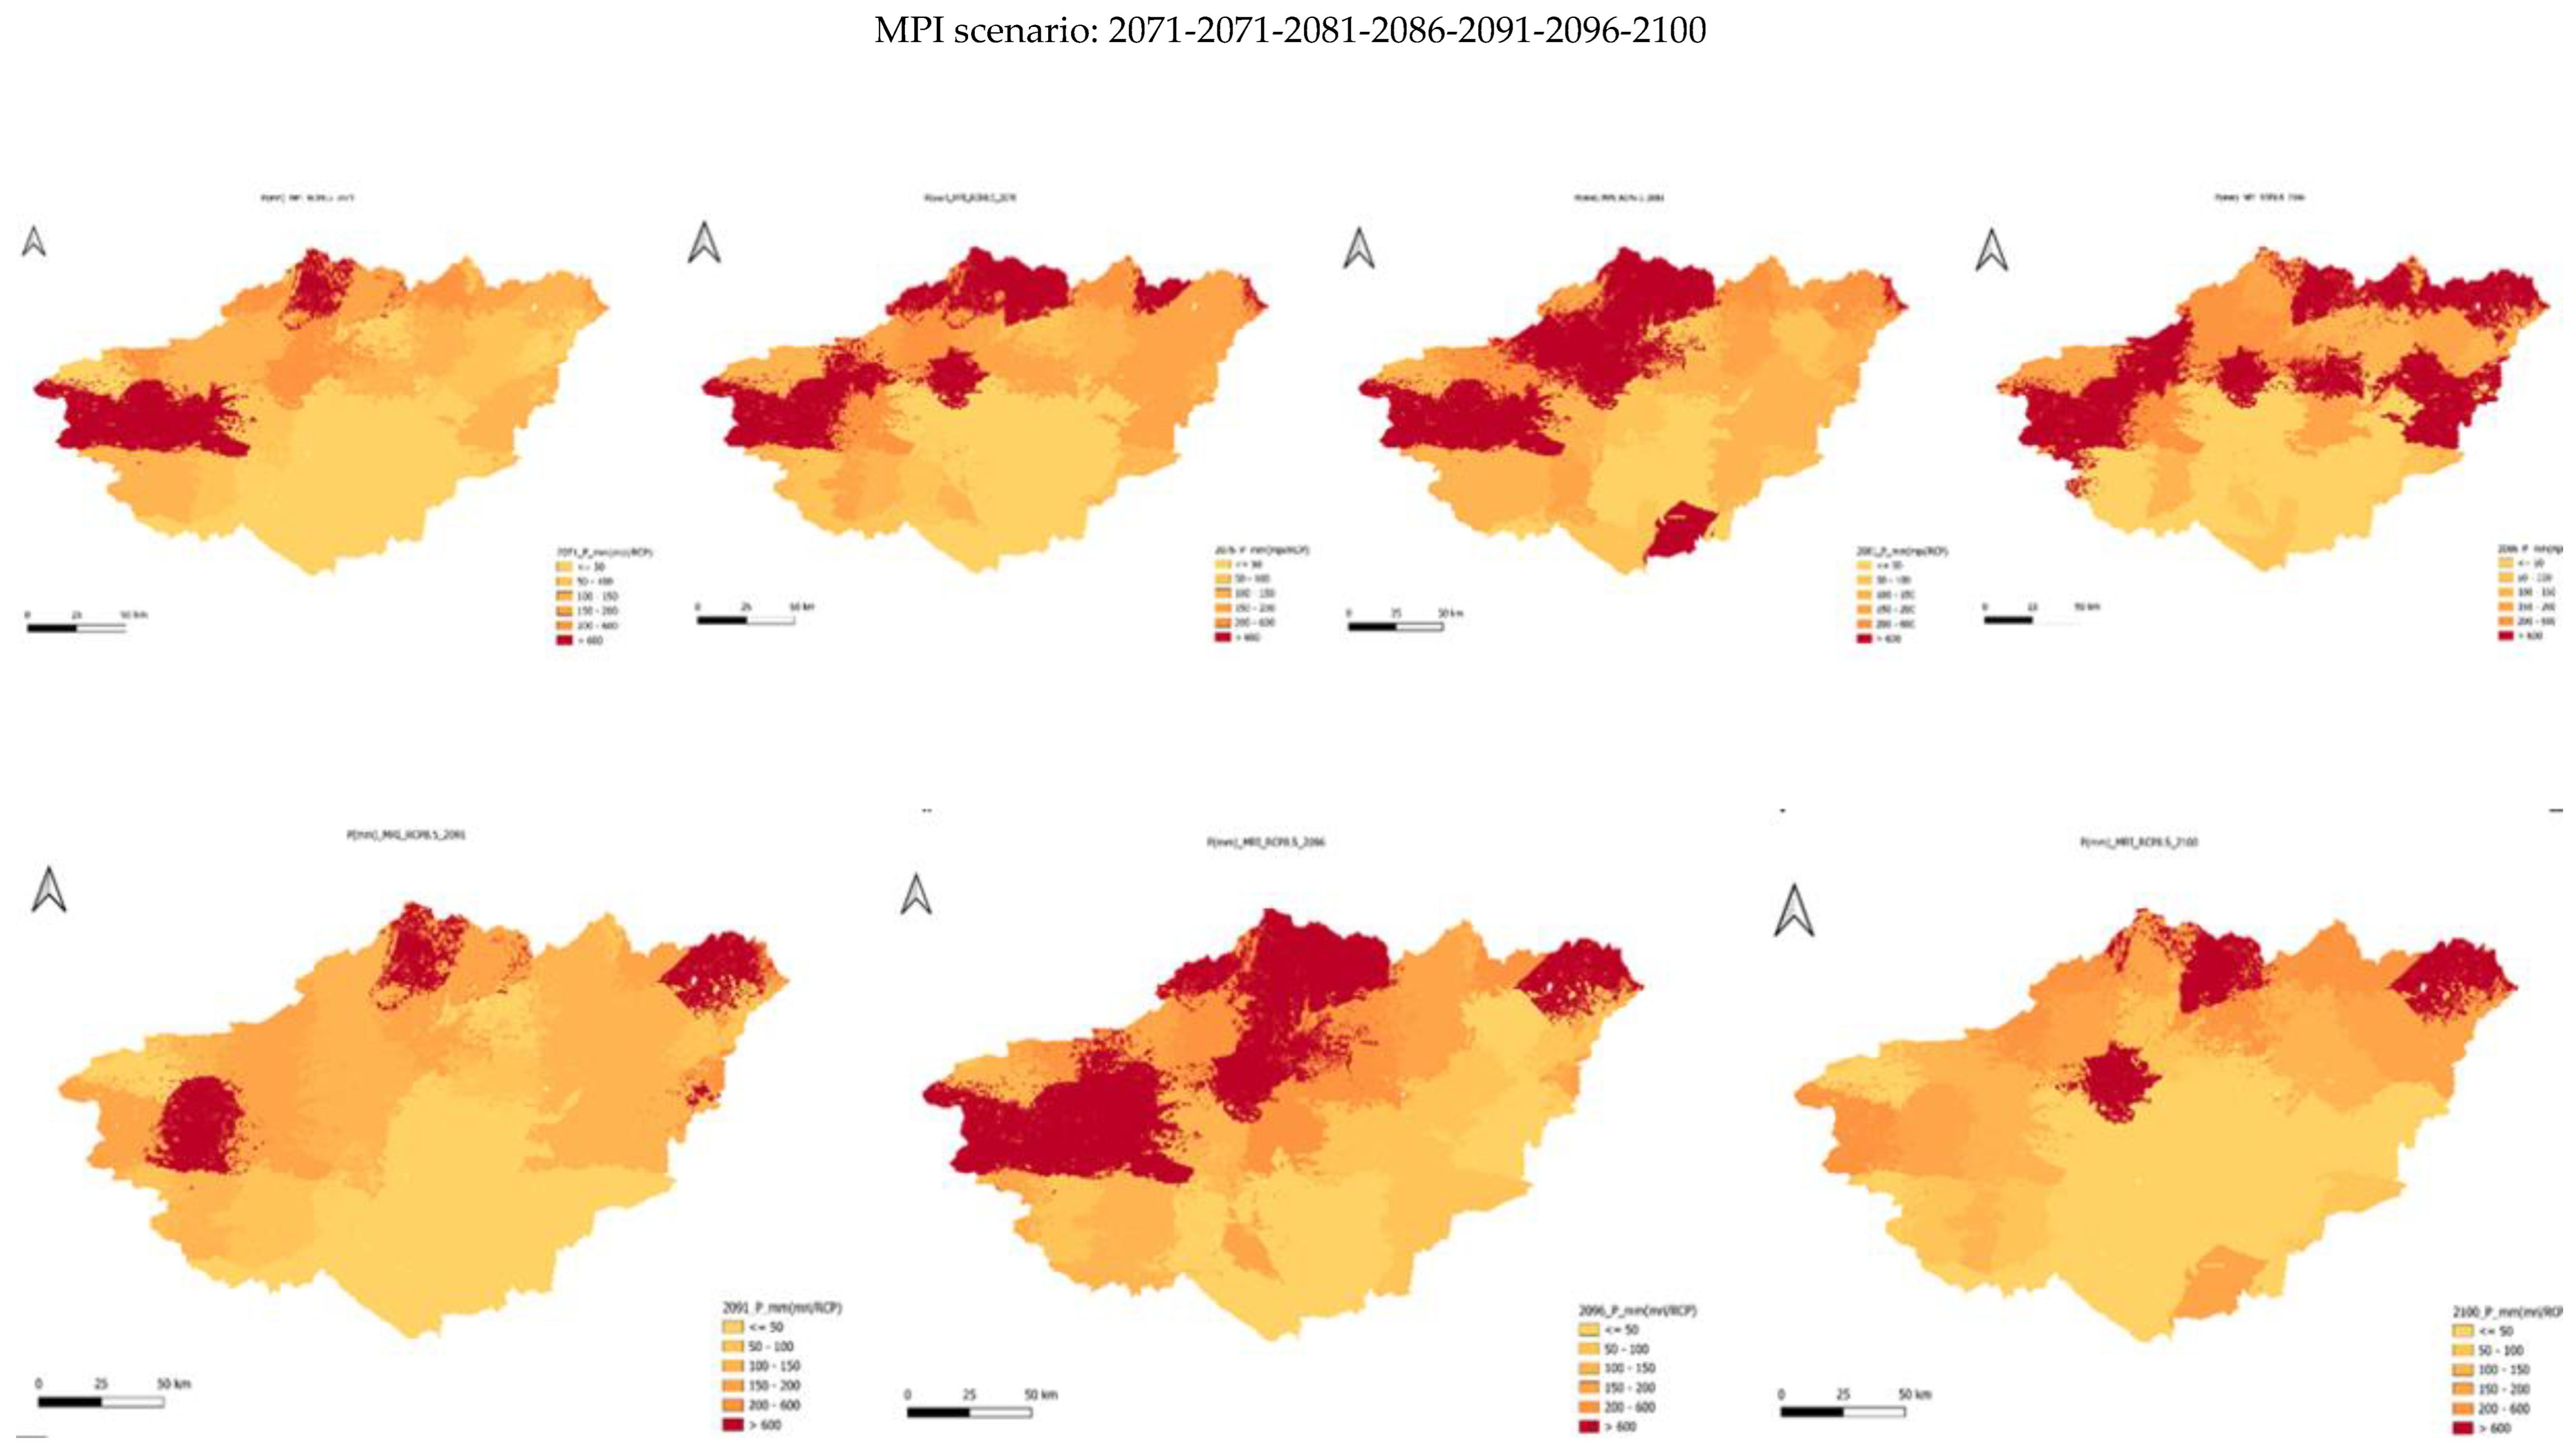
Figure 17.
Yearly RCP P using MRI scenario for the period 2071-2100.
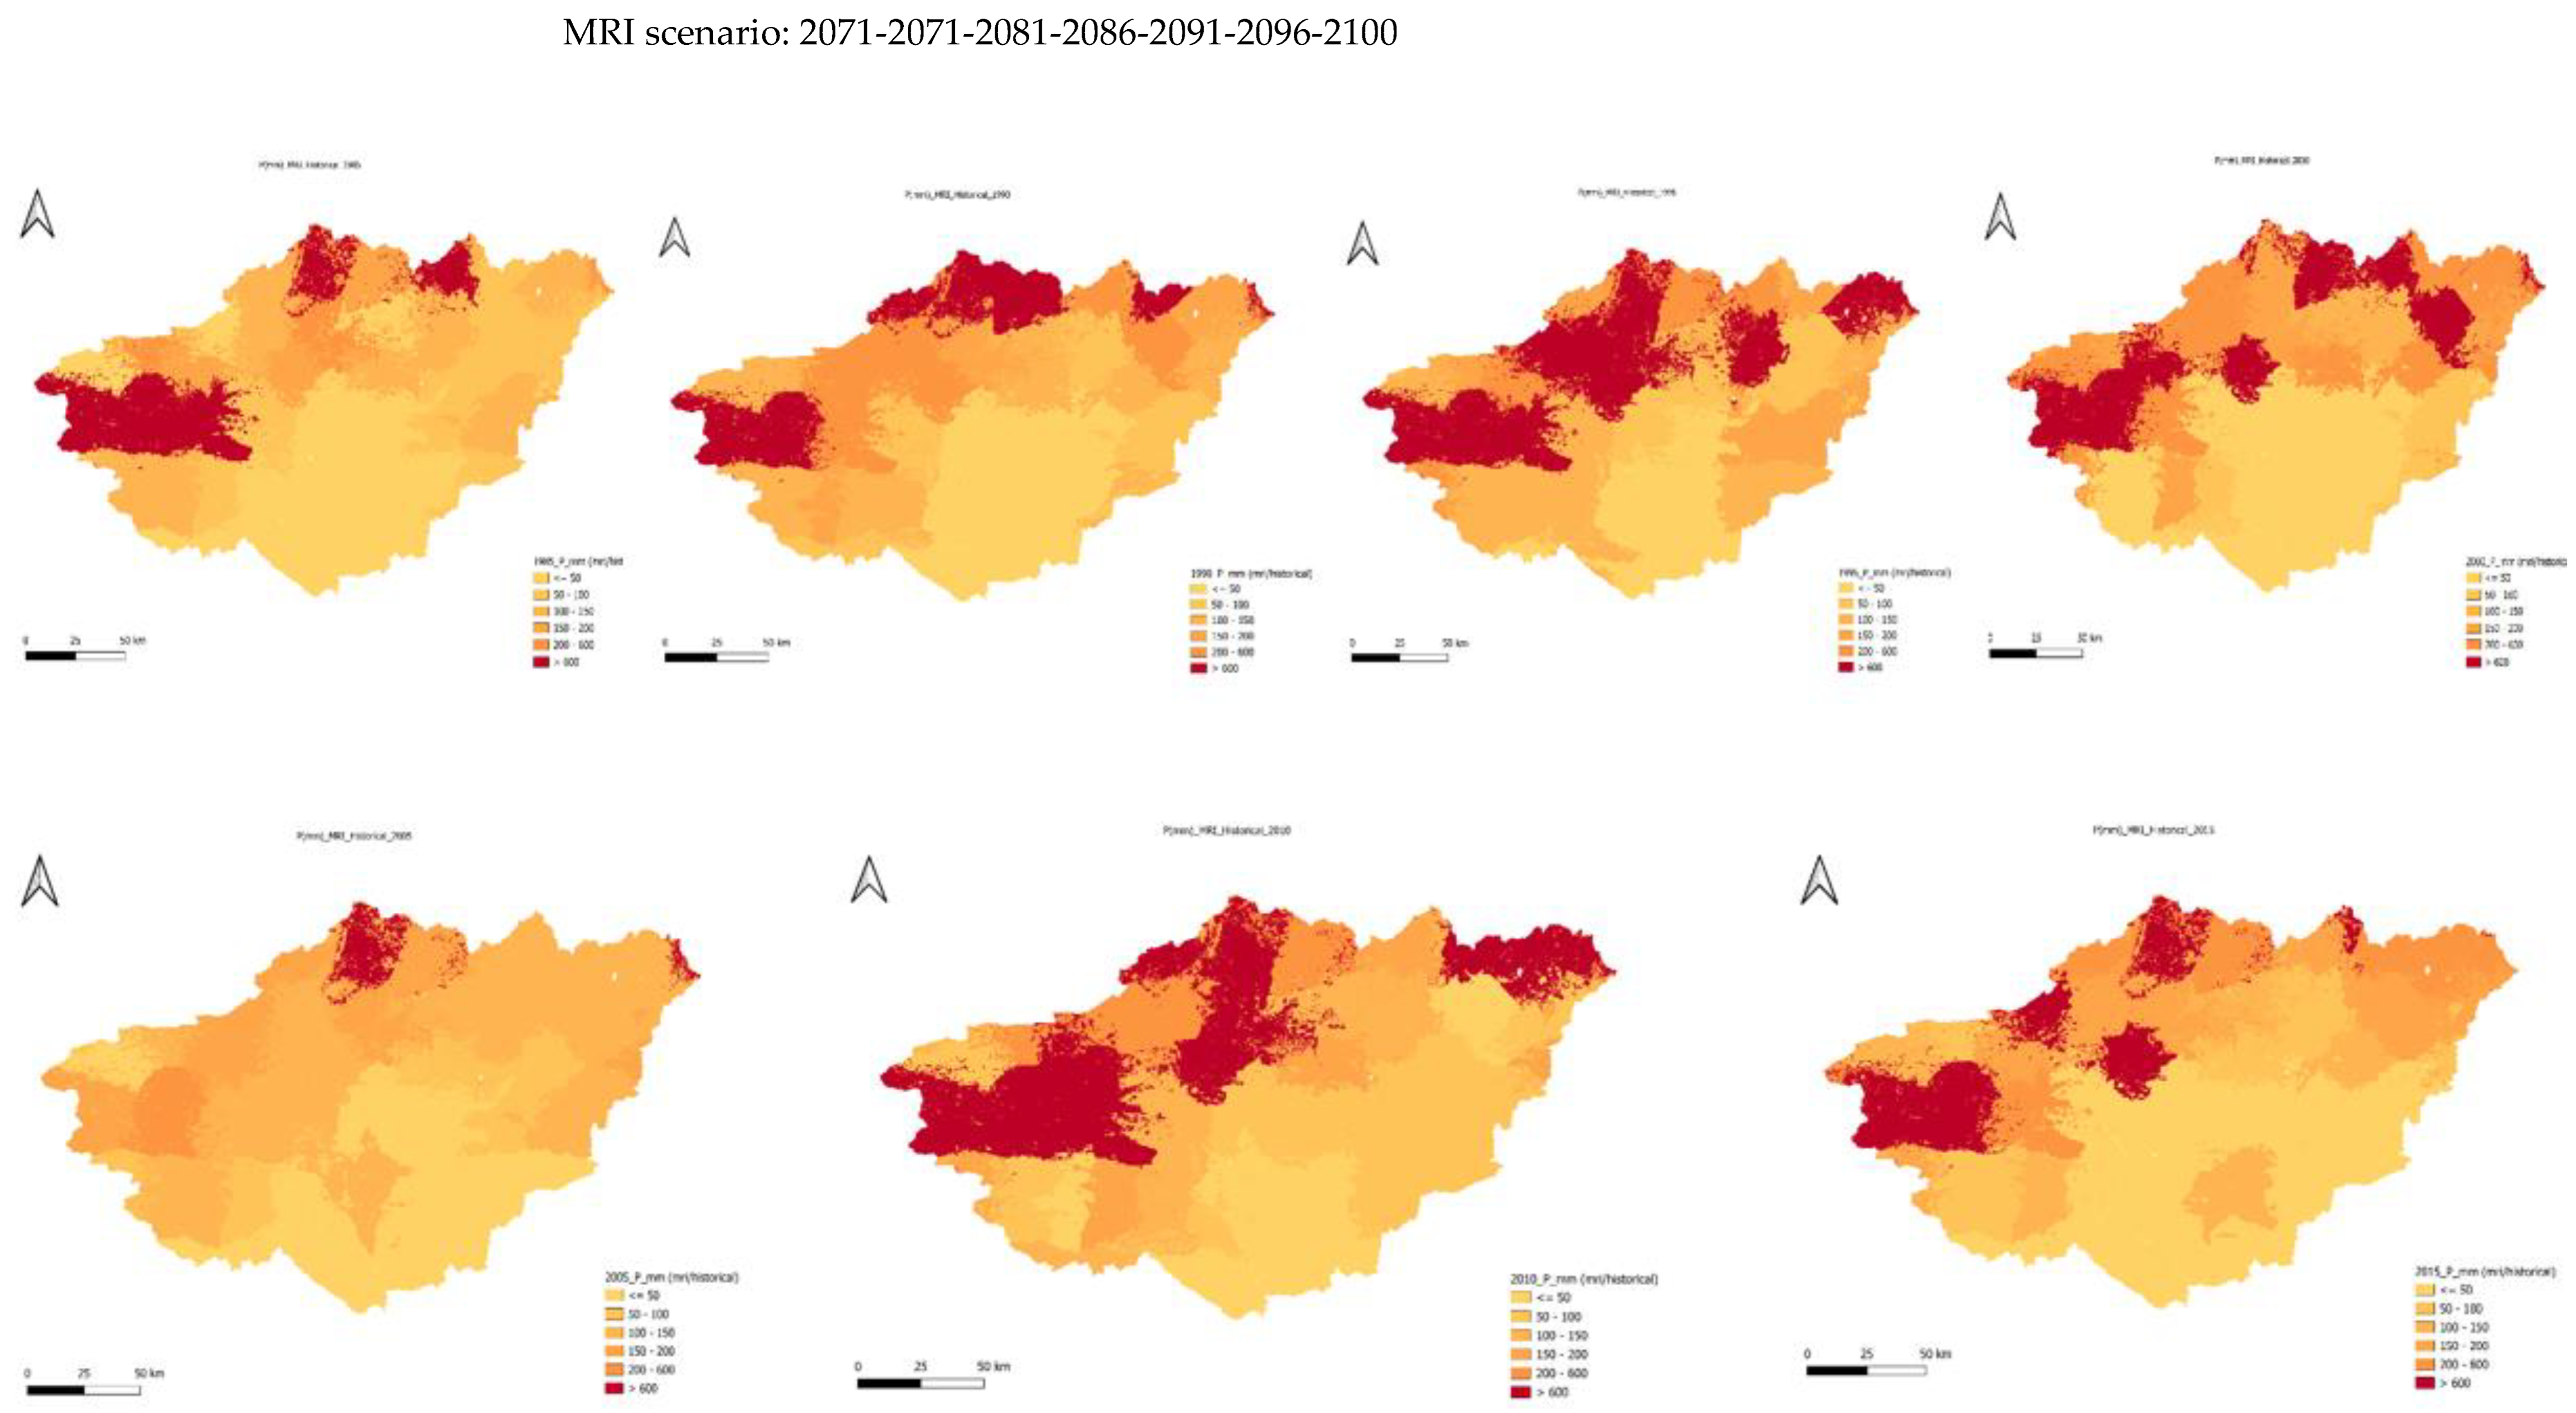
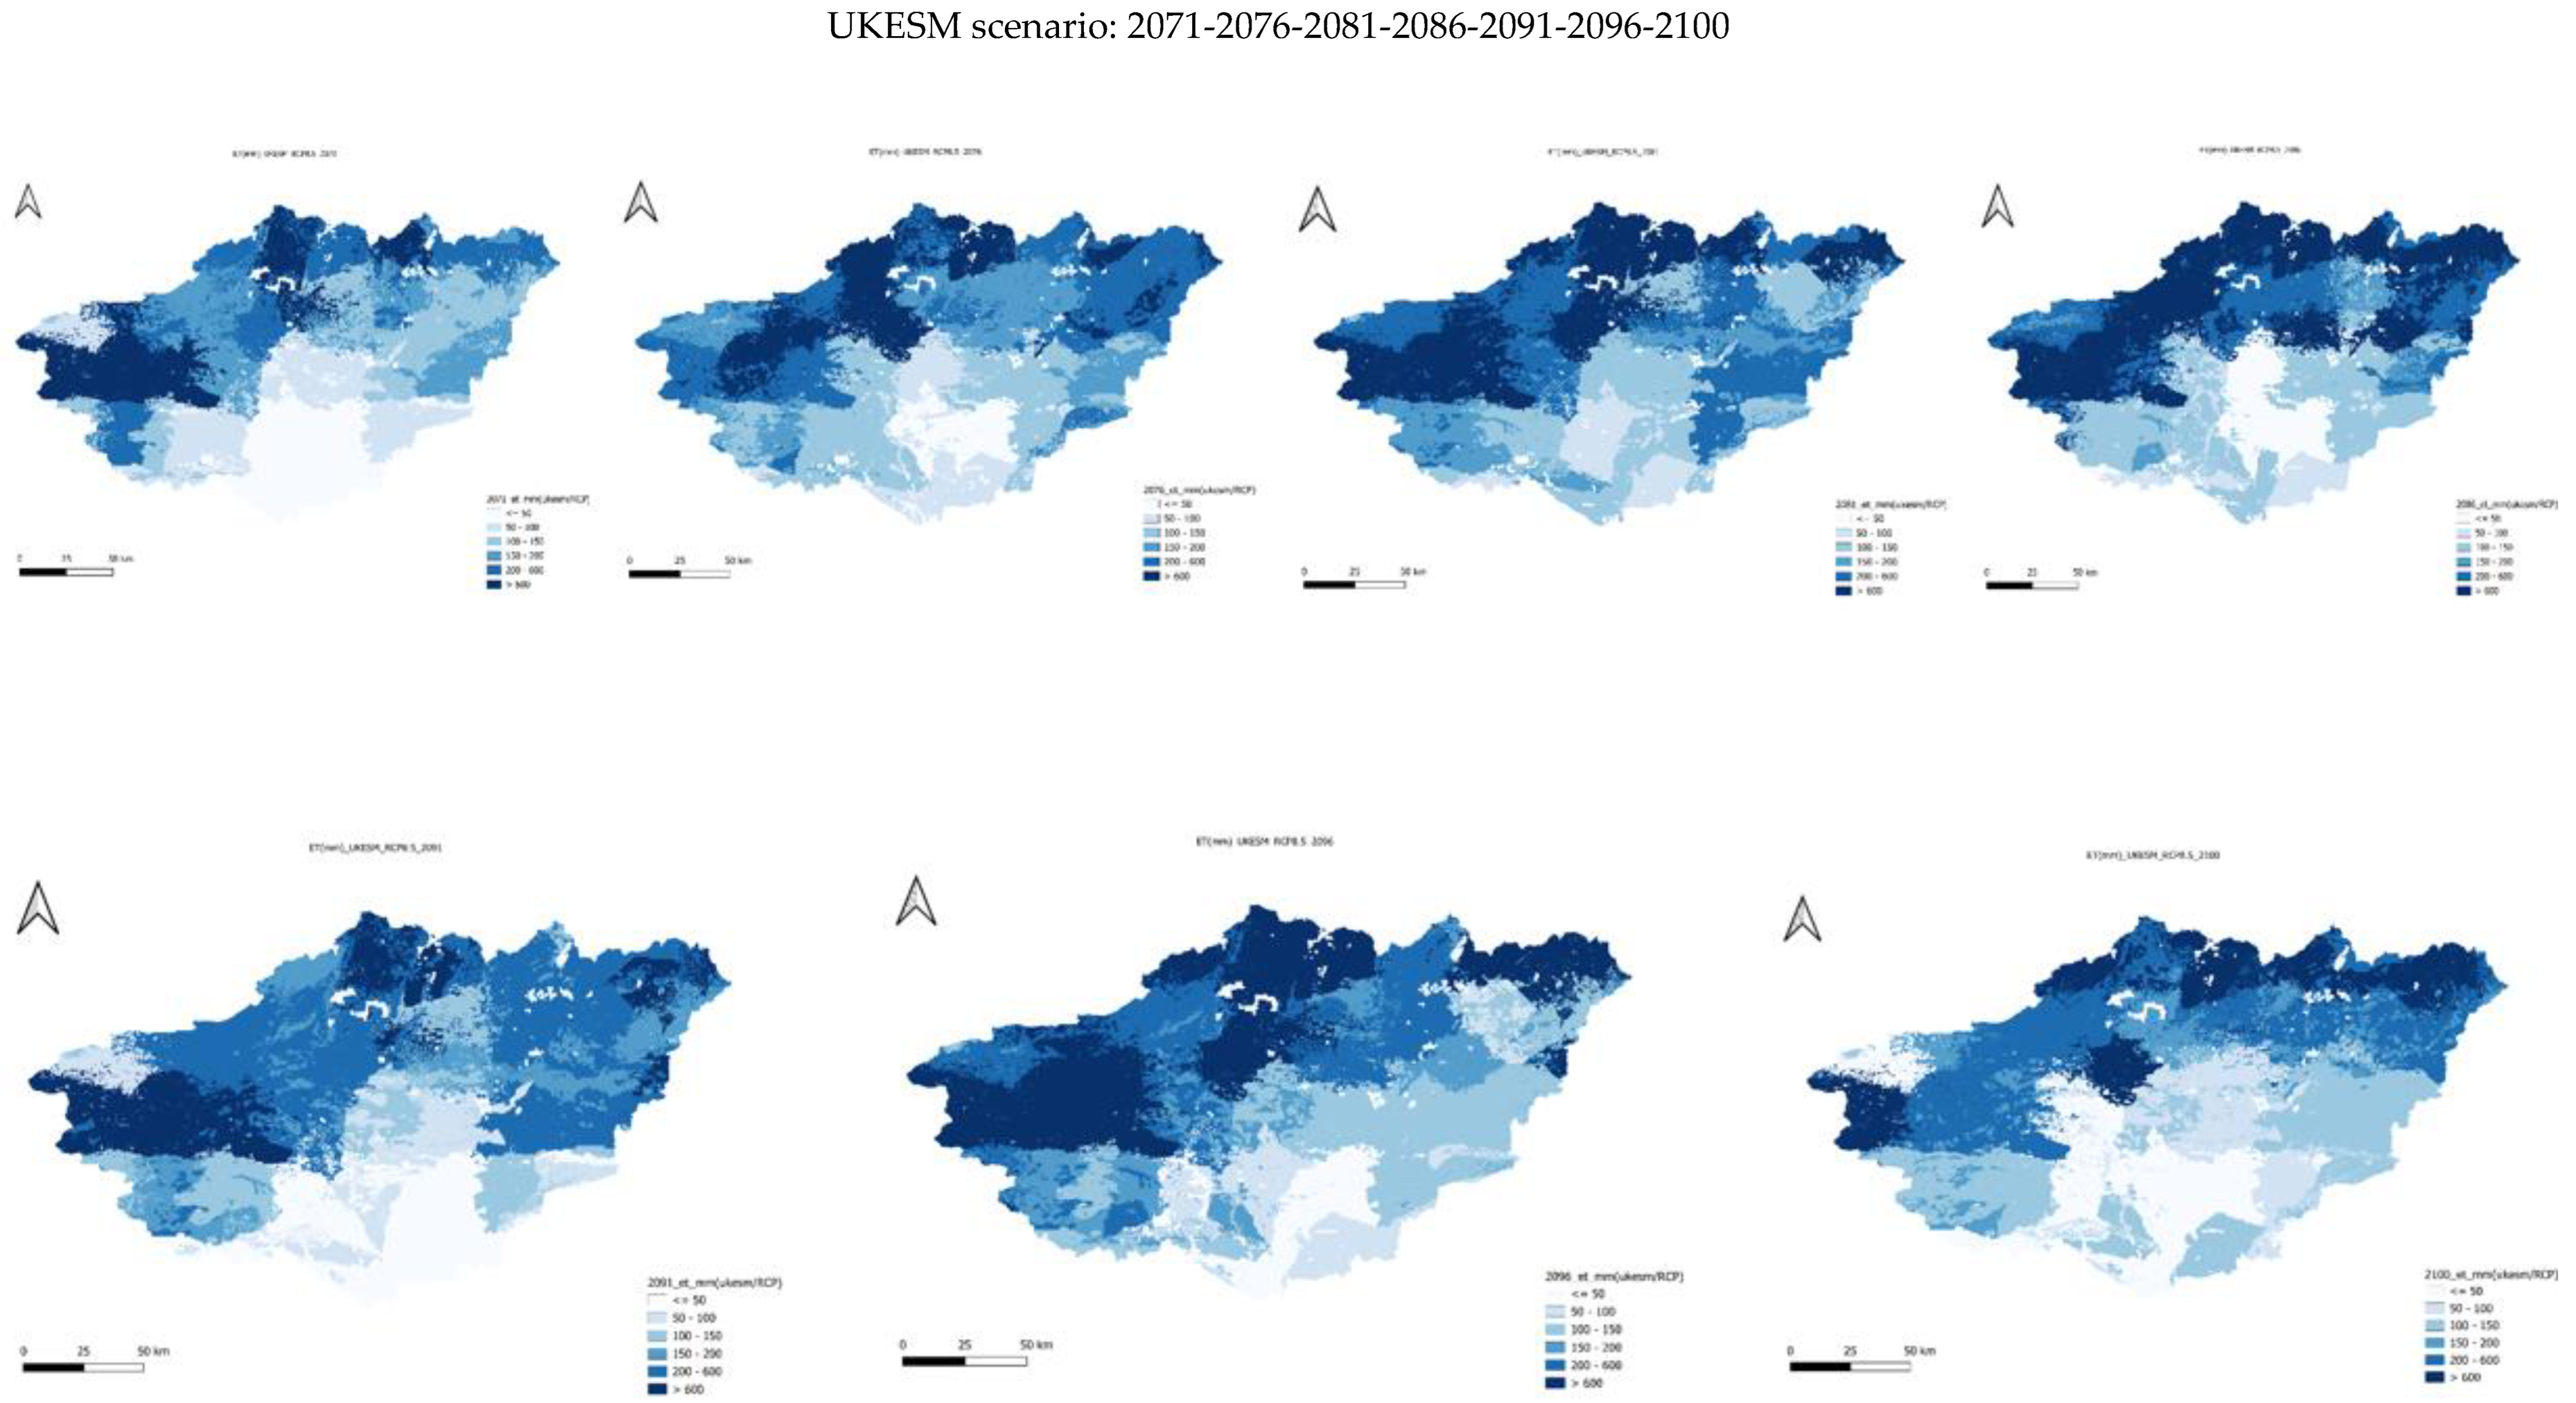
Figure 18.
Yearly RCP P using UKESM scenario for the period 2071-2100.
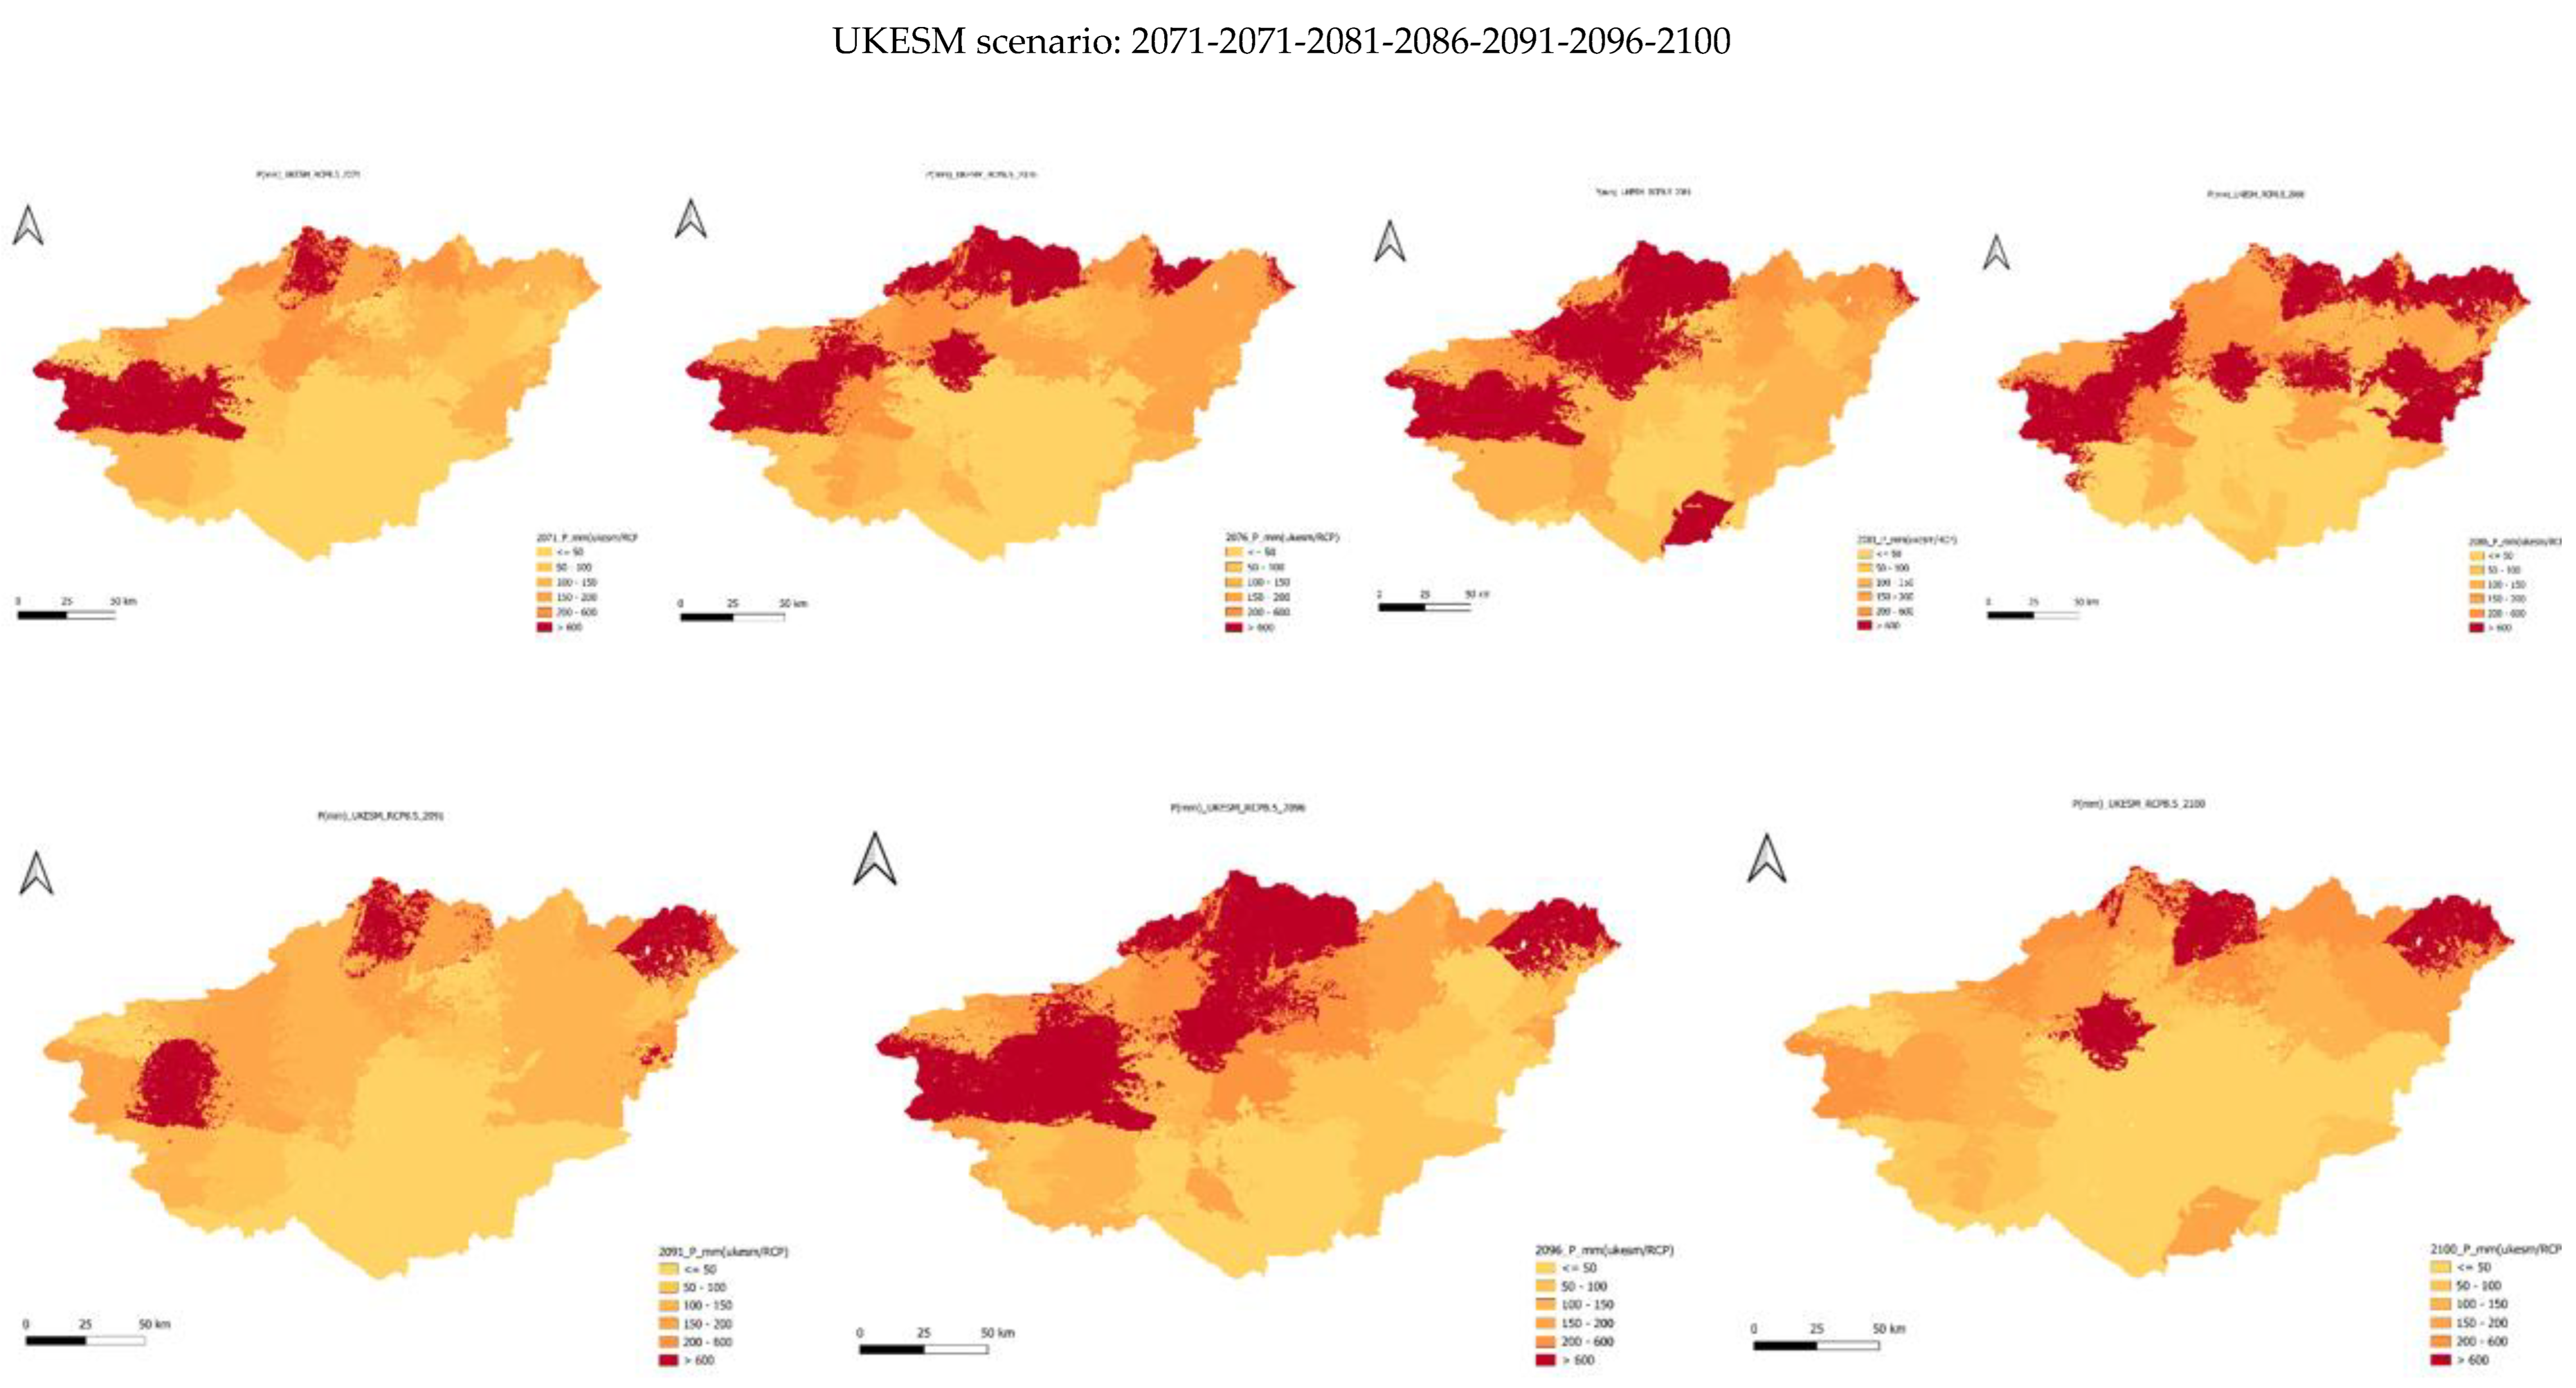
Future precipitation projections for the period 2071–2100 under the RCP 8.5 high-emission scenario (Figure 14, Figure 15, Figure 16, Figure 17, Figure 18) reveal substantial spatial and temporal variability across the Guir Basin, with simulated annual averages ranging between 30 mm and 416 mm. Across all five Global Climate Models (GFDL, IPSL, MPI, MRI, and UKESM), a consistent downward trend in precipitation is observed compared to the historical baseline (1985–2015). The mean annual precipitation, which previously averaged around 390 mm, is projected to decrease to approximately 280 mm by the end of the 21st century, indicating a significant reduction of nearly 30 %.
Spatially, the maps show that northern high-altitude areas—particularly those near the Atlas Mountains—will continue to receive relatively higher rainfall (>400 mm yr⁻¹), while the southern and southeastern zones of the basin, including the Boudenib Oasis, are expected to experience increasing aridity, with values often below 150 mm yr⁻¹ (Figures 14 – 18). This north–south gradient becomes more pronounced toward 2100, reflecting the intensification of semi-arid to desert conditions across the lower basin.
The GFDL and IPSL models show a sharp reduction in precipitation intensity, especially after 2080, with isolated wet zones shrinking considerably. MPI and MRI simulations depict a more moderate but spatially widespread drying pattern, whereas UKESM highlights a fragmentation of wet areas in the northwest, suggesting a potential shift in storm trajectories and rainfall concentration. Despite differences in model structure, all scenarios converge on the same outcome—a drier, more variable climate regime for the Guir watershed.
This projected decline is consistent with regional and national climate trends, as Morocco has already experienced a steady decrease in precipitation over recent decades [30]. By the 2090s, studies suggest an overall 10–30 % reduction in annual rainfall for southern Morocco, particularly across Saharan and pre-Saharan zones [30]. Such a reduction, combined with rising temperatures, is expected to intensify evapotranspiration rates, reduce soil moisture, and deplete groundwater recharge. The resulting hydrological stress may severely impact surface and subsurface water availability.
For the oasis ecosystems of the Guir Basin, including Boudenib, this reduction in precipitation poses serious challenges. Declining rainfall would lower groundwater levels, threatening the shallow root systems of date palms, which depend on a stable moisture regime. A persistent water deficit could lead to vegetation dieback, soil salinization, and progressive desertification. Moreover, the projected increase in rainfall irregularity—shorter, more intense events separated by prolonged dry spells—may exacerbate erosion and flood risk, further degrading agricultural lands.
Overall, the RCP 8.5 projections indicate that the Guir Basin is likely to undergo increased climatic aridity and hydrological instability(Table 2) by the end of the century. These findings underscore the urgent need for adaptive water management strategies, including improved irrigation efficiency, groundwater monitoring, and integrated watershed management to sustain oasis agriculture and mitigate the ecological and socioeconomic impacts of climate change.
3.2. Simulation of CC Impact on Evapotranspiration ETR
3.2.1. Historical Yearly ET
Figure 19.
Yearly Historical ET using GFDL scenario for the period 1985-2015.
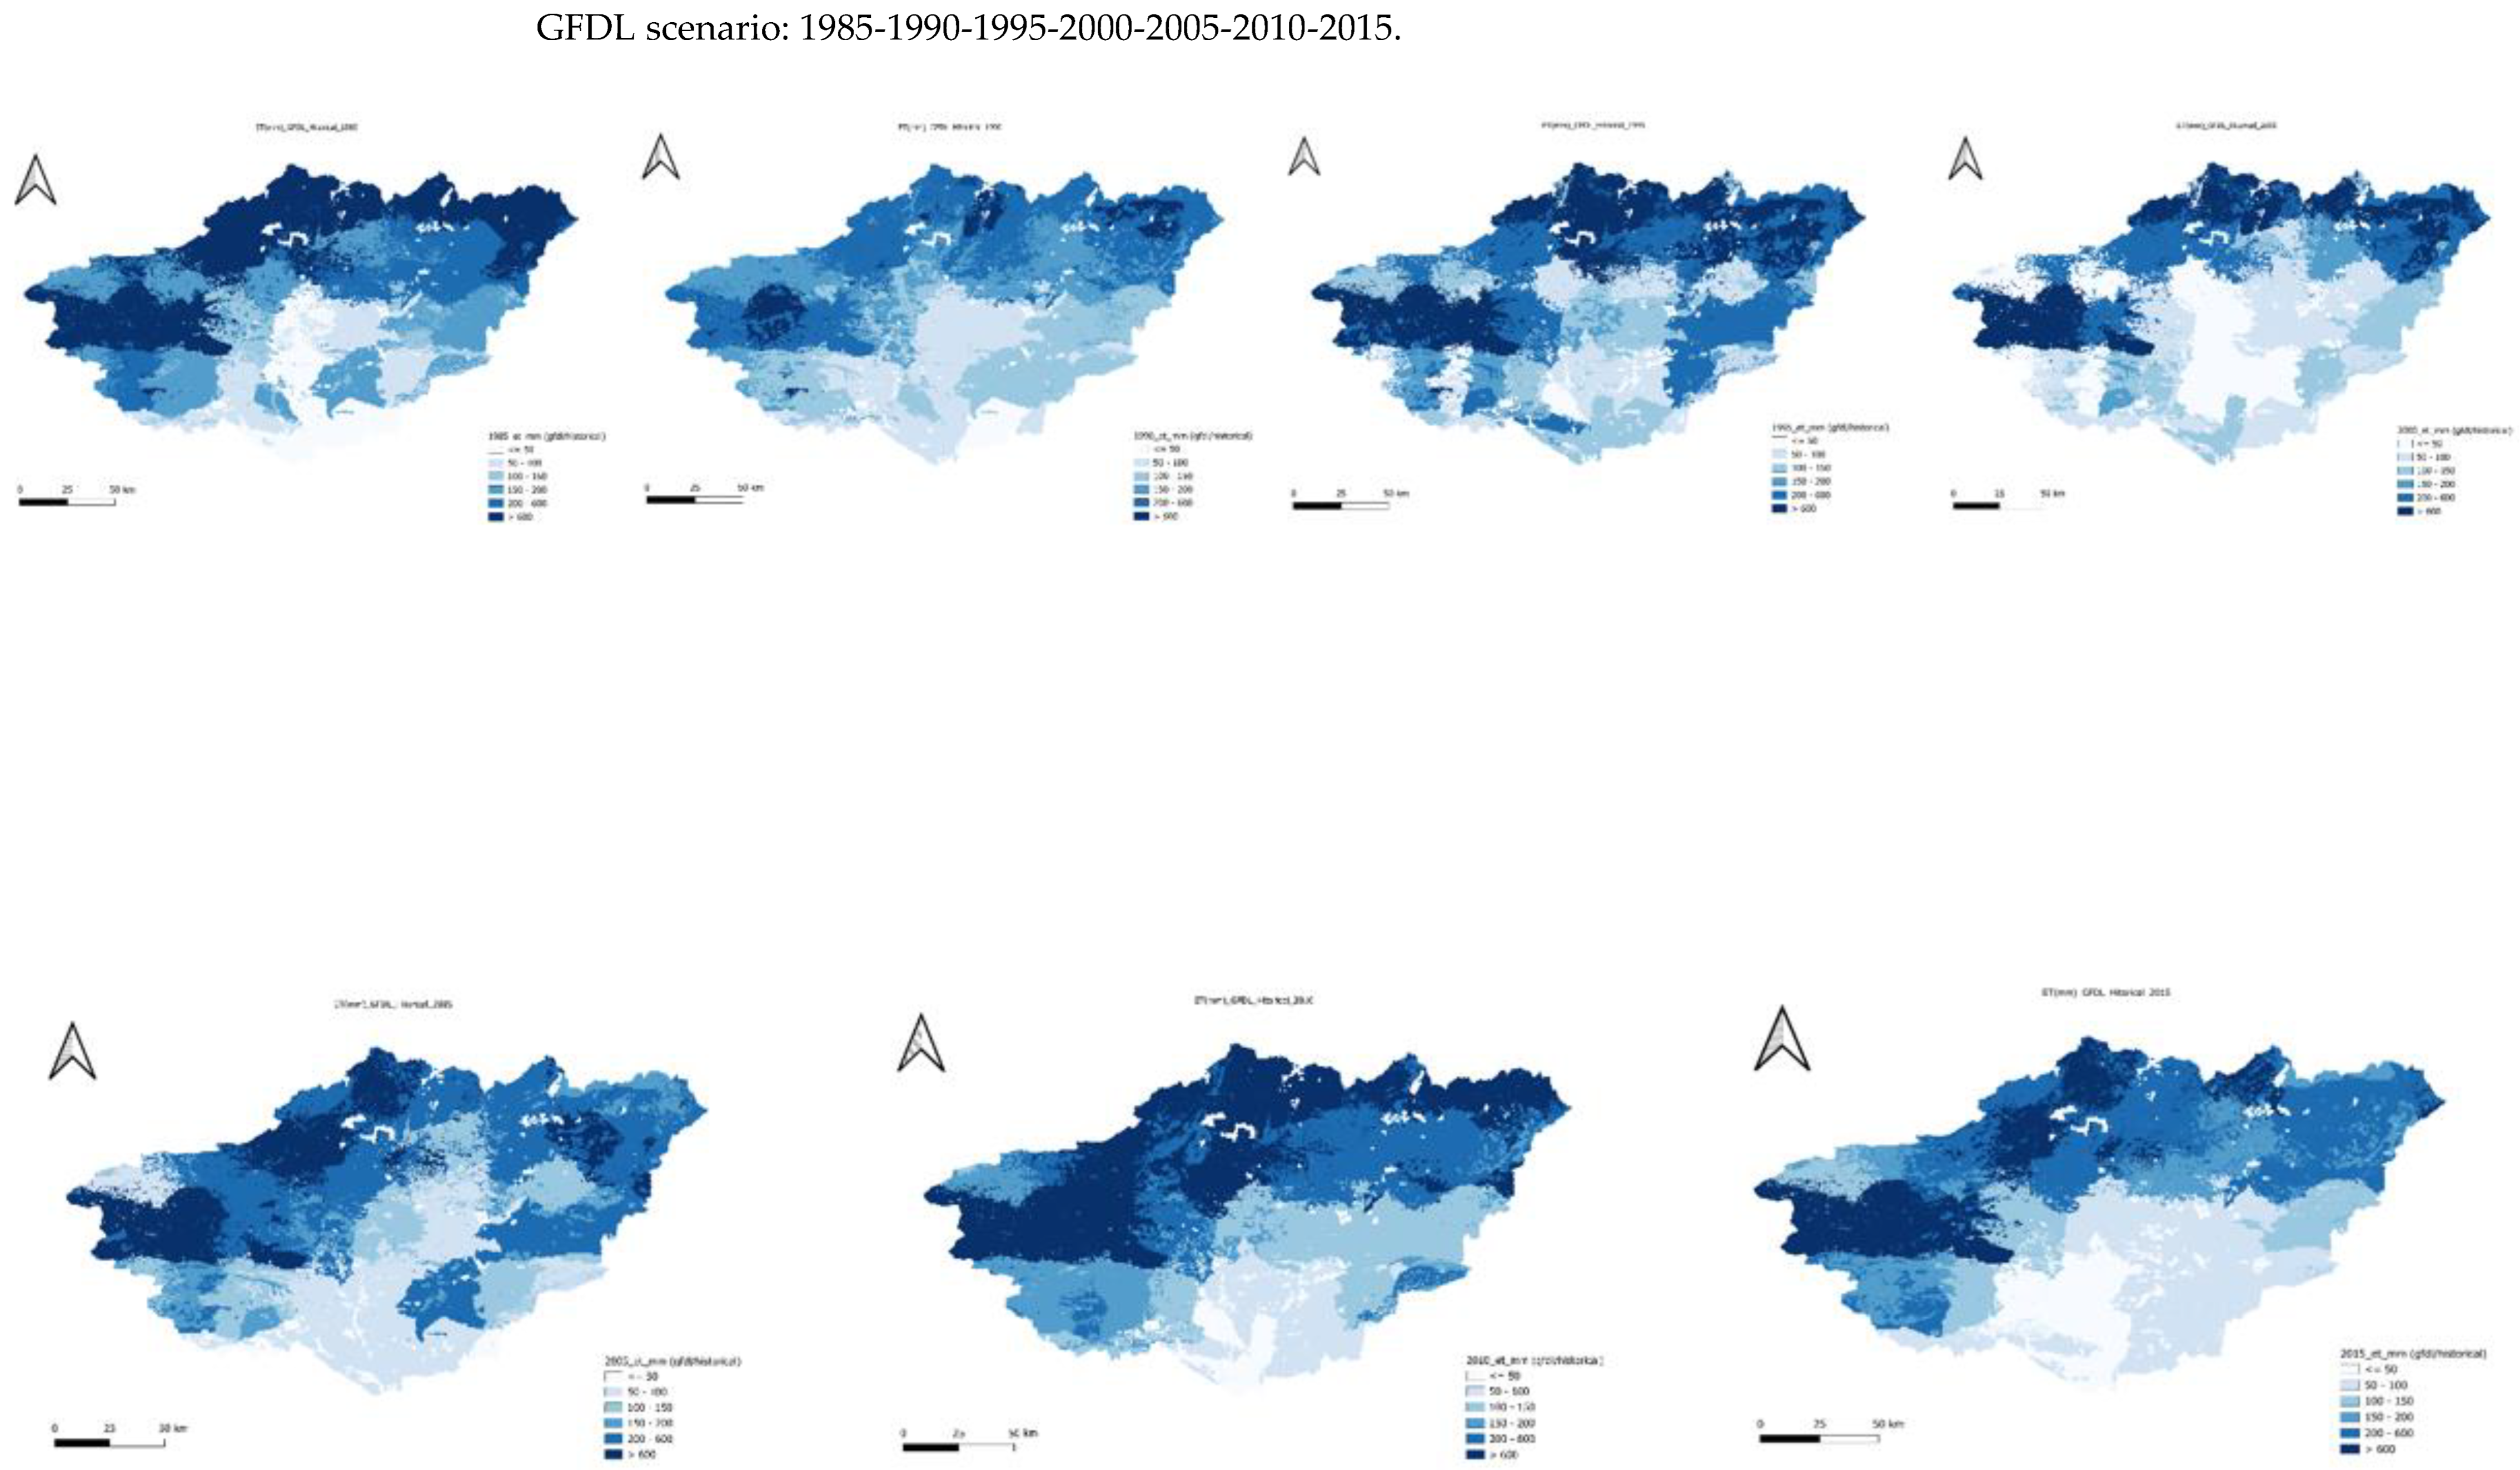
Figure 20.
Yearly Historical ET using IPSL scenario for the period 1985-2015.
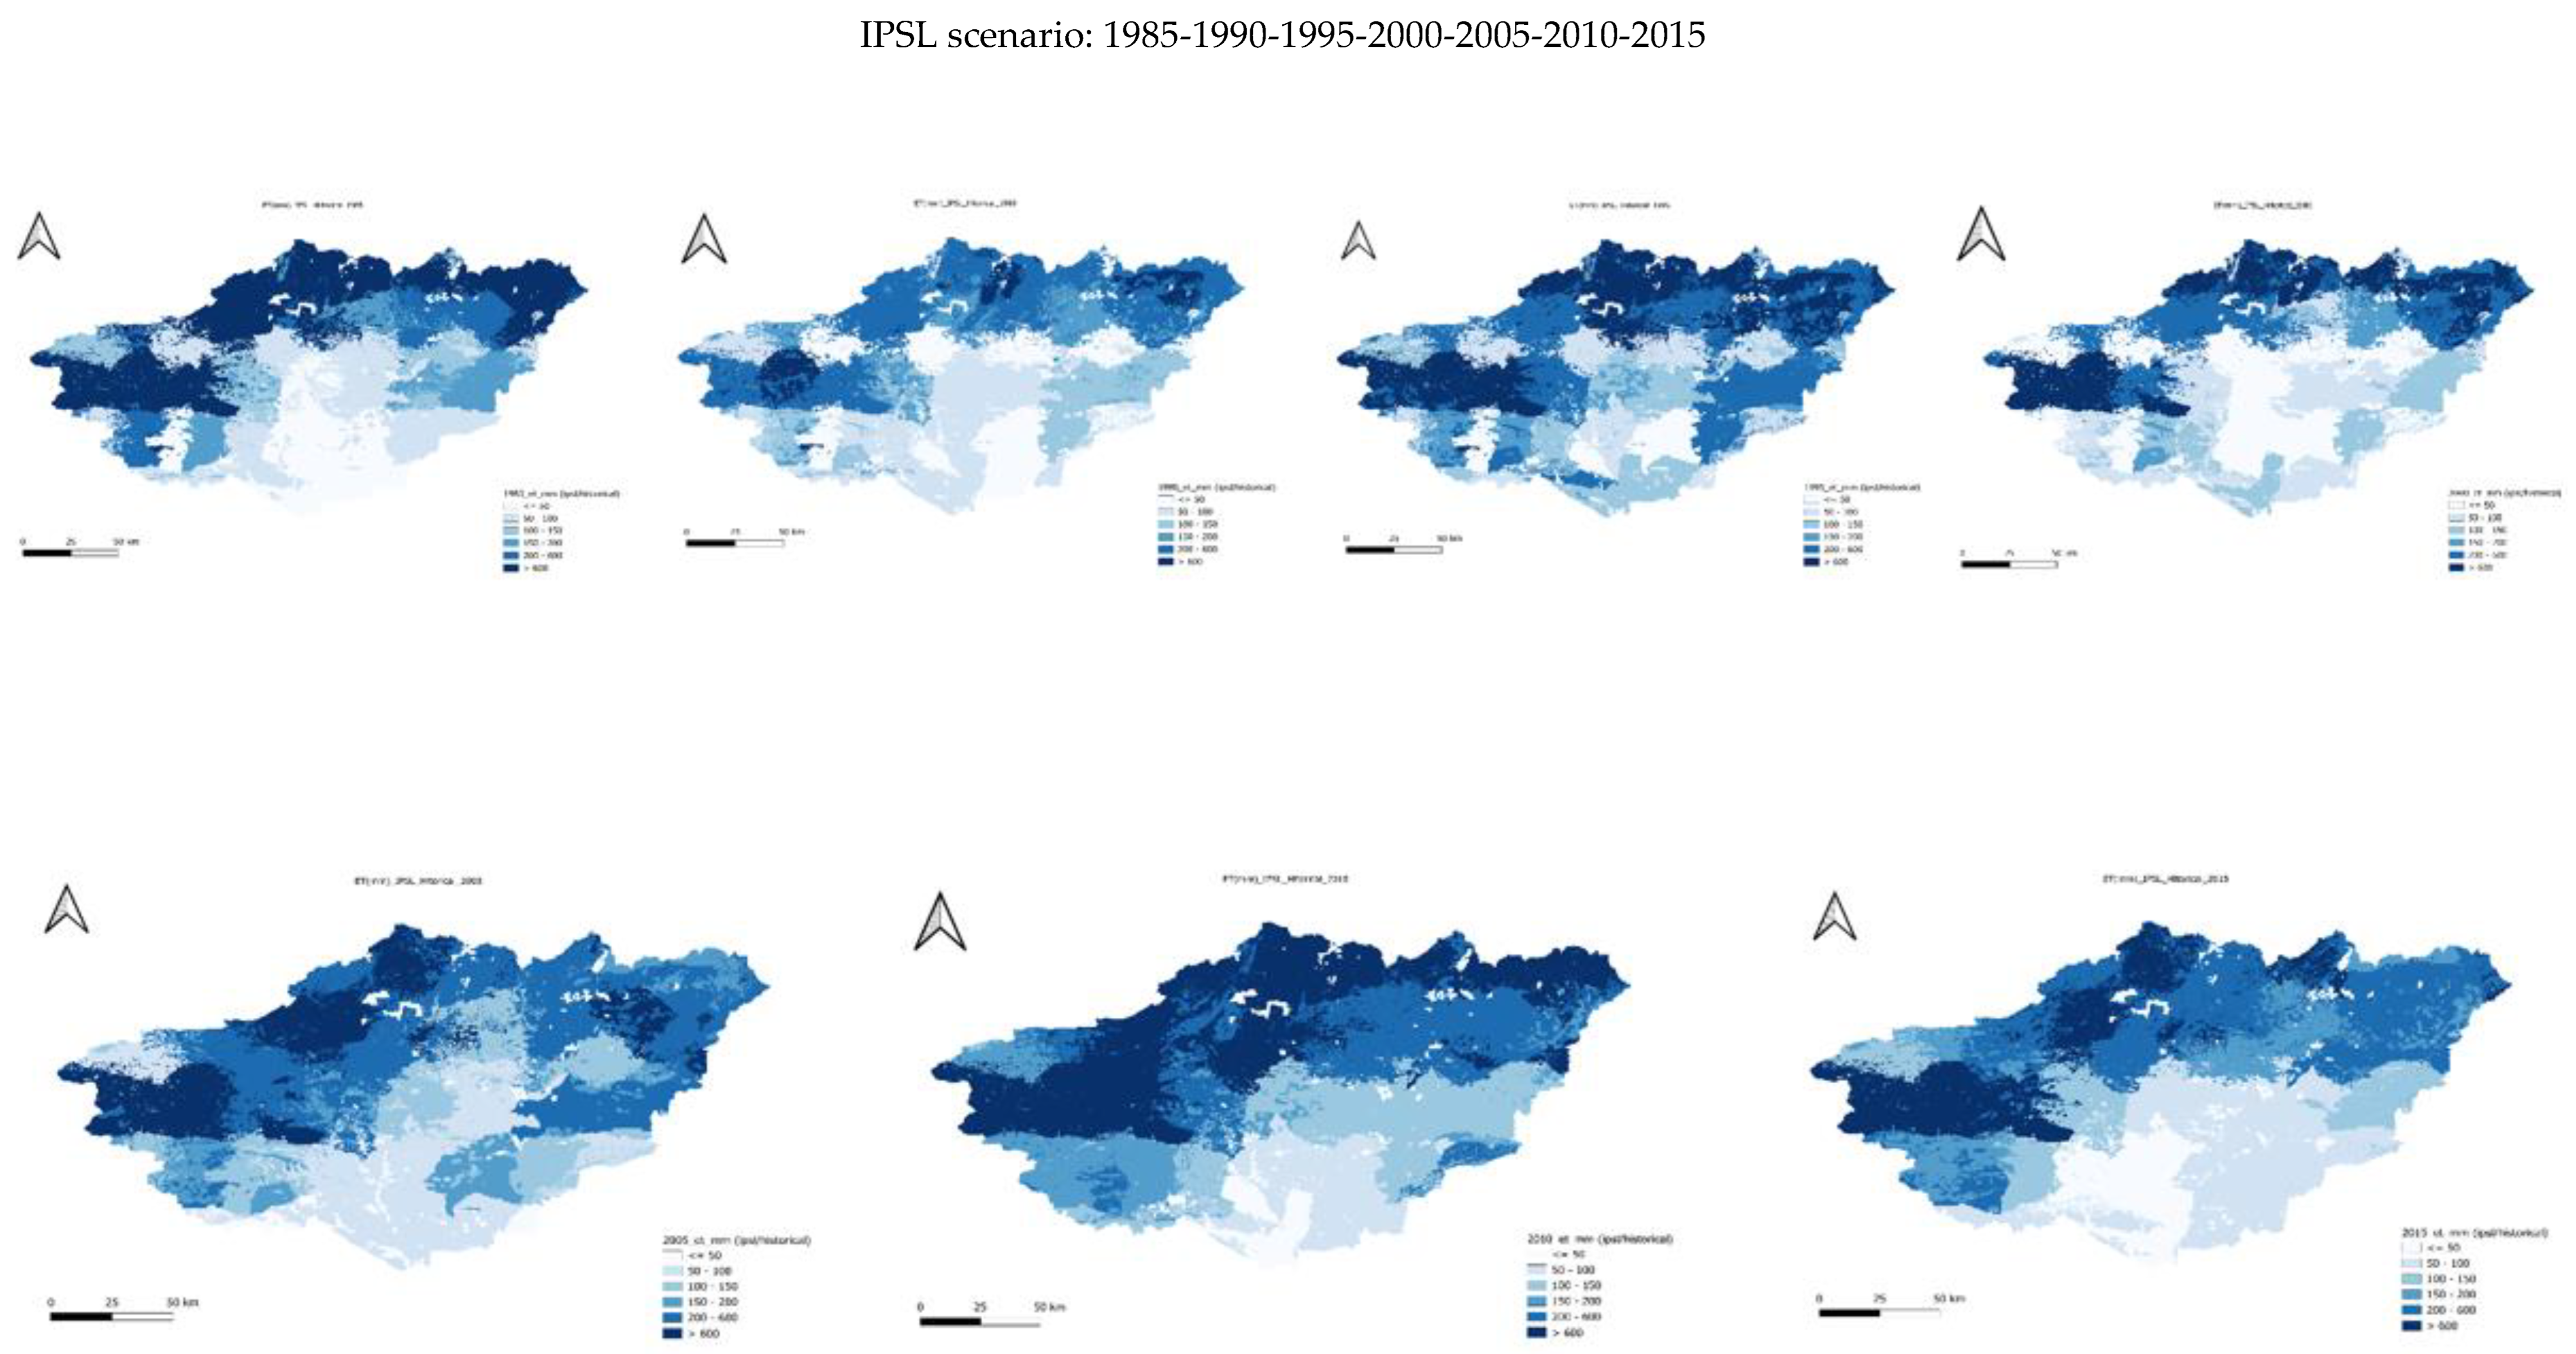
Figure 21.
Yearly Historical ET using MPI scenario for the period 1985-2015.
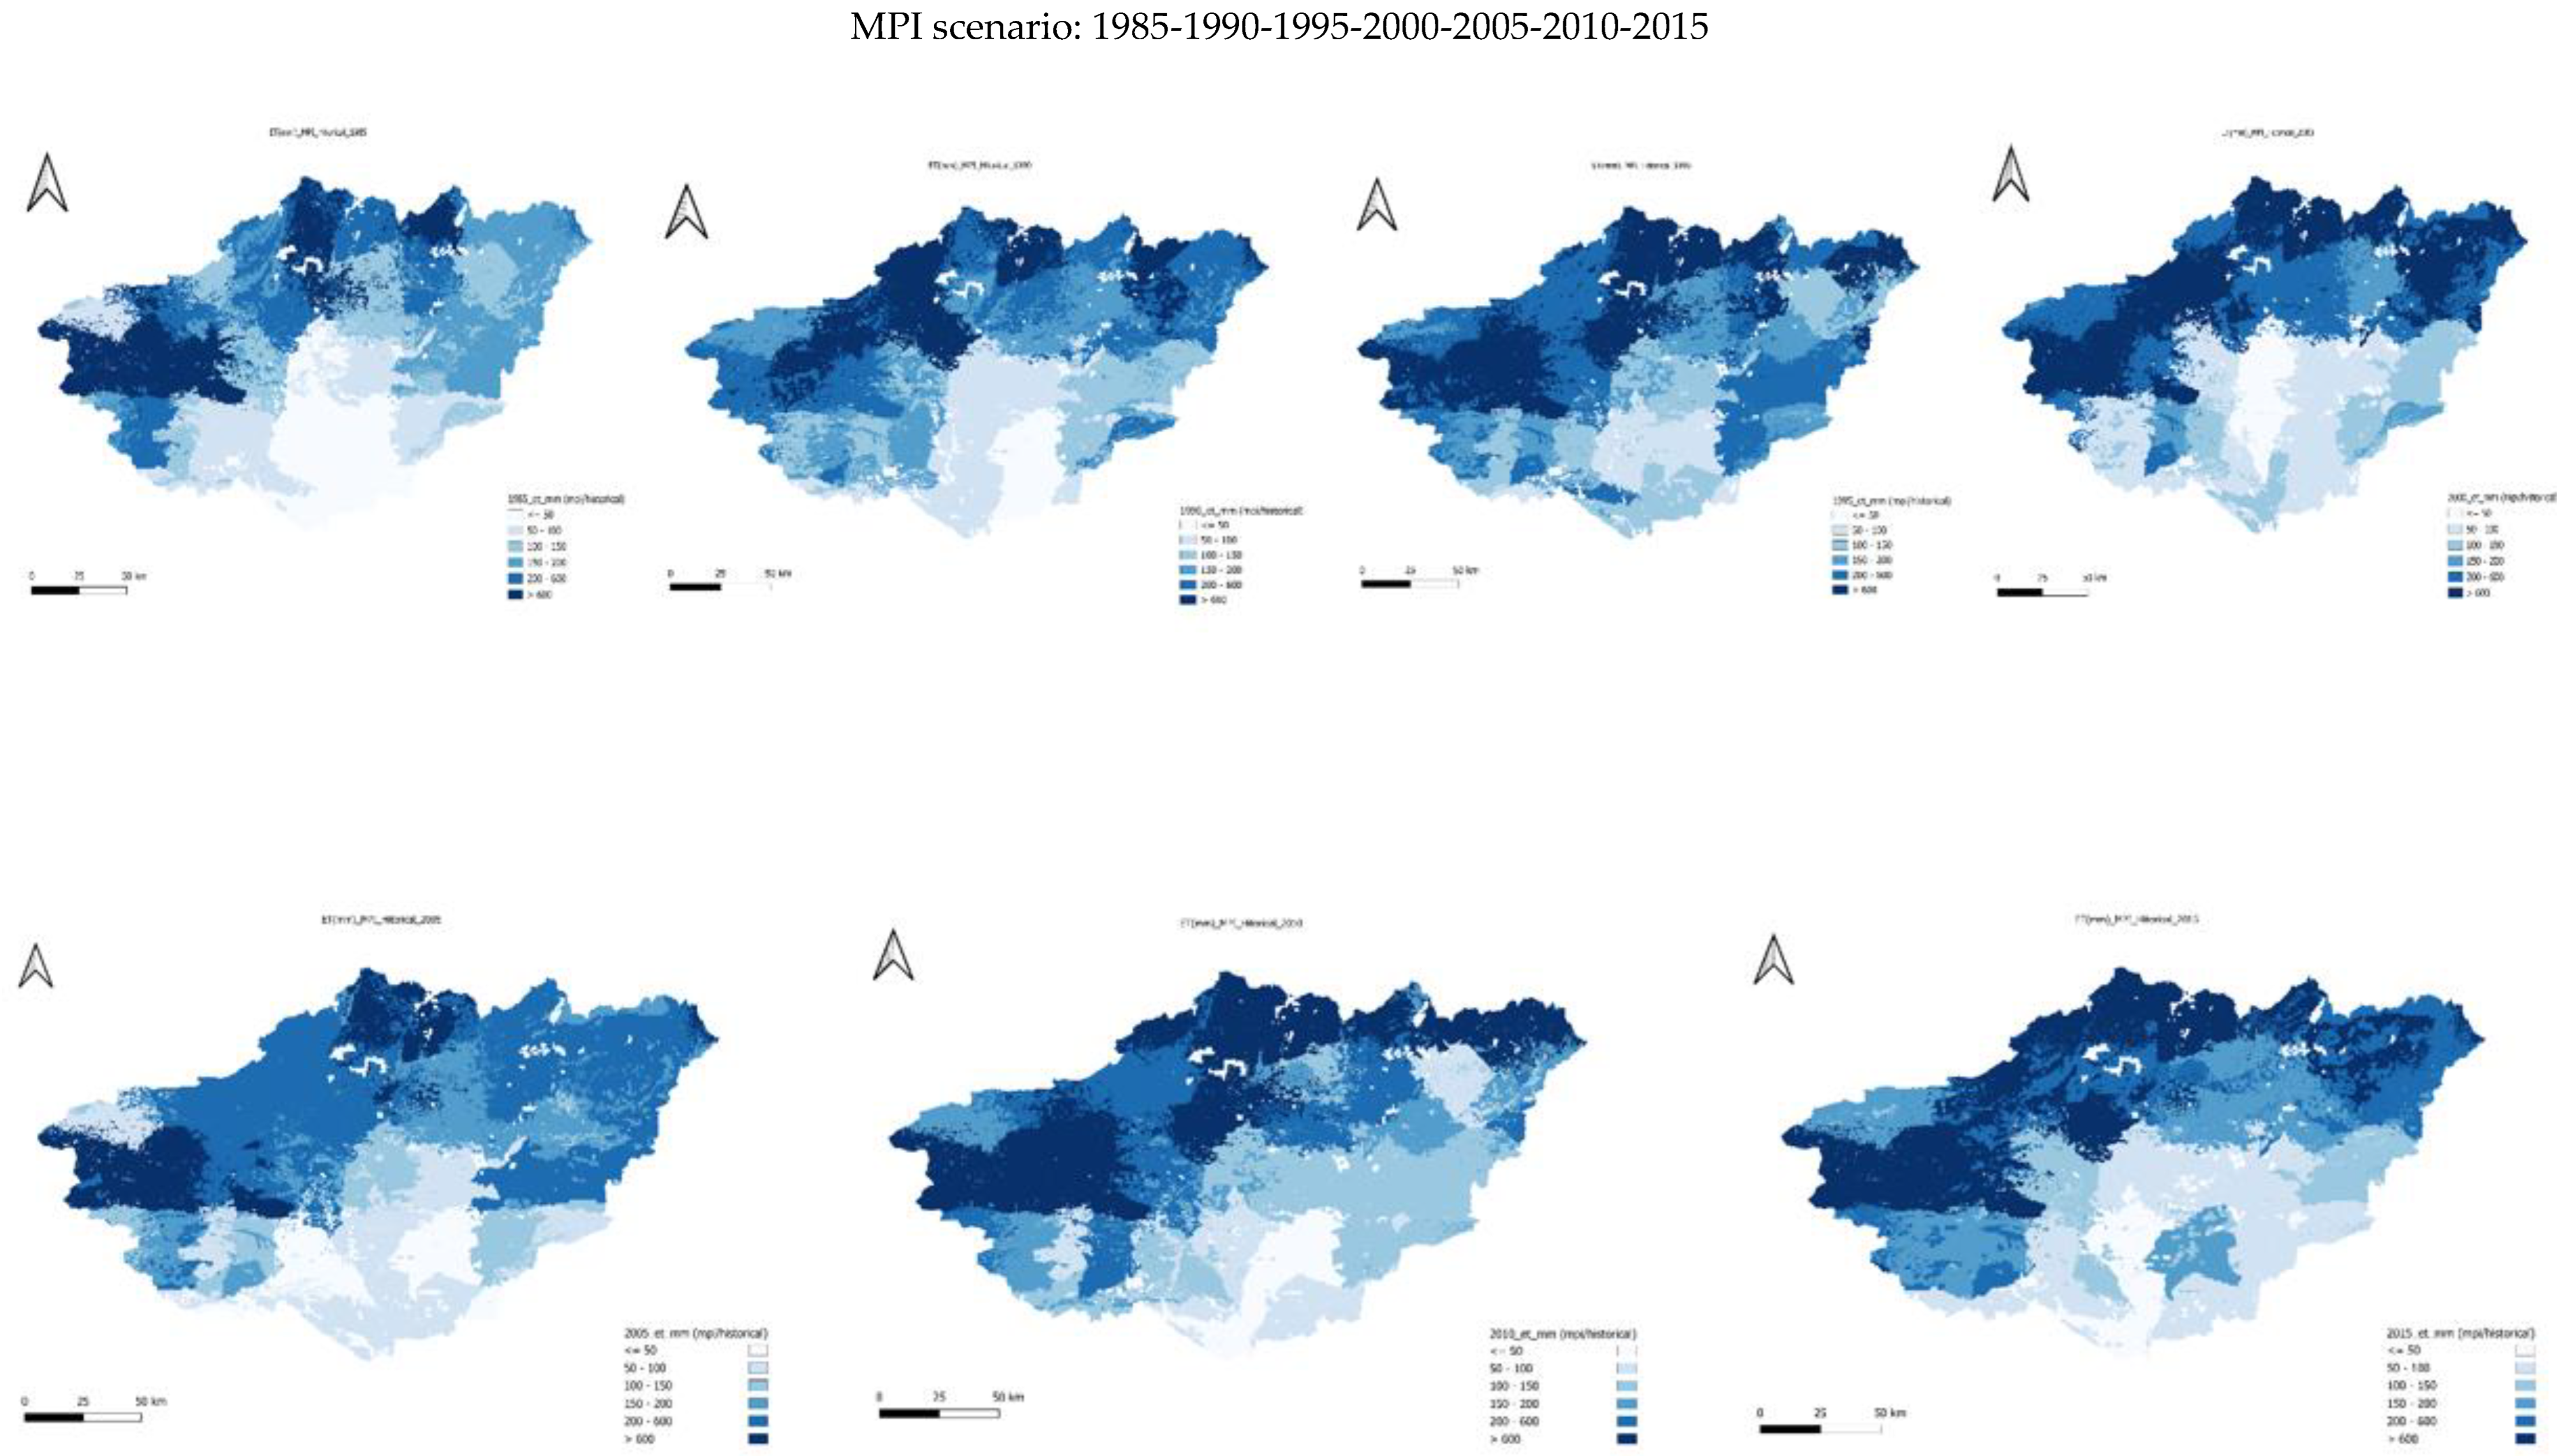
Figure 22.
Yearly Historical ET using MRI scenario for the period 1985-2015.
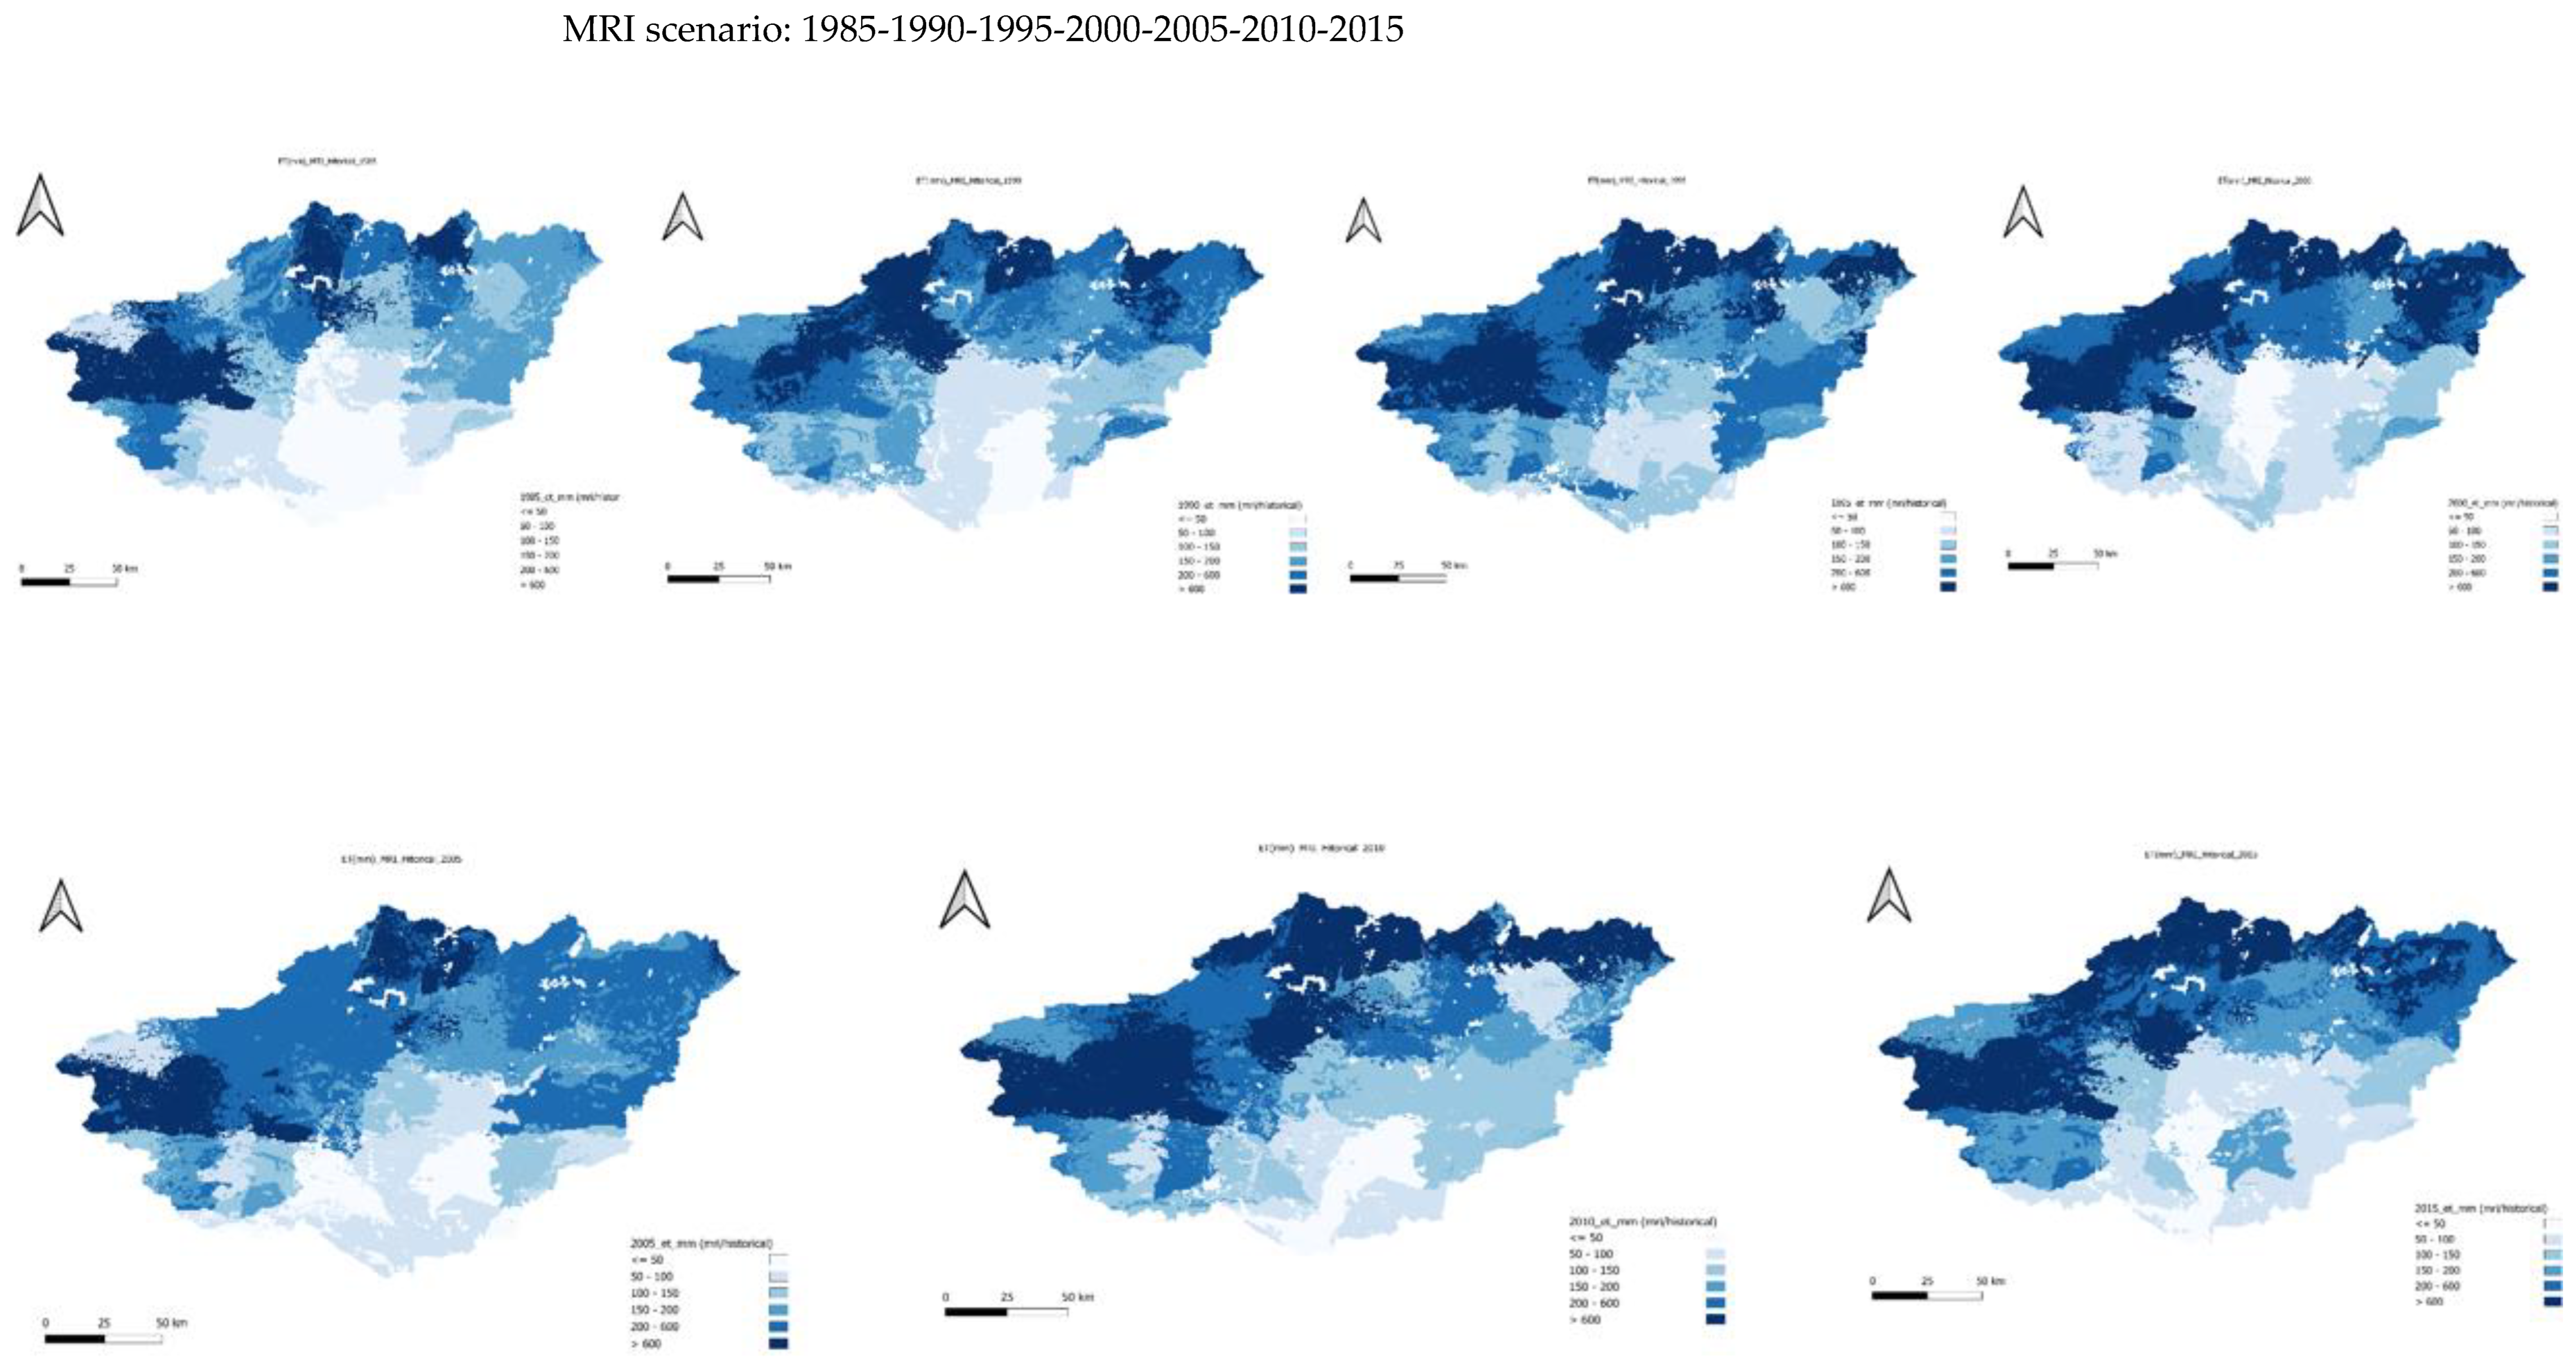
Figure 23.
Yearly Historical ET using UKESM scenario for the period 1985-2015.
The maps below present the simulated historical evapotranspiration (ETR) patterns in the Guir basin for the period 1985–2015, derived from the five Global Climate Models (GCMs) described in the methodology. Simulations were generated at five-year intervals to capture both interannual variability and long-term trends in ETR. This temporal resolution provides valuable insights into how evapotranspiration has evolved under historical climate variability. The results reflect the combined influence of temperature, precipitation, and land surface characteristics on the basin’s hydrological processes. Higher ETR values are typically associated with warmer conditions and increased solar radiation, while regions with lower precipitation or sparse vegetation exhibit reduced evapotranspiration rates. The use of multiple GCMs enhances the robustness of these findings by accounting for model uncertainty and highlighting spatial consistency across simulations. Overall, this historical analysis establishes a baseline for assessing future ETR responses to climate change in the Guir watershed.
The simulated historical evapotranspiration (ET) patterns across the Guir basin, derived from the five GCMs (GFDL, IPSL, MPI, MRI, and UKESM), exhibit a consistent spatial distribution and temporal evolution between 1985 and 2015 (Figure 19, Figure 20, Figure 21, Figure 22 and Figure 23). The historical ET values range from approximately 20 mm to 450 mm/year, showing clear spatial differentiation driven by climatic and physiographic conditions.
Higher ET rates are systematically concentrated in the northern and central zones, particularly in the High Atlas Mountains, where precipitation and vegetation density are higher. These regions experience elevated ET values exceeding 400 mm/year, mainly between October and April, corresponding to the wetter and cooler months. Conversely, low ET values (<150 mm/year) dominate the southern and southeastern parts of the basin, particularly in arid and semi-arid zones such as Boudenib, where precipitation is scarce and temperatures are persistently high.
This spatial pattern reflects the strong coupling between ET, precipitation, and temperature, confirming that ET variability is primarily driven by water availability rather than atmospheric demand. Areas characterized by low rainfall and high air temperature—such as the desert fringes—display the lowest ET rates, consistent with limited soil moisture and sparse vegetation cover.
Furthermore, soil characteristics also contribute significantly to this spatial differentiation. The southeastern and southern parts of the basin are dominated by sandy soils, with more than 70% sand content, as indicated by the soil data. These soils possess low water-holding capacity and high infiltration rates, resulting in limited surface evaporation. Consequently, ET values remain low due to rapid percolation and minimal moisture retention near the surface.
Temporally, ET in the Guir basin demonstrates a progressive increase from 1985 to 2015, with mean annual ET rising from approximately 340 mm to 450 mm. This upward trend aligns with the observed increase in precipitation over the same period, as shown in the historical P simulations, suggesting enhanced water availability for evaporation and transpiration. In addition, the expansion of irrigated agricultural areas—notably within oases such as Boudenib—has likely contributed to increased ET, as irrigation introduces additional surface moisture and promotes localized humidity, reinforcing microclimatic feedbacks.
These conditions have favored the development of a localized oasis microclimate, characterized by relatively cooler and more humid conditions than the surrounding arid landscape. The denser and healthier vegetation cover in these irrigated zones has further increased transpiration, amplifying total ET rates.
Overall, the results from all five GCMs confirm a robust and coherent historical ET pattern across the Guir basin, where topography, soil type, and climate jointly control evapotranspiration dynamics. The observed increase in ET over the 30-year period underscores the sensitivity of the basin’s hydrological balance to both natural climatic variability and anthropogenic land management, providing a solid baseline for evaluating future climate change impacts on water availability.
3.2.2. RCP8.5 yearly ET
Figure 24.
Future RCP8.5 ET using GFDL scenario for the period 2071-2100.
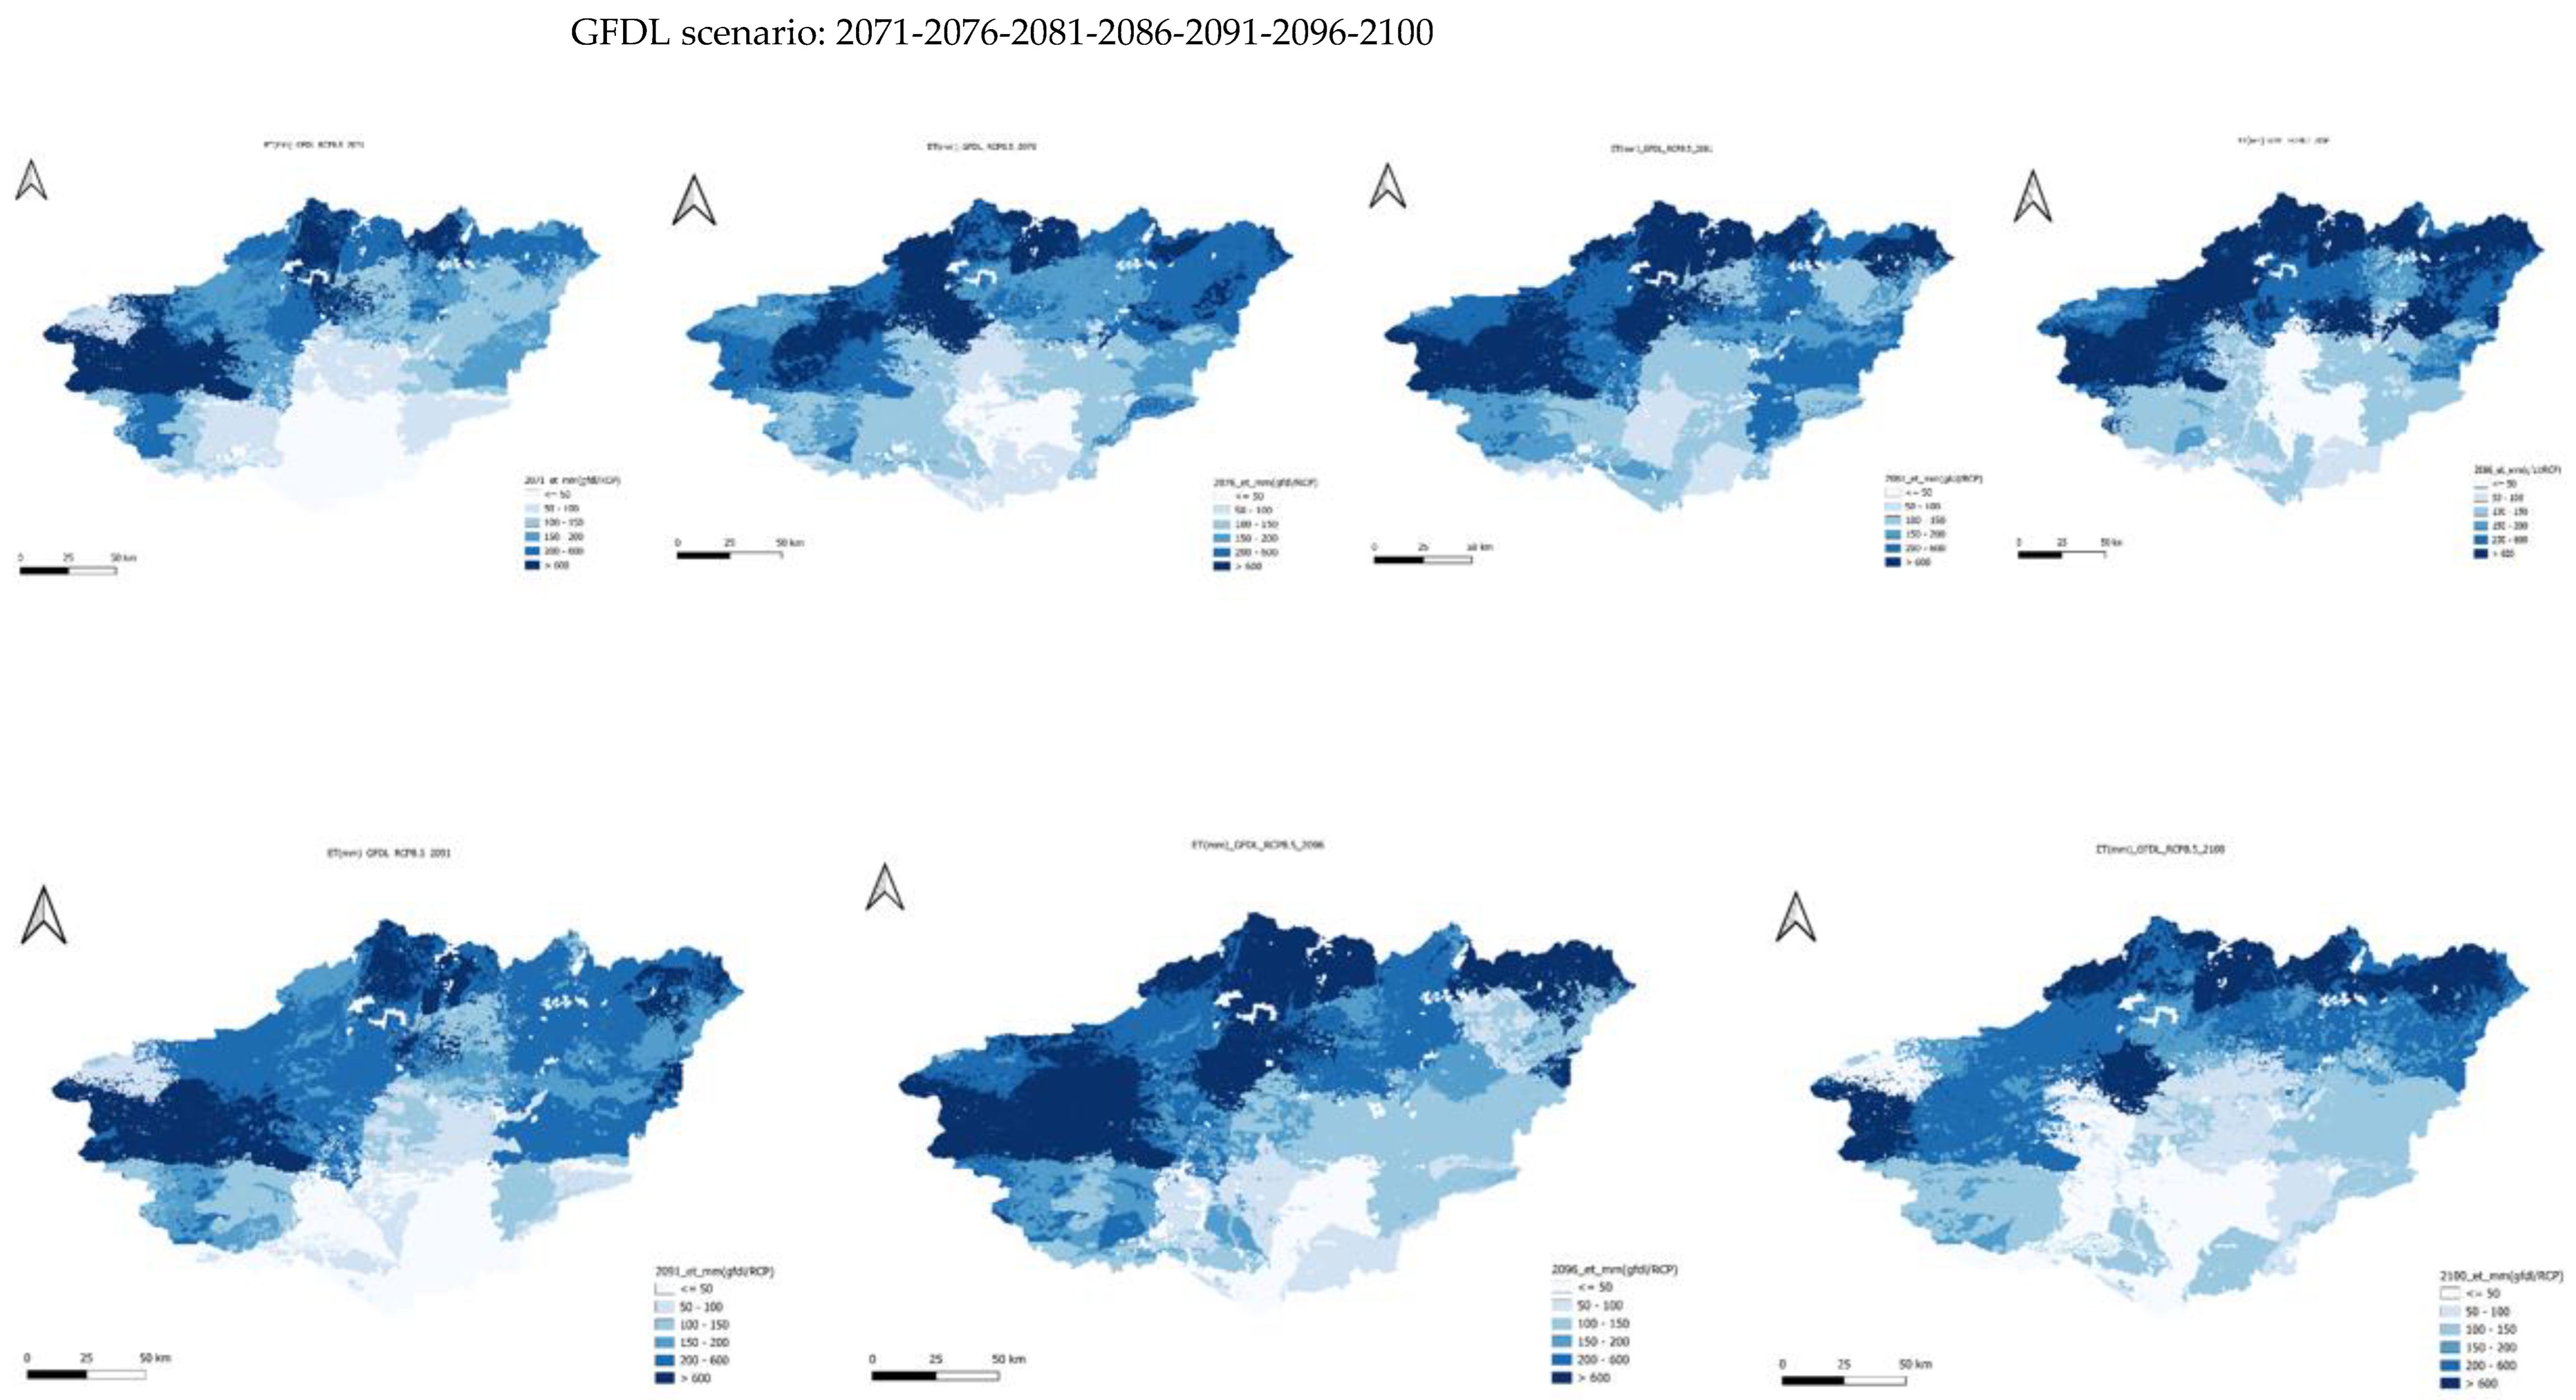
Figure 25.
Future RCP8.5 ET using IPSL scenario for the period 2071-2100.
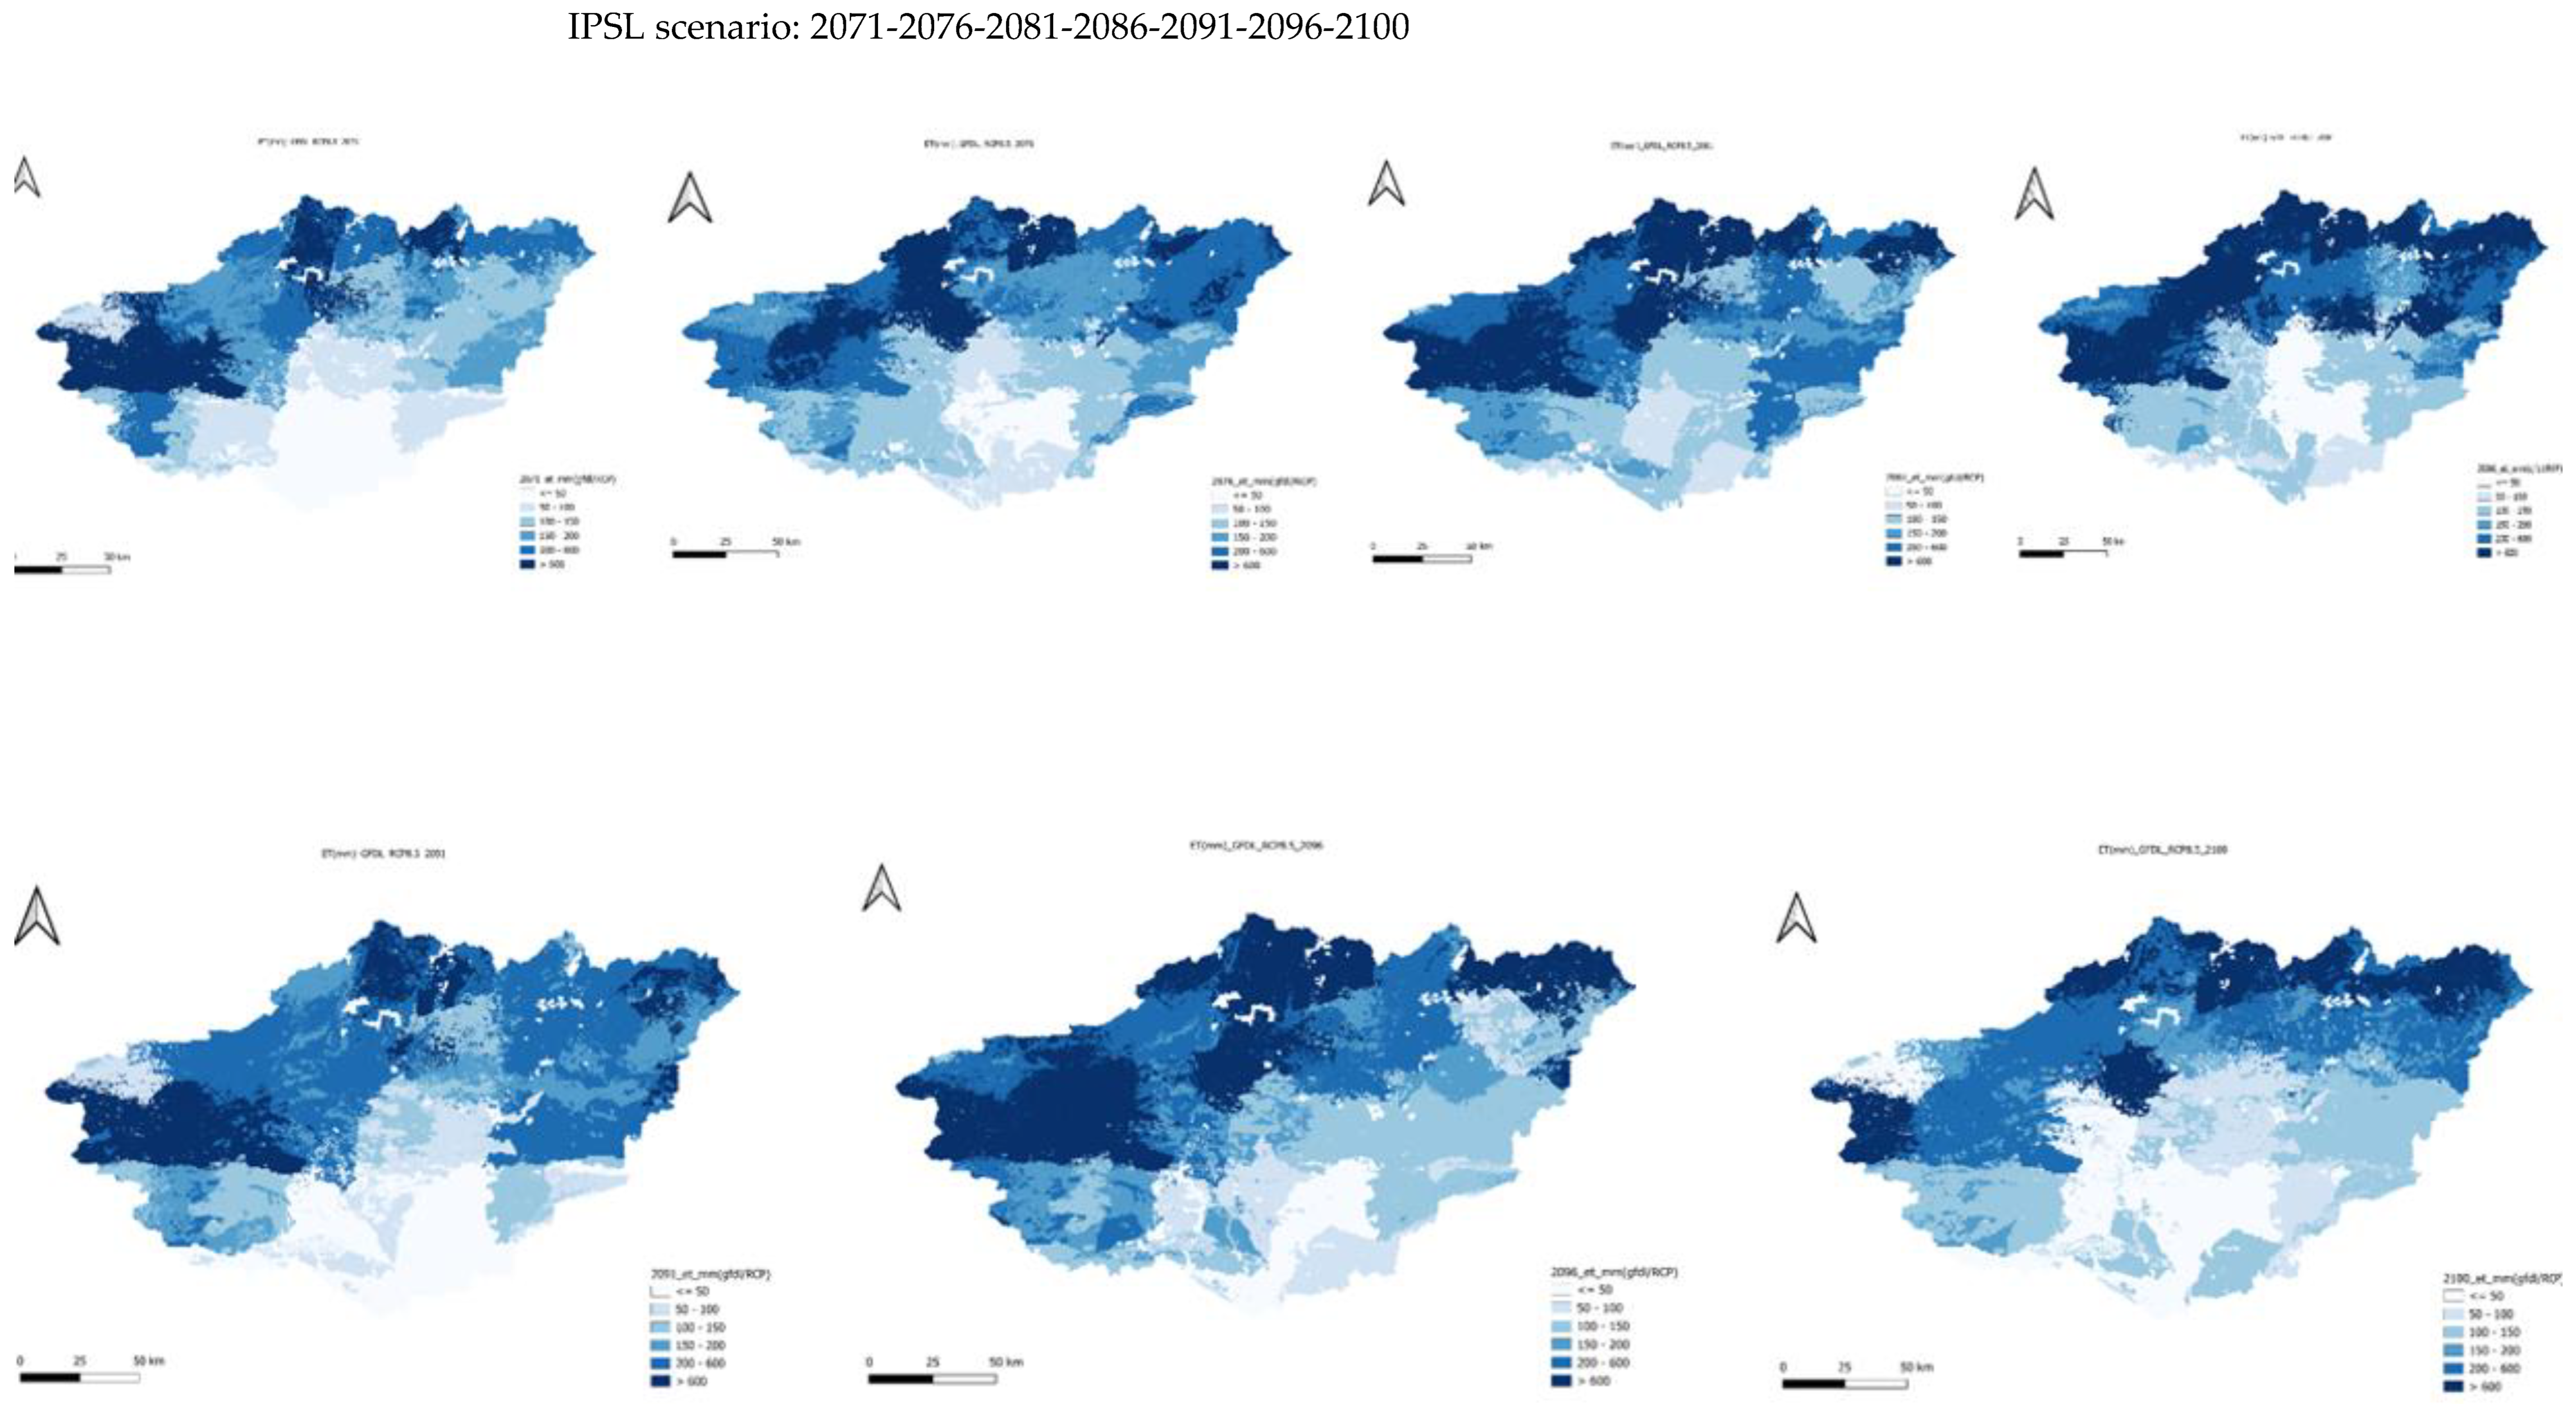
Figure 26.
Future RCP8.5 ET using MPI scenario for the period 2071-2100.
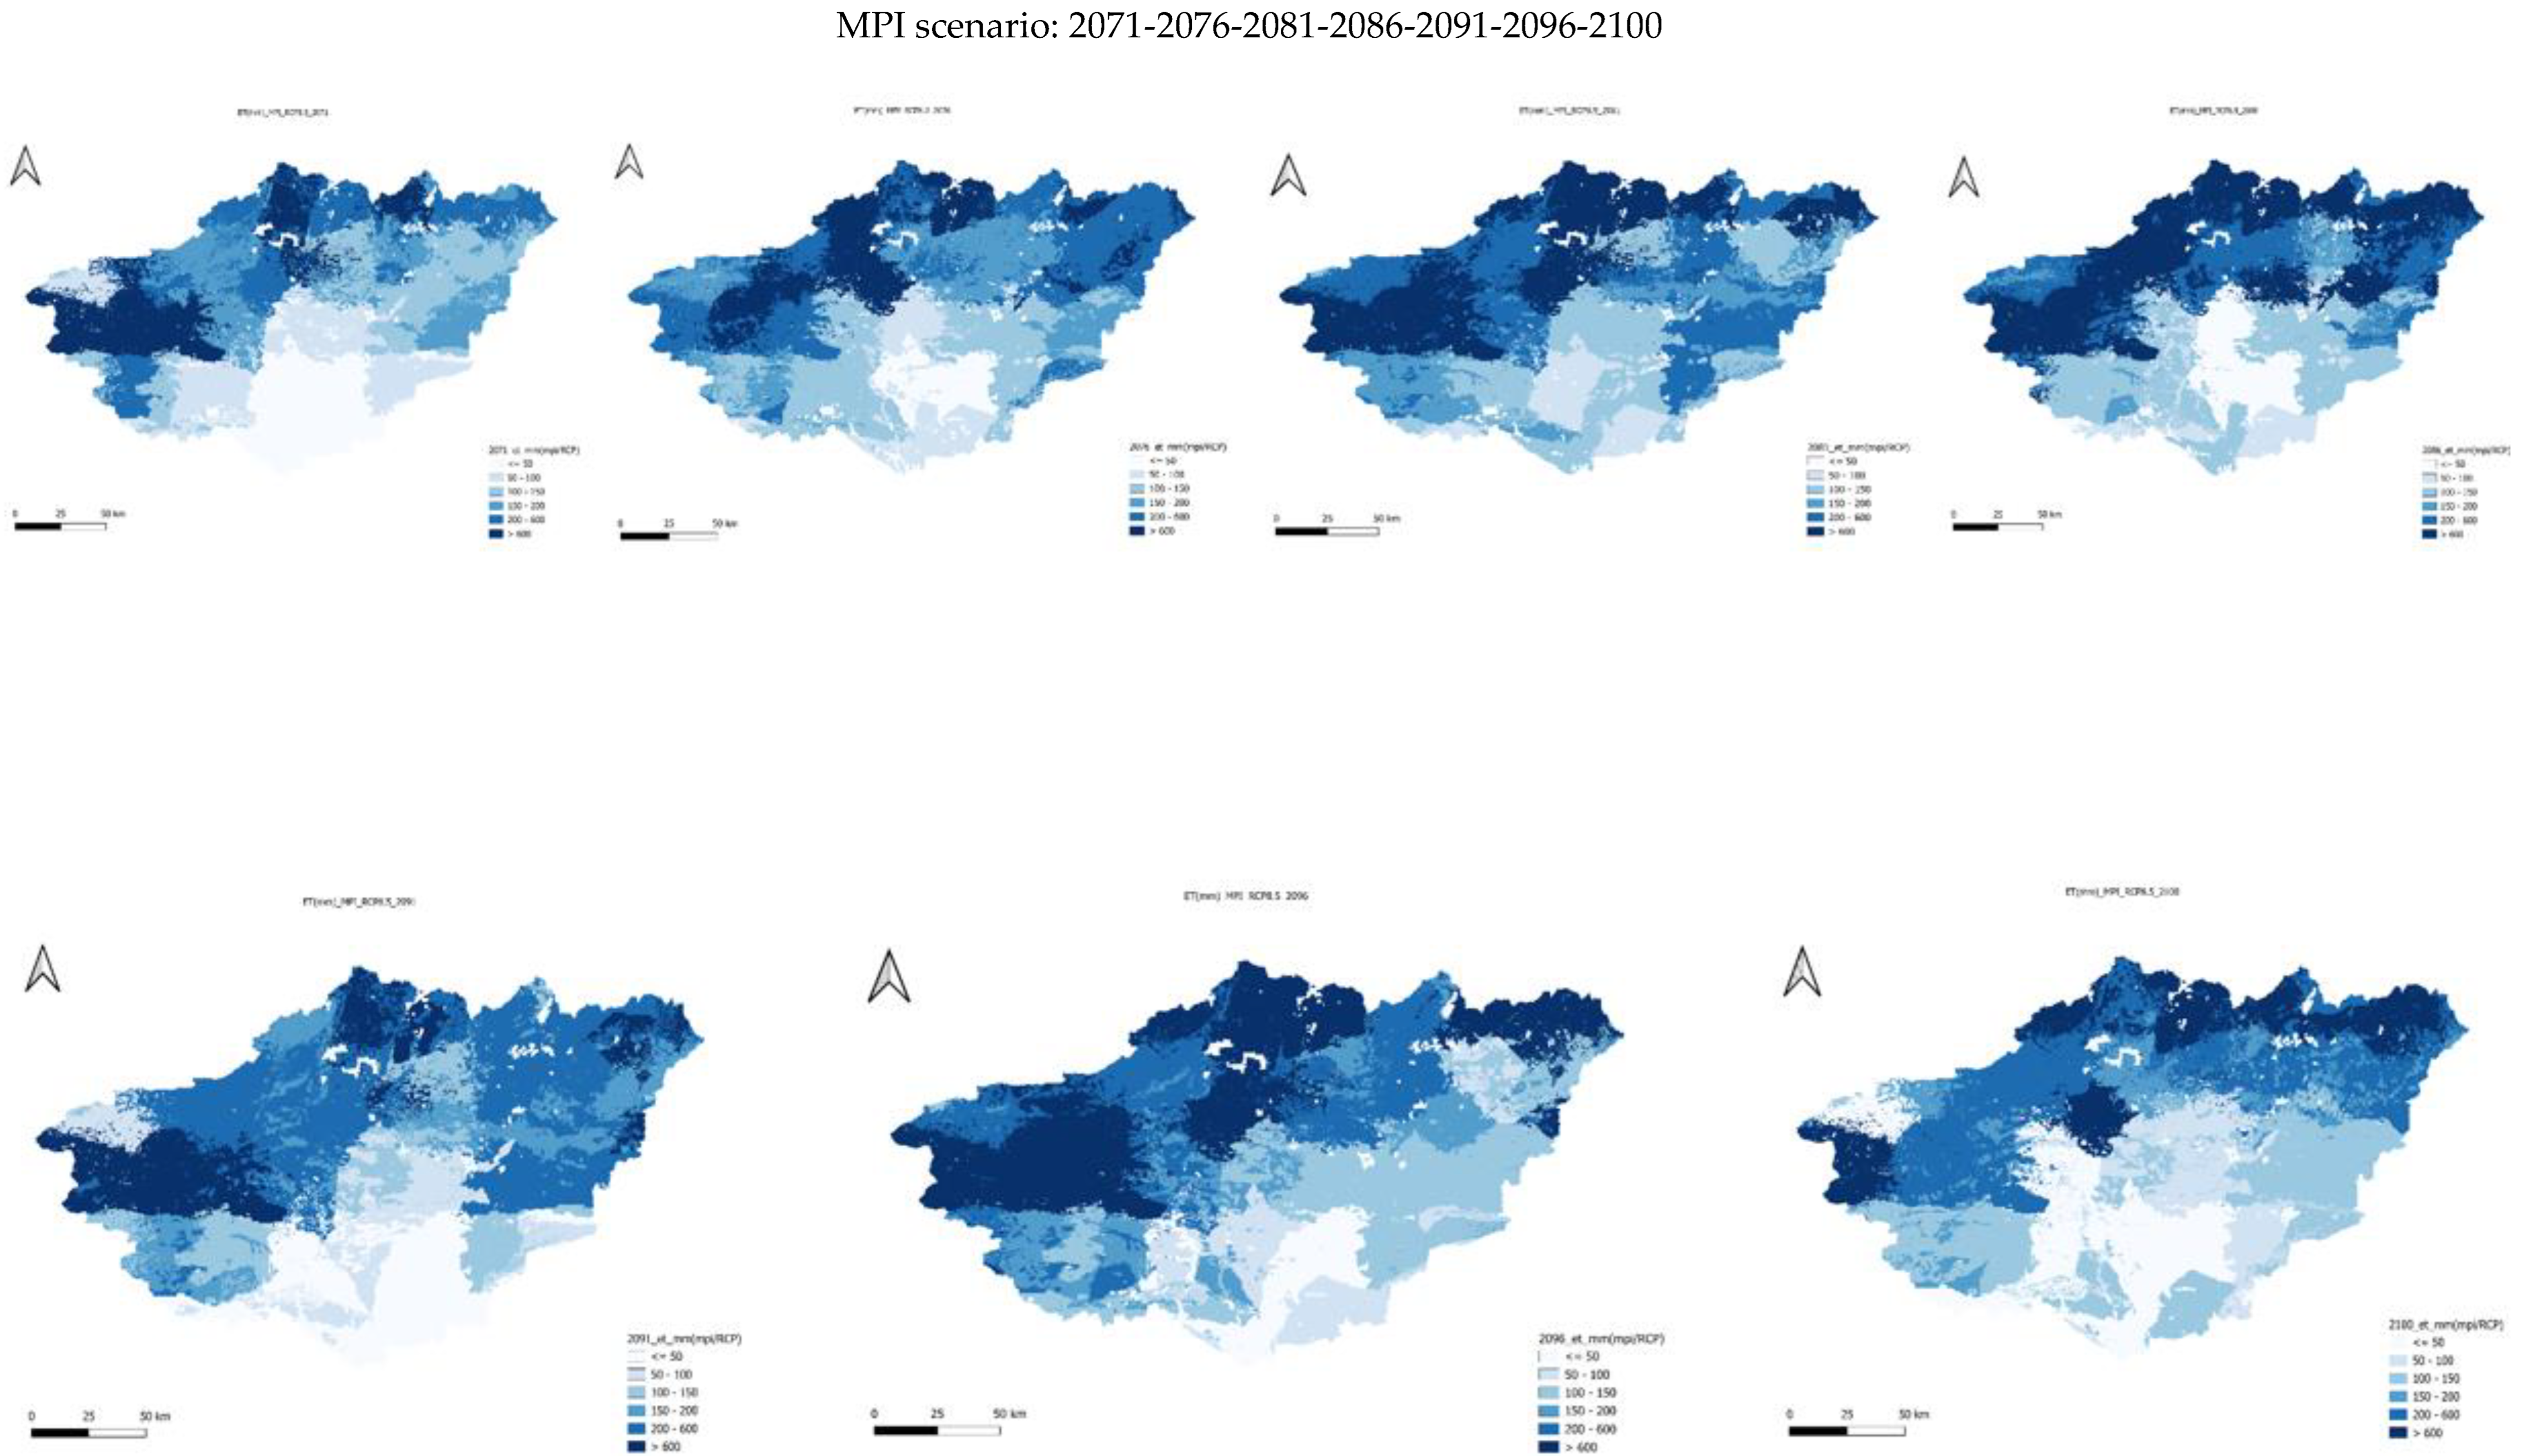
Figure 27.
Future RCP8.5 ET using MRI scenario for the period 2071-2100.
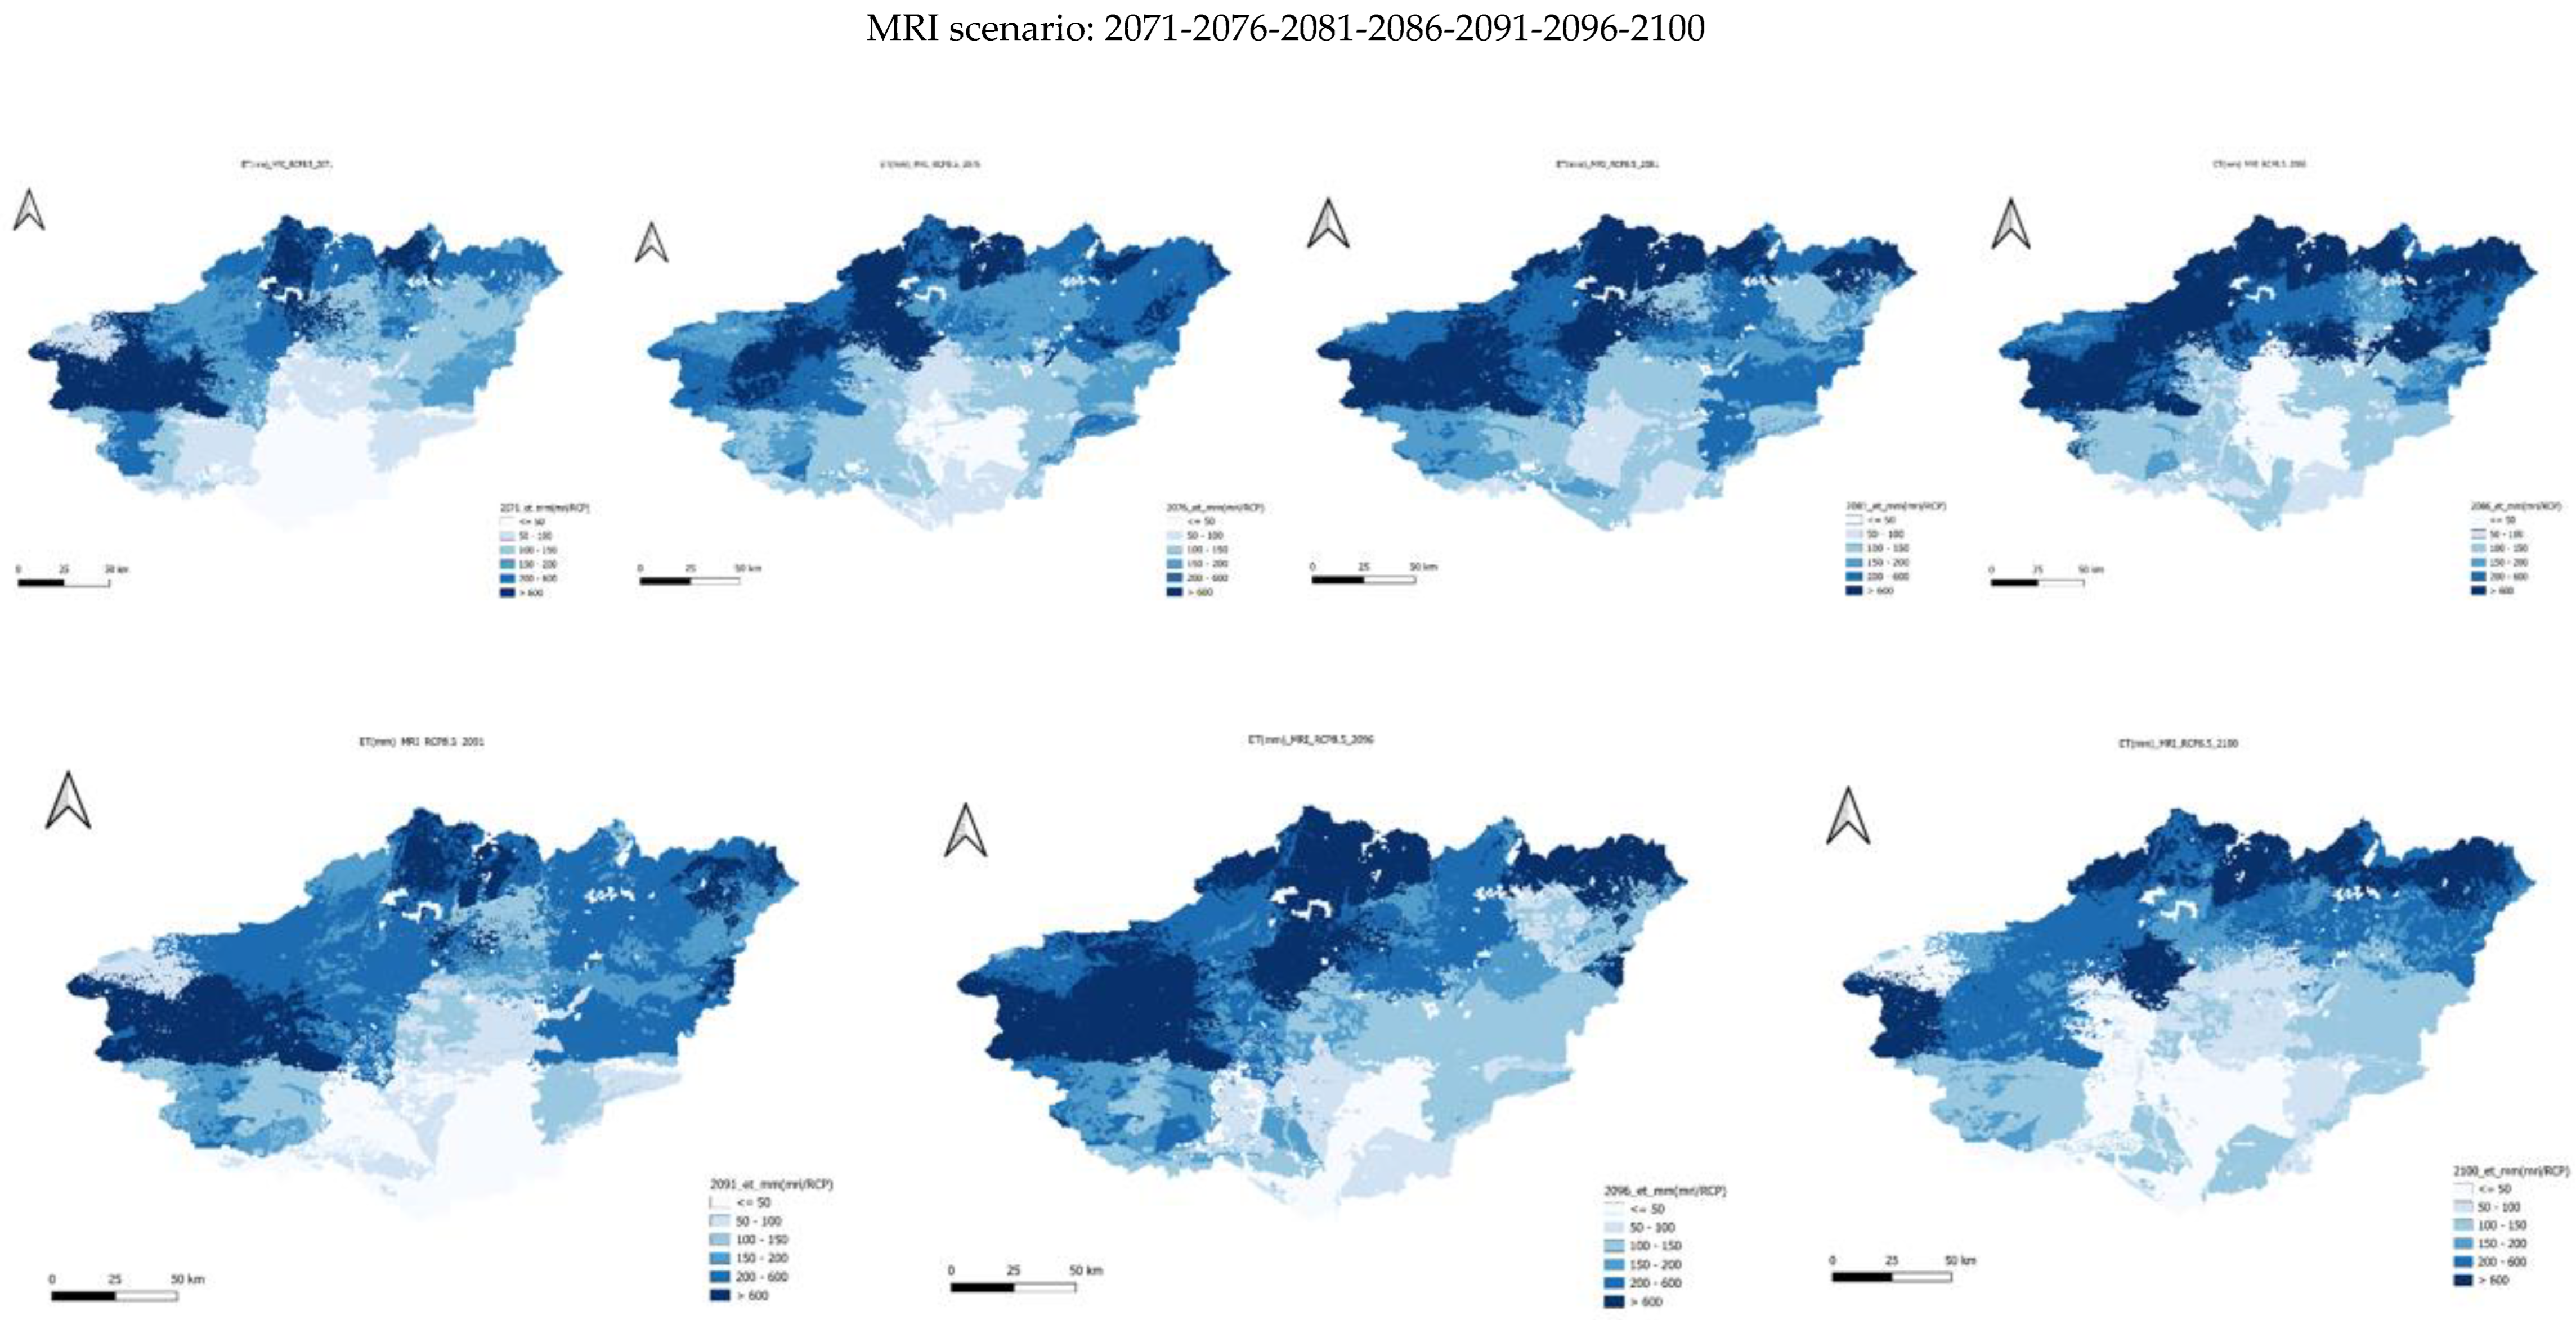
Figure 28.
Future RCP8.5 ET using UKESM scenario for the period 2071-2100.
Future evapotranspiration (ET) projections for the period 2071–2100 under the RCP 8.5 scenario, as simulated by the five GCMs (GFDL, IPSL, MPI, MRI, and UKESM), show a spatial distribution pattern consistent with the historical period but with generally lower magnitudes. The simulated annual average ET varies between 10 mm and 380 mm, reflecting the influence of projected climatic drying and rising temperatures. Across all models, higher ET values are concentrated in the northern and northwestern parts of the Guir basin, particularly in the High Atlas Mountains, where orographic effects and residual moisture availability support greater evapotranspiration. In contrast, the southern and southeastern zones, dominated by desert and oasis ecosystems, exhibit significantly lower ET values, largely due to declining precipitation, sparse vegetation cover, and increasingly arid conditions.
A consistent declining trend in ET is evident across all scenarios, with basin-wide averages projected to decrease from approximately 380 mm to 314 mm by the end of the century. This reduction aligns with the simulated decrease in precipitation and is primarily attributed to reduced soil moisture availability. As rainfall becomes increasingly irregular and total annual amounts decline, the capacity for both soil evaporation and plant transpiration diminishes. This decrease in ET reflects a broader weakening of the regional hydrological cycle, as projected under intensifying climate change.
Despite the general decline, local increases in ET are observed in limited high-altitude zones, particularly under the GFDL and UKESM models, where snowmelt and cooler microclimates may temporarily sustain higher moisture availability. However, the overall pattern suggests enhanced aridity and expanding low-ET areas in the southern basin, especially near Boudenib and Taghit oases, indicating heightened vulnerability to water scarcity.
These findings highlight (Table 3) the interdependence between ET, precipitation, and temperature. Projected temperature increases—up to 3.5°C by the 2090s (UNDP, 2012)—will accelerate potential evapotranspiration rates while simultaneously reducing effective water availability due to declining rainfall (10–30% reduction; [27]). This combination of higher thermal demand and lower moisture supply will intensify water stress, affecting both surface water resources and groundwater recharge. Consequently, irrigation requirements in agricultural zones, particularly within oasis systems, are expected to increase substantially, exacerbating competition over limited water resources.
For oasis ecosystems, the projected decline in actual ET signifies a critical stress on vegetation and local microclimates(table3). Reduced rainfall and groundwater levels will weaken palm tree root systems, leading to vegetation dieback, soil degradation, and desertification. The loss of vegetation cover will further diminish local humidity and cooling, reinforcing a positive feedback loop of drying. These results underscore the urgent need for adaptive water management strategies in the Guir basin, such as optimizing irrigation efficiency, promoting drought-resistant crops, and reinforcing ecosystem resilience under future climate conditions.
In this study, no calibration or validation procedures were performed, as the primary objective was not to reproduce observed discharge but to assess the relative impacts of climate change on key hydrological components—precipitation (P) and evapotranspiration (ET)—across the Guir Basin. The simulations were therefore used in a comparative framework to evaluate how future climatic forcing under RCP 8.5 may alter the basin’s hydrological balance. Results indicate a projected decrease in annual precipitation of approximately 28% and a moderate increase in evapotranspiration of about 8% by the end of the century. The decline in rainfall, combined with rising temperatures, is expected to intensify water deficits, reduce soil moisture, and exacerbate aridity—particularly in the southern oasis regions such as Boudenib. These findings underscore a shift toward a drier climate regime and highlight the vulnerability of the oasis ecosystem, emphasizing the need for adaptive water management strategies under future climate conditions.
3.3. CC Results Discussions and Comparison
Given the consistent spatial and temporal patterns obtained across all Global Climate Models (GCMs), the GFDL-ESM4 scenario was selected as a representative case for detailed analysis of both historical and future simulations of precipitation (P) and evapotranspiration (ET). This model was chosen due to its robust performance, fine spatial resolution, and reliable bias-adjustment methodology, which make it particularly suitable for regional hydrological assessments. The GFDL scenario provides comprehensive projections that capture the complex interactions between temperature, precipitation, and surface hydrology, offering valuable insights into the long-term evolution of the Guir Basin’s climate. Focusing on this model allows for a clearer understanding of the annual and interannual variability of P and ET, facilitating the comparison between historical (1985–2015) and future (2071–2100, RCP 8.5) periods. This approach supports a consistent and detailed interpretation of the impacts of climate change on the basin’s water balance and helps to inform adaptation planning and policy decisions at both local and regional scales.
3.3.1. Historical and Future RCP 8.5 Annual Average AA ET vs Historical AA P
The annual average (AA) maps of evapotranspiration (ET) and precipitation (P) for both historical and RCP 8.5 periods (Figure 29) display comparable spatial distributions across the Guir Basin. Elevated values of P and ET are concentrated in the northern high-altitude zones of the High Atlas Mountains, while the southern parts—particularly the oasis regions—exhibit markedly lower values. This spatial pattern underscores the dominant influence of topography and orographic effects on both precipitation generation and moisture recycling processes. The mountainous terrain acts as a key driver of local convection and moisture accumulation, resulting in enhanced precipitation and consequently higher ET due to increased soil moisture availability. In contrast, the southern lowlands are characterized by arid climatic conditions, limited rainfall, and higher air temperatures, leading to minimal ET and water stress conditions.
A strong coupling between precipitation and evapotranspiration is evident throughout the basin. Higher precipitation directly enhances canopy interception, soil water content, and transpiration rates, whereas reduced precipitation limits both surface evaporation and plant water uptake. ET variability is also modulated by climatic and biophysical factors such as temperature, solar radiation, wind speed, and vegetation type. Dense vegetation with deep rooting systems, supported by adequate soil moisture, sustains higher ET rates, while shallow-rooted vegetation such as palm trees in oasis environments exhibit heightened vulnerability to moisture deficits. Under these conditions, limited water availability leads to reduced transpiration, higher surface temperatures, and disrupted local microclimates.
The comparison between historical and future simulations reveals that climate change is expected to intensify aridity across the Guir Basin, with precipitation decreasing and ET showing localized increases in response to higher temperatures and vapor pressure deficits. These results indicate a tightening water balance—less precipitation recharge combined with sustained or enhanced ET losses—which will exacerbate water scarcity and soil desiccation, particularly in oasis systems reliant on groundwater and irrigation. The expected decline in precipitation and alteration in ET patterns could therefore jeopardize agricultural productivity, particularly in palm-based ecosystems, and accelerate desertification processes.
These findings are consistent with broader regional studies across Morocco and North Africa. Previous research reports a 20–30% decline in precipitation and increased temperature trends under future scenarios [30,31,32] demonstrated that precipitation and ET are most sensitive to relative humidity, shortwave radiation, air temperature, and wind speed, while [33] confirmed that potential ET (PET) is primarily driven by vapor pressure deficits across semi-arid regions. Moreover, [34,43] emphasized that agricultural systems will require adaptive strategies such as optimized irrigation practices, drought-tolerant crops, and improved soil moisture retention to mitigate the adverse effects of these climatic shifts.
In summary, the results highlight the mutual dependency between P and ET and their collective vulnerability to climate change. The projected decline in precipitation, combined with persistent or rising ET, points toward an increasingly constrained hydrological regime in the Guir Basin, underscoring the urgency for integrated water management and climate adaptation planning.
3.3.2. Quantitative Summary for CC Scenarios for the Guir Basin
The quantitative synthesis confirms that precipitation (P) in the Guir Basin has declined markedly from the historical to the future period, with an average reduction of ~111 mm yr⁻¹ (−28%) under RCP 8.5. The reduction is consistent across all five GCMs, reflecting a robust projection of a warmer and drier climate.
In contrast, evapotranspiration (ET), which increased historically due to sufficient rainfall and moisture availability, is projected to decrease by about 33 mm yr⁻¹ (−11%) in the future. This decline stems from reduced precipitation and soil moisture, which outweigh the compensating effect of higher temperatures that would otherwise enhance potential ET.
Spatially, the northern mountainous zones retain relatively higher values of both P and ET, benefiting from orographic uplift and denser vegetation. Conversely, the southern and oasis zones show the sharpest decline in both parameters, signaling increasing hydrological stress and desertification risk.
The combined decline of P and ET indicates a tight moisture deficit regime (Table 4), where water inputs and losses both shrink, but effective water availability (precipitation minus ET) diminishes even more sharply — implying potential impacts on agriculture, vegetation health, and groundwater recharge.
4. Conclusion
The spatial difference maps (Figure 30) clearly demonstrate a consistent future decrease in both precipitation (P) and evapotranspiration (ET) across the Guir watershed when comparing the historical period (1985–2015) with future projections (2071–2100) under the RCP 8.5 scenario. Both parameters exhibit predominantly negative anomalies, confirming a progressive aridification trend throughout the region.
These findings are in line with previous regional assessments, which report a 20–30 % decline in precipitation across Morocco by the end of the century and a contraction of wet seasons, particularly in southern and Saharan regions. According to the SWAT+ simulations driven by ISIMIP climate forcing, average annual precipitation is expected to decrease by approximately 28 %, while ET is projected to drop by ~11 % due to declining soil moisture and reduced rainfall inputs. Spatially, the northern mountainous zone retains slightly higher ET and P values, whereas the southern oasis and intermountain depressions show the sharpest decline—signaling a high risk of hydrological stress and desertification.
The results confirm that reduced precipitation directly limits evapotranspiration, as ET strongly depends on soil water availability and vegetation cover. Lower P leads to drier soils, reduced transpiration from crops and palm groves, and diminished evaporation from surface sources. Consequently, both hydrological parameters are expected to experience substantial declines, reshaping the region’s hydrological balance (P–ET) and threatening the eco-hydrological stability of the Guir oasis system.
Scientific Contribution and Novelty
This study is among the first to apply the SWAT+ model coupled with ISIMIP global climate datasets for the Guir watershed, a poorly documented transboundary basin in southeastern Morocco. By integrating multiple GCMs and high-resolution datasets, this research provides spatially explicit, multi-model projections of climate-induced changes in precipitation and evapotranspiration. The approach demonstrates that even without calibration data, SWAT+ can effectively identify large-scale hydrological trends under future climate conditions. This offers a valuable framework for other data-scarce arid basins facing similar challenges.
Implications for Water Resources and Oases Sustainability
The projected reduction in both P and ET implies a critical decline in water availability, threatening groundwater recharge, irrigation supply, and the vitality of oasis ecosystems. Increasing temperature and reduced rainfall will intensify irrigation demands, exacerbate soil salinity, and destabilize the humid microclimate essential for palm groves and agricultural productivity. Without effective adaptation measures, these trends may accelerate land degradation and rural vulnerability across southeastern Morocco.
Recommendations and Future Work
To mitigate these impacts, policymakers should prioritize:
Efficient irrigation systems (e.g., drip irrigation, deficit irrigation) to optimize water use.
Crop selection strategies adapted to arid and saline conditions.
Rainwater harvesting and managed aquifer recharge to strengthen water storage capacity.
Integrated land-use and water management planning across oasis regions.
Although this study provides valuable first-order insights, future work should focus on model calibration and validation using remote-sensing ET products (e.g., FAO-WaPOR, MOD16) and available meteorological records. Incorporating land-use change data, soil permeability, and geological heterogeneity would improve the accuracy of spatial hydrological responses. Additionally, coupling SWAT+ with climate downscaling and socio-economic scenarios could better assess adaptation options under different policy pathways.
Conclusion
Overall, this research demonstrates that the Guir watershed is undergoing a climatic and hydrological transition toward increased aridity, characterized by declining rainfall and evapotranspiration. These shifts will profoundly affect water resources, agriculture, and oasis sustainability. The methodological framework presented here—linking SWAT+, ISIMIP datasets, and GCM projections—offers a robust basis for climate-impact assessments in arid environments, contributing to informed water resource management and climate resilience strategies in Morocco and beyond.
References
- Ater, M.; Styring, A.; Younes, H.; Fraser, R.; Neef, R.; Pearson, J.; Bogaard, A. (2016). Disentangling the effect of farming practice from aridity on crop stable isotope values: A present-day model from Morocco and its application to early farming sites in the eastern Mediterranean. The Anthropocene Review, 3(2), 1–15. [CrossRef]
- Karmaoui, A.; Balica, S.F.; Messouli, M.; et al. Analysis of the Water Supply-Demand Relationship in the Middle Draa Valley, Morocco, under Climate Change and Socio-Economic Scenarios. *J. Sci. Res. Rep.* **2016**, *10*(1), 1–15. [CrossRef]
- Messouli, M.; Ben Salem, A.; Karmaoui, A. (2009). Ecohydrology and groundwater resources management under global change: A pilot study in the pre-Saharan basins of southern Morocco. Ecohydrology and Groundwater Management, 1, 1–15.
- Benabdelouahab, T.; Gadouali, F.; Boudhar, A.; et al. (2020). Analysis and trends of rainfall amounts and extreme events in the Western Mediterranean region. Theoretical and Applied Climatology, 141, 309–320. [CrossRef]
- El-Fadel, M.; Deeb, T.; Alameddine, I.; Zurayk, R.; Chaaban, J. (2018). Impact of groundwater salinity on agricultural productivity with climate change implications. International Journal of Sustainable Development and Planning, 13(3), 445-456. [CrossRef]
- Mejjad, N.; Laissaoui, A.; El-Hammoumi, O.; Benmansour, M.; Benbrahim, S.; Bounouira, H.; Benkdad, A.; Bouthir, F.Z.; Fekri, A.; Bounakhla, M. (2016). Sediment geochronology and geochemical behavior of major and rare earth elements in the Oualidia Lagoon in western Morocco. Journal of Radioanalytical and Nuclear Chemistry, 309(3), 1133–1143. [CrossRef]
- Milano, M.; Ruelland, D.; Fernandez, S.; Dezetter, A.; Fabre, J.; Servat, E.; Thivet, G. (2013). Current state of Mediterranean water resources and future trends under climatic and anthropogenic changes. Hydrological Sciences Journal, 58(3), 498–518. [CrossRef]
- Schilling, J.; Freier, K.; Hertig, E.; Scheffran, J. (2012). Climate change, vulnerability and adaptation in North Africa with focus on Morocco. Agriculture, Ecosystems & Environment, 156, 12–26. [CrossRef]
- Marchane, A.; Tramblay, Y.; Hanich, L.; Ruelland, D. (2017). Climate change impacts on surface water resources in the Rheraya catchment (High Atlas, Morocco). Hydrological Sciences Journal, 62(6), 979–995. [CrossRef]
- Mehdaoui, R.; Mili, E.-M. (2016). Drought Climatic Characterization Watershed of Guir (South East, Morocco) Using Standardized Precipitation Index (SPI). International Journal of Science and Research (IJSR), 7(6), 1931–1936. [CrossRef]
- Ministère de l’Équipement et de l’Eau. (2009). Rapport sur les Ressources en Eau du Maroc. Direction Générale de l’Hydraulique, Rabat, Maroc.
- Ministère de l’Équipement et de l’Eau. (2009). Rapport sur les Ressources en Eau du Maroc. Direction Générale de l’Hydraulique, Rabat, Maroc.
- Nouayti, A.; Khattach, D.; Hilali, M.; Nouayti, N. (2019). Mapping potential areas for groundwater storage in the High Guir Basin (Morocco): Contribution of remote sensing and GIS. Journal of Groundwater Science and Engineering, 7(4), 309–322. [CrossRef]
- Nouayti, N.; Khattach, D.; Hilali, M. (2017). Potential areas mapping for the groundwater storage in the High Ziz Basin (Morocco): Contribution of remote sensing and geographic information system. Bulletin de l’Institut Scientifique, Rabat, Section Sciences de la Terre, 39, 45–57.
- MILI, R. M. E.-M. (2018). Drought Climatic Characterization Watershed of Guir (South East, Morocco) using Standardized Precipitation Index (SPI). International Journal of Science and Research (IJSR), 7(6), 1931–1936. [CrossRef]
- ABHZGH, Watershed Agency in Morocco.
- Elbouqdaoui, K.; Ezzine, H.; Zahraoui, M.; Rouchdi, M.; Badraoui, M. (2006). Évaluation du risque potentiel d’érosion dans le bassin-versant de l’oued Srou (Moyen Atlas, Maroc). Science et Changements Planétaires / Sécheresse, 17(3), 425–431. [CrossRef]
- Driouech, F. (2010). Distribution des précipitations hivernales sur le Maroc dans le cadre d’un changement climatique: descente d’échelle et incertitudes. Doctoral Dissertation, Institut National Polytechnique de Toulouse-INPT, Toulouse, France. Toulouse.
- C.J. Chawanda. (2021). PhD Thesis., 1–148.
- Neitsch, S.L.; Arnold, J.G.; Kiniry, J.R.; Williams, J.R. (2011). Soil & Water Assessment Tool: Theoretical Documentation, Version 2009. Texas Water Resources Institute, 1–647. [CrossRef]
- Bieger, K.; Arnold, J.G.; Rathjens, H.; White, M.J.; Bosch, D.D.; Allen, P.M.; Srinivasan, R. (2017). Introduction to SWAT+: A Completely Restructured Version of the Soil and Water Assessment Tool. Journal of the American Water Resources Association, 53(1), 115–130. [CrossRef]
- Pechlivanidis, I.; Jackson, B.; McIntyre, N.; Wheater, H. (2011). Catchment scale hydrological modelling: A review of model types, calibration approaches and uncertainty analysis methods in the context of recent developments.
- Bosznay, Á.P. (1989). On the lower estimation of non-averaging sets. Acta Mathematica Hungarica, 53(1), 155–157. [CrossRef]
- Green, W.H.; Ampt, G.A. (1911). Studies on Soil Physics, Part I – The Flow of Air and Water Through Soils. Journal of Agricultural Science, 4(1), 1–24. [CrossRef]
- Arnold, J.; Bieger, K.; White, M.; Srinivasan, R.; Dunbar, J.; Allen, P. (2018). Use of decision tables to simulate management in SWAT+. Water, 10, 713. [CrossRef]
- Chawanda, C.J.; Arnold, J.; Thiery, W.; van Griensven, A. (2020). Mass balance calibration and reservoir representations for large-scale hydrological impact studies using SWAT+. Climatic Change, 163(3), 1307–1327. [CrossRef]
- Hengl, T.; Heuvelink, G.B.M.; Kempen, B.; Leenaars, J.G.B.; Walsh, M.G.; Shepherd, K.D.; Tondoh, J.E. (2015). Mapping soil properties of Africa at 250 m resolution: Random forests significantly improve current predictions. PLoS ONE, 10(6), 1–26. [CrossRef]
- Ayana, E.K.; Dile, Y.T.; Narasimhan, B.; Srinivasan, R. (2019). Dividends in flow prediction improvement using high-resolution soil database. Journal of Hydrology: Regional Studies, 21, 159–175. [CrossRef]
- Frieler, K.; Lange, S.; Piontek, F.; Reyer, C.P.O.; Schewe, J.; Warszawski, L.; Yamagata, Y. (2017). Assessing the impacts of 1.5°C global warming — simulation protocol of the Inter-Sectoral Impact Model Intercomparison Project (ISIMIP2b). Geoscientific Model Development, 10(12), 4321–4345. [CrossRef]
- USAID (U.S. Agency for International Development) 2016, USAID Climate Change Adaptation Plan: 2016–2020s, USAID, Washington, D.C.
- Ajjur, S.B.; Al-Ghamdi, S.G. (2021). Evapotranspiration and water availability response to climate change in the Middle East and North Africa. Climatic Change, 166(3), 28. [CrossRef]
- Gong, S. L.; Zhang, X. Y.; Zhao, T. L.; Zhang, X. B.; Barrie, L. A.; McKendry, I. G.; Zhao, C. S. (2006). A Simulated Climatology of Asian Dust Aerosol and Its Trans-Pacific Transport. Part I: Mean Climate and Validation. Journal of Climate, 19(1), 1-22. [CrossRef]
- Irmak, S.; Allen, R.G.; Whitty, E.B. (2006). Daily grass and alfalfa-reference evapotranspiration estimates and alfalfa-to-grass evapotranspiration ratios in Florida. Journal of Irrigation and Drainage Engineering, 132(3), 238–249. [CrossRef]
- Benzougagh, B.; Al-Quraishi, A. M. F.; Kader, S.; Mimich, K.; Bammou, Y.; Sadkaoui, D.; Ouchen, I.; El Brahimi, M.; Khedher, K. M.; Hakkou, M. (2024). Impact of Green Generation, Green Morocco, and Climate Change Programs on Water Resources in Morocco. Climate Change and Environmental Degradation in the MENA Region, 136, 223-253. [CrossRef]
- Farr, T.G.; Rosen, P.A.; Caro, E.; Crippen, R.; Duren, R.; Hensley, S.; Alsdorf, D. (2007). The Shuttle Radar Topography Mission. Reviews of Geophysics, 45(2), 1–33. [CrossRef]
- Ministry of Agriculture, Morocco. (2023). Programme Maroc Vert et Adaptation au Changement Climatique. Ministère de l’Agriculture du Maroc. https://www.agriculture.gov.ma/fr/accueil.
- World Bank; Climate Change Knowledge Portal (CCKP). (2021). Climate Risk Country Profile: Morocco. World Bank Group: Washington, DC, USA. Available online: https://climateknowledgeportal.worldbank.org/sites/default/files/2021-09/15725-WB_Morocco%20Country%20Profile-WEB.pdf.
- Editions Géologique Pistes du Maroc. (1971). Ressources en Eau du Maroc, Tome 1. Publications du Service Géologique du Maroc, Rabat.
- https://www.epa.gov/arc-x/climate-adaptation-and-source-waterimpacts#:~:text=Climate%20change%20threatens%20the%20quality,increase%20due%20to%20climate%20change).
- United Nations Water. (2024). Climate Adaptation and Source Water Impacts. UN Water Reports. https://www.unwater.org/.
- Chawanda, C.J.; Nkwasa, A.; Thiery, W.; van Griensven, A. (2024). Combined impacts of climate and land-use change on future water resources in Africa. Hydrology and Earth System Sciences, 28(1), 117–138. [CrossRef]
- Lionello, P. (2012). The Climate of the Mediterranean Region. Elsevier. [CrossRef]
- Combe, J., Martin, P., & Bernard, L. (1971). Hydrogeological study of the Guir watershed, southeastern Morocco. Journal of African Earth Sciences, 3(2), 115–128.
Figure 1.
Rainfall map of Morocco [1].
Figure 1.
Rainfall map of Morocco [1].
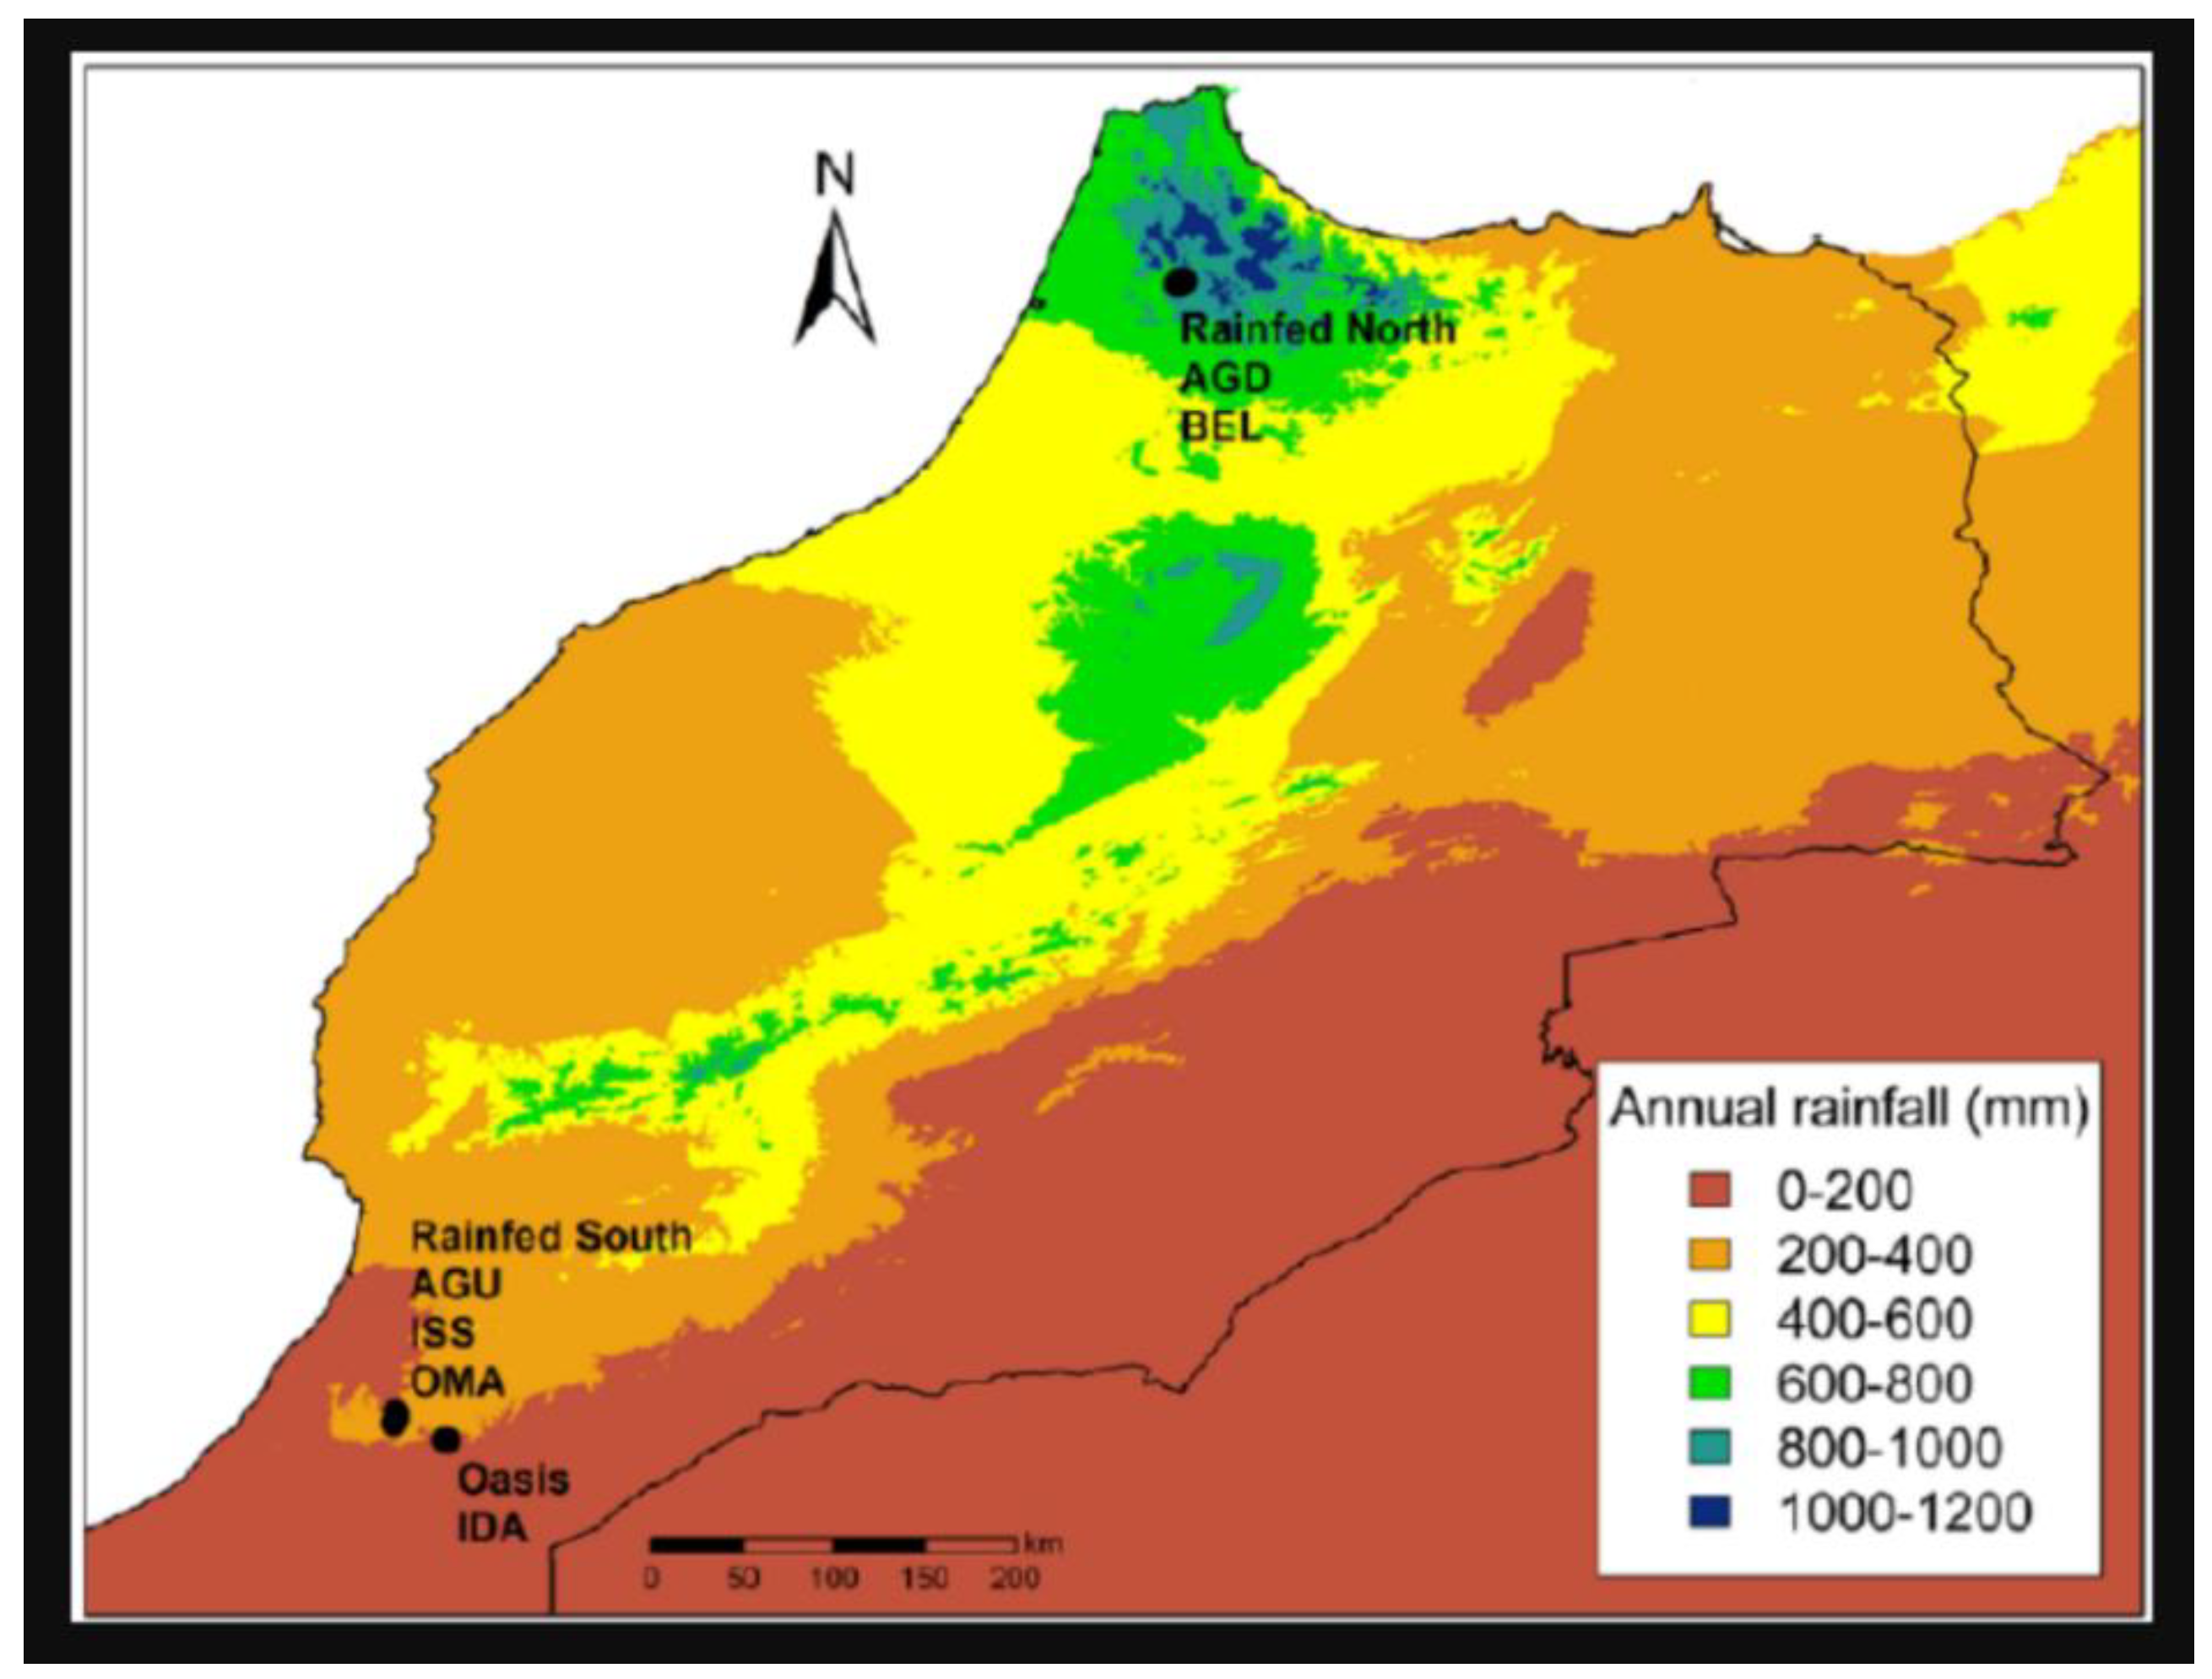
Figure 2.
Guir and Ziz catchments [1].
Figure 2.
Guir and Ziz catchments [1].
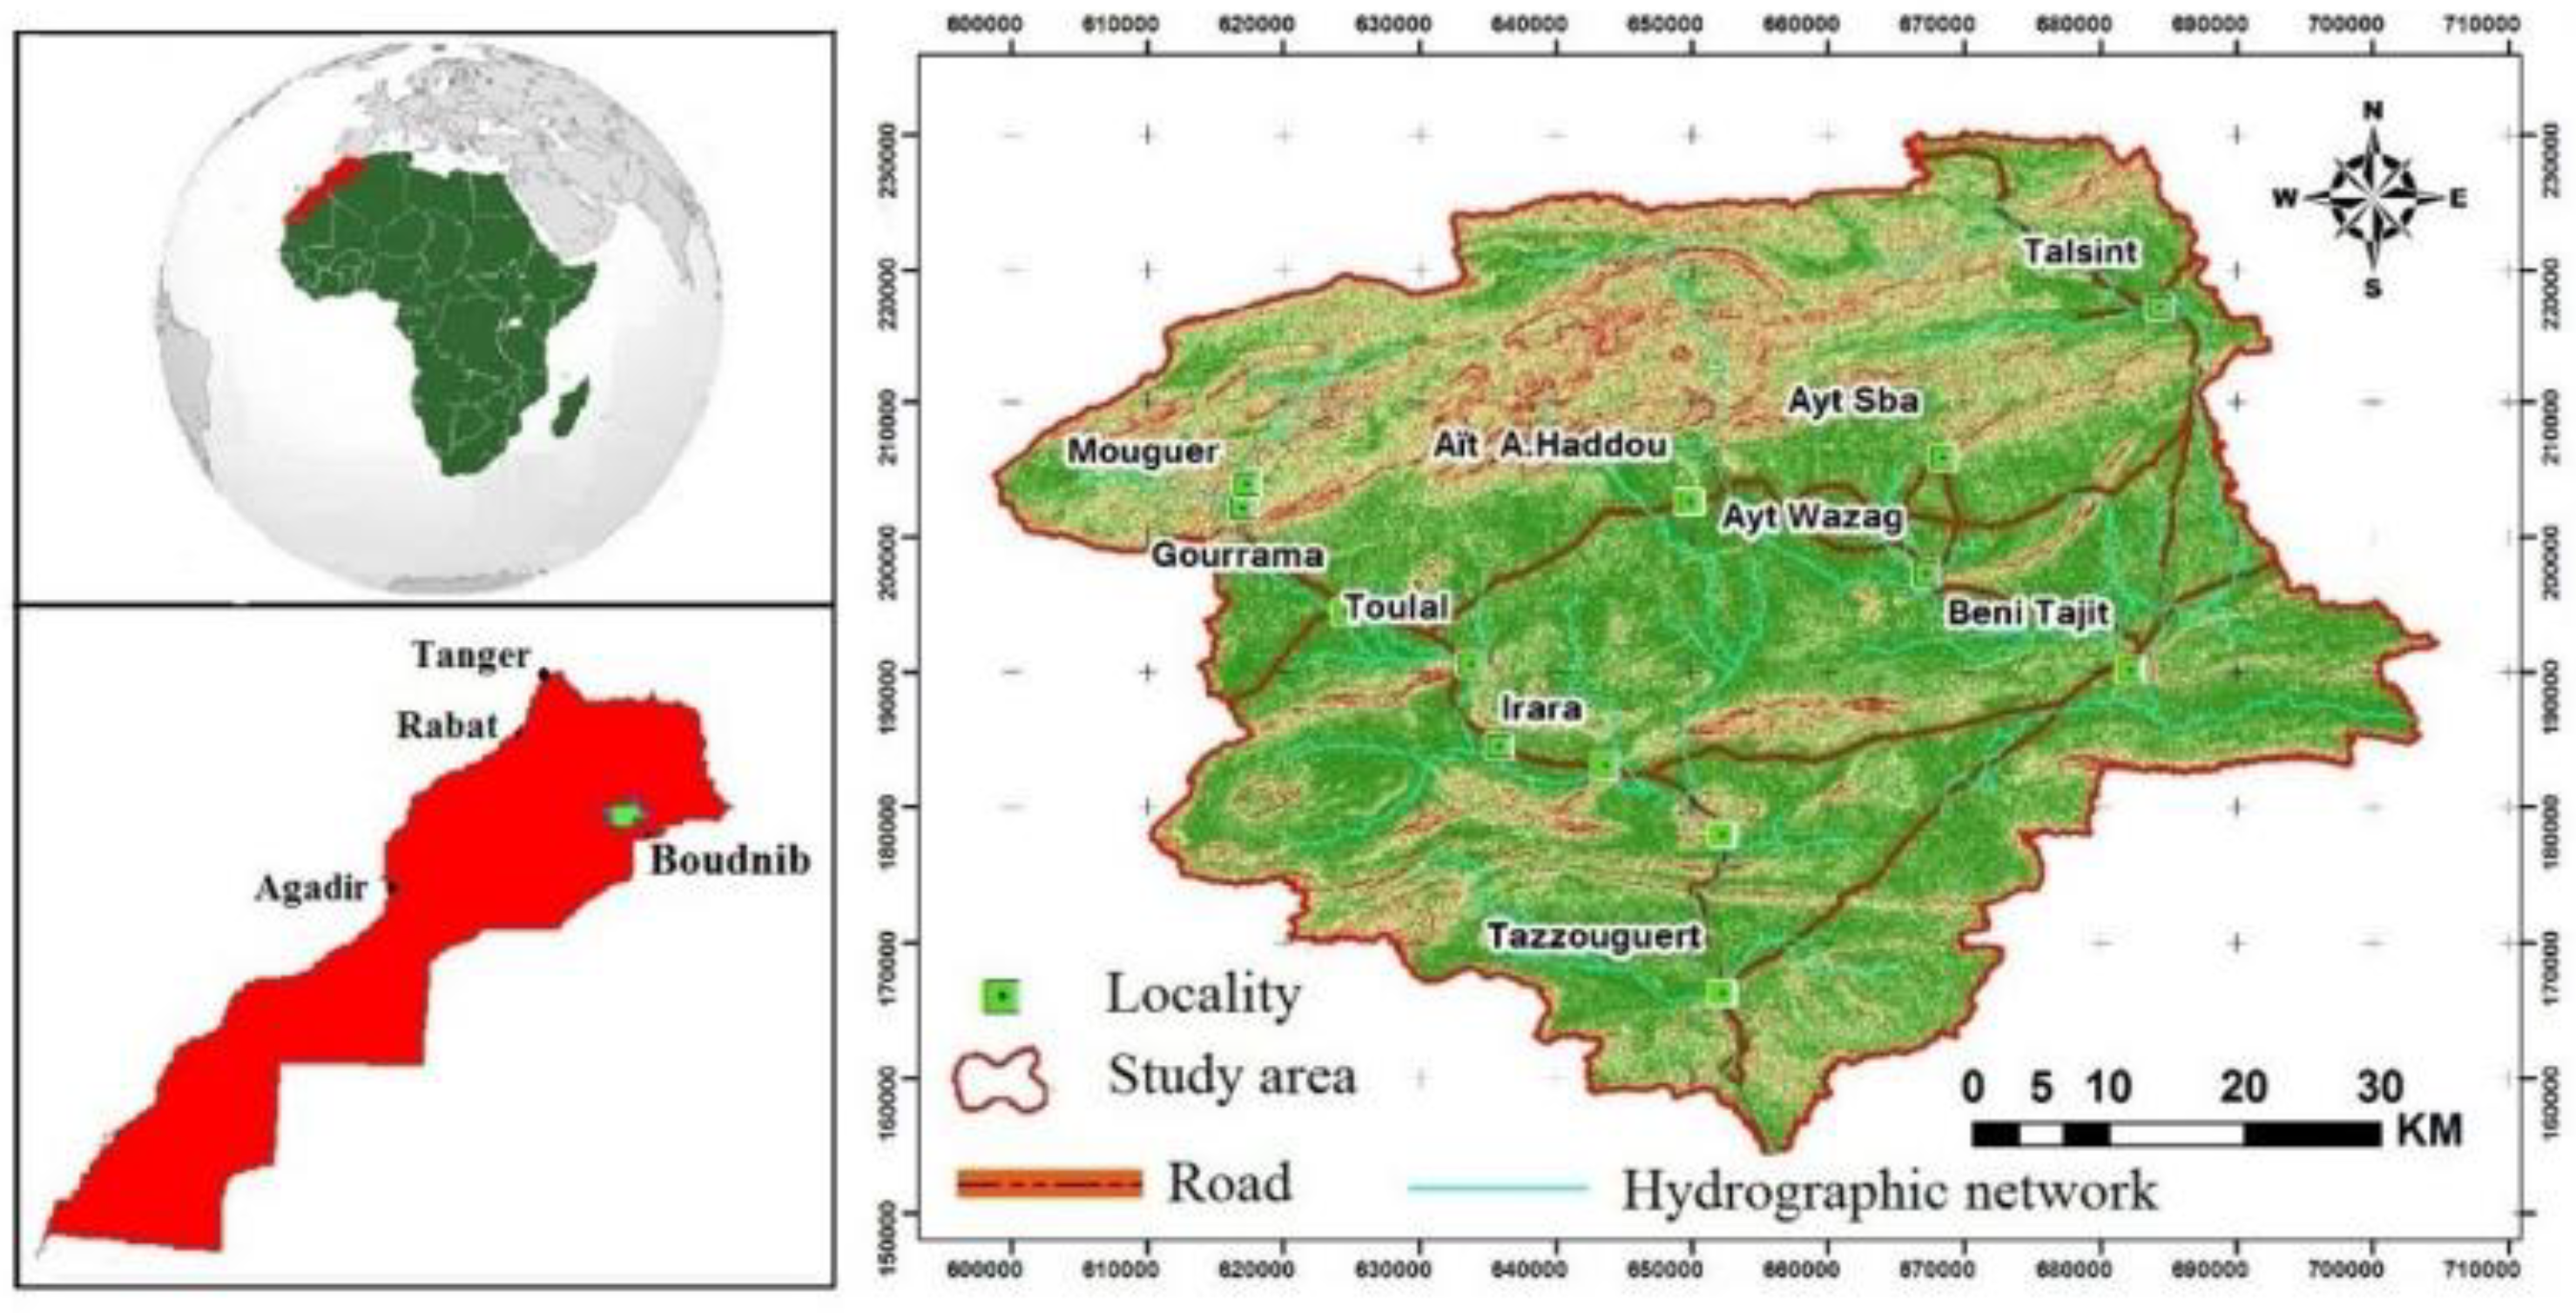
Figure 3.
High basin and downstream of Guir watershed.
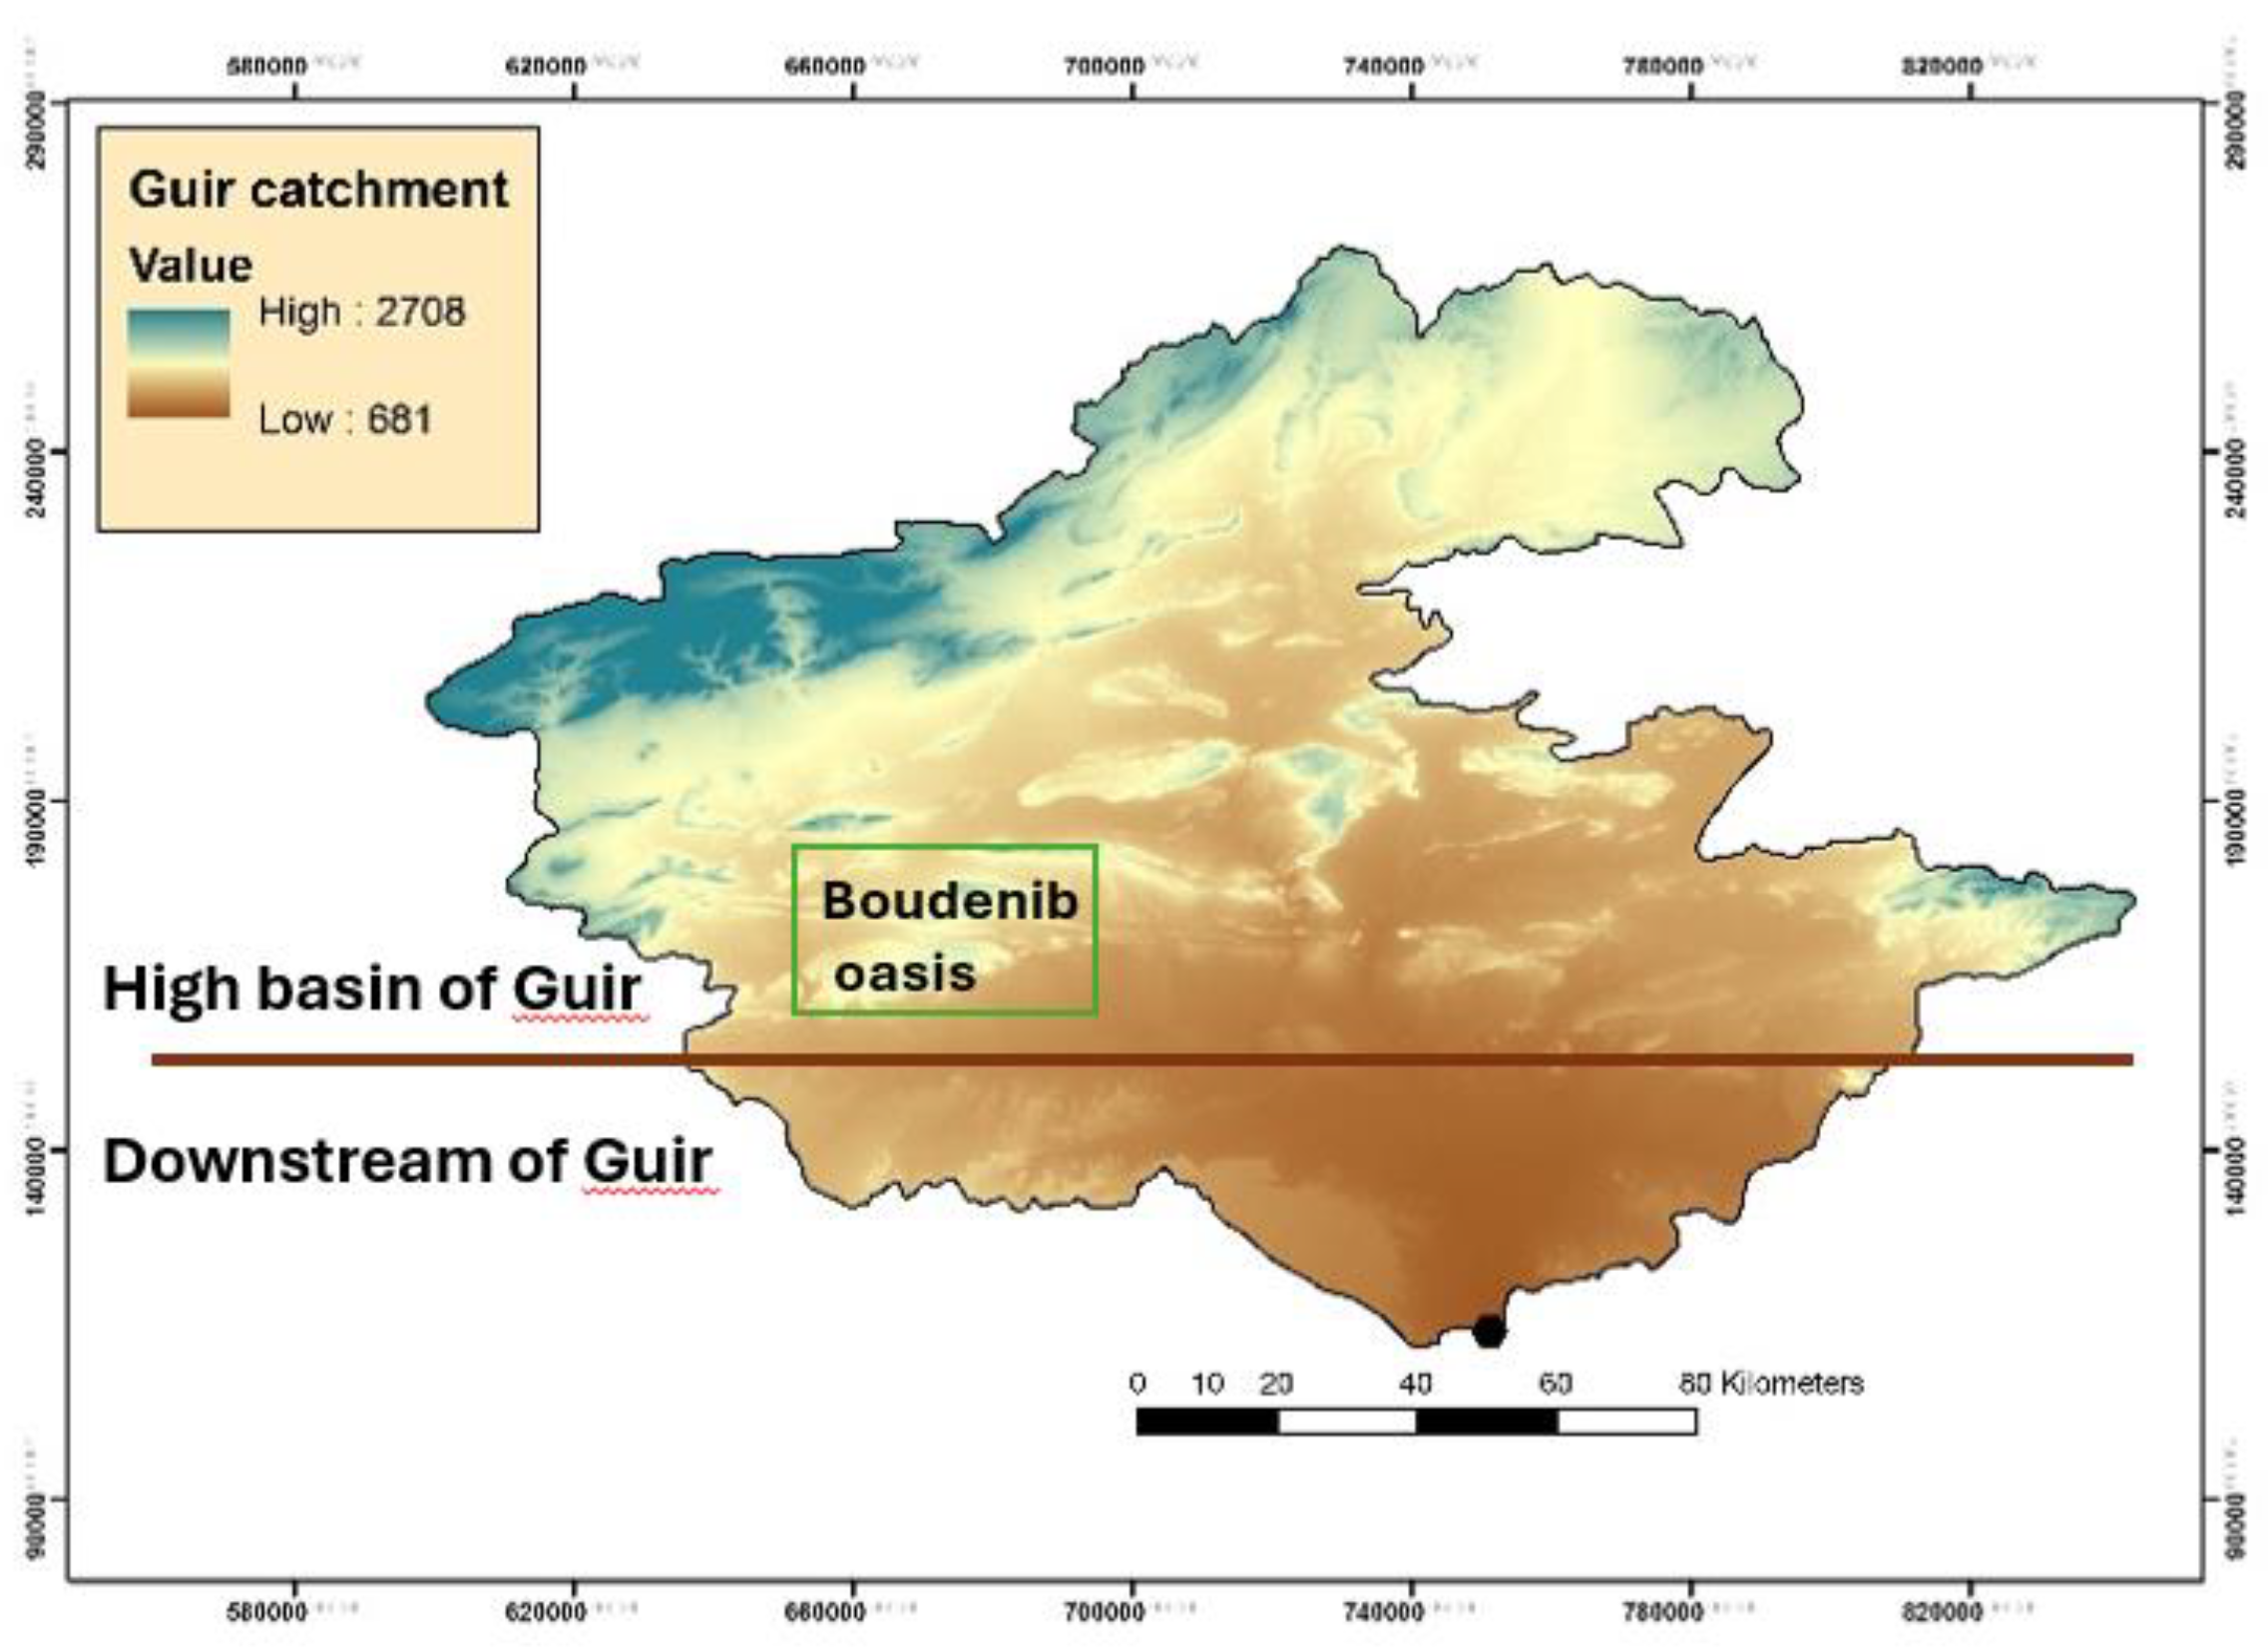
Figure 29.
Historical and RCP 8.5 Annual Average ET vs Historical and RCP 8.5 P.
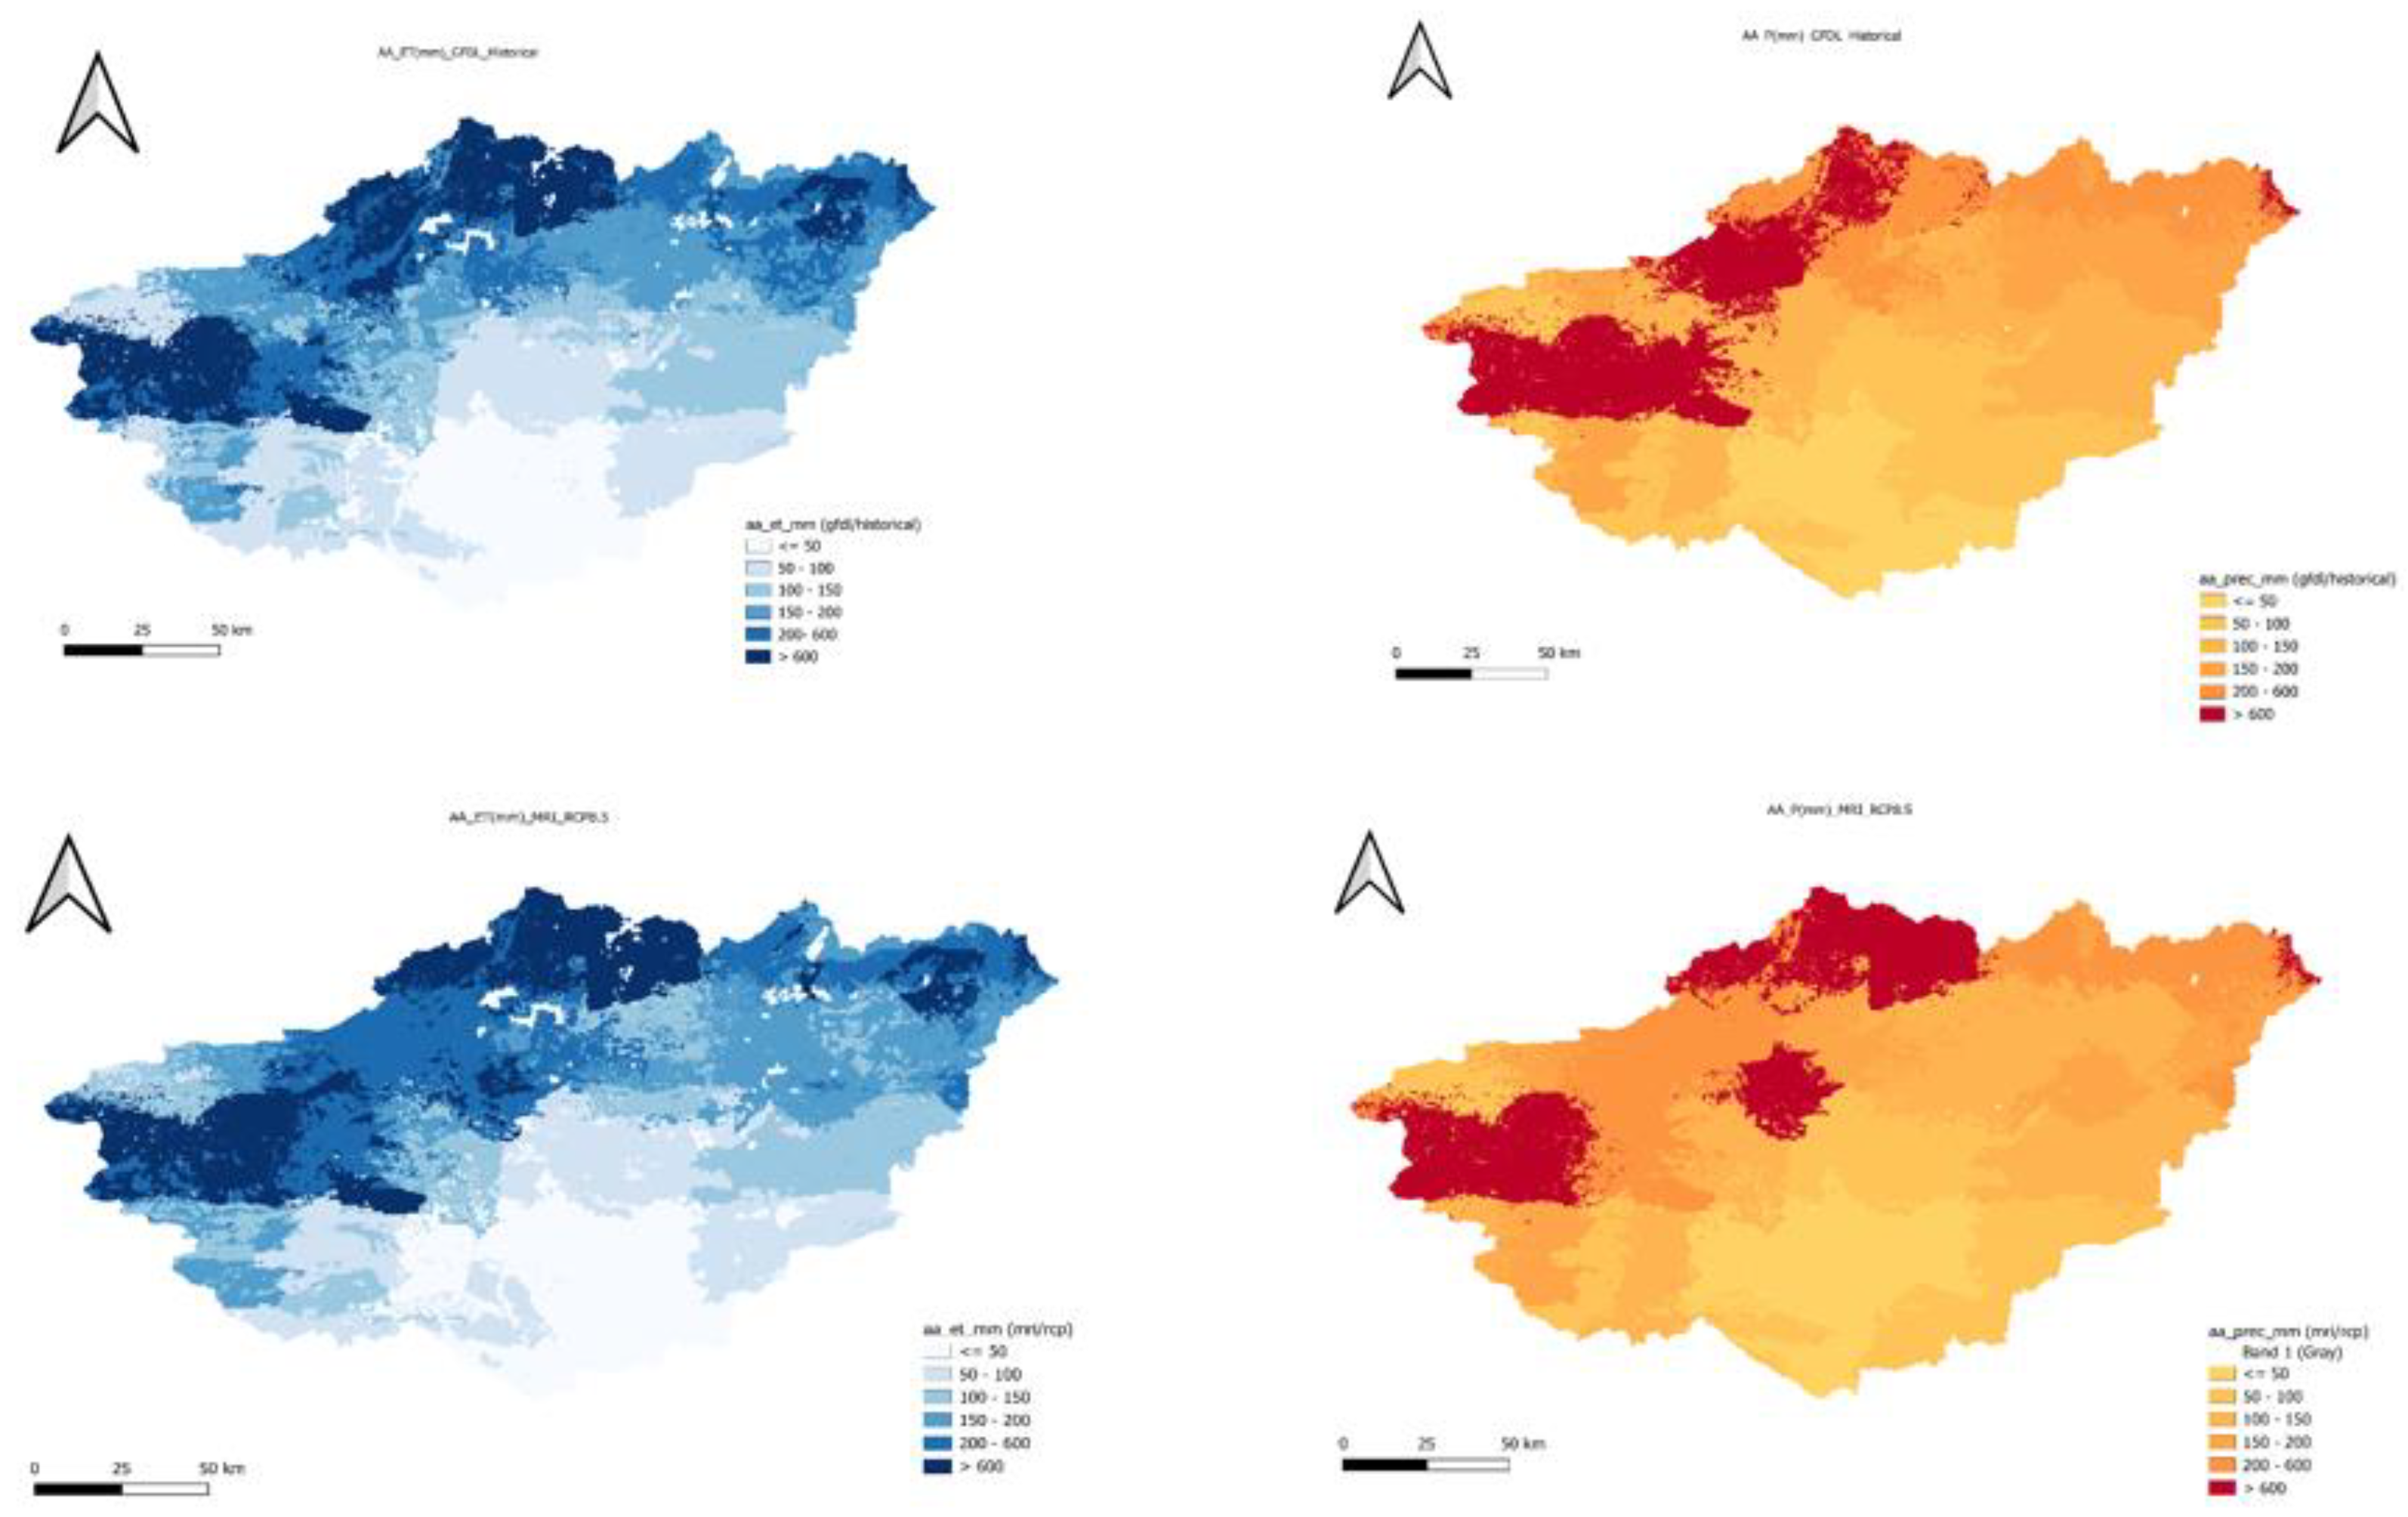
Figure 30.
Historical and future scenarios raster calculations result for both P and ET.
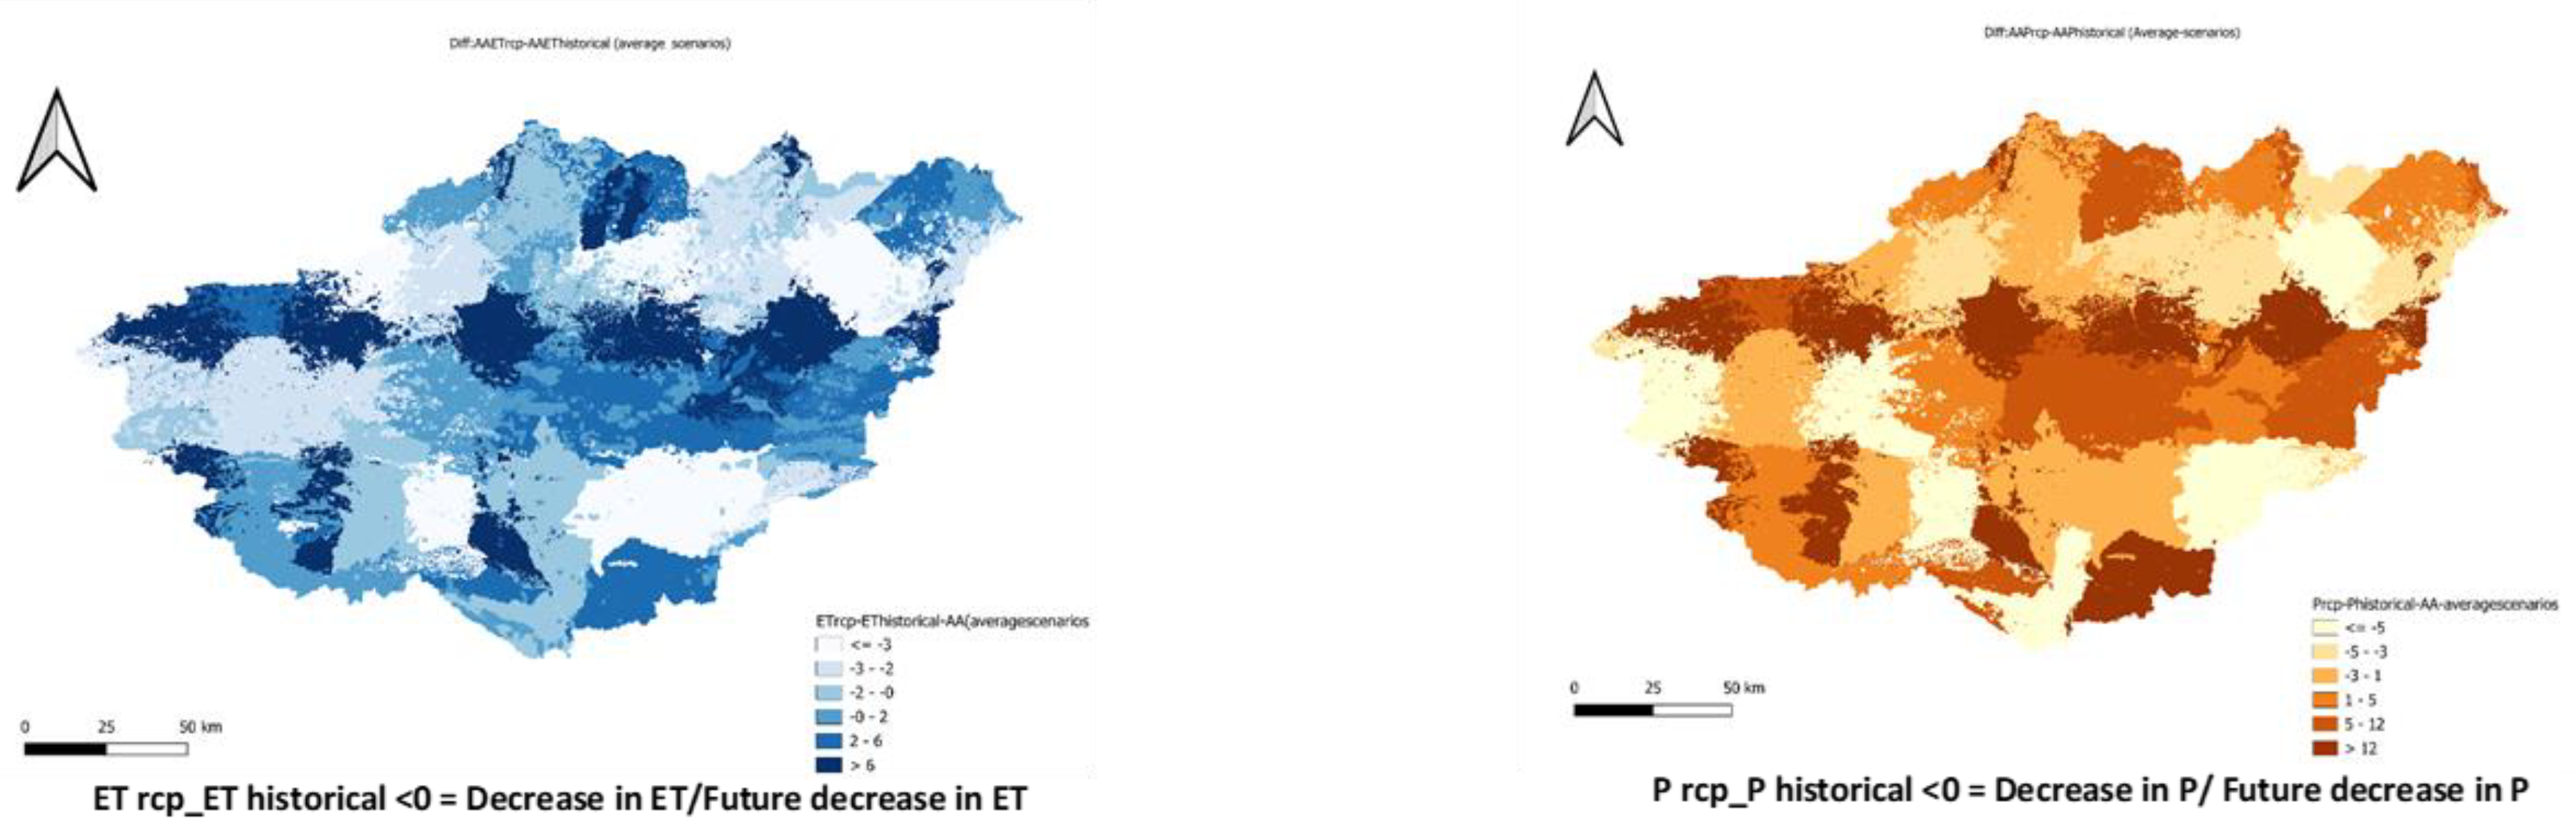

Table 1.
Historical and future simulation scenarios.
| Period | Scenario | GCM forcing |
| 1984-2015 | historical | GFDL |
| IPSL | ||
| MPI | ||
| MRI | ||
| UKESM | ||
| 2070-2100 | RCP 8.5 | GFDL |
| IPSL | ||
| MPI | ||
| MRI | ||
| UKESM |
Table 2.
Comparison of historical and future mean annual precipitation (P) simulated by five GCMs under the RCP 8.5 scenario for the Guir Basin (SWAT+ outputs).
Table 2.
Comparison of historical and future mean annual precipitation (P) simulated by five GCMs under the RCP 8.5 scenario for the Guir Basin (SWAT+ outputs).
| Model | Historical Mean P (1985–2015) | Future Mean P (2071–2100, RCP 8.5) | Absolute Change (mm) | % Change | Spatial Trend |
| GFDL-ESM4 | 392 | 276 | −116 | −29.6 % | Strong drying across basin; wet zones restricted to the north |
| IPSL-CM6A-LR | 384 | 272 | −112 | −29.2 % | Pronounced decrease in central and southern zones |
| MPI-ESM1-2-HR | 401 | 295 | −106 | −26.4 % | Gradual drying, persistent wet core in high elevations |
| MRI-ESM2-0 | 389 | 283 | −106 | −27.2 % | Homogeneous decrease, moderate north–south gradient |
| UKESM1-0-LL | 396 | 281 | −115 | −29.0 % | Patchy reduction, isolated wet spots remain in northwest |
| Average | 392.4 | 281.4 | −111 | −28.3 % | Increasing aridity, especially downstream (Boudenib Oasis) |
Table 3.
Comparison of historical and future mean annual evapotranspiration (ET) simulated by five GCMs under RCP 8.5 scenario for the Guir Basin (values in mm yr⁻¹ and % change).
Table 3.
Comparison of historical and future mean annual evapotranspiration (ET) simulated by five GCMs under RCP 8.5 scenario for the Guir Basin (values in mm yr⁻¹ and % change).
| Model | Historical Mean ET (1985–2015) | Future Mean ET (2071–2100, RCP 8.5) | Absolute Change (mm) | % Change | Spatial Trend |
| GFDL-ESM4 | 342 | 314 | −28 | −8.2 % | Noticeable decline in central and southern basin; higher ET persists in northern mountainous zones |
| IPSL-CM6A-LR | 338 | 309 | −29 | −8.6 % | Slight reduction across watershed; pronounced in lowland desert areas |
| MPI-ESM1-2-HR | 347 | 318 | −29 | −8.4 % | Moderate decline; ET remains stable near Atlas foothills |
| MRI-ESM2-0 | 350 | 322 | −28 | −8.0 % | Uniform ET decrease, strongest in eastern and arid sectors |
| UKESM1-0-LL | 344 | 315 | −29 | −8.4 % | Reduction concentrated in southern arid zones; persistent wet conditions in highlands |
| Average | 344.2 | 315.6 | −28.6 | −8.3 % | Basin-wide reduction in ET, mirroring decline in precipitation and soil moisture |
Table 4.
Quantitative synthesis of historical and future mean annual precipitation (P) and evapotranspiration (ET) simulated by SWAT+ under RCP 8.5 scenario for the Guir Basin.
Table 4.
Quantitative synthesis of historical and future mean annual precipitation (P) and evapotranspiration (ET) simulated by SWAT+ under RCP 8.5 scenario for the Guir Basin.
| Model | Historical Mean P (1985–2015) (mm yr⁻¹) | Future Mean P (2071–2100) (mm yr⁻¹) | ΔP (mm) | % Change in P | Historical Mean ET (1985–2015) (mm yr⁻¹) | Future Mean ET (2071–2100) (mm yr⁻¹) | ΔET (mm) | % Change in ET | Hydrological Trend Summary |
| GFDL-ESM4 | 392 | 276 | −116 | −29.6 % | 302 | 268 | −34 | −11.3 % | Decrease in rainfall leads to lower ET, drying strongest in south |
| IPSL-CM6A-LR | 384 | 272 | −112 | −29.2 % | 298 | 265 | −33 | −11.1 % | Moderate decline; reduced soil moisture limits ET |
| MPI-ESM1-2-HR | 401 | 295 | −106 | −26.4 % | 310 | 276 | −34 | −11.0 % | Persistent wet zone in north; general ET drop |
| MRI-ESM2-0 | 389 | 283 | −106 | −27.2 % | 304 | 272 | −32 | −10.5 % | Homogeneous drying pattern across basin |
| UKESM1-0-LL | 396 | 281 | −115 | −29.0 % | 307 | 273 | −34 | −11.1 % | Patchy decline: northern ET maintained slightly higher |
| Average | 392.4 | 281.4 | −111 | −28.3 % | 304.2 | 270.8 | −33.4 | −11.0 % | Both P and ET decline; reduced moisture availability dominates |
Disclaimer/Publisher’s Note: The statements, opinions and data contained in all publications are solely those of the individual author(s) and contributor(s) and not of MDPI and/or the editor(s). MDPI and/or the editor(s) disclaim responsibility for any injury to people or property resulting from any ideas, methods, instructions or products referred to in the content. |
© 2025 by the authors. Licensee MDPI, Basel, Switzerland. This article is an open access article distributed under the terms and conditions of the Creative Commons Attribution (CC BY) license (http://creativecommons.org/licenses/by/4.0/).
Copyright: This open access article is published under a Creative Commons CC BY 4.0 license, which permit the free download, distribution, and reuse, provided that the author and preprint are cited in any reuse.


