
Submitted:
16 October 2024
Posted:
18 October 2024
You are already at the latest version
Abstract
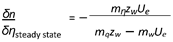
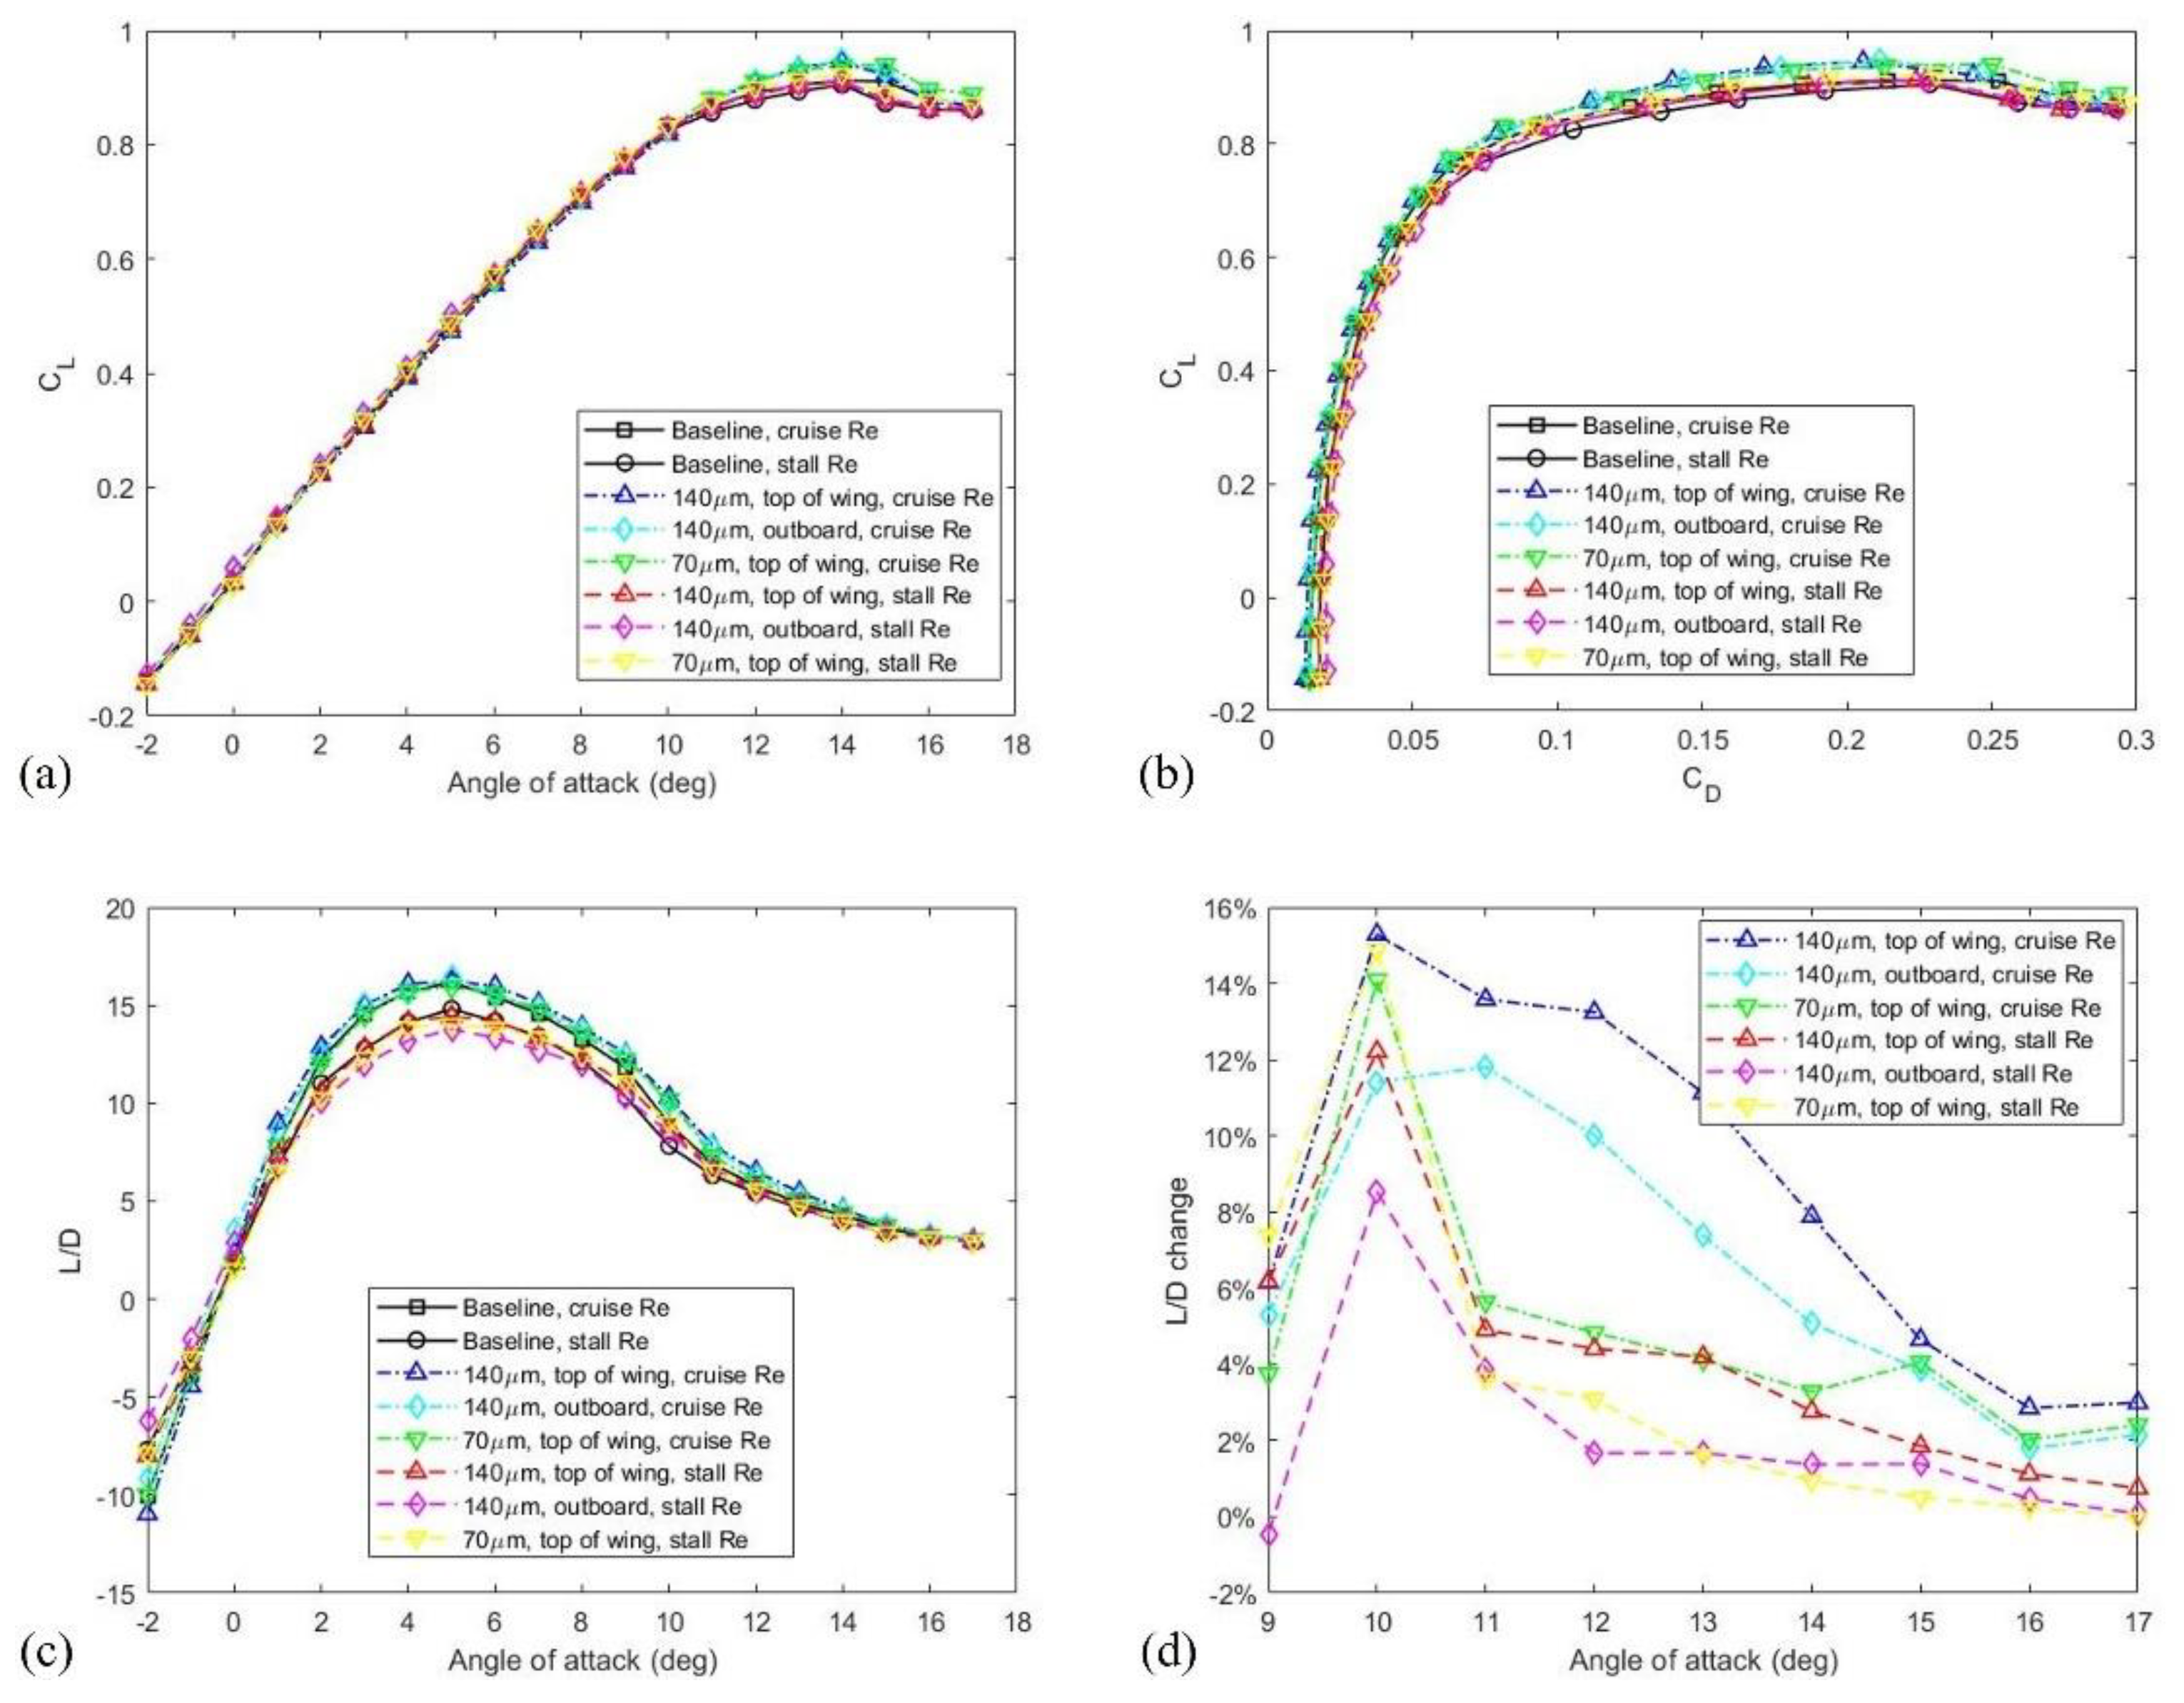
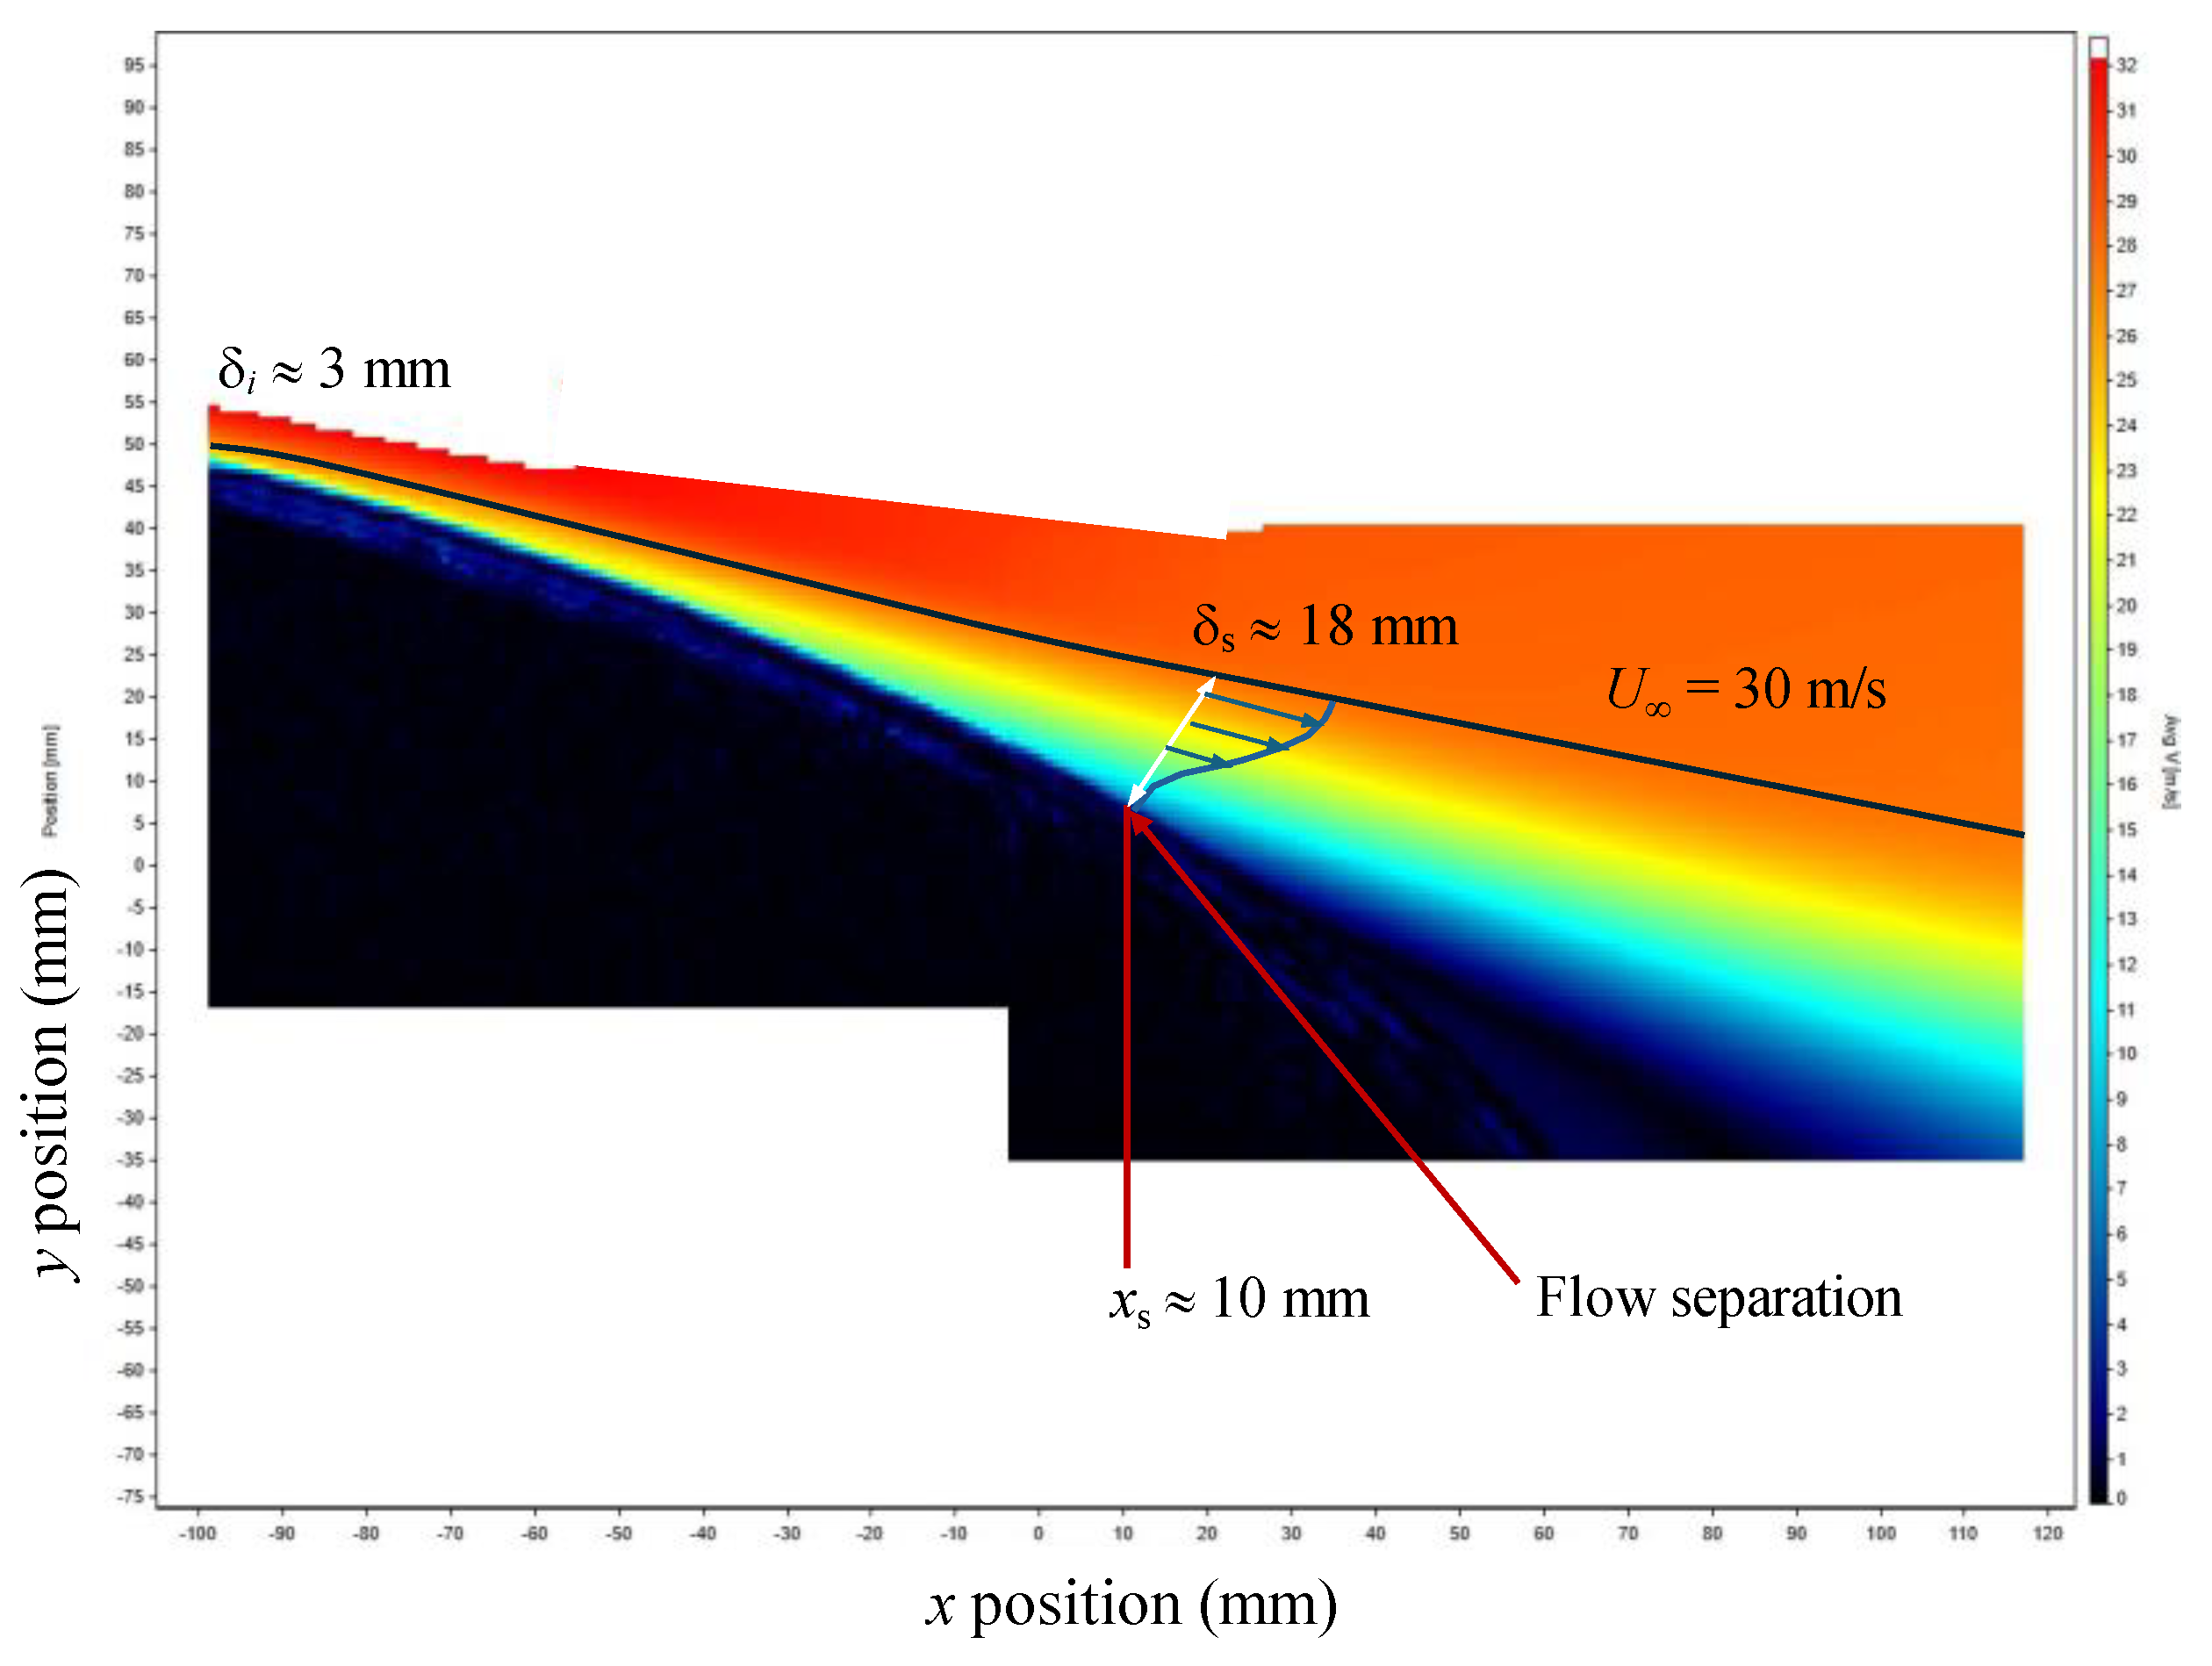
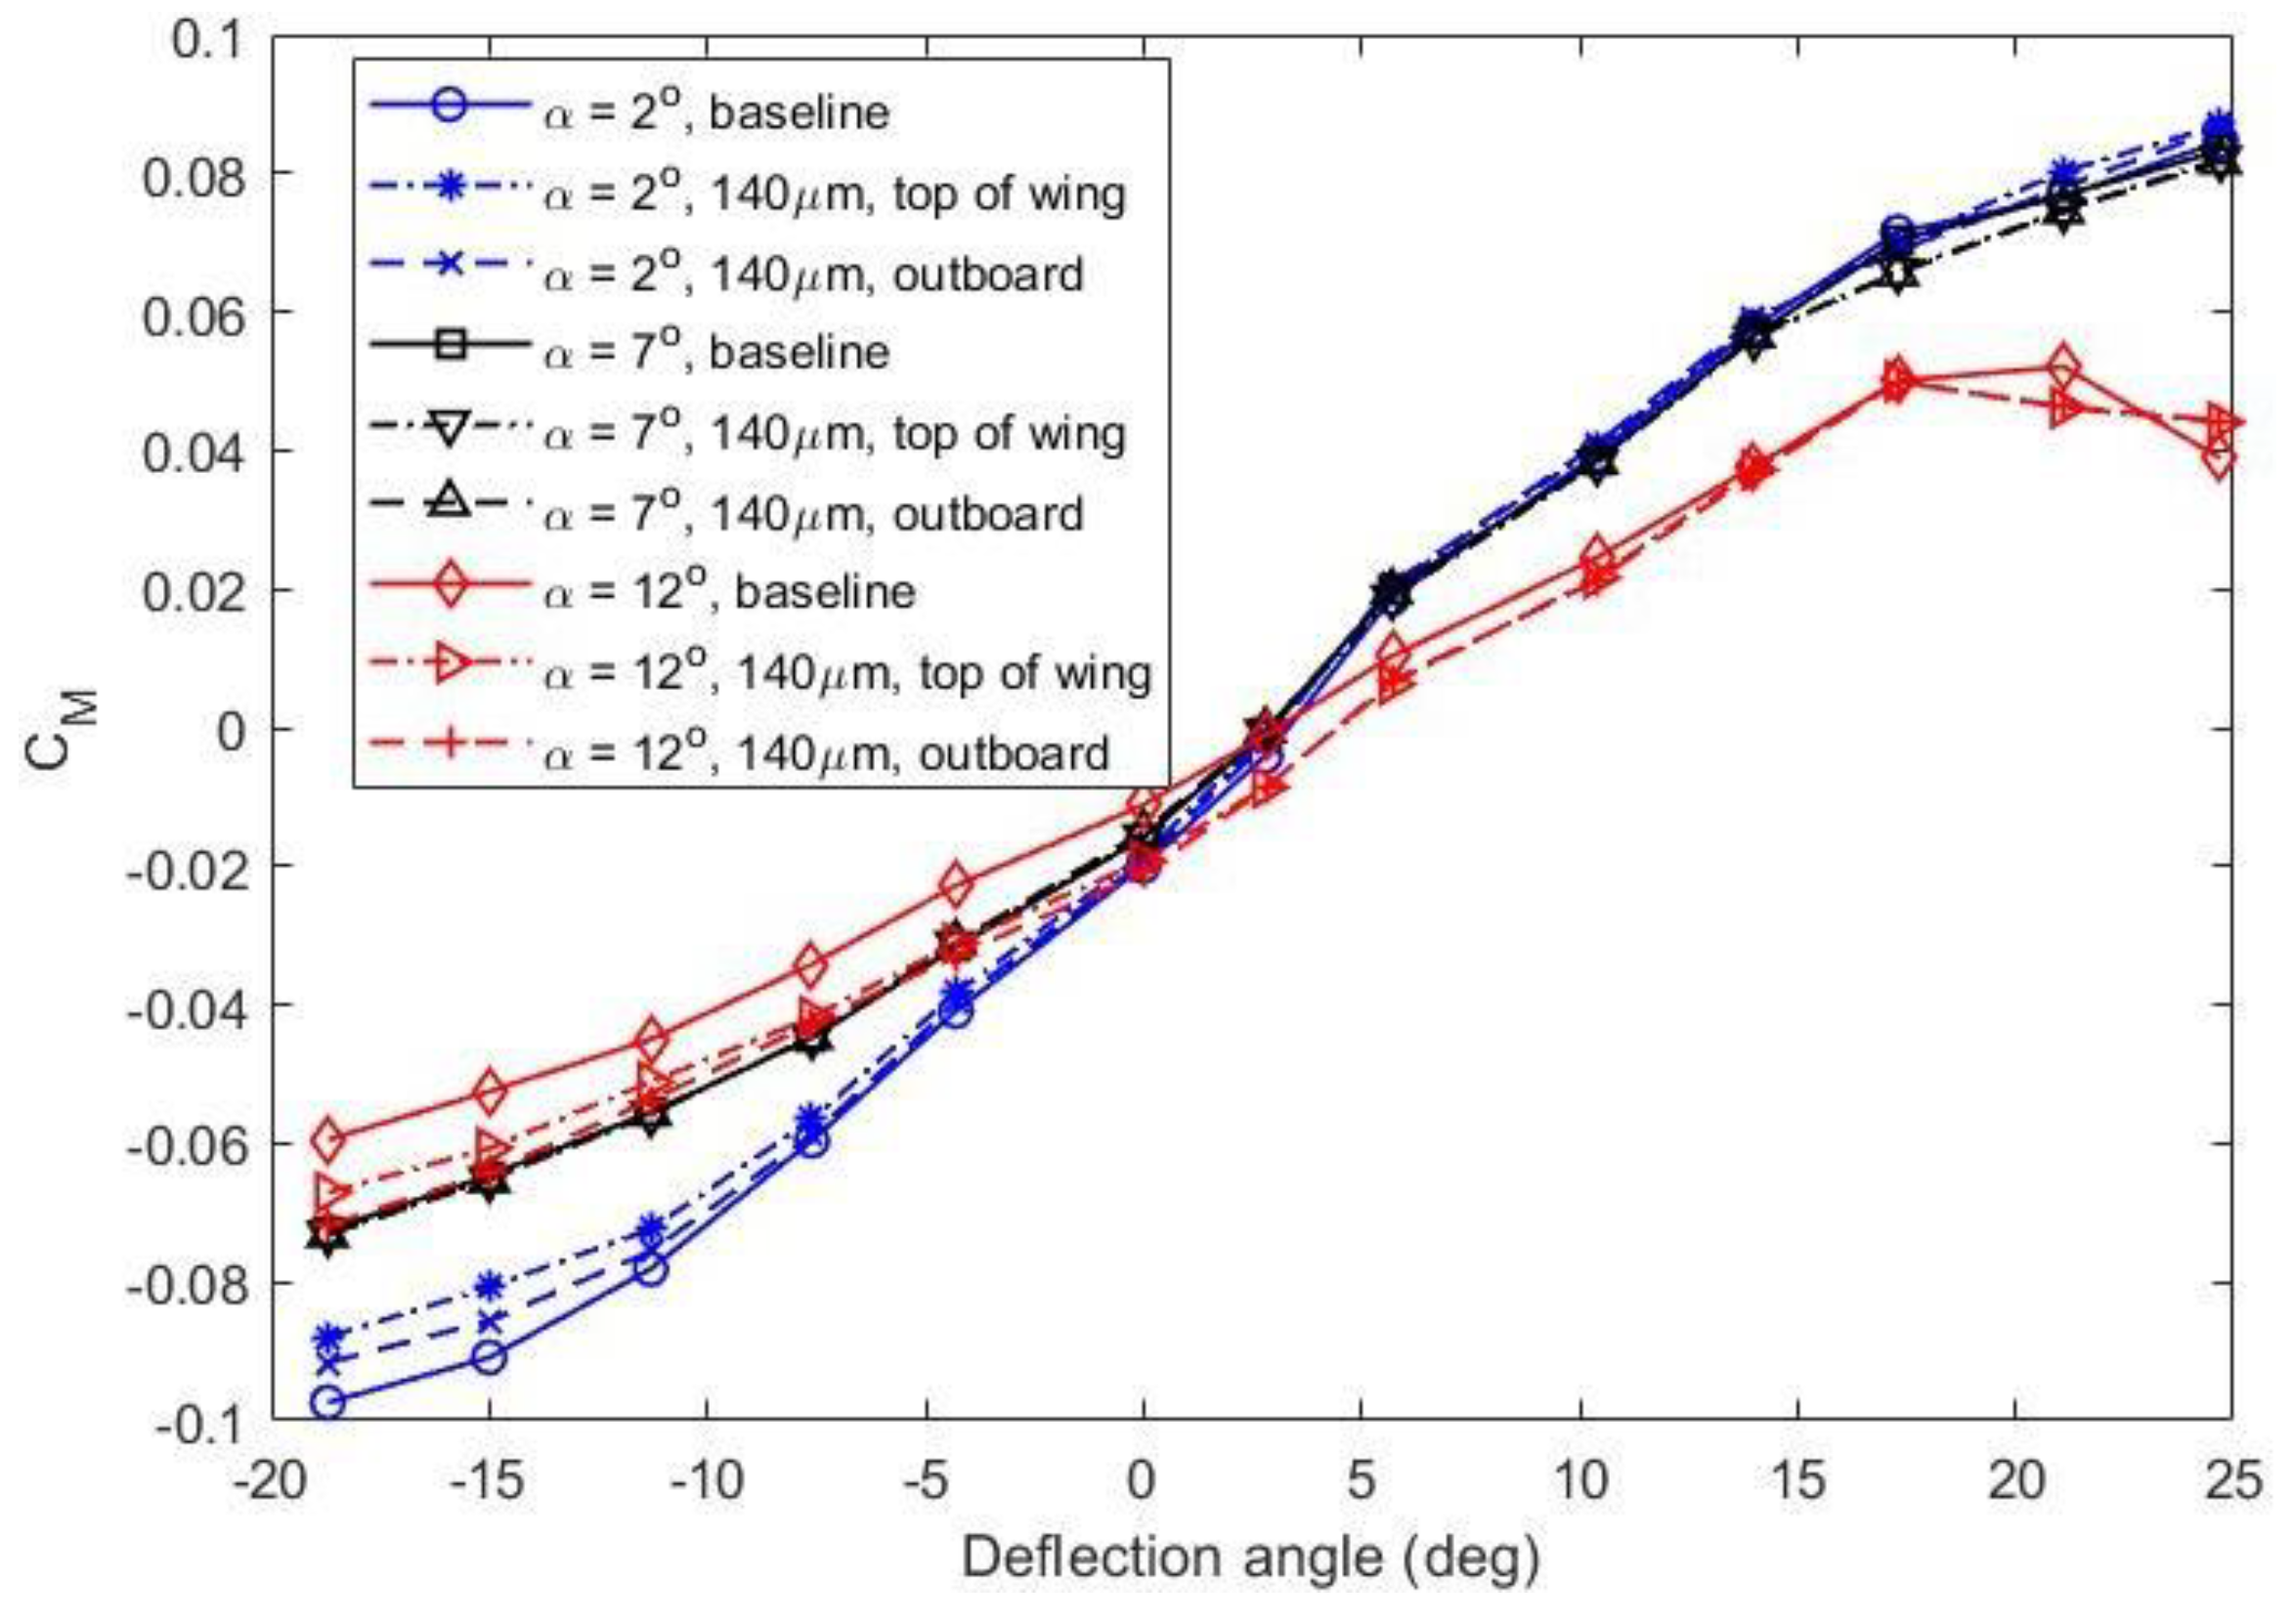
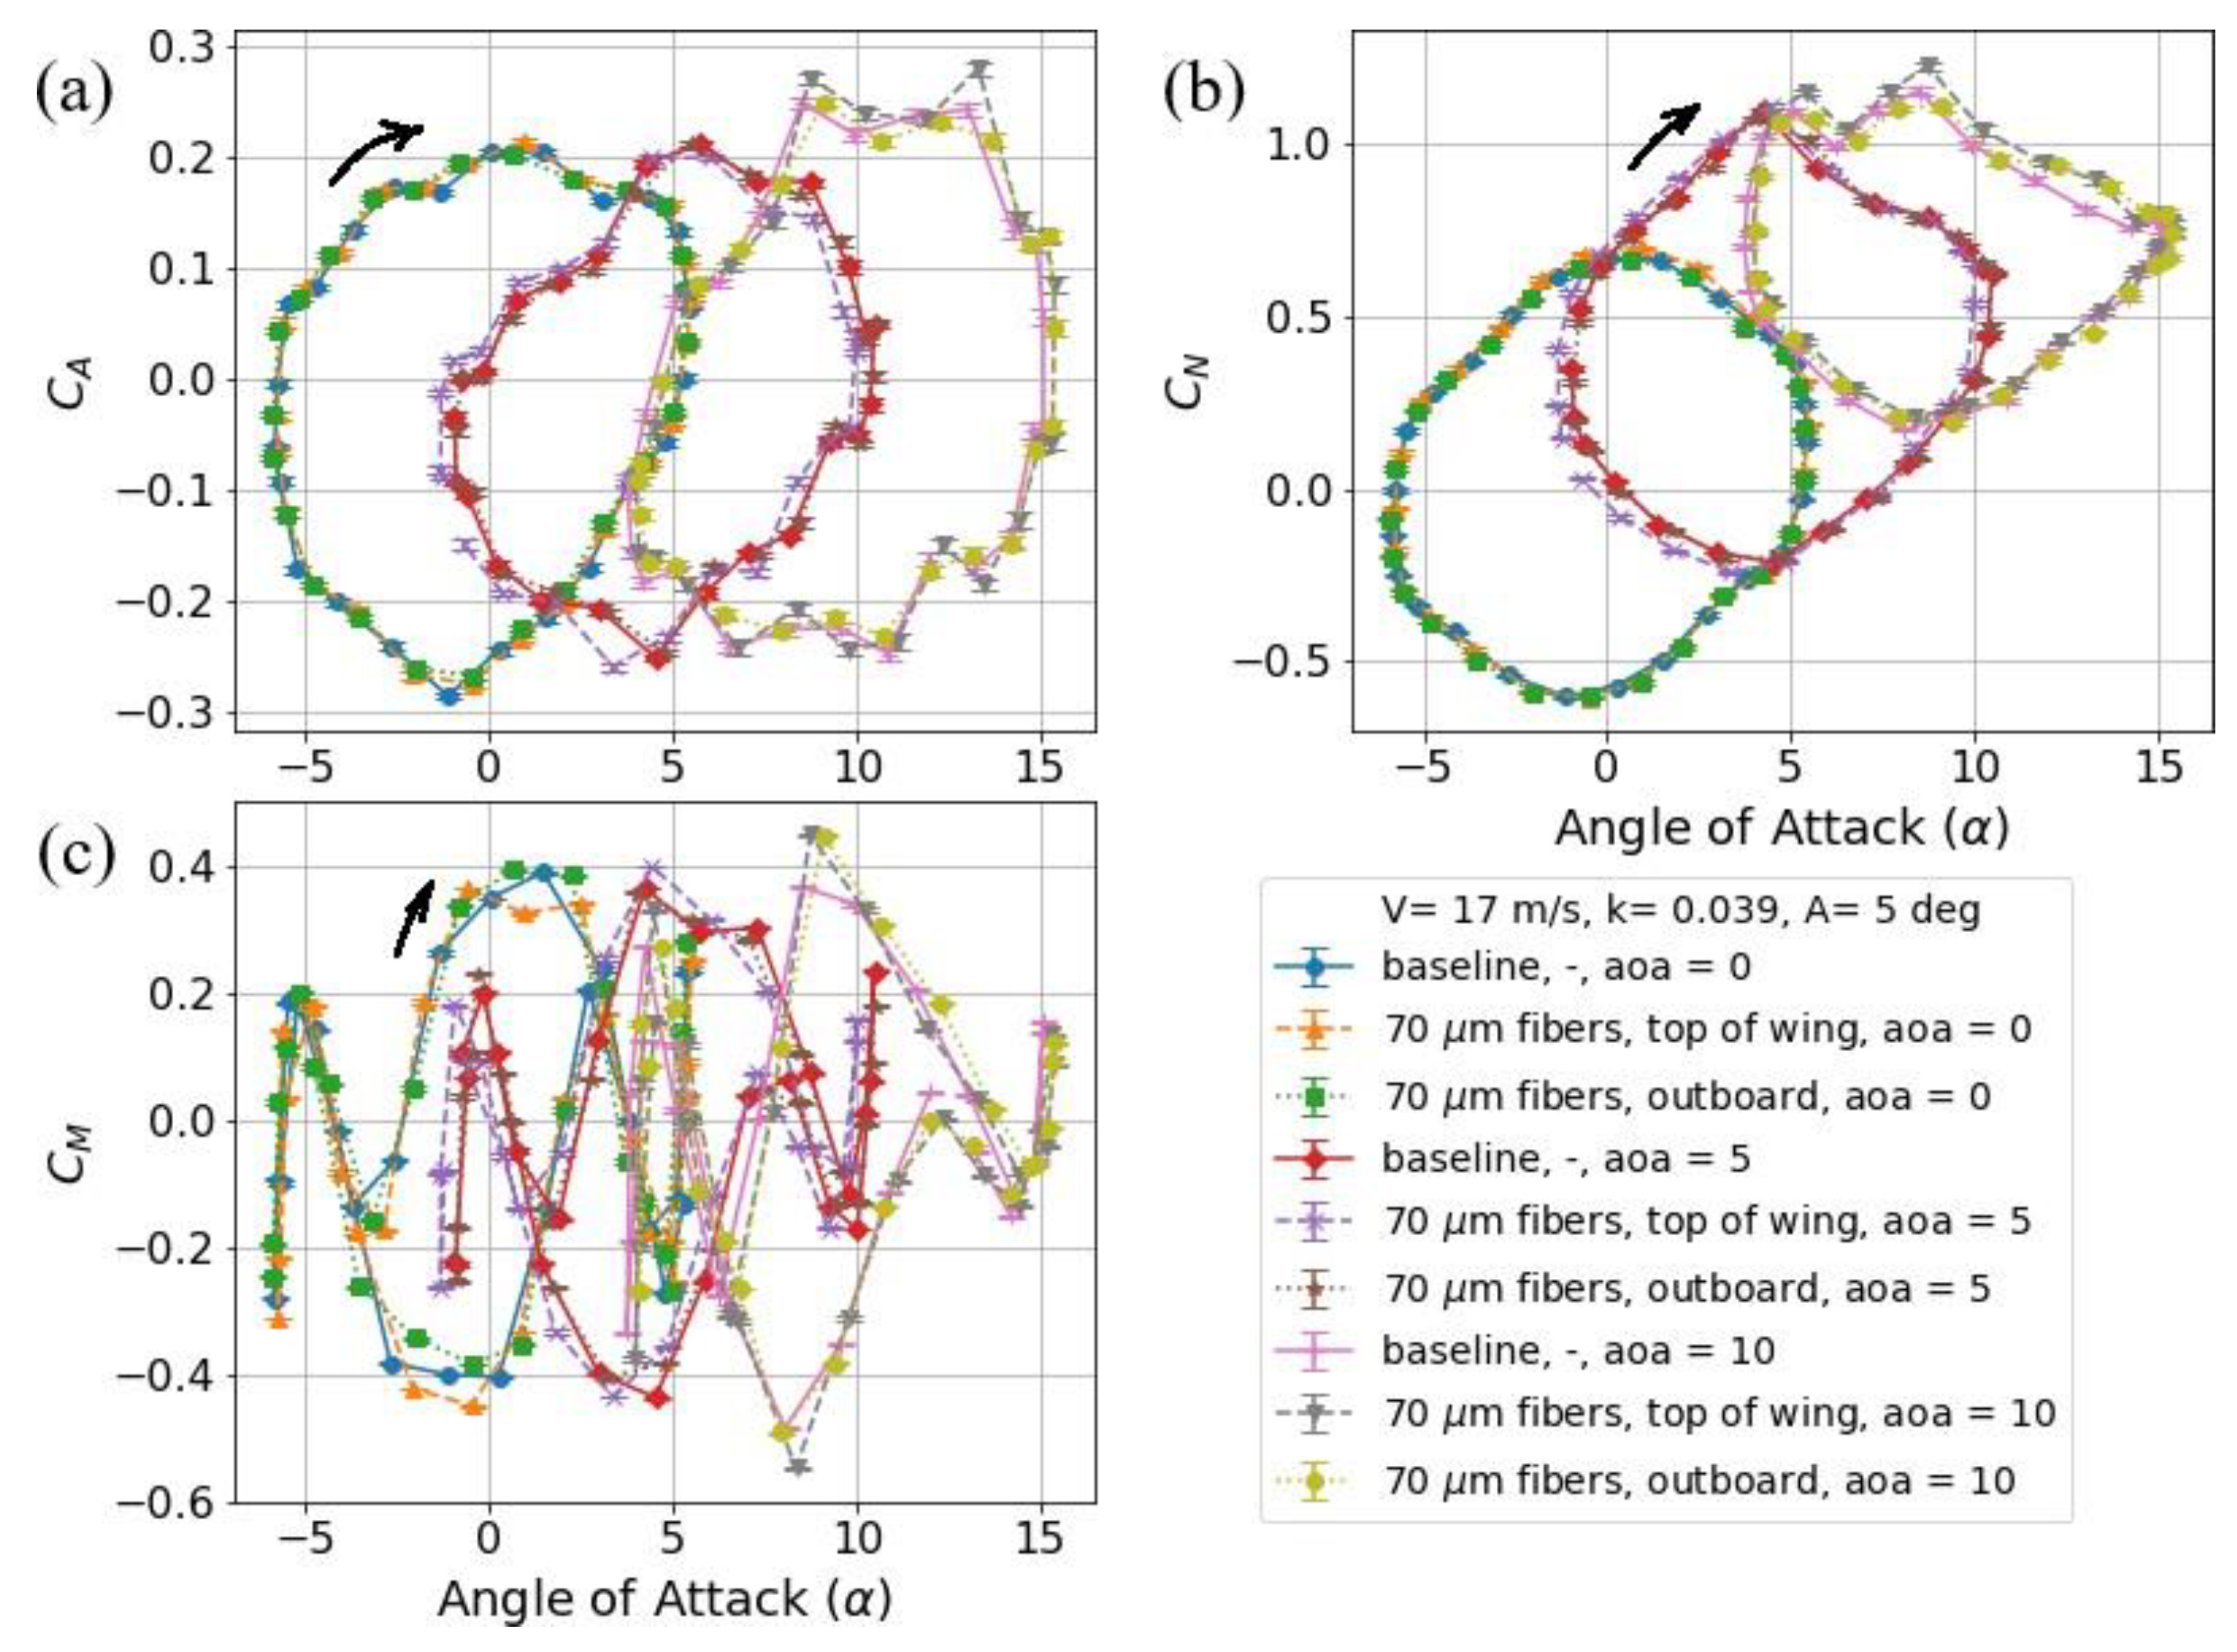
A passive flow control technique in the form of microfiber coatings with diverging pillar cross-section area was applied to the wing suction surface of a small tailless unmanned aerial vehicle (UAV). The coatings are inspired from ‘gecko feet’ surfaces and their effect on aerodynamic and control surface performance is analyzed via wind tunnel experiments in static and dynamic conditions. The static angle of attack was set at a range of angles from -2◦ to 17◦, and the elevon control surface was deflected from -18.7◦ to 24.7◦. In forced oscillation, various combinations of mean angle of attack, frequency and amplitude were explored. The aerodynamic coefficients were calculated from load cell measurements for experimental variables such as microfiber pillar height, the region of the wing coated with microfibers, Reynolds number and angle of attack. Microfibers with a 140µm pillar height, when compared to the smooth wing case, provide drag reduction of up to 24.7% for CL = 0.9 at the cruise Reynolds number, whereas shorter 70µm microfibers perform better at the stall Reynolds number, with a 24.2% CD reduction for the same CL. Control surface experiments show pitch moment authority is significantly improved at higher angles of attack near stall when microfibers cover the elevon and its upstream wing region, with an increase in CM magnitude of up to 22.4%. Dynamic experiments showed that microfibers marginally increase dynamic damping in pitch, improving load factor production in response to control surface actuation at low angles of attack, but reducing it at higher angles. In general, the microfiber pillars are within the laminar boundary layer, and create a periodic slip condition on the top surface of the pillars which increases the near-wall momentum over the wing surface. This mechanism is particularly effective in mitigating flow separation at high angles of attack, reducing pressure drag and restoring pitching moment authority provided by control surfaces.
Keywords:
1. Introduction
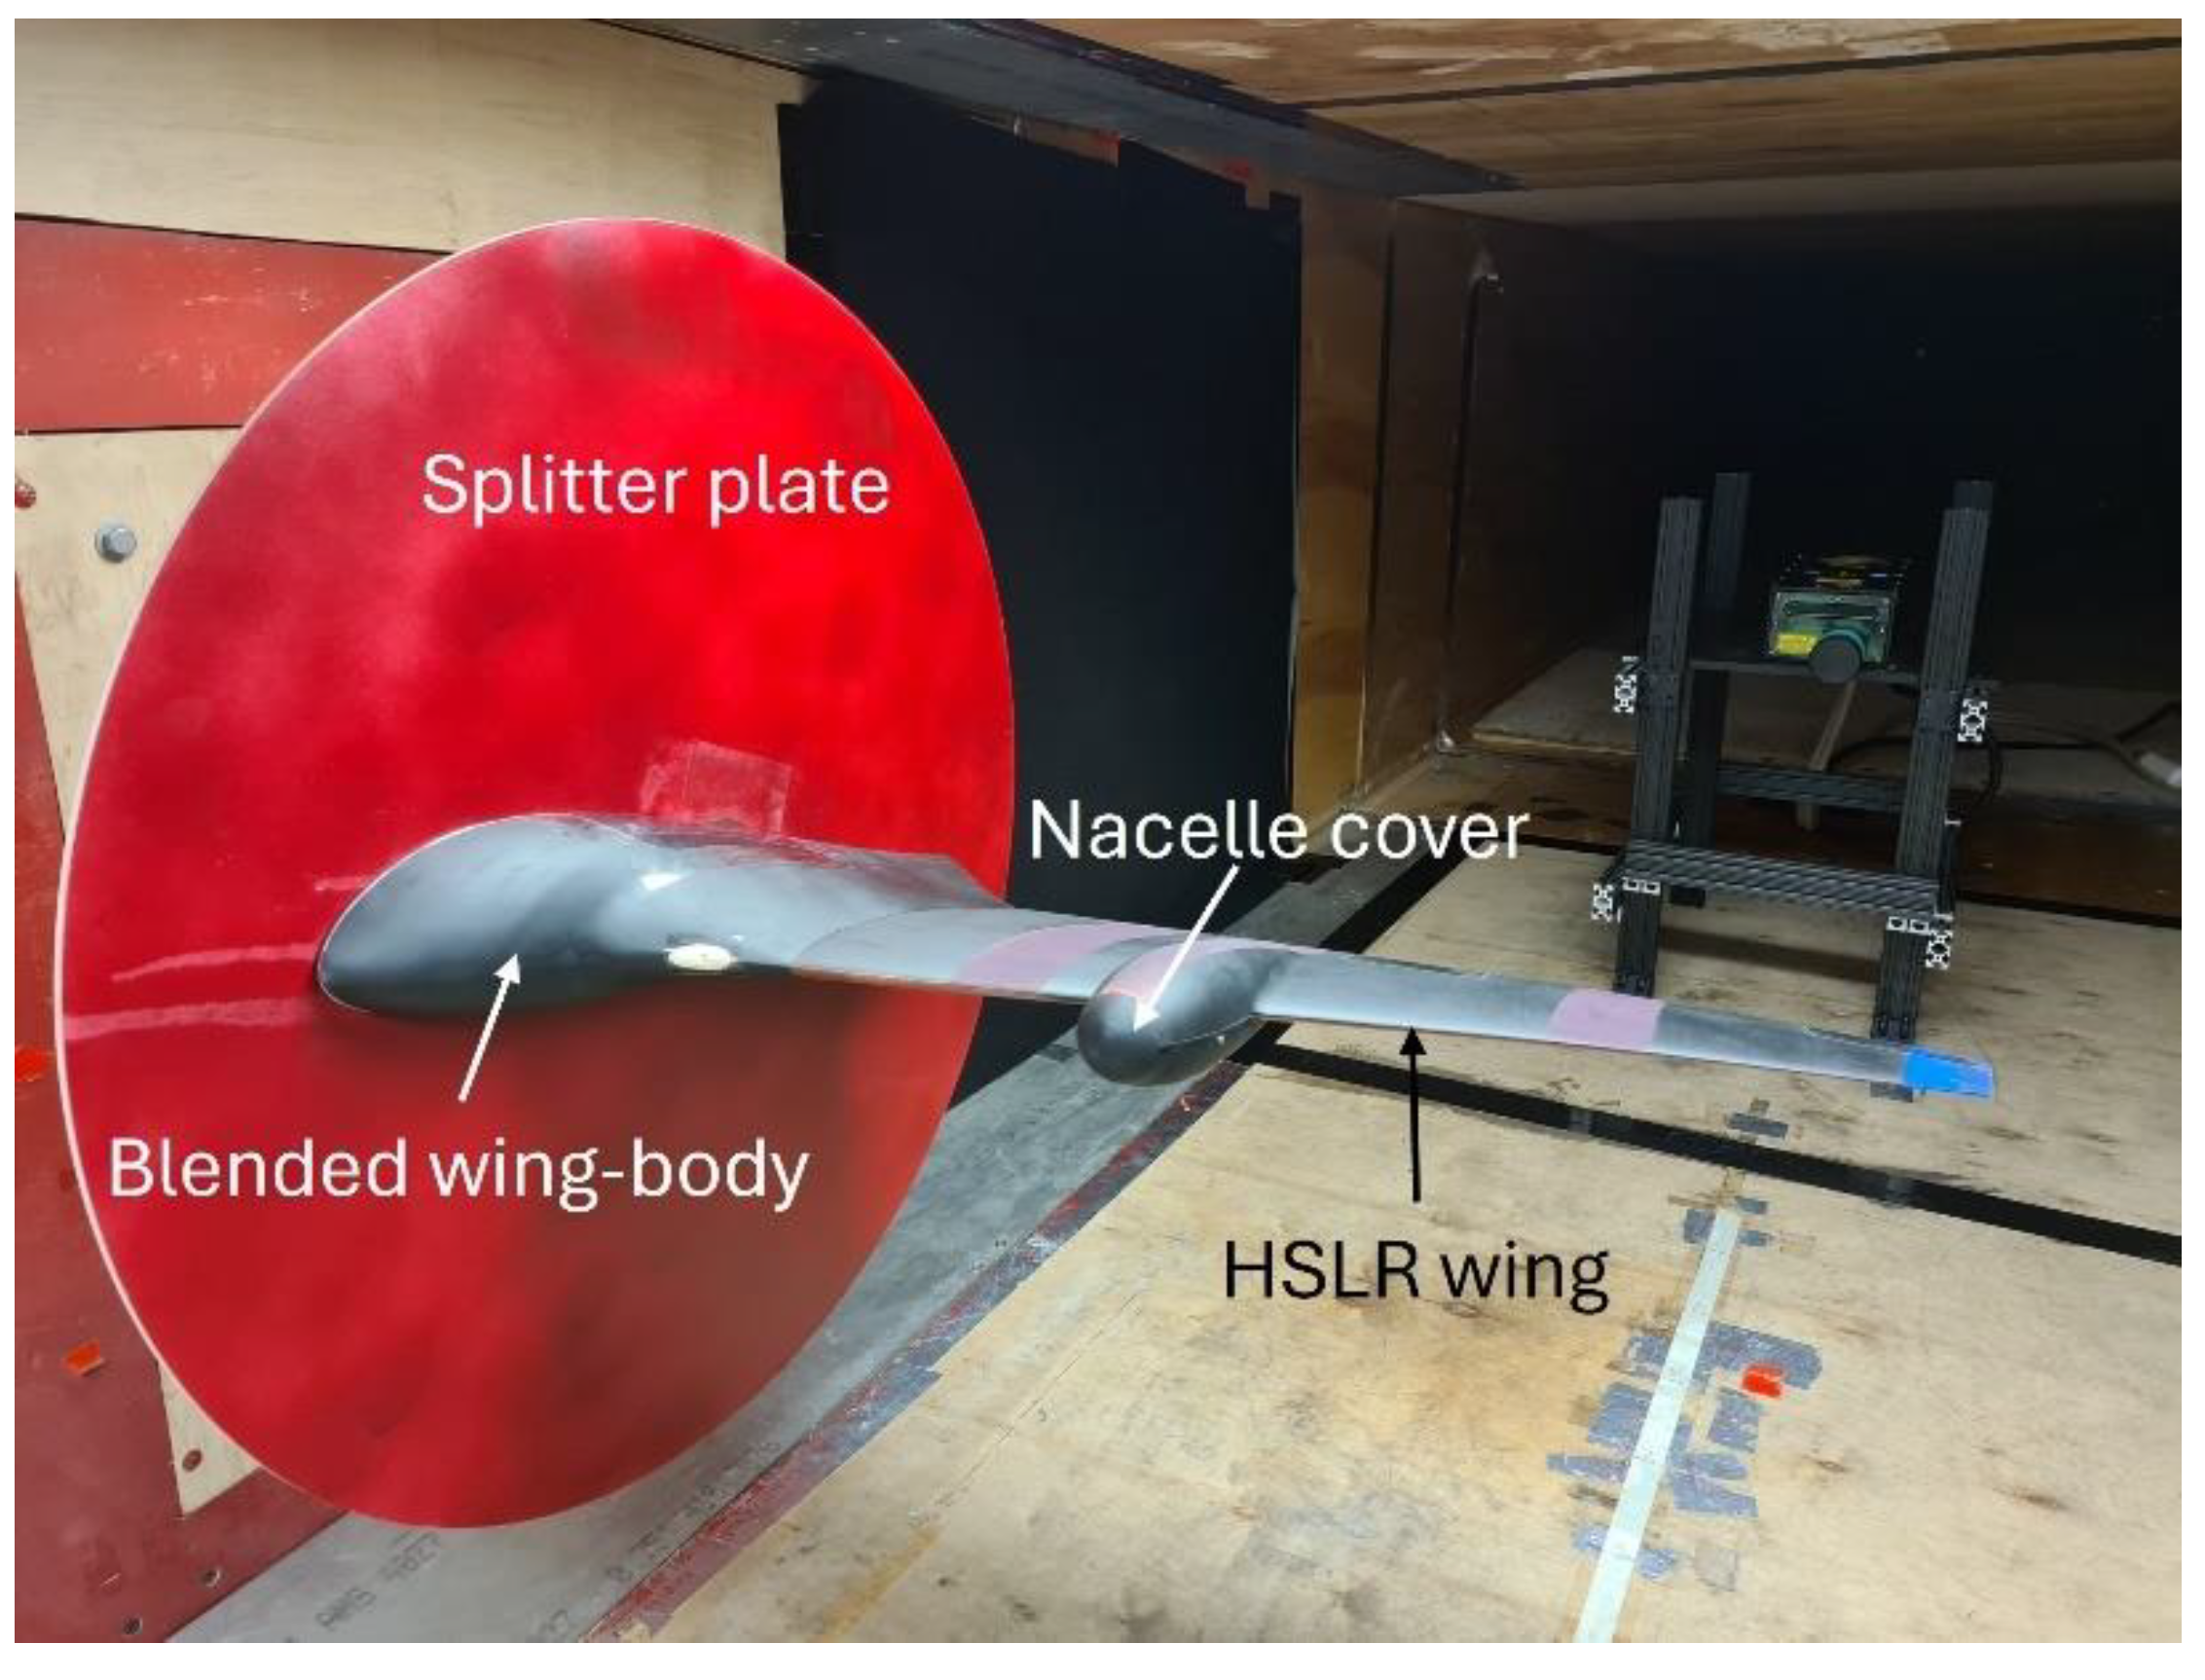
2. Test Setup
2.1. Switchblade UAV Model
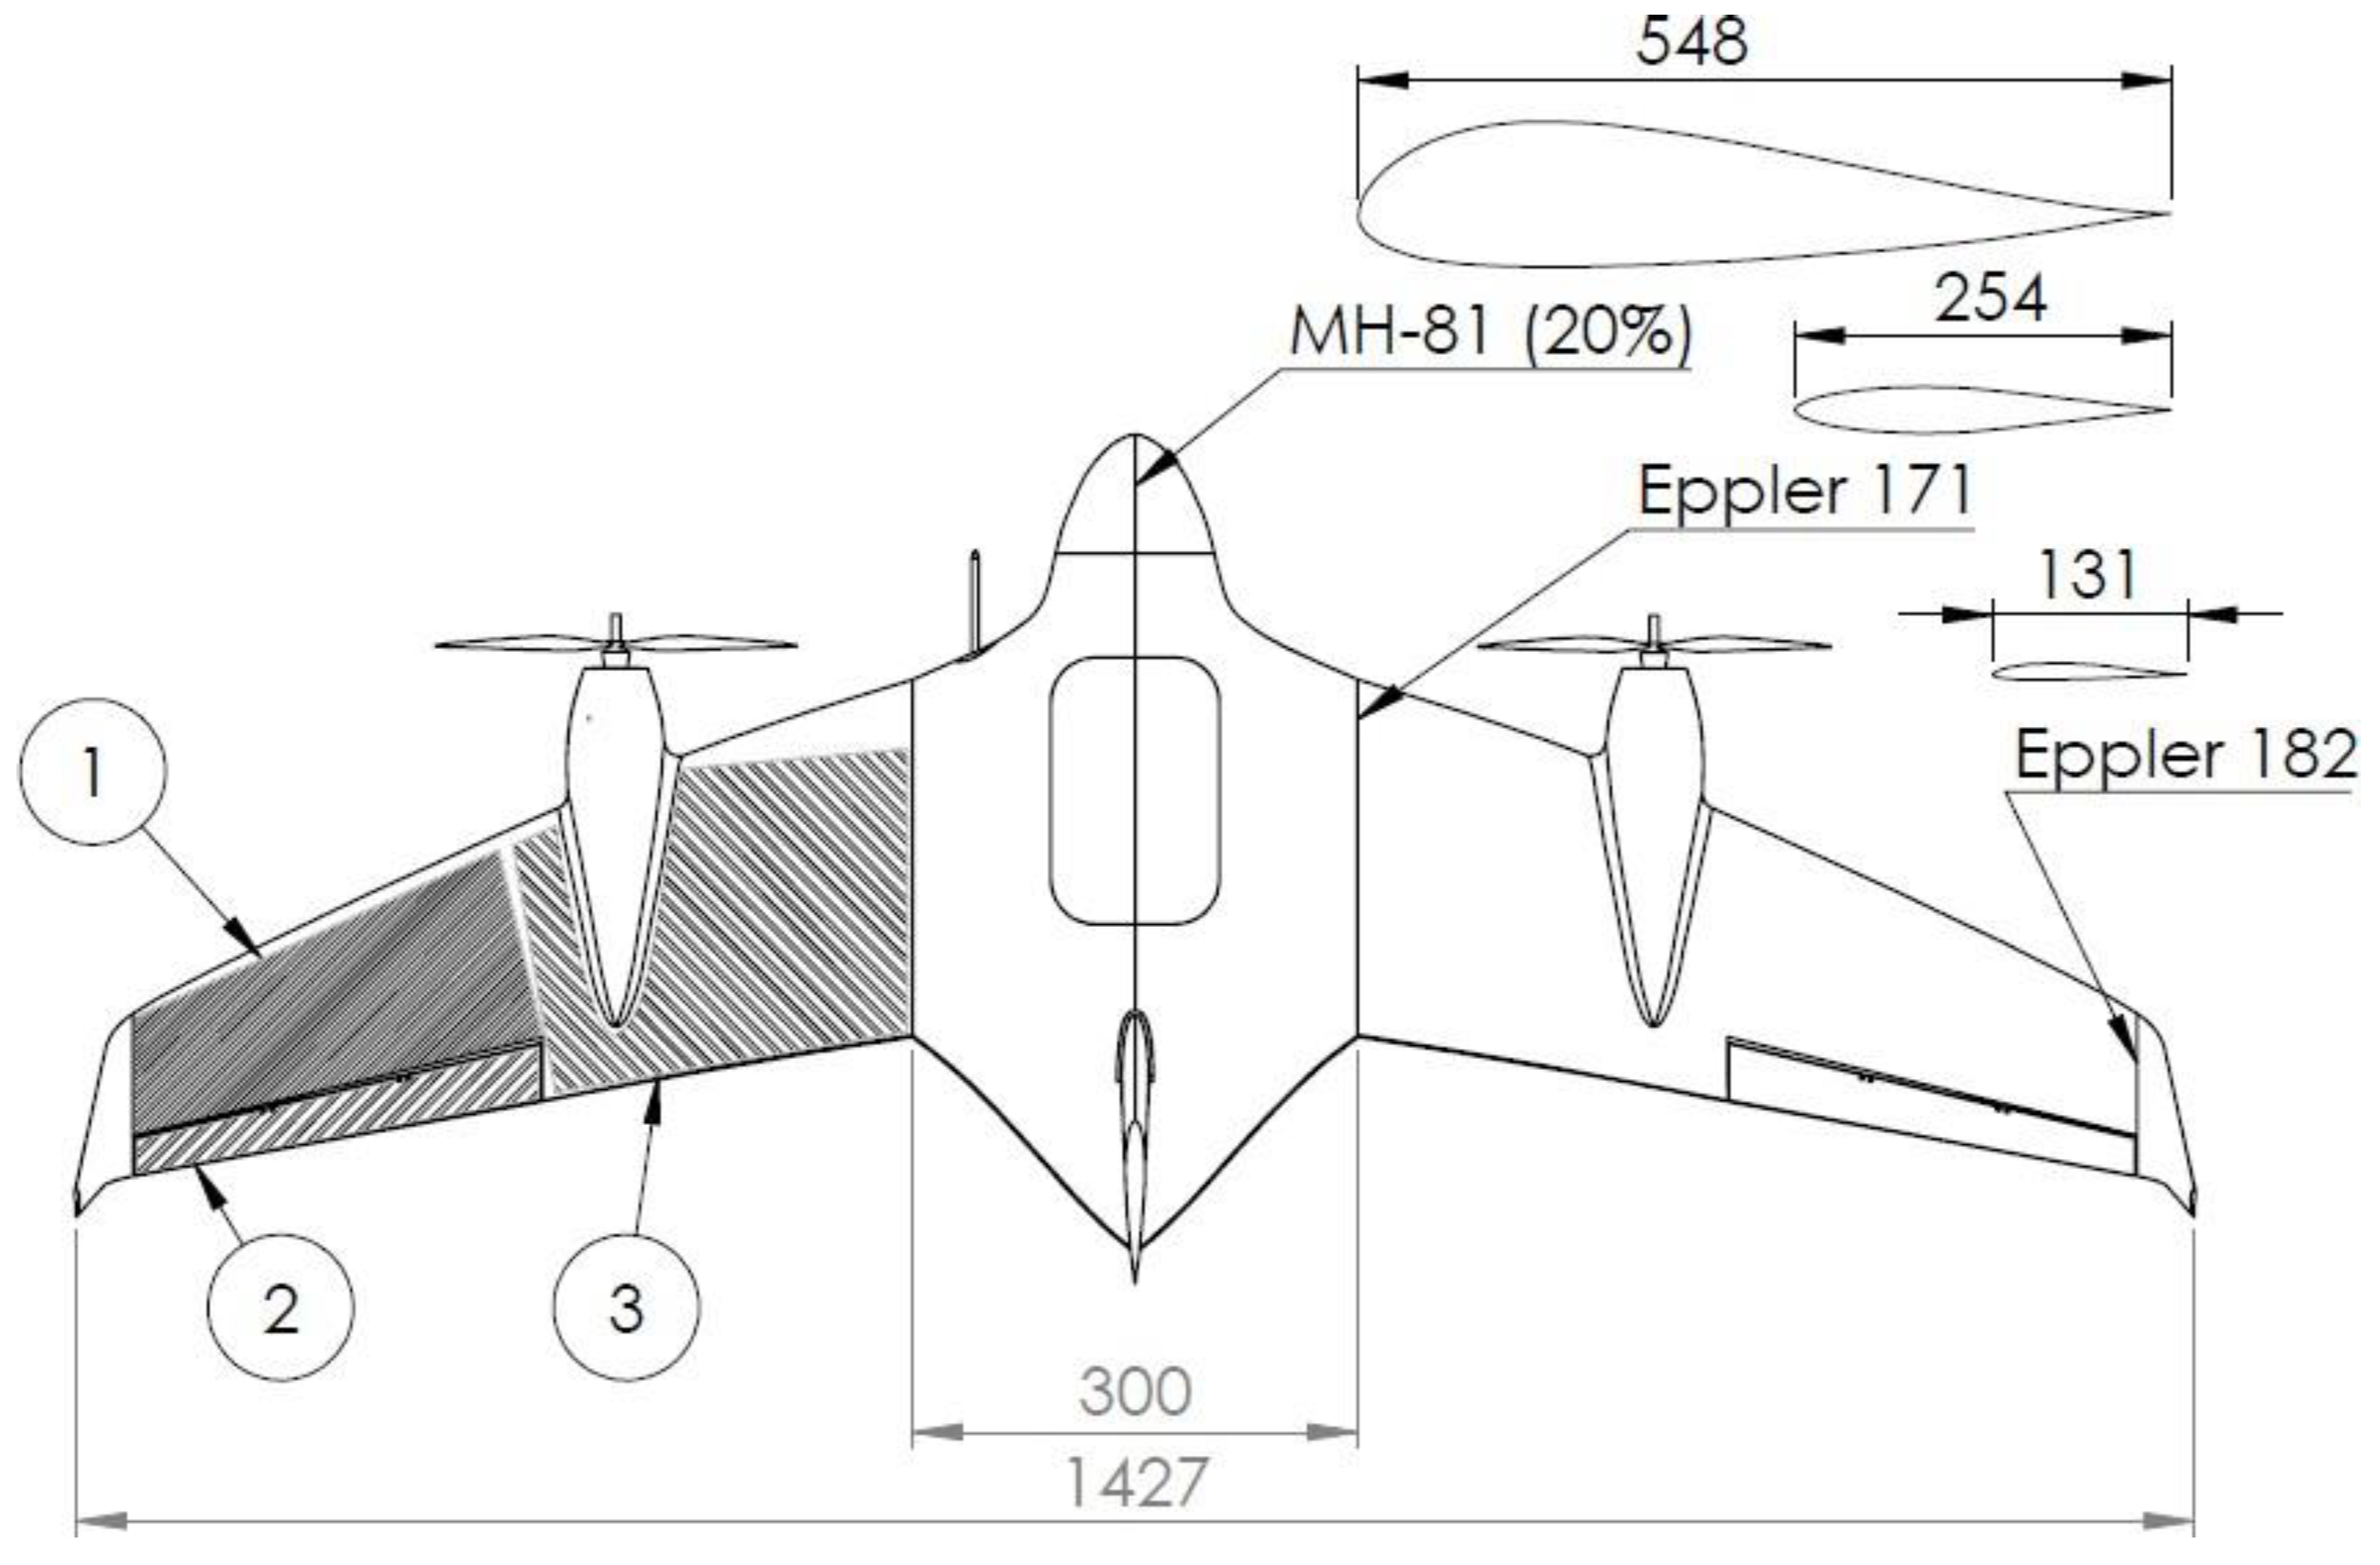
2.2. Bio-Inspired Microfiber Films
2.3. Wind Tunnel
2.4. Static Angles of Attack
2.5. Dynamic Stall Program

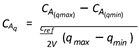
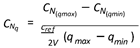
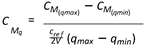
3. Results and Discussion
3.1. Static Angles of Attack

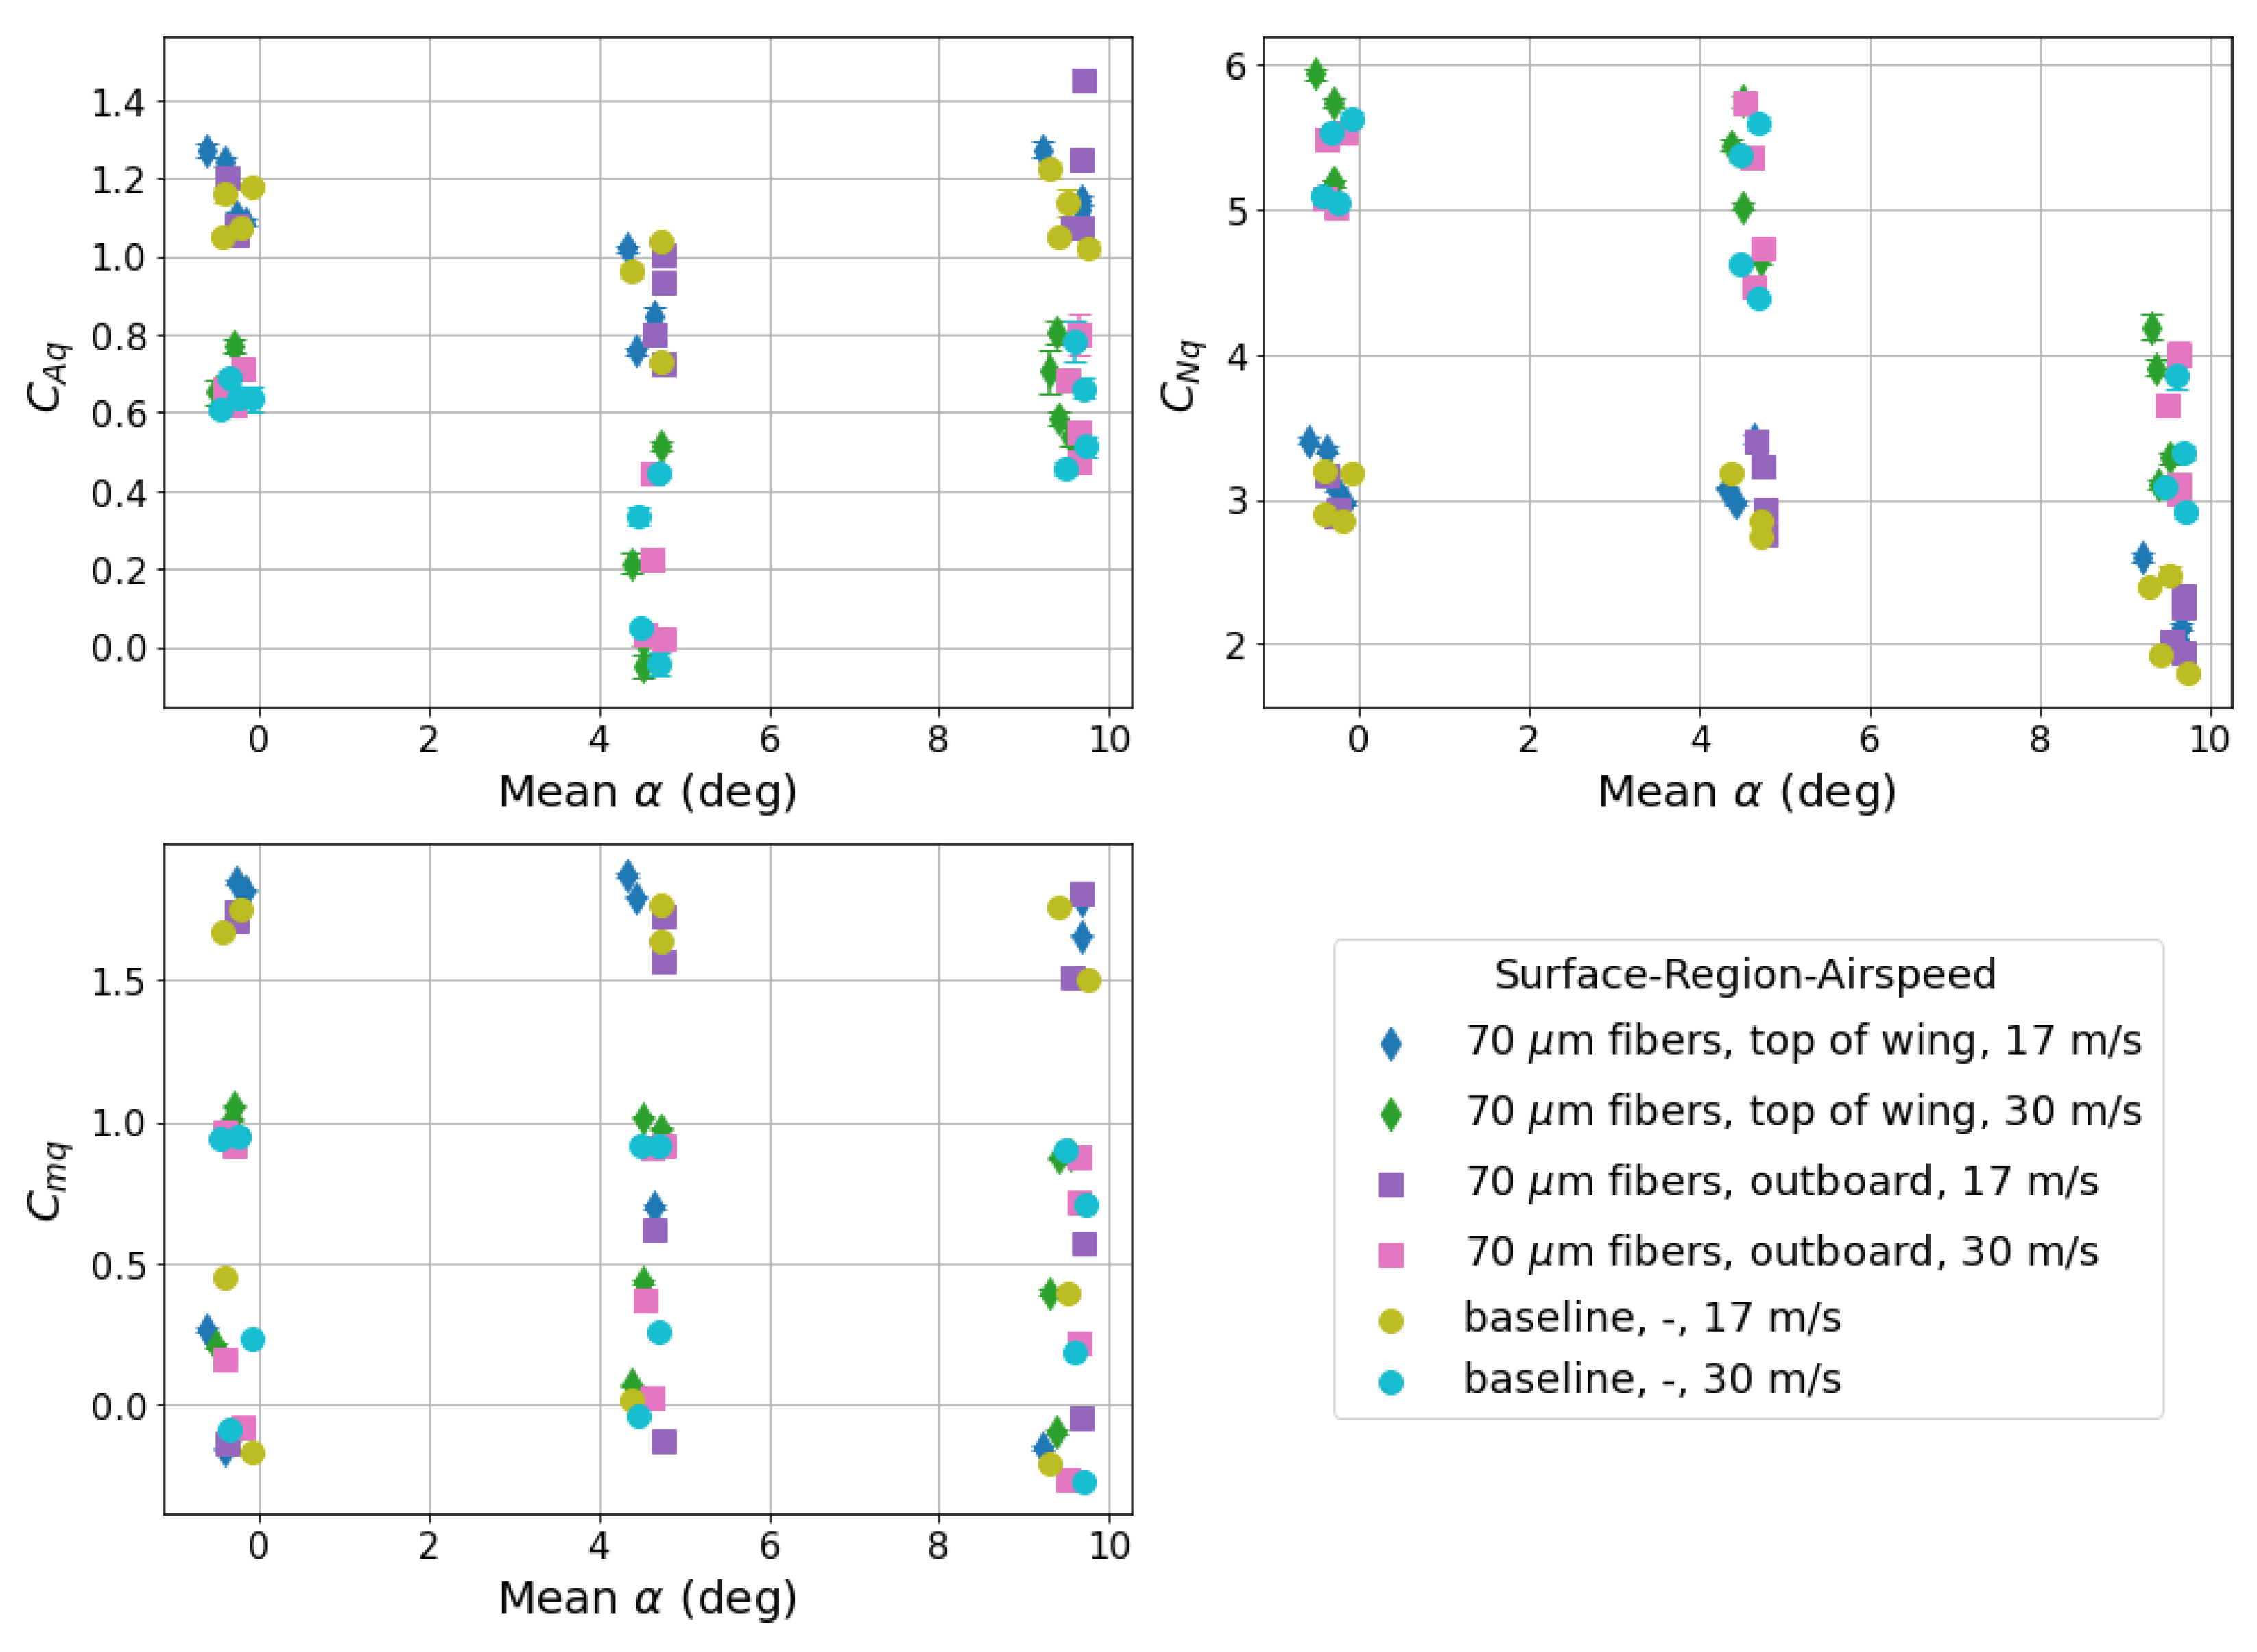
3.2. Dynamic Stall
4. Conclusions
Author Contributions
Funding
Data Availability Statement
Acknowledgments
Conflicts of Interest
Abbreviations
| UAV | Unmanned Aerial Vehicle |
| UAS | Unmanned Aerial System |
| HSLR | High-Speed Long-Range |
| LSHE | Low-Speed High-Endurance |
| AoA | Angle-of-Attack |
References
- GrandView. Commercial Drone Market Size, Share and Trends Analysis Report By Product (Fixed-wing, Rotary Blade, Hybrid), By Application, By End-use, By Region, And Segment Forecasts, 2021 - 2028.
- Raymer, D., Aircraft Design: A Conceptual Approach; American Institute of Aeronautics and Astronautics: Reston, VA, 2012; pp. 223 – 225. [CrossRef]
- Lin, J.C. Review of research on low-profile vortex generators to control boundary-layer separation. Progress in Aerospace Sciences 2002, 38, 389–420. [CrossRef]
- Lissaman, P. Low-Reynolds-number airfoils. Annual review of fluid mechanics 1983, 15, 223–239. [CrossRef]
- Zhen, T.K.; Zubair, M.; Ahmad, K.A. Experimental and Numerical Investigation of the Effects of Passive Vortex Generators on Aludra UAV Performance. Chinese Journal of Aeronautics 2011, 24, 577–583. [CrossRef]
- Zhu, C.; Chen, J.; Wu, J.; Wang, T. Dynamic stall control of the wind turbine airfoil via single-row and double-row passive vortex generators. Energy 2019, 189, 116272. [CrossRef]
- Zhou, Y.; Wang, Z.J. Effects of Surface Roughness on Separated and Transitional Flows over a Wing. AIAA Journal 2012, 50, 593–609. [CrossRef]
- Ben-Gida, H.; Stefanini, J.; Stalnov, O.; Gurka, R. Application of passive flow control techniques to attenuate the unsteady near wake of airborne turrets in subsonic flow. Aerospace Science and Technology 2021, 119, 107129. [CrossRef]
- Serdar GENÇ, M.; KOCA, K.; AÇIKEL, H.H. Investigation of pre-stall flow control on wind turbine blade airfoil using roughness element. Energy 2019, 176, 320–334. [CrossRef]
- Winzen, A.; Klaas, M.; Schröder, W. High-Speed Particle Image Velocimetry and Force Measurements of Bio-Inspired Surfaces. Journal of Aircraft 2015, 52, 471–485. [CrossRef]
- Hu, H.; Tamai, M. Bioinspired Corrugated Airfoil at Low Reynolds Numbers. Journal of Aircraft 2008, 45, 2068–2077. [CrossRef]
- Bie, D.; Li, D.; Xiang, J.; Li, H.; Kan, Z.; Sun, Y. Design, aerodynamic analysis and test flight of a bat-inspired tailless flapping wing unmanned aerial vehicle. Aerospace Science and Technology 2021, 112, 106557. [CrossRef]
- Sui, T.; Zou, T.; Riskin, D. Optimum Design of a Novel Bio-Inspired Bat Robot. IEEE Robotics and Automation Letters 2022, 7, 3419–3426. [CrossRef]
- Fish, F.E., Biomimetics and the Application of the Leading-Edge Tubercles of the Humpback Whale Flipper. In Flow Control Through Bio-inspired Leading-Edge Tubercles: Morphology, Aerodynamics, Hydrodynamics and Applications; New, D.T.H.; Ng, B.F., Eds.; Springer International Publishing: Cham, 2020; pp. 1–39. [CrossRef]
- Guerreiro, J.L.E.; Sousa, J.M.M. Low-Reynolds-Number Effects in Passive Stall Control Using Sinusoidal Leading Edges. AIAA Journal 2012, 50, 461–469. [CrossRef]
- Rose, B.; Vt, G. Aerodynamics with state-of-the-art bioinspired technology: Tubercles of humpback whale. Proceedings of the Institution of Mechanical Engineers Part G Journal of Aerospace Engineering 2021, 235. [CrossRef]
- Dou, Z.; Wang, J.; Chen, D. Bionic research on fish scales for drag reduction. Journal of Bionic Engineering 2012, 9, 457–464.
- Chen, D.; Chen, H.; Cui, X. Dual-coupling drag reduction inspired by tuna skin: Fan-shaped imbricated fish scale composited with flexible coating. AIP Advances 2022, 12, 035218. [CrossRef]
- Mosghani, M.M.; Alidoostan, M.A.; Binesh, A. Numerical analysis of drag reduction of fish scales inspired Ctenoid-shape microstructured surfaces. Chemical Engineering Communications 2021, 0, 1–16. [CrossRef]
- Muthuramalingam, M.; Puckert, D.K.; Rist, U.; Bruecker, C. Transition delay using biomimetic fish scale arrays. Scientific Reports 2020, 10, 14534. [CrossRef]
- Bixler, G.D.; Bhushan, B. Fluid Drag Reduction with Shark-Skin Riblet Inspired Microstructured Surfaces. Advanced Functional Materials 2013, 23, 4507–4528, [https://onlinelibrary.wiley.com/doi/pdf/10.1002/adfm.201203683]. [CrossRef]
- Friedmann, E.; Portl, J.; Richter, T., A Study of Shark Skin and Its Drag Reducing Mechanism. In Advances in Mathematical Fluid Mechanics: Dedicated to Giovanni Paolo Galdi on the Occasion of his 60th Birthday; Rannacher, R.; Sequeira, A., Eds.; Springer Berlin Heidelberg: Berlin, Heidelberg, 2010; pp. 271–285. [CrossRef]
- Domel, A.G.; Domel, G.; Weaver, J.C.; Saadat, M.; Bertoldi, K.; Lauder, G.V. Hydrodynamic properties of biomimetic shark skin: effect of denticle size and swimming speed. Bioinspiration & Biomimetics 2018, 13, 056014. [CrossRef]
- Afroz, F.; Lang, A.; Habegger, M.L.; Motta, P.; Hueter, R. Experimental study of laminar and turbulent boundary layer separation control of shark skin. Bioinspiration & Biomimetics 2016, 12, 016009. [CrossRef]
- Yu, C.; Liu, M.; Zhang, C.; Yan, H.; Zhang, M.; Wu, Q.; Liu, M.; Jiang, L. Bio-inspired drag reduction: From nature organisms to artificial functional surfaces. Giant 2020, 2, 100017. [CrossRef]
- Evans, H.B.; Hamed, A.M.; Gorumlu, S.; Doosttalab, A.; Aksak, B.; Chamorro, L.P.; Castillo, L. Engineered bio-inspired coating for passive flow control. Proceedings of the National Academy of Sciences 2018, 115, 1210–1214, [https://www.pnas.org/doi/pdf/10.1073/pnas.171 . [CrossRef]
- Doosttalab, A.; Dharmarathne, S.; Bocanegra Evans, H.; Hamed, A.M.; Gorumlu, S.; Aksak, B.; Chamorro, L.P.; Tutkun, M.; Castillo, L. Flow modulation by a mushroom-like coating around the separation region of a wind-turbine airfoil section. Journal of Renewable and Sustainable Energy 2018, 10, 043305.
- Santos, D.; Rogers, J.; De Rezende, A.; Maldonado, V. Exploring the Performance Boundaries of a Small Reconfigurable Multi-Mission UAV through Multidisciplinary Analysis. Aerospace 2023, 10. [CrossRef]
- Santos, D.; Ramirez, D.; Rogers, J.; Zamora, J.; Rezende, A.; Maldonado, V. Full-Cycle Design and Analysis of the Switchblade Reconfigurable Unmanned Aerial System. In Proceedings of the AIAA Aviation Forum; , 2022. [CrossRef]
- Maldonado, V.; Santos, D.; Wilt, M.; Ramirez, D.; Shoemaker, J.; Ayele, W.; Beeson, B.; Lisby, B.; Zamora, J.; Antu, C. ‘Switchblade’: Wide-Mission Performance Design of a Multi-Variant Unmanned Aerial System. In Proceedings of the AIAA Scitech 2021 Forum; 2021. [CrossRef]
- Vicroy, D.D.; Loeser, T.D.; Schütte, A. Static and Forced-Oscillation Tests of a Generic Unmanned Combat Air Vehicle. Journal of Aircraft 2012, 49, 1558–1583. [CrossRef]
- Marusic, I.; Monty, J.P.; Hultmark, M.; Smits, A.J. On the logarithmic region in wall turbulence. Fluid Mechanics 2013, 716, 389–420. [CrossRef]
- Österlund, J.M.; Johansson, A.V.; Nagib, H.M.; Hites, M.H. A note on the overlap region in turbulent boundary layers. Physics of Fluids 2000, 12, 1–4.
- Maldonado, V.; Peralta, N.; Gorumlu, S.; Ayele, W. On the figure of merit and streamwise flow of a propulsive rotor with synthetic jets. Aerospace Science and Technology 2021, 113. [CrossRef]
- Cook, M.J. Flight Dynamics Principles: A Linear Systems Approach to Aircraft Stability and Control, third edition ed.; Butterworth- Heinemann, 2013.
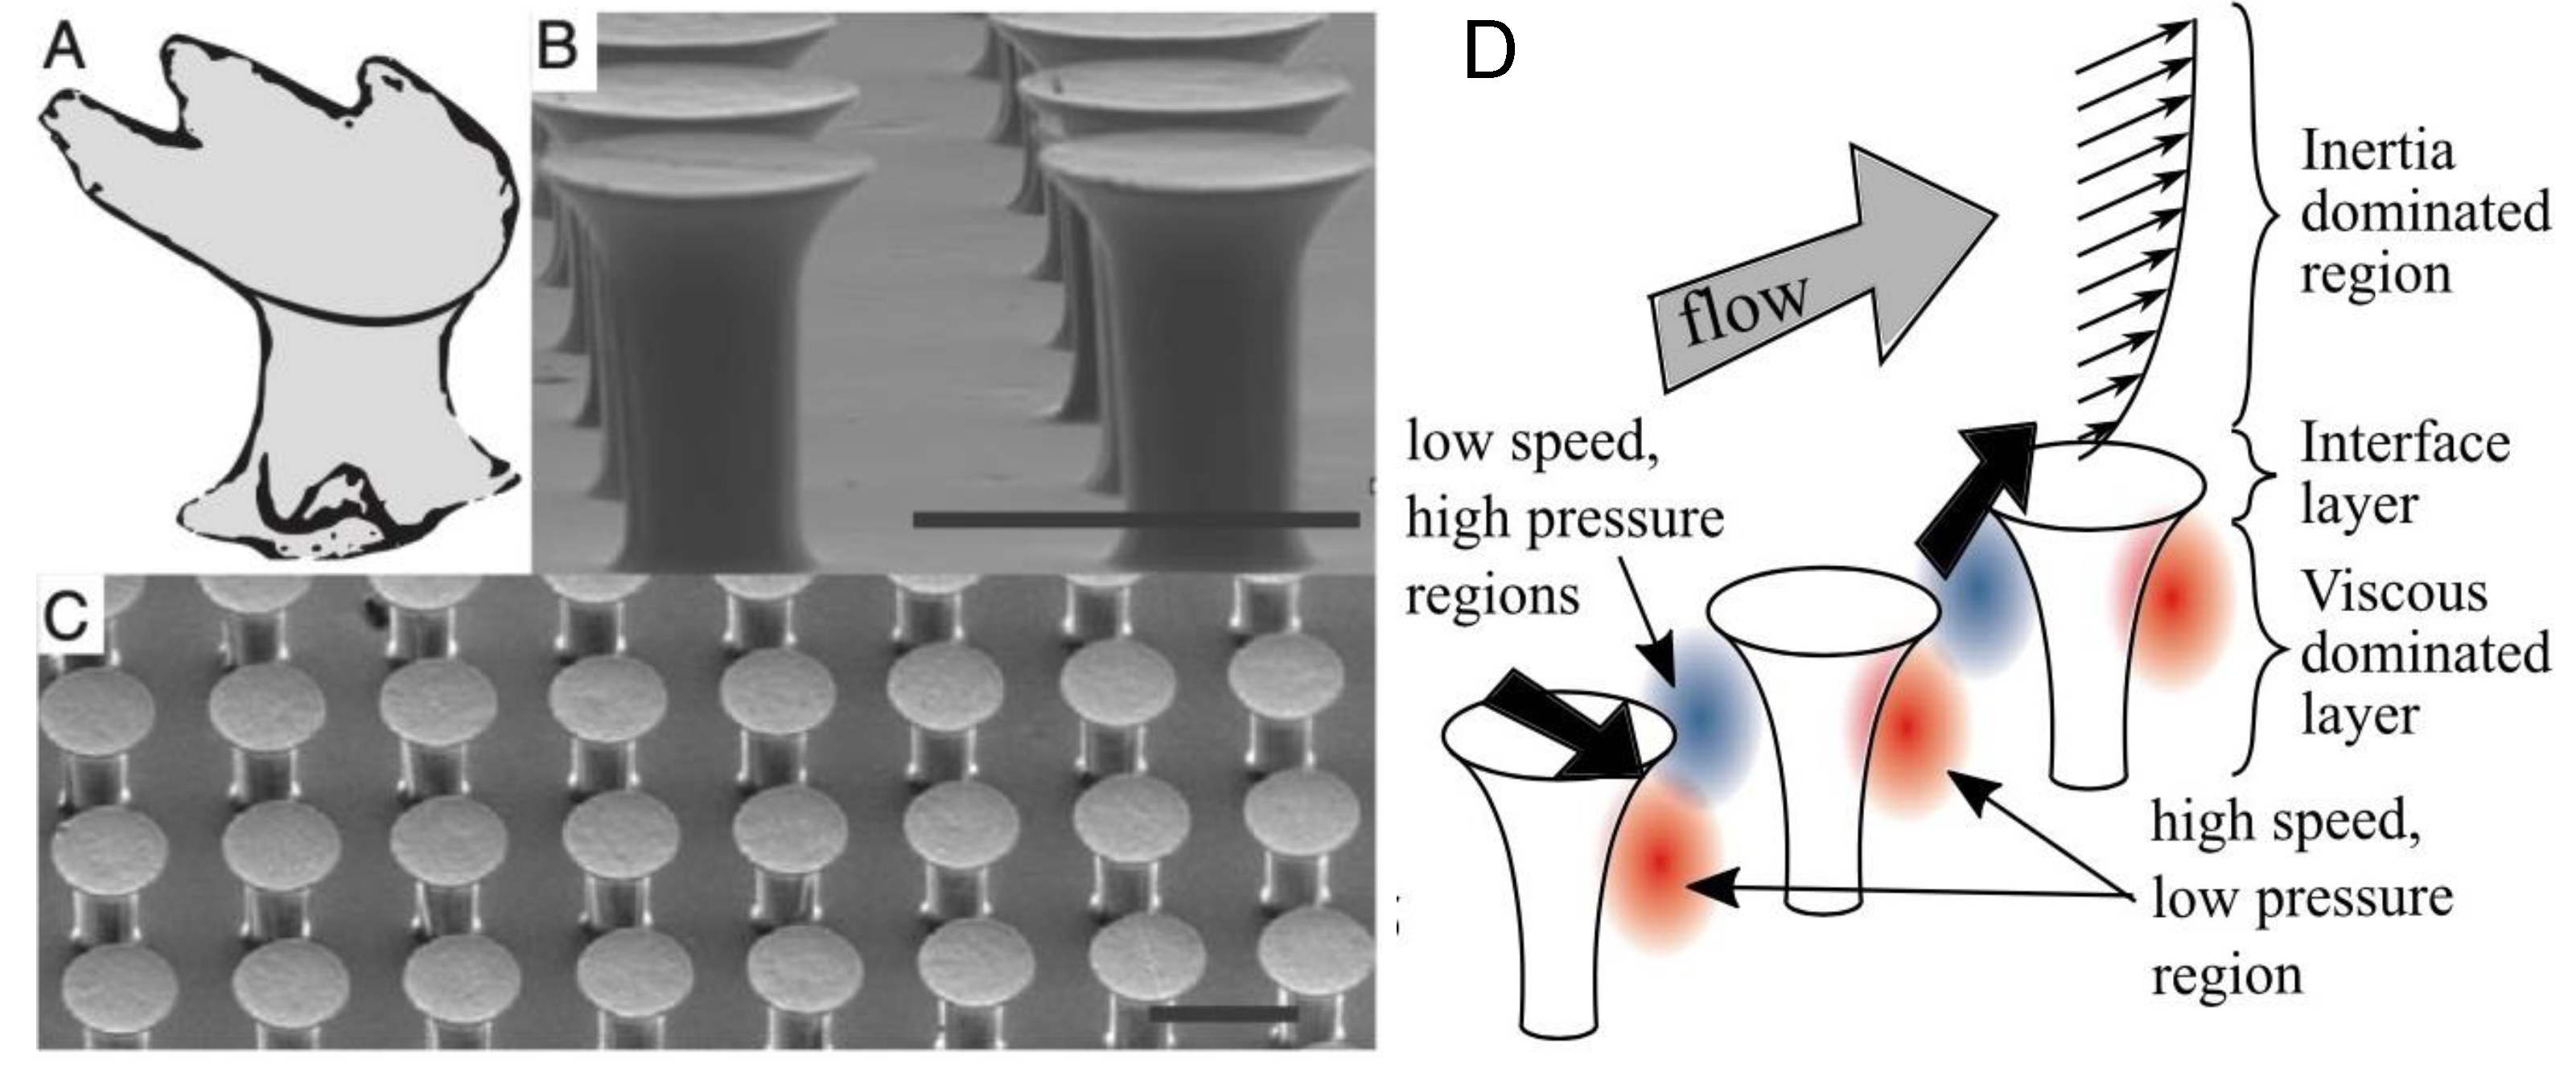

| Wing area [m2] | Aspect ratio | Span [m] | LE Sweep | Taper ratio |
|---|---|---|---|---|
| 0.324 | 6.3 | 1.43 | 24o | 0.35 |
| Surface | Region | AoA [deg] | Airspeed, U∞ | Elevon deflection, δe |
| no fibers | N/A | −2◦ to 17◦ | cruise | N/A |
| no fibers | N/A | −2◦ to 17◦ | stall | N/A |
| 140µm fibers | 1, 2, 3 | −2◦ to 17◦ | cruise | N/A |
| 140µm fibers | 1, 2, 3 | −2◦ to 17◦ | stall | N/A |
| 140µm fibers | 1, 2 | −2◦ to 17◦ | cruise | N/A |
| 140µm fibers | 1, 2 | −2◦ to 17◦ | stall | N/A |
| 70µm fibers | 1, 2, 3 | −2◦ to 17◦ | cruise | N/A |
| 70µm fibers | 1, 2, 3 | −2◦ to 17◦ | stall | N/A |
| no fibers | N/A | 2◦ | cruise | −18.7◦ to 24.7◦ |
| no fibers | N/A | 7◦ | cruise | −18.7◦ to 24.7◦ |
| no fibers | N/A | 12◦ | cruise | −18.7◦ to 24.7◦ |
| 140µm fibers | 1, 2, 3 | 2◦ | cruise | −18.7◦ to 24.7◦ |
| 140µm fibers | 1, 2, 3 | 7◦ | cruise | −18.7◦ to 24.7◦ |
| 140µm fibers | 1, 2, 3 | 12◦ | cruise | −18.7◦ to 24.7◦ |
| 140µm fibers | 1, 2 | 2◦ | cruise | −18.7◦ to 24.7◦ |
| 140µm fibers | 1, 2 | 7◦ | cruise | −18.7◦ to 24.7◦ |
| 140µm fibers | 1, 2 | 12◦ | cruise | −18.7◦ to 24.7◦ |
| Surface | Region | Mean AoA [deg] | Airspeed, U∞ | k | A [deg] |
| no fibers | N/A | 0.0, 5.0, 10.0 | cruise, stall | 0.022, 0.039 | 5.0 |
| no fibers | N/A | 0.0, 5.0, 10.0 | cruise, stall | 0.011, 0.020 | 5.0 |
| no fibers | N/A | 0.0, 5.0, 10.0 | cruise, stall | 0.022, 0.039 | 10.0 |
| no fibers | N/A | 0.0, 5.0, 10.0 | cruise, stall | 0.011, 0.020 | 10.0 |
| 70µm fibers | 1, 2, 3 | 0.0, 5.0, 10.0 | cruise, stall | 0.022, 0.039 | 5.0 |
| 70µm fibers | 1, 2, 3 | 0.0, 5.0, 10.0 | cruise, stall | 0.011, 0.020 | 5.0 |
| 70µm fibers | 1, 2, 3 | 0.0, 5.0, 10.0 | cruise, stall | 0.022, 0.039 | 10.0 |
| 70µm fibers | 1, 2, 3 | 0.0, 5.0, 10.0 | cruise, stall | 0.011, 0.020 | 10.0 |
| 70µm fibers | 1, 2 | 0.0, 5.0, 10.0 | cruise, stall | 0.022, 0.039 | 5.0 |
| 70µm fibers | 1, 2 | 0.0, 5.0, 10.0 | cruise, stall | 0.011, 0.020 | 5.0 |
| 70µm fibers | 1, 2 | 0.0, 5.0, 10.0 | cruise, stall | 0.022, 0.039 | 10.0 |
| 70µm fibers | 1, 2 | 0.0, 5.0, 10.0 | cruise, stall | 0.011, 0.020 | 10.0 |
Disclaimer/Publisher’s Note: The statements, opinions and data contained in all publications are solely those of the individual author(s) and contributor(s) and not of MDPI and/or the editor(s). MDPI and/or the editor(s) disclaim responsibility for any injury to people or property resulting from any ideas, methods, instructions or products referred to in the content. |
© 2024 by the authors. Licensee MDPI, Basel, Switzerland. This article is an open access article distributed under the terms and conditions of the Creative Commons Attribution (CC BY) license (http://creativecommons.org/licenses/by/4.0/).


