

Submitted:
15 October 2024
Posted:
16 October 2024
You are already at the latest version
Abstract
Vector published map, as a result of pre-press printing of paper map digital publishing, is a page file in line with PostScript standards. With large amount of data and a large number of map page graphics objects, the browsing speed is slow and the hardware performance is very high, which seriously affects the breadth and depth of the application of vector published map. In response to this problem, this paper proposes a visualization method of large-size vector published map. This method adopts the idea of tiling. The vector published map is physically cropped into several PDF tiles to form a map logically. Data encoding and organization are based on the GeoSOT earth division grid to realize the rapid loading, scaling, display of map data and the correlation retrieval of map product "map and spatial data integration". The experiment shows that the response time of map data loading and browsing is much less than that of professional software, and the method is insensitive to data volume and has low requirement on hardware performance. This method can not only make up the disadvantages of image tiles in the existing network map service, but also make the vector published map can be used in embedded devices, mobile terminals, network modes and other cross-media applications.
Keywords:
vector published map
; PDF map
; visualization
; digital publishing
; GeoSOT
; cross‐media
1. Introduction
The map serves as the fundamental medium for visualizing geographic information, an indispensable instrument enabling individuals to recognize, comprehend, and leverage their geographical surroundings [1,2,3]. As mapping endeavors progress, there is a discernible trend towards increased popularity, personalization, intelligence, and practicality [4,5,6]. With the use of geographic information democratization and its accessibility, mapping today must meet different specific needs. People’s need for map use is to have good visual effects, low thresholds for cartography, and non-professional features. Therefore, it is important to use the professional cartographic results directly and efficiently.
However, at present, countries have accumulated a large amount of cartographic data, whose main application is to print and publish paper maps. If these cartographic results are to be used in various information systems or electronically published and distributed over the network, the vector features of these maps will be lost and converted into raster data for sharing and reading. While this approach liberates the geographic information system from the intricacies of the cartographic process and eliminates the need for symbol libraries, it does so at the expense of converting vector data into raster format. The upshot is the forfeiture of the nuanced, clear, high-quality, and interactive characteristics inherent in vector map data.
Therefore, as a result, digital and network era, the vector digital mapping results other than printing extension application is of great significance, if as a man-machine interactive visualization of the data of all kinds of information system, or used to map a network share, it can not only obtain satisfy people reading requirements of map expression form and effect, and can improve the efficiency of the human-computer interaction, enhance data analysis results and the human spatial cognition and the consistency of decision conclusion.
We analyze the reasons why vector cartographic production cannot be used further in environments such as embedded devices, mobile terminals, and network modes. These productions are generally stored in EPS format, usually occupying a large storage space. For example: a small-scale topographic map sub-version EPS file size is about 30 MB, the combined version EPS file size is more than 100 MB, and a full China thematic map combined version EPS file is more than 200 MB. There are usually two ways to display the vector cartographic production. One is to use mature commercial professional software, such as Adobe Illustrator to browse, and the other is to convert EPS format to PDF format, and use a PDF browser, such as Adobe Acrobat or Adobe Reader to display. Each of these methods has high hardware requirements, low efficiency for opening, roaming, and zooming of map data, and poor user experience. Therefore, due to the large number of graphic objects, large file and high requirements of computer hardware and software, the depth and breadth of application of vector cartographic production are limited. As is the case for common vector published map, it is difficult for the existing technologies and methods to effectively support large-size vector published map.
In view of the above problems, based on PDF map technology, this paper comprehensively uses the map’s fast display strategy, and proposes a visualization method suitable for large-size vector published map. This method not only can effectively compress the data storage space and reduce the memory footprint while reading, keep the vector characteristics of maps published results, effectively improve reading experience, and make the vector published map has the characteristics of “map and spatial data integration”, and support the map the location of the data retrieval and a variety of flexible ways of organization. More importantly, the multi-platform characteristics of this method enable it to display large-size vector published map with high fidelity in the hardware and software environments such as ordinary computers, embedded devices, mobile terminals, network mode, etc., which provides the foundation and guarantee for cross-media application and deep processing of vector published map.
2. Related Works
2.1. Vector PDF Map
PDF (portable document format) is a kind of Adobe development design document format, containing the displayed on the screen, printer, phototypesetter or computer to plate directly output all the required data, completely independent of its original application and computer platform to create, is a kind of ideal of electronic document transmission and digital information transmission document format. Therefore, maps naturally want to use the PDF file format for publishing and transmission.
In 2004, Layton Graphics, Inc. (LGI, a company in the United States, http://laytongraphics.com/) proposed a GeoPDF file that uses PDF files to store maps and geographic information. Thereafter, it founded a subsidiary called TerraGo Technologies (a company in the United States founded in 2005, https://terragotech.com/), which specialized in GeoPDF research. GeoPDF is based on the existing PDF standard, expands many functions, and provides free tools for application terminals. Currently, mainstream GIS software supports the production of GeoPDF maps, including ArcGIS v10.x, FME2013, Intergraph GeoMedia, Erdas, MapInfo, GDAL, etc. With the continuous development and expansion of the GeoPDF standard, the OGC (Open Geospatial Consortium, https://www.ogc.org/) organization has adopted GeoPDF as the recommended PDF map coding standard [7,8], and Adobe is also designing PDF2.0 (ISO 32000-2, 2017) for managing geographic information based on the GeoPDF encoding standard [9].
According to the organization of the data, PDF maps can be divided into vector PDF maps and raster PDF maps. The former organizes PDF files in the form of vector graphic objects, while the latter organizes PDF files in raster. PDF maps we usually see, such as PDF maps that can be downloaded on many map service websites (such as https://www.onestopmap.com/, https://digital-vector-maps.com/) are raster-based. In order to adapt to the research problems in this paper, we need vector PDF map technology to support it.
The team of the author of this paper is the first research team in China to study the fusion of PDF documents with maps and geographic information. It has carried out a series of related researches on the expression of maps and geographic information in PDF documents [10,11,12], and finally based on the PDF format standard and GeoSpatialPDF standard specification, developed our own “Vector PDF Map” product [13,14]. The product defines its data model and generation method and studies the model of vector PDF tiles. The vector PDF map uses PDF standard data format, integrates the map’s spatial information, attribute information, symbol graphic information, and has functions such as map layering, browsing, attribute query, direction calculation, length and area measurement, and information annotation, etc., which can output paper map directly on the printer.
To sum up, the PDF map has the following characteristics:
(1) Product independence: PDF maps are completely separated from GIS software, and can be read by any PDF reader (such as Adobe Acrobat, Adobe Reader, Foxit Reader, etc.). Layered, geo-referenced maps and images have no special requirements for systems using PDF maps.
(2) Data integrity: PDF maps do not need to be associated with additional files, such as map symbol libraries. They embed geometric data, attribute data, and map symbol data within graphic data (including images, text, etc.), forming an integrated and complete dataset.
(3) Cross-Platform and Cross-Terminal applications: Converted PDF map products are 80% smaller than the original vector-published maps (EPS format), ensuring compatibility across various application and system platforms. PDF maps, under color management, maintain consistent display effects across different terminals.
(4) Industry applicability: PDF maps are directly oriented to applications. Ordinary users do not need professional knowledge in cartography or complex system training. Not only can they be used in the GIS industry, but non-professional users can also quickly apply them.
It can be seen that using PDF map as the carrier of vector published map has many advantages. From the current research status at home and abroad, although we have made a meaningful exploration in the field of PDF maps, we have achieved some achievements, mainly solving the problem of storing geographic information data in PDF file format, such as most GIS software both can generate map files that meet the GeoPDF standard, but the problems of displaying, browsing, and processing large-size PDF maps still exist. The existence of this problem is not difficult to understand, because PDF is a document format, Adobe company has continuously extended the PDF standard to enable it to store geographic information data. However, due to the inherent characteristics of map data, such as large data volume, complex data structure and graphic relationships, it is difficult for existing PDF browsers to display maps with large data volume. For example, when using commercial professional software Adobe Acrobat or Adobe Reader to browse vector published map, not only the hardware requirements are extremely high, but the operations of opening, roaming, and zooming are all inefficient. Generally, it takes about 70 seconds to open a single-page PDF map file with a file size of 100 MB. As the file size increases, the time required to open a PDF map file doubles. This poor response speed and long waiting time seriously affect the user experience. When the total number of graphic objects in the map page is more than 350,000, it is difficult for conventional PDF browsers to open and browse such PDF map files. Therefore, this paper studies the display technology of large-page vector published map, which is a technical problem urgently waiting for a breakthrough in the newly developed PDF mapping field, and it is also a supporting technology to discover and apply other capabilities (such as electronic map, network map, etc.) of vector published map in addition to paper map publishing.
2.2. Basic Techniques for Improving Map Display Speed
In order to improve the speed of map display, it is necessary to quickly retrieve and dispatch the vector data involved in the current display range from external storage when the map is displayed, so as to reduce the redundant data that need to be displayed and operated. Spatial index is important in spatial databases for efficient execution of queries involving spatial constraints and objects. The use of spatial index is undoubtedly an important method to improve the speed of map display. Shankar depicted GeoCloud and SpatialHadoop, both of which are developed for spatial information, indexing, and query processing [15]. Roumelis studied xBR+-tree and compare the performance of the xBR+-tree with respect to the R*-tree and the R+-tree for tree building and processing the most studied spatial queries [16].
GPU has powerful multi-core parallel computing capabilities. The fast-developing general-purpose computing GPU technology and CUDA programming framework provide a new way to improve the performance of spatial index technology and visualization technology. Schneider presented a novel GPU-based data structure for spatial indexing [17]. Zhang proposed a novel yet practical framework on developing a GPU-accelerated Web-GIS environment to support Query-Driven Visual Explorations (QDVE) on Big Spatial Data [18]. Mi focused on visual exploration of large graphs and multidimensional datasets based on the GPU technology [19]. Carabaño uses GPU acceleration to address the issues of data escalation and parallel transition [20].
Map tiling has been proved as the most effective way of delivering spatial data over the recent decade. Google Maps based on raster tiles is a popular tool that tells you where you’re going and how to get there. Mehta gives a perspective about how Google Maps works [21]. Branson present a fully automated tree detection and species recognition pipeline using Google MapsTM [22]. Taher gives an approach to combine map locations with their environmental sounds using Google Maps [23]. Zhu presents a general visualization framework in the web-based virtual globe environment [24].
The in-memory caching technique caches the map data that needs to be displayed into memory without having to access the database on every request. Since the speed of returning data from memory is always faster than the newly provided data, the display speed can be greatly improved. Wan proposes a flexible storage framework for tiled map data parallel clipping and retrieval operations [25]. Guo proposes a neighborhood prefetching cache strategy [26]. Gu uses map caching technology to reduce the average delay of HD map delivery [27].
Multi-threaded collaborative work is a method to improve system efficiency by improving resource use efficiency. Running multiple threads at the same time in a single program to accomplish different tasks is called multithreading. In the double-buffering mechanism of the map display, the processing of the front-end and back-end caches is handled by the foreground thread and the background thread respectively. Osterman proposes a rapid and flexible parallel approach for large datasets [28]. Qin presents a strategy for raster-based geocomputation under different parallel computing platforms [29]. Mckenny introduces a parallelization technique which is suitable to multi-core computers [30]. Rajput implements a generic 3D fusion framework to utilize a multi-threaded CPU architecture [31].
Based on the above-mentioned technology, this paper made adaptive improvements and integrations for PDF maps, and established a fast display method for large-page vector published maps.
3. Methodology
3.1. Map Page Adaptive Grid Division
A map page is a PDF page that uses graphic objects to express all map content such as elements inside and outside the map. Considering that different maps have different map page sizes, different vector PDF map file sizes and number of graphic objects in the map page and other factors, the division of the map page cannot be carried out by using fixed rows, columns or simply based on distance. This paper adopts adaptive grid division of map pages based on PDF map file size. The goal is to finally obtain a series of PDF tiles with file sizes within a specified threshold range, thereby providing a data source for fast and efficient display of maps. Taking the bottom left corner of the rectangle of the map page as the origin, the bottom edge of the map page as the X-axis, and the left side of the map page as the Y-axis, a flat rectangular coordinate system is established. The map page with width W and height H is divided into I row and J column, so as to get the cell grid with width dx and height dy.
The grid starts from the lower left corner, with rows horizontally and columns vertically, and is numbered incrementally to the upper right. For example, the grid number (i,j) indicates that the grid is located in the i-th row and the j-th column, where:0< i ≤ I, 0< j ≤ J. Schematic diagram of adaptive grid division on the map page is shown in Figure 1.
The specific calculation method of meshing is as follows:
(1) Roughly calculate the grid side length S based on the PDF map file size, as shown in the following equation:
where:
1) N denotes the PDF file size of the PDF map in megabytes (MB),
2) M signifies the anticipated PDF file size of the resultant PDF tiles after meshing and cropping in MB,
3) W denotes the map page width,
4) H indicates the map page height.
Setting the parameter M to 0.3, corresponding to approximately 300KB, ensures optimal graphic display efficiency.
(2) The number of rows I and columns J equally divided on the map page are calculated by the equation:
Here, ⌊ ⌋ it means that the floating-point value of the inner surface is rounded down.
(3) Calculate the width dx and height dy of the element grid, as shown in the following equation:
3.2. Map Page Graphic Object Cropping
According to the width and height parameters of the unit grid obtained by the grid division calculation, the rectangular coordinates of each unit grid are calculated and used as a crop rectangle to crop the graphic objects in the map page. There are five types of graphic objects supported in the PDF format: text objects (Text), path objects (Path), embedded image objects (Images), shading objects (Shading), and external objects (XObject). Generally, the graphic objects in a vector PDF map page are mainly composed of path objects, and the path object consists of several straight line segments or three cubic Bezier curves or some combination thereof. Limited to the length of the article, this paper focuses on the clipping method of path objects composed of several straight line segments.
For the cell grid with grid number (i, j), the point coordinate in the lower left corner of the grid rectangle Rij is , and the point coordinate in the upper right corner is . This grid rectangle Rij is used as the crop rectangle to crop all graphic objects in the map page to generate a PDF tile file. The PDF tile file named Cell_i_j.pdf corresponds to the cell grid (i, j). The specific process of generating the PDF tile file is as follows:
(1) Create a new PDF document that contains only one PDF page, name the PDF page as a tile page, and respectively set the tile page width and height to dx and dy.
(2) Iterate through all graphic objects in the map page, as shown in Figure 2, using the crop rectangle Rij to perform the following crop processing:
1) If the circumscribed rectangle of the graphic object is outside the cropped rectangle Rij, as shown in (a) of Figure 2, no processing is performed.
2) If the circumscribed rectangle of the graphic object is located inside the cropped rectangle Rij, as shown in (b) of Figure 2, copy the graphic object and use it as a new graphic object to perform coordinate translation transformation on the new graphic object, that is, translate its coordinate origin to the cropped rectangle Rij in the lower left corner point of the page, add a new graphic object to the tile page.
3) If the circumscribed rectangle of the graphic object intersects with the cropped rectangle Rij , as shown in (c) of Figure 2, the specific cropping method is as follows:
As shown in Figure 3, the graphic object is a polyline or a polygon, and the path consists of only a few straight line segments. Generally, the path can be clipped using classic algorithms, such as the Cyus-Beck line clipping algorithm Liang-Bar-sky line clipping algorithm, Nicholl-Lee-Nicholl line clipping algorithm, Weiler-Atherton polygon clipping algorithm and Sutherland-Hodgeman polygon clipping algorithm, etc. [32,33,34,35,36].
In Figure 3 (a), the path is a polyline. Starting from the starting point A, the path polyline is obtained along the direction of the path polyline and the entry point into the cropped rectangular area is 1. The exit point from the cropped rectangular area is 2, structure after cutting paths, set into the dot operator to “m”, set the dot operator to “l”, keep the point and its adjacent points out in the middle of the part. If the starting point in cutting inside the rectangular area, the starting point as the first point. If the end point is inside the cropped rectangular area, use the end point as the last out point to get the cropped path “1-B-C-2”.
The path in Figure 3 (b) is a polygon. Starting from the starting point A, find the entry point 1 of the polygonal edge into the cropped rectangular area and the exit point 2 from the cropped rectangular area along the direction of the path fold line. If the starting point is inside the clipping rectangular region, it will be taken as the first entry point. With the first entry point as the starting point, one entry point and one exit point constitute one group along the direction of the broken line and the nodes in the middle are reserved. Thus, the polygon is constructed as “1-B-C-2-1”.
Move the cropped path coordinate origin to the lower left corner point of the cropped rectangle Rij to get the cropped path. Create a new graphic object based on the cropped path coordinates. At the same time, copy the parameter values such as line width, color, and fill of the cropped graphic object, and add a new graphic object to the tile page.
(3) Update the tile page and store the PDF document containing the tile page as a PDF tile file Cell_i_j.pdf.
3.3. Map Data Organization and Storage
After a single vector published map is meshed and physically cropped, hundreds of PDF tile files can be obtained, and a large amount of map data can be used to obtain huge data PDF tiles. For example: After the global 1:50 thousand topographic map vector published map grid is divided and physically cropped, the number of PDF tile files obtained can reach 269 million. Based on the average size of 200KB of each PDF tile file, the total size of PDF tile files is about 51.2TB. Such a huge number of files and data, if stored separately for each PDF tile file, it will inevitably bring problems such as low map retrieval efficiency and slow file transfer speed, which will greatly affect the map service capabilities. How to reasonably organize and store such a huge PDF tile file and quickly and efficiently display and data migration is an issue that must be considered. This paper proposes a set of methods for organizing and storing vector published map data based on the Geographical coordinate global Subdivision grid with One-dimension-integer on Two to n-th power (referred to as GeoSOT) [37]. This method proposes the original map projection, based on the spatial extent of the map frame and the coordinates of the center point of the unit grid corresponding to the PDF tile file. The double mapping relationship between the grids is shown in Figure 4. In the map data storage process, a single map is given a segmented grid aggregation code, a PDF tile is given a positioning grid code, and a map code data table and a thumb map field are added to the map tile data table. The PDF tiles data table adds segmentation coding and browse map fields to achieve the purpose of efficient indexing and fast display of map data.
This strategy facilitates efficient indexing and rapid display of map data.
(1) Map data external overall location coding
For single map data, first determine which grid or grids the map ranges fall into. These grids are called the GeoSOT location reference positioning grid outside the map data to identify the location of the map and space range. The location code is GeoSOT location reference location grid code, and the location vector is taken as a corner grid of GeoSOT location grid as the location vector, and the grid span along the latitude direction and the grid span along the longitude direction as the scale vector. For example, in the location coding, is the corner positioning grid coding, M is the grid span in the latitudinal direction, N is the grid span in the longitudinal direction, and M and N range from {1,2,3, ..., n}. When M = 1 and N = 1, and then.
The overall location coding process of the map data is shown in Figure 5, which is as follows: First, select a sectional layer with a similar spatial scale according to the minimum outer rectangle of the map frame, and then coordinate the four corner points of the smallest outer rectangle of the map frame. They are converted into the grid codes of the section and hierarchy respectively, and their location reference positioning grids are determined by determining whether they are the same.
(2) PDF tile positioning coding inside map data
For a single map, the geographical coverage of a single PDF tile file data within the map is approximately equal and consistent with the average coverage of the cell grid. Calculate the average coverage of the cell grid according to the meshing parameters in Section 3.2, select a section level with a similar spatial scale according to the coverage, and then convert the coordinates of the center point of the cell grid corresponding to the PDF tile file to this hierarchical grid coding is used as the PDF tile positioning coding inside the map data.
(3) Map data overall thumb map and PDF tile browsing map
The thumb map is a schematic diagram of the entire map data, drawn directly from the map page of vector published maps at a scale of less than 1 (e.g., 0.2). The map thumb is associated with the overall location code outside the map data. The PDF tile browsing map is an image drawn at 100% of the PDF tile pages inside the map. All PDF tile browsing maps can be stitched together and viewed as an overall image of map data. The PDF tile browsing map is associated with the PDF tile positioning code inside the map data.
(4) Logical storage of map data
The map data adopts a three-layer storage mode, including the location association layer, map product layer, and tile data layer, as depicted in Figure 6.
The location association layer mainly includes fields such as RID, grid code, and product ID. Among them: RID is the unique ID of the association ID, grid code is the GeoSOT grid code included in the overall external location code of the map data, and product ID is the unique number of the vector published map product. The map product layer mainly includes product ID, map name, scale, page width, page height, number of rows, number of columns, thumb map, location code and other fields. Among them: the product ID is the unique number of the vector published map product, the map name is the vector published map product name, the scale is the vector published map scale, the page width is the map page width W, the page height is the map page height H, and the number of rows is the number of grid division rows on the map page, and the number of columns is the number of grid division columns on the map page, the thumb map is binary data of the entire thumb data of the map data, and the location code is the overall location code of the external map data. The tile data layer mainly includes fields such as tile ID, product ID, number of rows, number of columns, browse map, data stream, and positioning code. Among them: the tile ID is the unique number of the PDF tile, and the product ID is the unique number of the vector published map product, the row number is the row number of the PDF tile when the map page grid is divided, the column number is the column number of the PDF tile when the map page grid is divided, the browse map is the PDF tile browse map binary data, and the data flow is PDF tile file binary data, positioning coding is PDF tile positioning coding.
3.4. Map Data Query and Retrieval
Map data query and retrieval methods mainly include searching for map products based on product related information and based on area. Retrieve the map product according to the product related information. Directly query the map product layer data table, and return the matching map product ID and all its map data. Retrieving map products based on area is a retrieval method for quickly extracting area map data based on the GeoSOT mesh. The details are as follows:
According to the minimum outermost latitude and longitude rectangle of the input query area range, select a section level with a similar spatial scale, and transform the query area into a grid code. The grid code uses quaternary one-dimensional coding and starts with “G”. The retrieval operation only needs to retrieve the grid code in the data table of the map data location association layer and compare it with the code items in the table, so as to search the grid code of the parent grid, child grid and grandson grid corresponding to the input grid code, as follows:
From left to right, if each bit of the encoding is the same, if one of the bits is different, the item is discarded and the next encoding item is matched. If the same number of bits in the code have matched the last bit of either, then the code entry is recorded. According to the matching result, it can be divided into the following two processing methods:
(1) When the grid code in the data table is longer than the grid code of the query area, the data information of the coded item is matched to extract the map data associated with the product ID. The map data includes all the PDF tiles divided by the map page.
(2) When the grid code in the data table is equal to or shorter than the grid code of the query area, continue to query all tile positioning codes corresponding to the product ID in the tile data layer data table. If the codes match, extract all matching PDF tiles, that is, the local extent of the map matches the input query area.
3.5. Map Data Display Initialization
Two common trigger conditions for map data display are direct display of a single map according to the product ID and display of the map according to a specified area. The main purpose of the map display initialization is to establish the mapping relationship between the screen display window, the map page and the PDF tile. The map display initialization is slightly different for different trigger conditions.
(1) Initialization of full map display of a single map
In the map product layer data table, parameters such as page width, page height, number of rows, number of columns, and thumb map are obtained based on the product ID to initialize the full map display. The process is outlined in Figure 7 as follows:
1) Fill the map page’s rectangle within the screen display window’s rectangle and make the centers of the two rectangles coincide, thereby establishing the transformation relationship between the PDF user coordinate system (X, Y) and the screen coordinate system.
2) Calculate the pixel width and height of the corresponding page display rectangle of the map page rectangle in the screen coordinate system.
3) Compare the size of the thumb map and the rectangle displayed on the page:
① If the thumb map is larger than the rectangle displayed on the page, directly zoom the thumb map to the position of the page display rectangle on the screen.
② If the thumb map is smaller, retrieve the PDF tile browsing map of all PDF tiles from the tile data layer data table based on the product ID. Stitch a large page view according to the position of the tiles in the grid division and zoom the page view to the position of the page display rectangle on the screen.
(2) Initialize the display of the specified area range
Use the map data query and retrieval method to obtain map data in the specified area. If multiple product IDs are included in the results, display one of the maps based on interactive selection, and display the PDF tile data in the specified area within the screen display window, as shown in Figure 8, as follows:
1) Extract the smallest outer rectangle of the PDF tiles in the search results, fill the smallest outer rectangle with the screen display window rectangle, and make the centers of the two rectangles coincide, thereby establishing the PDF user coordinate system (X, Y) and screen coordinate system transformation relationship.
2) Recalculate the grid in the screen display window and obtain its PDF tile data.
3) For all PDF tiles in the screen display window, in the screen coordinate system, calculate the pixel coordinates of the grid rectangle where the PDF tiles are located as the display grid, and make the following judgments with the PDF tile view:
① If the display grid is smaller than the PDF tile view, directly zoom the PDF tile view to the position of the display grid.
② If the display grid is larger, use the PDF rendering engine to draw the PDF tiles into a display grid size and display the image at the grid’s position.
3.6. Map Data Display Control
After initializing the map data display, the user can implement panning, zooming in and out of the map through display control operations. The data sources for map display mainly include thumb map, browse map, and PDF tile. Among them: thumb map is used for the overall display of a single map, that is, to provide a preview of the map outline; the browse map is limited by resolution, and is used for ordinary map browsing; PDF tiles have vector characteristics and are used for detailed map display. The purpose of map data display control is to formulate a set of strategies for rapid dispatch and efficient display of map data. Simultaneously, the establishment of PDF document object cache and grid image cache aims to enhance map display precision and reduce response times for an improved user experience.
(1) Map pan and zoom operations
Map panning is essentially achieved by adjusting the rectangle position of the screen display window, and map zooming is essentially achieved by adjusting the rectangle size of the screen display window. During map panning, the data source used for screen display remains unchanged. During the map zooming process, the real-time calculation of the size of the unit grid occupying the screen display window is called the display grid, and the image occupied by the unit grid in the thumb map is called the thumb grid. By judging the display grid, thumb grid, and PDF tile browsing map, dynamically call the thumb map, browsing map, or PDF tile as the display data source, specifically:
1) If the display grid is not larger than the thumb grid, call the thumb map.
2) If the display grid is not larger than the PDF tile view, and is larger than the thumb grid, call the PDF tile view.
3) If the display grid is larger than the PDF tile view, call the PDF tile.
(2) Create PDF document object cache
In the map display process, when using PDF tiles as the display data source, in order to shorten the screen display response time and improve the user experience, a PDF document object cache needs to be established, as shown in Figure 9. The specific process is as follows:
1) Creating a reference rectangle centered on the screen display window, forming a nine-square grid.
2) Calculate and obtain the element grid that falls into the nine-square grid by taking the smallest outer rectangle of the nine-grid as a reference.
3) Based on the distance between the unit grid in the nine-square grid and the center of the nine-square grid as a reference, sort the unit grid in the nine-square grid in order of the distance from small to large.
4) Determine whether the PDF document object corresponding to the cell grid exists in the PDF document object cache one by one in order. If it does not exist, extract the PDF tile data stream from the tile data layer data table and parse it into a PDF document object, and stored in the PDF document object cache
(3) Create a PDF tile image cache
After the PDF document object cache is established, the PDF rendering engine needs to be used to draw the pages in the PDF document object into an image, that is, a PDF tile image, which can be quickly displayed on the screen window using this image. As the drawing of PDF tile images takes a certain amount of time, it will directly affect the speed of map display. Therefore, this paper will cache the already drawn PDF tile images and identify them with a grid number, so that they can be called directly when needed next time. Similarly, due to memory constraints, thresholds need to be set when creating a PDF tile image cache. When the number of PDF tile image buffers exceeds the threshold, some PDF tile images need to be released. The cache release is based on the principle that the unit grid where the PDF tile image is located is farther away from the center of the nine-square grid. In addition, when the zoom operation is performed, the PDF tile image cache needs to be completely cleared. According to actual experience, the PDF tile image cache threshold is at least two times the PDF document object cache threshold.
(4) Map display based on double buffer
Using the PDF document object cache and PDF tile image cache, vector published maps can be quickly displayed on the screen. The specific process is as follows:
1) Create a memory display area compatible with the screen display device.
2) Calculate the pixel width and height of the rectangle of the unit grid in the screen coordinate system of the screen display window one by one, and create a blank bitmap.
3) Retrieve the PDF tile image corresponding to the cell grid in the PDF tile image cache and copy it to the blank bitmap created in step 2 as a display bitmap.
4) Copy the display bitmap to the corresponding position of the cell grid in the memory display area.
5) Copy the memory display area to the screen display window in real time.
4. Experiments and Discussion
4.1. Experimental Environment
In order to verify the method of this paper, we have developed a vector published map data processing and display test system. Based on this, we have carried out a series of vector published map display tests, thereby verifying the effectiveness and efficiency of the proposed method. Vector published map data processing and display test system is mainly composed of vector published map data processing subsystem and vector published map data display subsystem, as shown in Figure 10.
The vector published map data processing subsystem is deployed on the Windows operating system, with Microsoft Visual Studio 2015 as the development tool, and designed and developed with Visual C ++ language. The vector published map data processing subsystem mainly includes four functional modules: grid division, PDF page cropping, GeoSOT coding, and data storage. Among them: the PDF page cropping function module is based on the secondary development of the open source project library PoDoFo library; the data storage function module SQLite database read and write is based on the open source project library SQLite sources.
The vector published map data display subsystem includes two versions deployed on the Windows operating system and the Android operating system, of which: the Windows version uses Microsoft Visual Studio 2015 as a development tool and is designed and developed using the Visual C ++ language; the Android version uses Android Studio 3.3 was developed for development tools. The vector published map data display subsystem mainly includes four functional modules: coordinate conversion, data cache scheduling, PDF page drawing and display control. Among them: the SQLite database read and write in the data cache scheduling function module is implemented based on the open source project library SQLite sources, and PDF page drawing function module is implemented based on the open source project library PDFium library.
The experimental data used in this paper are the combined version EPS data for printing large-format paper maps, which are mainly from the Chinese national surveying and mapping departments. These data include World Map, Asia Map, Asia Political Map, China Map, China Geographical Map, China Political Map, China Transportation Thematic Map, China Tourism Resources Distribution Map. Each map exceeds 200 MB in size, with the China Transportation Thematic Map being the largest, totaling 526 MB.
The purpose of the experiment is to verify the feasibility of the proposed method and to test the performance of various aspects in the process of displaying map data. The test environment is as follow:
1) Dell desktop: Intel Core i7 octa-core processor, 16GB DDR4 memory, 1TB + 128GB hard disk, Windows 10 64-bit operating system;
2) Huawei Tablet M5: 4GB RAM, 128GB ROM, 2560 × 1600 resolution, EMUI 8.0 (based on Android 8.0) operating system.
4.2. Performance Evaluation from Prototype’s Perspective: Initial Map
Before employing the vector-published map data processing subsystem for data processing, it is imperative to utilize professional software such as Adobe Illustrator (e.g., CS6 version) to convert experimental data from EPS to PDF format. Following this preprocessing step, SQLite database files for map data display can be generated. The test data encompass the original EPS file, the converted PDF file, and the final SQLite file for the vector-published map. Each test data is sequentially numbered, and the file data statistics are depicted in Figure 11.
On a Windows 10 desktop computer, a series of tests are conducted for each map in the test data. First, use Adobe Illustrator CS6 to open the EPS file and PDF file, and test it 10 times each time until the map is loaded to obtain the average time required to open it. Then, use Adobe Acrobat X to open the PDF file and test it 10 times each time until the map is loaded to obtain the average time required to open it. Finally, use the Windows version of the vector published map data display subsystem to open the SQLite file. Until the map is loaded, get the average time required to open it. The time required to load the test data map is shown in Figure 12.
(1) In terms of file data size:
1) For the same map sheet, the data source EPS file is significantly larger than the converted PDF file and the generated SQLite file, and the SQLite file is slightly larger than the PDF file.
2) For different map sheet, The size of the converted PDF file and the generated SQLite file is proportional to the size of the data source EPS file.
(2) The time it takes to load the map and display the image in its entirety:
1) Opening an EPS file using Adobe Illustrator CS6 consumes significantly more time than opening a PDF file. Additionally, opening a PDF file using Adobe Acrobat X requires slightly less time than using Adobe Illustrator CS6. Using the Windows version of vector published map data display subsystem to open the SQLite file takes far less time than the former.
2) For different sheet, the opening time of map data PDF files and EPS files is proportional to the amount of data, and the opening time of map data SQLite files almost maintained at about 2 seconds.
On the tablet of the Android operating system, because there is no professional software to support the display of large EPS files, the experiment is only carried out for PDF files and SQLite files. For each map in the test data, first open the PDF file with the Android version of Adobe Acrobat Reader, and test it 10 times each time until the map is loaded to obtain the average time required to open it. Then use the Android version of vector published map data display subsystem to open the SQLite file and test it 10 times each time until the map is loaded to obtain the average time required to open it. The time required to load the test data map is shown in Figure 13.
In Figure 13, we found that while PDF files can be opened with the android version of Adobe Acrobat Reader, the opening time of all images is more than 200 seconds, while the opening time of map data SQLite file with the android vector published map data display subsystem is about 3 seconds.
4.3. Performance from Prototype’s Perspective: Map Operation
Map operations, encompassing interactive zooming in, zooming out, and panning map, significantly influence user experience. In order to truly reflect the user experience of map data, we have performed map zoom-in, zoom-out, and pan operations on the desktop of Windows 10 operating system and the tablet of Android operating system. The response time of the map is calculated as follows:
On the desktop of Windows 10 operating system, We use Adobe Illustrator CS6, Adobe Acrobat X, and Windows vector published map data display subsystem to perform map zoom-in, zoom-out, and pan operations. Each operation was tested 50 times to obtain the average response time, as shown in Figure 14. In Figure 14, the response time for map operations in Adobe Illustrator CS6 is slightly greater than that of Adobe Acrobat X. The response time for map zooming is around 20 seconds, for map zooming is around 25 seconds, and for map panning is around 15 seconds. It is far beyond the psychological bearing range of users, and the user experience is extremely poor. The map operation response time of the vector published map data display subsystem of Windows version is obviously less than that of Adobe Illustrator CS6 and Adobe Acrobat X. The map zooming response time is about 2 seconds, and the map panning response time is less than 1 second. It’s cognitively satisfying and has a great user experience.
On the tablet of the Android operating system, use the Adobe Acrobat Reader for Android and the vector published map data display subsystem for Android to perform map zoom-in, zoom-out, and pan operations. Each operation is tested 50 times to obtain the average time, as shown in Figure 15. The map zoom-in response time for Adobe Acrobat Reader for android is around 20 seconds, and the map zoom-out response time is around 25 seconds. The map zooming response time for the android vector published map data display subsystem is around 3 seconds. In addition, the response time of map panning operation is also quite different. The android version of Adobe Acrobat Reader for each map panning needs to wait about 15 seconds, and the user experience is extremely poor. The android version of the vector published map data display subsystem is only about 1 second, and the user experience is better.
4.4. HIGH-FIDELITY Map Display Effect
The map display effect directly affects the user experience in the process of using the map. The high-fidelity reading experience is the same as the efficient map interactive operation. It is an important factor that must be considered in the design process of the electronic map system. With the developing of computer technology, map publishing has come into digital time from handcraft [38,39]. Commonly used electronic map publishing modes include WebGIS mode, Static map image mode, GeoPDF map publishing mode, and SVG map publishing mode [40]. WebGIS mode map display is poor, often with annotation or symbol capping phenomenon; static map picture mode is limited by the image resolution, and often appears jagged or distorted during the zoom-in process; GeoPDF map publishing mode has the characteristics of vector map, map zoom is still clear, but considering the loading of maps and the efficiency of map interaction, the amount of data in a single map should not be too large (such as less than 70MB); the SVG map publishing mode places high demands on the designer’s digital map design capabilities, which directly affects its map display effect.
The map data SQLite file in this paper is a direct conversion from print-oriented vector published map EPS files. The intermediate PDF file retains the same display effect as the EPS file. The thumb map in the SQLite file is an image extracted from the PDF file at a specific display scale, and the browse map is drawn by the PDF tile at a certain display scale. When the map display scale does not exceed the display scale when drawing the map, the effect of using the image for map display is equivalent to using a PDF file directly. The PDF tiles in the converted SQLite file are directly cropped from the PDF file, and have the same vector characteristics as the PDF file, and support the infinite zoom of the map. Taking the China map as an example, the display effect of each display ratio in the map display process using the vector published map data display subsystem is shown in Figure 16.
4.5. Map Data Association Retrieval and Display
Based on the GeoSOT coding technology, taking advantage of its tolerance with the existing data specifications of various departments, Various types of data resources are visually displayed in the corresponding grid according to their spatial division coding, in order to develop a more efficient data ball platform. The map data in this paper is based on map sheets and grid-divided PDF tiles, and is embedded with a spatial segmentation code, so that all vector published maps are seamlessly connected horizontally and vertically scaled. The coordinate conversion module of the vector published map display subsystem supports GeoSOT encoding calculations, and realizes the global comprehensive display, expression and management of vector published maps.
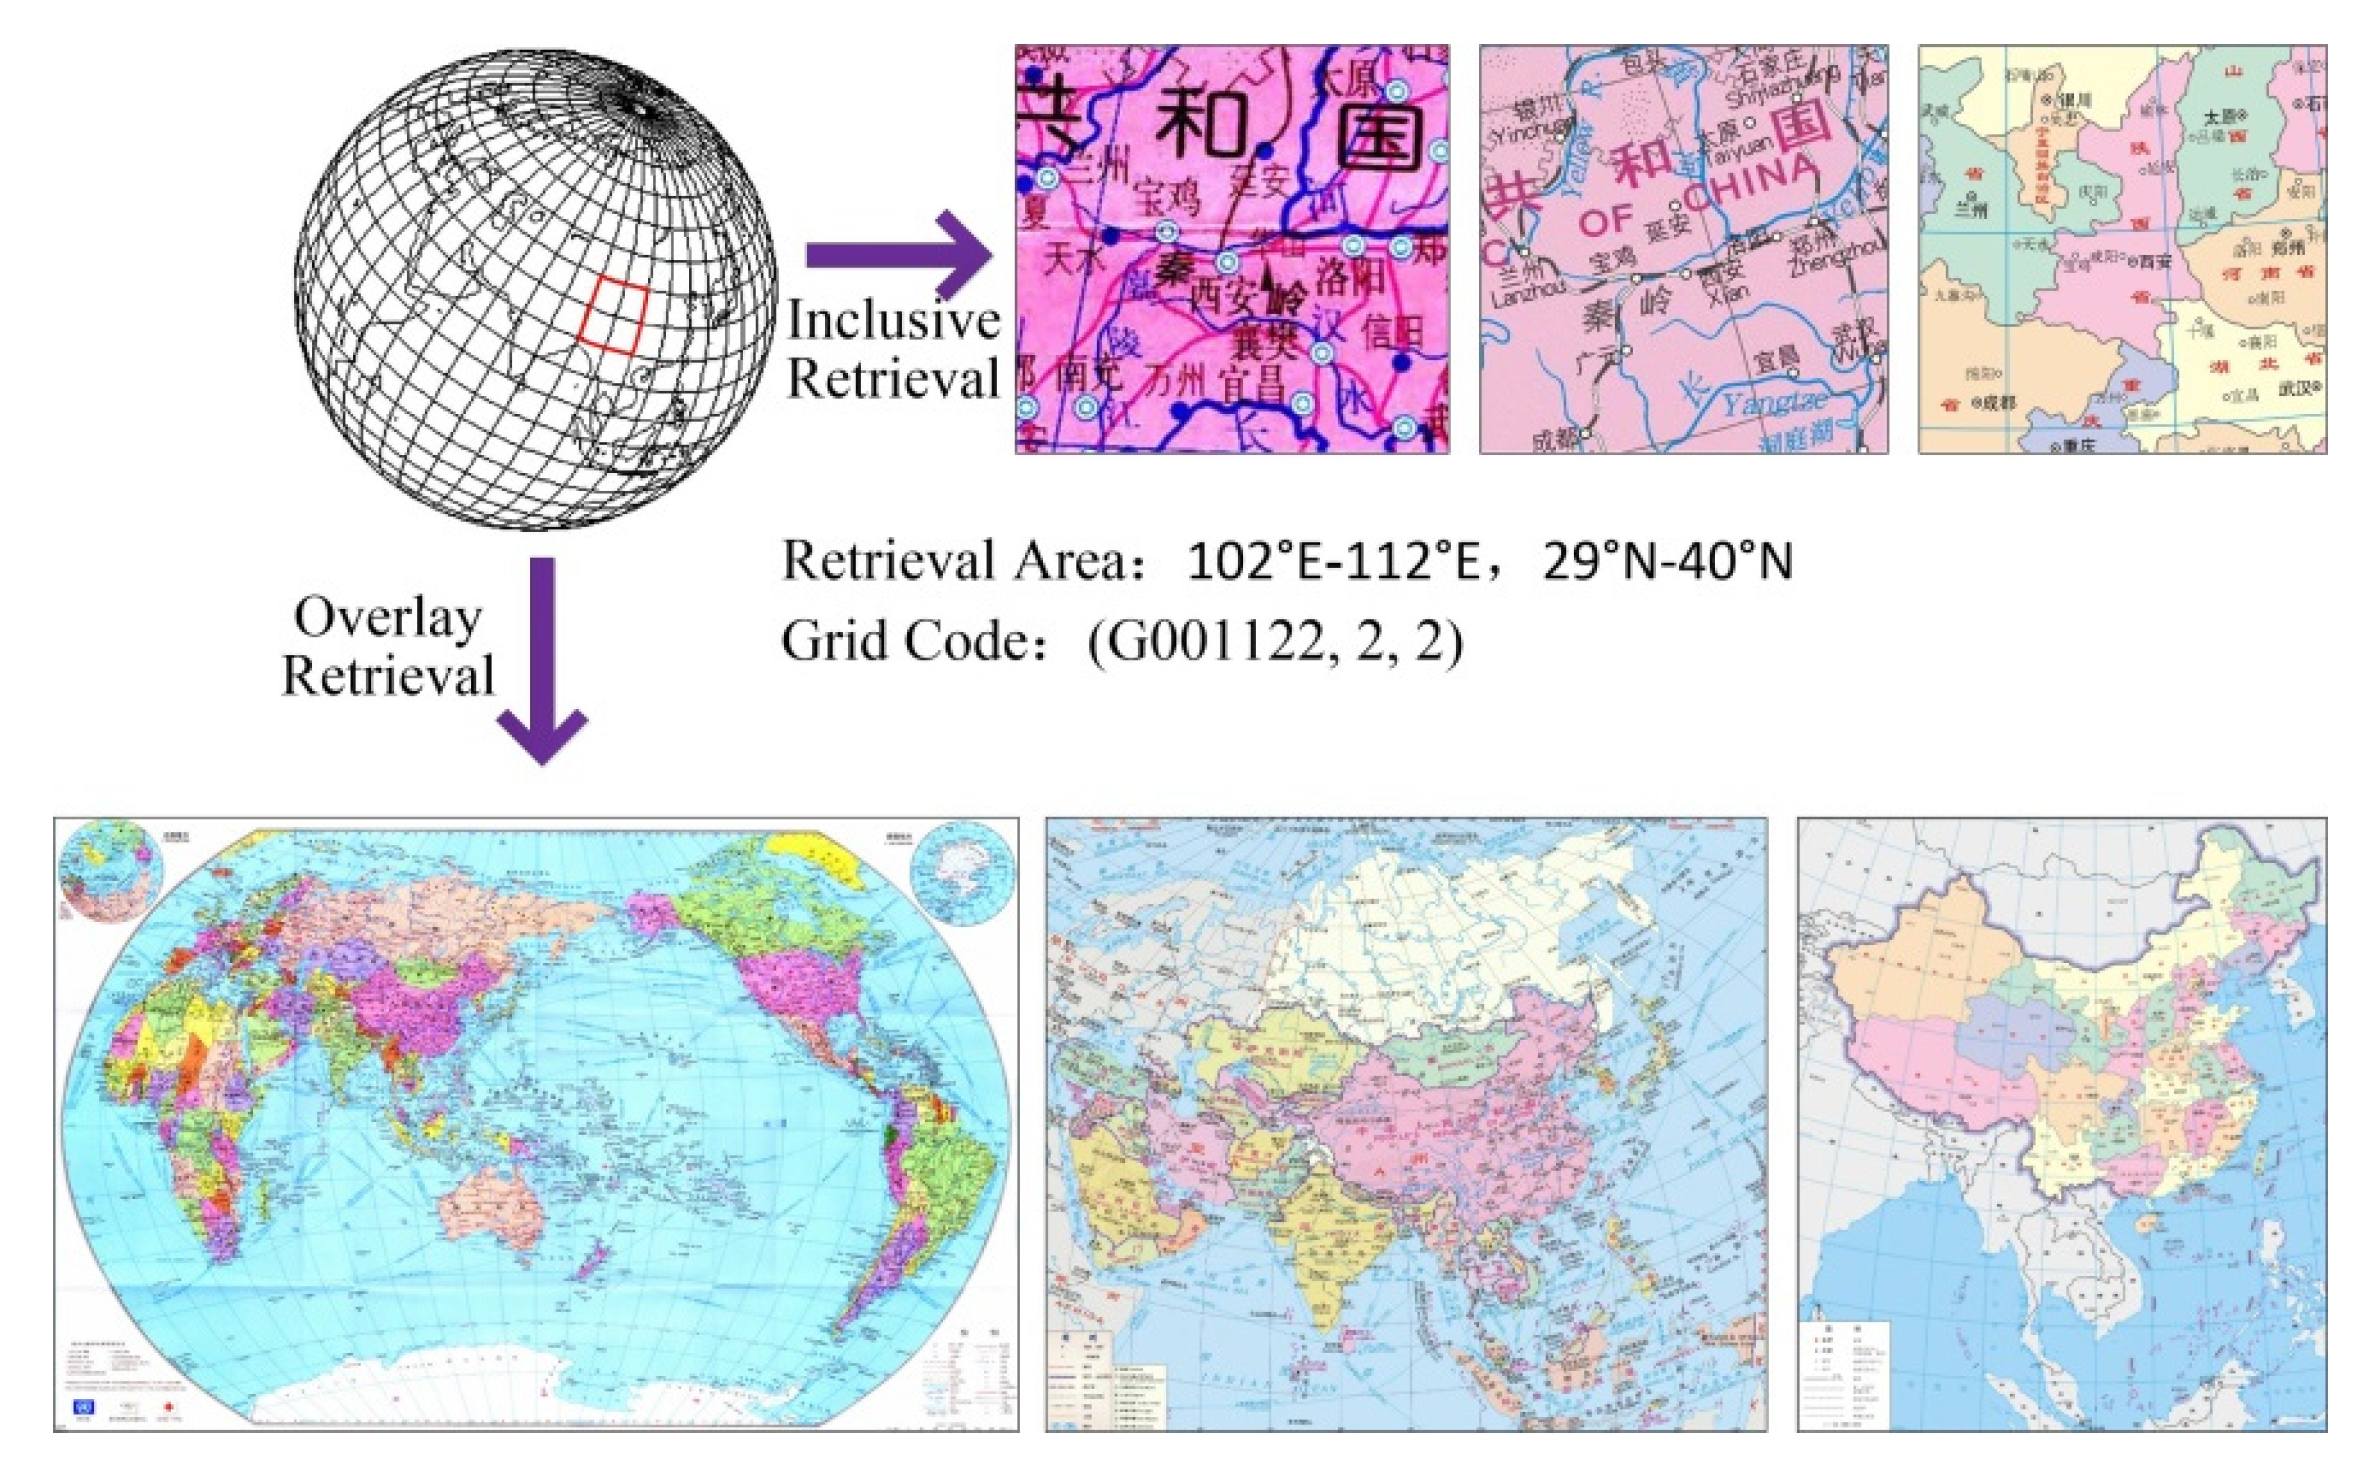
Spatial data association retrieval entails the comprehensive retrieval of all spatial data linked to the target area. The retrieved data and the target area may have the same region identification code, or be overlaying one another. The process of spatial data association retrieval is completely dependent on the GeoSOT code calculation. The latitude and longitude range inputted by user is directly converting to GeoSOT code. In this paper, the retrieval and display of multi-scale map data covering the target area and PDF tiles data contained in the target area are realized. These PDF tiles belong to different vector published maps, as is shown in Figure 17. In the Figure, the latitude and longitude ranges of the target area are 102° E to 112° E and 29° N to 40° N. The target area is identified as level 6, grid of 8°×8°, and region identification code (G001122, 2, 2). By using the method of inclusion retrieval, the PDF tiles contained in the target area are obtained, and the PDF tiles of the same sheet are spliced and displayed. By using the method of overlay retrieval, the vector published map covering the target area is obtained and displayed on the basis of the map sheet.
4.6. Discussion Summary
Following our comprehensive evaluation based on the test outcomes, the ensuing insights were discerned:
(1) This paper adopts the idea of tile, and the large page vector published map is physically cropped into a PDF tile, but logically it is still a map. After the PDF tile is automatically splicing, it has the same map printing ability as the original vector published map. More importantly, the response time of map data loading and browsing operation in this method is far less than that of professional software for map publishing, and the vector feature of published map data can be maintained to ensure the high-fidelity output of the map, which avoids the problem of decreased clarity of image data when zooming in. These features enable maps that were previously used only for paper publishing to serve a wider range of deeper application scenarios in the form of electronic publishing.
(2) This paper uses the GeoSOT earth segmentation grid to divide and process the map frame, so that each PDF tile has a clear grid code, which realizes the “map and spatial data integration” of the map product, that is, while meeting the demand of high-quality map reading, it can quickly retrieve and extract by location and region, which is not available in a single PDF map file. In addition, in this method, each PDF tile is controlled at the KB level, so that map data can be flexibly organized and managed in a variety of ways, such as single map storage, atlas packaged storage, map resource distributed storage, etc., to provide support for offline or online services of map data.
(3) Using the method in this paper, map data can be loaded and displayed efficiently and quickly respond to user map operation on the android tablet, which indicates that the method in this paper is also applicable to portable devices with limited performance, making it possible for vector published map products to spread across media.
5. Conclusions
The vector form of the published map, as a pre-printing result of digital map publishing, is a PostScript-compliant page file, usually in EPS format or PDF format. Professional software and high-performance computers are required for normal browsing and use. Large or even very large pages of vector published map, due to the large number of page graphics objects, and a large amount of file data, its use of hardware performance requirements are higher, ordinary personal computers, portable devices and networks are unable to use, leading to the problems of poor value-added services of vector published map. This paper proposes a fast and efficient display method of large-size vector published map, which adopts the idea of tiling. The vector published map is physically cropped into several PDF tiles to form a map logically. Data encoding and organization are based on the GeoSOT earth division grid to realize the rapid loading, scaling, display of map data and the correlation retrieval of map product “map and spatial data integration”. The experiments verify the superiority of the method in this paper. Compared with professional software, it has the characteristics of fast response speed, insensitivity to data volume, and low hardware performance requirements. Simultaneously, the method ensures high-fidelity map display, contributing to a positive user reading experience. This approach finds application in cross-media publishing of vector-published maps, encompassing electronic and network publishing. By substituting traditional multi-level image tiles or high-resolution image files with vector PDF tiles characterized by minimal data requirements and high fidelity, this method not only addresses the drawbacks of existing network map services but also affords users the same refined map reading experience as the exquisite paper maps. More importantly, this method makes the vector published map can be reused in network mode, embedded device, mobile terminal and so on, so as to improve the breadth and depth of electronic map and network map services.
The problems mentioned in this paper can be further studied in the aspect of map cross-media publishing, such as the model of map data storage for network publishing, the integrated cartography model of digital cartography and cross-media publishing.
Author Contributions
Conceptualization, N.M.; Methodology, N.M. and X.D.Z.; Software, X.D.Z; Validation, X.D.Z; Formal Analysis, N.M. and X.D.Z; Data Curation, N.M. and X.D.Z.; Writing-Original Draft Preparation, N.M. and X.D.Z.; Writing-Review & Editing, N.M.; Visualization, X.D.Z.; Supervision, N.M.; Project Administration, X.D.Z.; Funding Acquisition, N.M.
Acknowledgments
We would like to thank the editors and the anonymous reviewers for their valuable comments and Prof. Tinghua Ai for valuable inputs.
Conflicts of Interest
The authors declare no conflict of interest.
References
- Wang, J., Cheng Y., 2015. Discussions on Properties of Cartography and the Value of Map. Acta Geodaetica et Cartographica Sinica. 44, 237-241. [CrossRef]
- Gao, J., 2017. The 60 Anniversary and Prospect of Acta Geodaetica et Cartographica Sinica. Acta Geodaetica et Cartographica Sinica. 46, 1219-1225. [CrossRef]
- Guo, R., Ying, S., 2017. The Rejuvenation of Cartography in ICT Era. Acta Geodaetica et Cartographica Sinica. 46, 1274-1283. [CrossRef]
- Liao, K., 2017. Retrospect and Prospect of the Development of Chinese Cartography. Acta Geodaetica et Cartographica Sinica. 46(10), 1517-1525. [CrossRef]
- Meng, L., 2017. The Constancy and Volatility in Cartography. Acta Geodaetica et Cartographica Sinica. 46(10), 1637-1644. [CrossRef]
- Ning, J. Wang, Z., 2017. Progresses from Surveying and Mapping to Geomatics. Acta Geodaetica et Cartographica Sinica. 46(10), 1213-1218. [CrossRef]
- OGC 06-042, 2006. OpenGIS® Web Map Server Implementation Specification.
- OGC 08-139r3, 2011. PDF Georegistration Encoding Best Practice Version 2.2.
- ISO 32000-2:2017(en). Document management—Portable document format—Part 2: PDF 2.0.
- Deng, S., Liu, Z., Wang, X., 2001. A Method to Translate Digital Map to PDF File. Journal of Zhengzhou Institute of Surveying and Mapping. 2, 150-153.
- WEN J., SHI R., WANG Y., CHEN J., 2008. Realizing different GIS data’s unification and optimization using PDF structure. Science of Surveying and Mapping. 268-269.
- HU H., WEI B., YANG C., QI X., 2011. Method of Batch Outputing PDF Map Labeling. Journal of Geomatics Science and Technology. 28(5), 378-382.
- Zhou, X., Yang, C., Meng, N., 2016. A New Digital Map Product—PDF Map. Bulletin of Surveying and Mapping. 1, 108-110. [CrossRef]
- Zhou, X., Ai, T., Meng, N., 2019. A PDF Tile Model for Geographic Map Data. ISPRS International Journal Geo-Information. 8(9), 373-226. [CrossRef]
- Shankar, K., Sevugan, P., 2019. Spatial Data Indexing and Query Processing in GeoCloud. Journal of Testing and Evaluation. 47(6), 4039-4053. [CrossRef]
- Roumelis, G., Vassilakopoulos, M., Corral, A., & Manolopoulos, Y., 2017. Efficient query processing on large spatial databases: A performance study. Journal of Systems and Software. 132, 165-185. [CrossRef]
- Schneider, J., & Rautek, P., 2016. A versatile and efficient GPU data structure for spatial indexing. IEEE Transactions on Visualization and Computer Graphics. 23(1), 911-920. [CrossRef]
- Zhang, J., You, S., & Gruenwald, L., 2017. Towards GPU-accelerated Web-GIS for query-driven visual exploration. International Symposium on Web and Wireless Geographical Information Systems, Springer, Cham. 119-136.
- Mi, P., 2016. GPU Based Methods for Interactive Information Visualization of Big Data. Doctoral dissertation, Virginia Tech.
- Carabaño, J., Westerholm, J., & Sarjakoski, T., 2018. A compiler approach to map algebra: automatic parallelization, locality optimization, and GPU acceleration of raster spatial analysis. GeoInformatica. 22(2), 211-235. [CrossRef]
- Mehta, H., Kanani, P., & Lande, P., 2019. Google Maps. International Journal of Computer Applications (0975:8887). 178(8), 41-46. [CrossRef]
- Branson, S., Wegner, J. D., Hall, D., Lang, N., Schindler, K., & Perona, P., 2018. From Google Maps to a fine-grained catalog of street trees. ISPRS Journal of Photogrammetry and Remote Sensing. 135, 13-30. [CrossRef]
- Taher, H. A., 2018. Mapping Environmental Sounds Using Google Map (Acoustic Maps). In 2018 International Conference on Advanced Science and Engineering (ICOASE), IEEE. 431-436.
- Zhu, L., Chen, X., & Li, Z., 2019. Multiple-view geospatial comparison using web-based virtual globes. ISPRS Journal of Photogrammetry and Remote Sensing. 156, 235-246. [CrossRef]
- Wan, L., Huang, Z., & Peng, X., 2016. An effective NoSQL-based vector map tile management approach. Isprs International Journal of Geo-Information. 5(11), 215. [CrossRef]
- Guo, D., Zou, Y., & Wang, S., 2019. An Effective Tile Caching Mechanism of UAV Remote Sensing Map Based on Hilbert Coding Index. In 2019 IEEE 11th International Conference on Communication Software and Networks (ICCSN), IEEE. 535-541. [CrossRef]
- Gu, Y., Liu, J., & Zhao, L., 2019. Low-Latency Transmission and Caching of High Definition Map at a Crossroad. In International Conference on Communications and Networking in China, Springer, Cham. 264-277.
- Osterman, A., Benedičič, L., & Ritoša, P., 2014. An IO-efficient parallel implementation of an R2 viewshed algorithm for large terrain maps on a CUDA GPU. International Journal of Geographical Information Science. 28(11), 2304-2327. [CrossRef]
- Qin, C. Z., Zhan, L. J., Zhu, A. X., & Zhou, C. H., 2014. A strategy for raster-based geocomputation under different parallel computing platforms. International Journal of Geographical Information Science. 28(11), 2127-2144. [CrossRef]
- McKenney, M., Frye, R., Dellamano, M., Anderson, K., & Harris, J., 2017. Multi-core parallelism for plane sweep algorithms as a foundation for GIS operations. GeoInformatica. 21(1), 151-174. [CrossRef]
- Rajput, A., Funk, E., Börner, A., & Hellwich, O., 2018. A regularized volumetric fusion framework for large-scale 3D reconstruction. ISPRS Journal of Photogrammetry and Remote Sensing. 141, 124-136. [CrossRef]
- Cyrus, M., Beck, J., 1979. Generalized Two and Three Dimensional Clipping. Computers & Graphics. 3(1), 23-28. [CrossRef]
- Liang, Y., Barsky, B., 1984. A New Concept and Method for Line Clipping. ACM Transactions on Graphics. 3(1), 1-22. [CrossRef]
- Nichoil, T. M., Lee, D. T., Nicholl, R. A., 1987. An efficient new algorithm for 2-D line clipping: its development and analysis. ACM. 21(4), 253-262. [CrossRef]
- Weiler, K., Atherton. P., 1977. Hidden surface removal using polygon area sorting. Computer Graphics. 11(2), 214-222. [CrossRef]
- Sutherland, I. E., Hodgman, G. W., 1974. Reentrant polygon clipping. Communications of the ACM. 17(1), 32-42. [CrossRef]
- Lu, N., Cheng, C., Jin, A., & Ma, H., 2013. An index and retrieval method of spatial data based on GeoSOT global discrete grid system. In 2013 IEEE International Geoscience and Remote Sensing Symposium-IGARSS, IEEE. 4519-4522. [CrossRef]
- Pons X, Maso J., 2016. A comprehensive open package format for preservation and distribution of geospatial data and metadata. Computers & Geosciences. 97, 89-97. [CrossRef]
- Xu, Y., Lewis, B., & Guan, W. W., 2019. Developing the Chinese Academic Map Publishing Platform. ISPRS International Journal of Geo-Information. 8(12), 567. [CrossRef]
- Arikawa, M., Fujimori, F and Morita, T., 2003. A TOOL FOR CHECKING GRAPHIC LOGIC IN SVG MAPS. Proc. of the 21st Int. Cartographic Conf. (ICC) Durban, South Africa. 986-993.
Figure 1.
Schematic diagram of adaptive grid division on map page.

Figure 2.
Cropping of Map Page Graphic Objects.
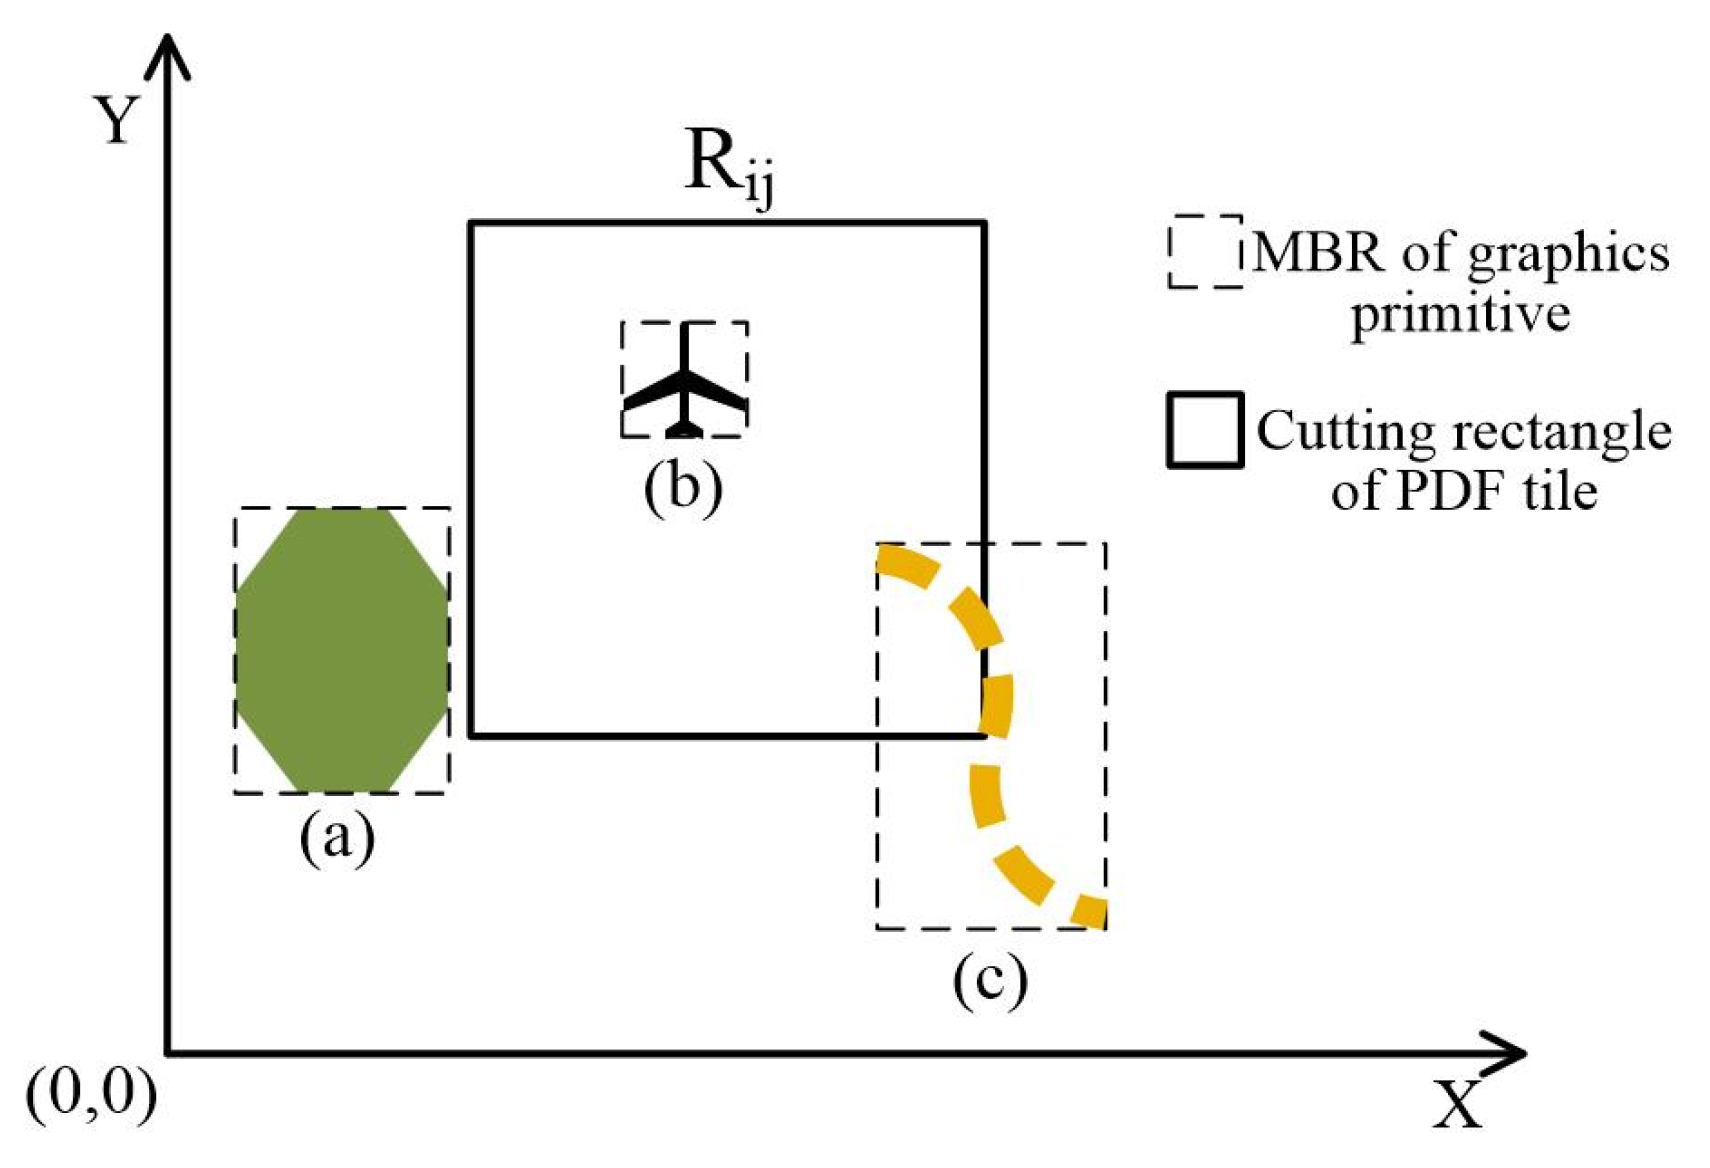
Figure 3.
Schematic illustration of path clipping.
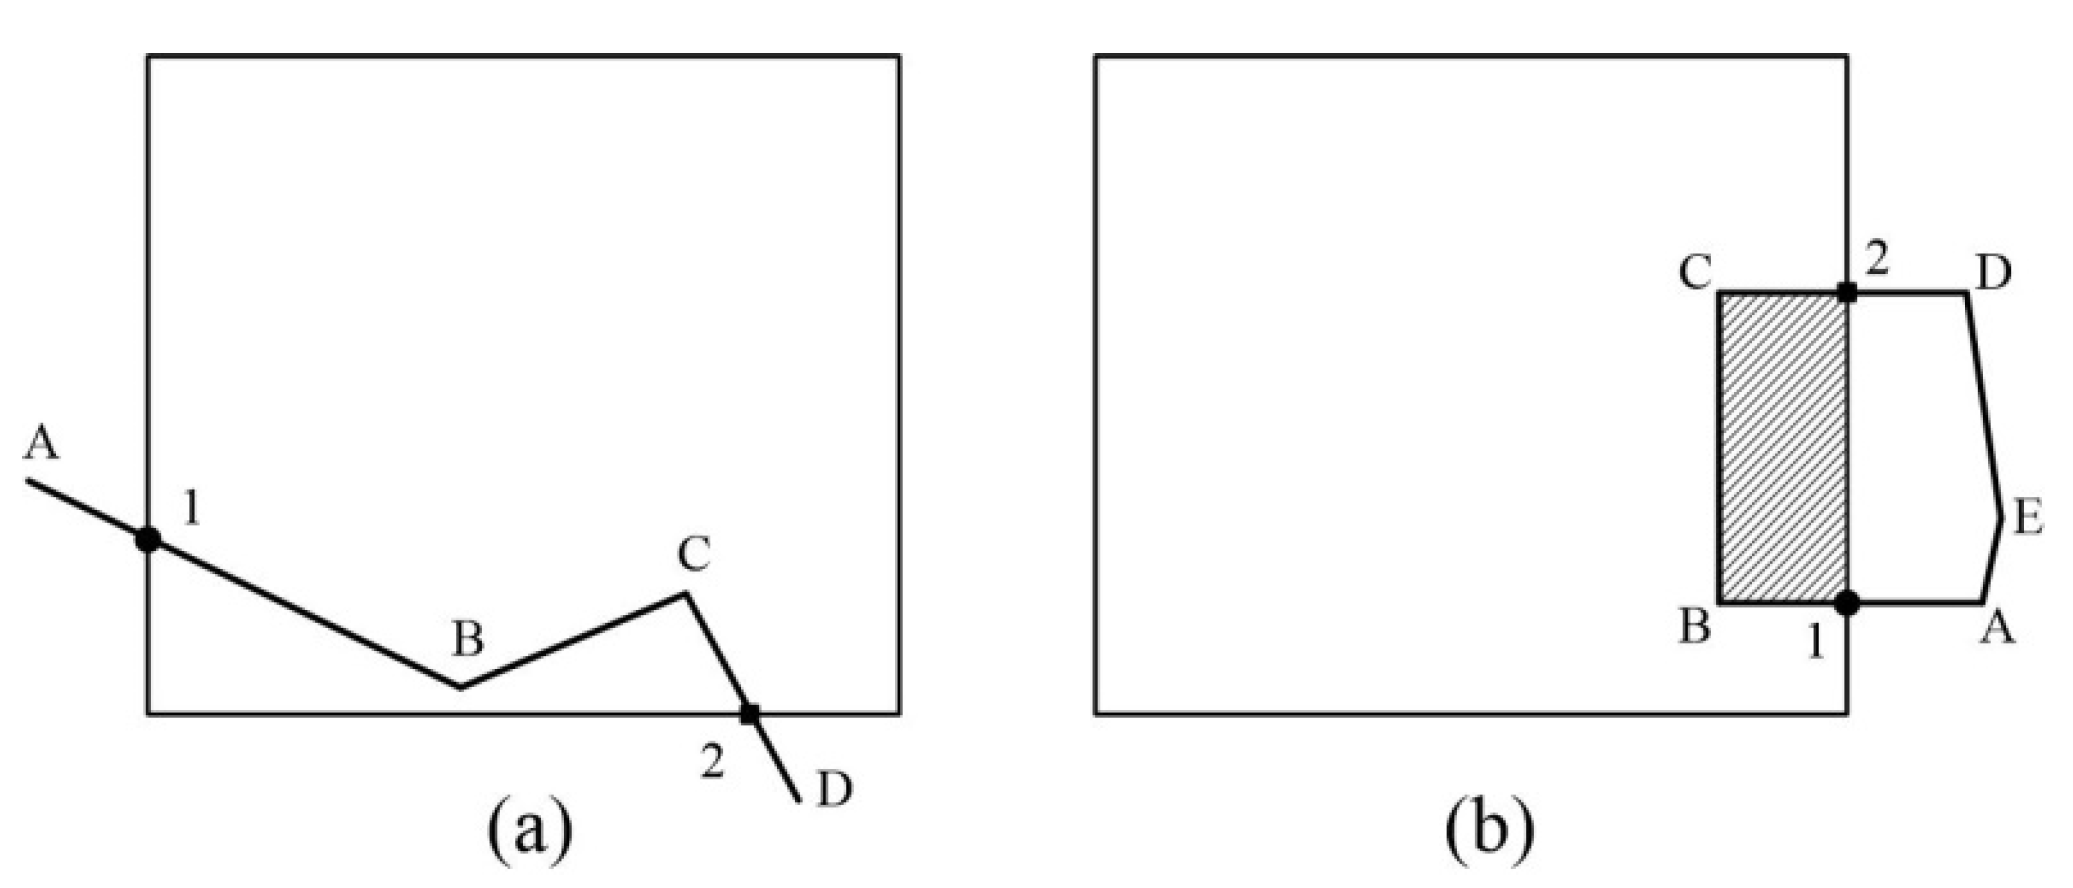
Figure 4.
Dual mapping relationship of map data.
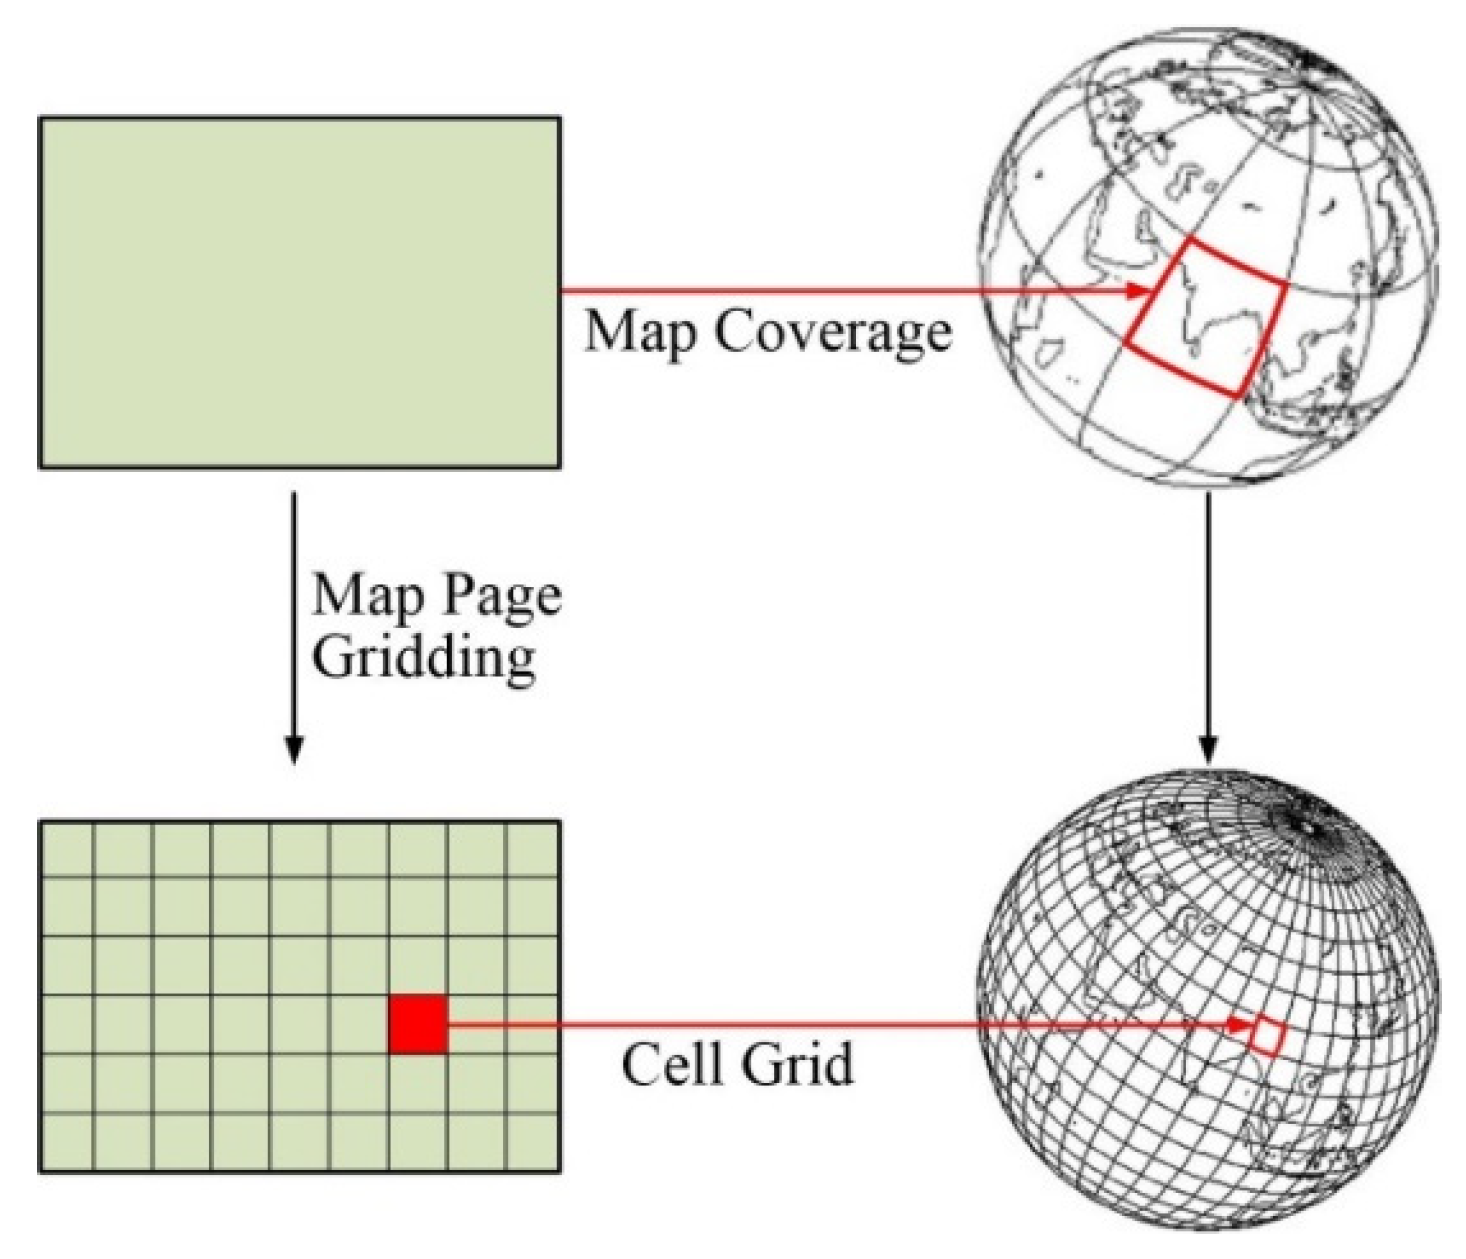
Figure 5.
Encoding of overall location outside map data.
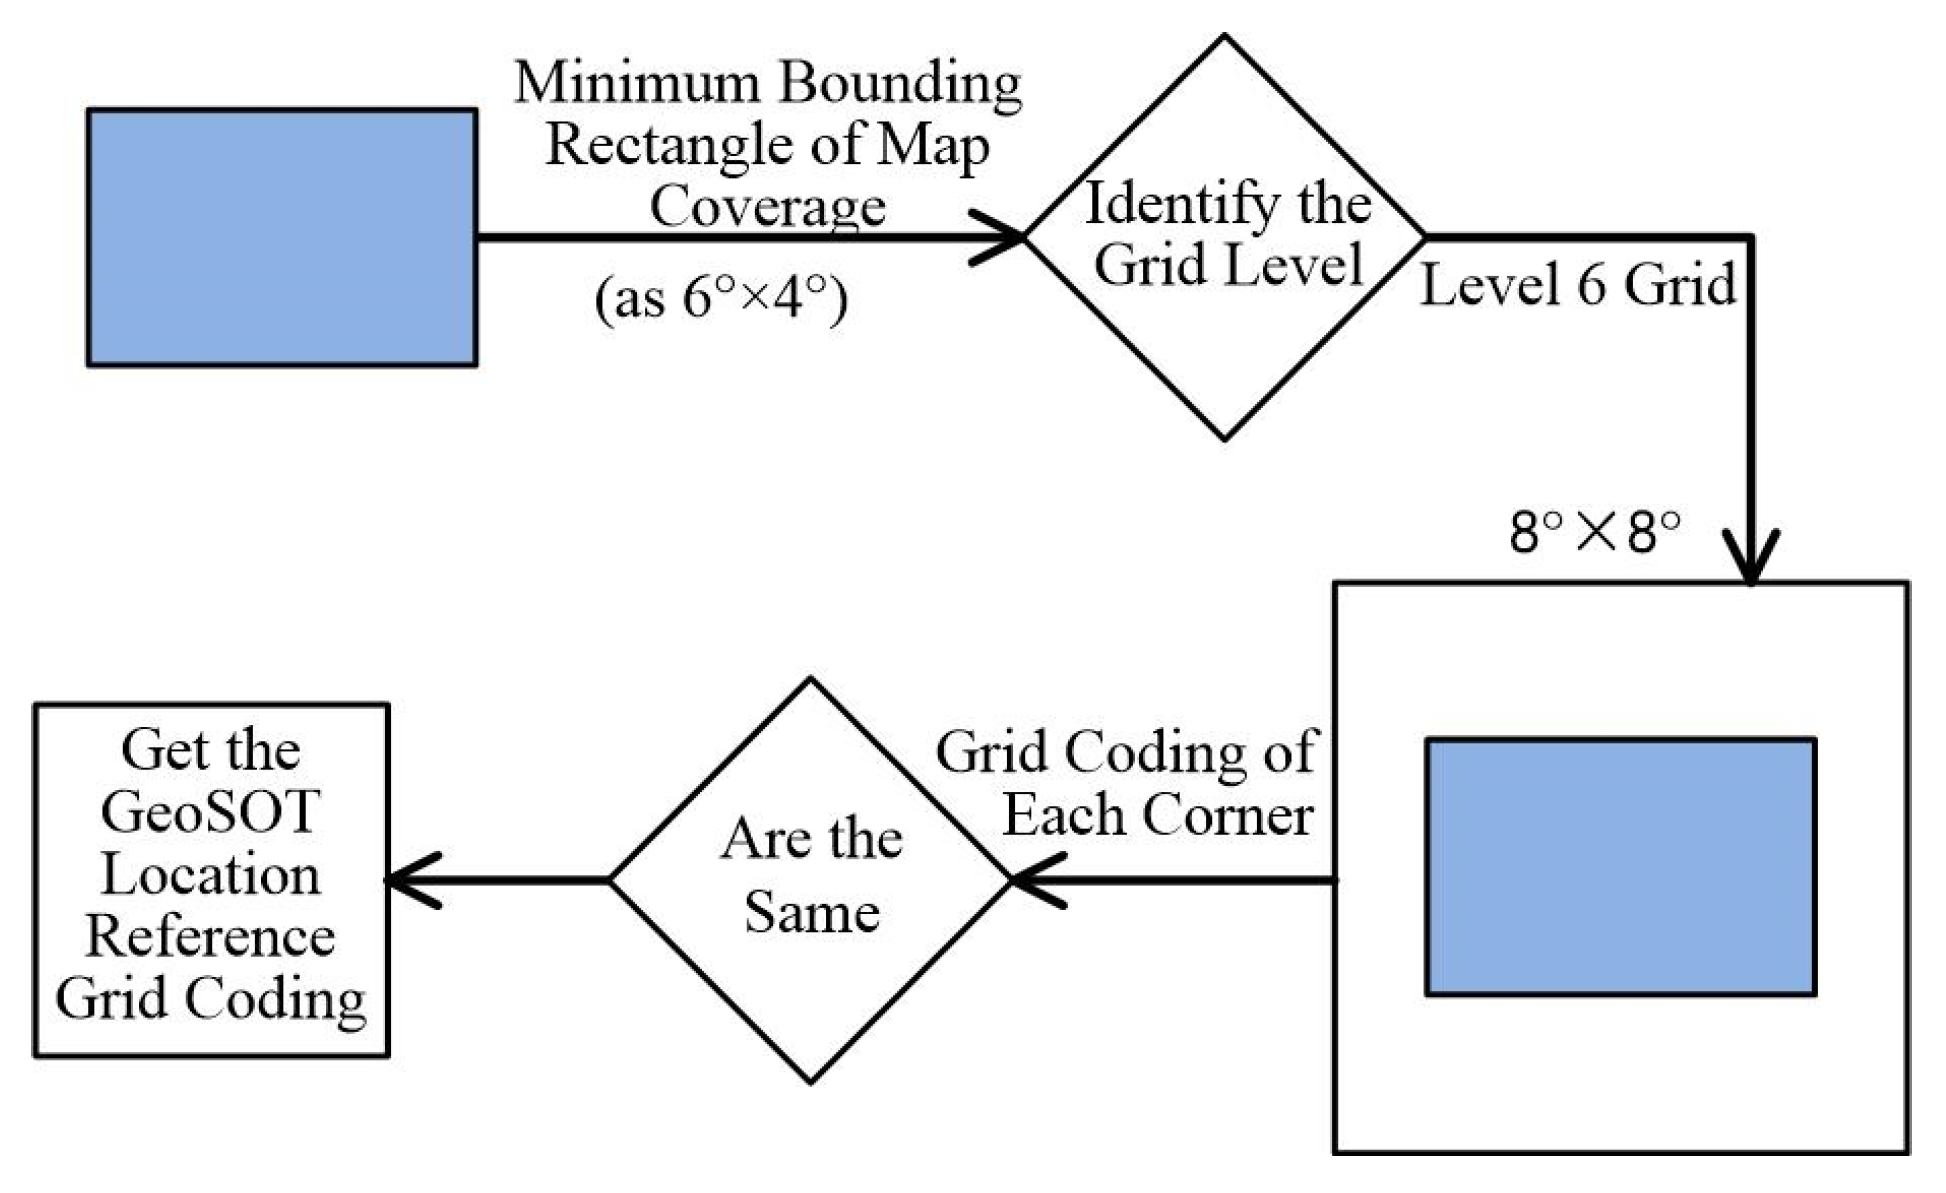
Figure 6.
Three-tier storage mode for map data.
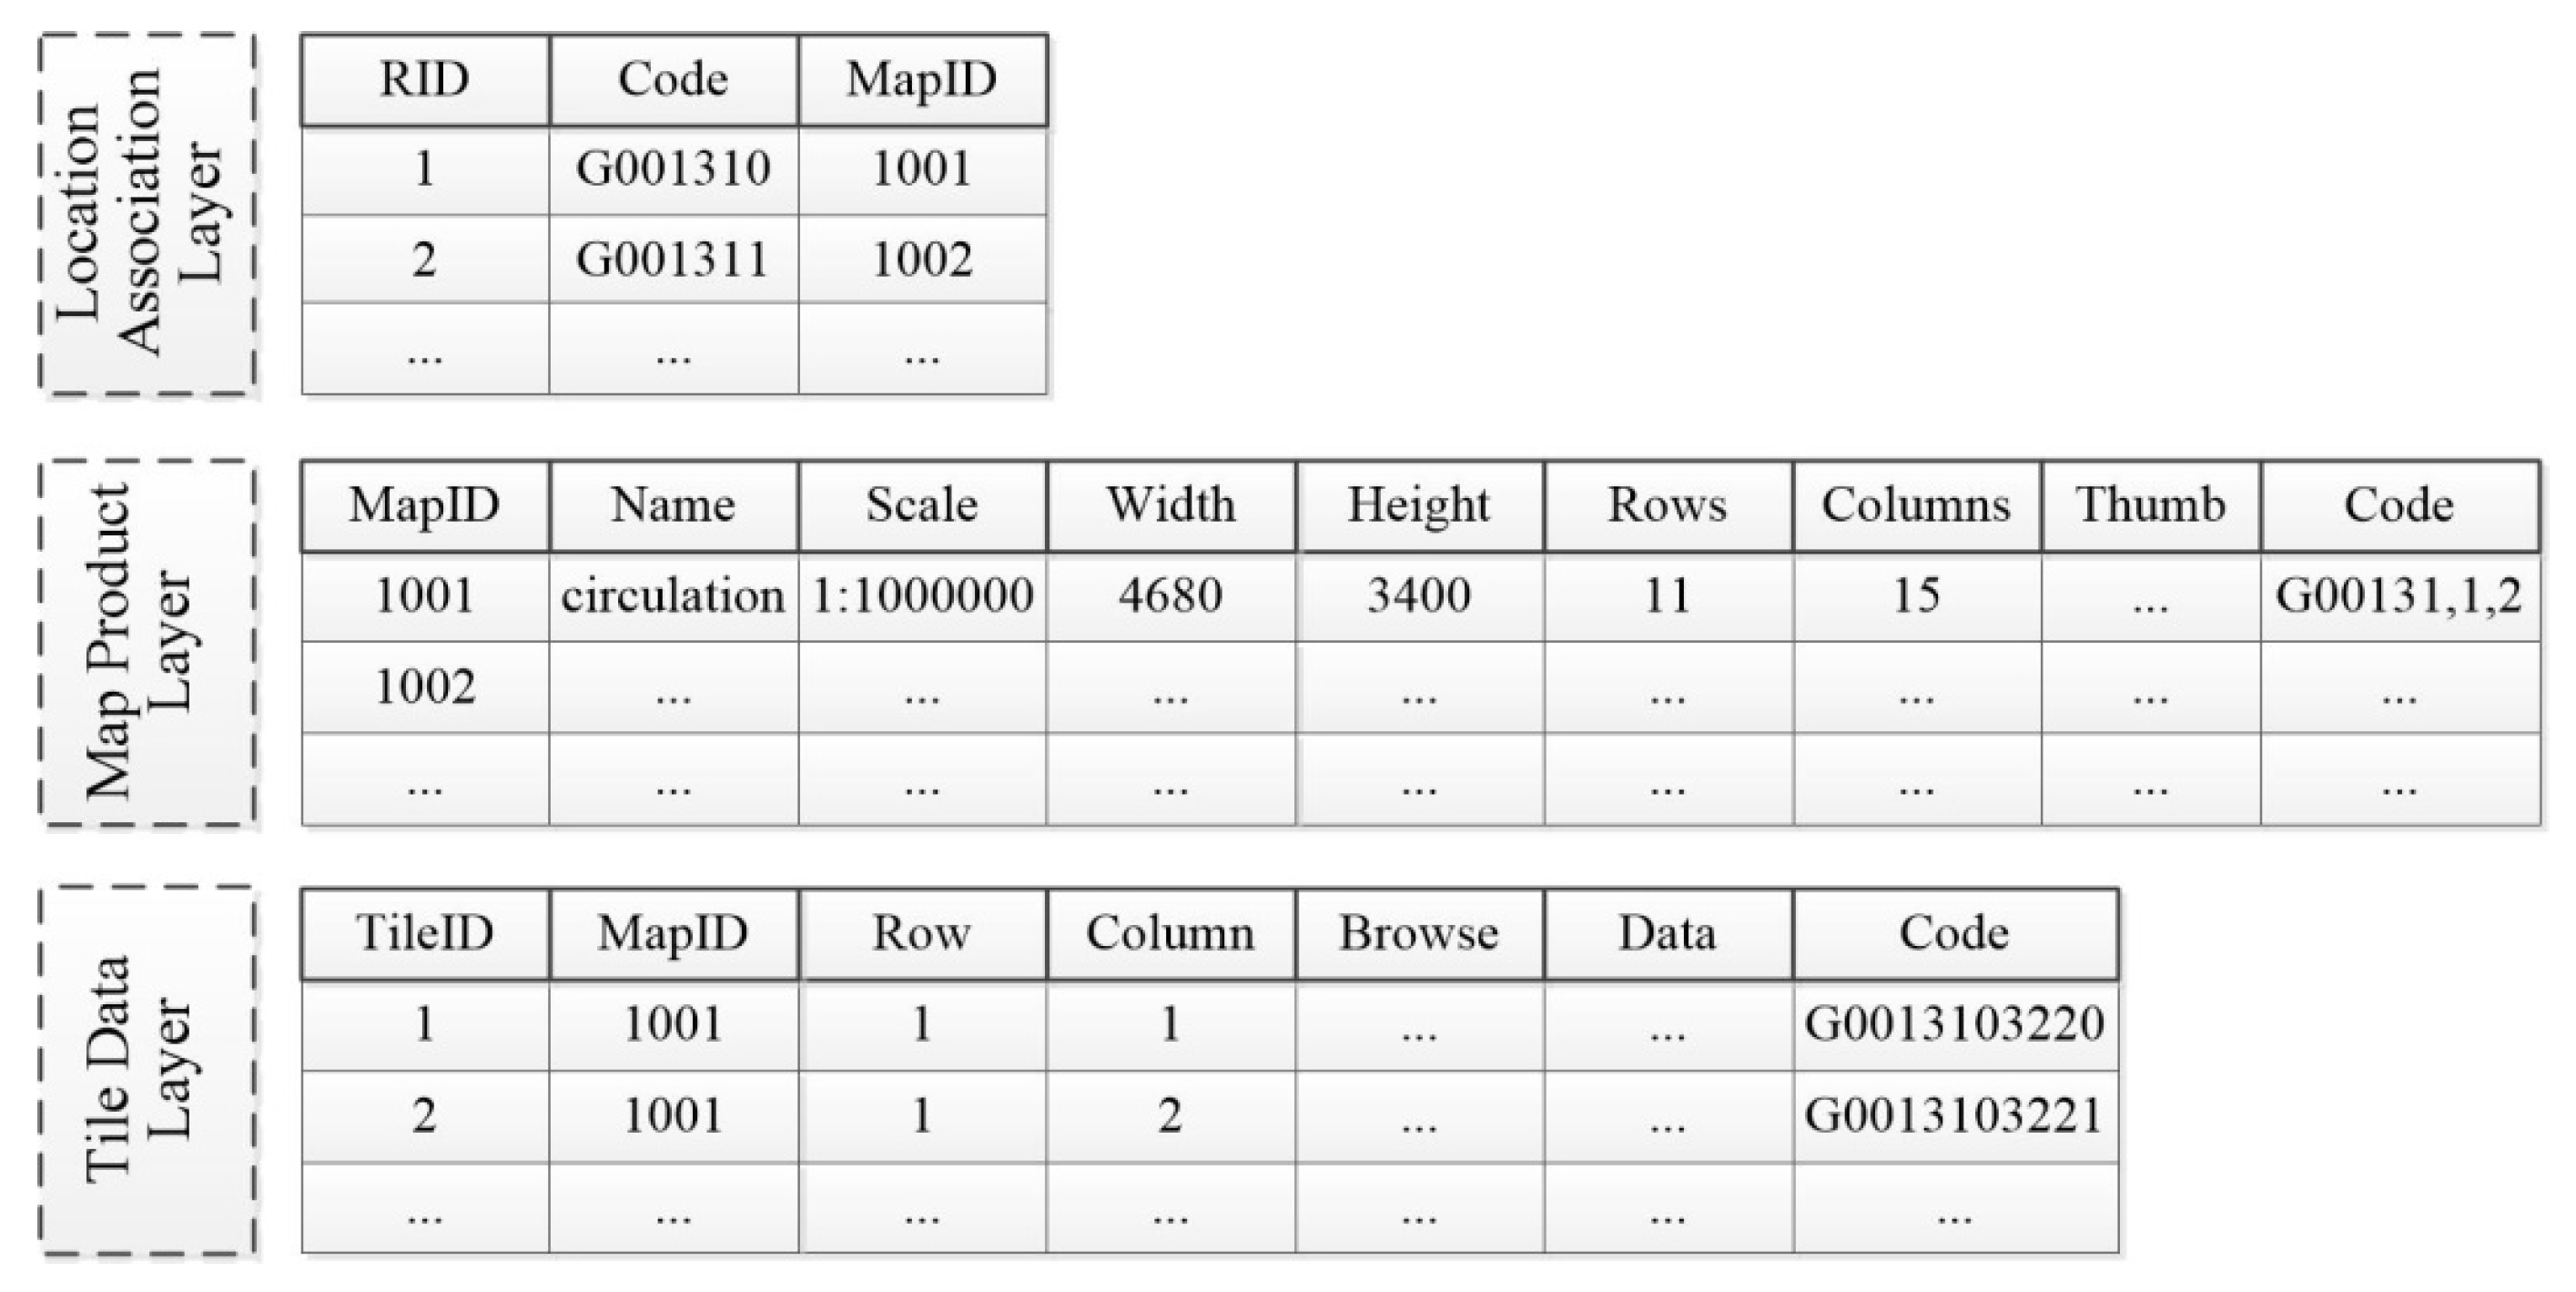
Figure 7.
Single map full image display initialization.
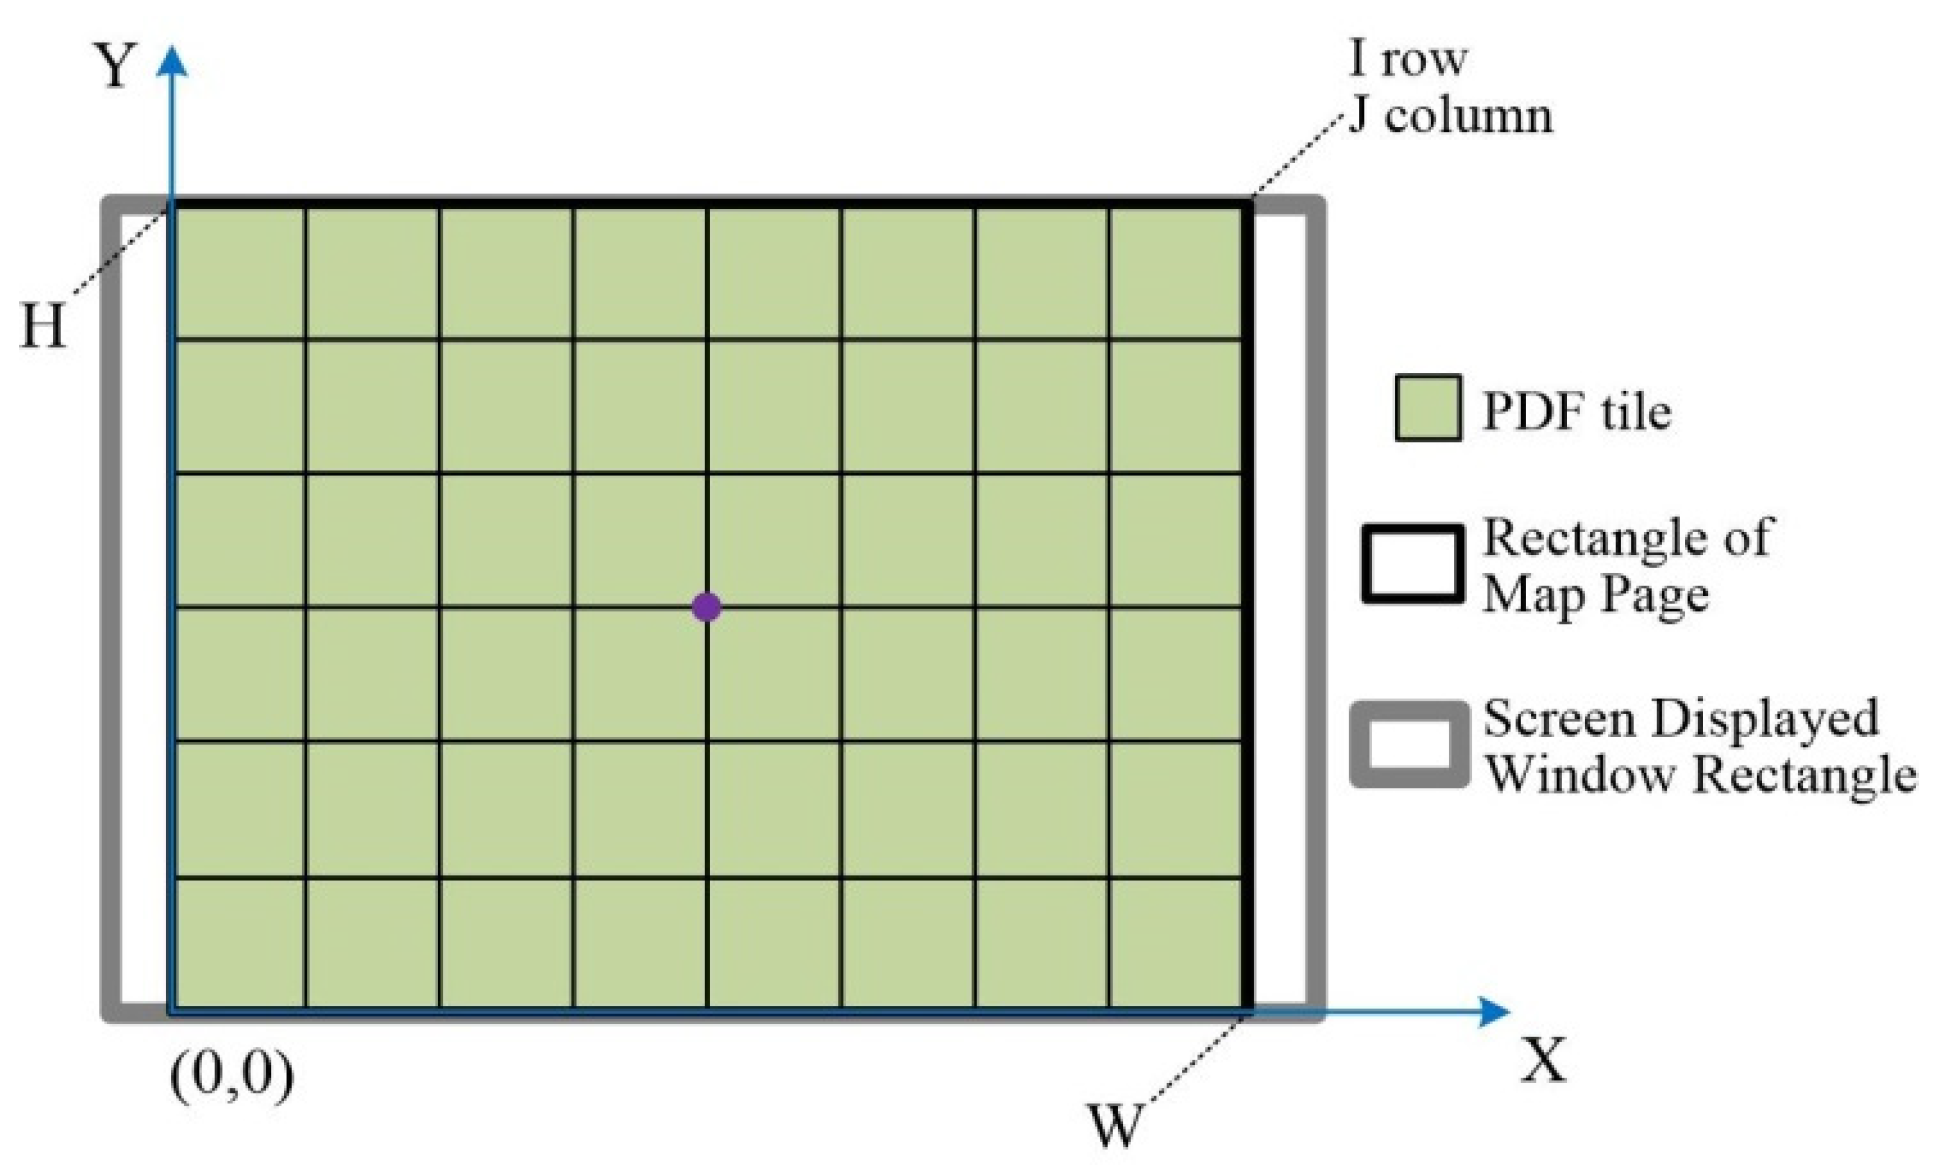
Figure 8.
Display initialization of the specified area range.
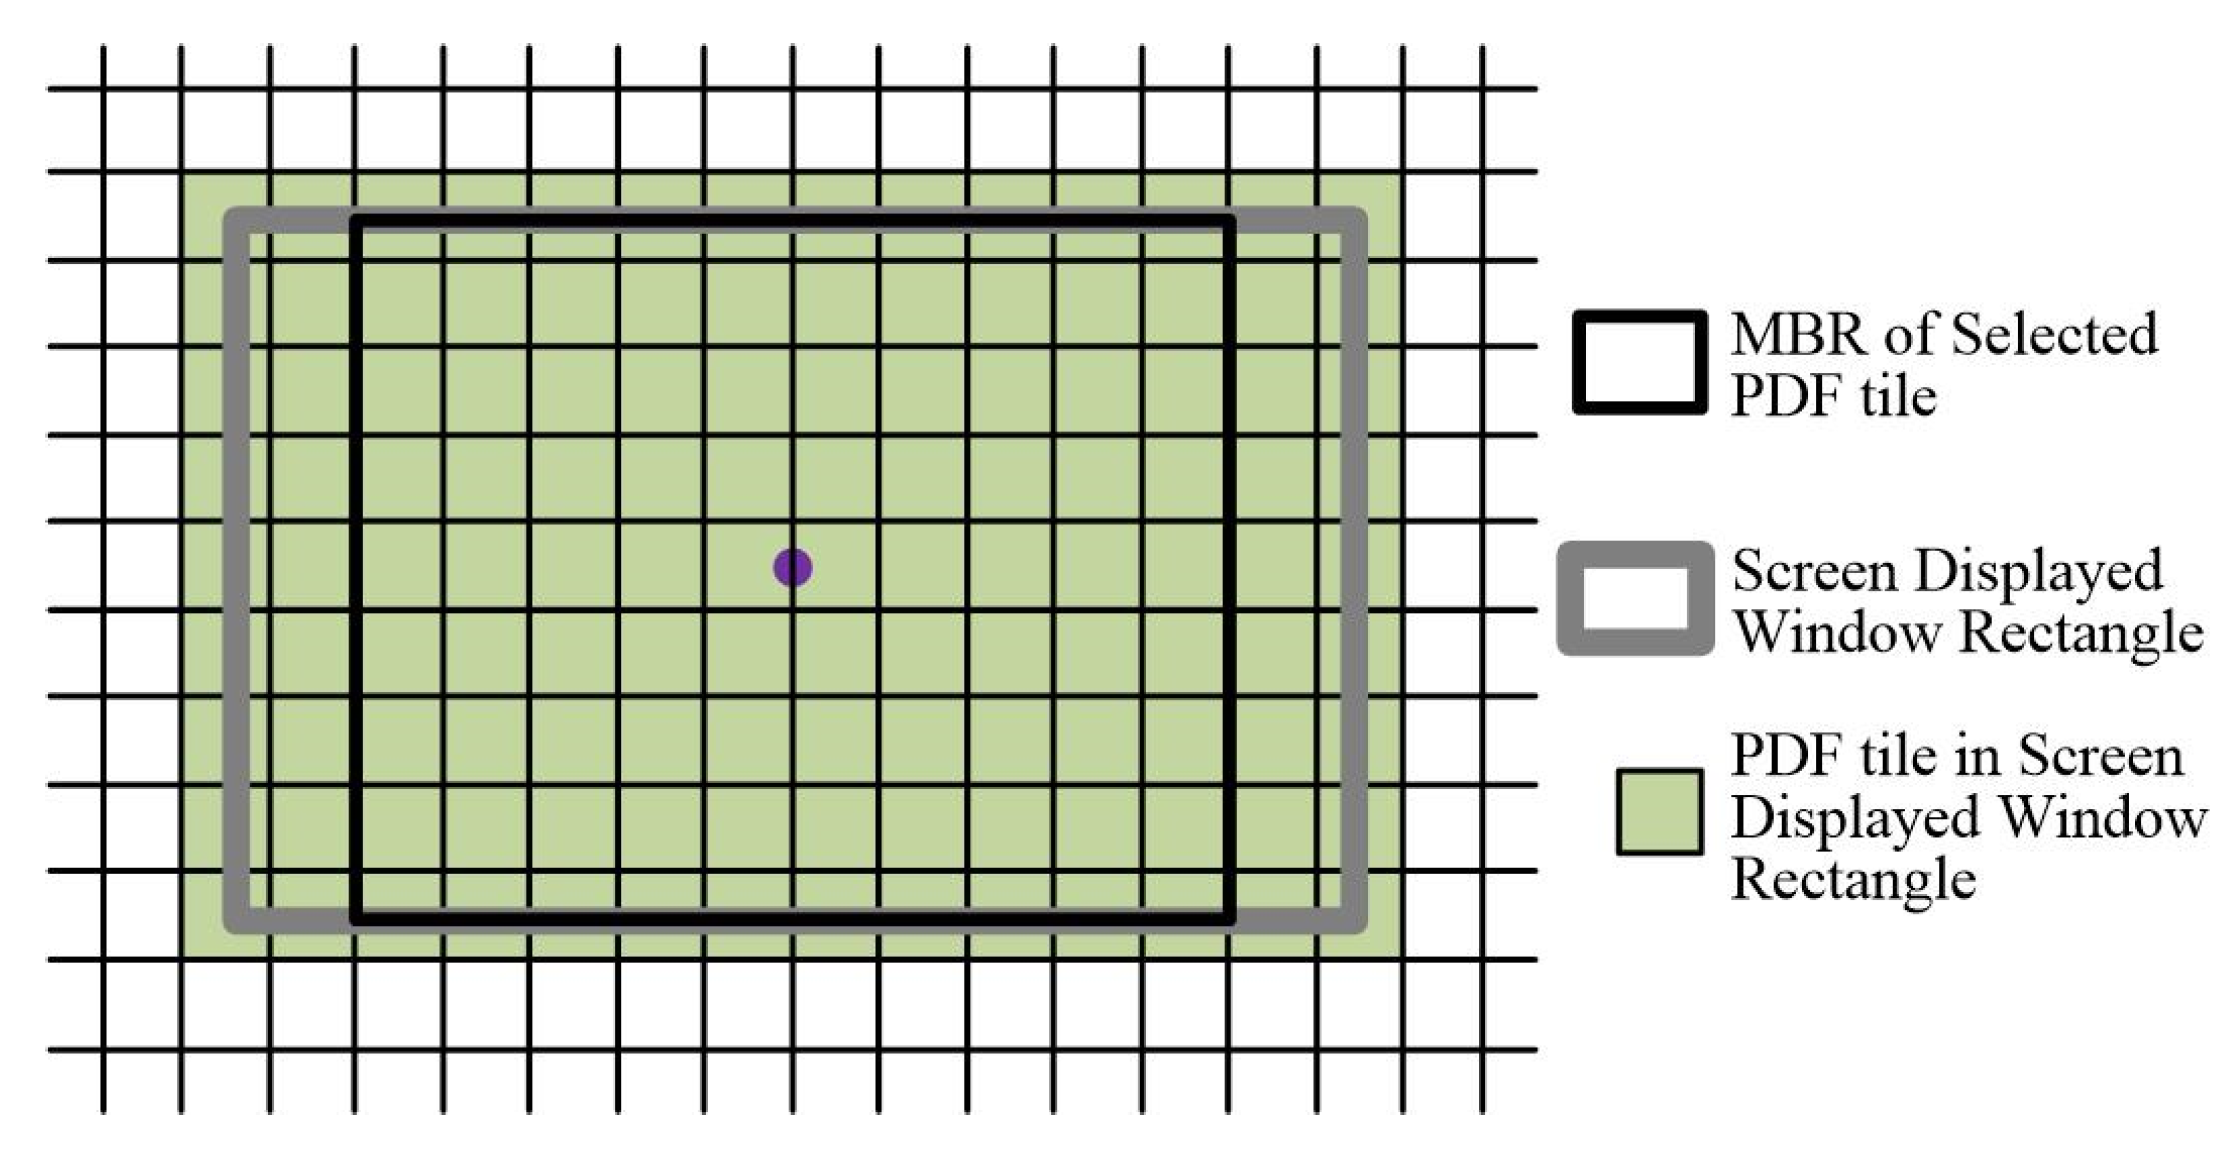
Figure 9.
PDF document object cache.
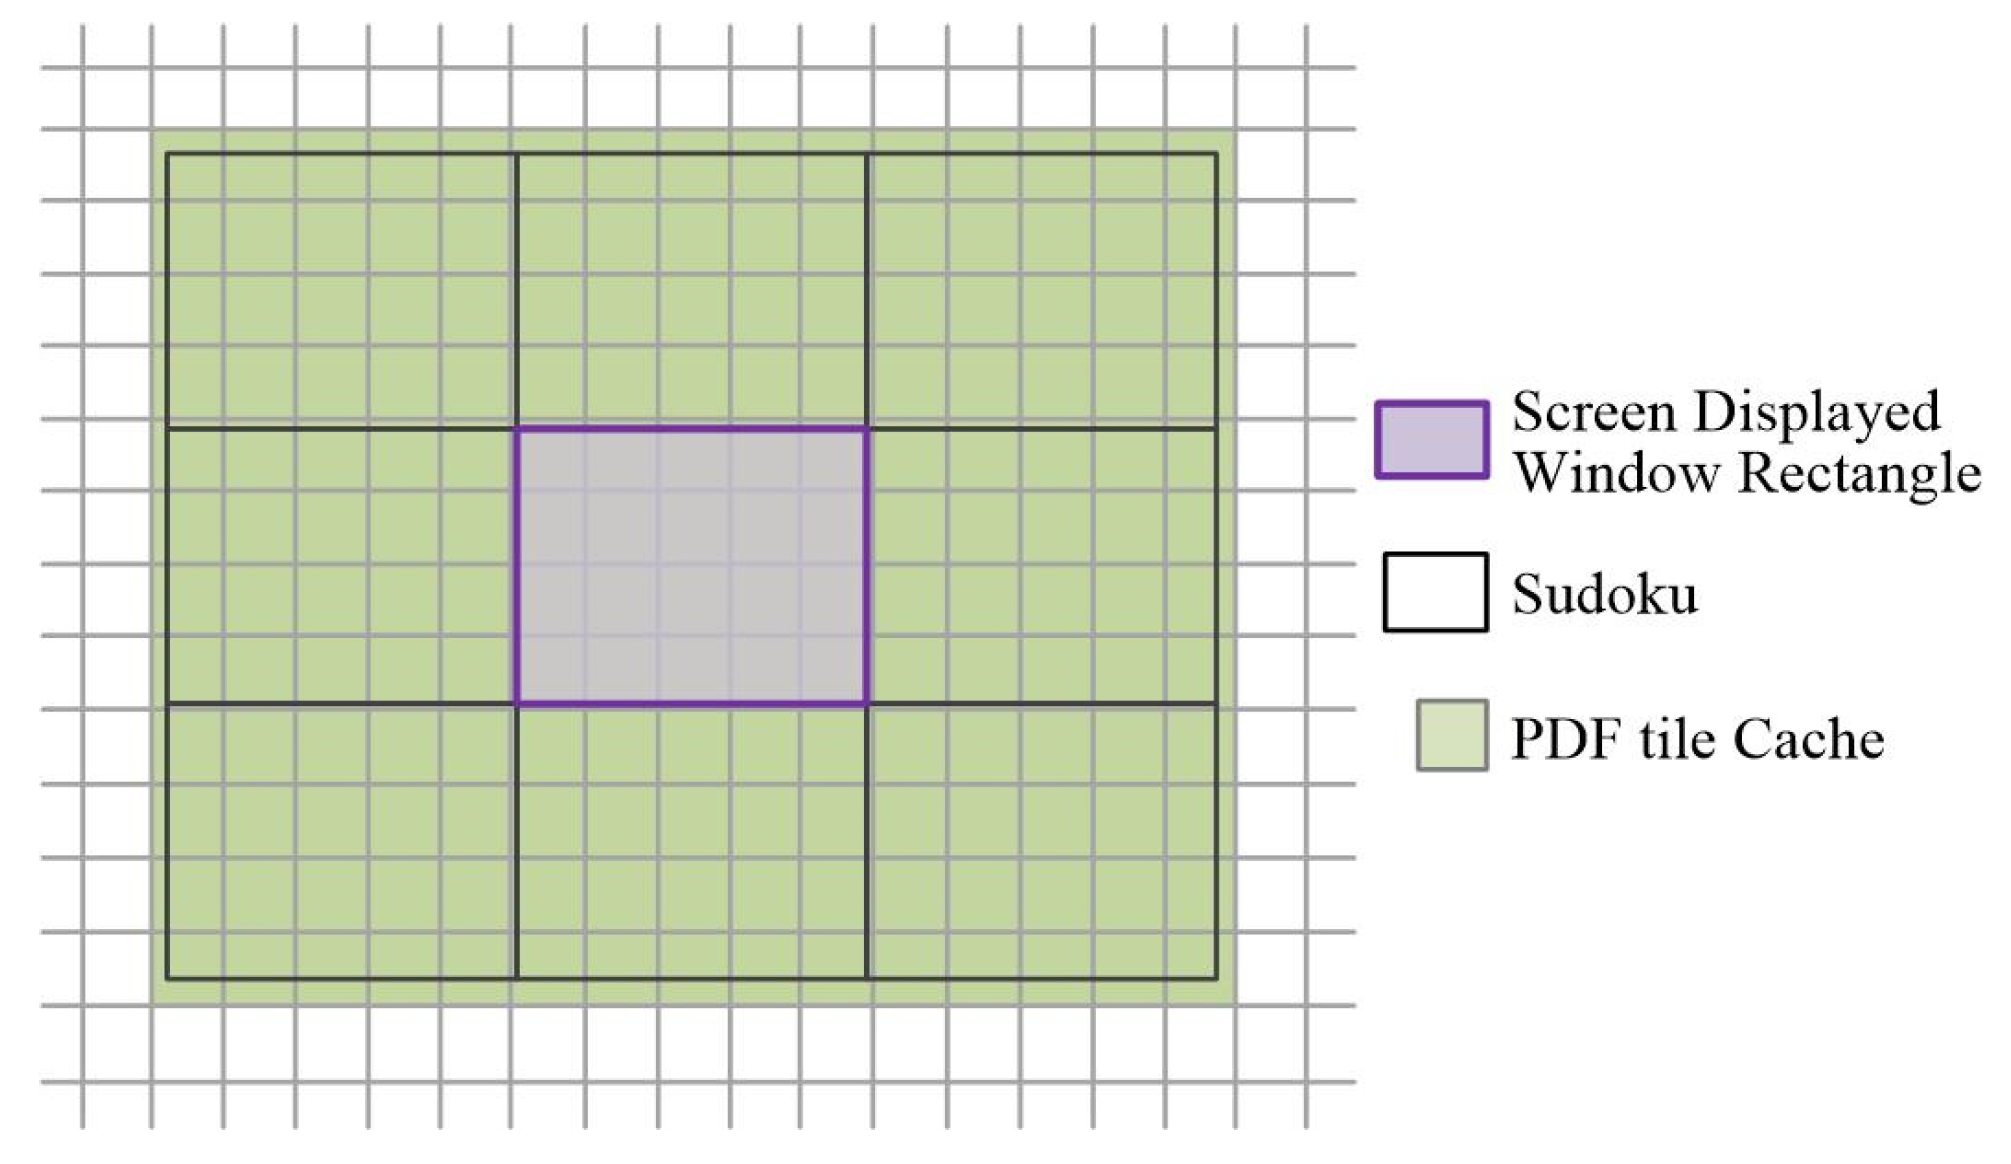
Figure 10.
Vector published map data processing and display test system.
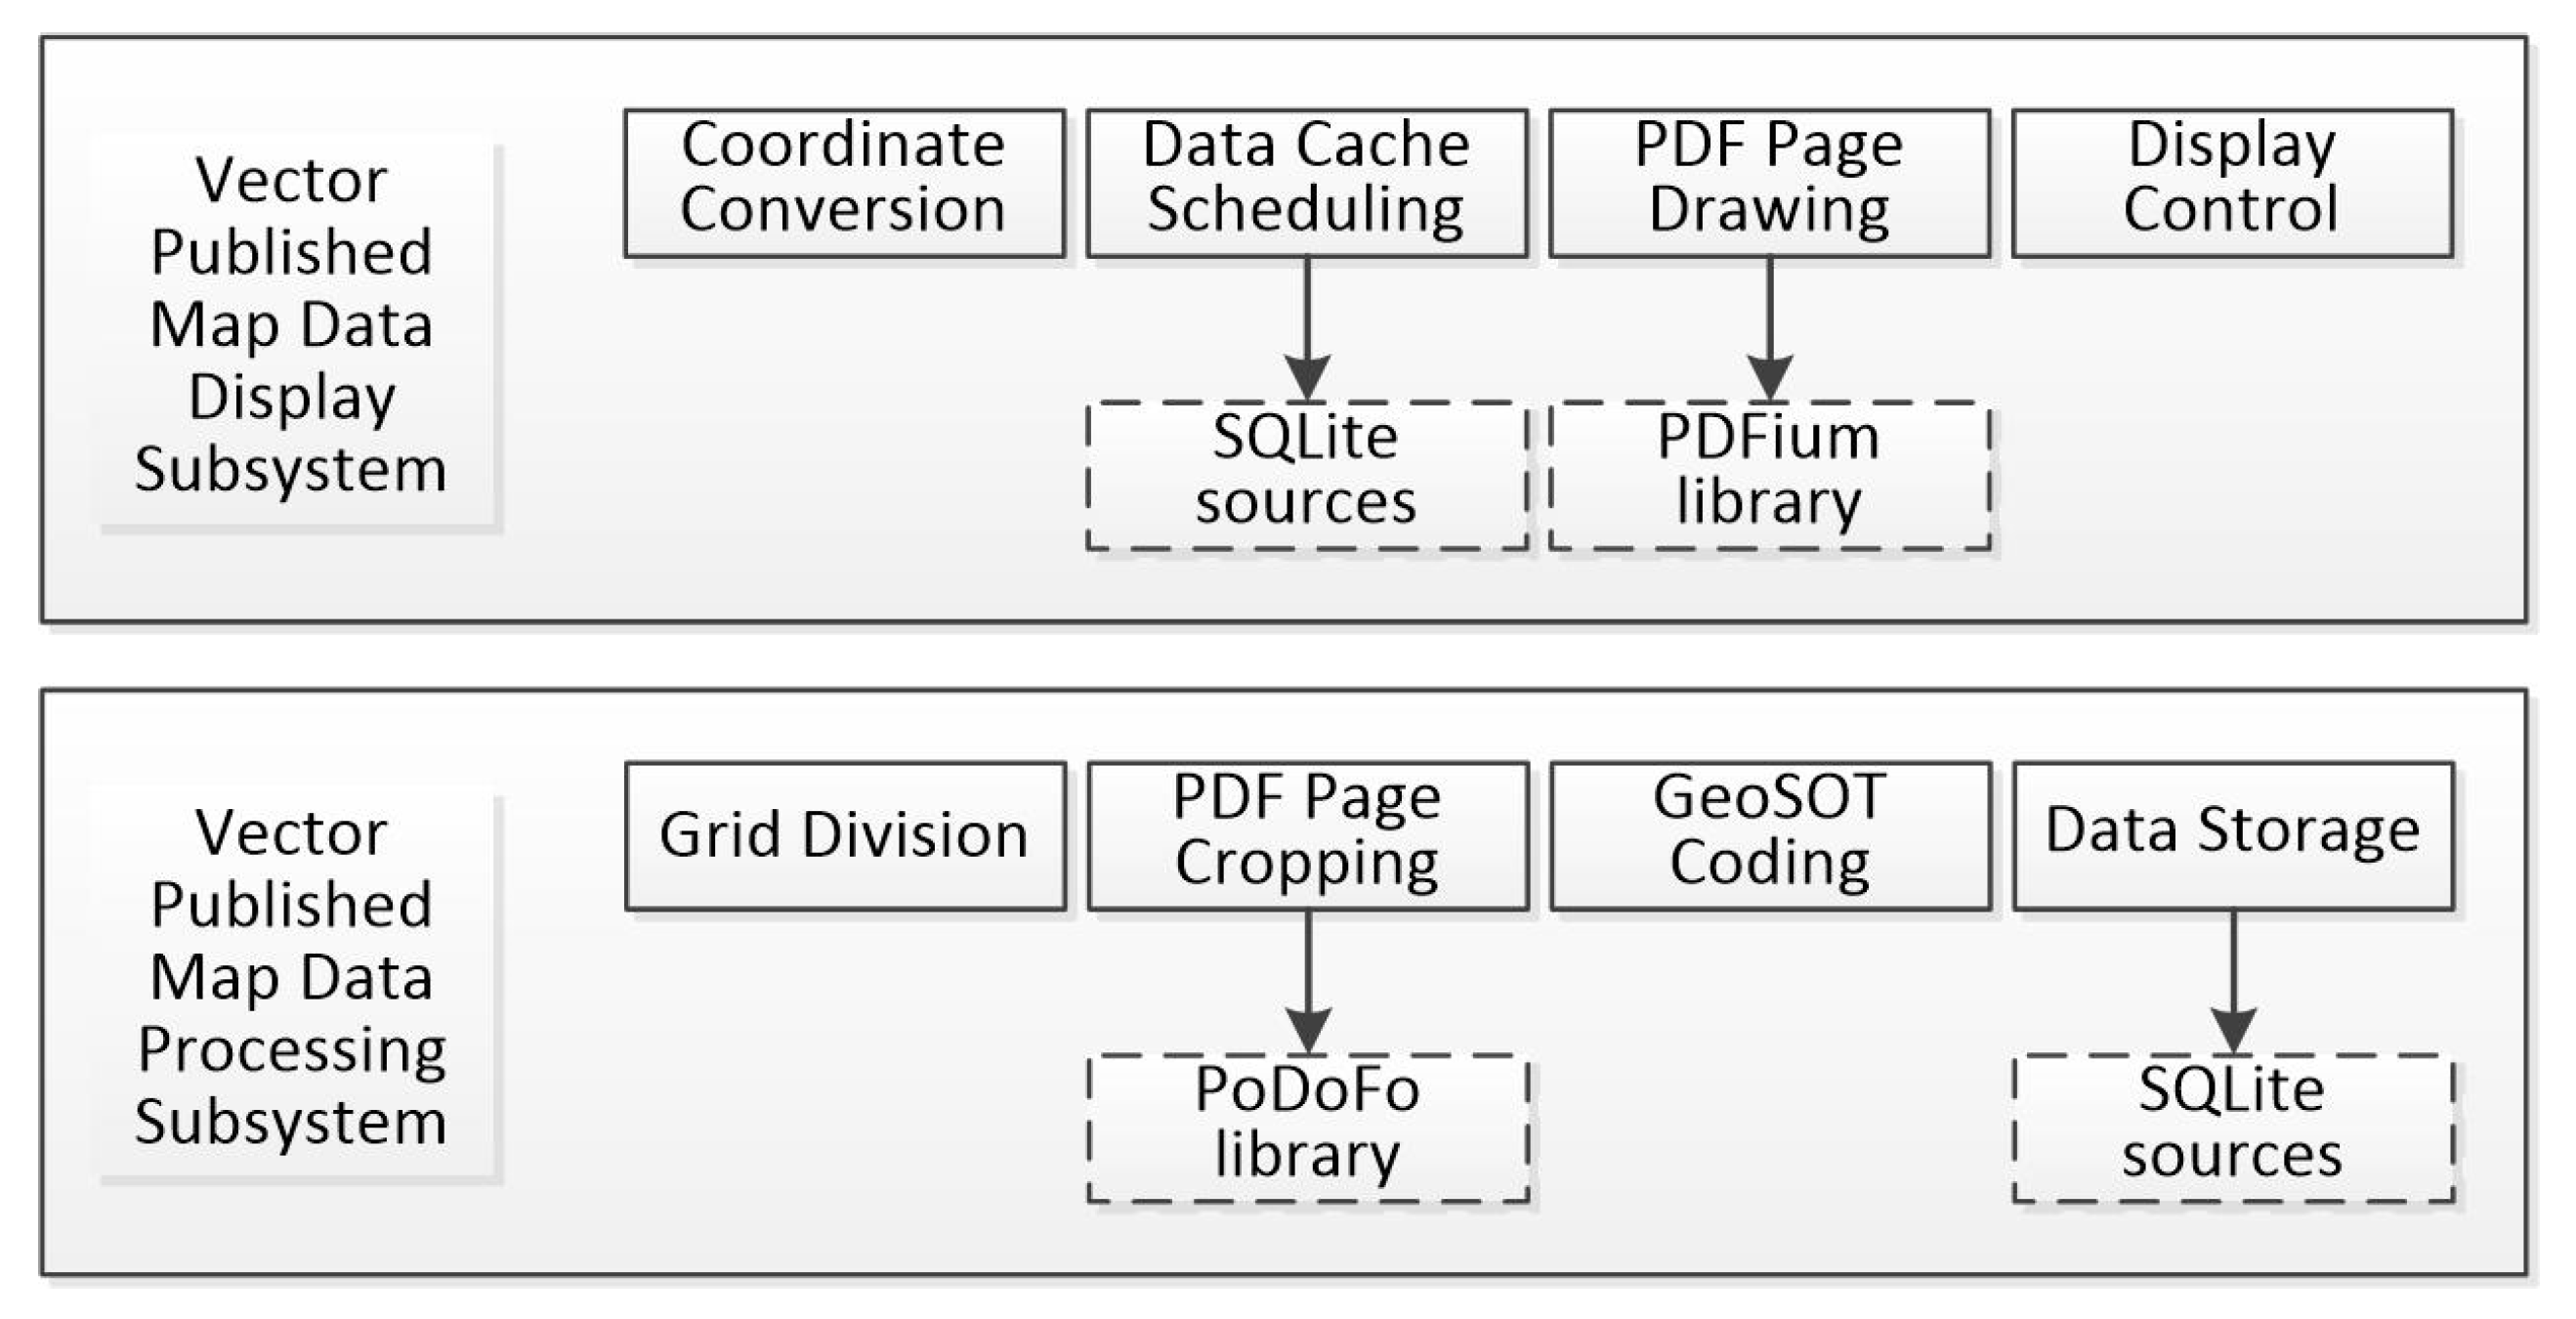
Figure 11.
Statistics of test data.
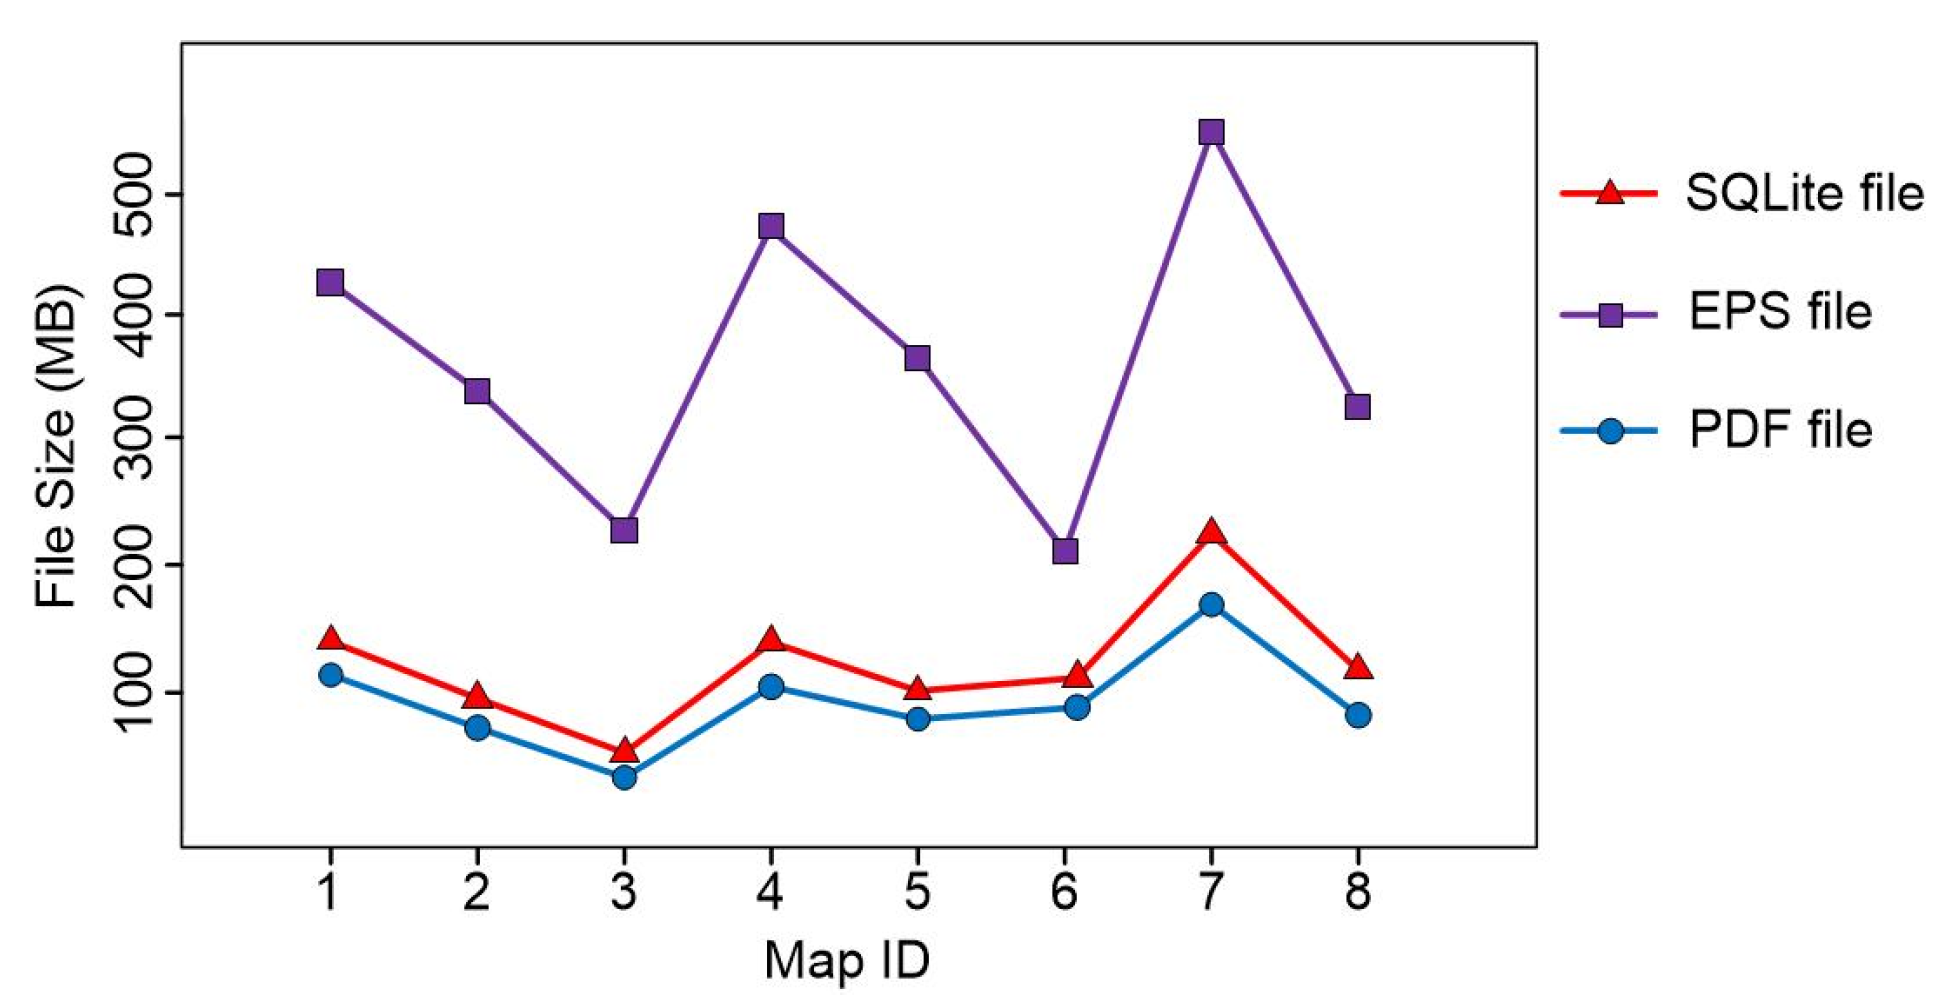
Figure 12.
Comparison of test data map loading efficiency (Windows).
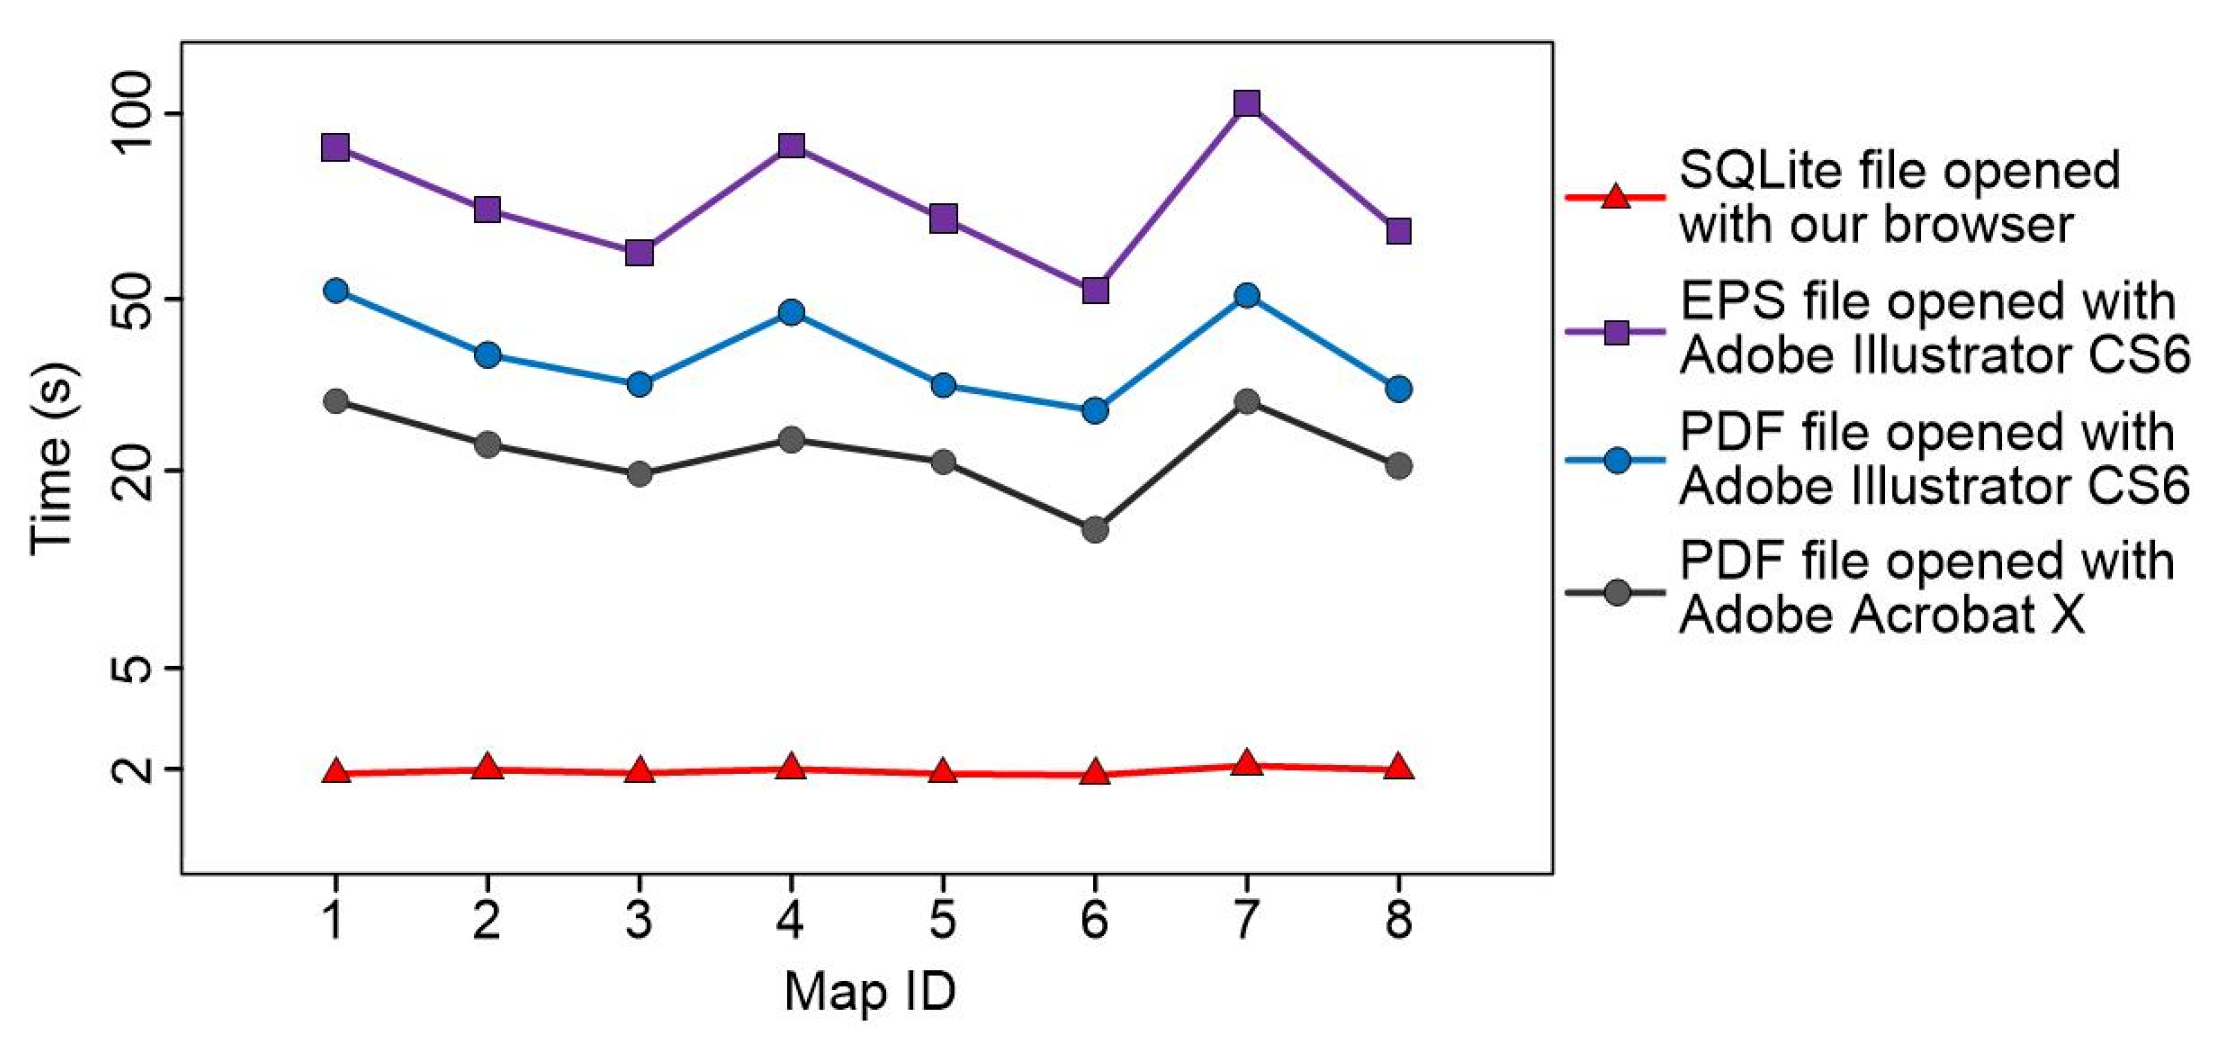
Figure 13.
Comparison of test data map loading efficiency (Android).
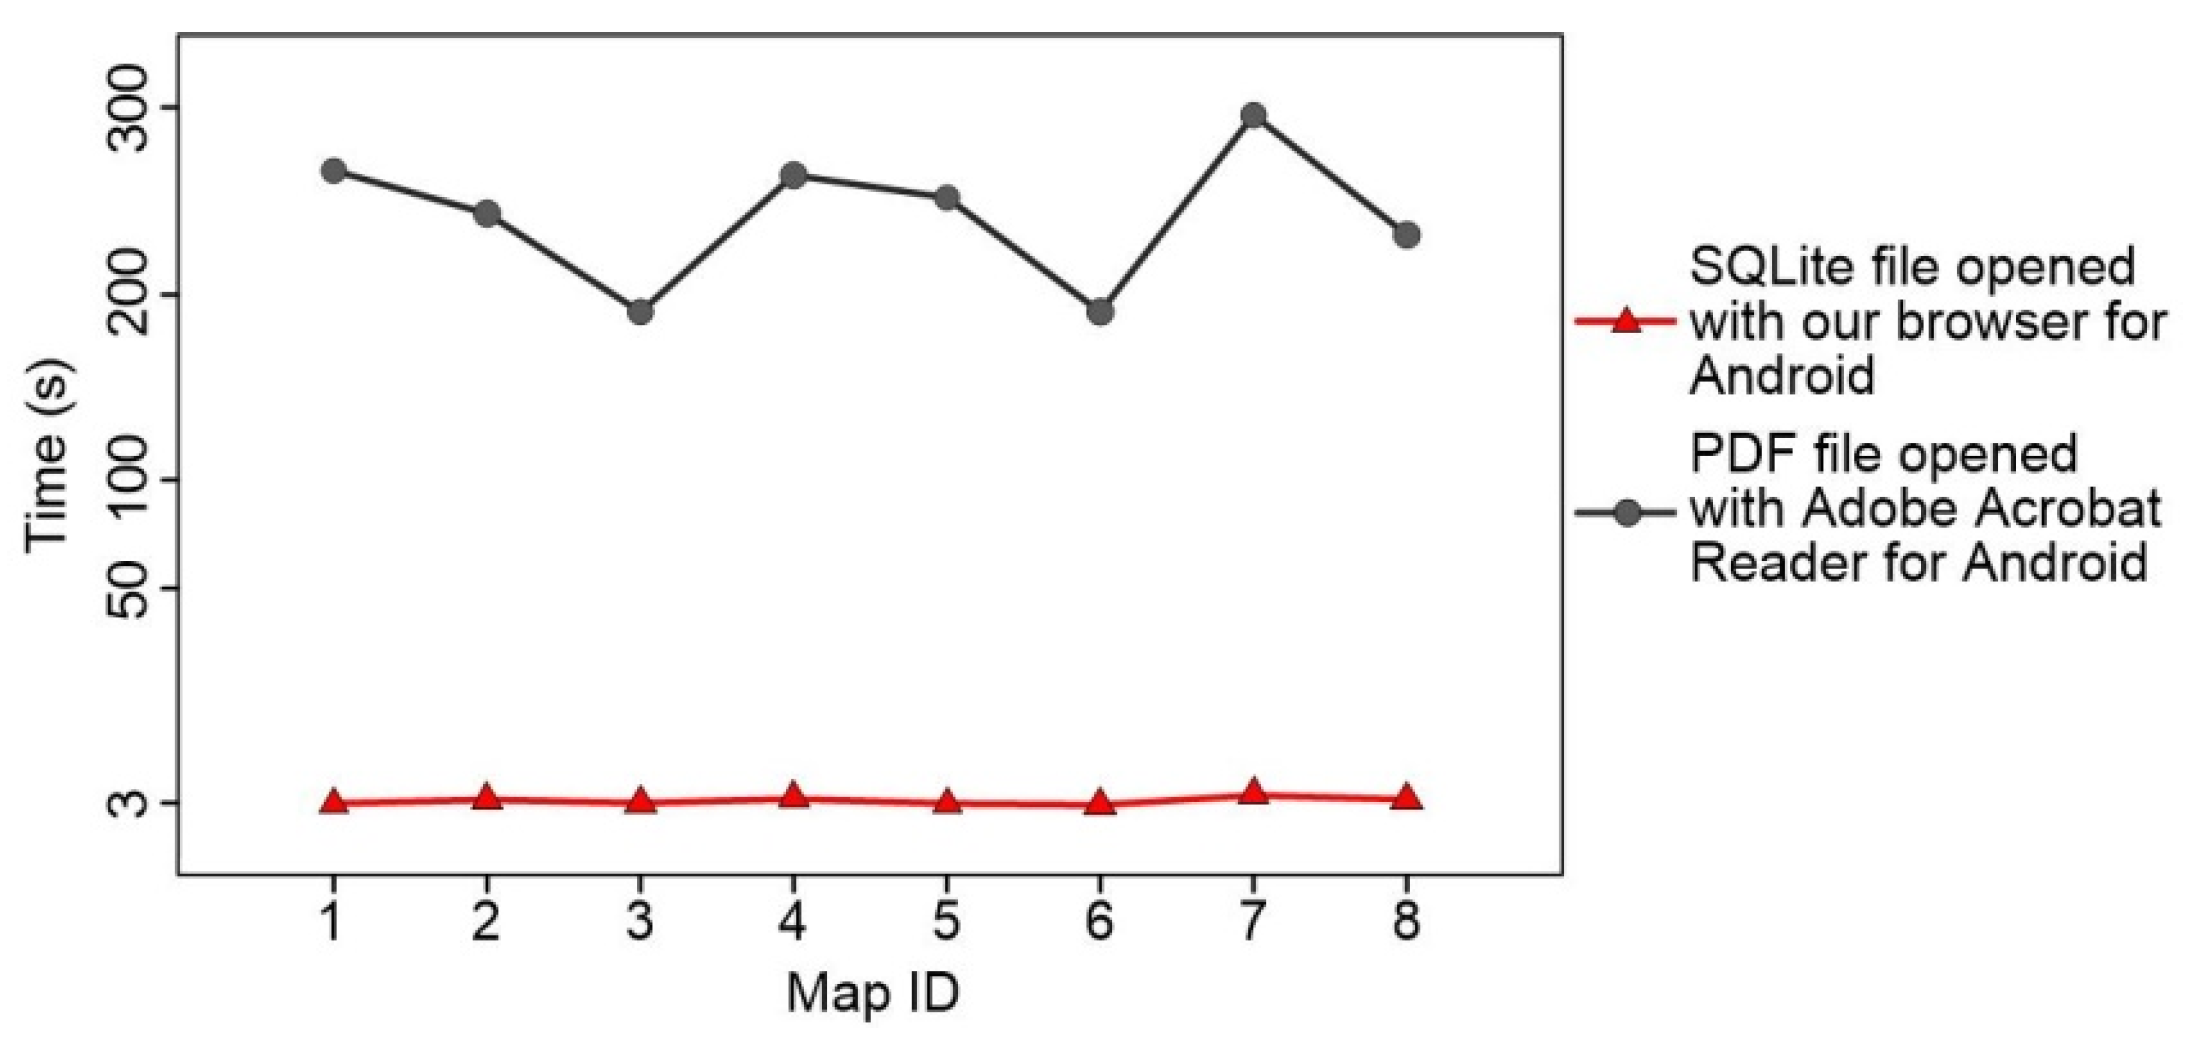
Figure 14.
Comparison of test data map operation efficiency (Windows).
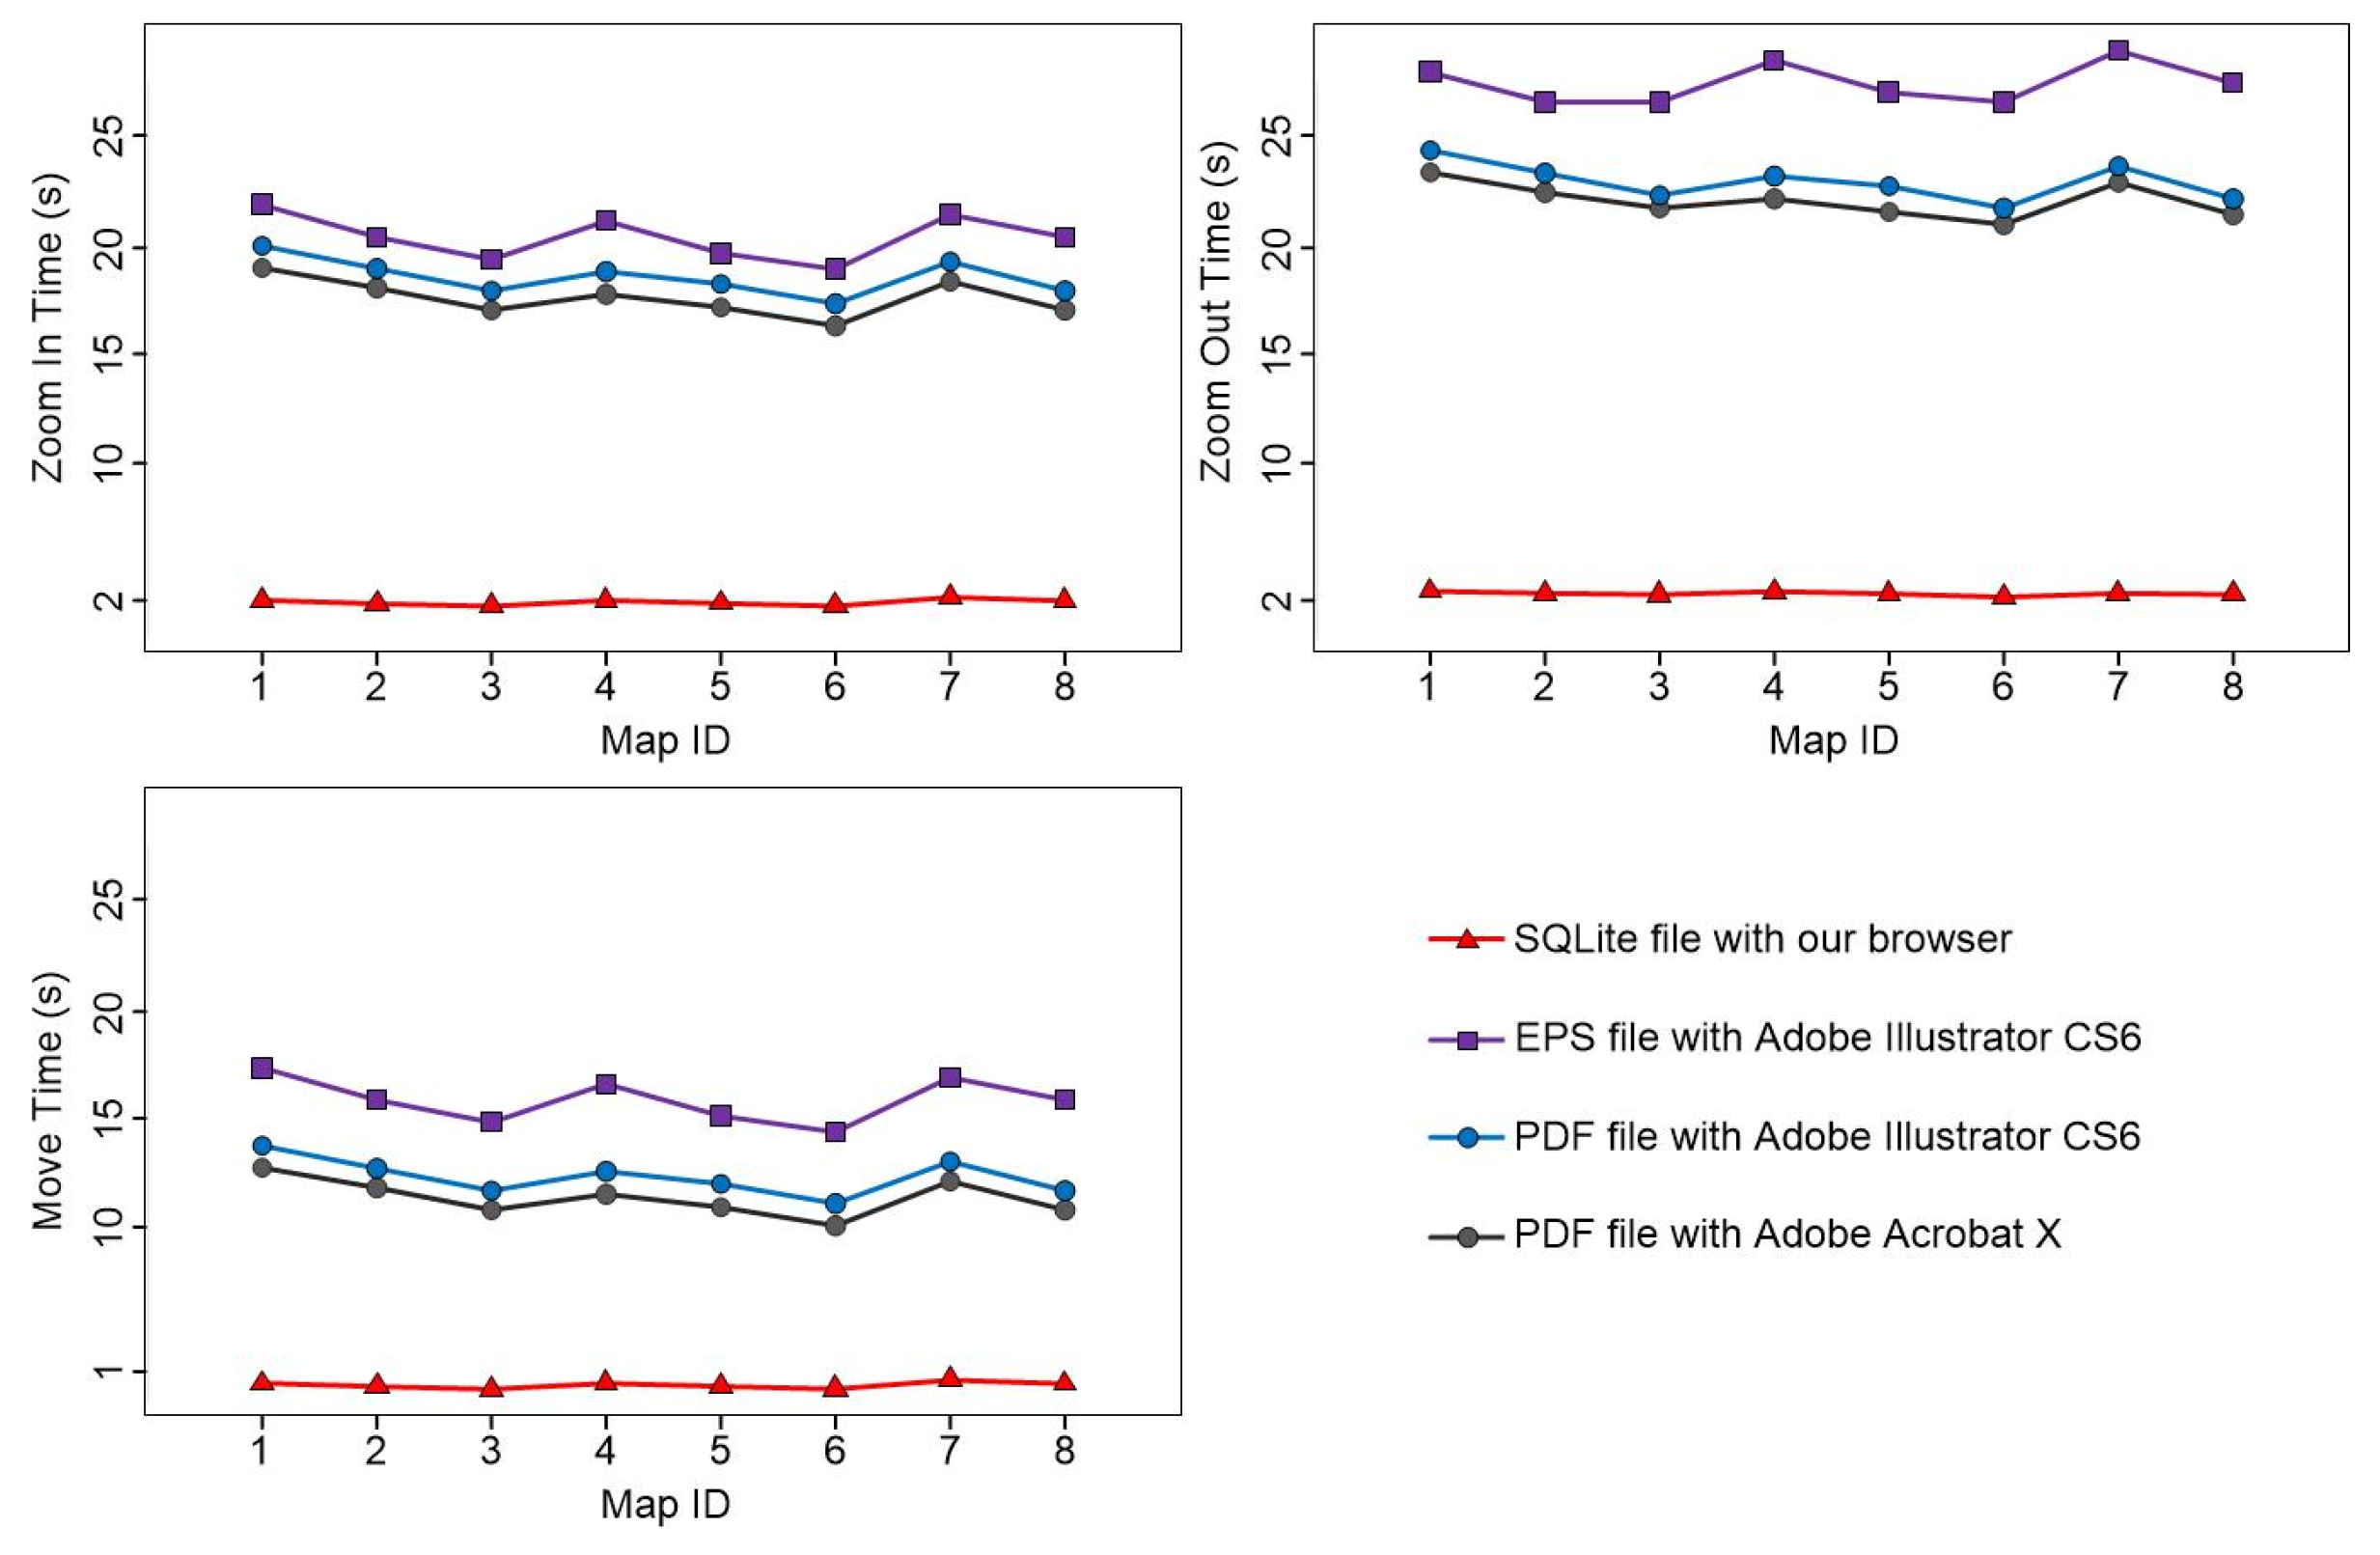
Figure 15.
Comparison of experimental data map operation efficiency (Android).
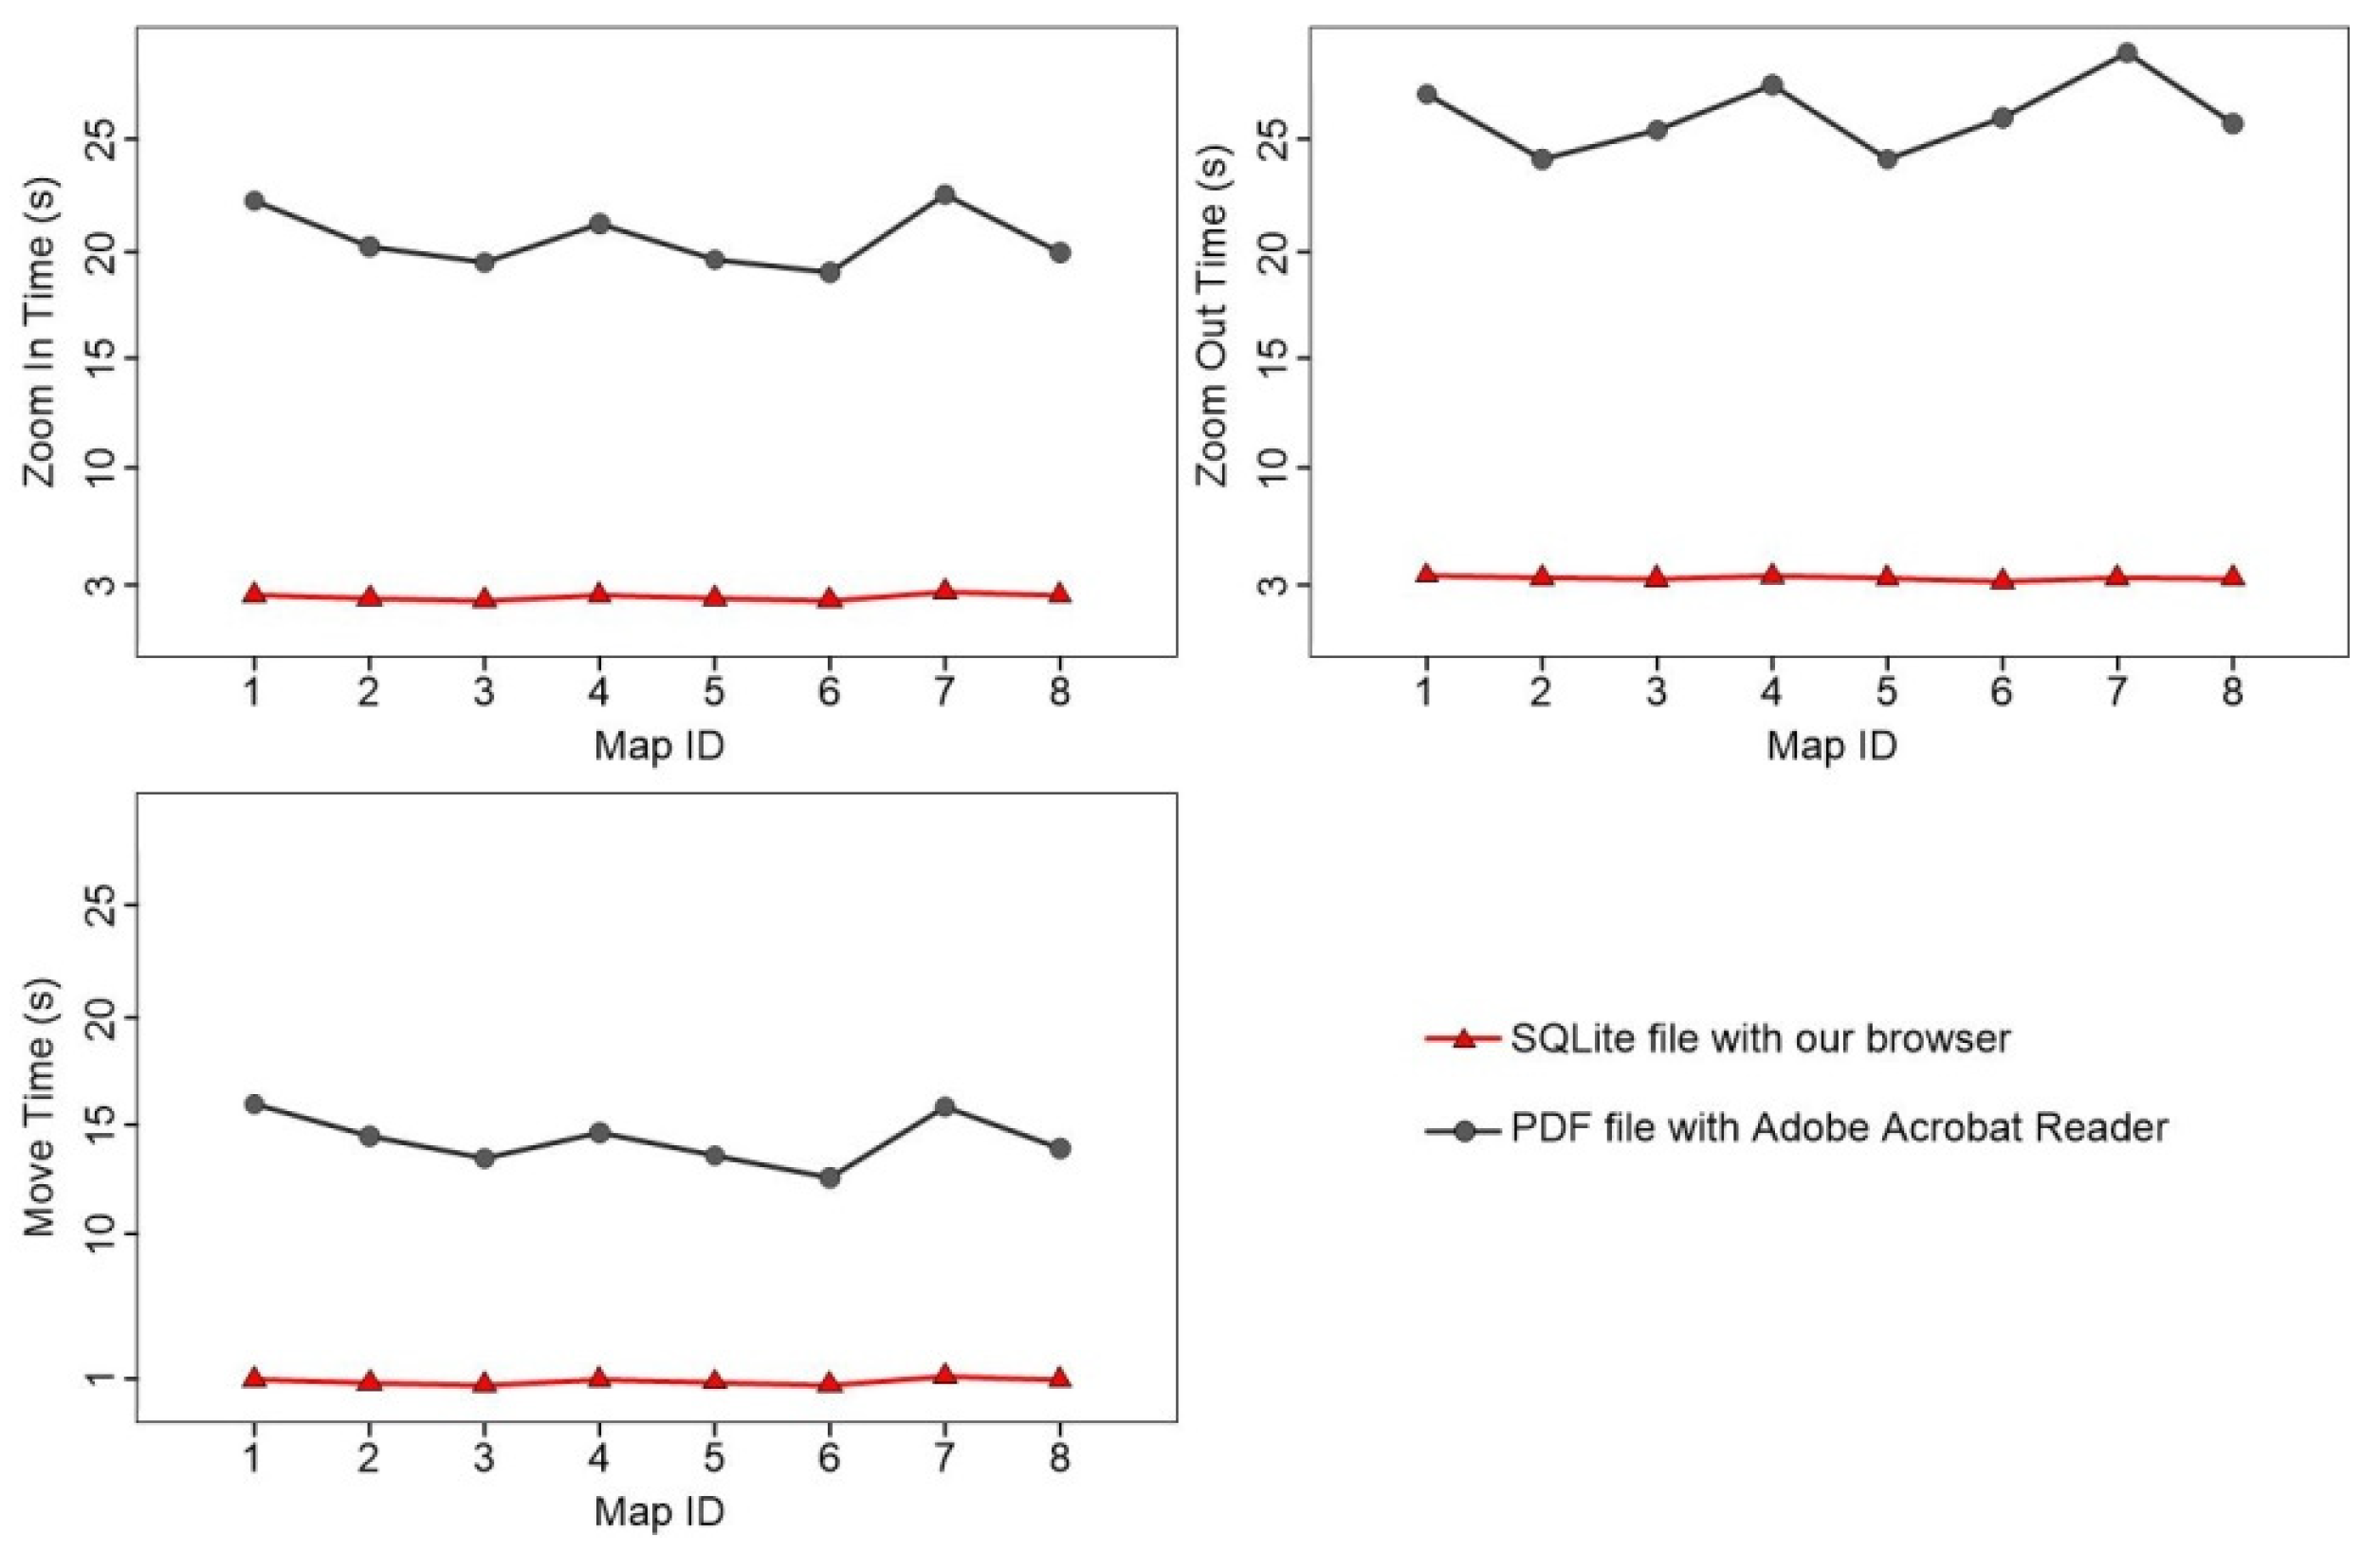
Figure 16.
The clear display effect in the process of map zoom-out.
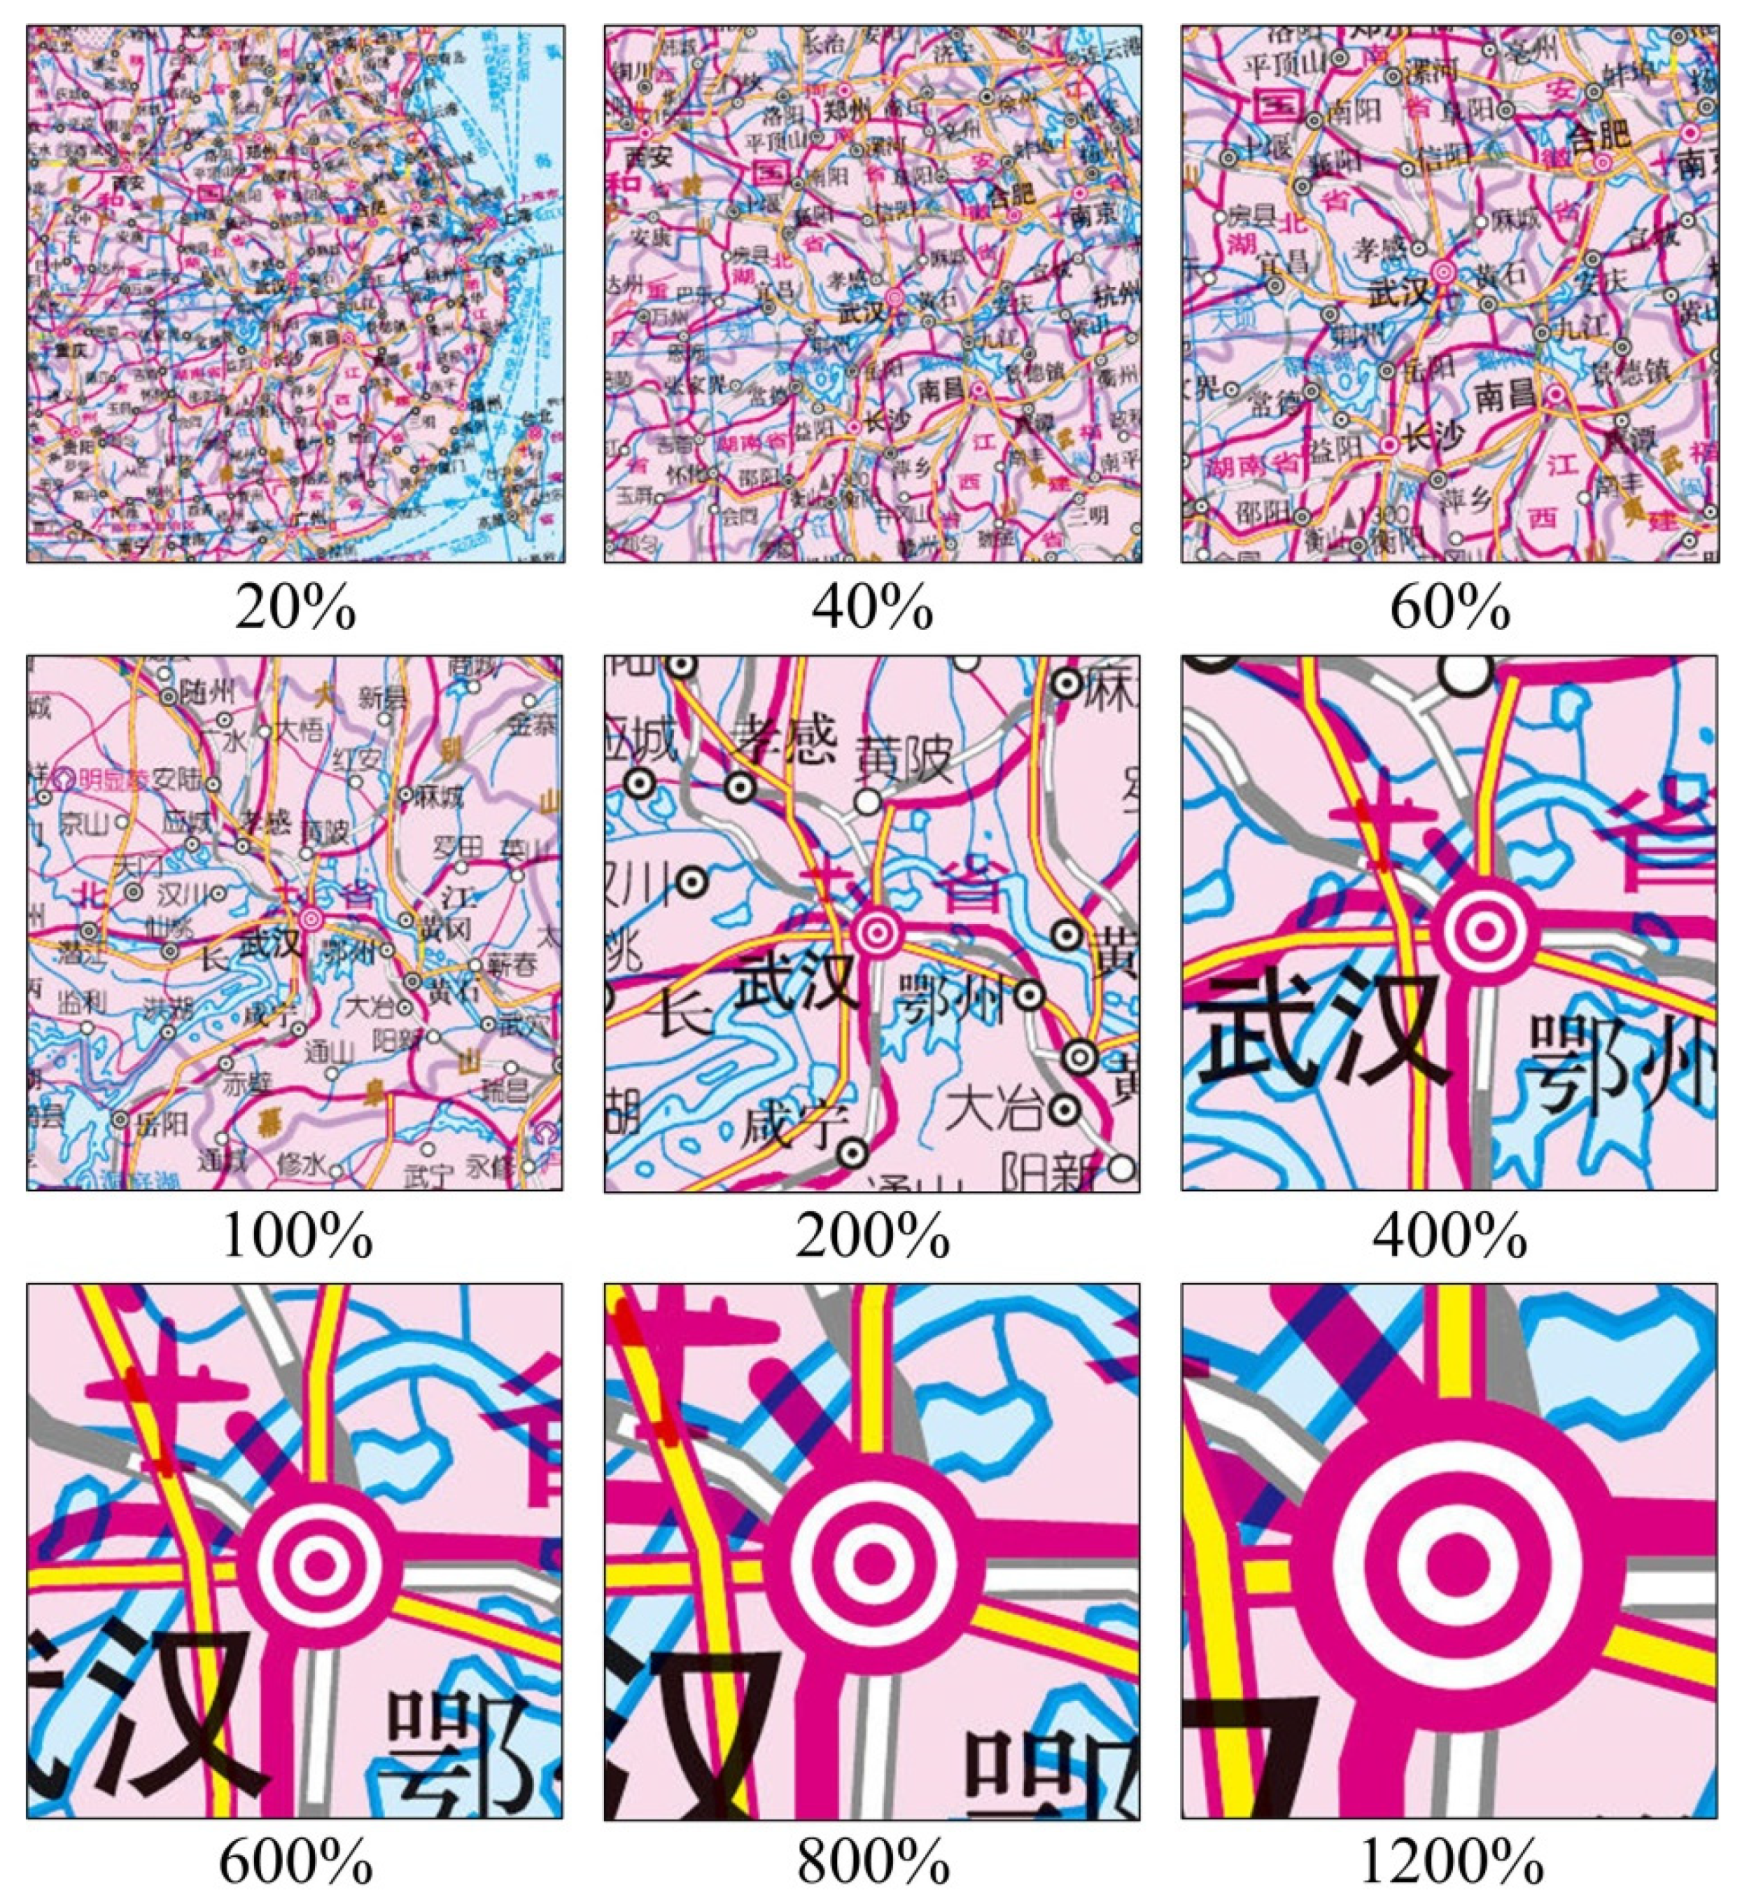
Figure 17.
Map data association retrieval and display.
Disclaimer/Publisher’s Note: The statements, opinions and data contained in all publications are solely those of the individual author(s) and contributor(s) and not of MDPI and/or the editor(s). MDPI and/or the editor(s) disclaim responsibility for any injury to people or property resulting from any ideas, methods, instructions or products referred to in the content. |
© 2024 by the authors. Licensee MDPI, Basel, Switzerland. This article is an open access article distributed under the terms and conditions of the Creative Commons Attribution (CC BY) license (http://creativecommons.org/licenses/by/4.0/).
Copyright: This open access article is published under a Creative Commons CC BY 4.0 license, which permit the free download, distribution, and reuse, provided that the author and preprint are cited in any reuse.


