Submitted:
27 October 2024
Posted:
29 October 2024
You are already at the latest version
Abstract
With the development of the times, the objective requirement of CIM is to establish a 3D digital city. This article proposes a software front-end and back-end open source solution for the production and release of 3D modeling in different industries. This article is based on the construction practice of CIM basic platform database, and analyzes the spatial resolution and corresponding entity expression effect of 3D models in CIM basic platform from the perspective of CIM industry application, as well as the advantages and disadvantages of application. It also elaborates on the classification of 3D models and the geographic elements and buildings they contain, and introduces the relationship between 3D models and vector data, raster data, attribute data, as well as the difficulties of modeling technology. On this basis, large-scale 3D modeling and mapping experiments were conducted in the power industry, water industry, construction industry, and indoormap scene. The article has improved and optimized the algorithms for 3D excavation volume and wire azimuth, and introduced various parametric modeling techniques. From the perspective of project application and user feedback, the modeling quality, performance, and user experience have been recognized by the market. This article has certain reference value for the construction of the 3D model basic framework, theme oriented model system, modeling technology selection, and the release of massive 3D data services in the CIM basic platform construction.
Keywords:
CIM
; GIS
; BIM
; LOD
; Parametric modeling
; indoormap
1. Introduction
A three-dimensional(3D) model is a 3D representation of terrain, landforms, and artificial building structures on the surface and underground, and so on. It can reflect the spatial position, geometric shape, texture, and attributes of objects. City Information Modeling(CIM) is an organic synthesis of urban information in a 3D digital space based on technologies such as Building Information Modeling(BIM), Geographic Information Systems (GIS) and the Internet of Things (IoT). 3DGIS is the technical foundation of the CIM platform and 3D model data is the foundation of the CIM data base [1].
With the emergence of concepts such as digital city, smart city, and city brain and the development of their technologies [2], the 3DGIS data base of CIM basic platform has become the main development trend of new smart city construction The 3D model data base faces a series of technical issues related to the design, production, storage, use, and sharing of 3D models, such as which 3D models to use, what technologies to use for 3D modeling, how to reduce 3D modeling costs, and how to achieve better 3D model application effects. The technologies, methods, and production processes related to DEM, oblique photography, BIM, individual models, point cloud data, and other aspects of 3D modeling have become hot topics in academic research and industrial applications of CIM [3,4,5]. In addition, CIM and the Industrial Internet have a close relationship in terms of data level interaction, sharing and mutual empowerment. CIM focuses more on urban spatial data, while industrial Internet focuses on industrial data. The two can interact and share data at the intersection of the construction industry chain and cities, jointly realizing the digitization of various physical assets.
With the continuous expansion of urban scale and the increasing complexity of urban systems, the demand for CIM infrastructure platforms in countries around the world is still increasing and includes: (1)Police requirements. Different standard constantly improving and gradually becoming standardized. For example, the Chinese industry standard CIJ/T57-2010 in 3D modeling standards, European Standard ISO/TR23262:2021 in GIS/BIM interoperability standards, and international standards such as ISO37170, IEC63273, and ISO37166 in CIM standards;(2) Business requirements. CIM uses different types of heterogeneous data such as BIM+GIS+IOT, which requires solving various data fusion problems. Urban operation data needs to provide full and incremental big data processing capabilities;(3) Functional requirement. The CIM basic platform integrates multi-dimensional and multi-scale historical status information data and perception data of urban surface, underground, and indoor areas, meeting the requirements of refined governance for scientific decision-making [6].
To address these issues, Scholars and companies around the world have been researching CIM for a long time, constantly exploring its data and implementation technologies. At present, global leading GIS commercial companies such as ArcGIS in USA and SuperMap in China have made a large number of industrial level applications of GIS [8,9]. 3dcitydb from the University of Munich in Germany is an open-source 3D city database based on the CityGML standard, used for storing, managing, and querying 3D city model data, and widely used around the world, such as 3D Berlin, 3D New York, etc [10]. Patrick Cozzi is the founder of Cesium and 3D Tiles format, the open geospatial consortium community Standard for streaming massive heterogeneous 3D geospatial datasets. He launched the 3D Tiles Next open specification in 2021 [10] and now his Cesium was acquired by Bentley Systems in 2024 to accelerate the integration of digital twins, CIM and 3D geospatial data, as well as the standardization of Cesium technology. Chinese academician Zhou Chenghu in GIS domain said at the WGDC2024 conference that CIM is based on modern BIM+GIS+IOT to build smart cities, and also needs to develop spatial intelligence technology, full space information systems, and even holographic maps to display the details that people cannot see in a three-dimensional manner, making the earth transparent [11]; Chinese academician Wu Zhiqiang in BIM and CIM domain has started to integrate AI technology into CIM [12].
However, due to the complex application environment and inconsistent standards, although many CIM projects, such as China’s Smart Guangzhou project, have been successfully launched and applied, they still expose many problems:, they still expose many problems:(1) The data sources are too complex, and the demand for realistic dynamic 3D models is increasing. Traditional static 3D data processing methods cannot adapt to this situation;(2) The complexity of various technology stacks leads to maintenance difficulties and poor user experience;(3) The entire lifecycle of software development is too long, and frequent requirement iterations result in software not truly solving practical problems. In order to solve these problems, this article proposes a solution to build a 3D model data base based on the Cesium engine to build a CIM platform, and has conducted long-term project exeperiments of 3D model data in real business scenarios in fields such as electricity, water affairs, construction design, agriculture, and land, We have conducted in-depth work on optimizing the performance of loading 3dtiles files in the browser front-end after converting various 3D models [13]. We hope that this experience can provide some help to relevant researchers.
The contributions of this paper are as follows:
- (1)
- Conducted classification analysis of spatial resolution and classification analysis of geographic object on 3D models;
- (2)
- Innovative application of earthwork volume algorithm and azimuth angle algorithm of wire measurement based on Cesium in mutil CIM projects;
- (3)
- Application of various parametric modeling in Cesium;
- (4)
- Application of BIM+indoormap in CIM project.
2. CIM’s 3D Data Base
2.1. Introduction to CIM’s 3D Data Base
The 3D data base integrates urban GIS data, BIM data, and IoT data to achieve visual management and decision support of urban resources. The architecture of the CIM’s 3D data base include: data layer, service layer, and application layer in Figure 1. It can achieve and form a 3D one map of surface and underground spaces, and providing support in urban planning, design scheme comparison, simulation analysis, and other aspects in almost all government departments and industries [14].
The pain points of the current 3D data base are as follows: (1) Lack of unified data standard formats, mainly including spatial benchmarks, data accuracy, data formats, spatial layers, and attribute fields, etc; (2) Lightweight processing of 3D model data.The volume of 3D data usually reaches the level of GB or TB, resulting in slow loading, long rendering time. 3D model lightweighting refers to removing non geometric information from the 3D model, retaining only the structure and geometric topology of the product, in order to significantly reduce the storage space occupied by 3D files; (3) Level of Detail (LOD) technology. By LOD, we can use a combination of model simplification, cache optimization, and to achieve lightweight processing at the data and code levels, thereby improving the efficiency of data loading and analysis; (4) Multi source fusion and editing processing of 3D data. Fully utilize the characteristics of different 3D data and achieve the fusion of data with different accuracies and scales through combination.
2.2. Classification Analysis of Spatial Resolution of 3D Models
CIM is developed on the basis of GIS and BIM, so the classification of CIM can be considered from two aspects. The development level of GIS and CIM in China is world leading, and we can see the process of integrating and unifying different 3D data modeling standards from the development history of CIM standards in China. In 2010, the Chinese government released the “Technical Specification for Urban 3D Modeling”, which divided urban 3D GIS models in GIS domain into four levels based on presentation details. The LOD1 to LOD4 levels gradually increased with the increase of scale, and the requirements for model accuracy gradually improved and the model performance gradually refined, focusing on the expression of terrain three-dimensional surfaces and solid 3D frameworks. In 2018, Chinese "Standard for Design and Delivery of Building Information Modeling" classified BIM models into four levels of refinement. CityGML is an international standard for city 3D modeling, divided into five levels of refinement. Based on common model objects and features, the four levels of 3D models, four levels of BIM, and five levels of CityGML can be comprehensively compared as shown in Table 1 [15].
In terms of content, Table 2 has further supplemented and deepened Table 1. In Table 2, 1:X is map scale of GIS, GY is geometric accuracy level of BIM and NY is attribute depth level of BIM(500≤X≤10000, 1≤Y≤4). The 7 levels of CIM models includes:(1) The Level 1 model is a 3D symbol generated based on the basic contour and height of the solid object, which can be generated using GIS data; (2) The Level 2 model is the basic model that expresses the 3D framework and surface of a solid, manifested as a "white model" without surface texture. For solids with a side length greater than or equal to 10m, the modeling should be refined; (3) The Level 3 model is a standard model that expresses the 3D framework and inner and outer surfaces of a solid. If the edge length of the solid is greater than or equal to 2 meters(≥2m), the modeling should be refined; (4) The Level 4 model is project level BIM, which is a detailed model that expresses the 3D framework and internal and external surface details of a solid. If the edge length of the solid is ≥0.5m, it should be refined; (5)The Level 5 model is functional level BIM, corresponding to G1~G2 and N1~N2. The surface convex concave structure edge length is ≥0.05m, and the modeling should be refined; (6) The Level 6 model is component level BIM, corresponding to G2~G3 and N2~N3 and ≥ 0.02 m; (7) The Level 7 model is component level BIM, corresponding to G3~G4 and N3~N4 and ≥ 0.01 m.
2.3. Classification Analysis of 3D Models Based on Geographic Objects
From the perspective of data composition, CIM data includes: spatiotemporal basic data, resource survey data, planning and control data, engineering construction project data, public thematic data, and IoT perception data. Among them, the spatiotemporal basic data includes six categories of 3D models: digital elevation model, architecture, water conservancy, transportation, pipeline gallery, vegetation, geology, etc. They can be modeled according to the LOD1-4 requirements specified in CJJ/T157 standard, or according to the 1-7 requirements in Table 2 [6]. BIM is the cellular unit of CIM, and city level CIM is formed by combining BIM from various industries. Omniclass and Uniclass are currently the mainstream coding systems for the entire lifecycle of BIM construction in USA and both use surface classification to decompose the content related to the construction process into multiple dimensions, and use line classification to hierarchically decompose concepts within each dimension. According to their design concepts, the 3D data base is classified from five dimensions: achivement, process, resource, characteristic, and application, as shown in Figure 2.
3. Methods and Technologies
3.1. 3D Data Acquisition, Production, Conversion, and Processing Technology
There are various channels for collecting 3D data, including basic surveying, manual modeling, AI generated building models, and access to publicly available resources on the internet, as shown in Table 3. Different types of GIS data require corresponding hardware devices to collect, and the files in this format also need corresponding GIS software to display. If Cesium engine is used, data conversion tools are required to convert the specified data into the corresponding tile set [16].
3.2. 3D Model Rendering Technology Based on Cesium in the Front-End
Cesium is an open-source JavaScript library based on WEBGL encapsulation, designed to create interactive 3D map applications using data in various geographic spatial formats. Cesium supports loading graphics language transmission format(gltf), which is a format used to store 3D models and scenes. The core of gltf is a JSON file that contains a complete scene description and is defined by referencing the grid through scene nodes. It includes: node hierarchy, materials, cameras, meshes, animations, skinning, and so on [17,18,19].
The Cesium engine created the 3DTiles format based on gltf, which is a development specification for streaming large-scale heterogeneous 3D geospatial datasets. The 3DTiles format is a hierarchical model organized in a tree structure, and its 3D space partitioning algorithms include k-d trees, quadtrees, octrees, grids, etc. When a 3D space is divided into multiple subspaces, each subspace is stored as a sub node of the spatial node, and the geometric information (bounding volume) of the spatial range is stored in the node. We call nodes tiles, and all nodes make up tiles [20].
The architecture of the Cesium engine is divided into five parts from bottom to top, namely the core layer, scene layer, primitives layer, source layer, and viewer layer. The upper layer modules depend on the functionality provided by the lower layer, and at the same time, the upper layer modules encapsulate and abstract the upper layer at a higher level. The primitives layer of Cesium provides two types of APIs in spatial data visualization. One is a primitive API in low-level, implemented through the primitive class for those developers who are familiar with computer graphics interface; Another type is an advanced API through the Entity class Only primitive developers can achieve custom graphic class by customizing geometry and appearance.
3.3. Backend GIS Map Service Publishing Technology
These technologies include data preprocessing, spatial database technology, and GIS service publishing technology. If an open source solution is used, Geoserve can consider publishing OGC standard WMS/WMTS/TMS for GIS raster mapping and vector data stored in PostGIS. The 3dtiles service can be stored in files or MongoDB.
3.4. Algorithm Design and Applicaiton in GIS
GIS related algorithms are generally used in data processing and modeling. Here, we will introduce two algorithms based on Cesium in CIM project.
3.4.1. Algorithm for Azimuth Angle of Wire Measurement
The experiments will be conducted in the fields of smart construction, transmission line inspection, and smart water management in the next chapter. Almost all of them will encounter the problem of finding the azimuth angle using a set of spherical coordinate points, such as the layout of the geological survey rock sampling points and the orientation of transmission line towers. Here is a general algorithm introduced.
Definition 1.
The azimuth angle is the horizontal angle between the direction line pointing north from a certain point and the target direction line in a clockwise direction in Figure 3. Given the latitude and longitude of three consecutive directional adjacent points A, B, and C, then β=∠ABC is called the connection angle in Figure 3. The threshold range is [0, 180], and the size is the internal angle of the vertex B of triangle ABC. If β is on the left side of t BC edge, then it is the left corner; otherwise, on the right side, it is the right corner. If the projection plane coordinates of A, B, and C are A(x1,y1), B(x2,y2),C(x3,y3), then β=arccos((BA*BC)/(|BA|*|BC|)). Regarding the calculation of the left and right directions, first obtain the linear equation ax+by+c=0 based on points B and C. Then, substitute A(x1,y1) to see if it is greater or less than 0 to determine. If the azimuth angle of the point A is αback, then the formula for the azimuth angle of the point B is:
Here the default value for n is 1. if β is the left corner, take the + sign; otherwise, take the - sign.
NEU coordinate system is essentially a variant of Cartesian coordinate system, while spherical coordinate system uses parameters such as latitude and longitude to describe points on the Earth’s surface Figure 4 (b), which leads to overly complex transformations. The Cesium engine supports the conversion between WGS84 global coordinates and NEU local coordinates, as shown in Figure 4 (a).
3.4.2. The Earthwork Algorithm
The key technical point here is to use Cesium to sample the surface elevation of oblique photography or BIM 3dtiles layer in Figure 6 [24]. The user must draw an area of interest(AOI) on the map and set a an elevation value as the horizontal reference plane for filling and excavation. The earthwork algorithm is as follows: (1) The granularity feature of Cesium’s PolygonGeometry can be used to partition AOI into specified small triangles based on preset precision, and construct a geometric structure similar to a mesh and subsequently obtain the elevation values of each point based on 3D tiles; (2) Set the elevation value of the reference plane mentioned above to h. Choose any surface triangle with vertex elevations of a, b, and c, so that the base area of this approximate triangular prism is s. The formula for calculating the volume of a triangular prism is v=s*h, which gives the volume of approximate triangular prism: v=s*(a-h+b-h+c-h)/3; (3) The current AOI excavation volume is the sum of the volumes of each composed triangular prism, such as V=v0+v1+...+vn.
Figure 5.
(a) The overview diagram of the hydropower project;(b) Excavation surface.
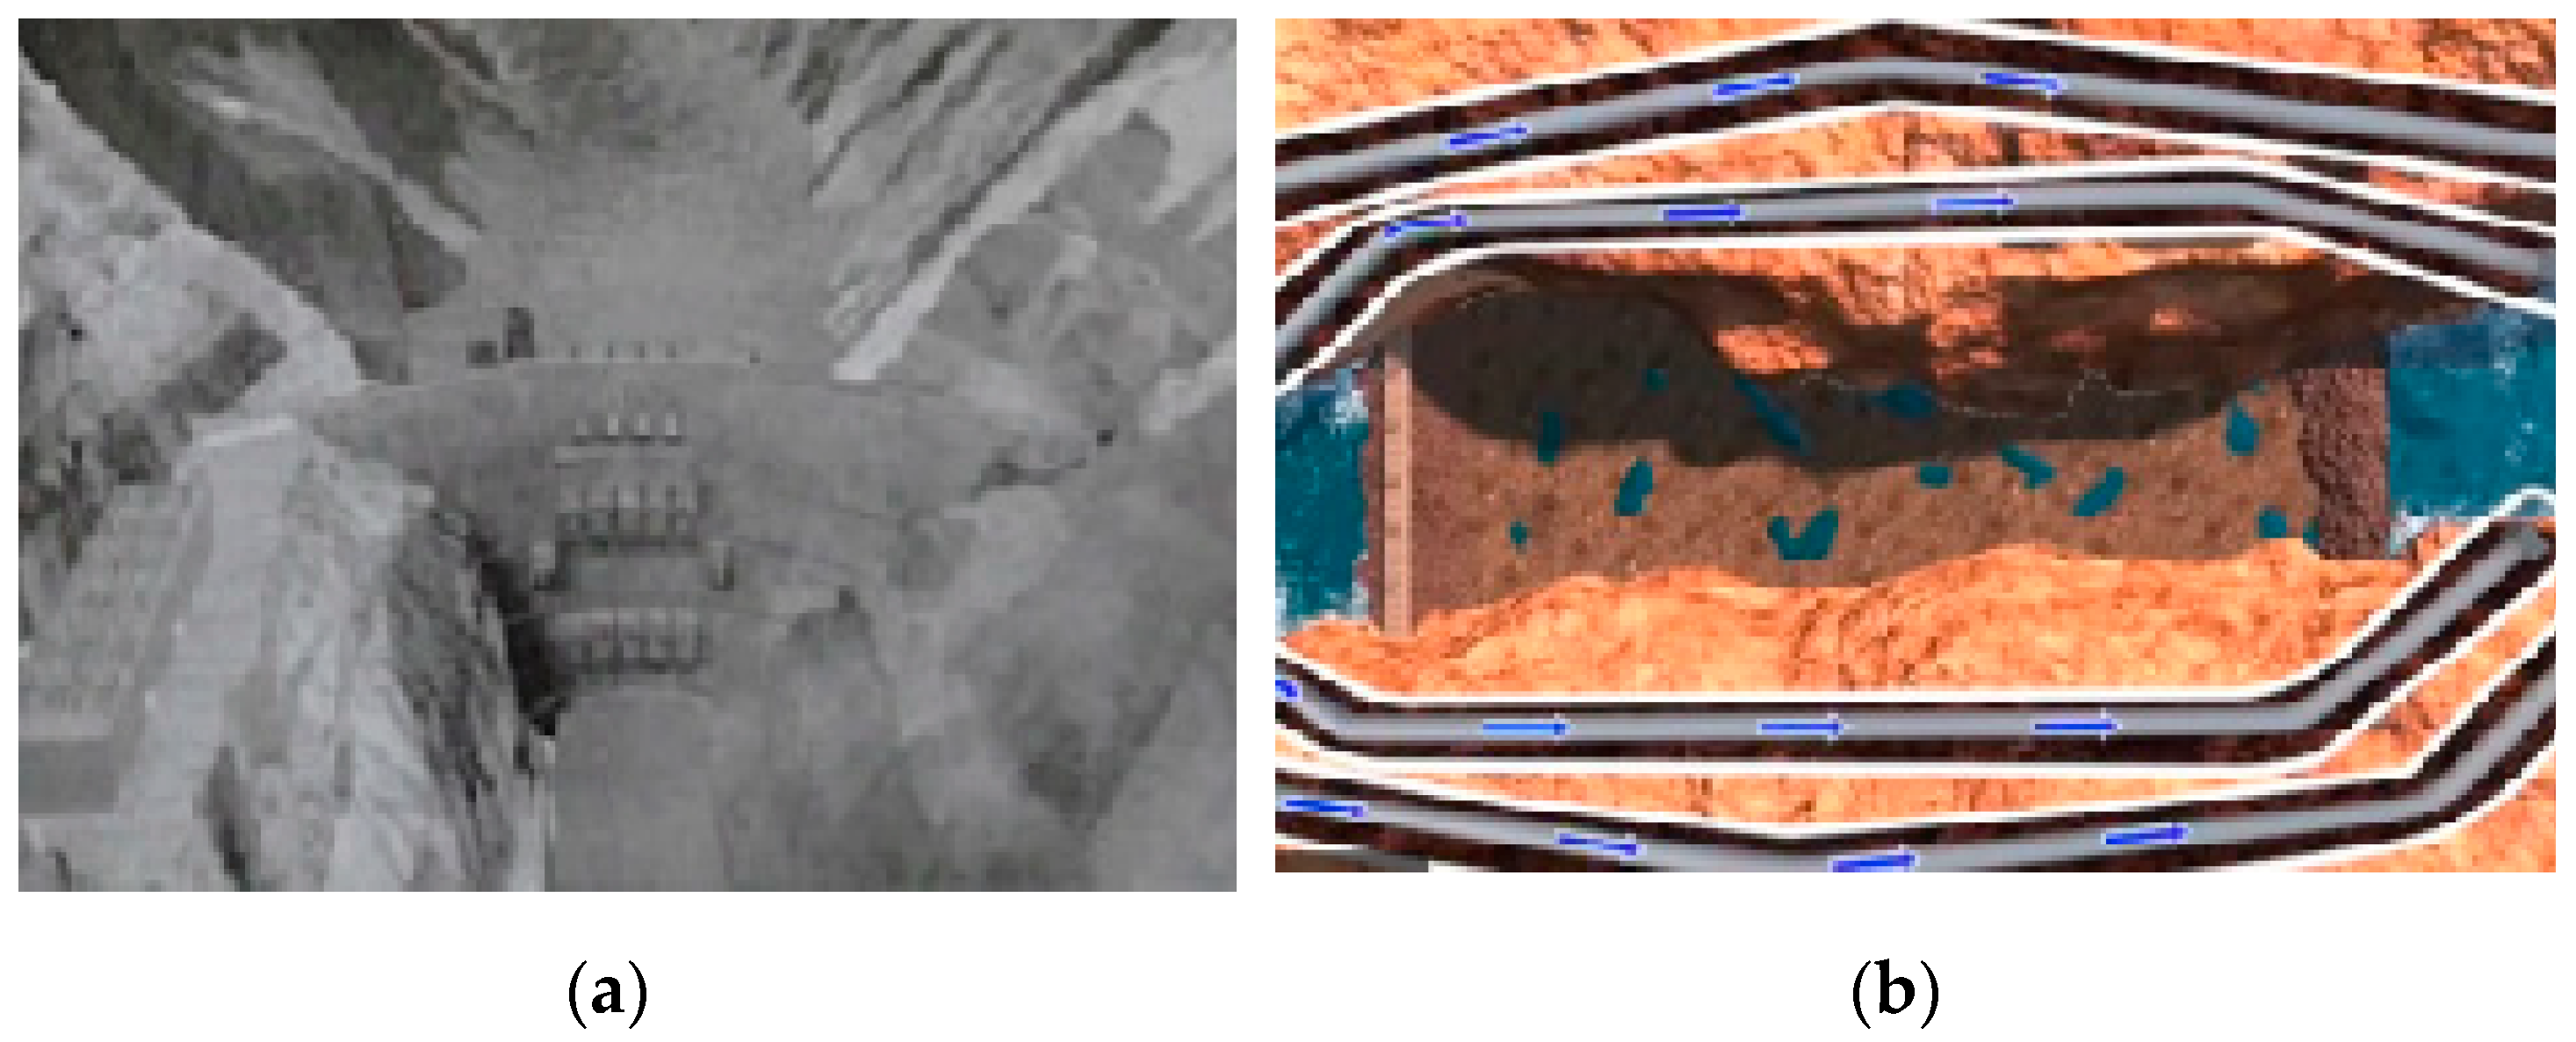
Figure 6.
(a) Decompose into several triangles;(b)calculate volume;(c)Actual 3D rendering effect.
4. Experiments
The following are the results of the author’s research and application on 3D modeling and massive 3dtiles data rendering based on Cesium in smart construction industry, smart power industry, smart water industry and indoormap scene.
4.1. Calculation of Earthwork Volume in Smart Construction Industry
4.1.1. Exepriemnent Background of Smart Construction
Smart construction site is the precise design and construction simulation of engineering projects through a 3D design platform, focusing on construction process management and achieving full lifecycle management of the project [21]. This is a construction project for a hydroelectric dam, as shown in Figure 5. The technical architecture of this project adopts BIM+GIS+IOT [22], where the BIM model and oblique photography data are provided by the hydroelectric design institute.These data are updated once a month [23].The engineering party needs to obtain the current excavation volume and estimated future excavation volume of an AOI after construction. In this article, AOI is excavation surface.
4.1.2. Experimental Environment and Results of Smart Construction
Using the earthwork algorithm in 3.4.2, we can obtain the completed excavation volume by calculating the difference between the excavation volumes on any selected two months’ oblique photographic base maps using the same AOI, as shown in Figure 7. Refer to this idea, BIM can also be converted into 3dtiles so that we can obtain an estimated excavation amount by calculating the difference of the excavation amount based on the same AOI between the month’s oblique photography 3dtiles and the separately existing BIM 3dtiles, as shown in Figure 8 [25,26,27].
The machine hardware configuration is a desktop computer with 16GB memory, i7 dual core CPU, 6G VRAM independent graphics card. Regarding software, the browser is Google, the operating system is 64 bit Windows 10 and the version of Cesium is 1.93.The total size of the 3dtiles file set for all months is close to 100G. The monthly data volume is up to 4GB, so that the system loads them slowly and is prone to cause the browser to crash when there are many interactive operations. We spent six months simplifying the 3D model file and optimizing the algorithm to ensure that the earthwork calculation can be used normally. The comprehensive solution of controlling the size of AOI sampling points and independently loading 3dtiles in small windows finally solved the performance problem of delaying computation time.
4.2. 3D Visualization Operation and Inspection of Transmission Lines in Smart Power Industry
4.2.1. Exepriemnent Background of Smart Power Industry
At present, transmission lines mainly rely on manual inspections and visualized online IOT monitoring and control [28,29]. Traditional measurement and inspection methods are no longer sufficient for real-time condition measurement of power lines, as well as complex environments such as mountains, valleys, deserts, and large-scale measurement work. The State Grid Corporation of China in Lanzhou city, Gansu Province, has replaced manual inspection with unmanned aerial vehicle(UAV) inspection of transmission lines.The real-time point cloud data collected by UAVs can be overlaid on the 3DGIS platform. Here we will introduce the 3D visualization technology of transmission lines on the 3DGIS platform of the power grid, as shown in Figure 9.
The transmission line is mainly composed of towers, conductors, ground wires, insulators, fittings, etc. The tower, insulator, and fittings are artificial models made by 3DMAX software, and different types of insulators and fittings can only be optionally attached to the tower, as shown in Figure 10 (a).The latitude and longitude positions of the tower are provided by the demander, but the azimuth angle value of the tower’s orientation in Cesium are calculated by the developer themselves in Figure 10 (b).
According to Definition 1 in 3.4.1, We set A,B,C to be 3 adjacent towers and set n=2, then β/2=0.5β represents taking half of the connection angle so that the orientation of the middle tower can balance the upstream and downstream angles. For example, α23 =α12 +180○-0.5β2 and α34 =α23 +180○+0.5β3 because β2 is right corner and β3 is left corner in Figure 3.
4.2.2. Experimental Environment and Results of Smart Power
The hardware environment is the same as 4.1.3. The experimental data includes 100000 towers and 500 transmission lines from Gansu Province, China.The performance optimization process has three stages: (1) The Entity model loading can only load a maximum of 300 towers and corresponding wires but can’t solve poor interactivity; (2) Using primitive API language loading could reach up to 500 towers and has poor performence; (3) A customized power tower 3dtiles tool solution has been created to completely solve the performance problem of massive data loading. This method first creates a two-dimensional shape file containing latitude, longitude, elevation, and azimuth fields, and then converts it into 3dtiles.
4.3. Parametric Modeling for Underground Pipeline Network of Smart Water Industry
4.3.1. Exepriemnent Background of Smart Water Industry
Urban underground pipeline network is an important infrastructure, which has the characteristics of large scale, wide range, diverse types, complex distribution, and large change. 3D pipeline networks has many advantages that traditional 2D pipeline networks cannot match in complex spatial position relationships, spatial topology relationships, symbol richness, and fidelity [30].
The project comes from a water company in China, which provided CAD drawings and actual verified pipeline point coordinate data and request the creation of a 3D water supply network system. The characteristics of pipeline network data are different from those of transmission lines, the former is dense, while the latter is very sparse.
4.3.2. Experimental Environment and Results of Smart Water Industry
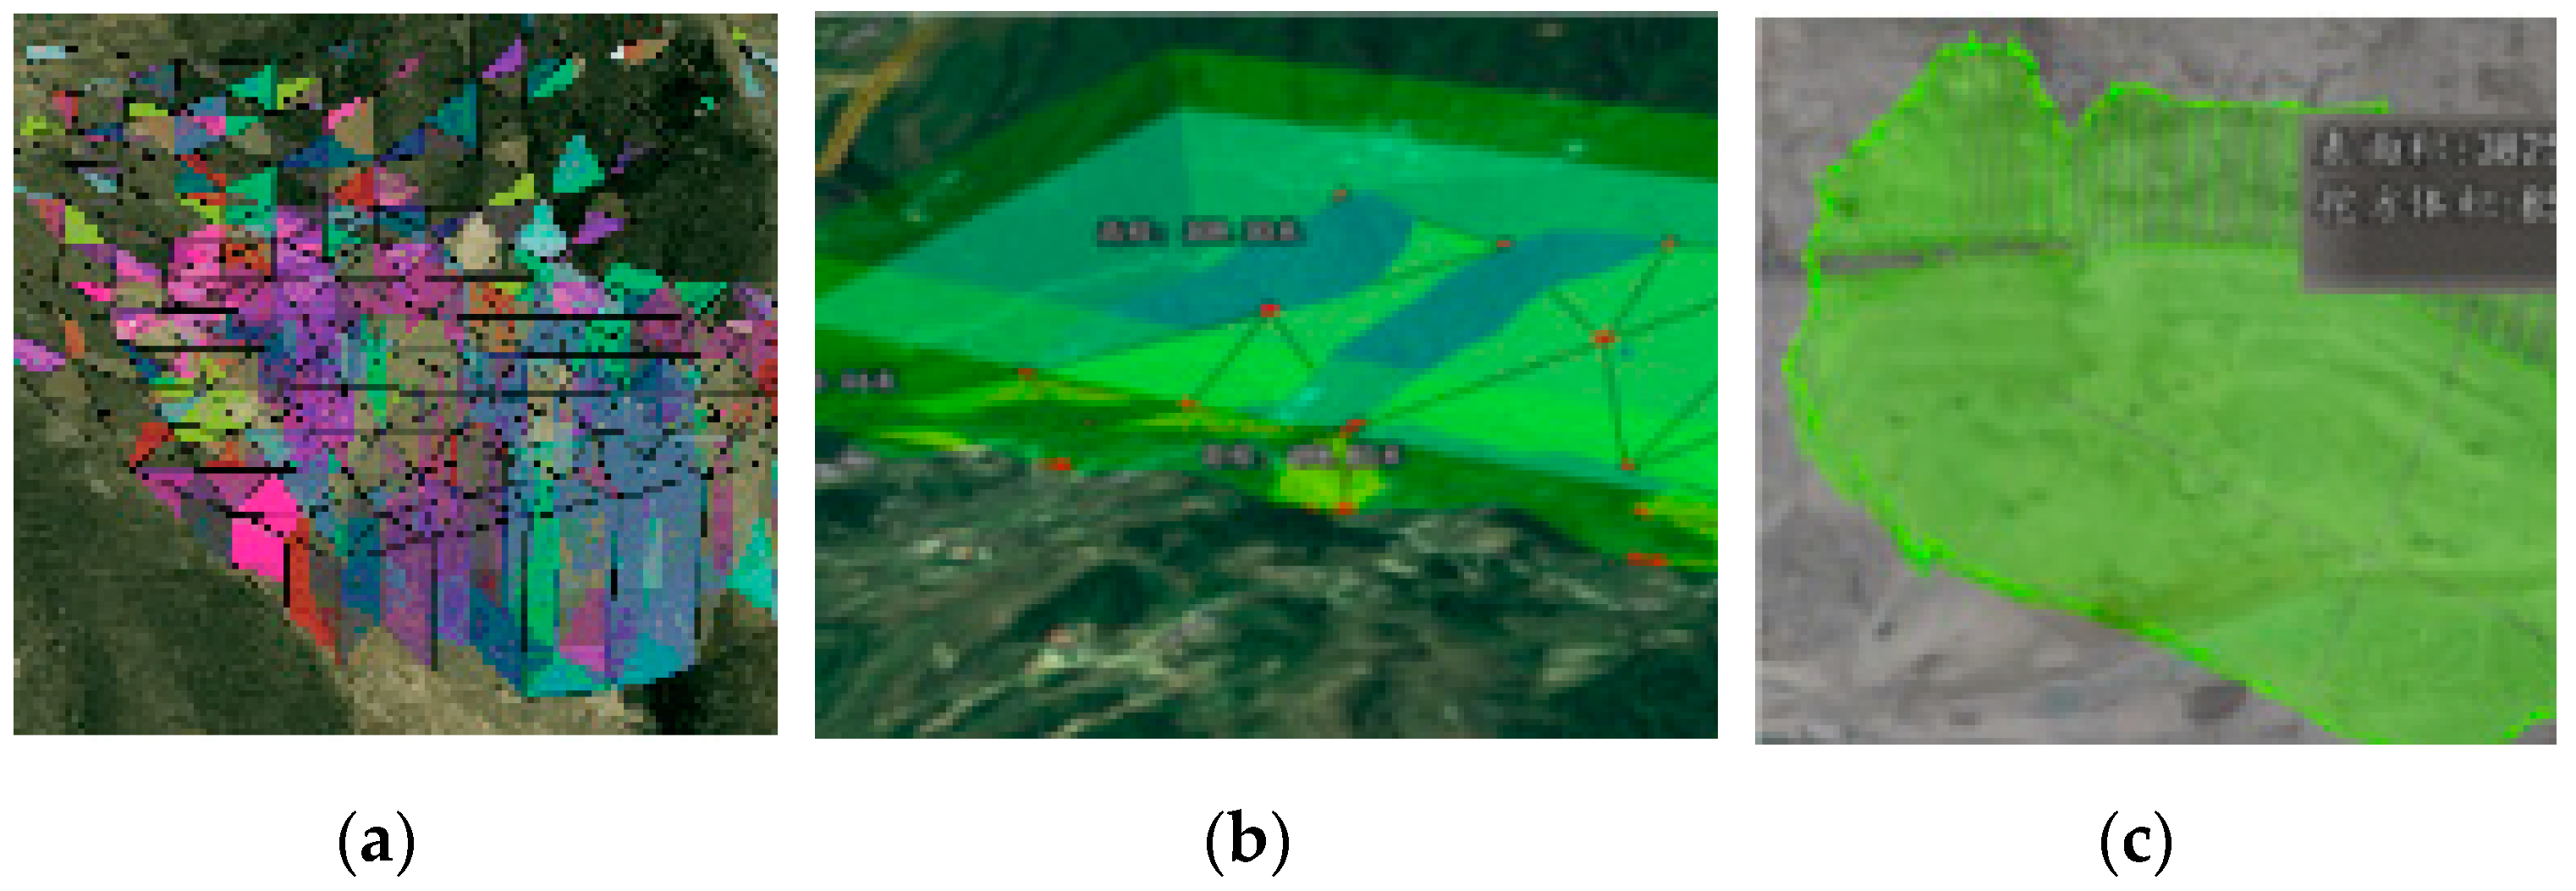
The hardware environment is the same as 4.1.3. The amount of experimental data is too large, exceeding 100 points.We only extracted nearly 5000 points for the analysis experiment of water pipe burst and valve closure [31,32]. We first generated pipeline layer based on the pipe point layer, and then stored them in PostGIS database.The map server adopts Geoserver and the front-end uses the primitive API to load geojson data pushed by the server. This type of brute force loading rarely loads successfully, and even if it unexpectedly loads successfully, WEBGL may encounter various exceptions during the interaction process, as shown in Figure 11 (a).
Finally, we adopted a pipeline automation modeling tool to generate 3D tiles to solve the performence problem of massive data.The business tool can refer to SuperMap iDesktopX 11i’s pipeline modeling tool [9]. If you choose OSG for custom development, you need understand some logical rules for tile generation [10]. Firstly, it should be clarified that the pipe network 3dtiles is created based on the two-dimensional shapefile. Shapefile data mainly includes point features and line features, which respectively store the spatial geographic location and attribute information of pipe network nodes and pipelines. The specific generation process is to first classify and process the two-dimensional data into a quadtree structure relationship. Then, by traversing the two-dimensional data, the point and line features are processed separately for tile by tile transformation matrix calculation and model construction. After replacing each geometric feature with a standard model, the features are encapsulated into a b3dm model, and the tileset.json files are updated separately; Finally, export the tileset.json file containing model information and the tree structured tiles folder to obtain the 3D tiles model data for pipe points and pipelines, respectively, as shown in Figure 11 (b).
4.4. 3D Indoormap
4.4.1. Exepriemnent Environmnet of 3D Indoormap
Compared with outdoor maps, indoor maps have three prominent features:①The overall enclosed space;②The internal layout is complex and easily obstructs people’s view;③Special accessibility conditions, no explicit roads, generally using elevator staircase doors as nodes. There are two modes for 3D indoor mapping, one is to directly use the 3dtiles converted from Revit, and refer to the properties of the reference features to achieve the display and hiding of different floors, as shown in Figure 12 (a). Another way is to directly use geojson pushed from the server-side for real-time drawing, as shown in Figure 12 (b).
4.4.2. Experimental Environment and Results of 3D Indoormap
The hardware and software environment is the same as 4.1.3. A certain project scenario is in a tunnel or underground cavern, and the construction party requires a display of the completed engineering model of the construction progress and a dynamic simulation of the construction model for prediction in a certain time interval [33]. BIM overly displays construction details and cannot highlight the POIs, roads, hubs and doors that users are most concerned about. 3dtiles supports global data display but severely occludes key POIs. Finally, BIM+indoormap was used to solve this problem:①Create dynamic three-dimensional height or length growth of construction project within the specified start and end time by the user;②The graphical linkage brought about by the generalization and specialization of attribute data support;③ Supports IOT data alarm highlighting, video, and two-dimensional chart overlay analysis display. Indoor map data is vector, often layered and segmented, with a large quantity, and the amount of individual data is not large. It is necessary to define a specific data structure based on business scenarios for storage [34,35].
4.5. Performance Tuning Optimization Experiment
The hardware and software environment is the same as 4.1.3. There are two types of experimental data, namely oblique photography model and BIM model, each with an overall number of triangular facets exceeding 10 million. The experimental objectives mainly focus on the impact of changing max screen space error(MSSE) parameters and reducing resolution scale(RS) on rendering performance.
Cesium utilizes a detail hierarchy level of detail(HLOD) to control the loading of 3D tiles in 3D tile sets [10]. Each set of 3D tiles and the 3D tiles within it must have a geometric error(GE) attached, representing the size of the tile set or tile. At runtime, the screen space error(SSE) is calculated based on the angle of view (FOV) and distance of GE and the camera. When SSE is less than MSSE, tiles at that level are not loaded. Due to the inverse relationship between distance and SSE, some tiles with smaller GE do not load when the distance is far. Meanwhile, the HLOD mechanism is applied when selecting rendering tiles. Even if a tile has already been loaded, when its SSE is less than MSSE, it will not be selected for rendering, but the parent node with a larger SSE will be selected. Therefore, when increasing MSSE, the rendering efficiency can be improved by reducing the graphic refinement of non essential positions. However, due to the varying rendering loads at different camera positions and the presence of multiple tile sets rendering simultaneously, it is difficult to determine the appropriate MSSE for each tile set. Setting the RS of the view viewer can modify the screen resolution of Cesium. This resolution adjustment can directly affect the size of the canvas components that Cesium depends on, thus rendering more or fewer pixels [10].
The experiment was divided into four groups: the RS of the first three groups are all equal to 1 and but their MSSE are different each other, Only RS of the fourth group is equal to 0.1. The other parameters of all are set by Cesium default.
In Figure 13, increasing MSSE from 8 to 96 has a relatively small effect on improving frame rate, but increasing it to 320 has a greater effect on improving frame rate. Example verification shows that if the MSSE value increases, it can make the final image blurry and the quality worse, even though the loading speed is faster. During this period, it is possible to stop loading graphics and cancel shadow calculations. At the same time, improving MSSE and reducing RS can all improve Cesium’s performance.
5. Discussion
In this study, we conducted research and application on 3D modeling and rendering on CIM Basic Platform in Cesium Engine. The overall software architecture includes business front-end, Geoserver, Tomcat, and PostGIS [36]. We have done the following main tasks. (1) In various industry system applications of CIM, various types of 3D data are integrated, such as DEM, city white mold data, BIM data, oblique photography data, point cloud data, panoramic data, etc; (2) We have explored the deep application of the fusion of 3D tiles in BIM+GIS. The entire software solution has been deeply applied in the power industry, water industry, and construction industry. We conducted long-term experiments on 3D modeling and rendering based on real massive data, and achieved industrial level mature application results. (3) By combining coordinate transformation, customized GIS algorithms have been designed in multiple industries to solve practical problems, such as the calculation algorithm for earthwork volume, the calculation of tower azimuth angle for transmission lines, and the layout of survey boreholes for geotechnical engineering construction; (4)We conducted pioneering project experiments based on Cesium in BIM+indoormap scene.
Based on this research, we have identified three areas that need improvement in future work:(1) The problem of saving 3D model data in 3dtiles that cannot be modified in the front-end requires the creation of a one-stop automated data production business process of front-end back-end conversion tools to achieve immediate effectiveness of 3D model modifications; (2)The maturity of the deep integration application level solution of BIM+Indoormap based on cesium is still being explored and verified. It can solve the problems of public static 3D data and dynamic personalized indoor 3D data in their respective fields;(3)Using VR, AR, AI technology in 3DGIS projects. VR/AR has been used in the inspection of insulators/fittings for transmission line and power tower inspections, as well as in real-time monitoring of underground pipelines. Multiple machine learning algorithms and deep learning based neural network algorithms have been employed in remote sensing image recognition and point cloud data processing [37,38].
6. Conclusions
CIM is an important technological approach for building new smart cities, and the 3D basic geographic base platform is the foundation of CIM [39]. From the perspective of 3D modeling technology, there are currently mainly 3D wireframe modeling, surface modeling, and solid modeling. On the basis of solid modeling, technologies such as feature modeling, parametric modeling, and hybrid modeling have also been developed. In the future, 3D modeling methods and technologies in CIM will also make greater progress in the following four areas:
- The further development of BIM, shifting from simple geometric models to information models that combine business data and geometric models;
- The application of AI technology in 3D model analysis enables 3D models;
- The integration of 3D digital technology and multi-source data;
- The further development of the standardization level of 3D model data.
CIM is not only GIS+BIM+IOT, but also integrates cloud computing, big data, AR.VR, edge computing, AI, blockchain, etc., so as to realize the interconnection of everything, data fusion, collaborative management, and innovative development of the city.The 3D applications based on cesium in CIM can be applied in urban planning, land use, transportation, tourism, municipal administration, public security and other fields. With the continuous advancement and breakthrough development of multi terminal 3D rendering technology, better and more 3D application results will continue to be optimized and improved.In the future, with the continuous improvement of various new technologies including 3DGIS and LBS, CIM will promote the transformation of cities towards intelligence and provide more accurate and convenient services for people living in cities [40,41,42].
Author Contributions
Conceptualisation, Hong Li; methodology, Hong Li; validation, Hong Li; writing—original draft, Hong Li; writing—review and editing, Hong Li; supervision, Hong Li; project administration, Hong Li; funding acquisition, Hong Li. All authors have read and agreed to the published version of the manuscript.
Funding
This research was supported by doctoral fund of Guangdong University of Science and Technology “Research and Application of Spatial Data Mining Based on Digital Twin Cities” (GKY-2023BSQD-45), and school level fund of Guangdong University of Science and Technology “Guangdong University of Science and Technology Smart Campus Full Space 3D Visualization” (GKY-2023KYZDK-4).
Data Availability Statement
Engineering data is confidential by the state and cannot be provided but we can provide test data of 3dtiles..
Acknowledgments
In this section, you can acknowledge any support given which is not covered by the author contribution or funding sections. This may include administrative and technical support, or donations in kind (e.g., materials used for experiments).
Conflicts of Interest
The authors declare no conflicts of interest.
References
- Chi, C.; Qu, X.; Yang, J. Construction and Application of CIM Development Support Platform Based on 3D Digital Base. China’s construction of informatization 2021, 22, 76–78. [Google Scholar]
- Guo, H.; Michael, F. Michael F. In Alessandro Annoni. Manual of Digital Earth; Springer: Singapore, 2020. [Google Scholar]
- Quattrochi, D.A.; Michael, F. Goodchild. In Scale in Remote Sensing and GIS; CRC Press: USA, 1997. [Google Scholar]
- Ying, S. 3D cadastral modeling technology; Science Press: Beijing, China, 2023. [Google Scholar]
- Guo, L. The Development and Application of 3D Reality Technology; Science Press: Beijing, China, 2019. [Google Scholar]
- Zhou, C. CIM Application and Development; China Electric Power Press: Beijing, China, 2021. [Google Scholar]
- Using ArcGIS CityEngine in real-world scenearios. Available online: https://learn.arcgis.com/en/paths/discover-arcgis-cityengine-real-world-scenarios/.
- SuperMap iDesktop. Available online: https://www.supermap.com/zh-cn/a/product/gis-idesktopX-2024.
- Semantic 3D City Model of Berlin. Available online: https://www.3dcitydb.org/3dcitydb/visualizationberlin/.
- Introducing 3D Tiles Next, Streaming Geospatial to the Metaverse. Available online: https://cesium.com/blog/2021/11/10/introducing-3d-tiles-next/.
- Zhou, C. Geographic research driven by big data and artificial intelligence. Proceedings of WGDC2024 13th World Geographic Information Developers Conference, Beijing, China, 15 May 2024. [Google Scholar]
- Interview with Academician Wu Zhiqiang: Consolidating the CIM data foundation and building an intelligent network. Available online: https://baijiahao.baidu.com/s?id=1787768985924728825&wfr=spider&for=pc.
- Zhang, H. 3D GIS Technology and Practice Tutorial; Wuhan University Press: Wuhan, China, 2023. [Google Scholar]
- Sepasgozar, S.; Shirowzhan, S. Digital Twin Adoption and BIM-GIS Implementation; Routledge: London, UK, 2024. [Google Scholar]
- Wang, Y.H.; Yao, L.; Chen, S.Q.; Bao, S.T. Research on levels and classification of city information model. JOURNAL OF GRAPHICS. 2021, 52, 995–1001. [Google Scholar]
- Jack, D.; Michael, F. Goodchild. Building geospatial infrastructure. GEO-SPATIAL INFORMATION SCIENCE 2020, 23, 1–9. [Google Scholar]
- Zhu, J. Spatial information visualization; Science Press: Beijing, China, 2023. [Google Scholar]
- Wu, L. spatial data visualization; Science Press: Beijing, China, 2019. [Google Scholar]
- Ibrahim, B.M.; Hisham , E.M.; Hidi, E. Youssef. 3D-GIS Parametric Modelling for Virtual Urban Simulation Using CityEngine. Annals of GIS 2022, 28, 325–341. [Google Scholar]
- Wang, H.; Hu, Z.; Zhao, Y. Approaches Improving Cesium Rendering Performance for Displaying Massive 3D Models. Journal of Information Technology in Civil Engineering and Architecture 2023, 15, 22–27. [Google Scholar]
- Deng, X. Construction and Application of Smart Guangzhou Time Space Information Cloud Platform; Electronic Industry Press: Beijing, China, 2021. [Google Scholar]
- Cho, J.; Kim, C.; Lim, K.J.; Kim, J.; Ji, B.; Yeon, J. Web-based agricultural infrastructure digital twin system integrated with GIS and BIM concepts. Computers and Electronics in Agriculture 2023, 215, 108441. [Google Scholar] [CrossRef]
- Zhu, X.; Yang, H.; Bian, H.; Mei, Y.; Zhang, B.; Xue, P. Multi-Scalar Oblique Photogrammetry-Supported 3D webGIS Approach to Preventive Mining-Induced Deformation Analysis. Applied Sciences 2023, 13, 13342. [Google Scholar] [CrossRef]
- Tang, G.; Li, Y.; Liu, X. Digital Elevation Model Tutorial; Science Press: Beijing, China, 2010. [Google Scholar]
- Wang, X.; Xie, M. Integration of 3DGIS and BIM and its application in visual detection of concealed facilities. Geo-spatial Information Science 2024, 27, 132–141. [Google Scholar] [CrossRef]
- Zhang, S.; Hou, D.; Wang, C.; Pan, F.; Yan, L. Integrating and managing BIM in 3D web-based GIS for hydraulic and hydropower engineering projects. Automation in Construction 2020, 112, 103–114. [Google Scholar] [CrossRef]
- Pallante, L.; Pallante, P.; Meriggi, P.; D’Amico, F.; Napolitano, A.; Gagliardi, V.; Paolacci, F.; Quinci, G.; De Felice, G. Proposal of a GIS and BIM based structured database for bridge management digitalization. Procedia Structural Integrity 2024, 62, 268–275. [Google Scholar] [CrossRef]
- Chang, Z.; Ma, C.; Gao, X.; Qu, M.; Li, D.; Xiao, F.; Zhu, B.; Zhang, S. Design and realization of a 3D and user-oriented auxiliary system. Proceedings of Remote Sensing, Mapping, and Geographic Systems (RSMG 2023), Kaifeng, China, 9 November 2023. [Google Scholar]
- Ferreira, R.R.; Ferreira, T.M. On the suitability of a unified GIS-BIM-HBIM framework for cataloguing and assessing vulnerability in Historic Urban Landscapes: a critical review. International Journal of Geographical Information Science 2021, 35, 2047–2077. [Google Scholar]
- Huang, Y.; Peng, H.; Fang, X.; Xing, T. A research on data integration and application technology of urban comprehensive pipe gallery based on three-dimensional geographic information system platform. IET Smart Cities 2023, 5, 111–122. [Google Scholar] [CrossRef]
- Genga, S.; Guo, Q.; Ran, W.; Jiang, J. Detection of underground natural gas pipeline micro-leakage based on UAV hyperspectral remote sensing and GIS. International Journal of Remote Sensing. 2024, 1–18. [Google Scholar] [CrossRef]
- Li, H. Research and Application of 3DGIS Burst Analysis Algorithm Based on Urban Water Supply Network. In Proceedings of Proceedings of the 4th International Conference on Public Management and Intelligent Society (PMIS 2024), Changsha, China, 15–17 March 2024. [Google Scholar]
- Ding, Z.; Lu, Y.; Sun, D.; Song, Z.; Hou, H. Rapid construction of indoor and outdoor three-dimensional scenes and augmented reality navigation design and application. Proceedings of Second International Conference on Environmental Remote Sensing and Geographic Information Technology(ERSGIT 2023).
- Wang, G.; You, X.; You, F.; You, J. Dynamic modeling and mapping methods for indoor location maps; Science Press: Beijing, China, 2024. [Google Scholar]
- Meyer, T.; Brunn, A.; Stilla, U. Geometric BIM verification of indoor construction sites by photogrammetric point clouds and evidence theory. ISPRS Journal of Photogrammetry and Remote Sensing 2023, 195, 432–445. [Google Scholar] [CrossRef]
- Zhong, E.; Song, G.; Tang, G. Principles, Technologies, and Applications of Big Data Geographic Information Systems; Tsinghua University Press: Beijing, China, 2020. [Google Scholar]
- Chen, J.; Yang, L.; Yang, Y.; Peng, L.; Ge, X. Spatio-temporal graph neural networks for missing data completion in traffic prediction. International Journal of Geographical Information Science 2024, 1–19. [Google Scholar] [CrossRef]
- Hong, L. Research and application of neural network algorithm based on Water supply and drainage pipeline network. Proceedings of 2024 International Conference on Generative Artificial Intelligence and Information Security(GAIIS 2024), Guangzhou, China, 29–31 March 2024. [Google Scholar]
- Bai, X. The perception ability of three-dimensional spatiotemporal integration and the key to industry digital transformation. Proceedings of WGDC2024 13th World Geographic Information Developers Conference, Beijing, China, 15 May 2024. [Google Scholar]
- Li, D. On Spatiotemporal Intelligence and Digital Twin Smart Cities. Proceedings of The 17th China Smart City Conference, Changsha, China, 18 July 2024. [Google Scholar]
- Khan, R.; Ibrahim, R.; Ibrahim, A. Introduction to Spatio-temporal data management and analytics for Smart City research. Proceedings of Construction Logistics, Equipment, and Robotics(CLEaR 2023), Tübingen, Germany, 19 September 2023. [Google Scholar]
- Shang, S.; Chen, L.; Jensen, C.S.; Kalnis, P. Introduction to Spatio-temporal data management and analytics for Smart City research. GeoInformatica 2020, 24, 1–2. [Google Scholar] [CrossRef]
Figure 1.
The architecture of CIM’s 3D Data Base.
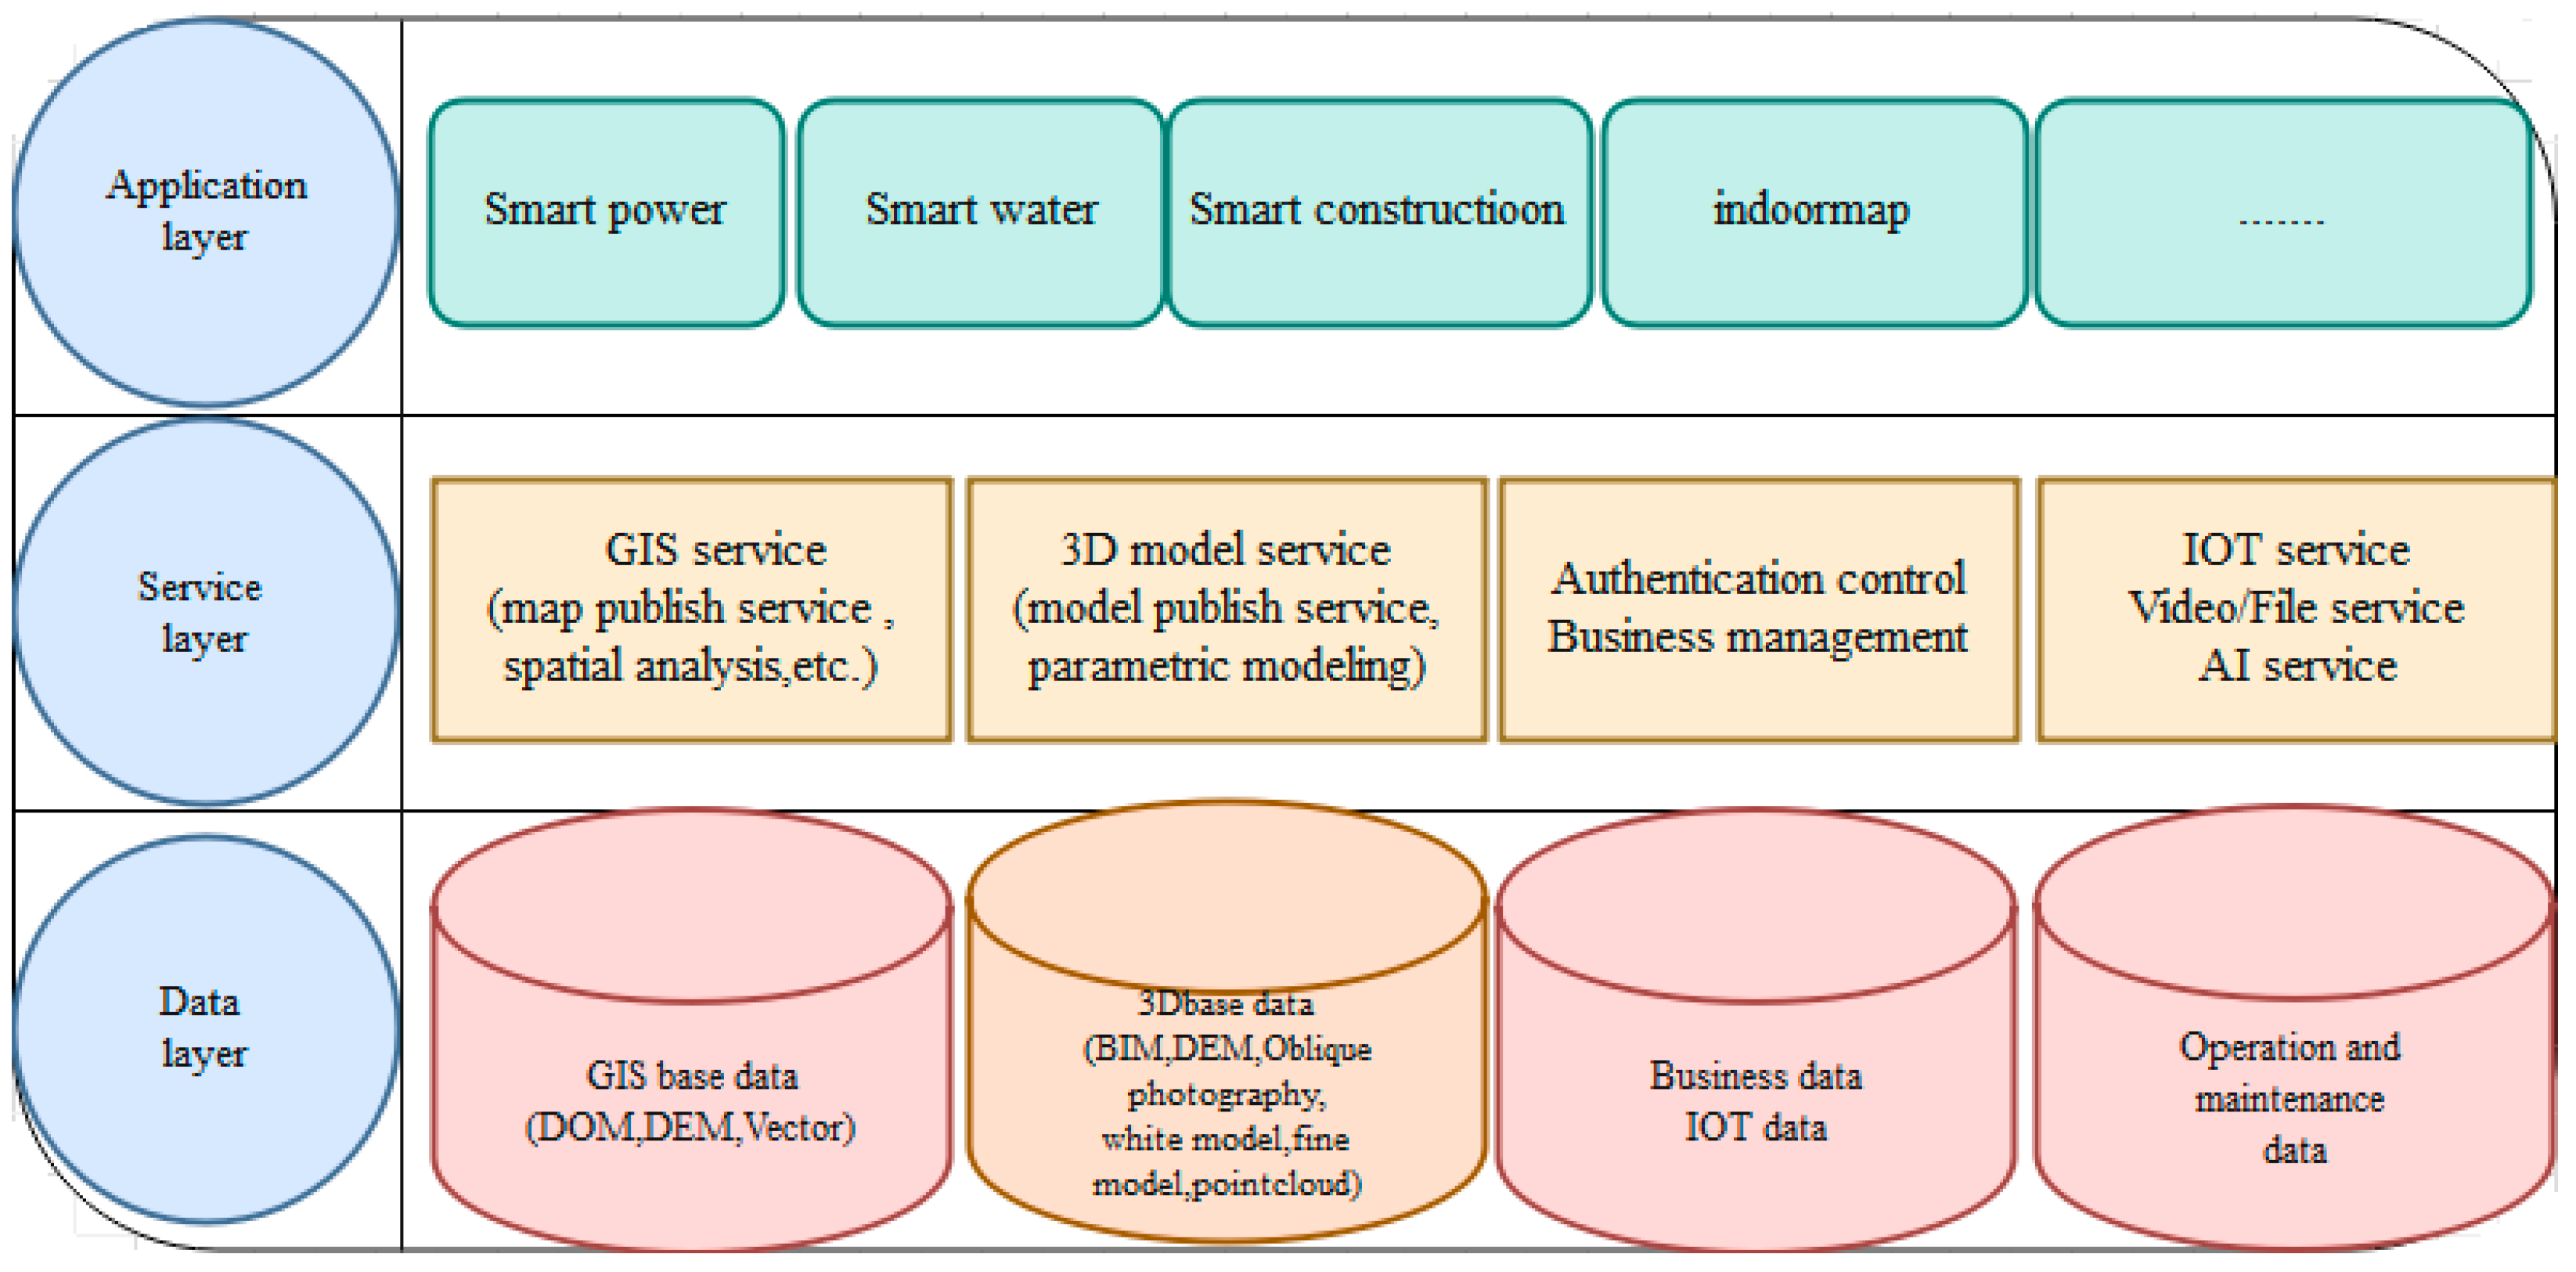
Figure 2.
Classification of 3D Models Based on Geographic Objects in CIM.
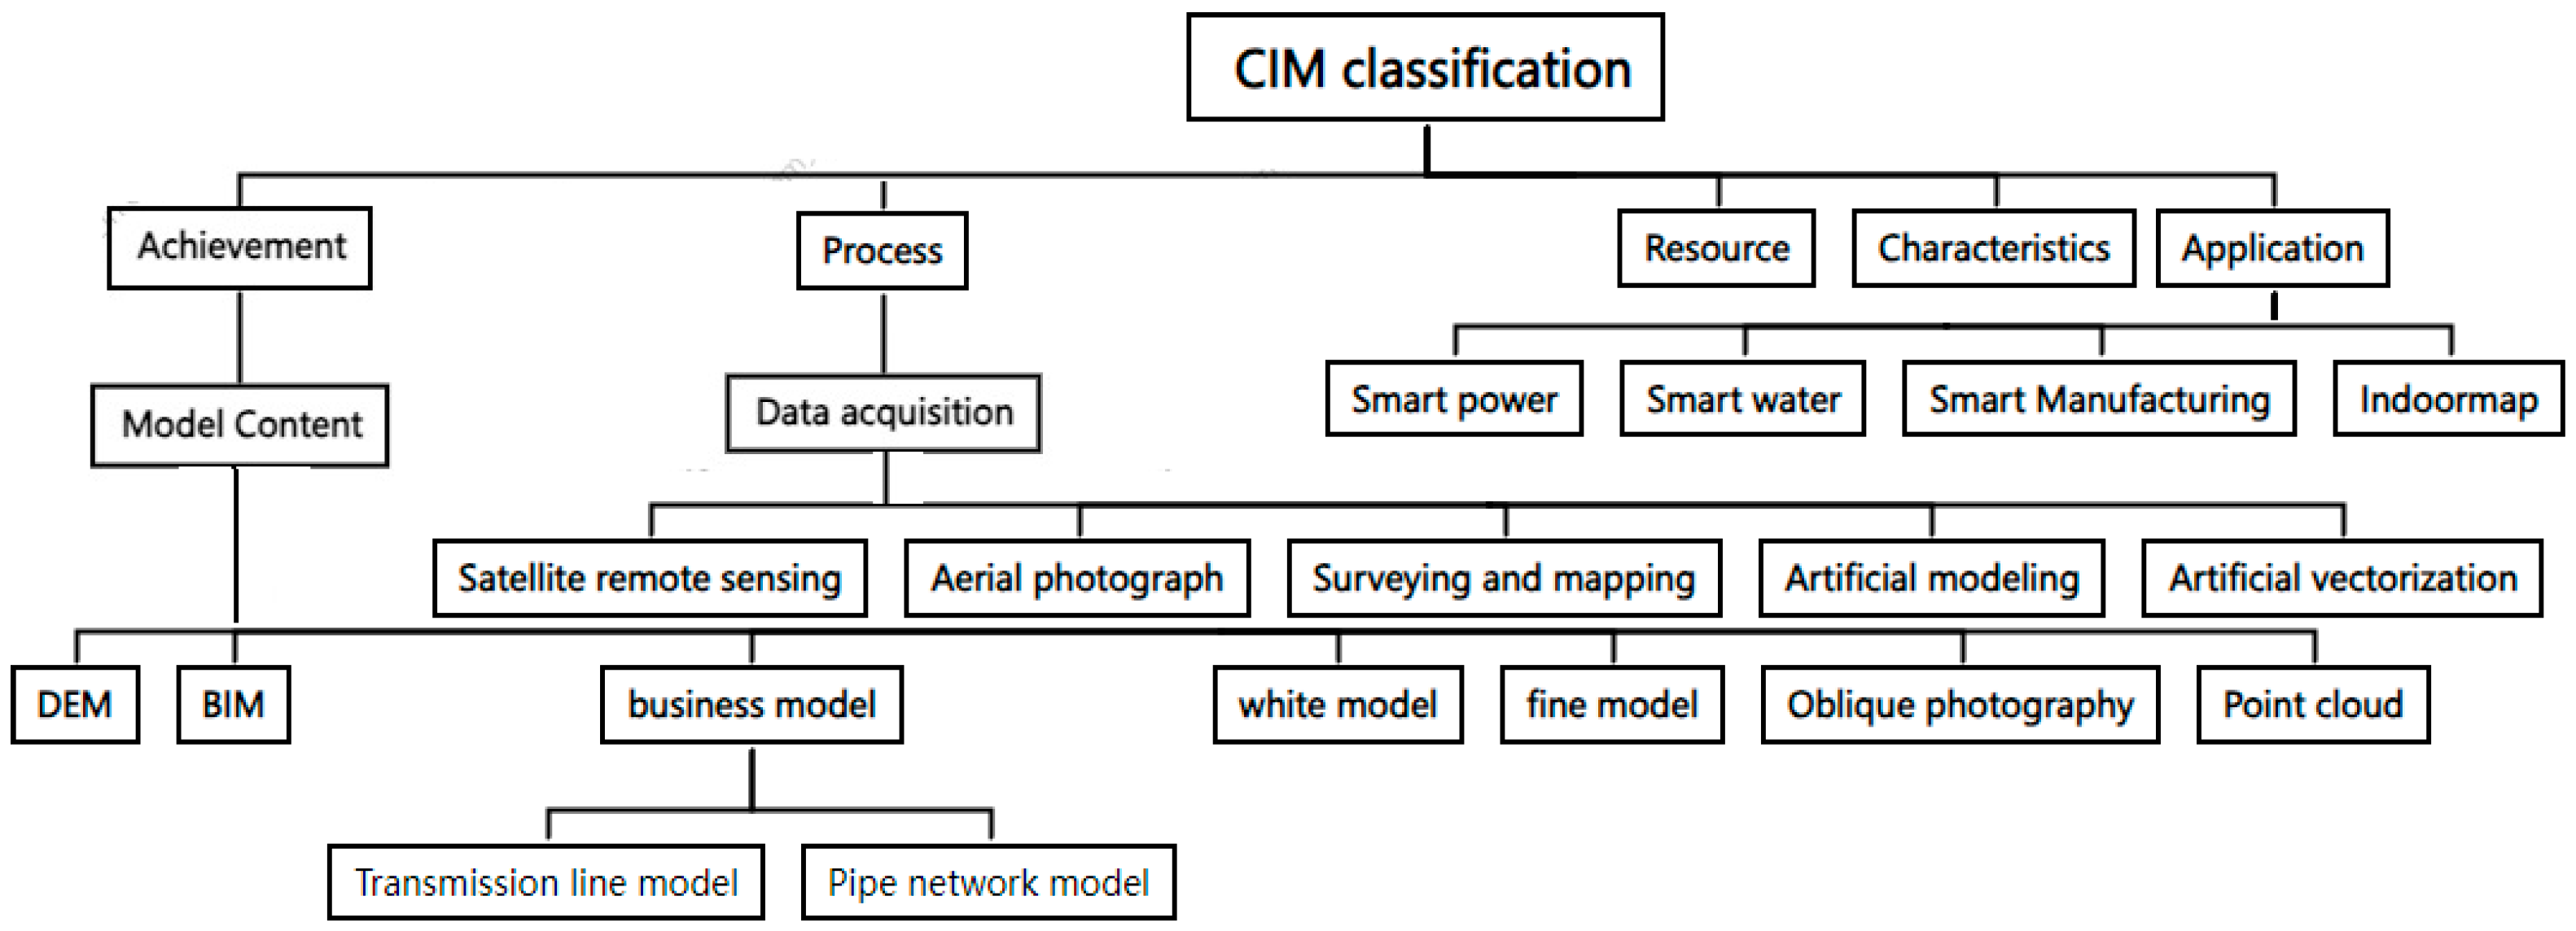
Figure 3.
Calculation of the azimuth angle of the wire.
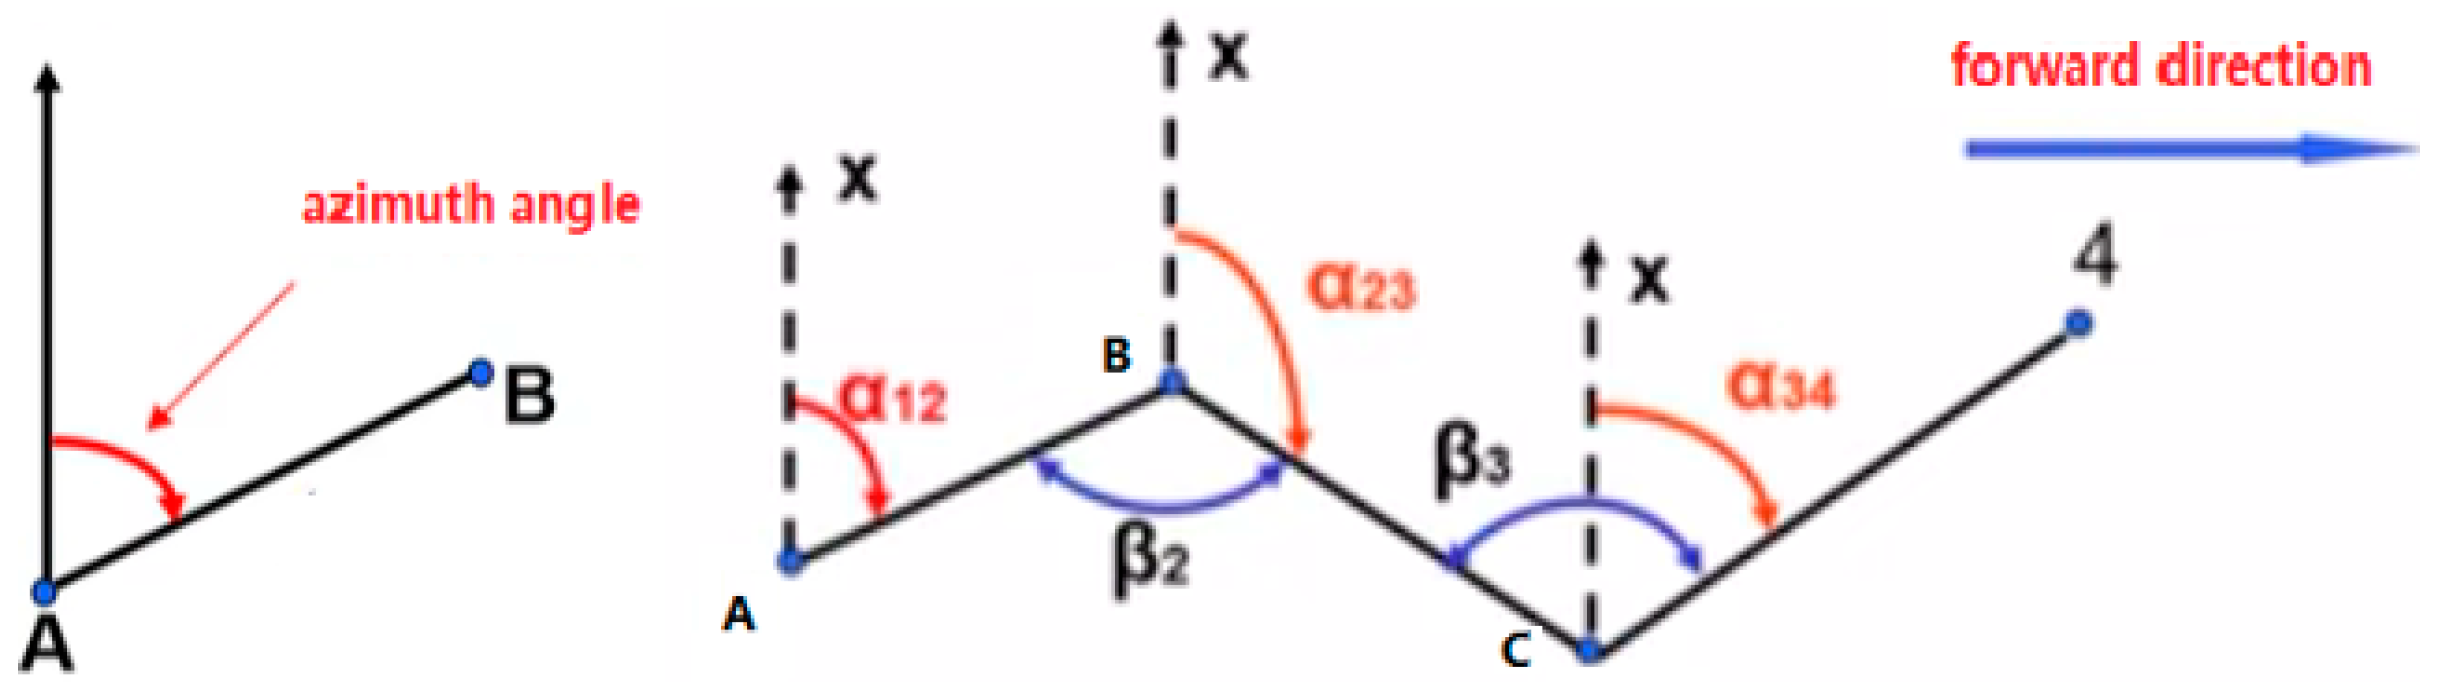
Figure 4.
(a)local coordinate and global coordinate;(b)the latitude and longitude division.
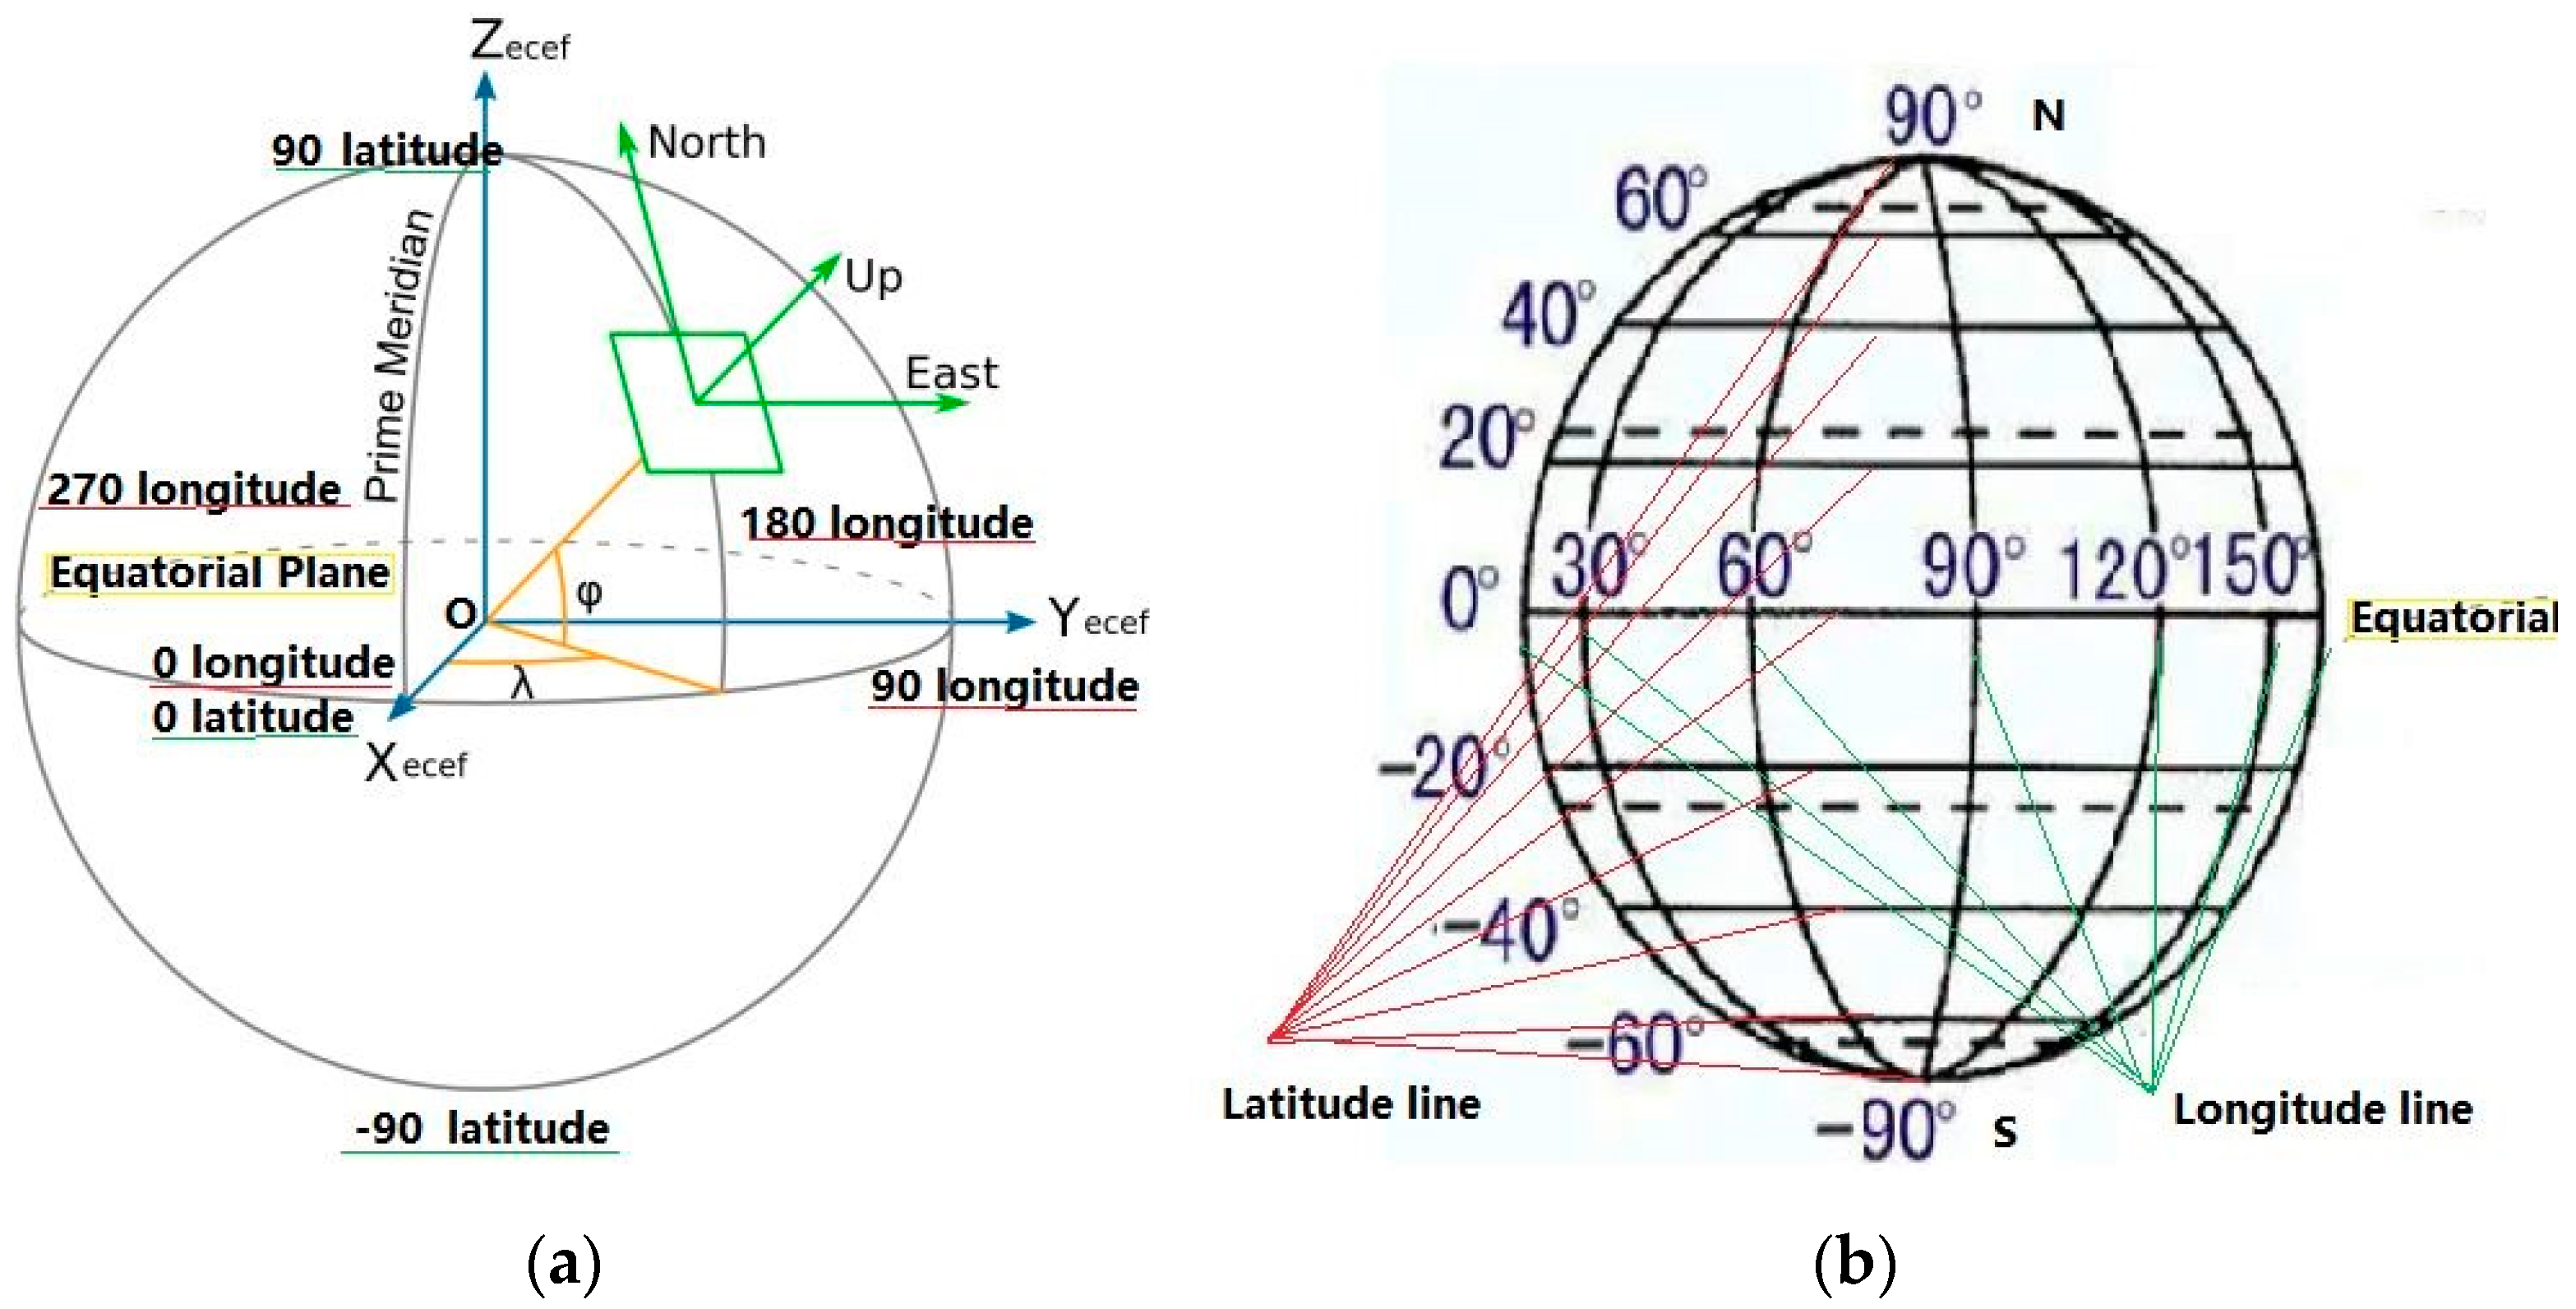
Figure 7.
The finished excavation volume between two months.
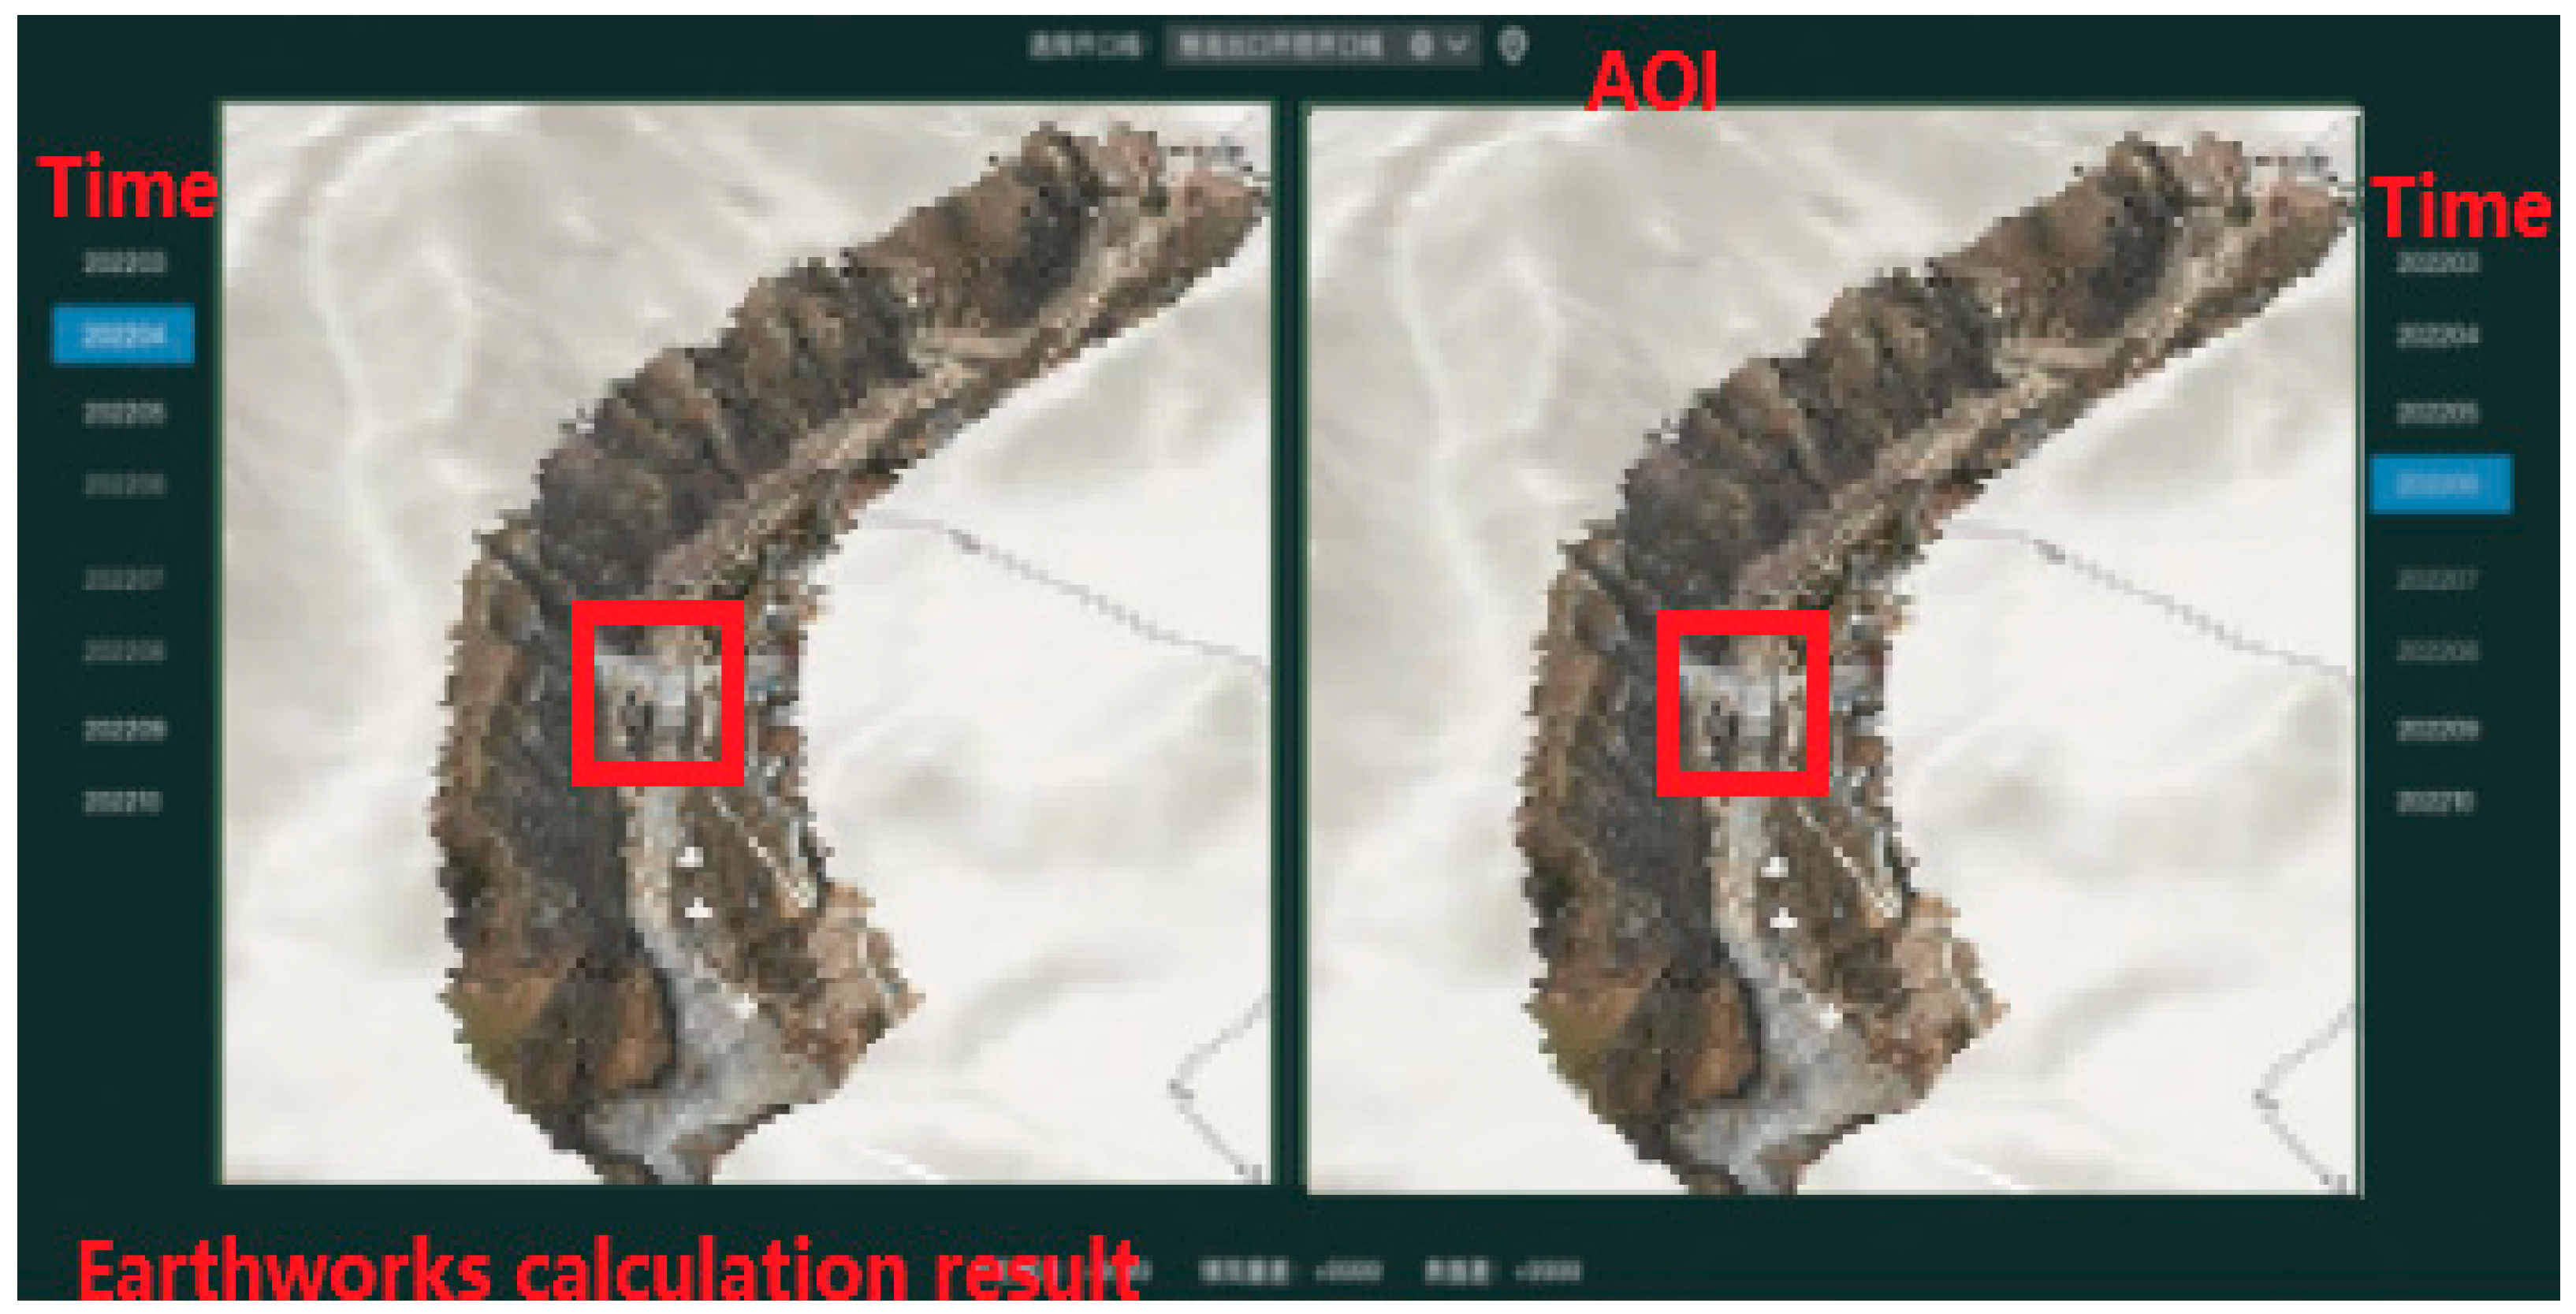
Figure 8.
The current estimated future excavation volume between the two month.
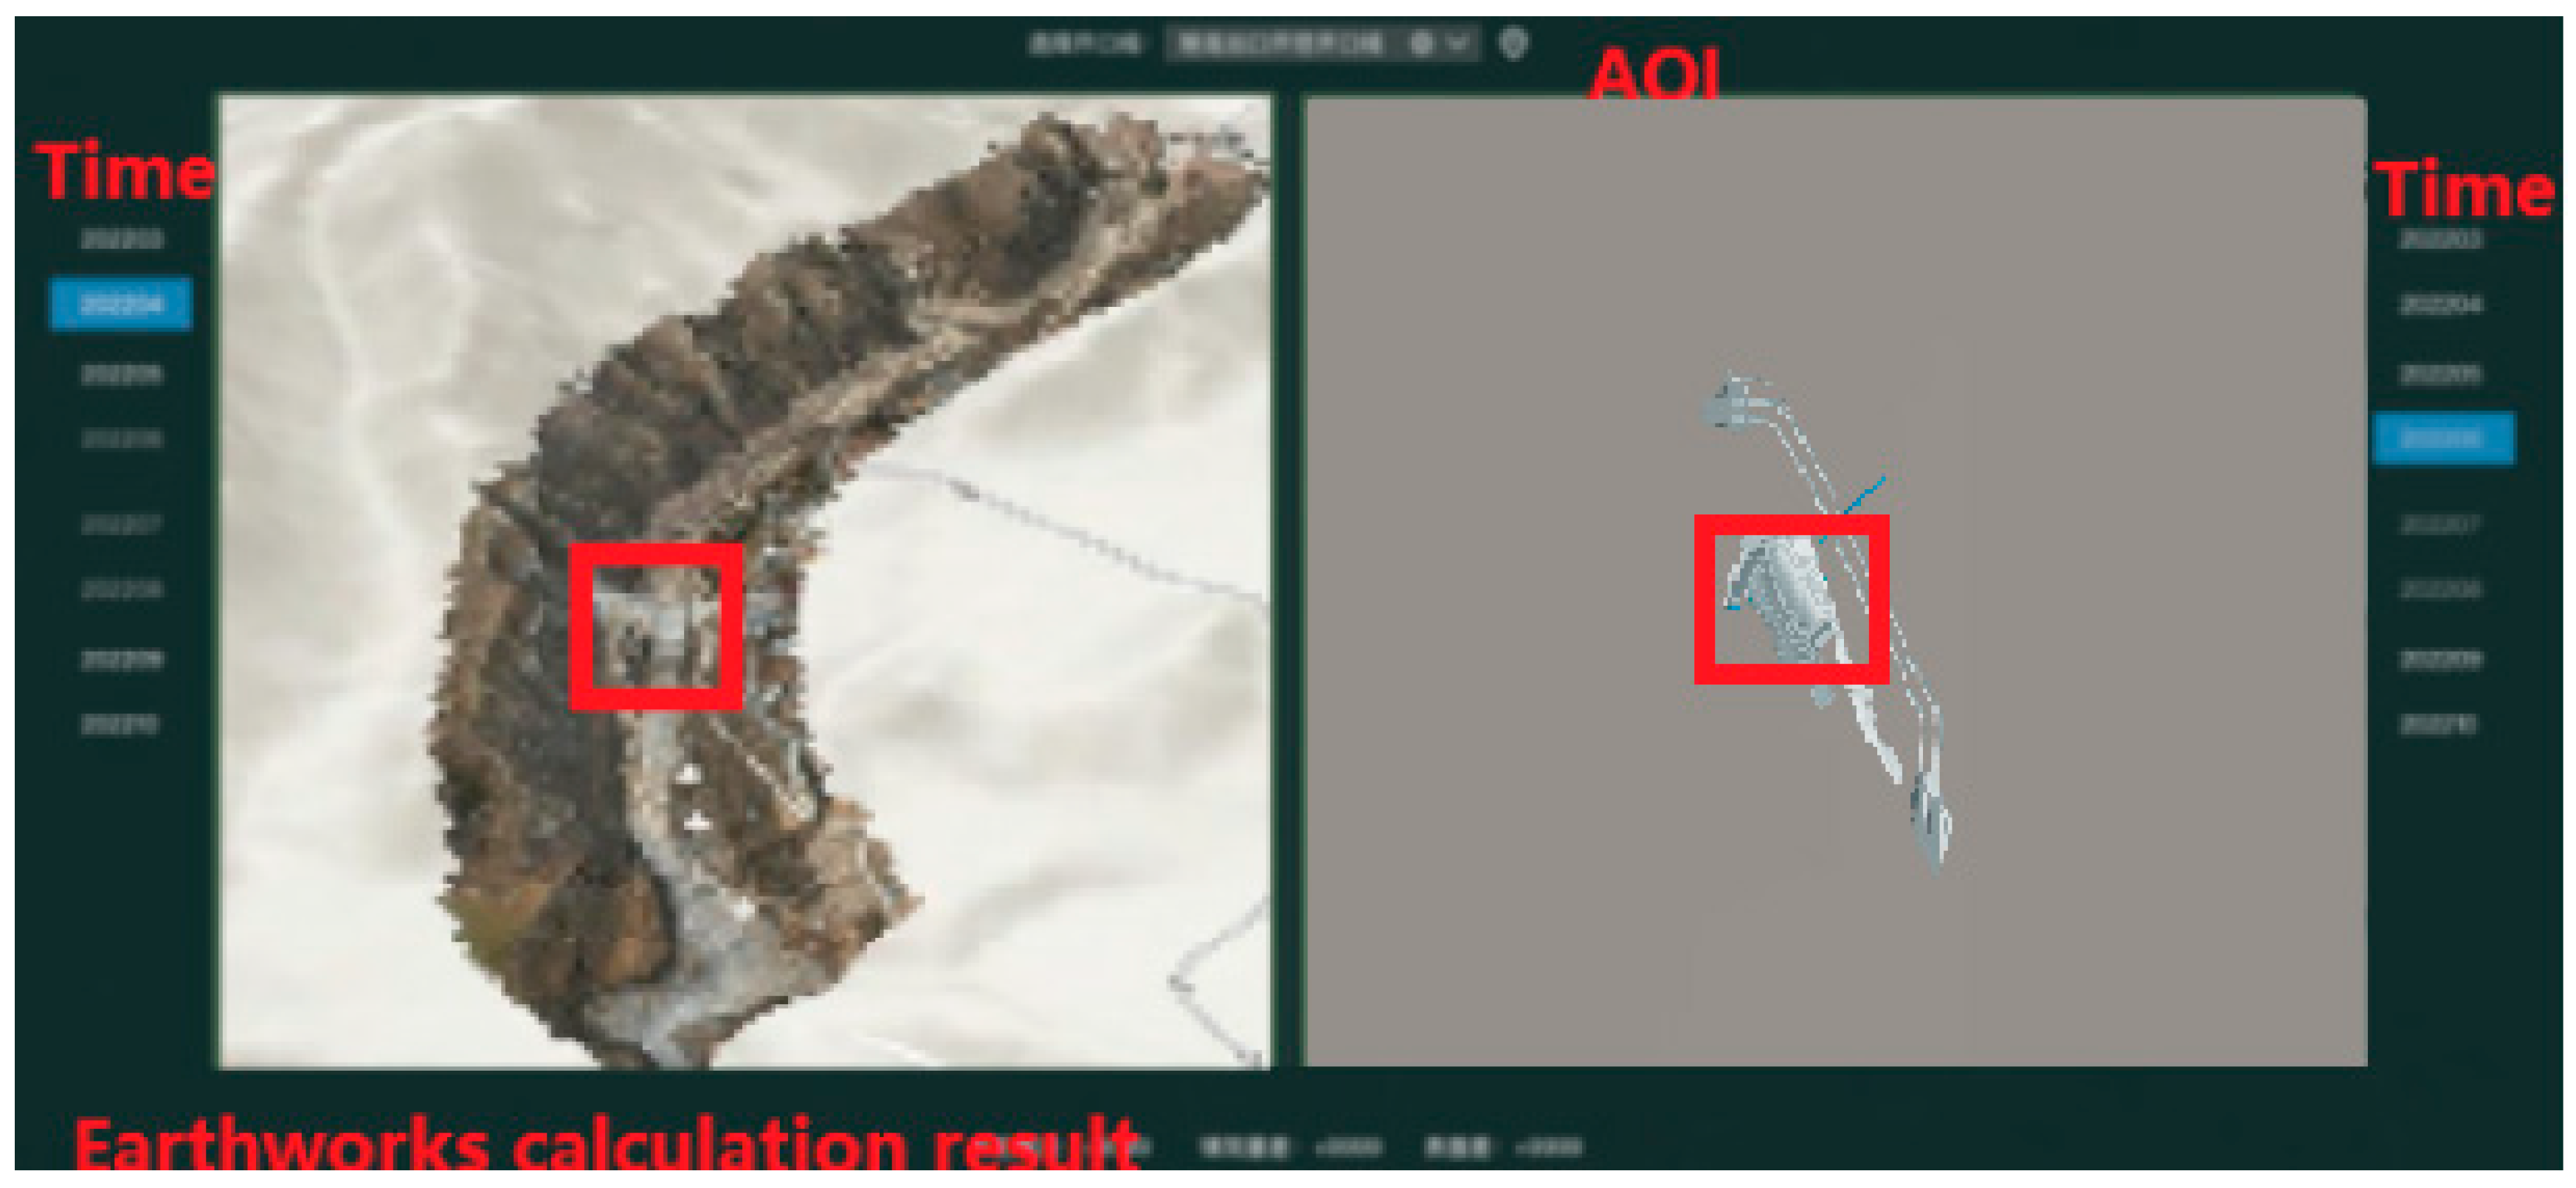
Figure 9.
3D visualization system for power transmission lines.
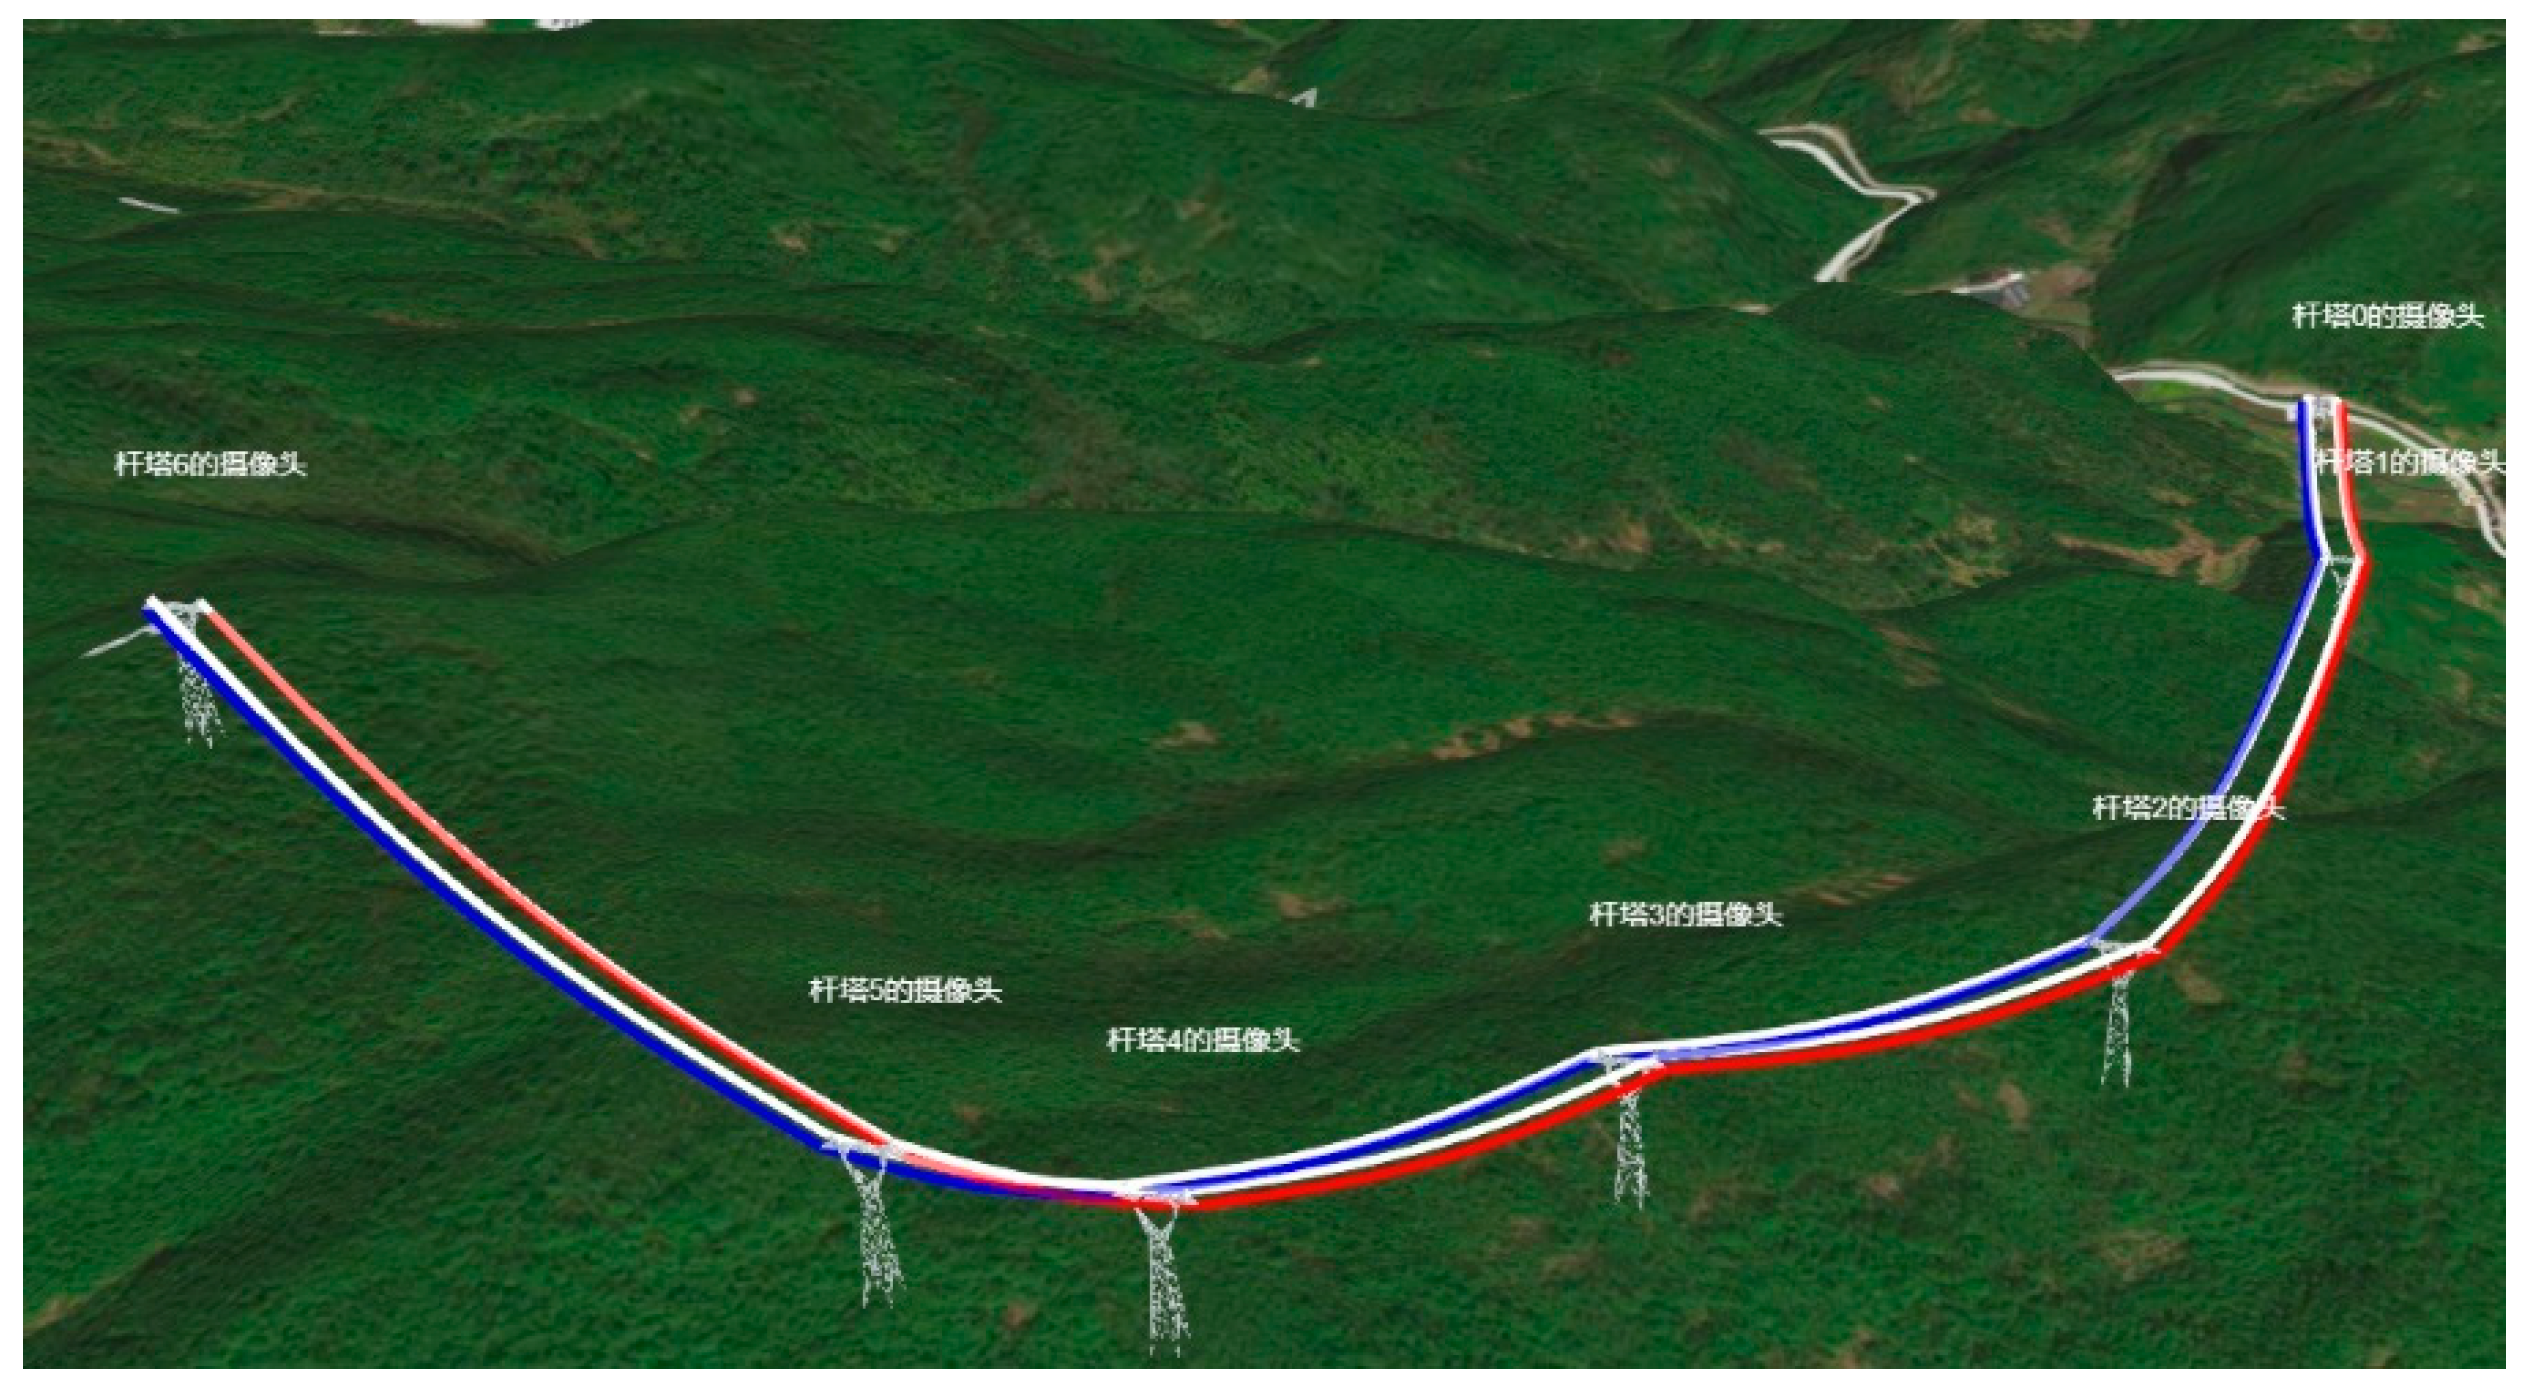
Figure 10.
(a) The tower in 3DMAX; (b)The azimuth calculation between towers in 3DGIS.
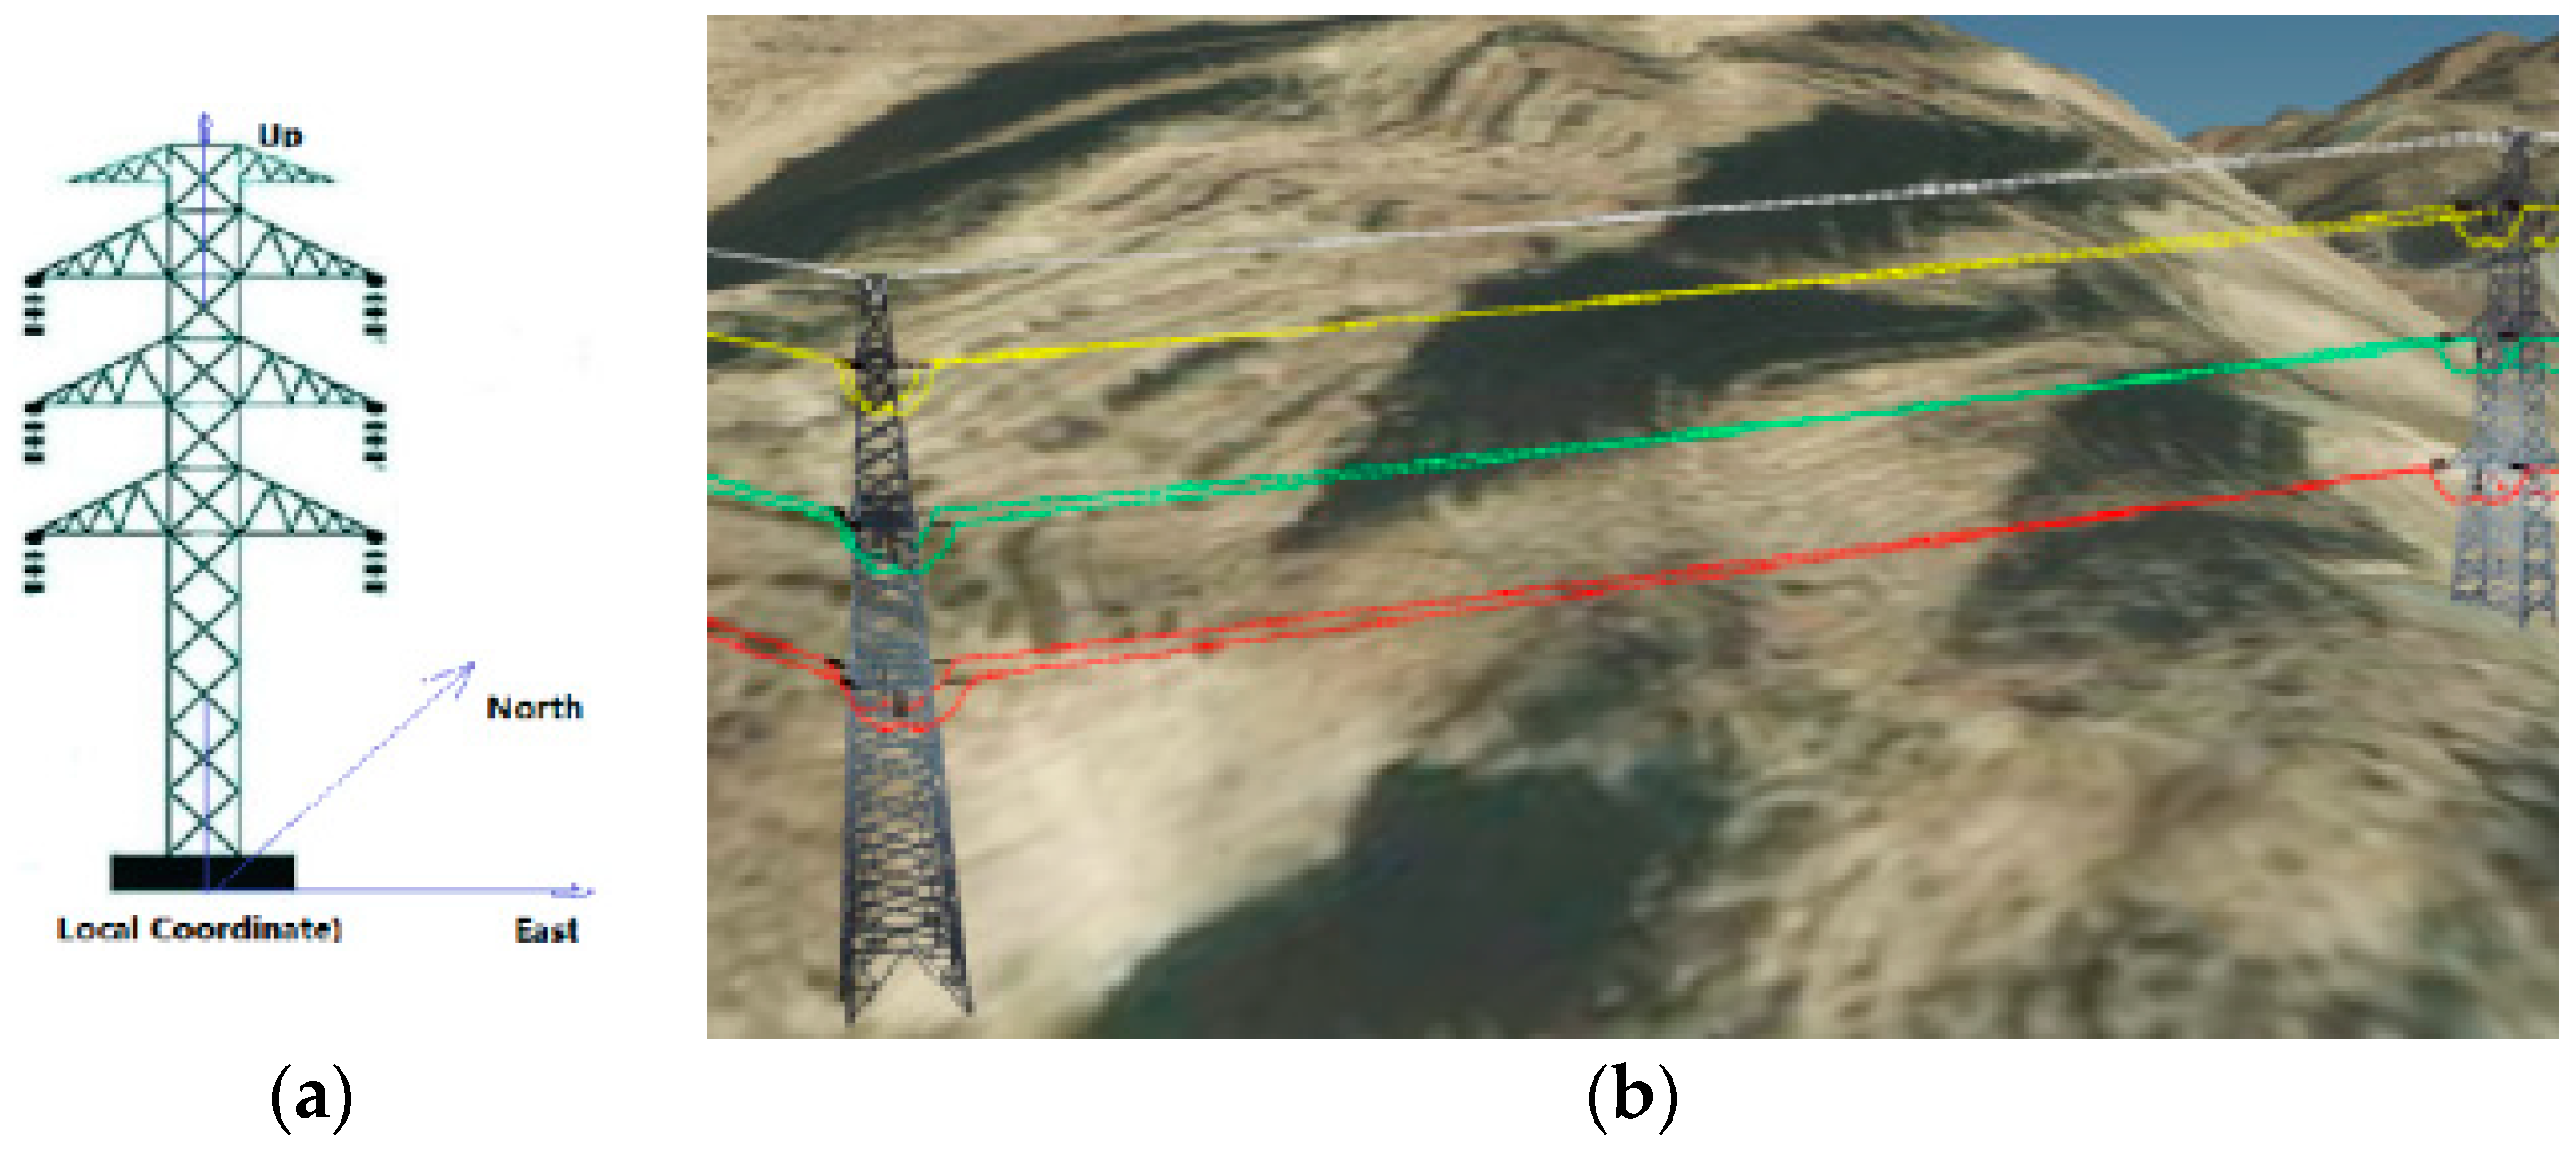
Figure 11.
(a) Geojson loading using the primitive API; (b) 3dtiles loading.
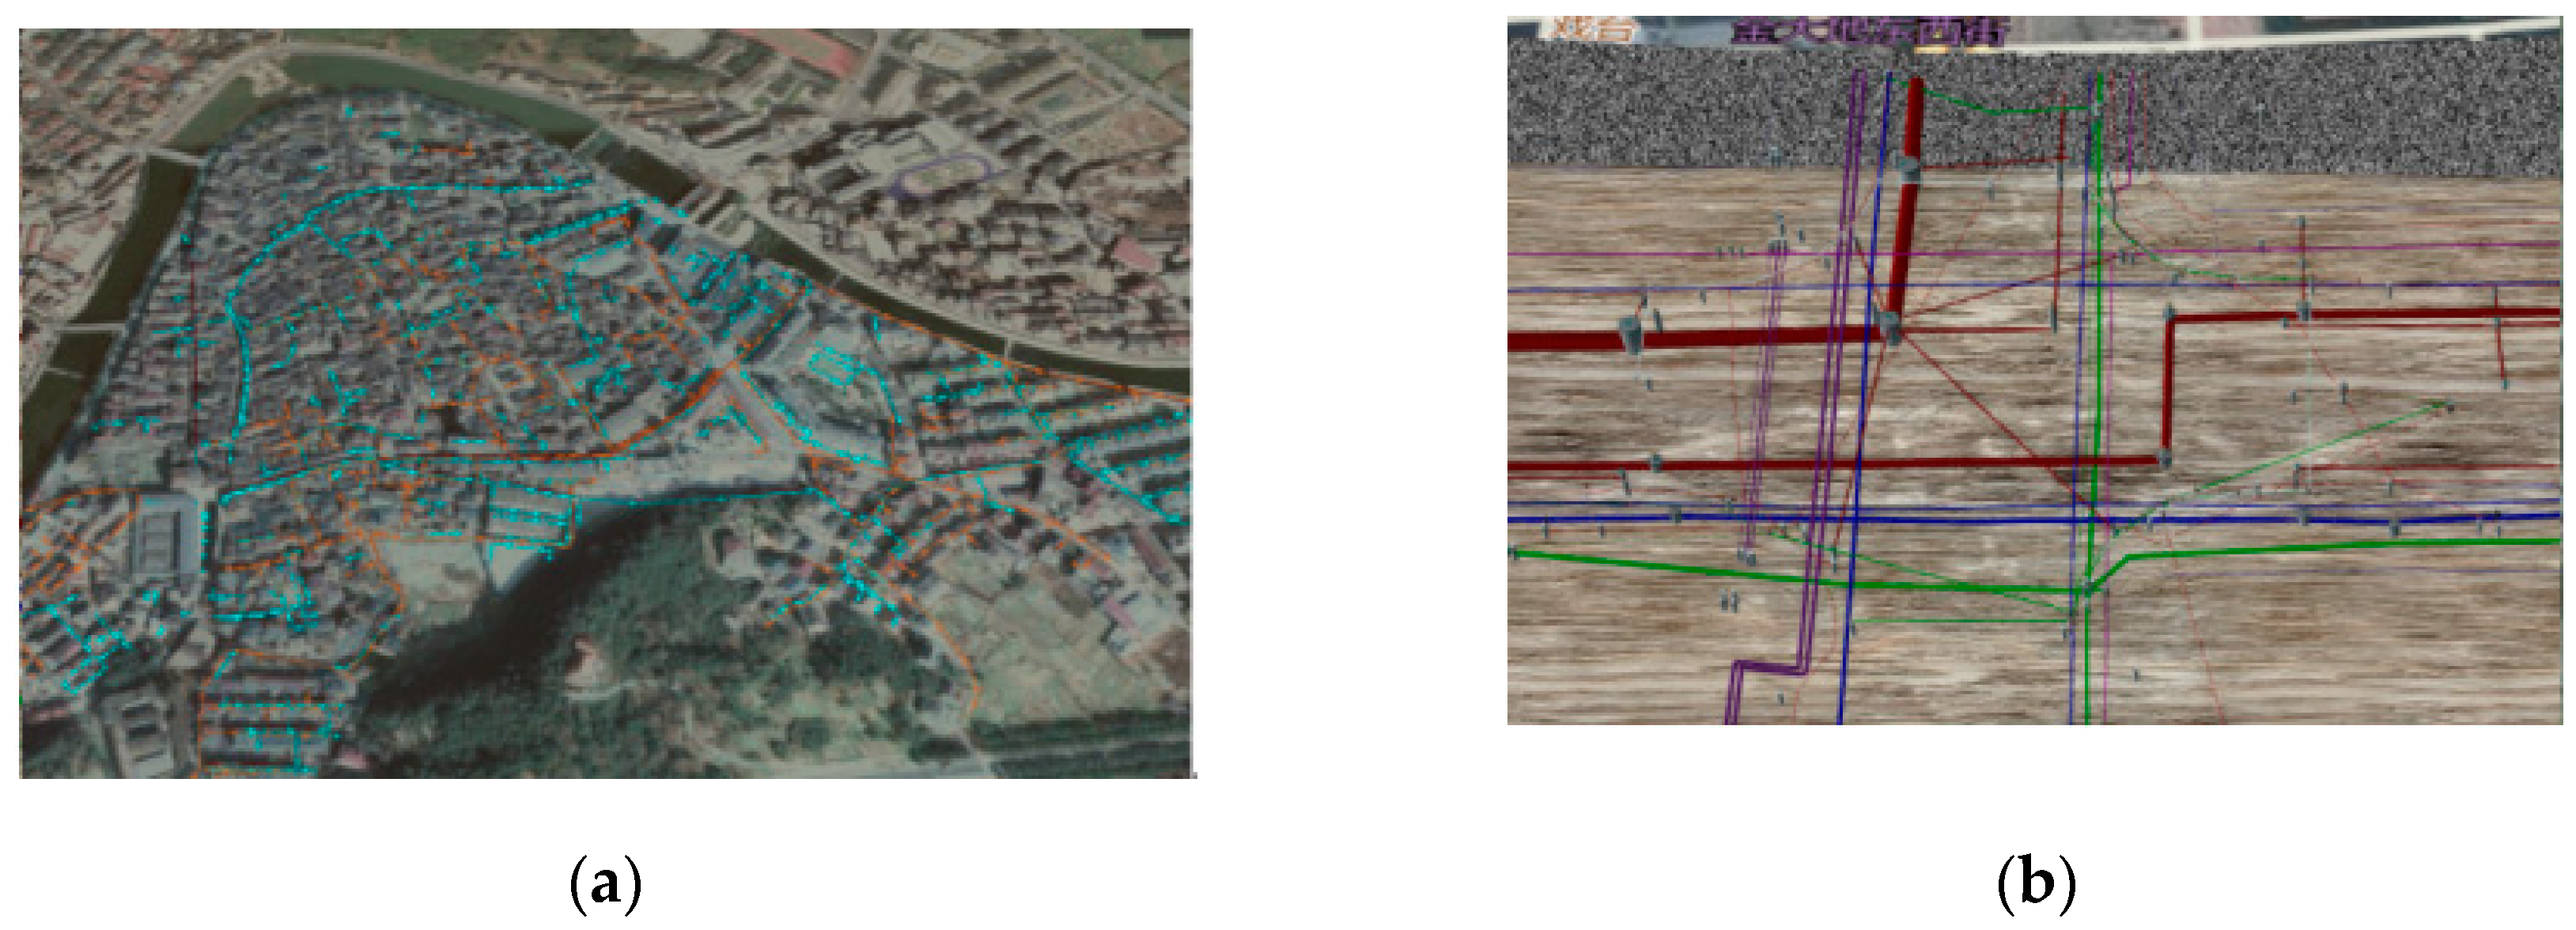
Figure 12.
(a) 3dtiles from revit;(b) geojson loading
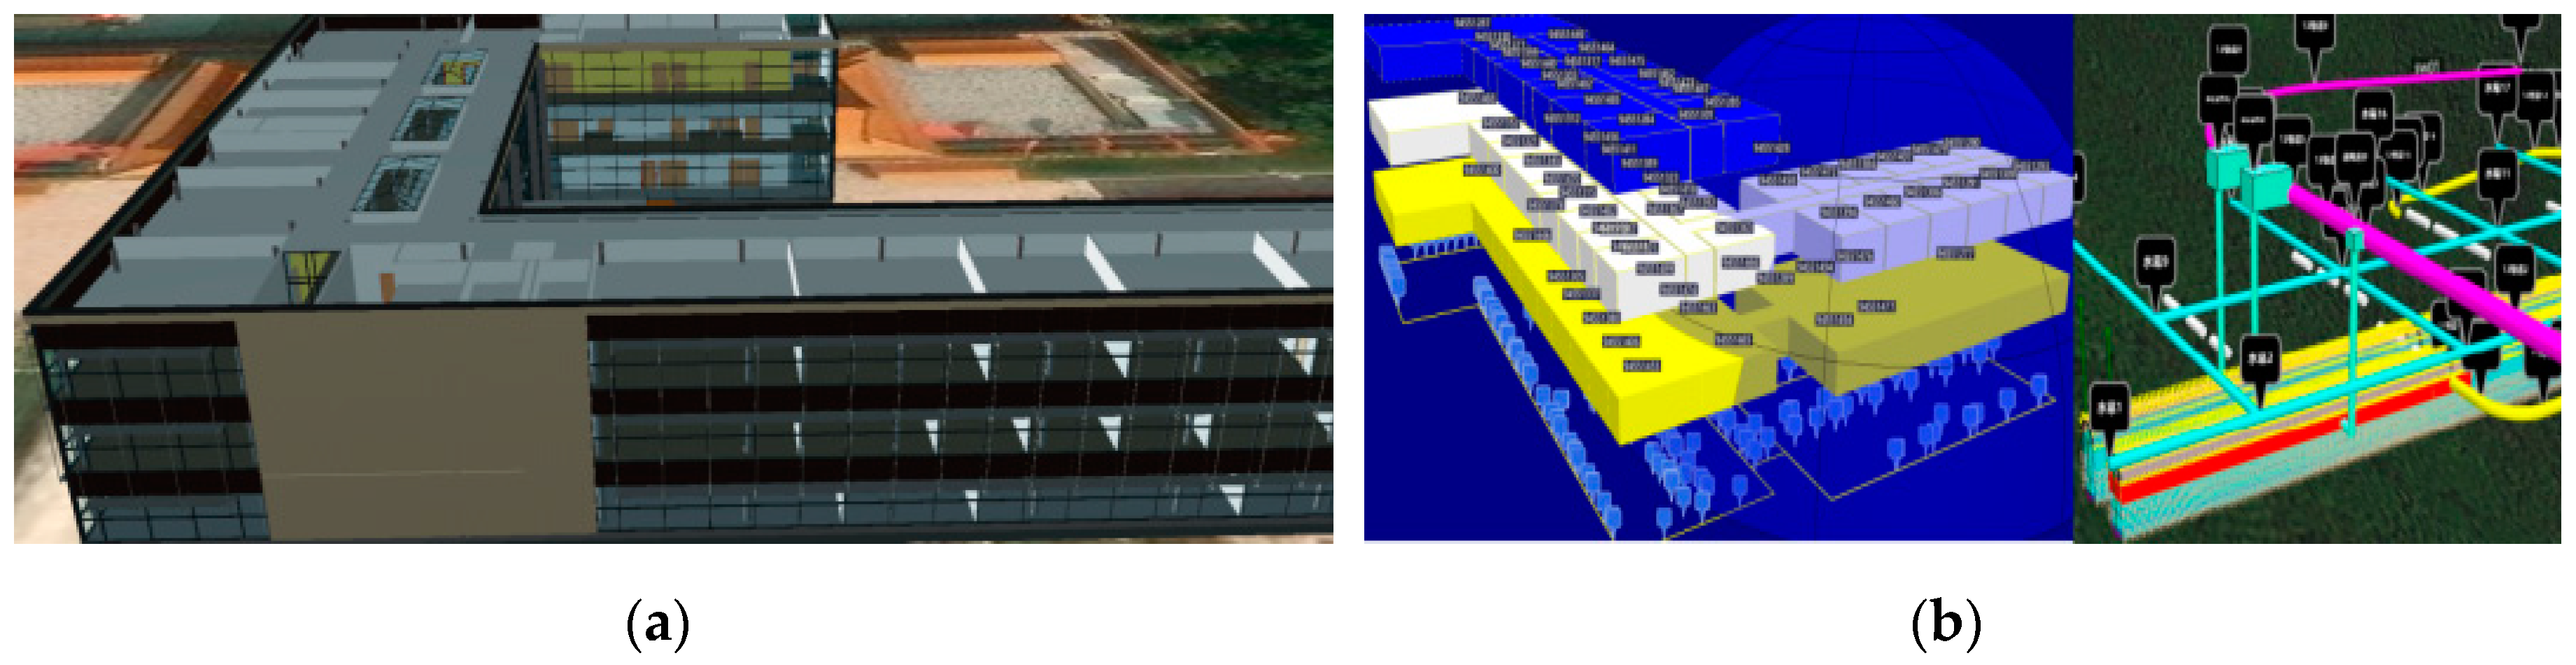
Figure 13.
Relationship between testing time (s) and frame rate.
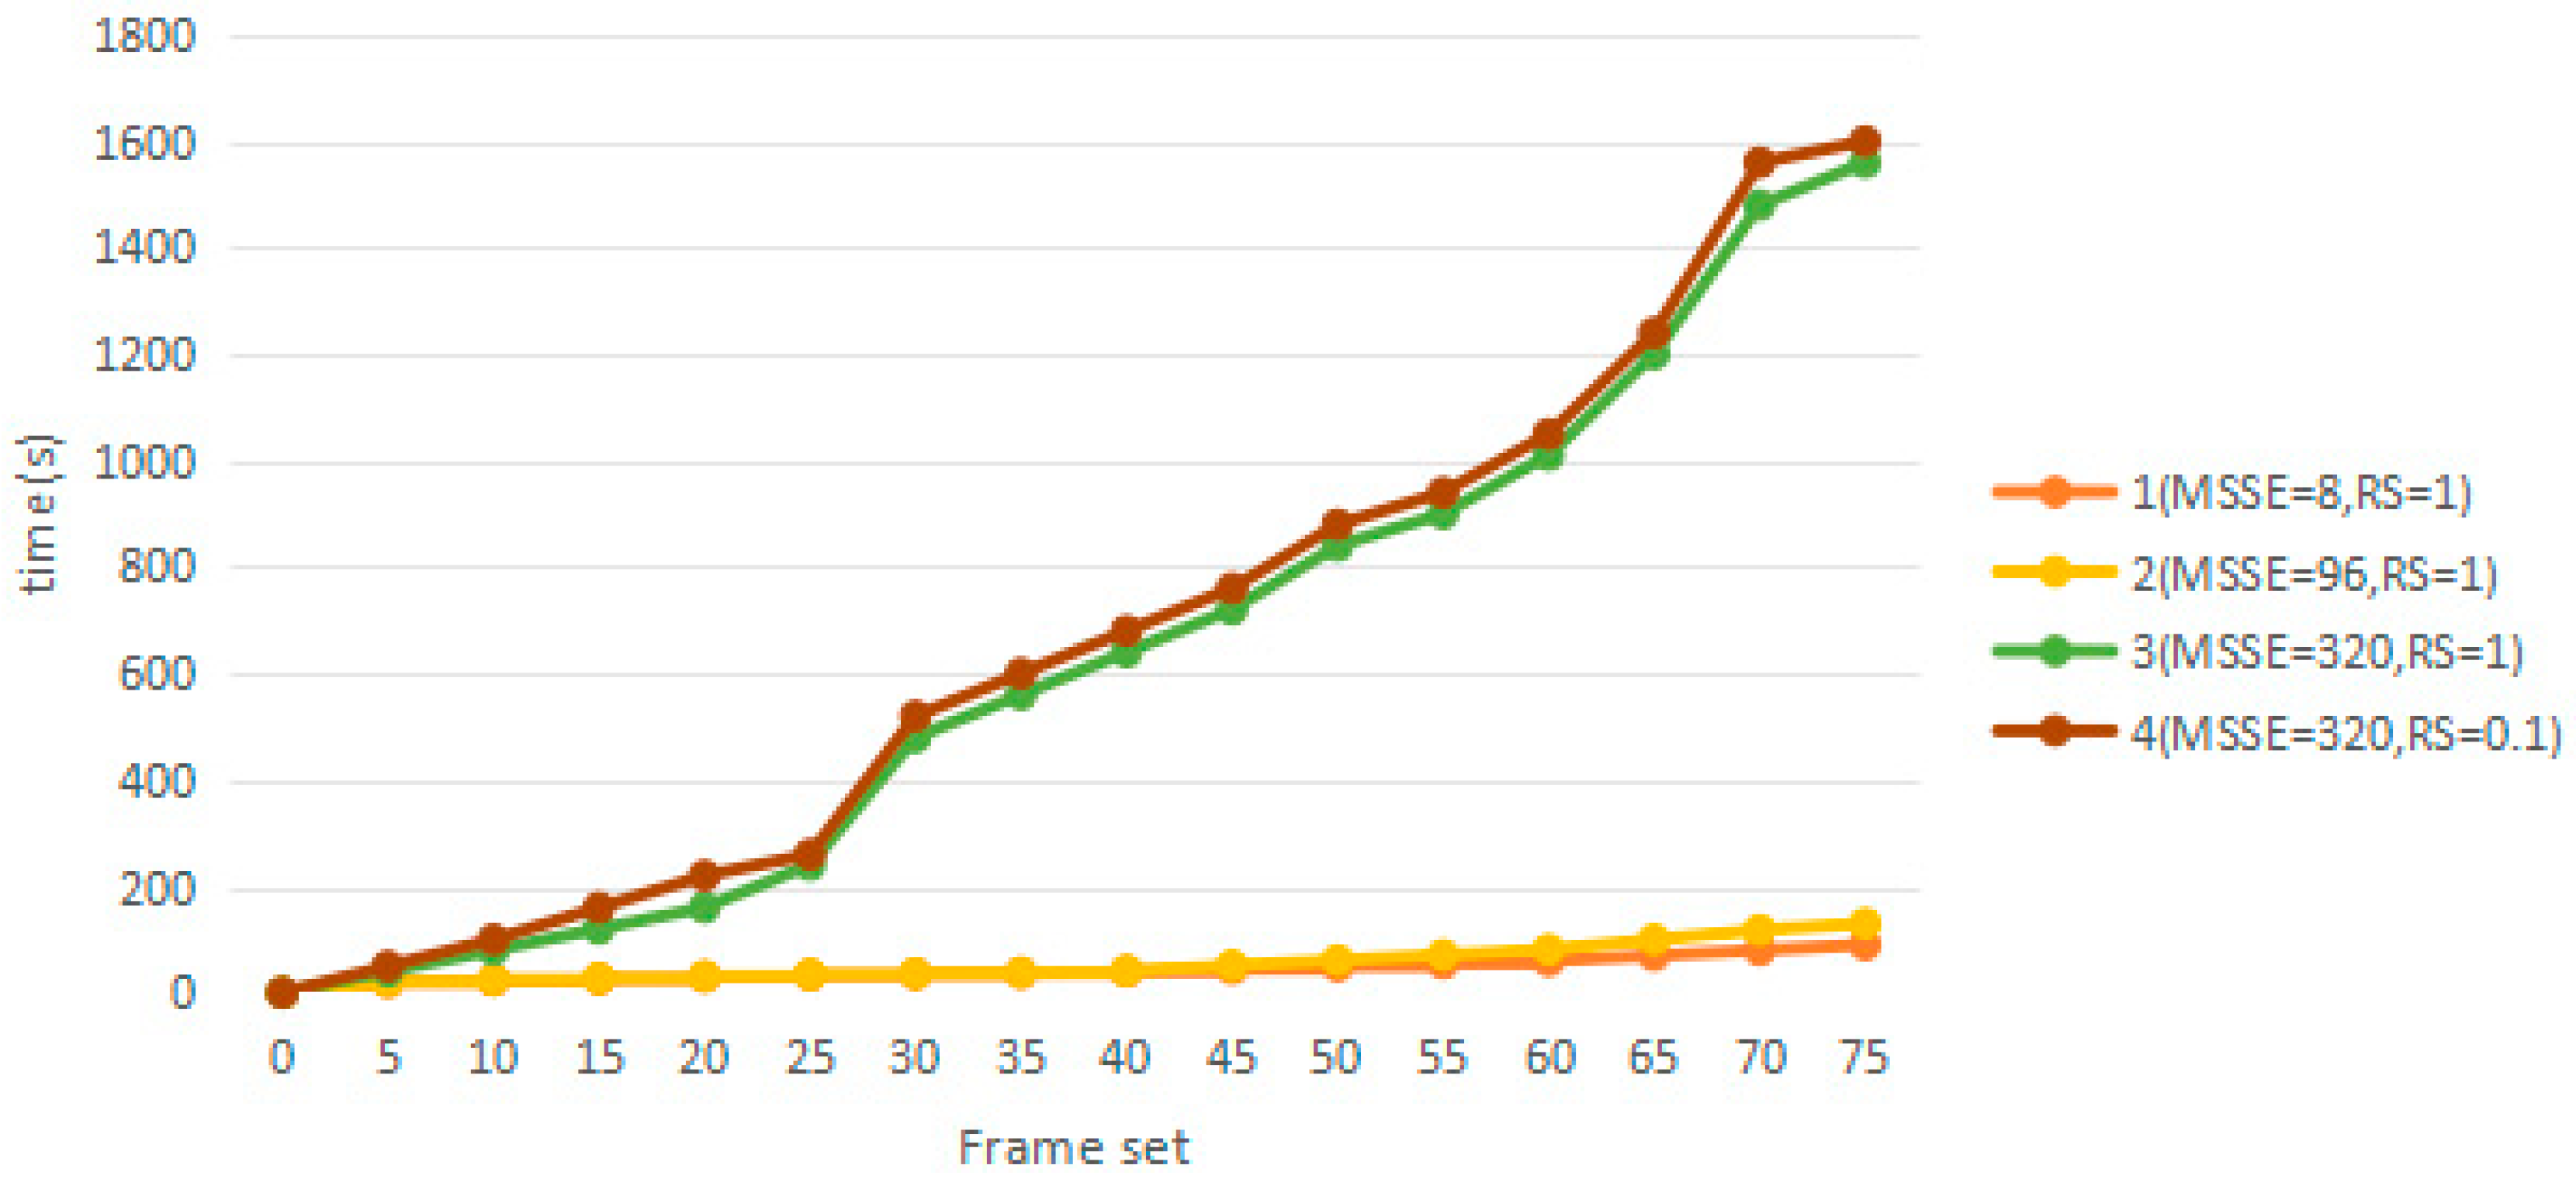

Table 1.
LOD comparison of city 3DGIS model, CityGML and BIM.
| ID | Main content and features of the model | 3DGIS model grading | CityGML grading | BIM grading |
|---|---|---|---|---|
| 1 | Terrain model, planar contour or symbol representation entity | LOD1 (block model) |
LOD0 | |
| 2 | Solid 3D framework, such as architectural 3D framework (white modle) | LOD2(base model) | LOD1 | |
| 3 | Solid 3D framework+standard surface, such as architectural 3D framework, enclosed surface, roof surface |
LOD3 (standard model) |
LOD3 | |
| 4 | Solid 3D framework+fine surface, such as architectural 3D framework, such as closed surface, layered surface, window | LOD4 (fine model) |
LOD4 | LOD1.0 (project level BIM) |
| 5 | Complete functional modules or spatial information, such as layered households, rooms, interior wall surfaces, main building decorations, meeting the geometric expression accuracy requirements for rough identification | LOD5 | LOD2.0 (functional level BIM) |
|
| 6 | The geometric expression accuracy of a single component such as a building element (wall, beam, slab, column, etc.) to meet the precise identification requirements of the construction and installation process, psrocurement, etc | LOD3.0 (component level BIM) |
||
| 7 | Geometric expression accuracy that meets high-precision recognition requirements such as rendering display, product management, manufacturing and processing preparation, and is subordinate to the information of component parts | LOD4.0 (part level BIM) |
Table 2.
The content,features and recision of 3d Modle in LOD of CIM.
| ID | Name | Main content of the model | Model features | Precision of data source | sample data |
|---|---|---|---|---|---|
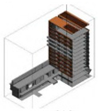
| 1 | Surface model | Administrative regions, terrain, water systems, residential areas, transportation lines, etc | Basic contours of solid objects overlaid by DEM and DOM | Less than 1:10000 |  |
| 2 | Framework model | Terrain, water conservancy, architecture, transportation facilities, etc | Solid 3D framework and surface (no texture), including entity classification, etc | 1∶5 000~ 1∶10 000; ≥10 m |
 |
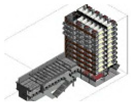
| 3 | Standard model | Terrain, water conservancy, construction, transportation facilities, pipeline corridors, vegetation, etc | Solid 3D framework, outer surface, including information on entity classification, ID, and basic attributes | 1∶1 000~ 1∶2 000; ≥2 m |
 |
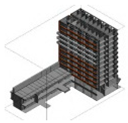
| 4 | Fine model | Terrain, water conservancy, building appearance and layered structure, transportation facilities, pipeline corridors, vegetation, etc | Solid 3D framework, internal and external surface details (real textures), including ID descriptions of model units, project information, etc | Better than 1:500 or G1, N1; ≥0.5 m |
 |
| 5 | Functional levelmodel | Elements such as buildings, facilities, pipeline corridors, sites, underground spaces, and their main functional zoning (corresponding to the hierarchical and household division of buildings) | Geometric accuracy that meets spatial occupancy, functional zoning, and including and supplementing higher-level information, adding information on entity system relationships, composition and materials, performance or attributes, etc | G1~G2; N1~N2; ≥0.05 m |
 |
| 6 | Component level model | Functional zoning and main components of buildings, facilities, pipeline corridors, underground spaces, and other features | Geometric accuracy (component level) that meets the precise identification requirements of construction and installation processes, etc. | G2~G3; N2~N3; ≥0.02 m |
 |
| 7 | Part levelmodel | Functional zoning, components, and main parts of buildings, facilities, pipeline corridors, underground spaces, and other elements | Geometric accuracy (part level) that meets high-precision recognition requirements such as rendering display, product management, and manufacturing preparation | G3~G4; N3~N4; ≥0.01 m |
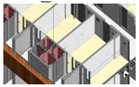 |
Table 3.
3D data acquisition, production, conversion, and processing technology.
| Data Type | Description | Acquisition Device | Application Software | File Format | Converted file |
|---|---|---|---|---|---|
| GIS data | DOM(grid file) | Remote sensing satellite | Erdas | .tiff | Tile set.(jpg/.png) |
| DEM(grid file) | Remote sensing satellite/photogrammetry | Arcgis | .dem/.hgt | Tile set(.terrain) | |
| vector file | surveying instruments/collection | Arcgis | .shp | geojson/Tileset 3dtiles) | |
| Oblique photography | Oblique photography | Drone aerial photography | ContextCapture | .osg | Tile set(3dtiles) |
| Artificial model | 3D artificial model | Camera/manual acquisition of textures | 3dmax | .fbx/.obj | Glb/gltf |
| BIM | Converted from CAD and other drawings | 3d laser scanner, digital camera | Revit | .frc | Tile set(3dtiles) |
| Point cloud | 3D laser point cloud | 3d laser scanner | CloudCompare | .pts | Tile set(3dtiles) |
Disclaimer/Publisher’s Note: The statements, opinions and data contained in all publications are solely those of the individual author(s) and contributor(s) and not of MDPI and/or the editor(s). MDPI and/or the editor(s) disclaim responsibility for any injury to people or property resulting from any ideas, methods, instructions or products referred to in the content. |
© 2024 by the authors. Licensee MDPI, Basel, Switzerland. This article is an open access article distributed under the terms and conditions of the Creative Commons Attribution (CC BY) license (http://creativecommons.org/licenses/by/4.0/).
Copyright: This open access article is published under a Creative Commons CC BY 4.0 license, which permit the free download, distribution, and reuse, provided that the author and preprint are cited in any reuse.


