
Submitted:
11 October 2024
Posted:
14 October 2024
You are already at the latest version
Abstract
2,3,5,6-tetrafluoro-7,7,8,8-tetracyanoquinodimethane (F4TCNQ) is a molecule widely employed as a very effective p-dopant of semi-conducting polymers, such as poly(3-hexylthiophene -2,5-diyl) (P3HT). The CN stretching transitions of F4TCNQ are exceptionally sensitive to the charge state of the molecule, thus allowing the doping diagnosis via IR spectroscopy. Less pronounced frequency shifts can reveal characteristics of the intermolecular environment. We present a systematic study based on Density Functional Theory (DFT) calculations and on experiments aimed at exploring how different factors, such as the charge state and the environment, modify the vibrational spectra of F4TCNQ. While several effects on the vibrational frequencies are well known and have been thoroughly investigated in the past, this study focuses on the infrared intensities of the CN stretching modes and reveals that they are strongly affected both by the charge state of the molecule and by the surrounding medium: it is then mandatory to consider such remarkable intensity modulation for any quantitative diagnosis based on spectroscopic measurements, e.g., concerning the amount of F4TCNQ molecules involved in the formation of charge transfer complexes.
Keywords:
Organic dopant
; DFT calculations
; Infrared intensities
; Electro-Optical Parameters (EOP)
; atomic charges
; atomic polar tensor (APT)
; doped P3HT
1. Introduction
Since the early studies in molecular electronics, many papers dealing with 2,3,5,6-tetrafluoro-7,7,8,8-tetracyanoquinodimethane (F4TCNQ) have appeared in the literature. The peculiar features of F4TCNQ are related to its electronic structure: the high electron affinity makes it a suitable acceptor in alkaline salts and organic charge transfer compounds, which are characterized by remarkable charge transport properties. [1,2]
F4TCNQ is probably one of the most used and characterized organic dopants for p-type polymers such as polythiophene, its copolymers, and alkyl-substituted derivatives, one of the most famous examples being poly(3-hexylthiophene-2,5-diyl), P3HT [3,4,5,6,7,8,9,10,11,12,13,14]. Chemical doping of polymers containing conjugated π-electrons is a common strategy to enhance the electrical conductivity by orders of magnitude and is the reason why doped semiconducting polymeric materials earned the name “conducting polymers” or “synthetic metals”.
Spectroscopic techniques have shown great potential for studying doped polymers, highlighting the structure of the induced charge defects, such as polarons and charge transfer complexes [3,4,5,6,7,8,9,10,11,12,13,14,15,16,17]. In particular, IR and Raman spectroscopies contributed to the understanding of the polaron structure, as well as to the investigation of the complicated interplay between the material morphology and the doping mechanisms [9,10,19]. In addition, the remarkable changes observed in IR and Raman spectra upon polymer doping allowed monitoring the occurrence of de-doping phenomena and the subsequent reduction of the conductivity of the doped material.
The infrared spectra of doped polymers show strong transitions, the so-called IRAVs (IR Activated Vibrations), which provide evidence that the polymer chain hosts polarons or bipolarons, since IRAVs are silent in the IR spectrum of the pristine material [15,16,17]. However, in general, it is not straightforward to detect the vibrational transitions of the dopant because the strong IRAVs hide its spectroscopic features, either in its neutral or charged form. F4TCNQ represents a remarkable exception, thanks to its CN groups, which give rise to vibrational normal modes in a spectral region (2200 – 1900 cm-1) free from the IRAVs and other fundamental transitions of the most common conducting polymers.
Several studies on doped P3HT exploited the significant frequency shift of the CN stretching band of F4TCNQ (of about 40 cm-1) [8,9,10,11,12] in going from the neutral species to the singly charged anion. Moreover, theoretical calculations, corroborated by experimental evidence, indicate that there is an almost linear relationship between the CN stretching frequencies and the amount of electron charge transferred to F4TCNQ in charge transfer complexes (CTCs), characterized by the exchange of fractional electronic charge, at difference from integer charge transfer complexes (ITCs), which give rise to the formation of polarons. [8,9,13,14]. Moreover, some authors extensively analysed frequency shifts and broadening of the CN stretching IR bands of F4TCNQ as a function of the morphology/crystallinity degree of the host polymer [8,10].
While the frequency shift of the CN stretching modes is well recognized and exploited as a diagnostic tool for charge injection, the dramatic changes in the absorption intensity of such modes are often neglected, and less effort has been devoted to the understanding of this phenomenon.
On the other hand, any quantitative determination of the amount of ICT complexes based on the analysis of the IR features of F4TCNQ requires settling some open issues. In particular, the following points deserve our attention:
- i.
- One of the most intriguing phenomena associated with the transition from the neutral to the charged state is the reversal of the IR intensity ratio between the higher frequency B1u band, assigned to the symmetric CN stretching, and the lower frequency B2u band, assigned to the anti-symmetric CN stretching vibration. The phenomenon has been highlighted by Zhu et al. [14], using Density Functional Theory (DFT) simulations on F4TCNQ and its anion. In the present work, we will present a discussion and a rationalization of this effect based on the analysis of local IR electro-optical parameters (EOPs).
- ii.
- Both simulations and experimental data indicate that the IR intensity of the CN stretching transitions is remarkably intensified due to the anion formation. As for point i), the determination and analysis of EOPs will allow for an understanding of the origin of such enhancement.
- iii.
- Solid-state crystalline F4TCNQ samples in the neutral state show the intensity reversal phenomenon observed for the anion (point i.). This feature has been described by Zhu et al. [14], who performed DFT calculations of the spectra of the crystal. In addition to the intensity reversal, the calculations predict a remarkable increase (of about a factor of 50) of the total CN stretching IR intensity going from the isolated molecule to the crystal. Such an intriguing analogy of the IR intensity pattern of the crystal and the anion deserves an additional experimental and theoretical investigation, which could capture the effects of the intermolecular environment.
- iv.
- Several authors have applied theoretical methods to model the spectroscopic response of F4TCNQ [1,14,20]. However, at the present research stage, it is challenging to settle reliable reference values for the IR intensities of the neutral F4TCNQ molecule and its anion. Moreover, the effects of the surrounding medium on the IR intensities of the CN stretching transitions are still unexplored.
This paper, based on a DFT theoretical investigation corroborated by experimental spectroscopic data, is devoted to analysing the vibrational spectra of F4TCNQ and its singly charged anion. It aims to highlight the mechanisms at the molecular level that lead to the observed and/or simulated IR intensity behaviour.
The main achievement of this investigation is the demonstration that CN stretching IR intensities are extremely sensitive to the charge state of F4TCNQ and the polarizing effects induced by the medium surrounding it. This feature makes the theoretical modelling an extremely delicate issue and represents a significant limitation for safely using the experimental spectroscopic data to quantify the presence of neutral/charged F4TCNQ, e.g. in the case of F4TCNQ doped polymers. A strategy to manage this problem is to combine theoretical data – which lead the vibrational assignment and allow the rationalization of the observed trends - and experimental determinations of bands intensities, obtained from reference samples.
2. Materials and Methods
2,3,5,6-Tetrafluoro-7,7,8,8-tetracyanoquinodimethane (F4TCNQ) purity >99% (sublimed grade), was purchased from Ossila. Chloroform (CHCl3) and acetonitrile (CH3CN) solvents were purchased from Sigma-Aldrich. All chemicals have been used as received without further purification.
The IR absorption spectra were recorded with a Nicolet 6700 Fourier Transform InfraRed (FTIR) spectrometer coupled to a Thermo Scientific Continuμm FT-IR microscope using a 15× Cassegrain objective (4 cm–1 resolution, 128 scans). FT-Raman spectra were recorded in backscattering geometry using a Nicolet NXR9600 FT-Raman spectrometer equipped with a Thermo Scientific MicroStage Microscope for solid state measurements (1064 nm exciting laser line, 100 mW, 512 scans at 4 cm−1 resolution).
The IR spectrum of solid F4TCNQ was recorded in a Diamond Anvil Cell (DAC), using the IR microscope, and the FT-Raman spectrum was recorded directly on the solid sample deposited on an aluminum substrate.
IR spectra of solutions of F4TCNQ in chloroform (1 mg in 15.5 ml) and acetonotrile (3.6 mg in 6.5 ml) were recorded in a sealed KBr transmission cell (thickness 200 μm), while FT-Raman spectra were recorded in NMR quartz tubes.
DFT calculations were performed with the hybrid exchange-correlation (XC) functional GGA B3LYP. The People split-valence double-ζ basis set including polarization functions (6-31G**) was used. The molecular structure of F4TCNQ in each electronic state (neutral molecule and singly charged anion) was optimized, imposing a D2h symmetry; the obtained equilibrium structures were characterized by vibrational frequency calculations. IR and Raman spectra were computed at the same level of theory on top of the optimized structures. To simulate the interactions between the F4TCNQ molecule and the surrounding medium, Polarizable Continuum Model (PCM) calculations were performed. Two different dielectric constants were selected, namely ε = 4.7113 and ε = 35.6880, which correspond respectively to the case of CHCl3 and CH3CN solvents: the former tends to stabilize neutral F4TCNQ molecules, while the latter the anions. Also in the case of PCM calculations, the B3LYP functional and the 6-31G** basis set were used. All the computations were carried out with the Gaussian program [21].
3. Results and Discussion
3.1. Structure and Vibrational Properties of F4TCNQ in Its Neutral and Charged State
In Figure 1.a the sketch of F4TCNQ is illustrated. Following ref. [14], we performed structure optimization starting from a planar guess geometry by imposing the D2h point group symmetry. The same molecular symmetry has been assumed for the singly charged anion, which shows a significant relaxation of several geometrical parameters, as illustrated in Figure 1.b. The most remarkable change is the lengthening of the CC bond (#3) linking the C(CN)2 group to the ring, resulting in a sequence of four nearly equalized CC bonds, instead of the typical quinoid structure of the neutral species. Interestingly, the change of the CN bond length is rather small (RCN increases from 1.1642 Å in the neutral case to RCN = 1.1687 Å in the anion state), while CF bonds go from RCF = 1.3310 Å to RCF = 1.3455 Å.
Figure 2 compares the computed IR spectrum of F4TCNQ and F4TCNQ(-1). Looking at panel a., we can immediately grasp significant differences. Together with a general shift to lower frequencies of the main bands, a remarkable change of the intensity pattern occurs: the CN stretching absorption features above 2000 cm-1 (panel c.), which can hardly be observed in the spectrum of the neutral species, become the dominant bands of the anion, while the 1800-700 cm-1 wavenumber region bands (panel b.) are characterized by minor changes, and in some cases even an intensity reduction is registered.
Similarly to the IR spectra, the frequencies of the Raman transitions are mostly shifted to lower values, while the intensity pattern is not dramatically modified, showing a general intensification of the entire Raman spectrum in the case of the anion (Figure 3.a). However, the Raman activity when F4TCNQ passes from the neutral to the anion state presents a more significant intensification of the region below 1800 cm-1 (panel b. with respect to the CN stretching region, illustrated in panel c.).
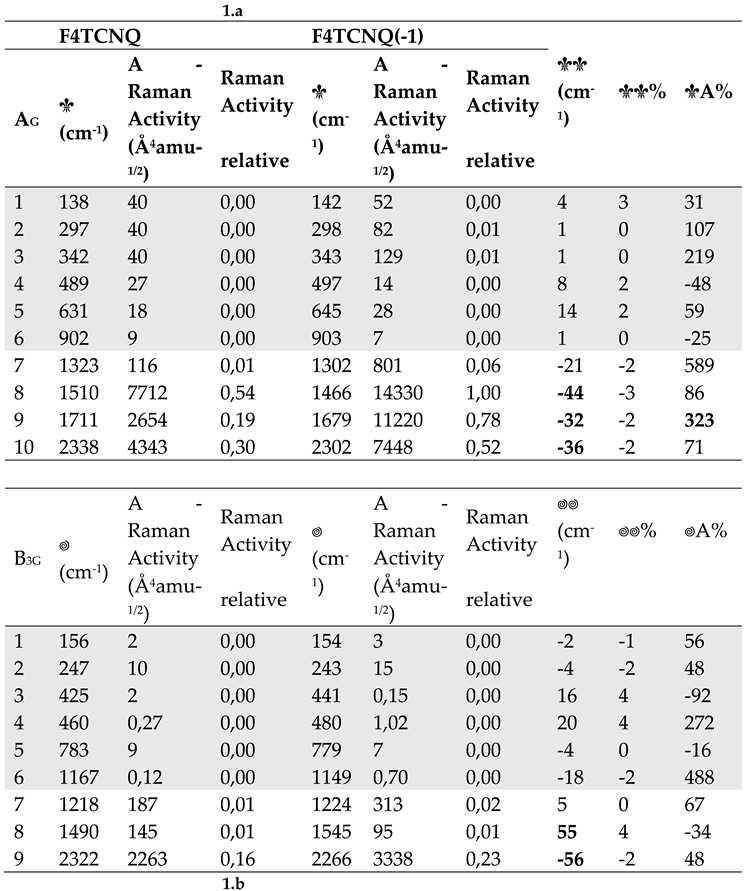
Table 1 provides quantitative information on the effects of the electron charge injection on the vibrational spectra of F4TCNQ , showing a comparison of the computed vibrational frequencies, IR absorption intensities and Raman activities of the in-plane normal modes of F4TCNQ and F4TCNQ(-1). In Supplementary Materials (Table S1) reports the same data for the very weak IR and Raman transition of the out-of-plane B3u, B1g and B2g and for the inactive Au modes. Vibrational assignment from computed modes eigenvectors is coherent with those described in ref. [20], so we decided to omit the information.
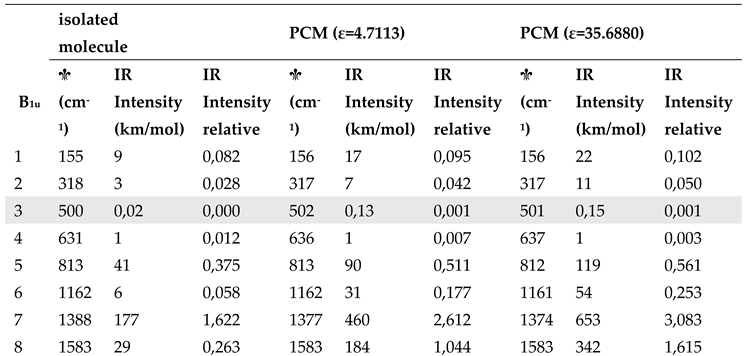
The values reported in the last three columns of Table 1 show that large shifts ( 30 cm-1) affect the transitions between 1400 and 1800 cm-1, all involving large CC stretching contributions. As widely recognized in the literature [8,9,10,13,14,20], considering both experimental observations and modelling results, the shifts of the CN stretching bands are among the largest registered (e. g., the shift of the B3g and B2u antisymmetric CN stretching modes is = 55 cm-1 according to our calculations).
Even more remarkable is the IR intensity increase of the B1u symmetric CN stretching band, which increases by more than two orders of magnitude in the spectrum of the anion. This exceptional intensification is accompanied by intensity reversal of the pair of CN stretching IR bands that show a largely dominant B1u band in the spectrum of the anion, whereas the B2u band is the strongest in the IR spectrum of the neutral molecule. The two B1u and B2u bands are assigned to the symmetric (r+) and to the anti-symmetric (r-) CN stretching of the C(CN)2 group, respectively. The peculiar intensity reversal phenomenon occurring in the anion spectrum is clearly described in ref [14], which predicted a similar feature also for the neutral F4TCNQ molecules forming a crystal, by means of DFT calculations with Periodic Boundary Conditions.
The remarkable intensity changes described above indicate the occurrence of effects that are not simply related to local changes in the charge distribution in the CN bonds. In Section 3.2, we will discuss this feature by modelling the infrared bands intensities in the framework of Electro-Optical parameters theory.
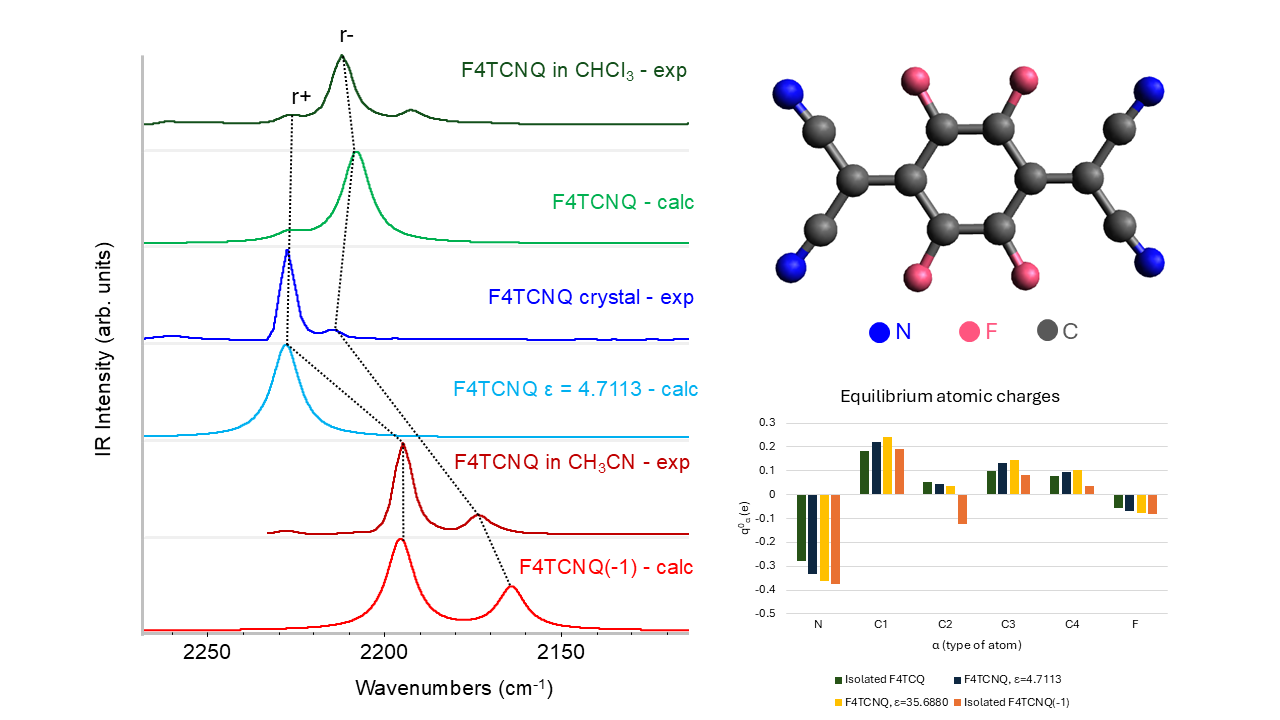
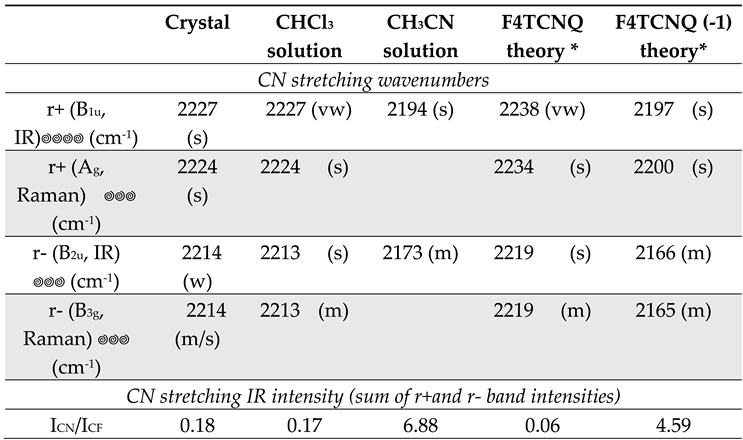
In conclusion of the analysis of the DFT spectra, we present here some experimental data which corroborate the results from theoretical modelling. Table 2 displays the IR and Raman wavenumbers of the CN stretching bands of F4TCNQ samples in different phases, namely in the solid crystalline phase and CHCl3 and CH3CN solution. According to the position of the CN stretching peaks, in the crystal and in chloroform the molecule is in the neutral state, whereas CH3CN stabilizes the anion [14]. For all the samples, the pair of frequencies observed in the Raman spectra are only slightly displaced with respect to the corresponding IR active transitions, and this feature can be easily justified as follows. Ag and B1u modes are both symmetric CN stretching (r+) of the two C(CN)2 groups, which vibrate in phase (Ag) or out-of-phase (B1u): the phase has a limited effect on their frequencies, because of the small dynamical coupling of the two C(CN)2 units, since they are separated by the phenyl ring. The argument applies also to the r- vibrations, belonging to B2u and B3g symmetry species. The observed behaviour is fully accounted for by our theoretical predictions obtained with DFT calculations on the isolated F4TCNQ and F4TCNQ(-1).
The comparison between experimental infrared and Raman spectra definitely proves the vibrational assignment of the r+ modes to the higher frequency band of the pair. The Raman spectra reported in Figure 4 show that the stronger band is at a higher wavenumber, suggesting that it is associated with a mode belonging to the totally symmetric irreducible representation - Ag, in this case – since totally symmetric modes usually display higher Raman activities. The assignment of the Raman transitions implies that the higher frequency IR band, at a wavenumber close to the Ag mode, is assigned to the B1u mode. In the case of the CHCl3 solution, this conclusion is not trivial because of the very low intensity of the B1u band, which could make its identification as a fundamental transition questionable. The intensity pattern of the DFT IR spectrum of the isolated F4TCNQ molecule fits very well with the one observed for the CHCl3 solution, showing the main B2u band at the lower frequency. Interestingly, in the experimental IR spectrum of the F4TCNQ crystal, the two CN stretching bands show the opposite intensity trend compared to the CHCl3 solution, even if the wavenumbers in the solid and solution phases are practically coincident.
Table 2 reports also relative IR bands intensities obtained as the ratio between the integral of the two CN stretching bands and the CF stretching band (at 976 cm-1 for the neutral molecule and at 967 cm-1 for the anion). The experimental ratios, ICN/ICF , are compared with the corresponding DFT values, which show the same trend experimentally observed going from the neutral molecule in CHCl3 to the anion in CH3CN solution. The experimental intensity ratio of the anion increases by a factor of 40 because of the remarkable enhancement of the CN stretching intensities. On the other hand, the agreement between the theoretical prediction and the experiment is only qualitative, since, according to DFT calculation, ICN/ICF of the anion should increase 76 times. This observation seems to suggest that the calculation overestimates the effect of the charge injection on the IR spectrum, but also numerical errors can explain this discrepancy because of the very low intensity of the CN stretching bands of the neutral molecule.
In conclusion, the experimental spectra reported in Figure 4 provide experimental proof that DFT calculations give the correct vibrational assignment of r+ and r- bands and show the intensity reversal phenomenon occurring in the IR spectrum of the anion and of crystalline F4TCNQ in the neutral state.
3.2. Electrooptical Parameters and IR Intensities
The use of the Electro-Optical Parameters (EOP) theory [22,23,24] allows the modelling of the CN stretching IR intensities of the two IR active B1u and B2u modes and highlights that the observed (and computed) intensity pattern is peculiar, because of non-local effects of the CN stretching vibration on the electron charge distribution in the whole molecule.
It is instructive to start with the simplest model, which describes molecular dipole derivatives with CN stretching modes in terms of fluctuations of local dipoles associated to the CN bonds.
A normal coordinate (Q) corresponding to a localized CN stretching mode almost coincides with the proper vibrational symmetry coordinate , namely:
and
where are the CN stretching coordinates of F4TCNQ (see Supplementary Materials, Figure S1 for the definition); for a given symmetry coordinate, we can write:
Because of the orthogonality in the definition of the symmetry coordinates [25] (with ) the terms are given by the same coefficients that defineas a linear combination of the coordinates (Equations 1,2). The EOP theory [22,23,24], which models the molecular dipole moment as a sum of bond dipoles: , where the sum, in principle, should be extended to all the bonds of the molecules. We obtain:
Equation 4 can be greatly simplified if we have assume that the contributions to come just by the local diagonal parameters, namely by the bond dipole derivatives of the vibrating bond, i.e. . We obtain the general expression:
where are the bond dipole vectors associated to the four CN bonds. For symmetry reasons, the absolute value of the four dipole derivatives is the same: = Equations 6, 7 provide the expressions of the dipole derivatives of the two CN normal modes:
is the valence angle between adjacent C-CN groups, . In the above equations, starting from Equation 3, all the derivatives are evaluated at the equilibrium geometry of the molecule, e. g. . Hereafter, we will omit the label “0” for all the derivatives to simplify the notation.
The physical meaning of the local parameter is better highlighted in the framework of the Equilibrium Charges-Charge Fluxes (ECCF) model [24,26]. The ECCF model splits the bond dipole moment derivative in a contribution due to the displacement of the partial charge associated to the Nitrogen atom (Equilibrium Charge) and a contribution arising from a charge flux which occurs along the CN bond, according to the relationship: The IR absorption intensity associated to the transition of a normal mode is , where C is a constant which depends on the adopted units. By using Equations 6, 7 we can compute the ratio R of the IR intensities of the r- mode vs. the r+ mode:
Equation 8 states that the IR intensity of the B2u anti-symmetric stretching is about three times larger than that of the B1u symmetric stretching band.
For the neutral molecule, the intensity data in Table 1.b show that the CN stretching bands follow the correct relationship ( ), even though the computed intensity ratio R 10 largely exceeds the value of 3. On the other hand, the intensity reversal observed in the case of the anion (R = 0.46), together with the dramatic increase of the whole CN stretching intensities, definitely indicates that the approximation which leads to Equation 8 , based on local EOPs, is totally unsuitable.
Two different factors can modify the ratio , which largely differs from the value predicted according to Equation 5 both for F4TCNQ and F4TCNQ(-1):
Normal modes assigned to CN stretching involve other vibrational coordinates in addition to the CN stretching symmetry coordinates described by Equations 1, 2.
- (i)
- the rationalization based only on the diagonal CN stretching bond dipole derivatives , is an excessively rough approximation.
- (ii)
The derivative of the molecular dipole with respect to the normal coordinate can be expressed as:
where are the elements of the vibrational eigenvector associated to (basis of internal valence coordinates, ). The sketches of the vibrational eigenvectors of the CN stretching modes (Figure 5.b) show that the vibration involves the stretching of the CN bonds, remarkably coupled with the stretching of the CC bonds belonging to C-CN group, which oscillate out-of-phase with respect to CN stretching coordinates. As a consequence, in equation 9 both contributions from CN and CC stretching vibrations ( and in Figure 5) are important, the relevant parameters are therefore in Figure 5.a.
The most remarkable indication, from Figure 5.a, is that the value of changes dramatically going from the neutral molecule to the anion. In particular and increase by a factor 29 and 6 respectively, being the stretching parameter with the highest value in the case of the anion. Indeed, the value of explains the huge intensity change of the CN stretching modes of the anion. Interestingly, the parameter, namely the dipole derivative with respect to the stretching of the C-CN bond, which is rather small both for the molecule and for the anion, has opposite sign in the two (neutral and charged) species.
shows a peculiar feature, namely its z component (right panel in Figure 5.a) is larger than its y component (left panel) both for F4TCNQ and F4TCNQ(-1). In the hypothesis that the dipole oscillation were localized on the CN bond which stretches, we should write , which implies , in complete disagreement with the calculated values. The result parallels the conclusions reached through the analysis of (see above) and indicates that a remarkable non-local charge fluctuation is induced by the CN stretching vibration.
For sake of completeness, we performed the analysis of the polarizability derivatives with respect to the internal stretching coordinates, which mostly contribute to the Raman intensities of the stretching modes, namely the parameters . Since the component of these tensors is the dominant one, we reported in Figure S2 the comparison of the parameters obtained for F4TCNQ and F4TCNQ(-1). The behaviour of and , showing a small increase in the case of the anion, explains why the Raman activity of the CN stretching bands is only slightly affected by the charge injection. Instead,has the largest value, and changes significantly going to the anion, a property which is certainly correlated with the fact that is subjected to the most relevant bond length change passing from the neutral to the charged species (Figure 1.b). Since the largest parameters and the largest changes are associated to the stretching of CC bonds, it is evident why the Raman spectra of F4TCNQ and F4TCNQ(-1) show the most significant differences in the region below 1800 cm-1, and in particular for totally symmetric normal modes involving CC stretching vibrations.
3.3. Atomic Polar Tensors (APT) Analysis.
In this paragraph we present a discussion of the IR intensity parameters which better highlights the properties of the electronic charge and its mobility in F4TCNQ and its anion. The computed IR atomic polar tensors (APTs) allow obtaining a description of the charge distribution in molecules by means of partial charges on individual atoms (IR atomic charges). [24,27,28]
The Atomic Polar Tensor of atom α is a 3×3 tensor, which collects the three Cartesian components of the derivative of the molecular dipole moment with respect to the Cartesian displacements of the atom a, namely: where the derivatives are evaluated at the equilibrium geometry. are often referred to as Born Charges and are used for the calculation of the dipole moment derivatives with respect to the normal modes according to the relationship:
where the vectors collect the cartesian displacements of all the atoms. Equation 10 is analogous to Equation 9, it holds when the basis set corresponds to atomic Cartesian displacements instead of internal coordinates. APTs and the vibrational eigenvectors are computed for the DFT simulated spectra.
In the case of a planar molecule, with the x axis normal to the molecular plane, atomic charges can be obtained as This relationship provides a physically robust definition of point atomic charges [27], which can be fully adopted for the definition of the expression of the equilibrium molecular dipole moment: , where is the set of position vectors of the atoms at the equilibrium.
Figure 6 displays APTs derived point atomic charges for each atom of F4TCNQ and F4TCNQ(-1). The negative point charges of N and of C2 atoms of the anion are remarkably different from those of the neutral molecule. By considering the group C(CN)2 as a whole, the total charge of the group is about -0.5 e for F4TCNQ(-1), meaning that the integer electron transferred to the molecule mainly resides on the two C(CN)2 groups. Interestingly, even if the excess of charge is localized on the end groups, the geometry of the whole molecule relaxes upon charging, as illustrated in Section 3.1.
In Figure 6, APT charges for neutral F4TCNQ are also reported as derived from DFT calculations for the molecule in a dielectric environment, by applying the Polarizable Continuum Medium (PCM) model [29], which takes into account the polarizing effect of a homogeneous medium characterized by its dielectric constant. The effect of the surrounding medium on the Nitrogen charge is relevant; in the case with ε = 35.6880, it reaches a value close to that obtained for the anion in vacuum. This effect will be discussed in Section 3.3, in conjunction with the analysis of the evolution of the IR spectrum as obtained with the PCM approach.
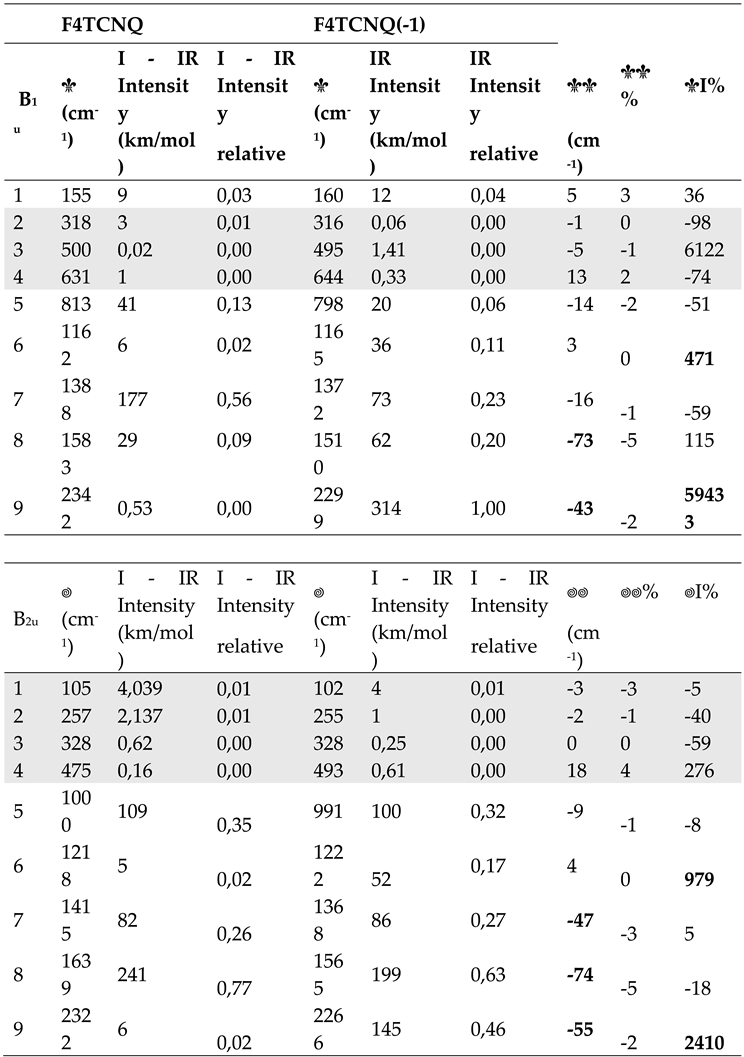
Table 3 provides additional details, focusing on the APT of the nitrogen atom.
For planar molecules it is possible to split APTs in Charge and Charge Flux contributions ( and respectively). is a spherical tensor with the three diagonal elements corresponding to the atomic charge value; is obtained from the whole by subtracting the equilibrium charge value to its diagonal elements [30]. The whole APT of Nitrogen and its Charge Flux contribution are reported in Table 3.
Any element of can be expressed, in the framework of the Effective Charges and Charge Fluxes (ECCF) theory [24,26], as a function the charge fluxes on the individual atoms, induced by the displacement of atom . In the case of Nitrogen: ), where is the set of charge fluxes on each atom β of the molecule. To obtain values of charge fluxes from APT it is usually necessary to make the hypothesis that some fluxes can be neglected, and is set to 0, for far from N.
If the tensor is rotated in the bond axis system (X,Y,Z), where the Z axis is oriented along the CN bond (sketch in Table 3), the expression of some tensor elements simplifies. According to the bond reference system, the displacements results in the stretching of the CN bond, and only charge fluxes induced by the CN bond stretching can contribute to the tensor elements . We have obtained the following relationships:
Eqs 11 and 12 are derived in the hypothesis that the CN stretching does not induce charge fluxes on atoms further than C3 from N. Because the total charge is conserved during vibrational displacements, we have , which allows to obtain the expression for the charge flux on atom C1:
Interestingly, fluxes on the atoms which form the CN bond do not appear in the expression for (Equation 11). Moreover, while usually off diagonal APT terms are small, in the case of the anion the term has a value comparable to the diagonal components (refer to Table 3.a), thus confirming that non-local fluctuation of the charge is associated to the CN stretching. In the case of the neutral molecule, is still comparable to , but with rather small values. Considering that and are the leading terms in the calculation of the CN stretching intensities through Equation 7, it is now evident why the CN stretching IR transitions are so weak for the neutral F4TCNQ molecule. The split of into charge and charge flux contributions clearly shows that its very small value comes from a balance between the two terms: the contribution of the negative charge (-0.277 e) is almost compensated by a large flux of 0.206 e, with the opposite sign.
From Table 3.b, showing the ECCF parameters obtained from APT, it appears that the charge flux affecting C3, , is large in the case of anion and for the neutral molecule in the case of PCM calculations. While CN bond stretches, the atom C3, belonging to the phenyl group, becomes more positive, namely some amount of negative charge is transferred from the ring to the group C(CN)2. The above observation suggests an intriguing interpretation of the large CN stretching intensity of the B1u band of the anion, corresponding to a normal mode where the group C(CN)2 on the right stretches out of phase with the group C(CN)2 on the left. A positive stretching on the left C(CN)2 group causes a withdrawal of negative charge from the ring, while the simultaneous shrink (negative stretching) of C(CN)2 on the right determines an injection of the same amount of charge on the ring. Thus, for the anion, the B1u stretching mode is a vibration capable to promote an exchange of the excess electronic charge between the two end groups C(CN)2, which is “mediated” by the phenyl ring.
Unfortunately, the data are not enough to calculate the individual charge fluxes on N and C2, but the remarkable variation of the value corresponding to their combination (see Table 3.b) suggests that fluxes different from the so called “principal flux” become important when the electron charge is injected, or because of the interaction with a polarizing medium.
3.3. Solid vs Solution: Effect of the Intermolecular Environment.
As already observed, the experimental IR spectrum of solid, crystalline F4TCNQ (Figure 4) shows the phenomenon of the intensity reversal between the B1u and B2u bands, which is evident by direct comparison with the spectrum of the neutral molecule in CHCl3 solution. As pointed out by ref. [14], DFT calculations on the isolated neutral molecule fully agree with the intensity pattern of F4TCNQ in Chloroform solution, while Periodic Boundary Condition (PBC) simulations for the F4TCNQ crystal predict the observed intensity reversal phenomenon. Moreover, according to the calculations reported in [14], the CN stretching IR intensities show a remarkable increase. According to ref. [14], the whole CN stretching intensity (per molecule) amounts to 319 Km mol-1 for the crystal, meaning that its predicted value is of the same order of magnitude as the total CN stretching intensity of the isolated anion (618 Km mol-1 or 458 Km mol-1 according to ref. [14], and our calculations respectively, namely about two orders of magnitude larger than in the case of the neutral isolated molecule, for which our computations show a value of 6.53 km mol-1). This feature is noticeable, especially considering that the intensity reversal is a typical phenomenon observed – and predicted – for the anion, while the molecules in the crystal are neutral and the CN stretching wavenumbers in the solid phase and in solution are practically coincident (refer to Figure 4).
Aiming to highlight the role of the surrounding crystal on F4TCNQ in the solid state, we simulated the effect of a dielectric medium by means of PCM method. The results are illustrated in Table 4 (the complete data set is reported in Table S2). Spectra obtained with DFT-PCM calculations are illustrated in Supplementary Materials (Figures S3 and S4). We observe:
- i.
- The effect of a surrounding polarizing medium on the structural parameters of neutral F4TCNQ is much less significant than that on its vibrational properties: bond lengths are unaltered passing form the case of the isolated molecule to calculations with a dielectric constant, as it clearly appears from Figure S5.
- ii.
- A general increase of the IR bands intensity in the whole IR spectrum calculated with the PCM method.
- iii.
- According to PCM results, there are very small shifts of the IR and Raman wavenumbers, with the exception of few modes, e.g. the B1u mode #7 in Table 4, in the region 1350 - 1500 cm-1.
- iv.
- Also after normalization to the band at about 1000 cm-1, which was adopted as internal standard in the analysis of the IR intensities of the experimental spectra, the intensity pattern of the B1u transitions is appreciably modified in PCM calculations. In particular the B1u CN stretching band is remarkably intensified, giving rise to the reversal intensity phenomenon, already observed for the anion.
We can conclude that:
- The IR intensity reversal between r- and r+ IR bands is a phenomenon not directly related to the charge injection, but it can be induced also by the surrounding medium. On the other hand, looking at the atomic charges and the APTs (Table 3) it is evident that the charge distribution in the C-(CN)2 group, as well as the charge mobility in the whole molecule, is remarkably affected by the presence of a dielectric medium.
- The intensity reversal observed (and predicted) for the crystal can be explained based on polarization mechanisms mimicked by PCM calculations.
- It is difficult, at this stage of the investigation, to clearly state if the intensity reversal observed for the crystal is accompanied or not by a significant intensification of the CN stretching intensities with respect to the case of the isolated molecules, as predicted by the simulations of the crystal performed by Zhu at al. [14] and with PCM calculations for the neutral molecule. The comparison of the experimental intensity data of the crystal with those of the molecule in CHCl3 solution indicate that the intensity ratio between the total integrated CN stretching intensity and the reference CF stretching band at 976 cm-1, ICN/ICF, is practically the same (ICN/ICF = 0.18 and 0.17 for the crystal and for F4TCNQ in solution, respectively, see Table 2). Instead, according to the theoretical predictions, the ratio markedly increases in going from the isolated molecule in vacuum (ICN/ICF= 0.06) to the DFT-PCM (ε=4.7113) prediction (ICN/ICF = 4.5), because of the huge intensification (more than two order of magnitude) of the B1u band (from 0.56 Km mol-1 to 80 Km mol-1) while the CF stretching reference band in the PCM calculation increases only by a factor of 1.6.
The issue illustrated at point 3 suggests that both the calculation for the crystal and PCM computations predict overestimated CN stretching intensities for F4TCNQ, and that these data should be used with great caution while interpreting the intensity pattern in experimental spectra.
In this regard, it is worth mentioning that, in the PCM calculations performed in this work, we have chosen values of ε corresponding to the dielectric constants of Chloroform (ε=4.7113) and Acetonitrile (ε=35.6880). In principle, the experimental spectra of F4TCNQ solutions should be better described by PCM results, but this is not the case. The intensity reversal predicted with PCM, already for ε=4.7113, is not observed experimentally in CHCl3 solution; moreover, the experimental ratio ICN/ICF is overestimated by PCM. Similarly, the PCM calculation for the anion in Acetonitrile (Table S2) gives too high a value of ICN/ICF =9.9 (compared to the data in Table 2).
3.4. Doping Diagnosis via IR Spectra: F4TCNQ-P3HT Doping in Solution
In Figure 7 we report the experimental IR spectra – CN stretching region – of three chloroform solutions containing P3HT and F4TCNQ in different relative concentration. The molar ratio P3HT:F4TCNQ was 1:1, 5:1 and 25:1 in the three solutions (the ratio refers to moles of individual thiophene rings of the polymer). It is known that the doping of the polymer occurs already in solution [5,11,12], as it can be inferred focusing on the characteristic IRAV bands of the polymer [31]. The effectiveness of the doping depends on the relative concentration of F4TCNQ and P3HT, as shown in Figure 7. All the solutions clearly show the two bands assigned to the anion, while the B2u feature of F4TCNQ in its neutral state can be identified for 1:1 and 25:1 solutions, while cannot be detected in the case 5:1.
If the different intrinsic absolute IR intensity of the neutral species and of the anion is not considered, one can reach the conclusion that the 5:1 concentration guarantees that the charge transfer reaction between F4TCNQ and the polymer has a yield very close to 100%, which seems to be an unphysical result. Indeed, the above estimate can be totally wrong because of the remarkably different CN stretching bands intensity of the neutral and the charged species.
According to the experimental data reported in Table 2, we can state that the total CN stretching intensity increases by a factor 40, going from the neutral molecule to the anion. This means that the occurrence of a CN stretching band of the neutral molecule as strong as that of the anion bands implies that only 1/40, i.e. the 2.5% of the total amount of F4TCQ molecules are involved in the doping. This is the situation we observe at lower F4TCNQ concentration (25:1) and when we operate with a large excess of dopant (case 1:1). On the other hand, in the hypothesis that 50% of F4TCNQ molecules were involved in the doping, the CN stretching intensity of the bands of the anion would be 40 times stronger than the CN stretching band of the neutral species, which would make it rather hard to detect unreacted neutral F4TCNQ molecules in the experimental spectrum. Even if it is evident that the 5:1 ratio noticeably increases the doping effectiveness in solution, the above argument suggests that in the 5:1 case the doping yield could be significantly far from 100%.
This qualitative discussion could be improved by means of an accurate post-processing of the experimental spectra, by means of curve fitting procedures which can provide the intensities (integrated areas) of the individual band components, thus allowing a reliable quantitative determination of the relative concentration of anions and neutral F4TCNQ molecules in a P3HT-F4TCNQ solution.
Unfortunately, the quantitative determination of the doping in solid state samples still remains a challenge. The intermolecular environment can heavily affect the intensities of the CN stretching band of F4TCNQ, as clearly demonstrated by the intensity reversal phenomenon experimentally observed in the case of crystalline F4TCNQ samples and predicted both by DFT calculations of the crystal and by DFT-PCM methods. However, the comparison between the predicted and the experimental intensity pattern raised some doubts about the soundness of the theoretically calculated intensity values. Moreover, in real solid-state samples of doped polymers, the intermolecular environment of the anions and of the “unreacted” dopant molecules is rather complex. Indeed, the morphology of a polymer sample results from the interplay of crystalline and amorphous domains, whose relative amount and sizes are affected by the chemical structure, e.g. by the molecular weight distribution and degree of regularity of the polymer chains, as well as by the material preparation and processing. Both crystalline and amorphous phases are involved in the doping process, in different ways and to a different extent. Moreover, together with integer charge transfer (ICT) polymer/dopant complex, fractional charge transfer complexes (CTC) have been recognized and detected based on the frequency shifts of their CN stretching bands [8,9,10], which have been successfully modelled by means of DFT calculations [14,20]. Also in the case of CTC species, the determination of reliable intensity parameters is an open challenge.
4. Conclusions
We carried out DFT calculations and spectroscopic experiments on F4TCNQ and its singly charged anion F4TCNQ(-1) to highlight how the charge state and the intermolecular environment affect its spectroscopic features. Purpose of this study is to support the interpretation of the vibrational spectra of F4TCNQ doped polymers, and in particular IR spectra of doped P3HT samples.
Calculations and experiments confirm the vibrational assignments - already reported in the literature - in the CN stretching region:
- -
- both in the case of the neutral molecule and the anion. The comparison between experimental IR and Raman spectra proves that DFT modelling provides the correct assignment.
- -
- The CN stretching bands of the anion show a remarkable downward shift (about 40 cm-1) with respect to the neutral molecule.
- -
- IR intensities of CN stretching bands are extremely sensitive to the charge state and to the environment:
- -
- r+ and r- CN stretching bands show intensity reversal in going from the neutral state, where , to the anion where Interestingly, in the crystalline phase of the solid state the same intensity reversal is observed.
- -
- A huge enhancement of the CN stretching IR intensities of about 2 orders of magnitude, occurs while going from F4TCNQ to F4TCNQ(-1). The correctness of DFT calculations prediction is experimentally proven considering the significant change of the intensity ratio between the CN and CF stretching bands (CF stretching at about 970 cm-1 can be taken as an internal standard since its intensity is stable in the neutral species and in the anion).
A detailed analysis of the IR intensity parameters from DFT calculations, in the framework of EOP and ECCF theories, allows to obtain a description of the charge distribution of F4TCNQ and F4TCNQ(-1), based on atomic point charges, and shows that the negative charge excess resides mainly on the C(CN)2 groups of the anion. Moreover, the huge IR intensity of the B1u r+ mode of the anion can be rationalized only considering a flow of negative charge from the phenyl ring to the C(CN)2 group, during CN stretching vibration.
This study demonstrates that the use of IR spectra (CN region) for the quantification of the doping extent in F4TCNQ/P3HT samples requires knowing the intrinsic absolute CN stretching intensity of the neutral molecule and of the anion. DFT calculations provide reliable intensity values for the diagnosis in solution, where isolated F4TCNQ and F4TCNQ(-1) are good models.
However, a word of caution must be said in the case of solid state environments (e. g. in F4TCNQ/P3HT solid samples). Because of the remarkable effect of the environment - at this stage of the knowledge - reliable CN stretching intensity values are not available and any quantitative estimate could be greatly affected.
Supplementary Materials
The following supporting information can be downloaded at: preprints.org, Figure S1: Sketch of F4TCNQ with the labelling of the four CN stretching coordinates; Figure S2: Calculated polarizability derivatives with respect to individual bond stretchings; Figure S3: Comparison between the DFT computed infrared spectra of F4TCNQ in the isolated state and in two different solvents; Figure S4: Comparison between the DFT computed Raman spectra of F4TCNQ in the isolated state and in two different solvents; Figure S5: Comparison between DFT computed bond length of F4TCNQ in the isolated state and in two different solvents; Table S1: a. Computed wavenumber and Raman Activities of vibrational transitions of F4TCNQ and F4TCNQ(-1) (B1g and B2g normal modes); b. Computed wavenumber and Infrared Intensities of vibrational transitions of F4TCNQ and F4TCNQ(-1)(B3u and Au normal modes); Table S2: Computed wavenumbers, Raman Activities and Infrared Intensities of the vibrational transitions of F4TCNQ in the isolated state and in two different solvents.
Author Contributions
Conceptualization, C.S. and C.C; methodology, C.S. L. B., M.T.; validation, C.S., L.B. M.D.Z.; formal analysis, C.C. M.T.; investigation, C.S., L. B., C.C.; data curation, C.S., C.C., and M.D.Z.; writing—original draft preparation, C.C., M.D.Z.; writing—review and editing, C.C., C.S., M.T.; M.D.Z and G.Z.; supervision, C.C., M.T.; funding acquisition, C.C., M.T. All authors have read and agreed to the published version of the manuscript.
Funding
This research received no external funding.
Institutional Review Board Statement
Not applicable.
Informed Consent Statement
Not applicable.
Data Availability Statement
Data is contained within the article or supplementary materials.
Conflicts of Interest
The authors declare no conflicts of interest.
References
- Meneghetti, M.; Pecile, C. Charge–transfer organic crystals: Molecular vibrations and spectroscopic effects of electron–molecular vibration coupling of the strong electron acceptor TCNQF4. J. Chem. Phys. 1986, 84, 4149–4162. [Google Scholar] [CrossRef]
- Sutton, A.L.; Abrahams, B.F.; D'Alessandro, D.M.; Hudson, T.A.; Robson, R.; Usov, P.M. Structural and optical investigations of charge transfer complexes involving the radical anions of TCNQ and F4TCNQ. CrystEngComm 2016, 18, 8906–8914. [Google Scholar] [CrossRef]
- Yim, K.-H.; Whiting, G. L.; Murphy, C. E.; Halls, J. J. M.; Burroughes, J. H.; Friend, R. H.; Kim, J.-S. Controlling Electrical Properties of Conjugated Polymers via a Solution-Based p-Type Doping. Adv. Mater. 2008, 20, 3319–3324. [Google Scholar] [CrossRef]
- Hamidi-Sakr, A.; Biniek, L.; Bantignies, J.-L.; Maurin, D.; Herrmann, L.; Leclerc, N.; Lévêque, P.; Vijayakumar, V.; Zimmermann, N.; Brinkmann, M. A Versatile Method to Fabricate Highly In-Plane Aligned Conducting Polymer Films with Anisotropic Charge Transport and Thermoelectric Properties: The Key Role of Alkyl Side Chain Layers on the Doping Mechanism. Adv. Funct. Mater. 2017, 27, 1700173. [Google Scholar] [CrossRef]
- Gao, J.; Niles, E.T.; Grey, J.K. Aggregates promote efficient charge transfer doping of Poly(3- hexylthiophene). J Phys Chem Lett, 2953. [Google Scholar]
- Scholes, D.T.; Yee, P.Y.; Lindemuth, J.R.; Kang, H.; Onorato, J.; Ghosh, R.; Luscombe, C.K.; Spano, F.C.; Tolbert, S.H.; Schwartz, B.J. The Effects of Crystallinity on Charge Transport and the Structure of Sequentially Processed F4TCNQ-Doped Conjugated Polymer Films. Adv Funct Mater 2017, 27, 1702654. [Google Scholar] [CrossRef]
- Duong, D.T.; Wang, C.; Antono, E.; Toney, M.F. , Salleo, A. The chemical and structural origin of efficient p-type doping in P3HT, Organic Electronics 2013, 14, 1330–1336. [CrossRef]
- Stanfield, D.A.; Wu, Y.; Tolbert, S.H.; Schwartz, B.J. Controlling the Formation of Charge Transfer Complexes in Chemically Doped Semiconducting Polymers, Chemistry of Materials 2021, 33, 2343–2356. [CrossRef]
- Jacobs, I.E.; Cendra, C.; Harrelson, T.F.; Bedolla Valdez, Z.I.; Faller, R.; Salleo, A.; Moule, A.J. Polymorphism controls the degree of charge transfer in a molecularly doped semiconducting polymer, Mater. Horiz. 2018, 5, 655–660. [Google Scholar] [CrossRef]
- Stanfield, D.A.; Mehmedović, Z.; Schwartz, B.J. ; Vibrational Stark Effect Mapping of Polaron Delocalization in Chemically Doped Conjugated Polymers. Chem. Mater. 2021, 33, 8489–8500. [Google Scholar] [CrossRef]
- Müller, L.; Nanova, D.; Glaser, T.; Beck, S.; Pucci, A.; Kast, A.K.; Schröder, R.R.; Mankel, E.; Pingel, P.; Neher, D.; Kowalsky, W.; Lovrincic, R. Charge-Transfer-Solvent Interaction Predefines Doping Efficiency in p-Doped P3HT Films. Chem Mater 2016, 28, 4432–4439. [Google Scholar] [CrossRef]
- Hase, H.; Berteau-Rainville, M.; Charoughchi, S.; Bodlos, W.; Orgiu, E.; Salzmann, I. Critical dopant concentrations govern integer and fractional charge-transfer phases in doped P3HT. J. Phys. Mater. 0140. [Google Scholar]
- Pingel, P.; Zhu, L.; Park, K. S.; Vogel, J. O.; Eung-Gun Kim, S. J.; Rabe, J. P.; Brédas, J.-L. Charge-Transfer Localization in Molecularly Doped Thiophene-Based Donor Polymers, N. K., J. Phys. Chem. Lett. 2010, 1, 2037–2041. [CrossRef]
- Zhu, L.; Kim, E.-G.; Yi, Y.; Brédas, J.-L. Charge Transfer in Molecular Complexes with 2,3,5,6-Tetrafluoro-7,7,8,8-tetracyanoquinodimethane (F4-TCNQ): A Density Functional Theory Study, Chem. Mater. 2011, 23, 5149−5159. dx.doi.org/10. 1021. [Google Scholar]
- Gussoni, M.; Castiglioni, C.; Zerbi, G. Vibrational spectroscopy of polyconjugated materials: polyacetylene and polyenes. In Spectroscopy of Advanced Materials; Clark, R. J. J., Hester, R. E., Eds.; Wiley: Chichester, England, 1991; Volume 19. [Google Scholar]
- Ehrenfreund, E.; Vardeny, Z.; Brafman, O.; Horovitz, B. Amplitude and phase modes in trans-polyacetylene: Resonant Raman scattering and induced infrared activity. Phys Rev B Condens Matter 1987, 36, 1535–1553. [Google Scholar] [CrossRef] [PubMed]
- Saporiti, C.; Brambilla, L.; Fazzi, D.; Castiglioni, C. Insights into the Structural and Vibrational Properties of Polaron in Doped Poly(3-alkyl-thiophene), P3HT. J Phys Chem C. 2024, 128, 5189–5205. [Google Scholar] [CrossRef]
- Arrigoni, A.; Brambilla, L.; Castiglioni, C.; Bertarelli, C. Conducting Electrospun Nanofibres: Monitoring of Iodine Doping of P3HT through Infrared (IRAV) and Raman (RaAV) Polaron Spectroscopic Features. Nanomaterials 2022, 12, 4308. [Google Scholar] [CrossRef] [PubMed]
- Arrigoni, A.; Brambilla, L.; Bertarelli, C.; Saporiti, C.; Castiglioni, C. Conducting Electrospun Poly(3-hexylthiophene-2,5-diyl) Nanofibers: New Strategies for Effective Chemical Doping and its Assessment Using Infrared Spectroscopy, Appl. Spectrosc. 2024. [Google Scholar] [CrossRef]
- Vo, N.; Le, T.H.; Thompson, C.D.; Bond, A.M.; Martin, L.L.; Haworth, N.L.; Lu, J. Diagnosis of the Redox Levels of TCNQF4 Compounds Using Vibrational Spectroscopy, ChemPlusChem 2014, 79, 962–97. [CrossRef]
- Frisch, M.J.; Trucks, G.W.; Schlegel, H.B.; Scuseria, G.E.; Robb, M.A.; Cheeseman, J.R.; Scalmani, G.; Barone, V.; Mennucci, B.; Petersson, G.A.; Nakatsuji, H. ; M. Caricato, Li, X.; Hratchian, H.P.; Izmaylov, A.F.; Bloino, J.; Zheng, G.; Sonnenberg, J. L.; Hada, M.; Ehara, M.; Toyota, K.; Fukuda, R. ; Hasegawa, J.; Ishida, M.; Nakajima, T.; Honda, Y.; Kitao, O.; Nakai, H.; Vreven, T. ; Montgomery, Jr. J.A., Peralta, J.E.; Ogliaro, F.; Bearpark, M.; Heyd, J.J.; Brothers, E.; Kudin, K.N.; Staroverov, V.N.; Kobayashi, R.; Normand, J.; Raghavachari, K.; Rendell, A.; Burant, J.C.; Iyengar, S.S.; Tomasi, J., Cossi, M.; Rega, N.; Millam, J.M.; Klene, M.; Knox, J.E.; Cross, J B.; Bakken, V.; Adamo, C.; Jaramillo, J.; Gomperts, R.; Stratmann, R.E.; Yazyev, O.; Austin, A.J.; Cammi, R.; Pomelli, C.; Ochterski, J.W.; Martin, R.L.; Morokuma, K.; Zakrzewski, V.G.; Voth, G.A.; Salvador, P.; Dannenberg, J.J.; Dapprich, S.; Daniels, A.D.; Farkas, Ö.; Foresman, J.B.; Ortiz, J. V.; Cioslowski, J.; Fox, D.J. Gaussian 09; Gaussian, Inc., 2009.
- Person, W.B.; Zerbi, G. Vibrational Intensities in Infrared and Raman Spectroscopy, Elsevier: Amsterdam, 1982.
- Gribov, L.A. Intensity Theory for Infrared Spectra of Polyatomic Molecules, Consultants’ Bureau: New York, 1964.
- Gussoni, M.; Castiglioni, C.; Zerbi, G. Vibrational Intensities: Interpretation and use for diagnostic purposes. In Handbook of vibrational spectroscopy; Chalmers, J.M., Griffiths, P.R., Eds.; Wiley: London, UK, 2001; Volume 3. [Google Scholar]
- Wilson, E.B.; Decius, J.C.; Cross, P.C. Molecular Vibrations, McGraw-Hill: New York, 1955.
- Decius, J.C. An effective atomic charge model for infrared intensities, J. Mol. Spectrosc. 1975, 57, 348–362. [Google Scholar] [CrossRef]
- Dinur, U. Charge Flux and Electrostatic Forces in Planar Molecules. J Phys Chem 1991, 95, 6201–6211. [Google Scholar] [CrossRef]
- Milani, A.; Castiglioni, C. Atomic Charges from Atomic Polar Tensors: A Comparison of Methods. J. Mol. Struct. THEOCHEM 2010, 955, 158–164. [Google Scholar] [CrossRef]
- Mennucci, B. Polarizable continuum model, WIREs Comput Mol Sci 2012, 2, 386–404. [CrossRef]
- Prasad, P. L. , Infrared intensities: Polar tensors and charge flux parameters, J. Chem. Phys. 1978, 69, 4403–4410. [Google Scholar] [CrossRef]
- Doti, S. Polarons in P3HT: unravelling vibrational fingerprints of ordered and disordered doped phases in solids and solutions. IR and Raman study of the polymers and oligomers. Master Thesis, Politecnico di Milano, Milano, Italy, 2023. [Google Scholar]
Figure 1.
a. Sketch of the structure of the F4TCNQ molecule. Colour code: dark blue: Nitrogen; pink: Fluorine; black: Carbon. The labels from 1 to 5 refer to the numbering of bonds. b. Equilibrium CC bond lengths for F4TCNQ and its singly charged anion F4TCNQ(-1).
Figure 1.
a. Sketch of the structure of the F4TCNQ molecule. Colour code: dark blue: Nitrogen; pink: Fluorine; black: Carbon. The labels from 1 to 5 refer to the numbering of bonds. b. Equilibrium CC bond lengths for F4TCNQ and its singly charged anion F4TCNQ(-1).
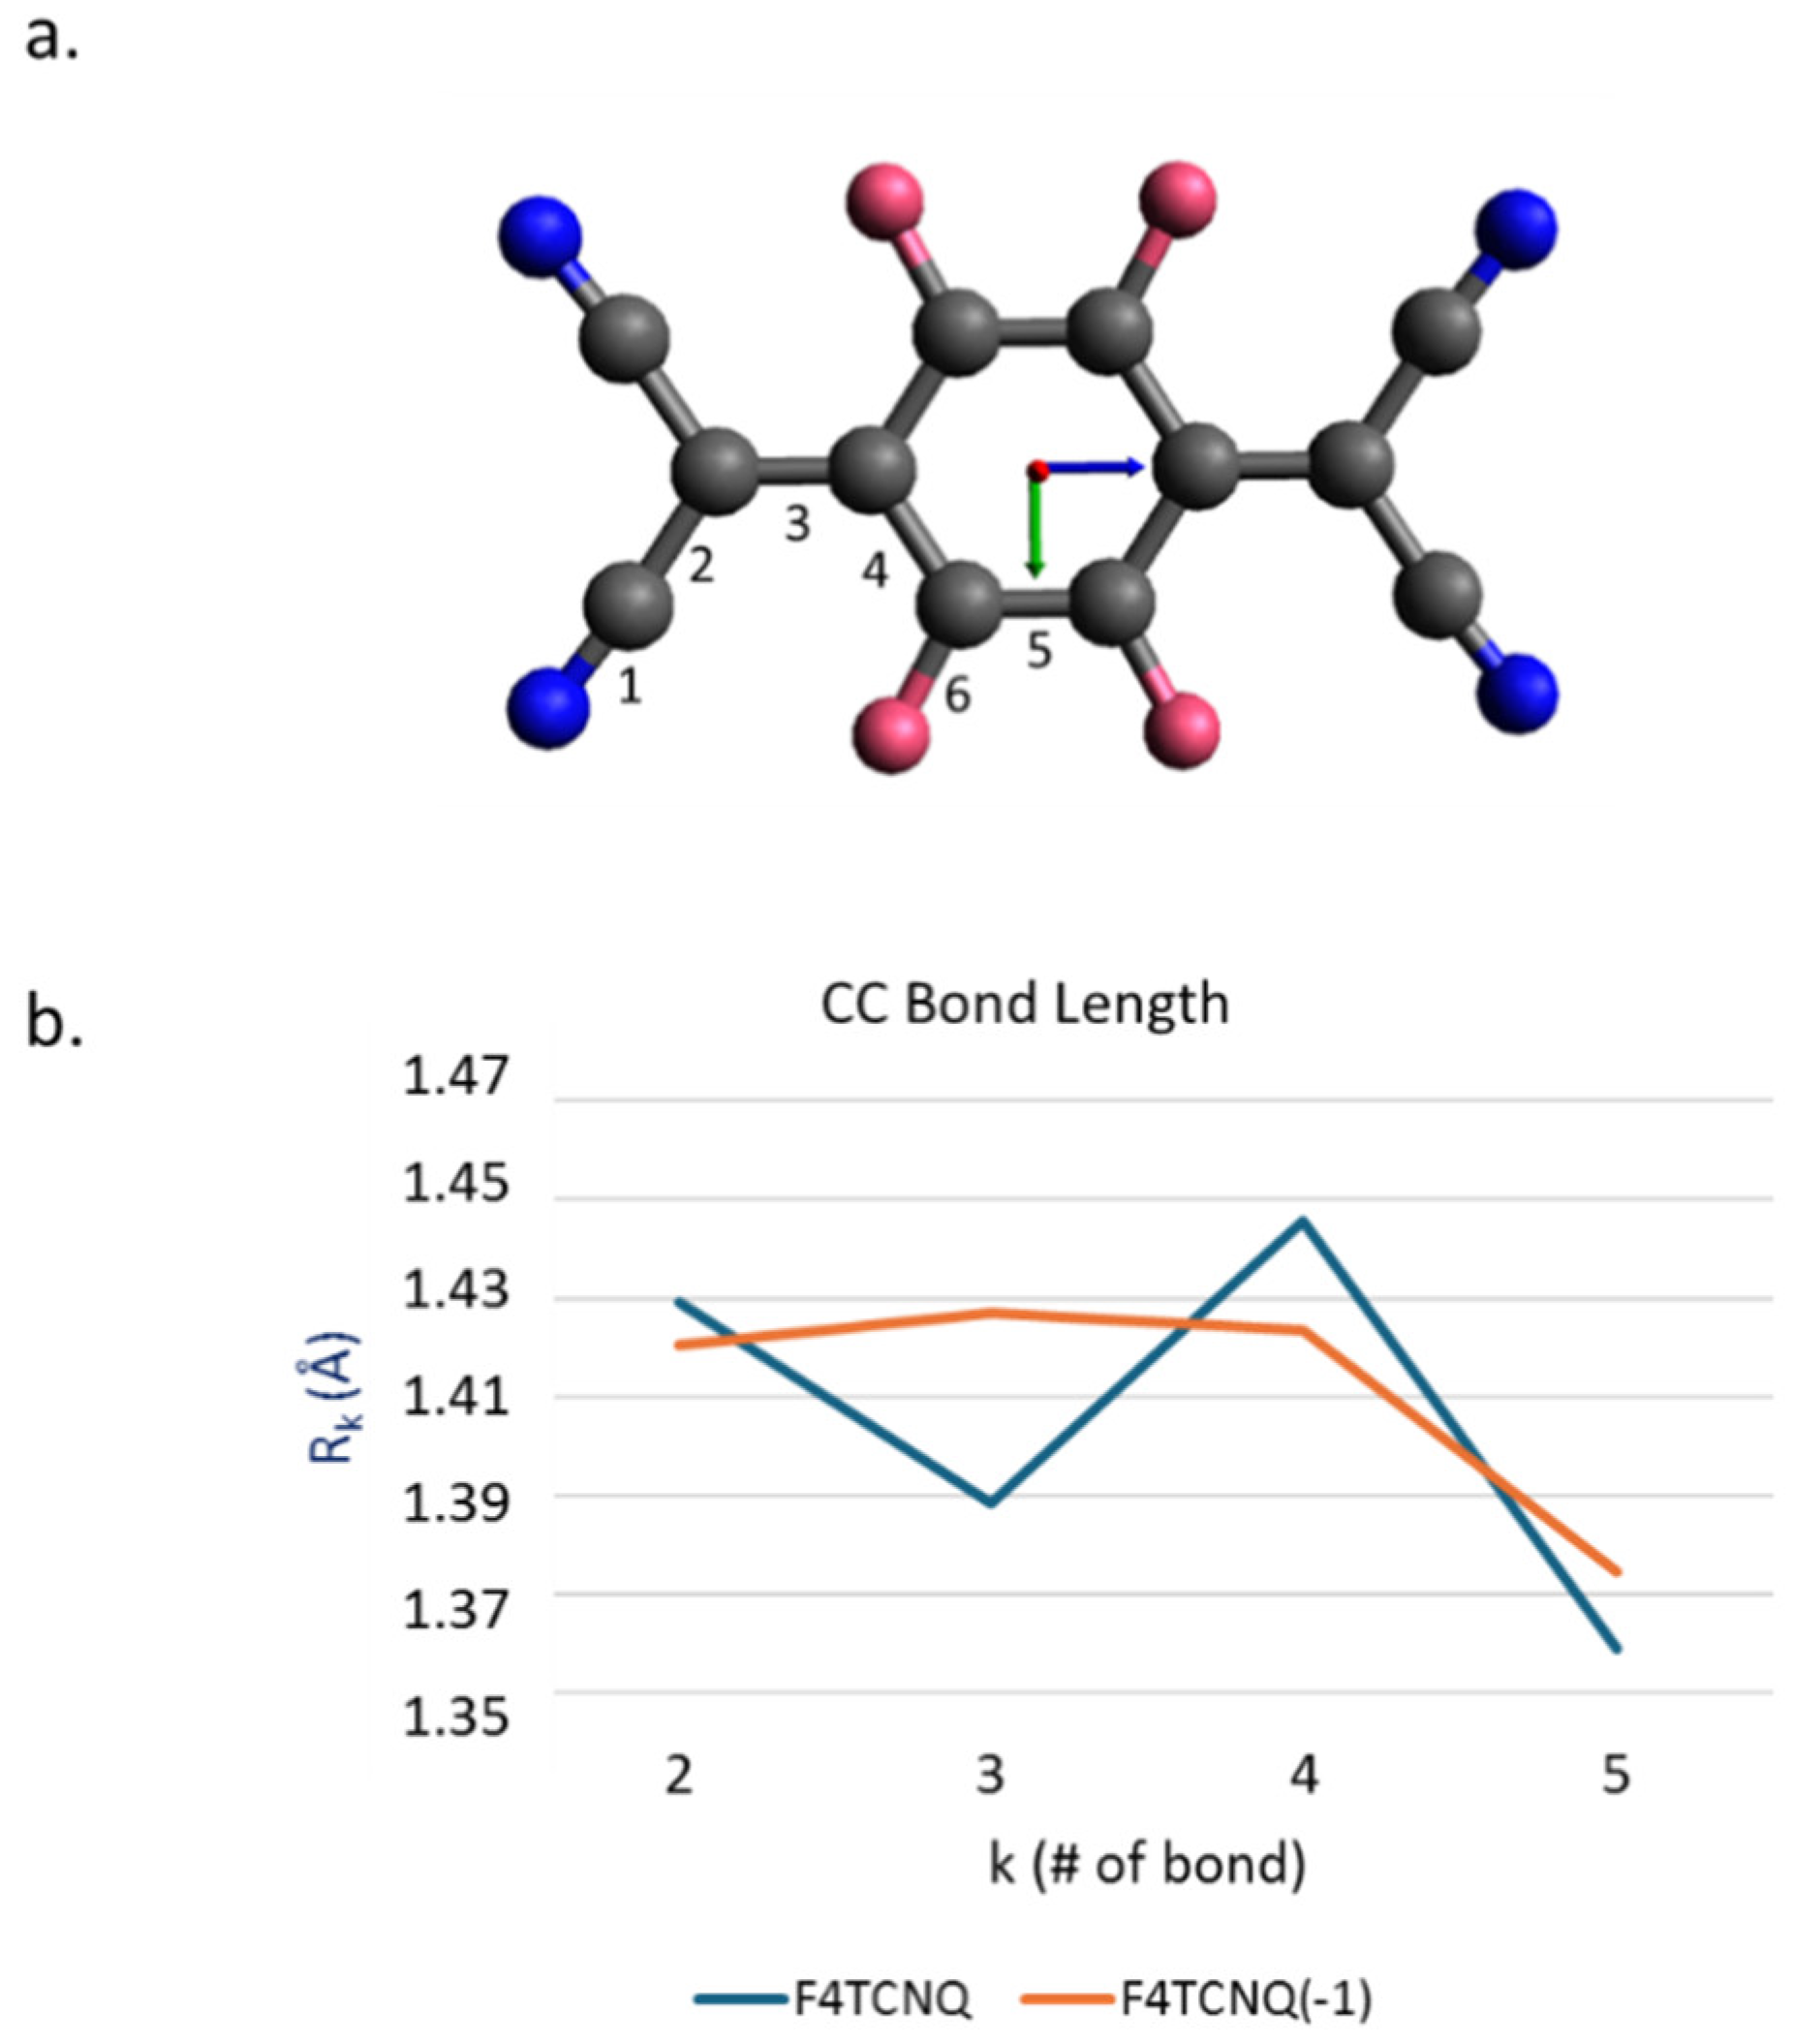
Figure 2.
Comparison between the DFT (6-31G**) computed infrared spectra of F4TCNQ (blue line) and its singly charged anion (orange line). Spectral region 2500 - 700 cm-1 (a.) and zooms in the 1800 – 700 cm-1 region (b.) and in the CN stretching region (c.) .
Figure 2.
Comparison between the DFT (6-31G**) computed infrared spectra of F4TCNQ (blue line) and its singly charged anion (orange line). Spectral region 2500 - 700 cm-1 (a.) and zooms in the 1800 – 700 cm-1 region (b.) and in the CN stretching region (c.) .
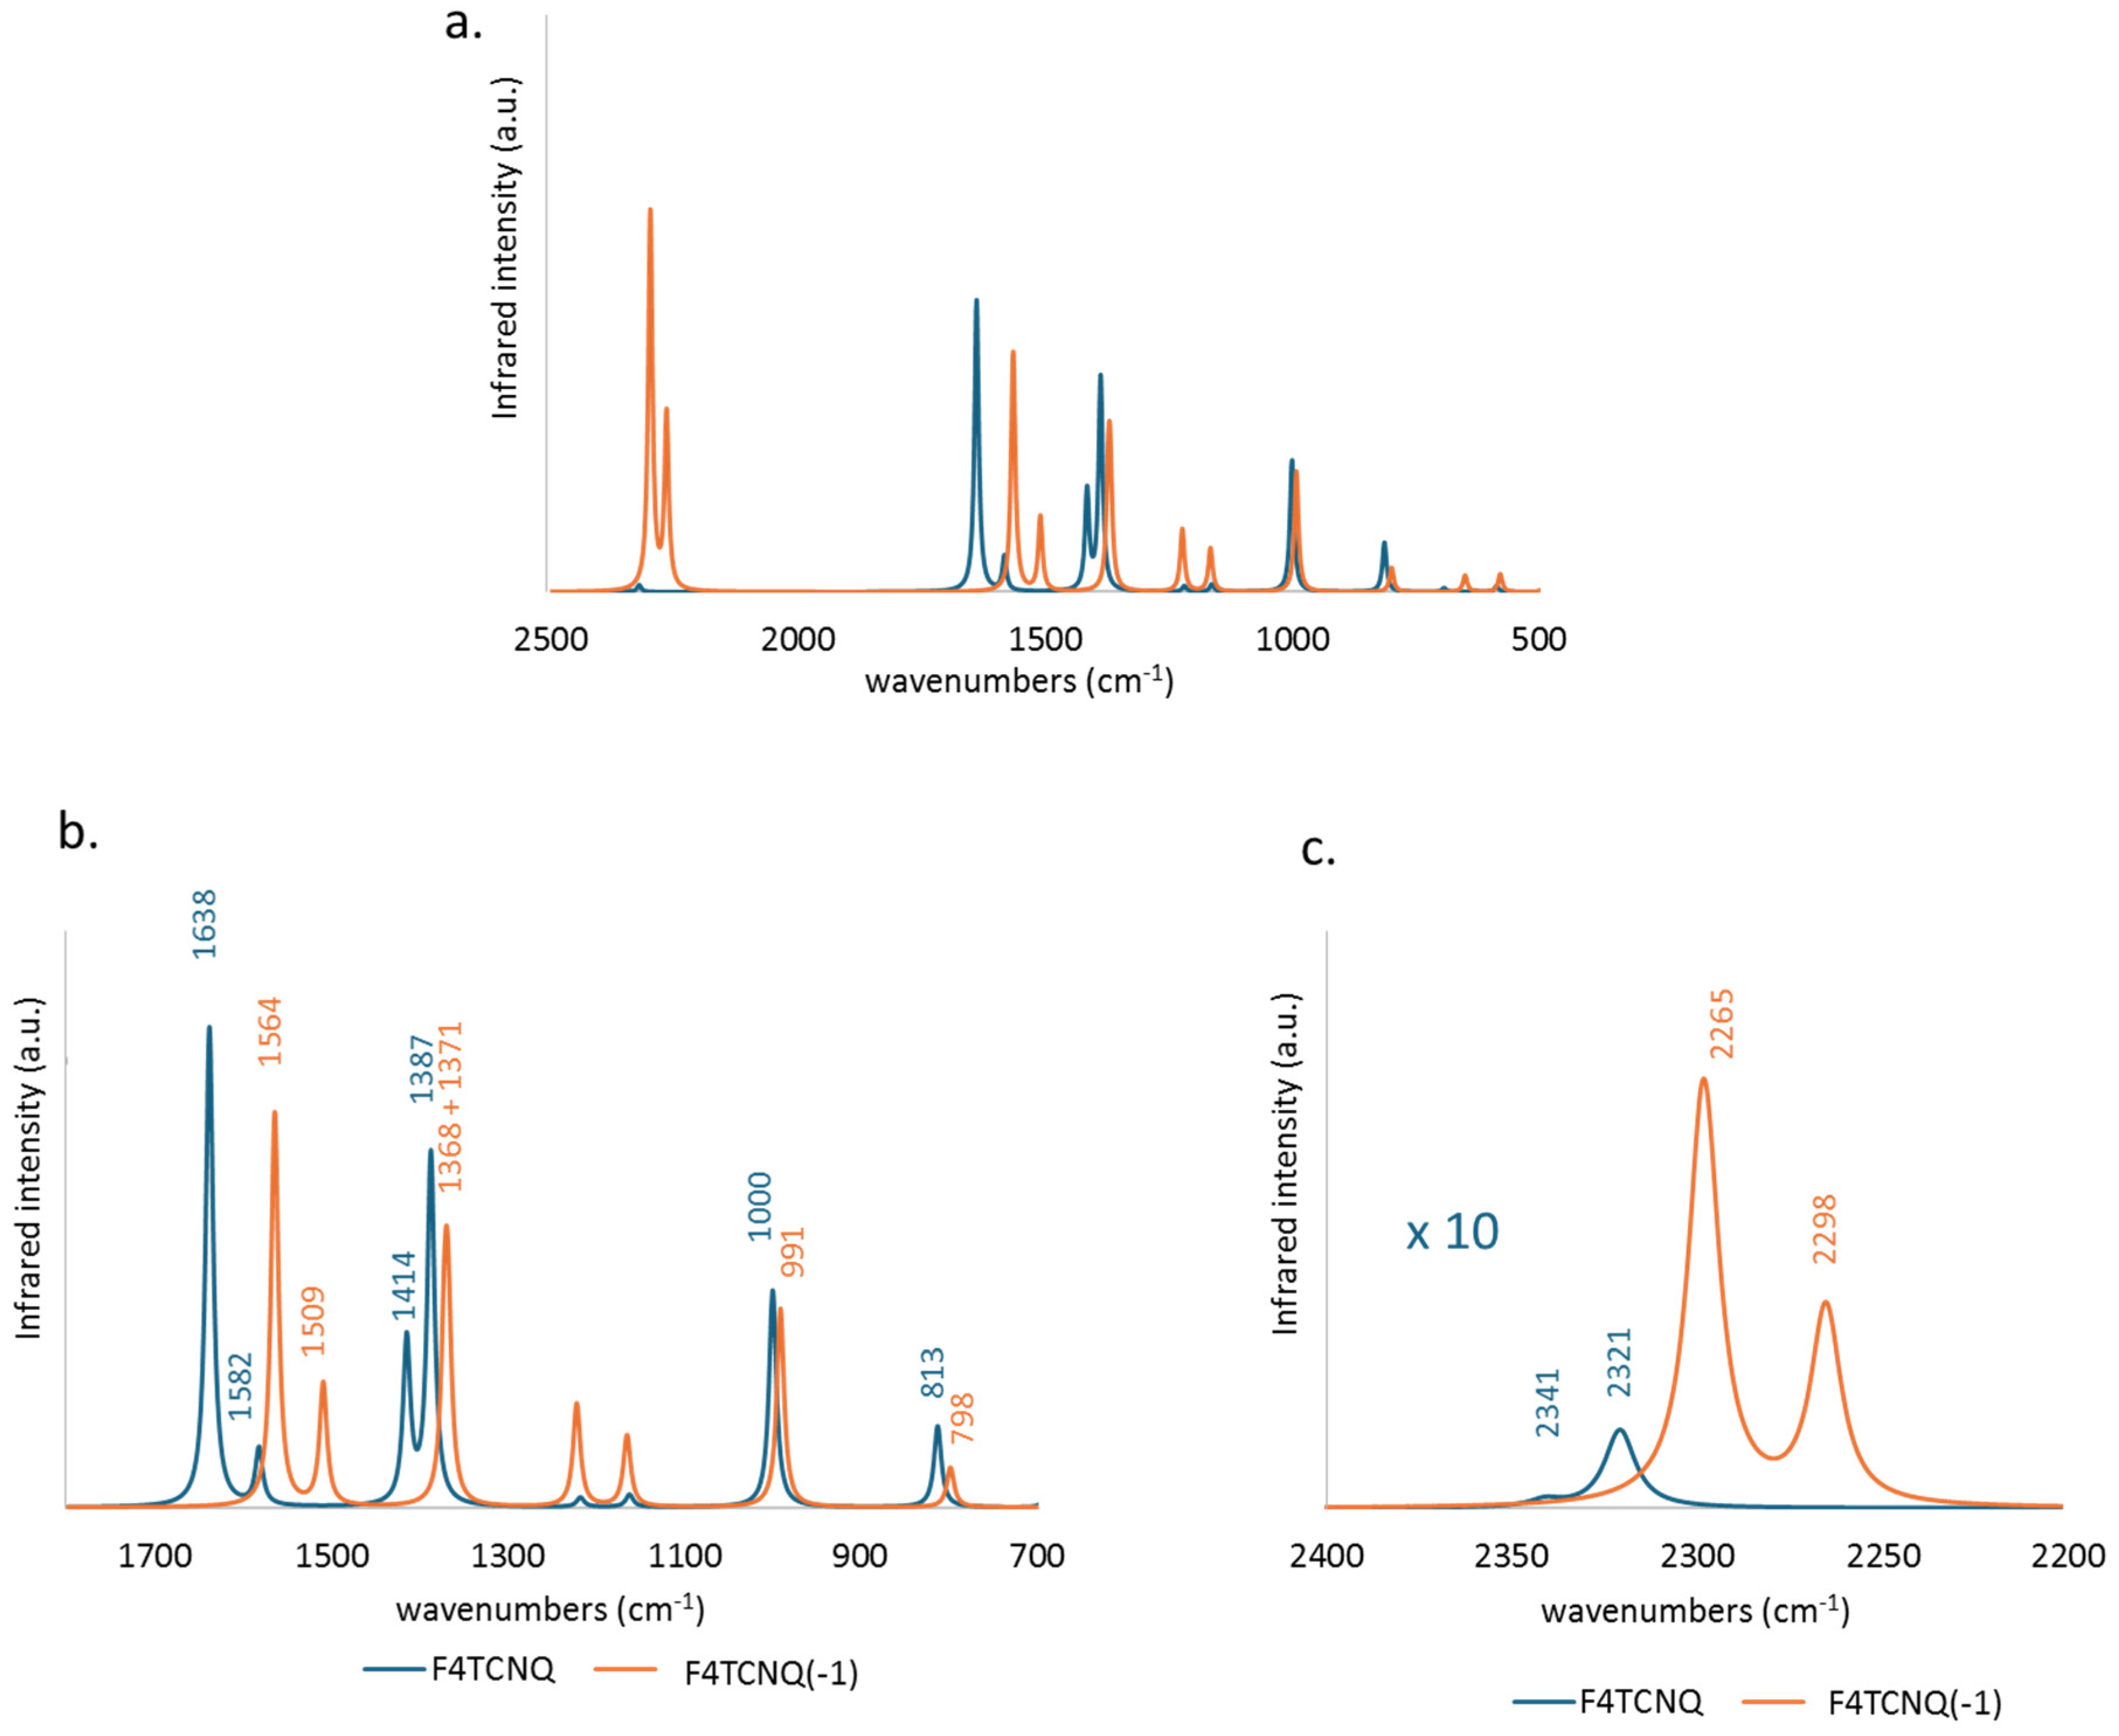
Figure 3.
Comparison between the DFT (6-31G**) computed Raman spectra of F4TCNQ (blue line) and its singly charged anion (orange line). (a.) spectral region 2500 -700 cm-1 and zooms in the 1800 – 700 cm-1 region (b.) and in the CN stretching region (c.) .
Figure 3.
Comparison between the DFT (6-31G**) computed Raman spectra of F4TCNQ (blue line) and its singly charged anion (orange line). (a.) spectral region 2500 -700 cm-1 and zooms in the 1800 – 700 cm-1 region (b.) and in the CN stretching region (c.) .
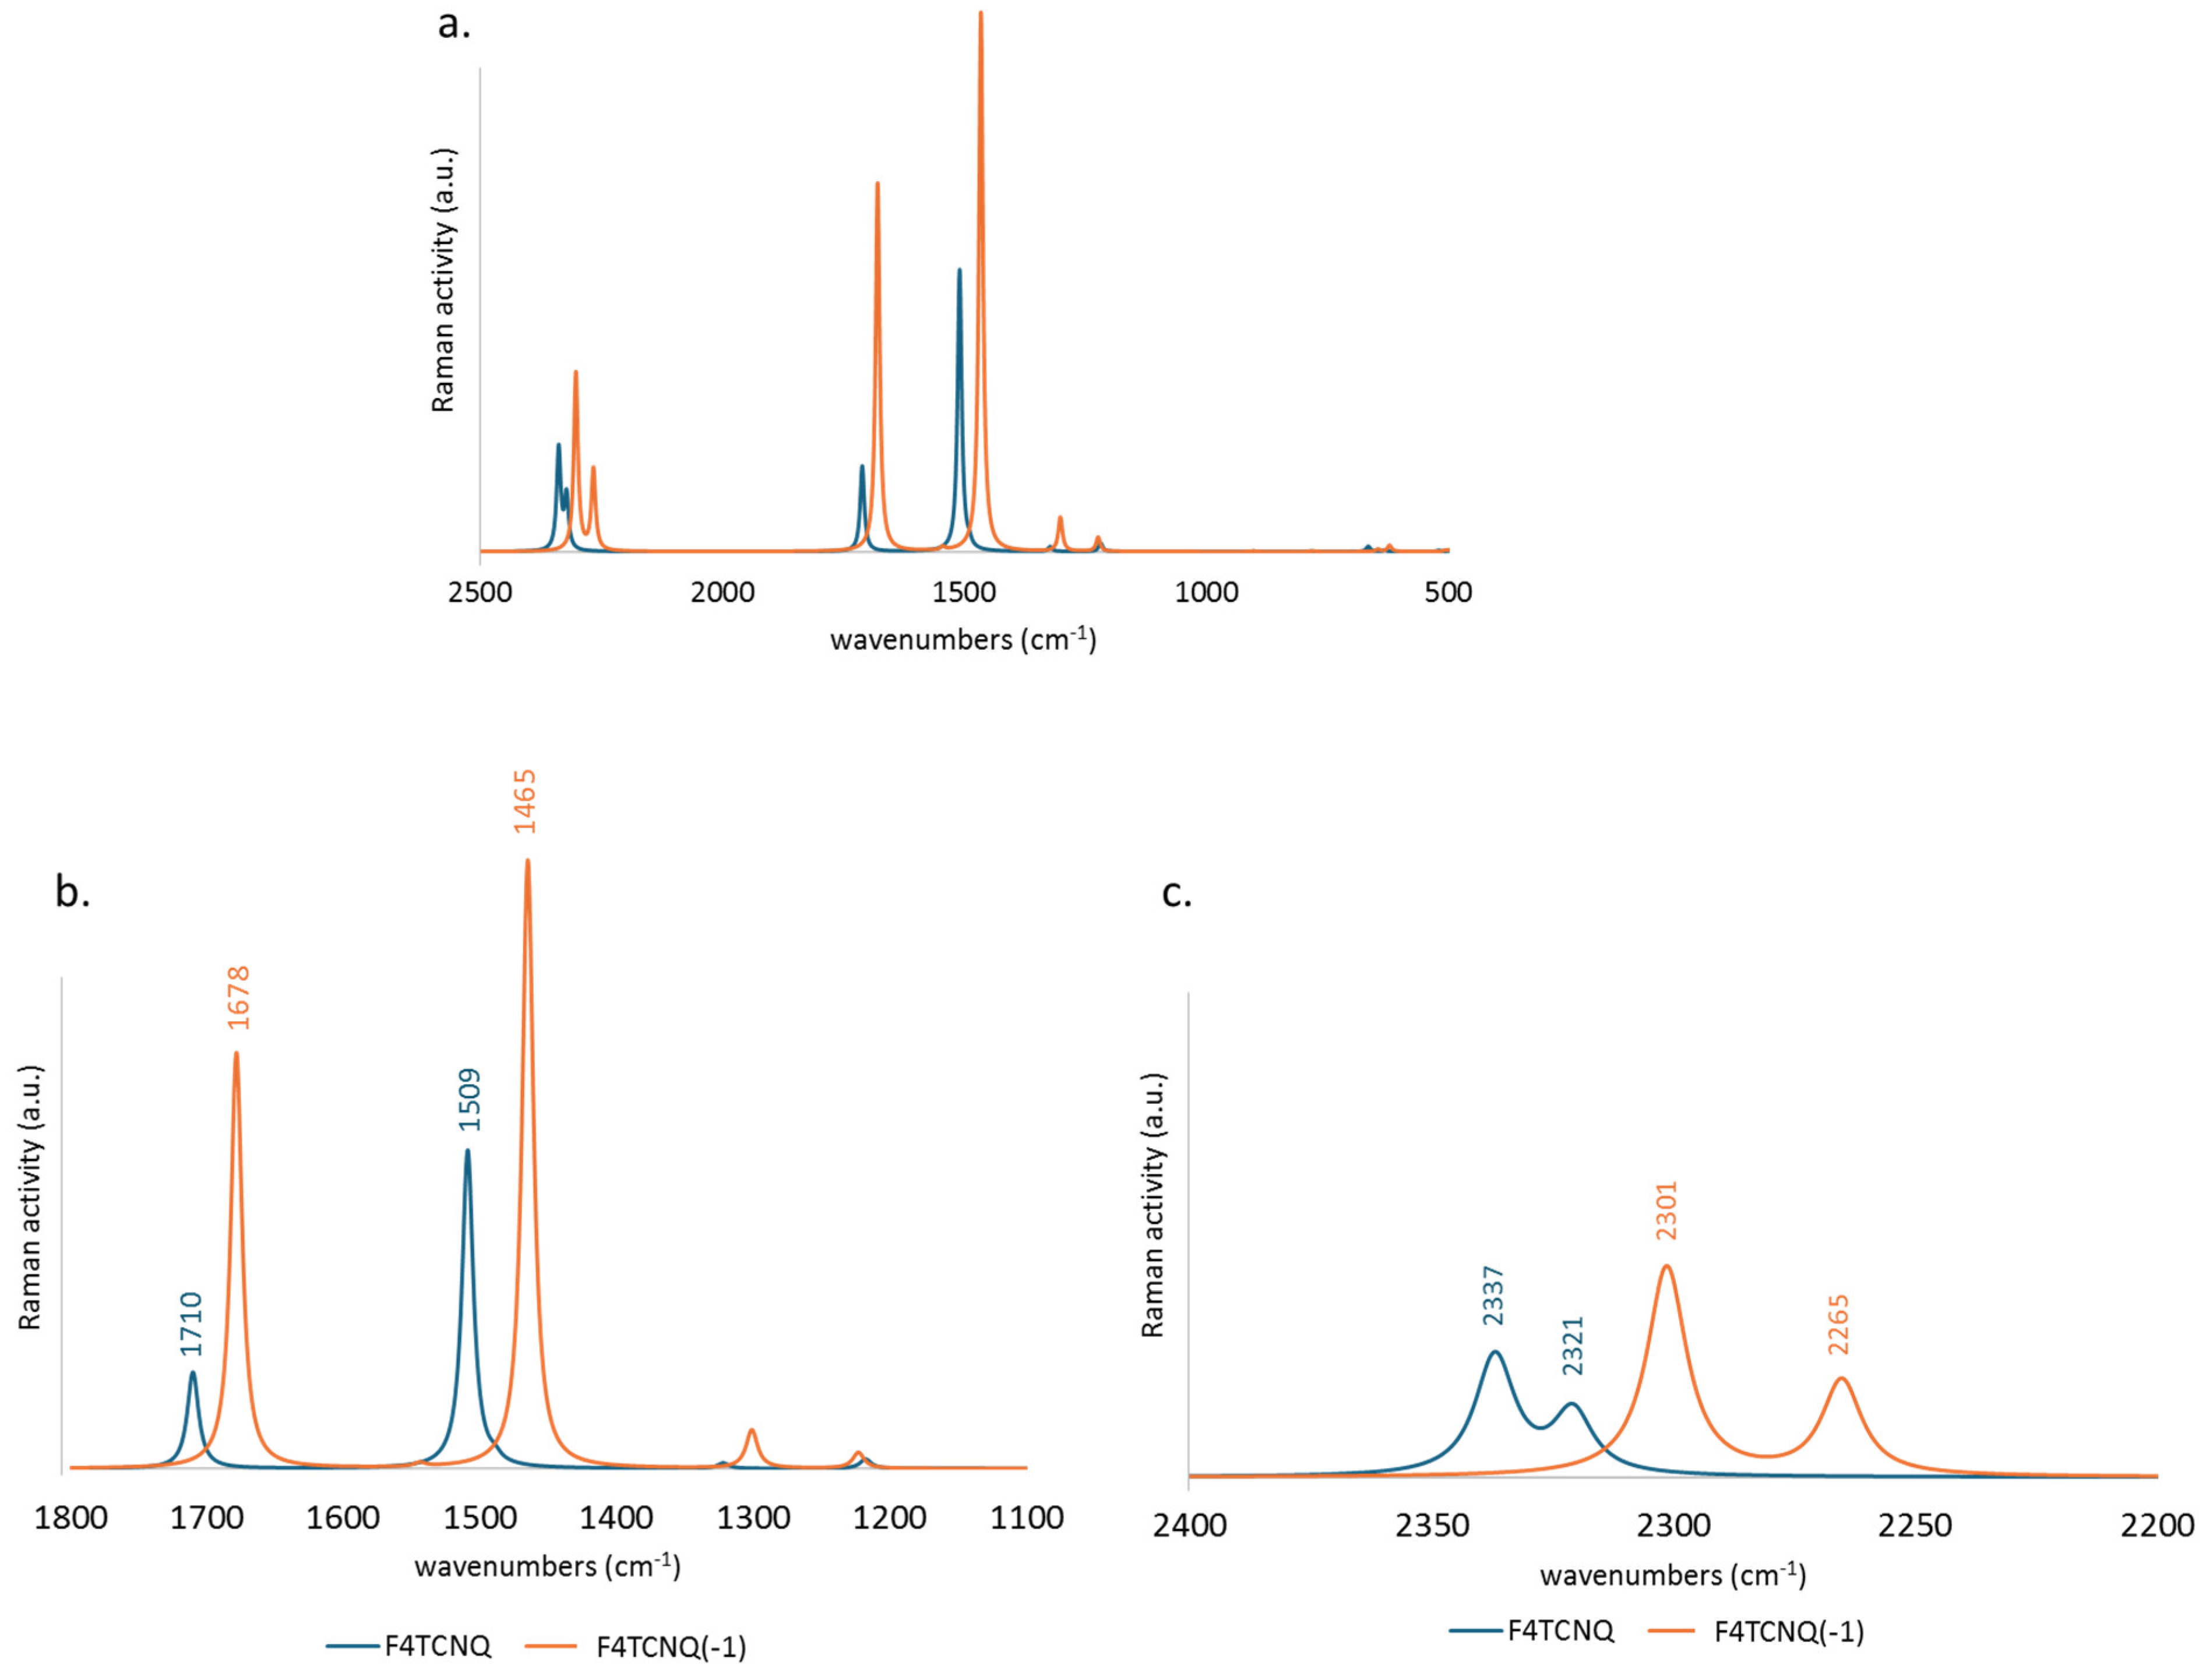
Figure 4.
Experimental Infrared and Raman spectra of F4TCNQ in solid crystalline phase and CHCl3 solution; IR spectrum of F4TCNQ(-1) in CH3CN solution. .
Figure 4.
Experimental Infrared and Raman spectra of F4TCNQ in solid crystalline phase and CHCl3 solution; IR spectrum of F4TCNQ(-1) in CH3CN solution. .
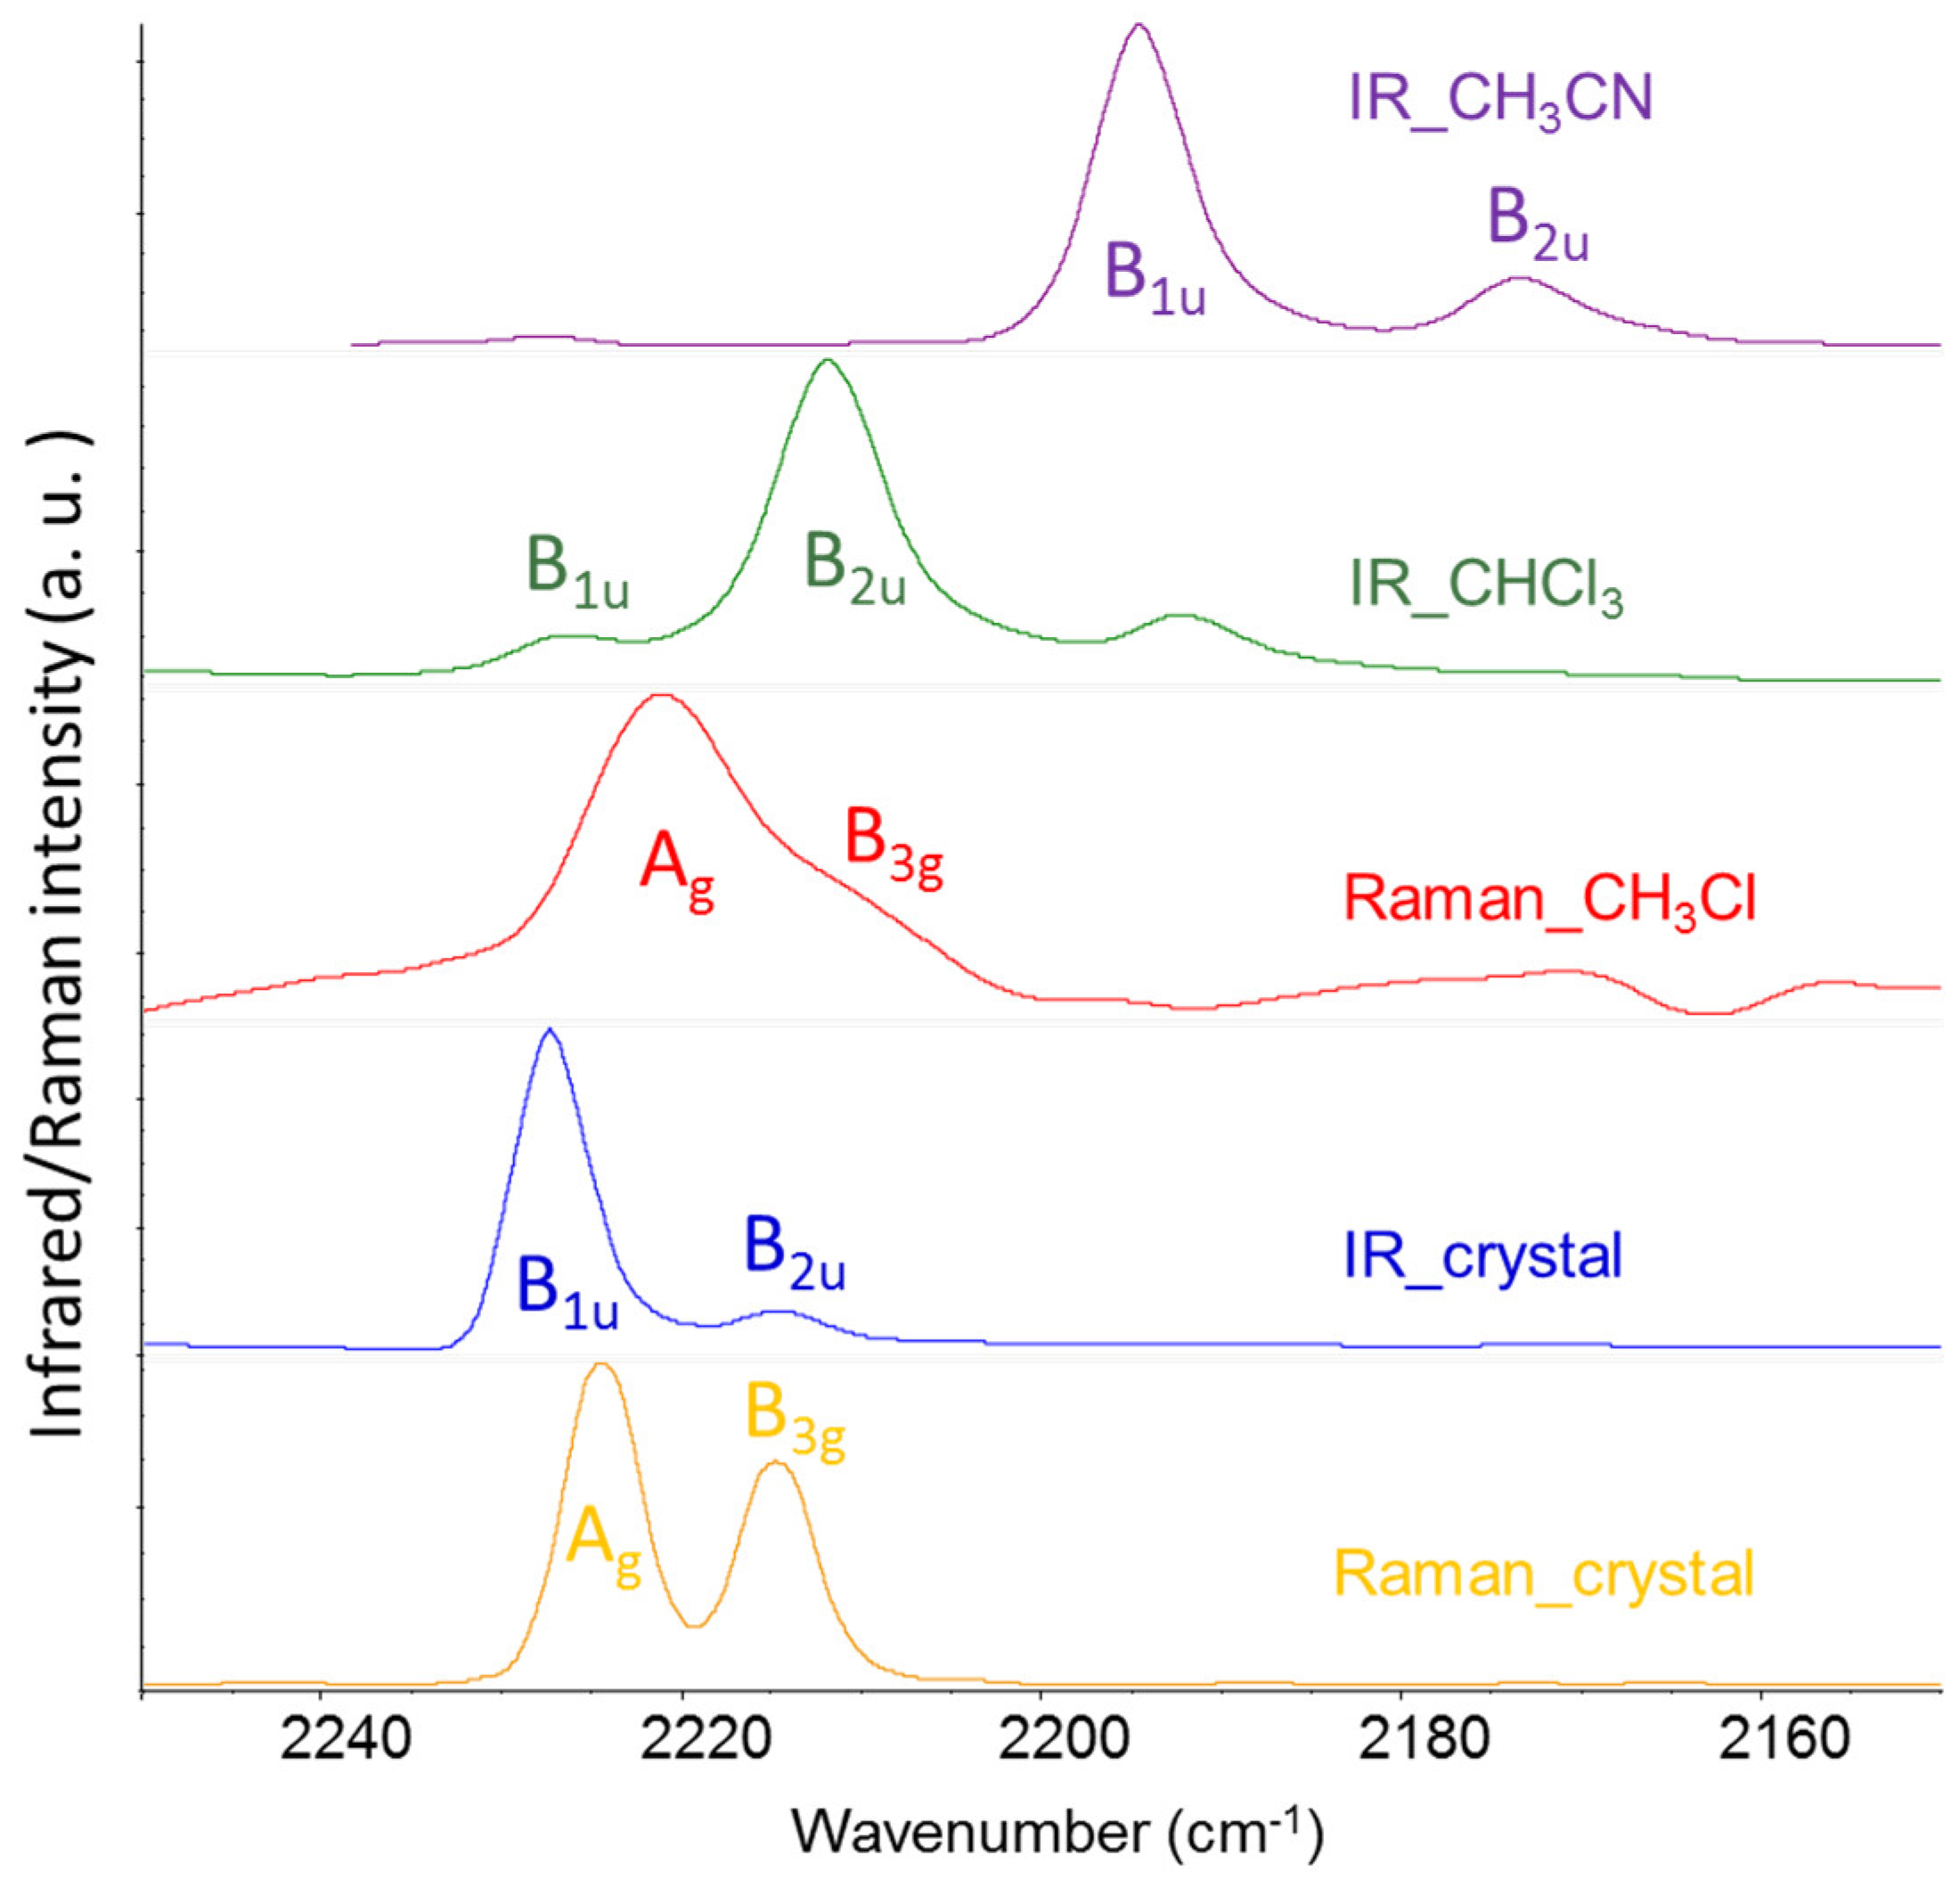
Figure 5.
a. Local IR parameters of F4TCNQ and of its singly charged anion (F4TCNQ(-1)): dipole moment derivatives with respect to individual stretching coordinates (bonds labelling and Cartesian reference system as in Figure 1). Left panel: ; right panel . Units are e. b. Sketches of the vibrational eigenvectors associated to the IR and Raman r+ and r- transitions of F4TCNQ and F4TCNQ(-1) in the CN stretching region. The thickness of the green and blue segments is proportional to positive and negative bond stretching contributions, respectively. Calculated wavenumbers (cm-1) and symmetry species of the irreducible representation are reported for each eigenvector.
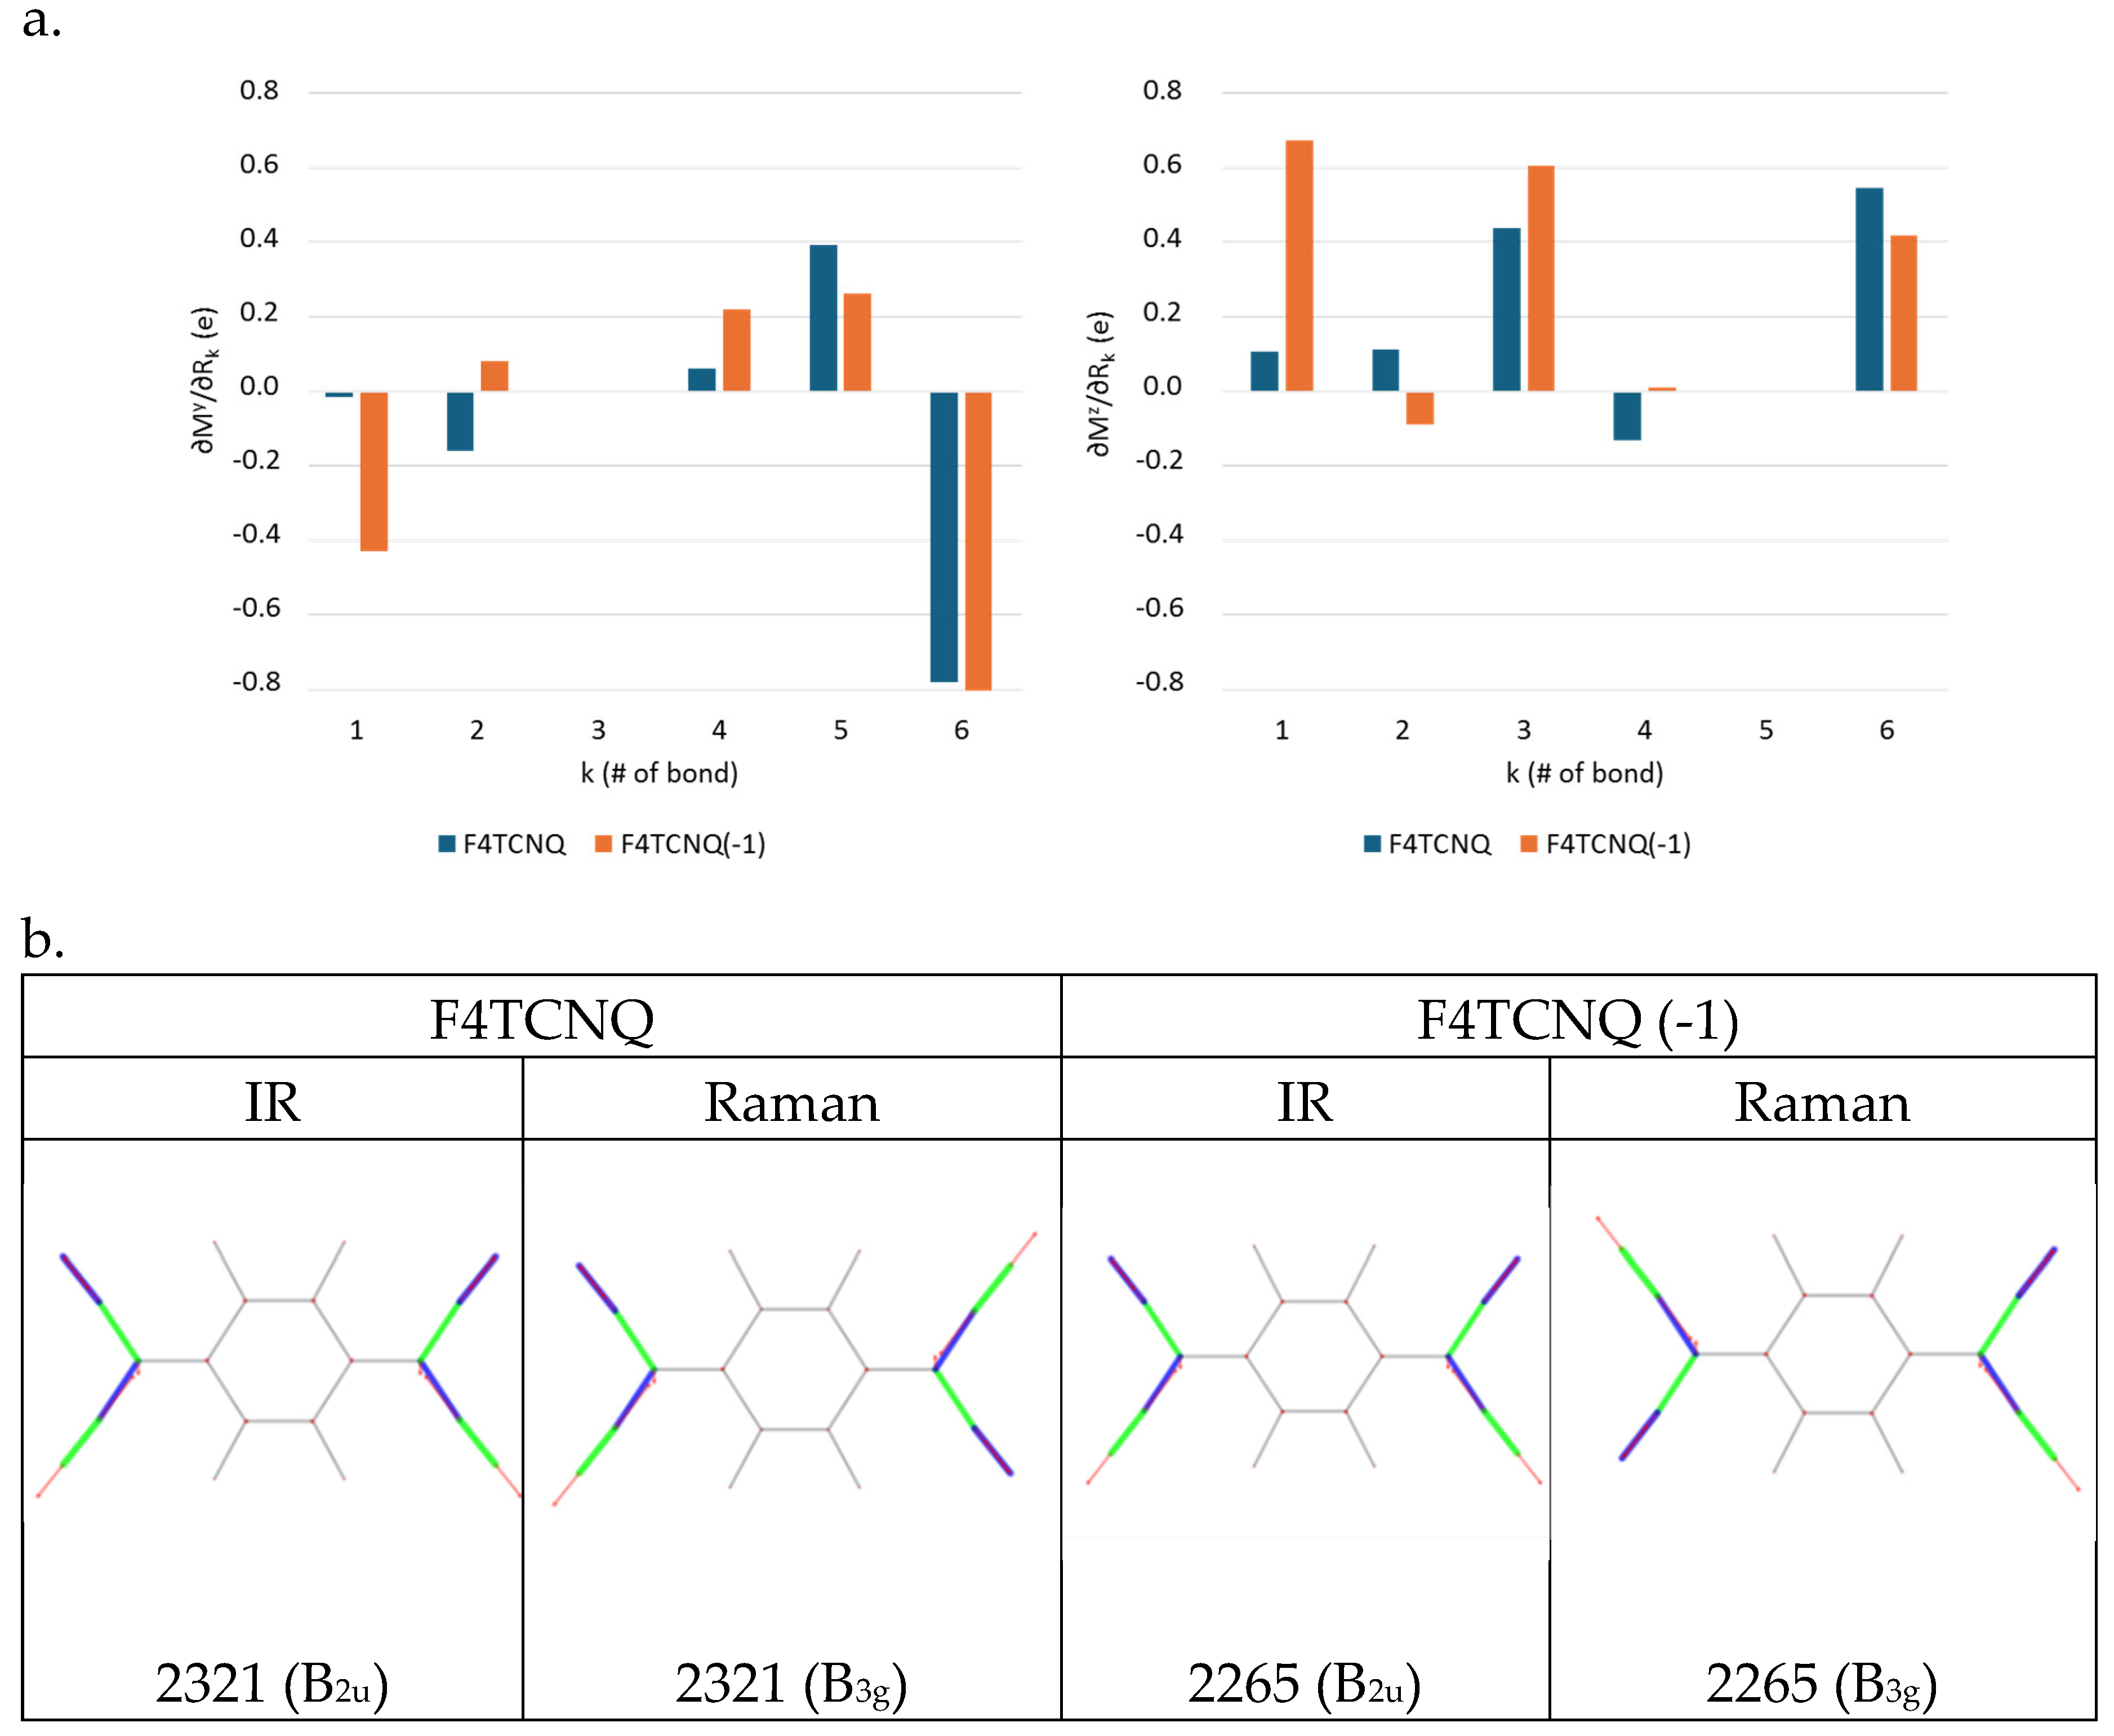
Figure 6.
a. Equilibrium atomic charges (units of e) from the DFT computed Atomic Polar Tensors of F4TCNQ in vacuo and in a Polarizable Continuum Medium, PCM method, and of its singly charged anion in vacuo (top-right panel). b. Histogram showing the comparison of the equilibrium atomic charges (units of e) of F4TCNQ and of its anion. Atoms labelling as in a.
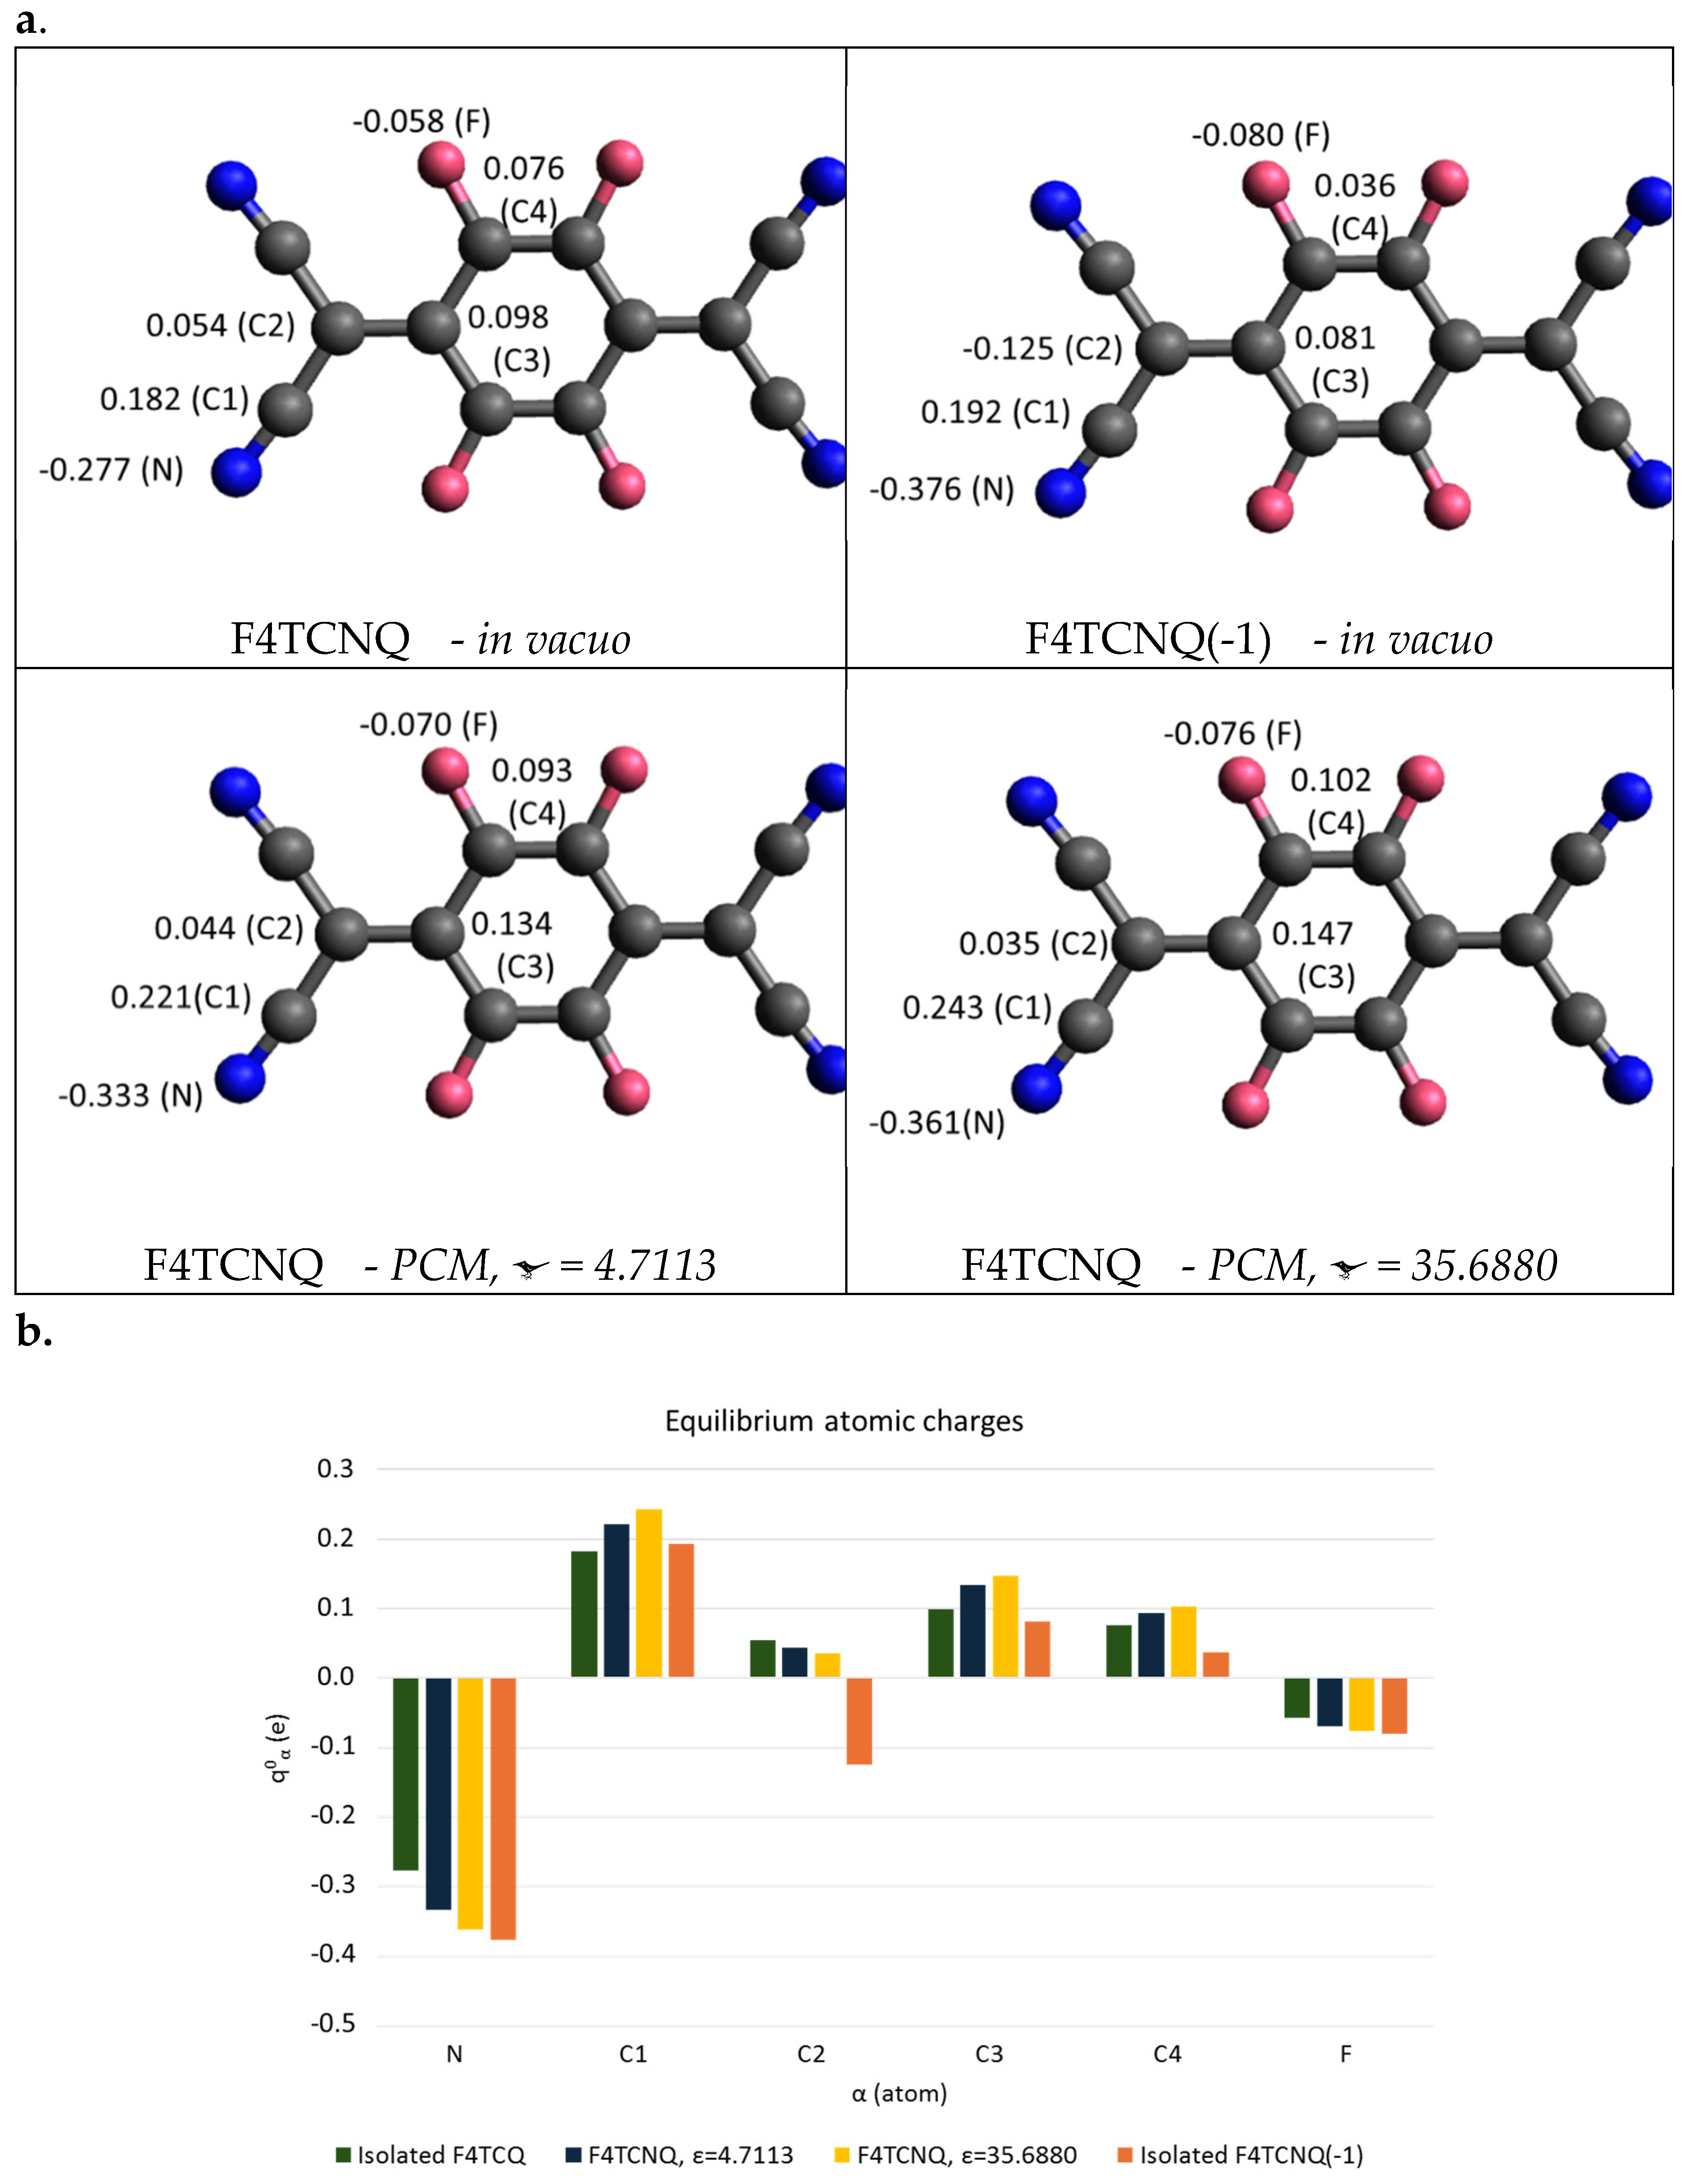
Figure 7.
Infrared spectra of chloroform solutions of P3HT and F4TCNQ at different relative concentration. From top to bottom: 1:1, 5:1 and 25:1 P3HT:F4TCNQ molar ratio. The black dashed lines corresponds to the CN stretching wavenumbers of neutral F4TCNQ, and red dashed lines to those of the anion, resulting from the doping of P3HT.
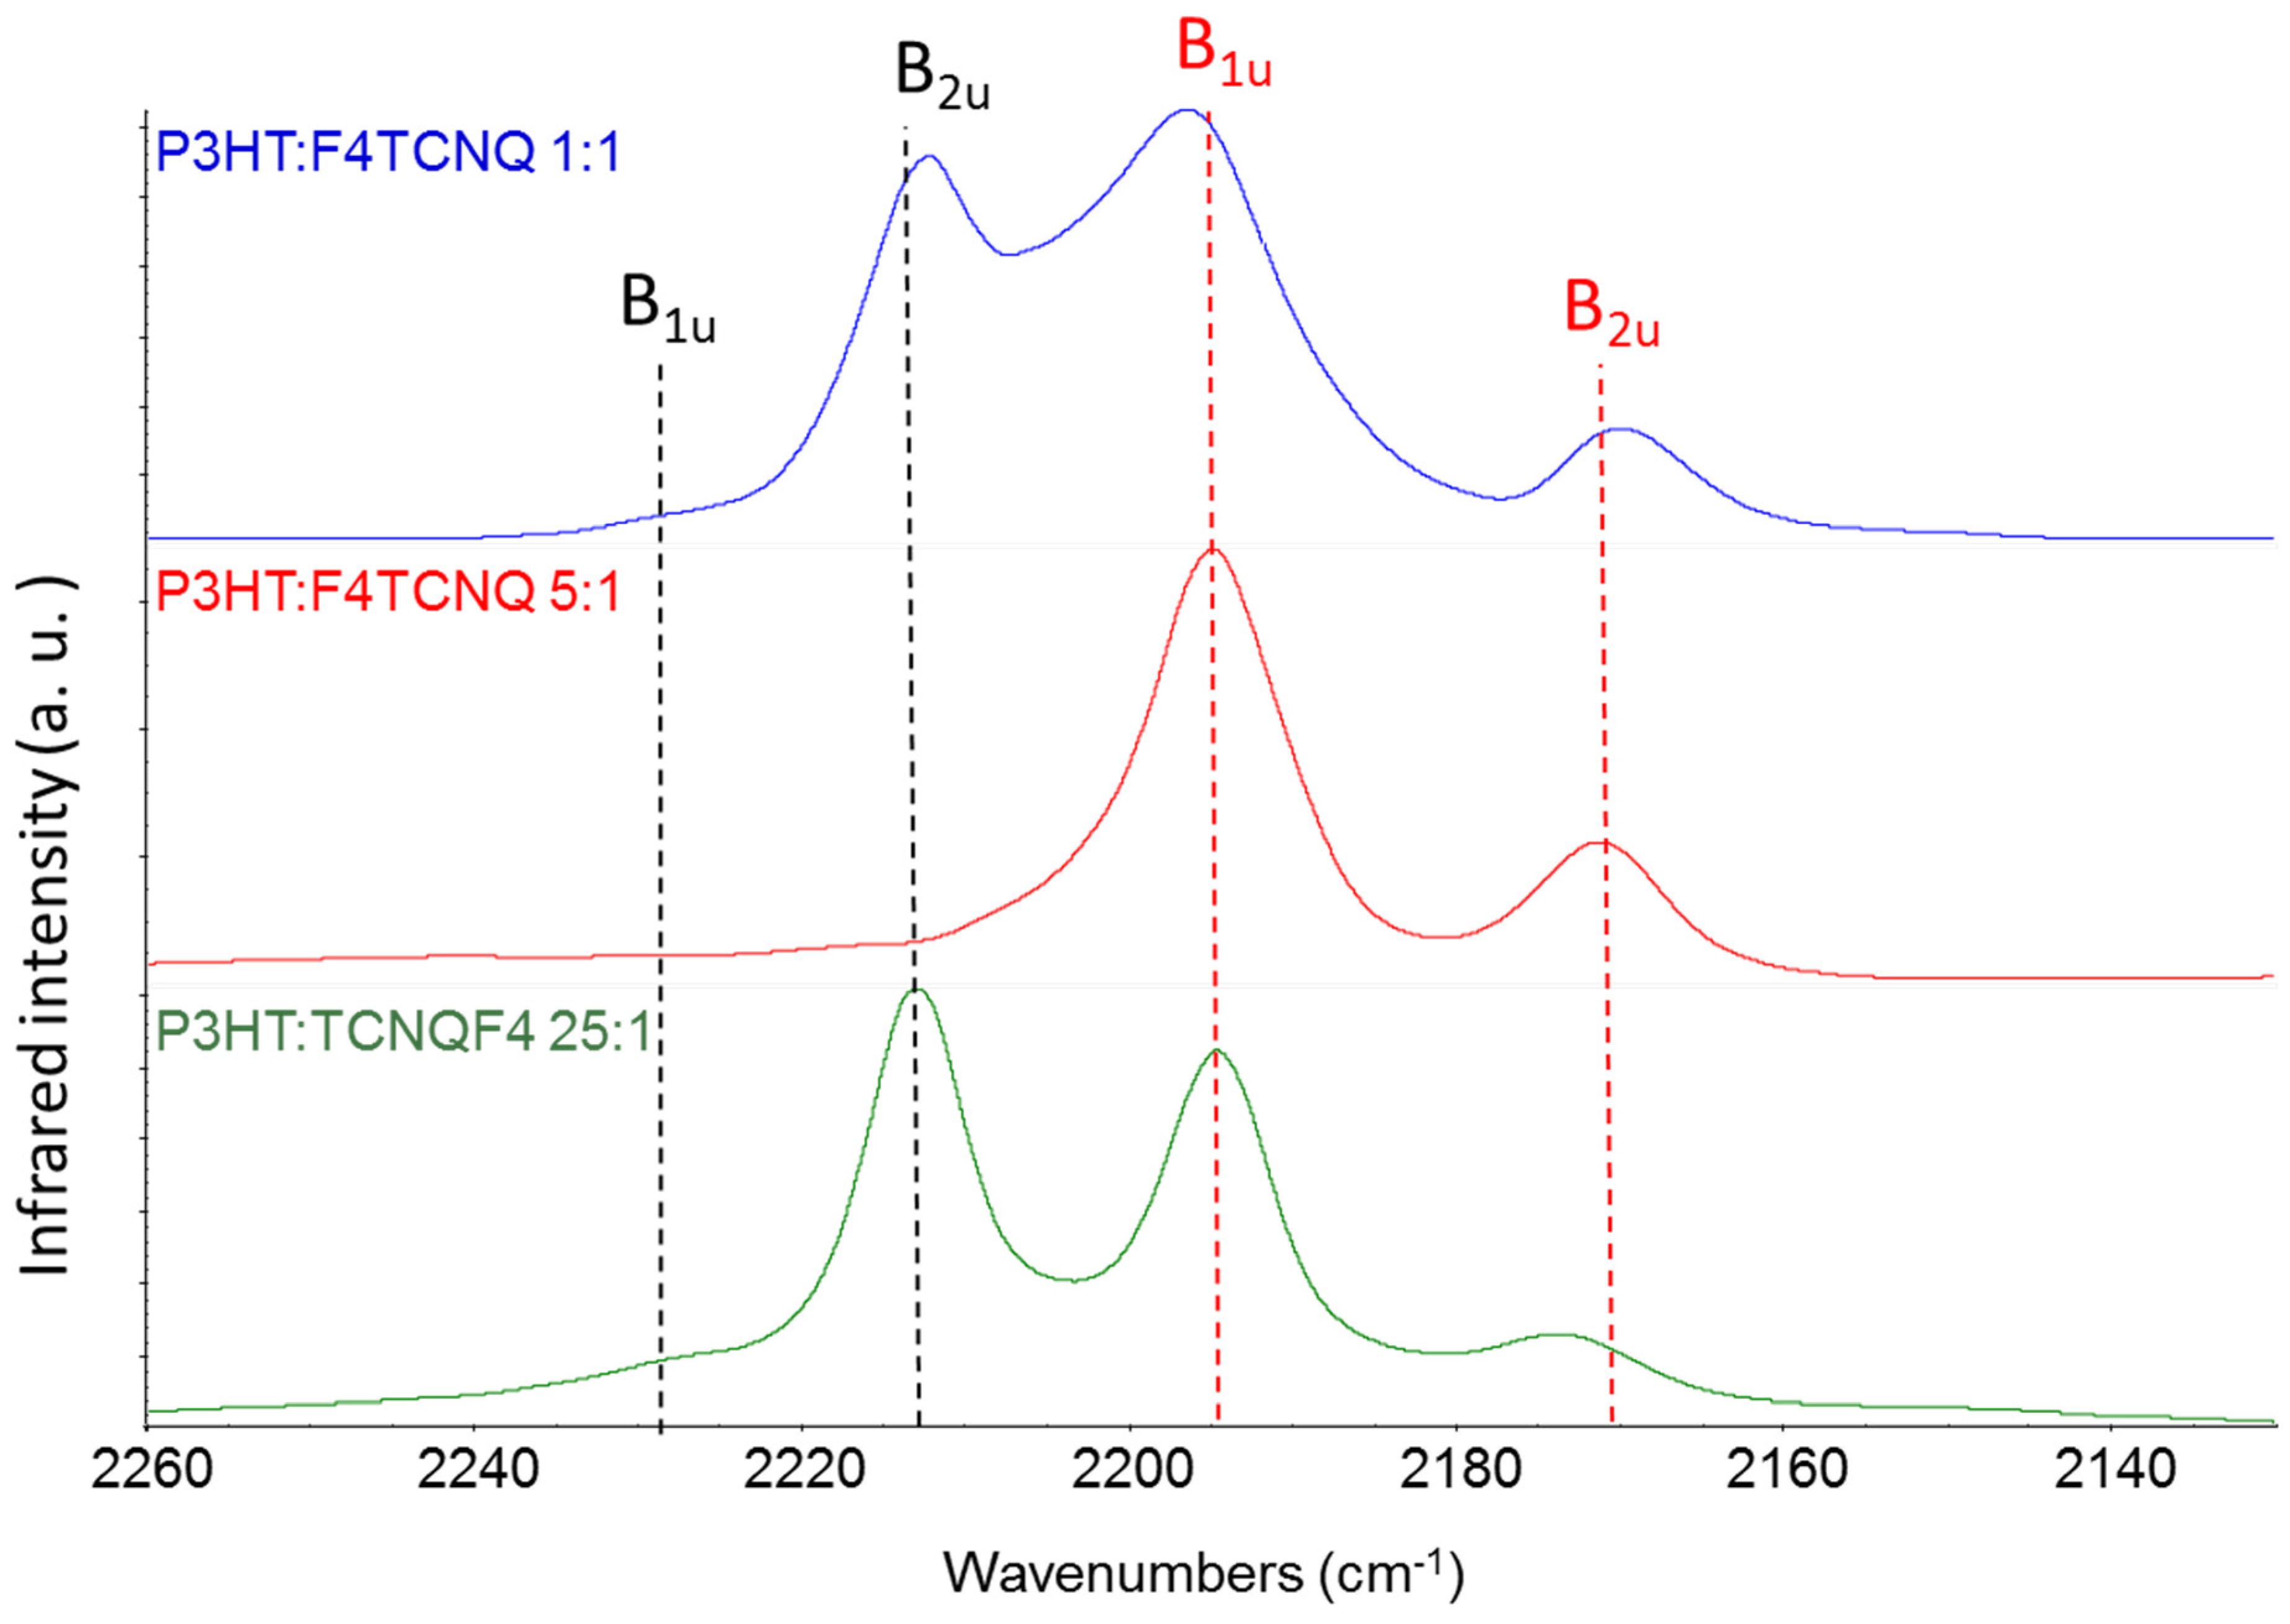

Table 1.
a Computed wavenumber and Raman Activities (A) of vibrational transitions of F4TCNQ and its singly charged anion, F4TCNQ(-1) (in-plane normal modes belonging to the Ag and B3g irreducible representation - DFT 6-31G** calculations). Relative Raman Activities (normalized to the strongest Raman transition) are also reported. The last three column report wavenumber shifts and Raman Activity changes from the neutral molecule to the anion. Data concerning very weak transitions are displayed with a grey background. Bold characters highlight the largest frequency shifts and Raman Activity changes. b. Computed wavenumber and Infrared Intensities (I) of vibrational transitions of F4TCNQ and its singly charged anion, F4TCNQ(-1) (in-plane normal modes belonging to the B1u and B2u irreducible representation - DFT 6-31G** calculations). Relative Infrared Intensities (normalized to the strongest Infrared transition) are also reported. The last three column report wavenumber shifts and intensity changes from the neutral molecule to the anion. Data concerning very weak transition are displayed with a grey background. Bold characters highlight the largest frequency shifts and Infrared Intensity changes.
|
Table 2.
Observed IR and Raman wavenumbers of the CN stretching bands of F4TCNQ samples in different solutions and in the solid crystalline phase. Theoretical wavenumbers from DFT calculations are reported for sake of comparison, after scaling (f = 0.9556). The last row reports the ratio between the integrated IR CN stretching intensity (sum of r+ and r- bands) and the intensity of the B2u band observed at about 976 cm-1 in the case of the neutral species and 967 cm-1 for the anion.
 |
* scaled (f = 0.9556).
Table 3.
a. Atomic Polar Tensor of the N atom,, after rotation in the CN bond reference system X,Y,Z (red axes in the sketch) and its charge flux contribution, for isolated F4TCNQ in two different dielectrics and for its anion F4TCNQ(-1). Units of e. b. Equilibrium atomic charges and charge fluxes obtained from ; atoms labelling as in the sketch.
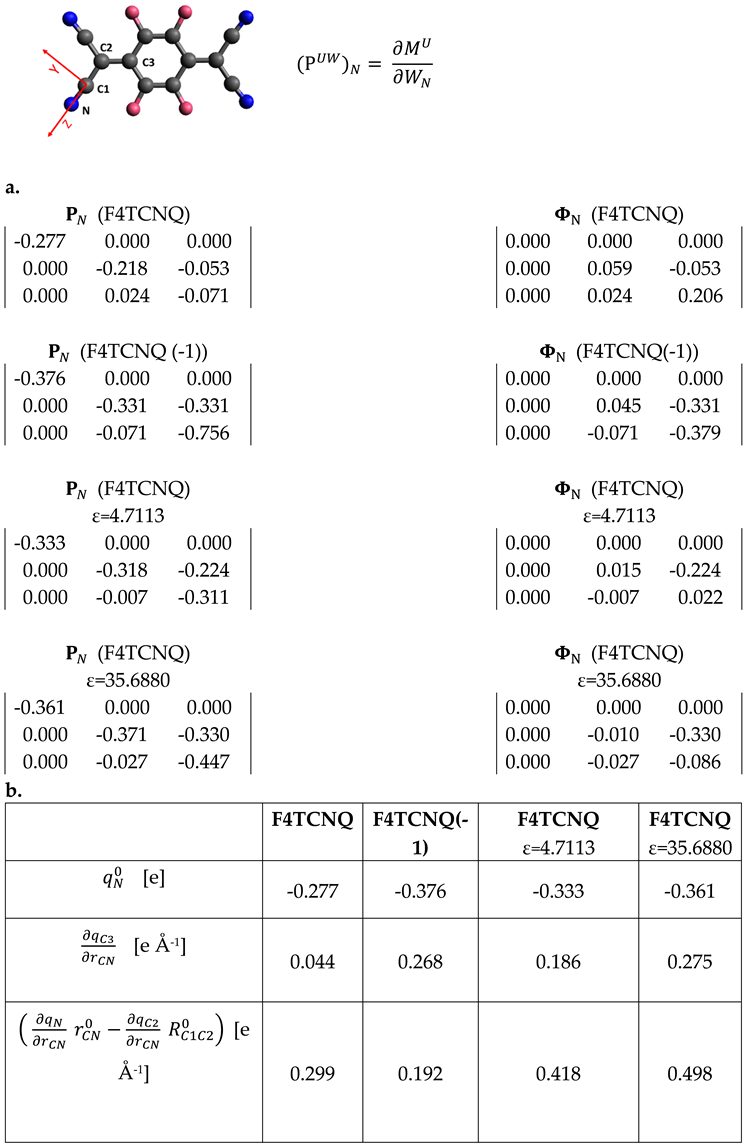 |
Table 4.
DFT B3LYP/6-31G** computed wavenumber and Infrared intensities of vibrational transitions of F4TCNQ (in-plane normal modes belonging to the B1u and B2u irreducible representation): comparison among calculations for the isolated molecule and the molecule in a Continuum Polarizable Medium with dielectric constants = 4.7113 and 35.6880. Data concerning very weak transitions are displayed with a grey background. The relative intensities are obtained after normalization to the band at about 1000 cm-1.
|
Disclaimer/Publisher’s Note: The statements, opinions and data contained in all publications are solely those of the individual author(s) and contributor(s) and not of MDPI and/or the editor(s). MDPI and/or the editor(s) disclaim responsibility for any injury to people or property resulting from any ideas, methods, instructions or products referred to in the content. |
© 2024 by the authors. Licensee MDPI, Basel, Switzerland. This article is an open access article distributed under the terms and conditions of the Creative Commons Attribution (CC BY) license (http://creativecommons.org/licenses/by/4.0/).
Copyright: This open access article is published under a Creative Commons CC BY 4.0 license, which permit the free download, distribution, and reuse, provided that the author and preprint are cited in any reuse.


