
Submitted:
03 October 2024
Posted:
04 October 2024
You are already at the latest version
Abstract
In an attempt to replace corroding mild steel components in aggressive mine water environ-ments, nickel-chromium-iron (Hastelloy® G30), copper-nickel-tin (ToughMet® 3), and co-balt-chromium-tungsten (Stellite® 6B) hard alloys were selected due to their excellent corrosion resistance, but they remain challenged in many acidic environments. The corrosion behaviours of these alloys were compared and investigated in synthetic mine water with varying pH levels (6, 3, 1) using potentiodynamic polarisation. Microstructural, hardness, and XRD analyses were conducted. Stellite® 6B exhibited superior corrosion resistance across all pH values, outperform-ing both Hastelloy® G30 and ToughMet® 3. With the lowest corrosion rates and comparable high hardness, Stellite® 6B emerges as a promising choice for replacing mild steel pump components in aggressive mine water environments.
Keywords:
Hard alloy
; corrosion
; potentiodynamic polarisation
; passivation
; mine water
1. Introduction
Mild steel shaft sleeves, valves, and casings serve a crucial role in water pump systems utilized in various mines. These systems operate continuously to extract water from underground reservoirs, preventing flooding in the mine. However, these components undergo substantial degradation due to the combined effects of corrosion from the mine water and wear caused by the mechanical interaction with solid particles suspended in the water.[1]. Many underground mines contain extensive sulphide deposits. For instance, a copper mine might possess a high copper concentration (~1.6 wt%) along with zinc, lead, silver, and gold as by-products [2,3,4]. These mines also contain alkaline earth elements, rare earth elements, sulphates, nitrates, and have an acidic pH, which can vary seasonally. Additionally, they exhibit high electrical conductivity and total dissolved solids (TDS). Seepages from the tailings dump, consisting of pyrite (FeS2), react with oxygen, nitrogen, water vapour, chlorine, and other gases, making the mine water acidic and corrosive [3]. This acidic and corrosive mine water frequently causes corrosion and breakdown of pumping systems, resulting in frequent maintenance, downtime, and part replacement that is deemed unacceptable.
In order to improve the corrosion of pumping system in many mines, candidate hard alloys such as a nickel-based alloy (Ni-Cr-Fe, Hastelloy® G30), copper-based alloy (Cu-Ni-Sn, ToughMet® 3) and a cobalt-based alloy (Co-Cr-W, Stellite® 6B) were selected as a replacement material for the failing steel pump components due to their hardness and corrosion resistance properties. The corrosion behaviours of these hard alloys have received extensive research attention, particularly in reducing and oxidising environments. While some researchers have explored the impact of corrosion on hard metals, emphasising corrosion resistance and hardness. There has been limited research on the electrochemical responses of nickel-based copper-, and cobalt-based hard alloys in synthetic mine water.
Hastelloy® G30 is a highly corrosion resistant nickel-chromium-iron based superalloy, especially against corrosion in phosphoric acid or chloride-induced localized attack such as hydrochloric, sulphuric and nitric acids [5]. Corrosion behaviour of Hastelloy alloys offer superior performance similar to stainless steel grades, however, the alloys have low hardness (160-230 HV2) with active-passivation behaviour in many solutions [6,7,8,9]. The significant presence of chromium content facilitates the formation of a protective passive film (potentially Cr2O3), which plays a role in preventing nickel ions or electrons from migrating towards the surface, thereby enhancing corrosion [6,10]. Zhu et al. [4] and Guo et al. [6] found that apart from this compact inner Cr2O3 passive film, there is also a loose outer layer consisting of iron oxide (Fe2O3) or nickel iron oxide (NiFe2O4).
ToughMet® 3 is a Cu-Ni-Sn superalloy with a good tensile strength, a high hardness and minimum corrosion resistance in acidic environment, where it experiences localised corrosion deterioration such as pitting corrosion, hydrogen embrittlement and fatigue corrosion [11,12]. Due to its good strength and elastic behaviour, the alloy is mostly used for bearing, sleeve and other high-strength wear-resistant parts, high performance engines as well as mining, industrial and heavy equipment due to its ability to resist mechanical wear [11,13].
Corrosion behaviour of copper-based alloys in natural sea water showed the alloys experienced de-alloying and intergranular corrosion by sulphides produced by bacteria attacked nickel in grain boundaries, accelerating corrosion [14]. Additionally, Hamidah et al. [15] concluded that electrolyte ion attacks lead to a reduction in the strength of the internal structure of copper alloys, rendering them more susceptible to fatigue. This may lead to failure of an engineering material. In most acidic media, copper-based alloys experience passive and pseudo-passivation behaviour due to corrosion product of Cu2O or Cu2Cl(OH)3) [15].
The Stellite® 6B alloy finds extensive application in various industrial settings, safeguarding mild steel components. These applications range from protecting slurry pump elements like casings, sleeves, and valves, to serving as implants for physiological orthopedic purposes such as artificial knees and hips.This preference is primarily due to their commendable mechanical properties and resistance to corrosion [16]. Moreover, they are widely employed across diverse sectors as cutting tools and for hard-facing castings, including but not limited to power generation, steel manufacturing, chemical processing, oil and gas, and marine environments [17]. Comprising mainly cobalt (Co), with chromium (Cr) added to fortify the Co matrix and facilitate the formation of chromium carbide (Cr3C7 or Cr23C6), these alloys also develop a protective passive film of chromium oxide (Cr2O3). Tungsten (W) is incorporated to enhance hardness [18,19]. The alloy spontaneously passivates in various environments, which is observed during anodic potentiodynamic polarisation measurements [20,21].
Thus, the purpose of this study was to perform a systematic investigation and comparison on the microstructural, hardness and electrochemical behaviour of Hastelloy® G30, ToughMet® 3 and Stellite® 6B hard alloys. Optical microscopy and scanning electron microscopy were employed to analyse and determine the microstructural features and elemental compositions of the hard alloys. The phases present in the alloys were determined through X-ray diffraction analysis. Potentiodynamic polarisation technique was used to investigate and compare the passivation and corrosion mechanisms of these alloys in synthetic mine water at varying pH levels of 6, 3, and 1. The best performing alloy was selected in attempt to replace the corroding mild steel in acidic mine environments. The right alloy for such applications is crucial for durability and performance.
2. Materials and Methods
2.1. Materials
The materials studied were nickel-chromium-iron (Hastelloy® G30, UNS N06030), copper-nickel-tin (ToughMet® 3, UNS C72800), and cobalt-chromium-tungsten (Stellite® 6B, UNS R30006) hard alloys, supplied as bars by Multi Alloys, South Africa. Their nominal compositions are given in Table 1. The selection of these hard alloys was due to their exceptional corrosion resistance in both acidic and alkaline media, coupled with commendable hardness values.

2.2. Microstructures and X-ray Diffraction Characterisation
The bulk samples underwent a comprehensive preparation regimen involving cutting, hot mounting in resins, and subsequent wet grinding with silicon carbide papers ranging from 80 to 1200 grit, followed by polishing using diamond suspensions of 9 μm, 6 μm, 3 μm, and 1 μm, to achieve a thorough analysis of their surface characteristics. Following preparation, surface cleanliness was ensured through rinsing with de-ionized water and degreasing with acetone. Subsequently, scanning electron microscopy coupled with energy dispersive X-ray spectroscopy (SEM-EDX) was employed for the detailed observation and analysis of the bulk alloy microstructures. Grain size and carbide proportions within the Stellite® 6B bulk alloy were quantified using the line intercept method on micrographs captured at a magnification of 1000X, with a minimum of 20 measurements conducted at various points. Furthermore, phase identification within the bulk alloys was facilitated using Panalytical Highscore Plus analytical software.
2.3. Hardness Tests
The Hastelloy® G30, ToughMet® 3, and Stellite® 6B bulk alloys were prepared metallographically as previously described (see section 2.2). Vickers hardness measurements were done on polished surfaces using a Vickers FM-700 hardness tester, with each sample subjected to a dwell time of 10 seconds and seven repetitions to ensure reproducibility, employing a load of 2 kg (HV2).
2.4. Test Solution
The electrolyte used for testing was synthetic mine water, the composition of which has been detailed elsewhere.
2.5. Electrochemical Measurements
The corrosion resistance of the samples was evaluated in synthetic mine water with pH levels of 6, 3, and 1 at 22.3±1.0°C. Measurements were conducted in a 500 ml three-electrode cell, with the samples acting as the working electrode, a saturated calomel electrode (SCE) as the reference electrode, and a Luggin capillary used to minimise ohmic drop errors. Samples were prepared by cold-mounting in epoxy resin after being connected to a copper wire with aluminum conducting tape. Subsequently, they underwent wet grinding with silicon carbide papers, rinsing with de-ionized water, ethanol degreasing, and air drying. Each sample had an exposed area of 1 cm^2 to the corrosive environment. Potentiodynamic polarisation measurements were conducted within a range of -750 to 1200 mV versus the reference electrode potential at a scan rate of 0.2 mV/s using an Auto Tafel potentiostat equipped with Auto Tafel software (V1.79 and Auto LPR V2.7h). Duplicate tests were performed to ensure reproducibility. Corrosion rates were calculated using Tafel extrapolation from corrosion current densities. Following polarisation, optical and scanning electron microscopy as well as XRD analysis were conducted to examine surface morphologies and films.
3. Results
3.1. Microstructural, X-Ray Diffraction and Hardness
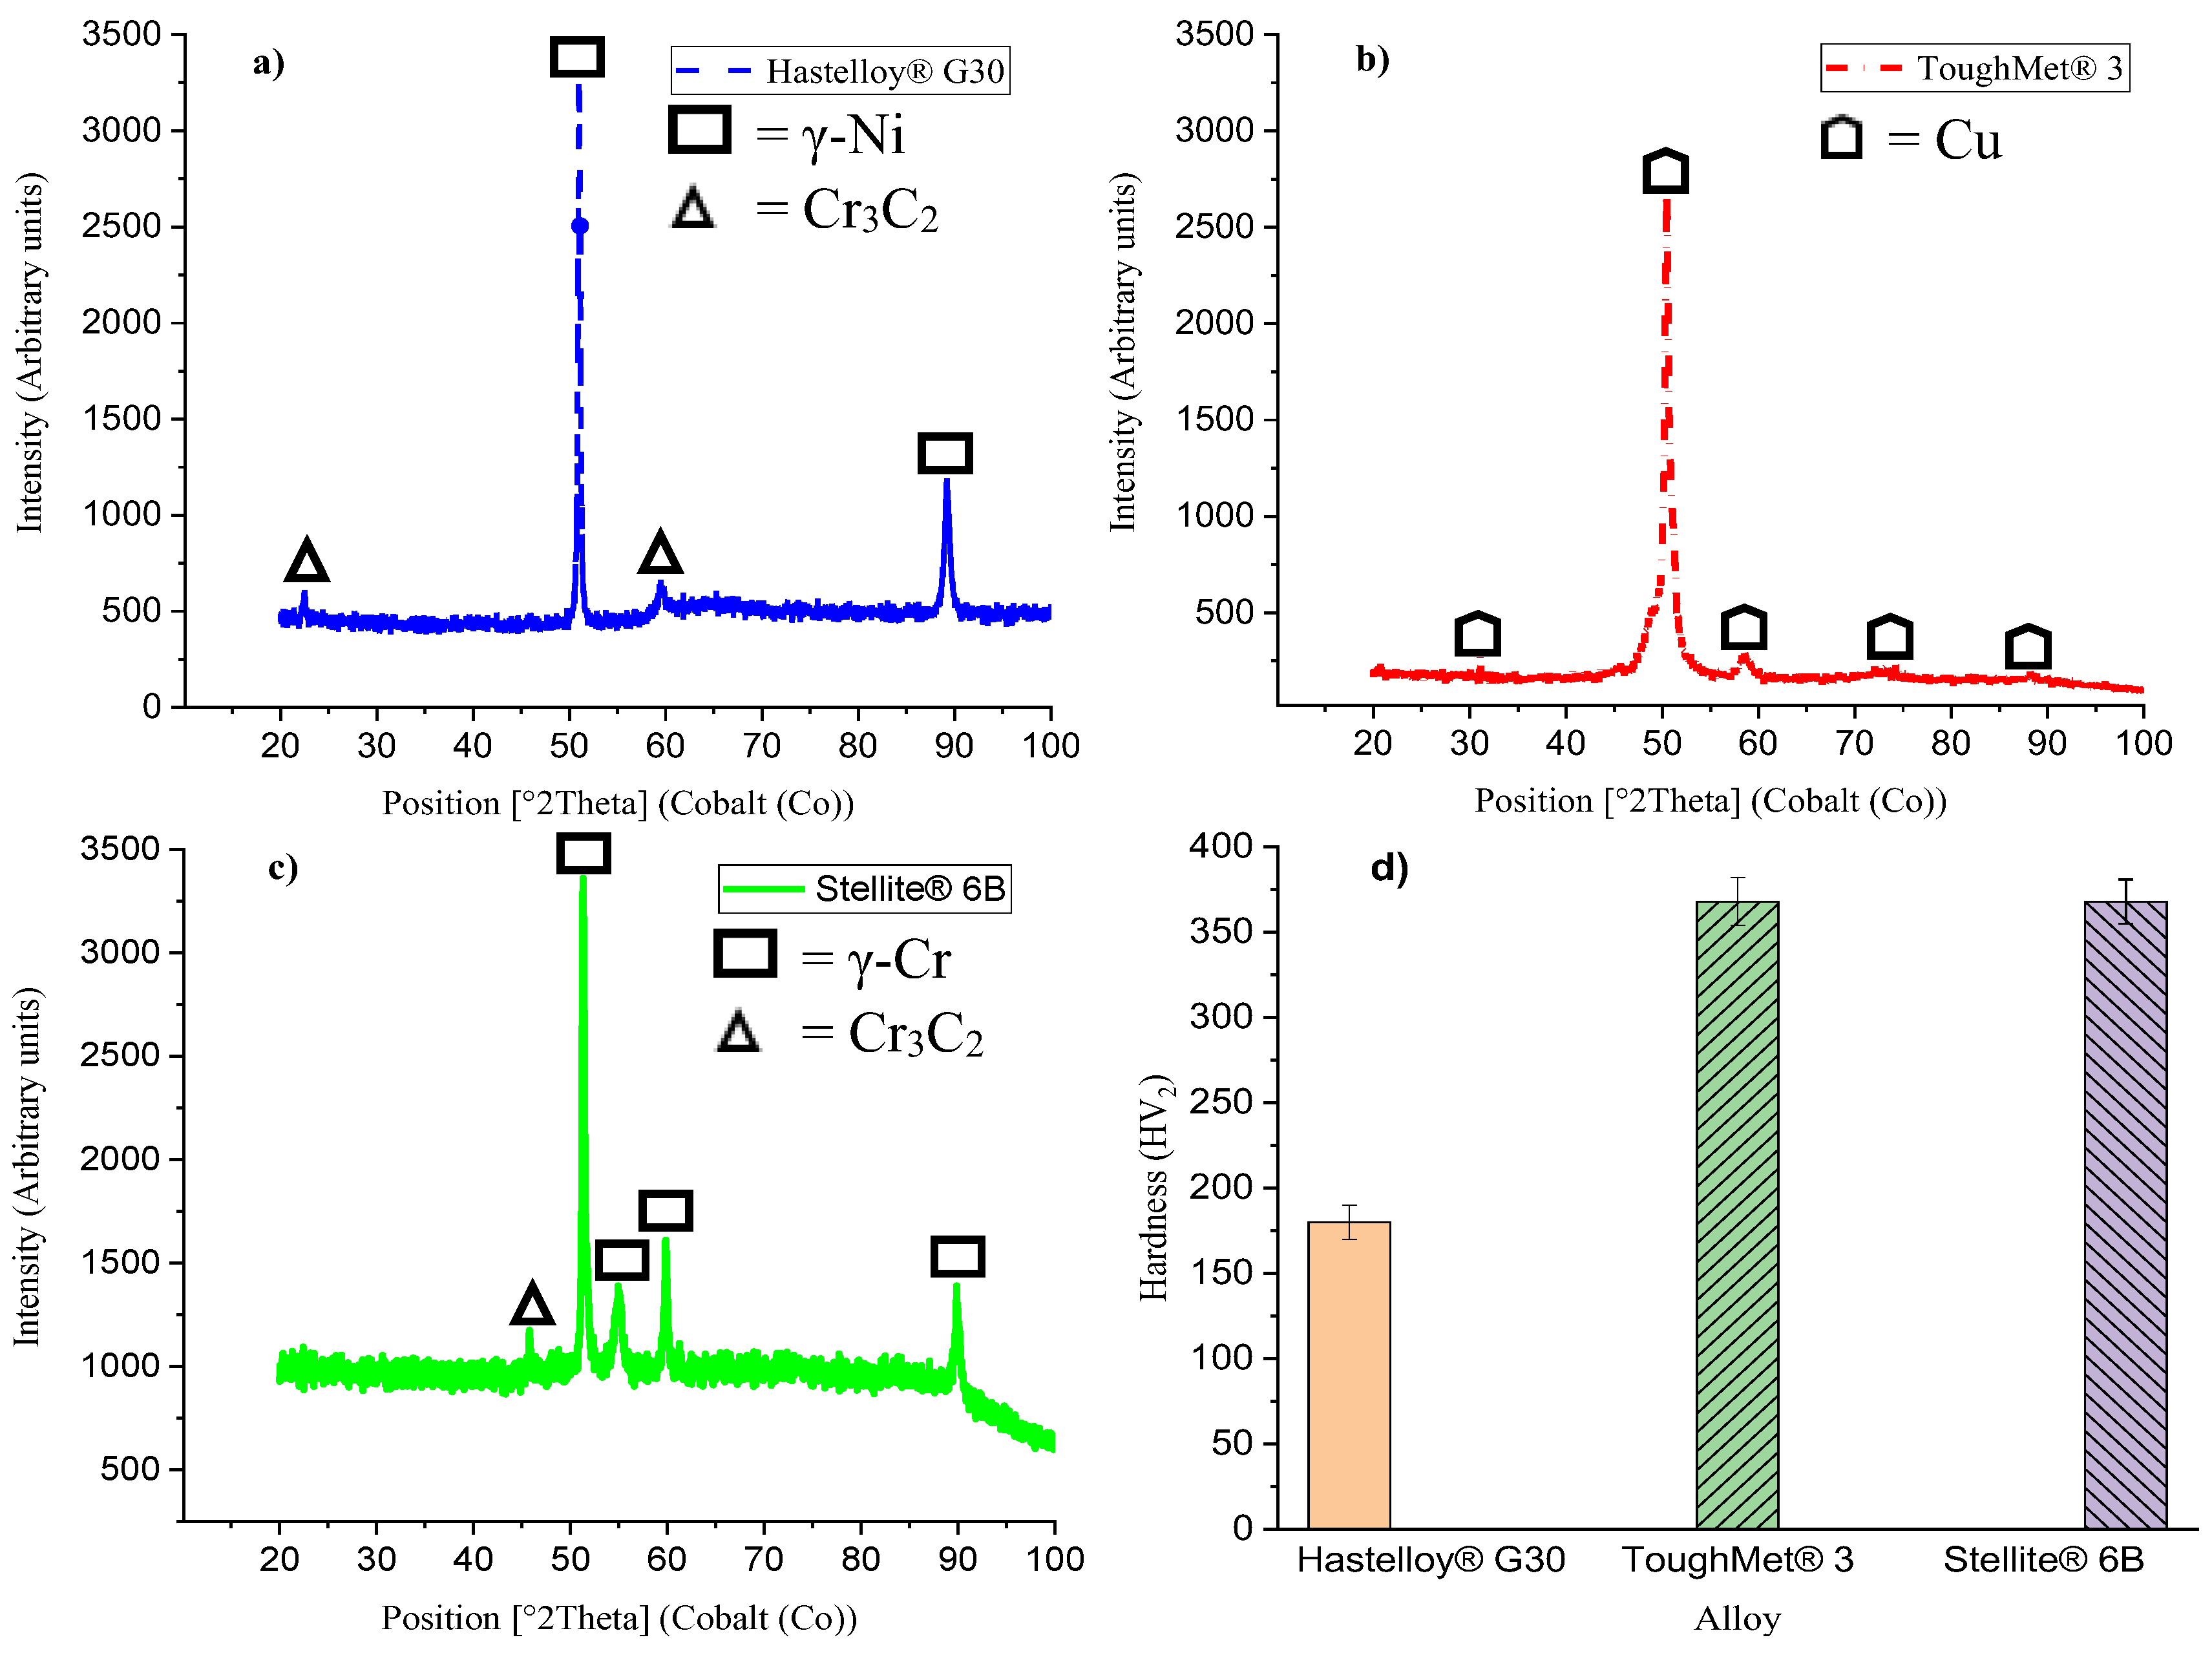
Figure 1 shows the SEM microstructures of the bulk alloys before corrosion tests. Hastelloy® G30 (Figure 1 a) composed of light grey network and dark grey matrix phases, consisting of irregular to approximate equiaxed shape γ (i.e., a Ni-rich solid solution with Cr) grains with twinning, which were more visible in the optical microstructure (Figure 1 b). The average grain size of the Hastelloy® G30 was 18.7±6.0 µm. Apart from γ-Ni, Cr3C2 was also confirmed by XRD in Hastelloy® G30 alloy (Figure 2 a). ToughMet® 3 (Figure 1 c) showed large and irregular grains, more prominently visible at lower magnifications, comprised with the average grain size of 445.4±78.0 µm. Only peaks from Cu-based solid solution were detected (Figure 2 b). Stellite® 6B (Figure 1 d) comprised of well defined γ (i.e.; a cobalt-rich solid solution with Cr) , also exhibiting twinning and also large Cr3C2 precipitated at the grain boundaries, confirmed by XRD (Figure 2 c).
Figure 1.
SEM-BSE micrographs of: a) Hastelloy® G30 and b) optical micrograph Hastelloy® G30, showing twins in the light and dark grey grains, c) SEM-BSE micrographs of ToughMet® 3, showing large grains and d) SEM-BSE micrographs of Stellite® 6B alloys displaying twins and carbides distributed within the matrix and along the grain boundaries [23].
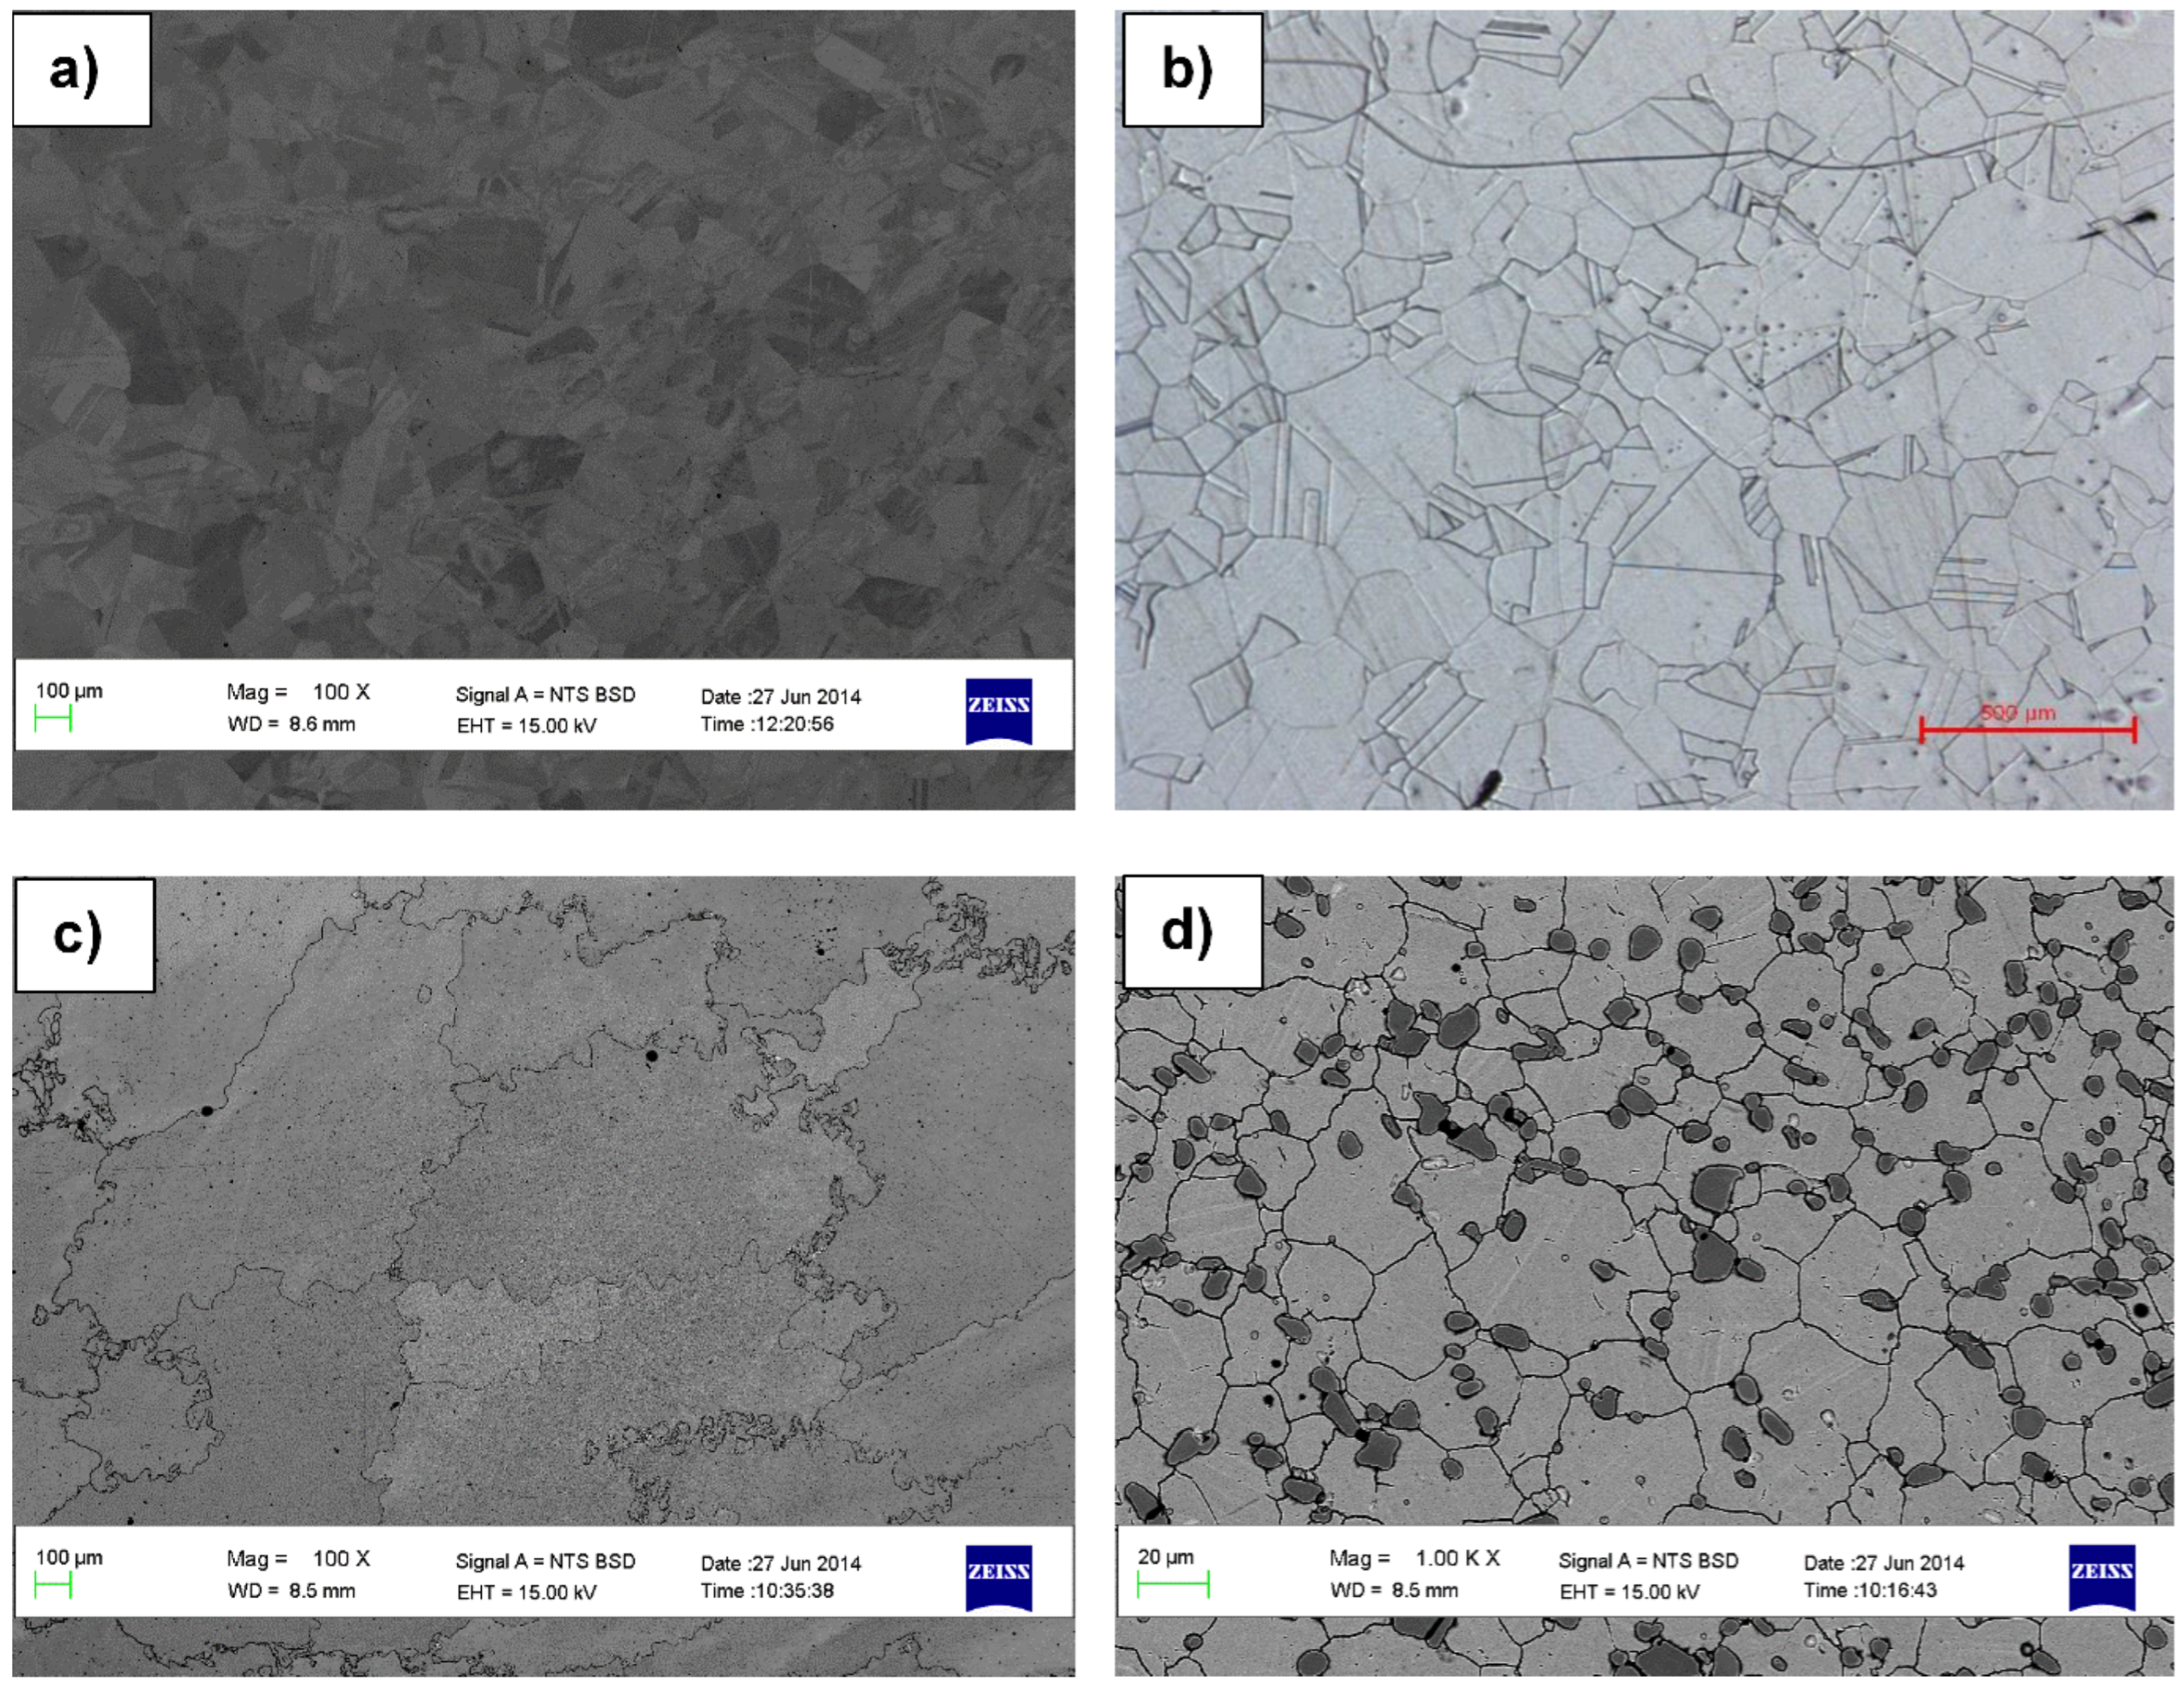
Figure 2.
XRD patterns of: a) Hastelloy® G30 alloy with γ-Ni and Cr3C2 phases, b) ToughMet® 3 alloy with Cu solid solution only, and c) Stellite® 6B showing γ-Co and Cr3C2 phases before corrosion testing. Microhardness of the alloys is in d), showing ToughMet® 3 and Stellite® 6B equally harder than the Hastelloy® G30.
The SEM-EDX data for the bulk alloys is outlined in Table 2. Hastelloy® G30 predominantly featured Ni, Cr, and Fe as major constituents, supplemented by minor elements including Mo, W, Co, Cu, Mn, Si, and Al. Meanwhile, ToughMet® 3 exhibited single-phase grains containing Cu, Ni, and Sn. EDX analyses of the Stellite® 6B alloy indicated minimal variations in composition across all phases (Table 2), revealing Co and Cr as the primary constituents, with minor quantities of W, Fe, Ni and Mn. Stellite® 6B had a larger grain size (20.5±2.0 µm). The carbide fraction for Stellite® 6B was 16±1.5 % while the precipitates for Hastelloy® G30 may be formed as thin films along grain boundaries, which were too small to measure, and this is where the Cr3C2 (Figure 2 a) is suspected to be. Stellite® 6B had 7.7±0.1 wt% O and 0.4±0.0 wt% Si for the matrix. Carbon was found in the dark phase, with 10.5±0.2 wt% (Figure 1 d).
Microhardness measurement results are presented in (Figure 2 d). Hastelloy® G30 had a lowest hardness while ToughMet® 3 and Stellite® 6B had equally high hardness. The high hardness of Stellite® 6B was likely attributed to the combined effects of finer grains and carbides (Figure 1 d and Figure 2 c), could be beneficial for improved wear properties.
Table 2.
SEM-EDX phase analyses of the Hastelloy® G30, ToughMet® 3 and Stellite® 6B hard alloys (Figure 1) before corrosion testing.
Table 2.
SEM-EDX phase analyses of the Hastelloy® G30, ToughMet® 3 and Stellite® 6B hard alloys (Figure 1) before corrosion testing.
| Element (wt%) | Hastelloy® G30 | ToughMet® 3 | Stellite® 6B | |||||
|---|---|---|---|---|---|---|---|---|
| Overall | Light grey | Dark grey | Overall | Grains | Overall | Light grey | Dark grey | |
| Cu | 1.7±0.3 | 2.3±0.2 | 2.4±0.2 | 78.3±0.2 | 76.7±1.0 | - | - | - |
| Al | 0.2±0.0 | 0.3±0.1 | - | - | - | - | - | - |
| Ni | 41.8±0.5 | 44.8±0.1 | 44.8±0.3 | 13.9±0.1 | 14.9±1.0 | 1.7±0.1 | 2.1±0.1 | - |
| Si | 0.6±01 | 0.1±0.0 | 0.2±0.0 | - | - | 0.4±0.0 | 0.5±0.0 | - |
| Cr | 29.8±0.2 | 28.8±0.2 | 28.9±0.1 | - | - | 29.5±1.0 | 24.0±0.1 | 75.3±0.3 |
| Co | 2.7±0.1 | 2.3±0.1 | 2.4±0.3 | - | - | 46.2±0.4 | 53.7±0.1 | 9.3±0.1 |
| Fe | 15.3±0.4 | 12.8±0.0 | 12.9±0.1 | - | - | 1.7±0.1 | 1.9±0.1 | 0.6±0.0 |
| Mo | 3.5±0.3 | 5.4±0.1 | 5.3±0.3 | - | - | - | 0.7±0.4 | - |
| Mn | 1.3±0.0 | 1.1±0.1 | 1.0±0.1 | - | - | 1.5±0.1 | 1.6±0.2 | 1.3±0.1 |
| W | 3.3±0.1 | 2.1±0.1 | 2.3±0.1 | - | - | 4.8±0.2 | 5.2±0.2 | 3.1±0.4 |
| Sn | - | - | - | 7.8±0.1 | 8.4±0.4 | - | - | - |
| O | - | - | - | - | - | 7.4±1.0 | 6.5±0.3 | 7.4±1.0 |
| C | - | - | - | - | - | 7.6±1.1 | 3.9±1.0 | 10.6±0.2 |
3.2. Corrosion of the Hard Alloys
3.2.1. Microscopic Morphologies of the Alloys after Corrosion Tests
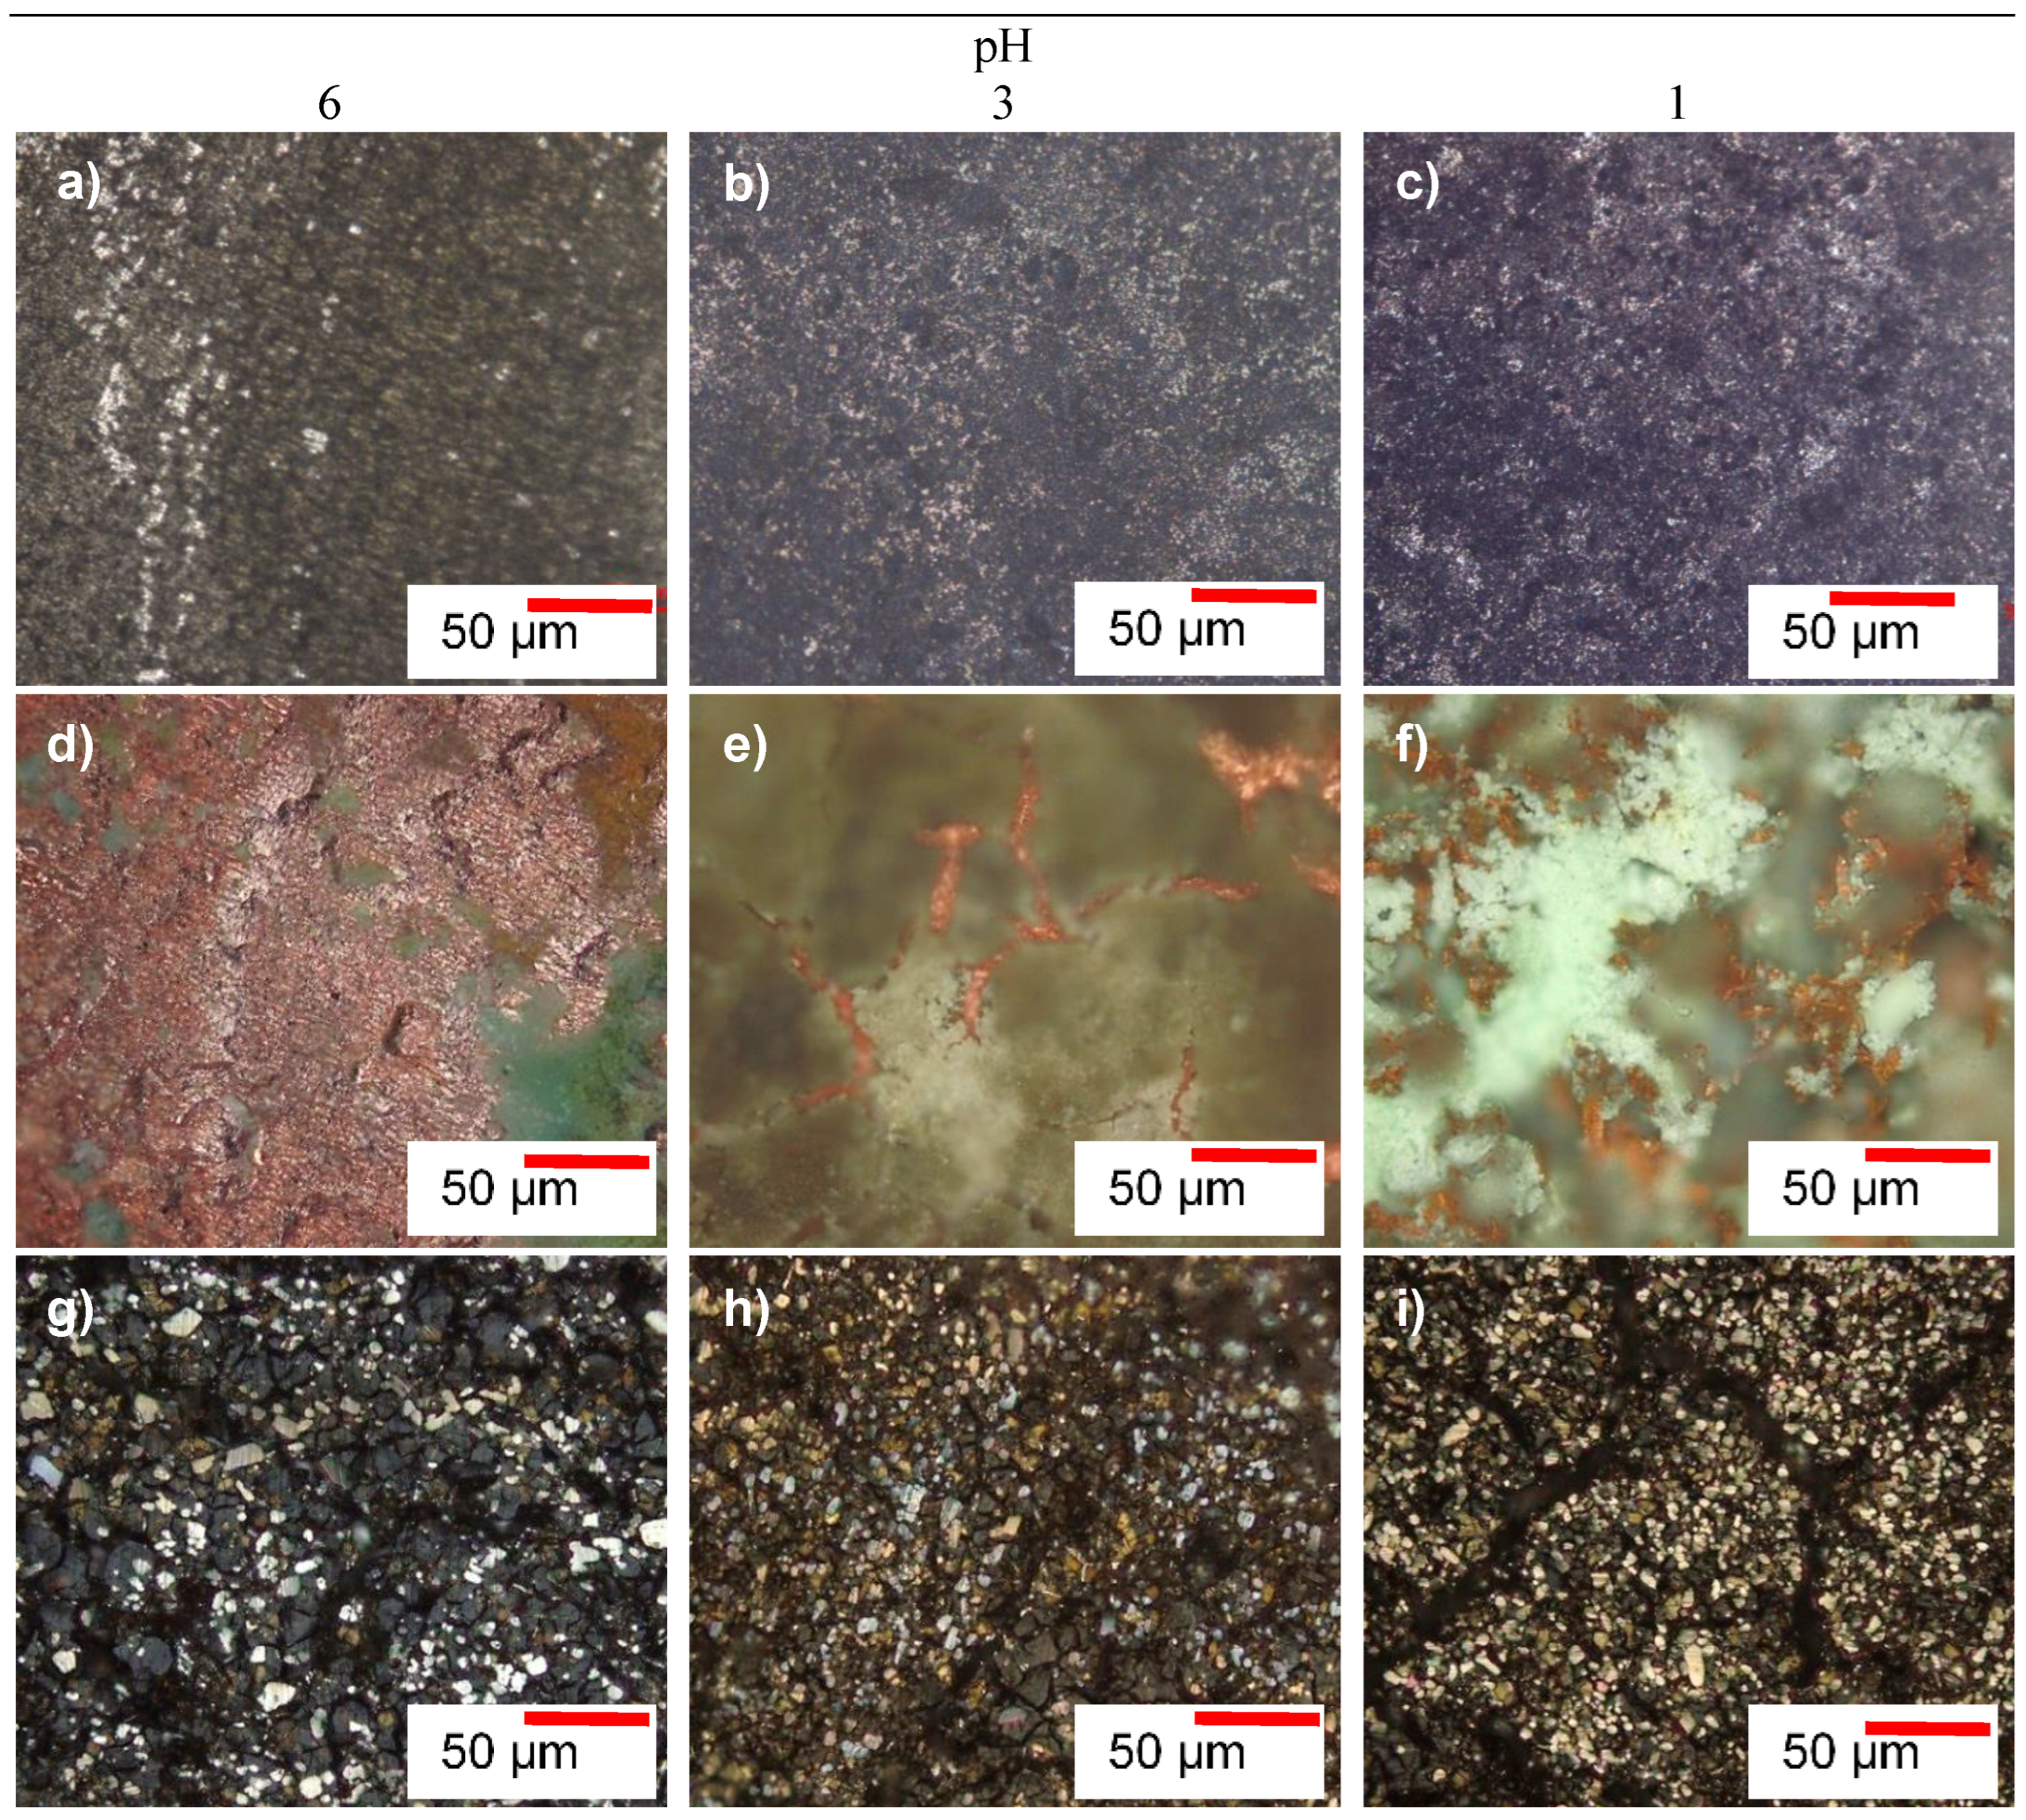
The optical microscopic morphologies of the alloys exposed in synthetic mine water at different pH values is displayed in Figure 3, and differentiated by colour observation. There were a little significant differences observed in the morphologies of the alloys when the pH was lowered. This means that that the corrosion mechanism of the alloys at all pH values may be the same. For the Hastelloy® G30 (Figure 3 a-c), the surface was simply darkish with some white products. ToughMet® 3 (Figure 3 d-f) had little bluish green corrosion products of the surface at pH 6, and covered entirely with blackish to whitish at pH 3 and bluish green and white corrosion products at pH 1. The corrosion products on top of the Stellite® 6B (Figure 3 g-i) alloy showed brownish and whitish particles at all pH values, with greyish particles at pH 6.
Figure 3.
Optical micrographs (20X magnification) show: a)-c) Hastelloy® G30, d)-f) ToughMet® 3, and g)-i) Stellite® 6B hard alloys following potentiodynamic polarisation in synthetic mine water with pH levels of 6, 3, and 1.
Figure 3.
Optical micrographs (20X magnification) show: a)-c) Hastelloy® G30, d)-f) ToughMet® 3, and g)-i) Stellite® 6B hard alloys following potentiodynamic polarisation in synthetic mine water with pH levels of 6, 3, and 1.
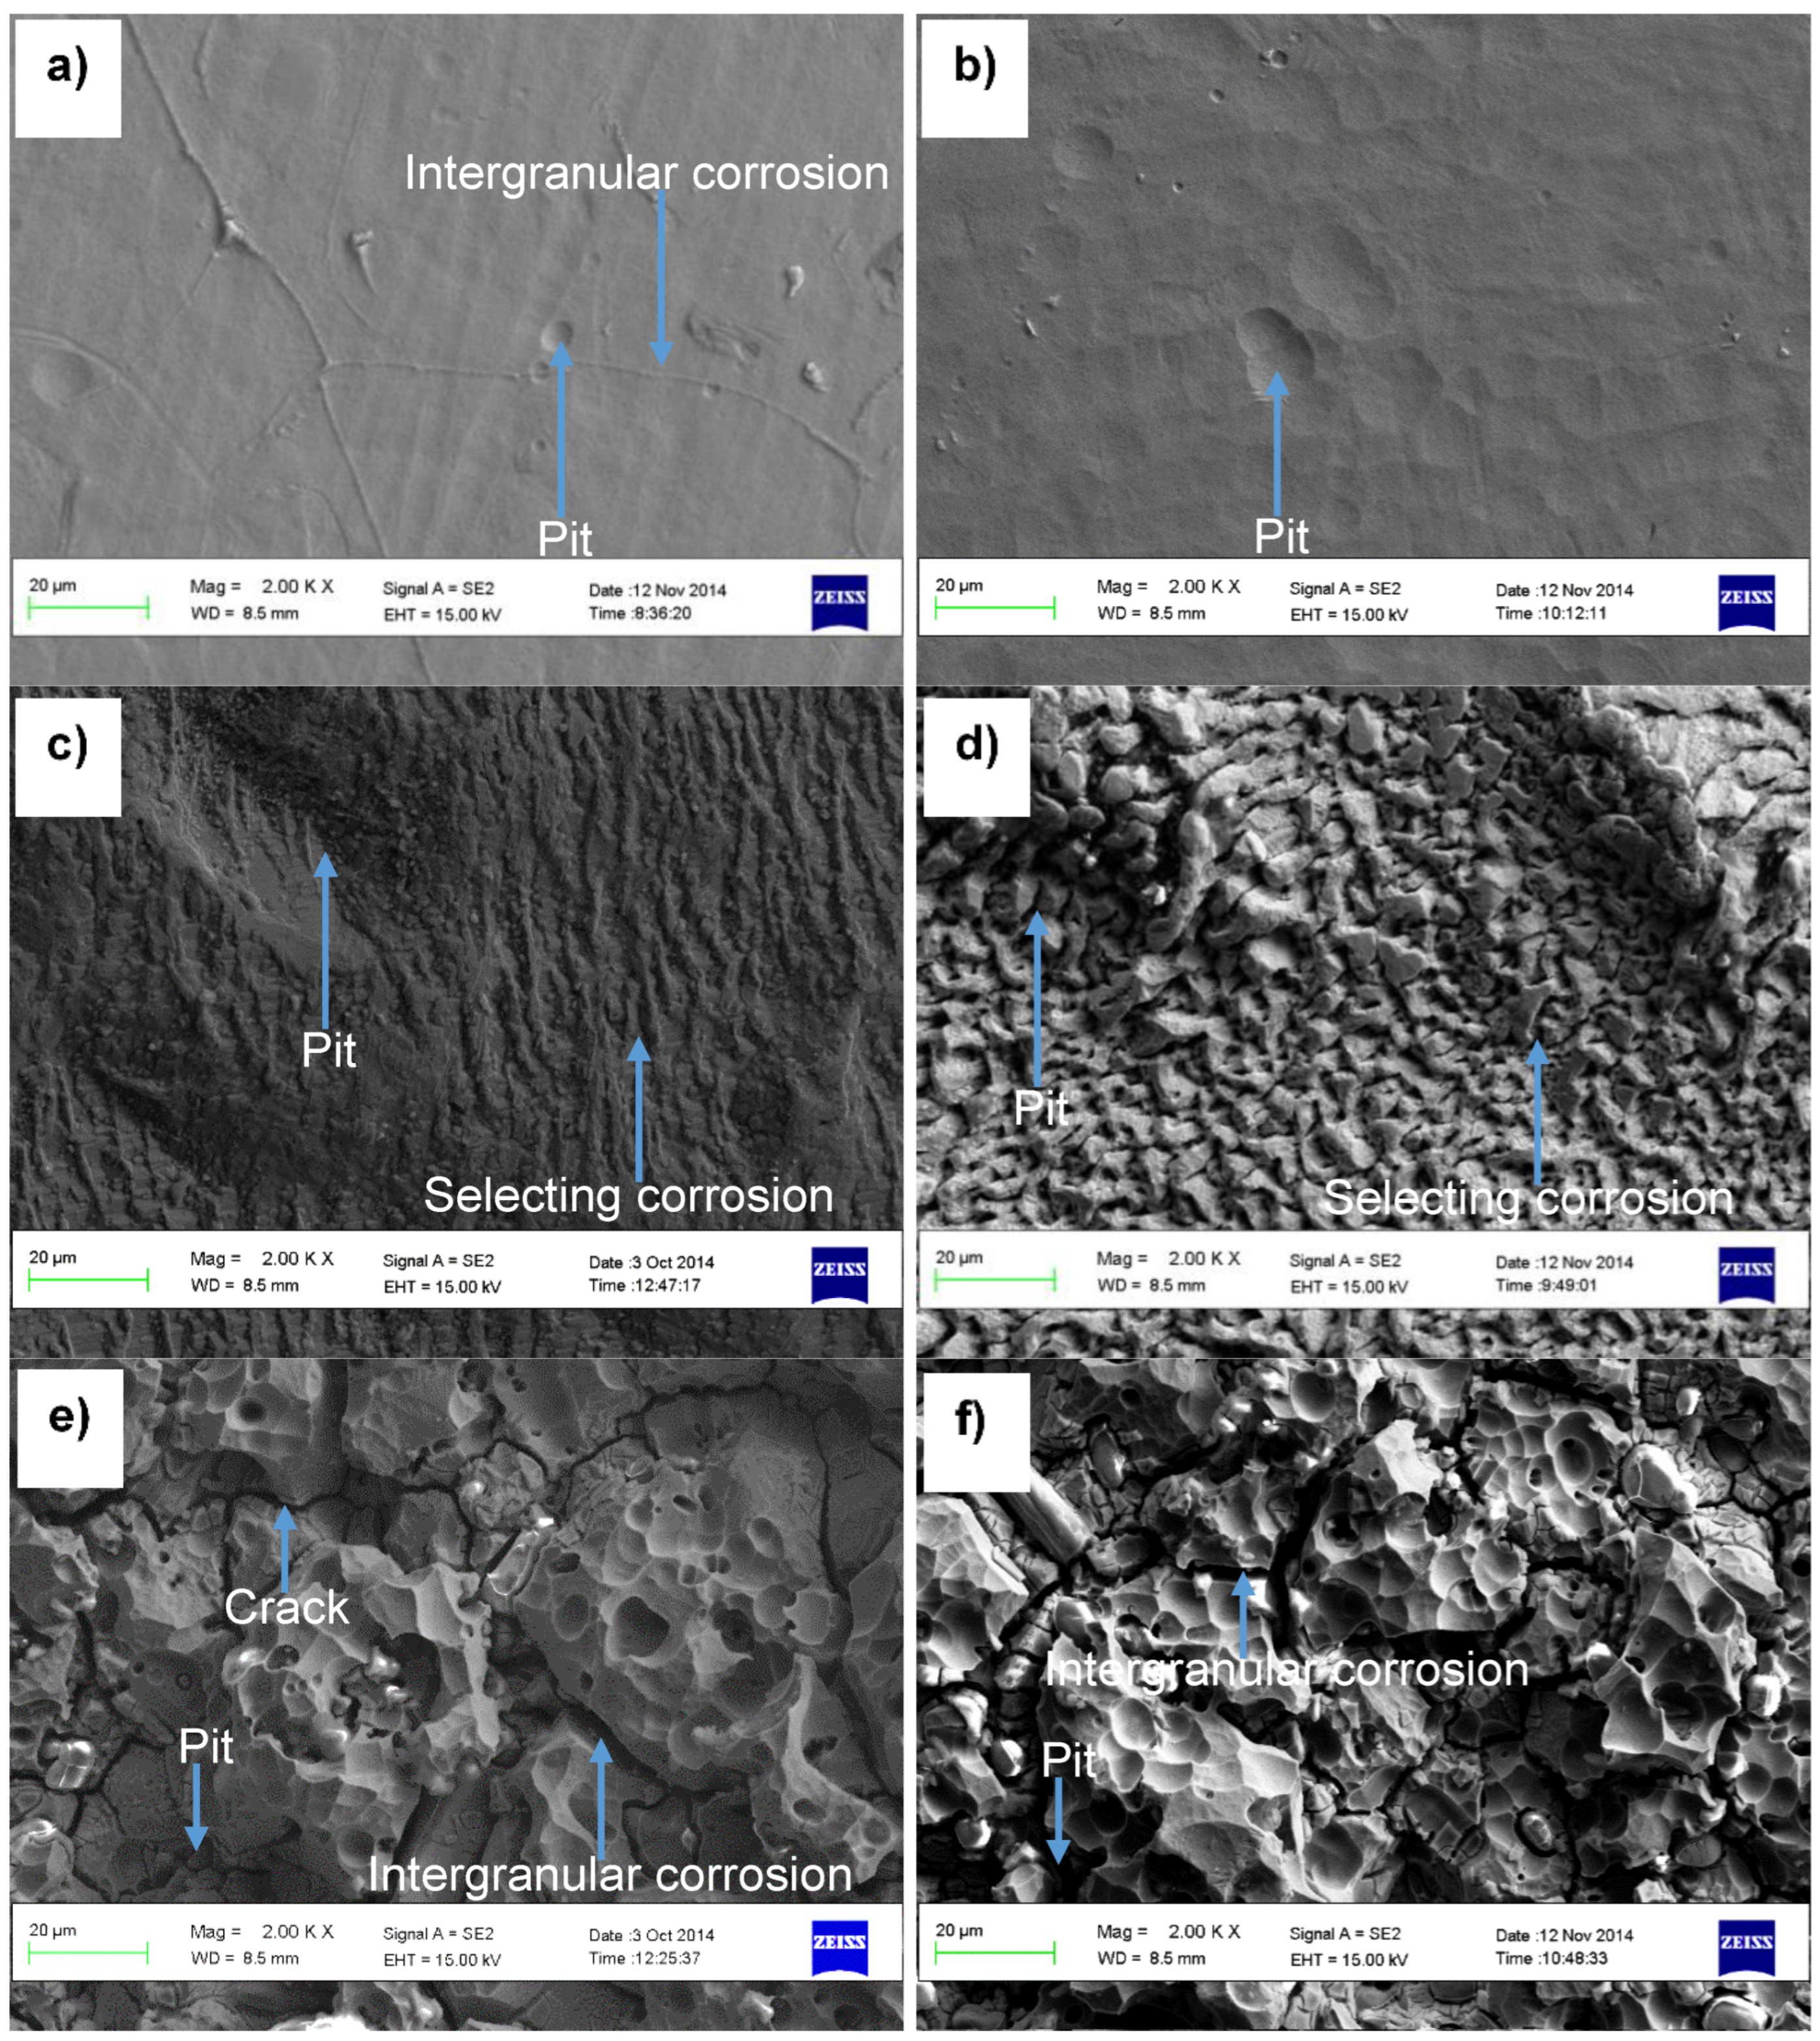
Under SEM-secondary electron (SE) detector, the surface morphologies of the alloys after corrosion tests is synthetic mine water at pH 6 and 1 are shown in Figure 4.
Hastelloy® G30 alloy showed almost even surfaces with shallow and a few deep pits, which were more at pH 1 than pH 6 (Figure 4 a and b). ToughMet® 3 exhibited pitting and selective corrosion, resulting in a thick surface layer (Figure 4 c and d. Stellite® 6B, on the other hand, primarily underwent uniform corrosion, with instances of intergranular corrosion and small pits where carbides were removed, along with surface oxides as corrosion byproducts (Figure 4 e and f), observed across all pH levels.
Figure 4.
SEM-SE micrographs of the alloys after potentiodynamic polarisation in synthetic mine water at pH 6 and 1: a) and b) Hastelloy® G30, c) and d) ToughMet® 3 and e) and f) Stellite® 6B [23].
Figure 4.
SEM-SE micrographs of the alloys after potentiodynamic polarisation in synthetic mine water at pH 6 and 1: a) and b) Hastelloy® G30, c) and d) ToughMet® 3 and e) and f) Stellite® 6B [23].
3.2.2. Corrosion Products by XRD Analyses
To confirm the compositions of the corrosion products, SEM-EDX (Table 3) and XRD (Figure 5) analyses were used. XRD results showed that Hastelloy® G30 had Ni, Cr2O3 and NiFe2O4 after corrosion tests in all pH values (Figure 5 a).
EDX analysis conducted on the surface in Figure 4 c revealed that ToughMet® 3 exhibited relatively high concentrations of Cu, O, and Cl, with no detection of Sn (Table 3) across all pH levels. Comparing the data from Table 2 and Table 3), it is evident that the content of Cu and Sn decreased after corrosion. This suggests that Cu and Sn were preferentially removed from the sample, leaving behind Ni, which likely interacted with Cl and O from the solution. The phase compositions of the corrosion products, as confirmed by XRD. This means Cu and Sn were selectively removed from the sample, leaving behind Ni and they would probably combine with Cl and O from the solution. The phase compositions of the corrosion products, confirmed by XRD (Figure 5 b), consisted of Cu, along with a double-layered reaction product: copper (I) oxide (Cu2O) beneath and a copper chloride hydroxide (Cu2Cl(OH)3) layer formed by the presence of chloride-containing electrolyte. For the Stellite® 6B alloy, the overall EDX analysis indicated elevated concentrations of Co, Cr, C, O, and W on the surface across all pH levels (Table 3). The increased concentration of O suggests the formation of a chromium oxide (Cr2O3) oxide film on the surface, a finding corroborated by XRD analysis (Figure 5 c).
Table 3.
SEM-EDX surface analyses of the ToughMet® 3 and Stellite® 6B hard alloys (Figure 4) after corrosion testing.
Table 3.
SEM-EDX surface analyses of the ToughMet® 3 and Stellite® 6B hard alloys (Figure 4) after corrosion testing.
| Element (wt%) |
pH 6 | pH 3 | pH 1 | |||
|---|---|---|---|---|---|---|
| ToughMet® 3 | Stellite® 6B | ToughMet® 3 | Stellite® 6B | ToughMet® 3 | Stellite® 6B | |
| C | - | 14.6±1.0 | - | 11.3±1.0 | - | 6.6±1.0 |
| Ca | 0.4±0.0 | 0.3±0.0 | 0.4±0.0 | 0.2±0.0 | 1.5±1.0 | 0.2±0.0- |
| Cu | 50.4±7.0 | - | 64.4±2.0 | - | 69.0±12.0 | - |
| O | 11.3±2.0 | 8.4±0.3 | 12.9±2.0 | 7.0±0.1 | 12.4±5.0 | 12.6±0.2 |
| Na | 0.1±0.0 | 0.3±0.0 | 0.4±1.0 | 0.2±0.1 | 0.2±0.0- | 0.2±0.0 |
| S | 0.4±0.0 | 0.2±0.0 | 0.2±0.0 | 0.3±0.0 | 0.3±0.1- | 0.8±0.1 |
| Cl | 10.0±3.0 | - | 20.3±5.0 | - | 10.0±5.0 | - |
| Cr | - | 26.6±0.1 | - | 27.9±0.3 | - | 29.6±0.2 |
| Mn | - | 1.5±0.0 | - | 1.7±0.2 | - | 1.4±0.1 |
| Fe | - | 1.9±0.0 | - | 2.0±0.0 | - | 1.5±0.0 |
| Co | - | 38.8±0.0 | - | 42.8±1.0 | - | 35.8±0.2 |
| Ni | 0.6±0.0 | - | 0.2±0.0 | 1.0±0.1 | 0.9±0.3 | 1.4±0.0 |
| Mo | - | - | - | 5.5±0.1 | - | 0.9±0.4 |
| W | - | 6.1±1.0 | - | 5.5±0.1 | - | 8.7±0.4 |
Figure 5.
XRD patterns of the alloys after potentiodynamic polarisation in synthetic mine water at pH 6 and 1: a) Hastelloy® G30, b) ToughMet® 3, and d) Stellite® 6B.
Figure 5.
XRD patterns of the alloys after potentiodynamic polarisation in synthetic mine water at pH 6 and 1: a) Hastelloy® G30, b) ToughMet® 3, and d) Stellite® 6B.
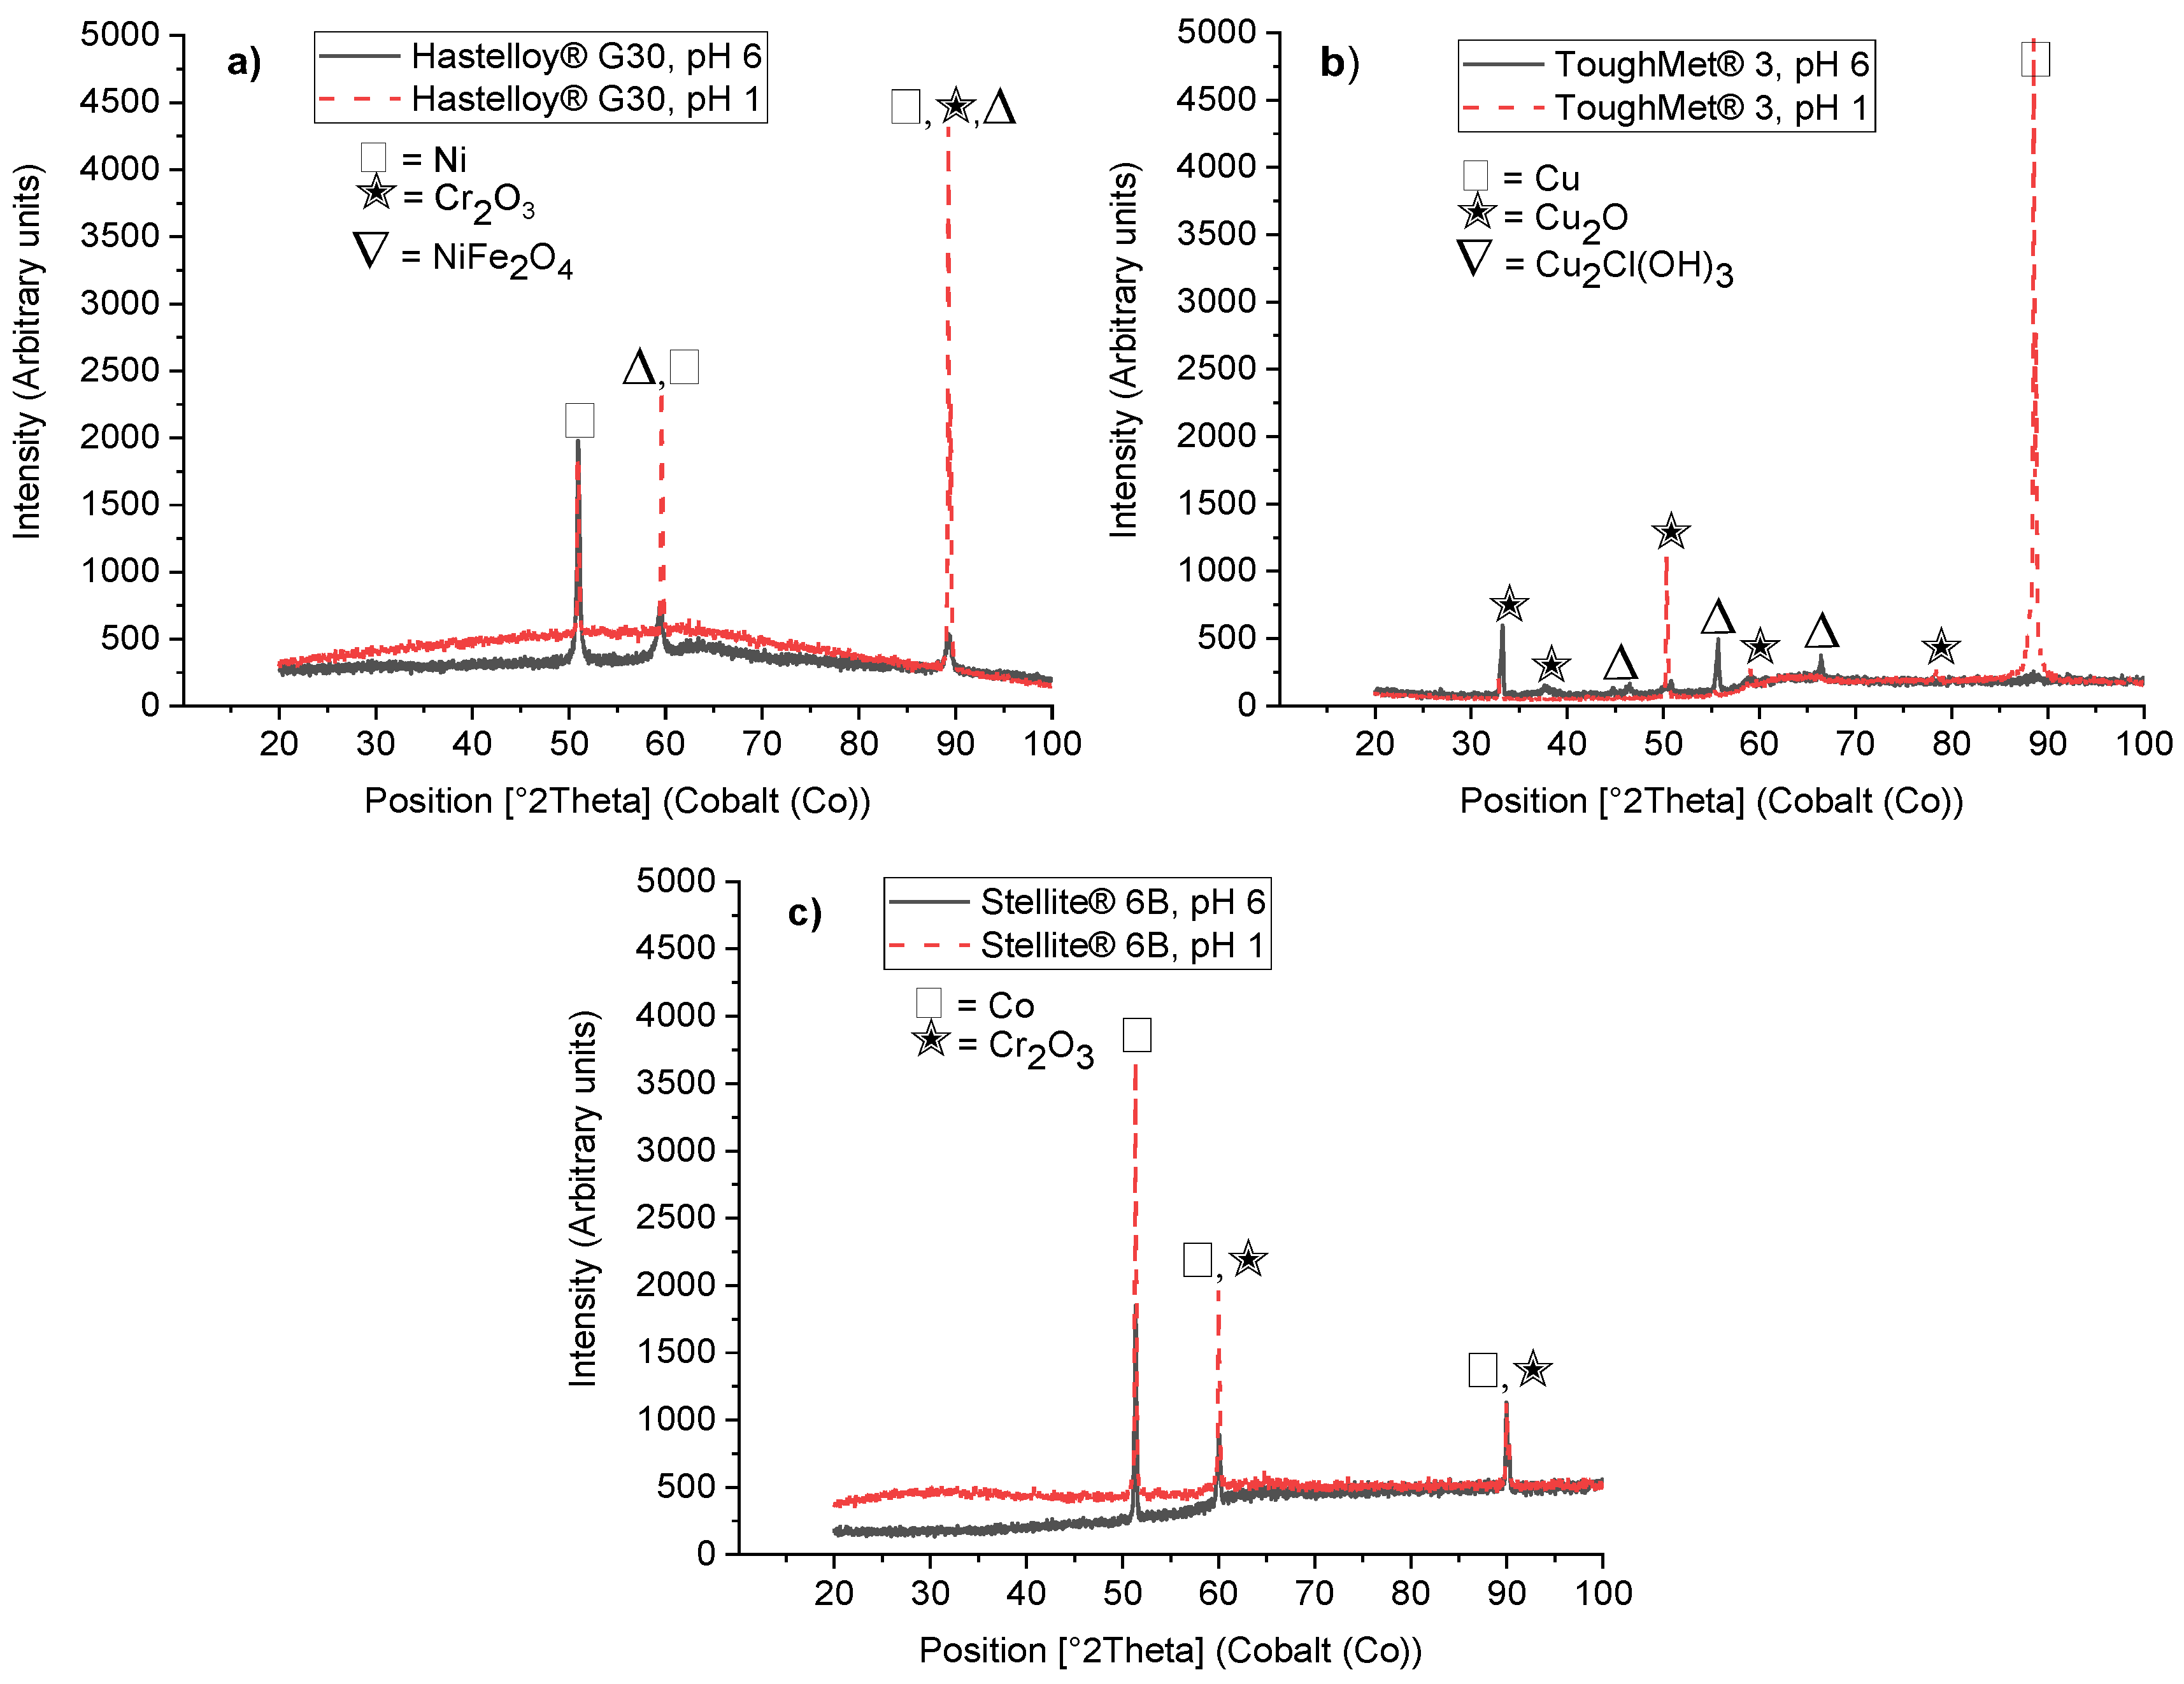
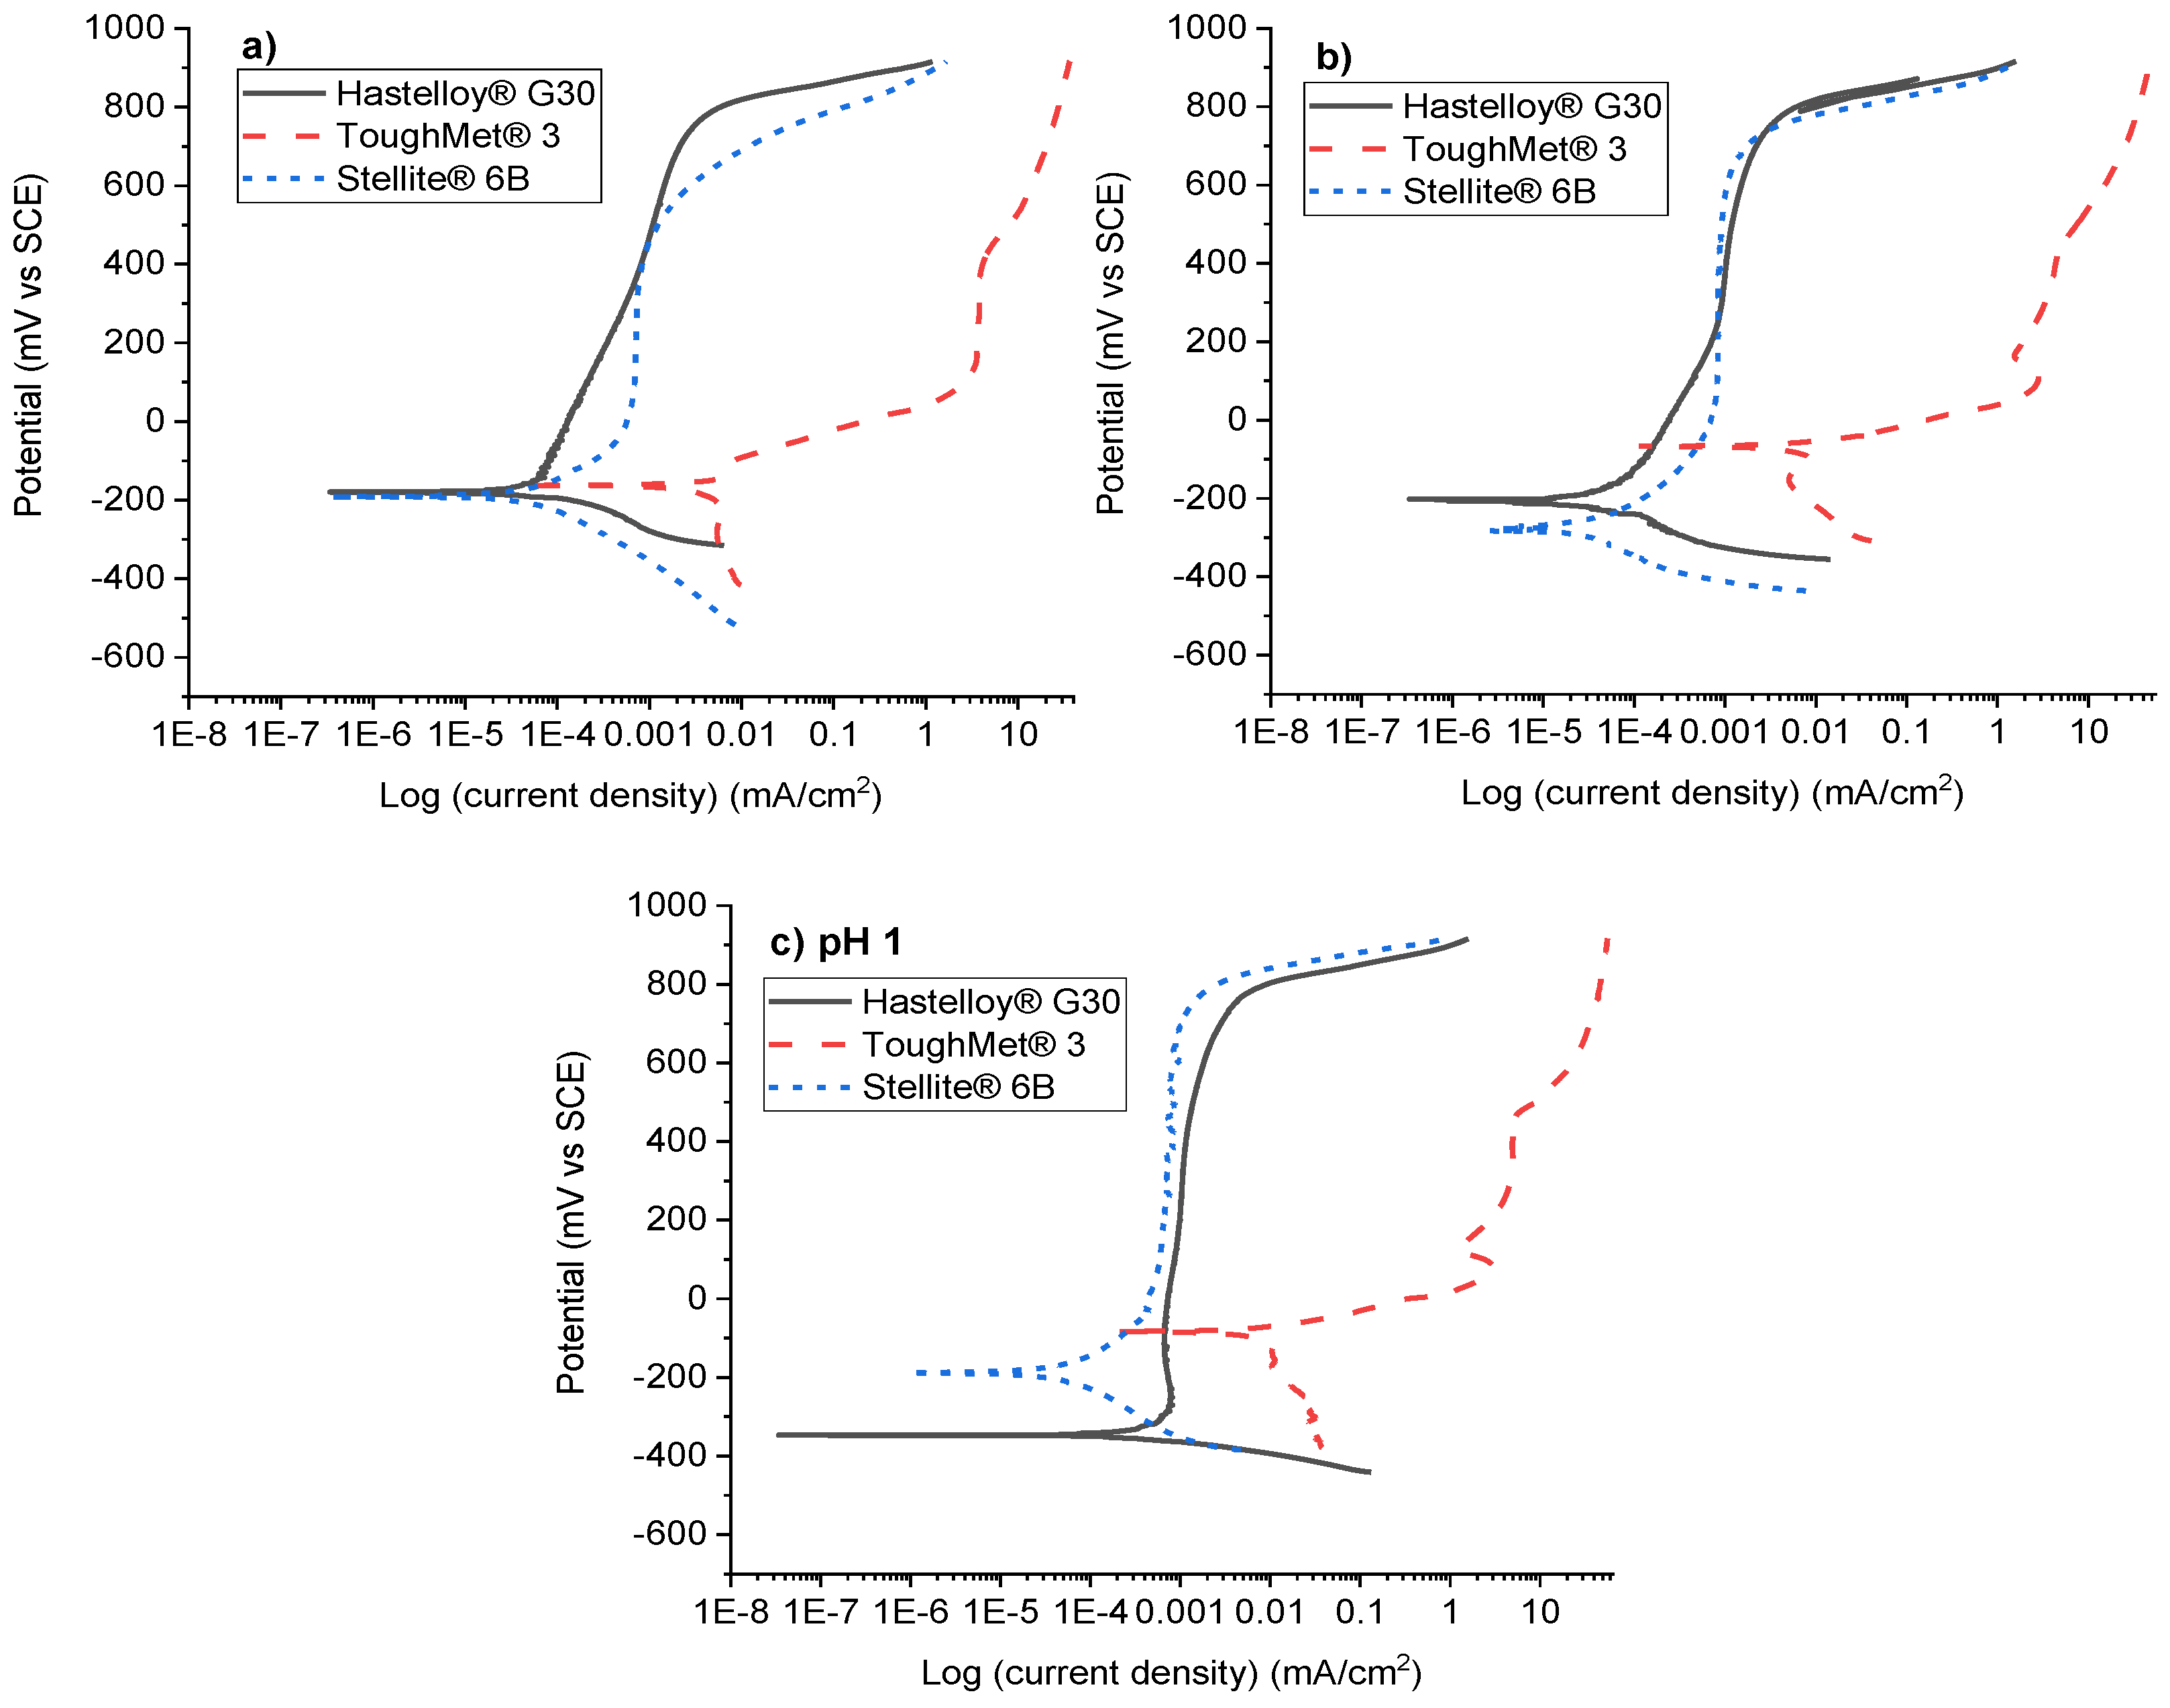
Figure 6.
Potentiodynamic polarisation curves, showing the behaviour of Hastelloy® G30, ToughMet® 3, and Stellite® 6B hard alloys in synthetic mine water at: a) pH 6, b) pH 3, and c) pH 1.
Figure 6.
Potentiodynamic polarisation curves, showing the behaviour of Hastelloy® G30, ToughMet® 3, and Stellite® 6B hard alloys in synthetic mine water at: a) pH 6, b) pH 3, and c) pH 1.
3.3. Electrochemical Results
The potentiodynamic polarisation curves of Hastelloy® G30, ToughMet® 3 and Stellite® 6B bulk alloys in synthetic mine water at pHs 6, 3 and 1 at ambient temperature (22.3±1.0°C are presented in Figure 6. The Hastelloy® G30 (Figure 6 a) and Stellite® 6B (Figure 6 b) bulk alloys exhibit the spontaneous passive behaviour without active–passive transition, at all pH values tested, suggesting the formation of stable and protective passive film was formed [17,20,24]. The ToughMet® 3 (Figure 6 c) bulk alloy also experienced an active-passive and then pseudo-passive (unstable or apparent passivation) behaviour at all pH values tested.
Hastelloy® G30 and Stellite® 6B exhibited an extensive passivation range spanning approximately -350 mV to around 750 mV (Figure 6). However, pitting occurred when the protective thin film was locally breached, resulting in elevated current densities at these corrosion potentials [25,26]. As the passive and transpassive regions of the polarisation curves nearly coincided, the corrosion resistances of the Hastelloy® G30 and Stellite® 6B alloys appeared quite similar, despite notable differences in their microstructures (Figure 1). ToughMet® 3 exhibited a limited passivity range, spanning approximately -0 mV to around 400 mV, followed by pitting. It demonstrated higher passive current densities across all pH values, indicating inferior corrosion resistance in the tested environment.
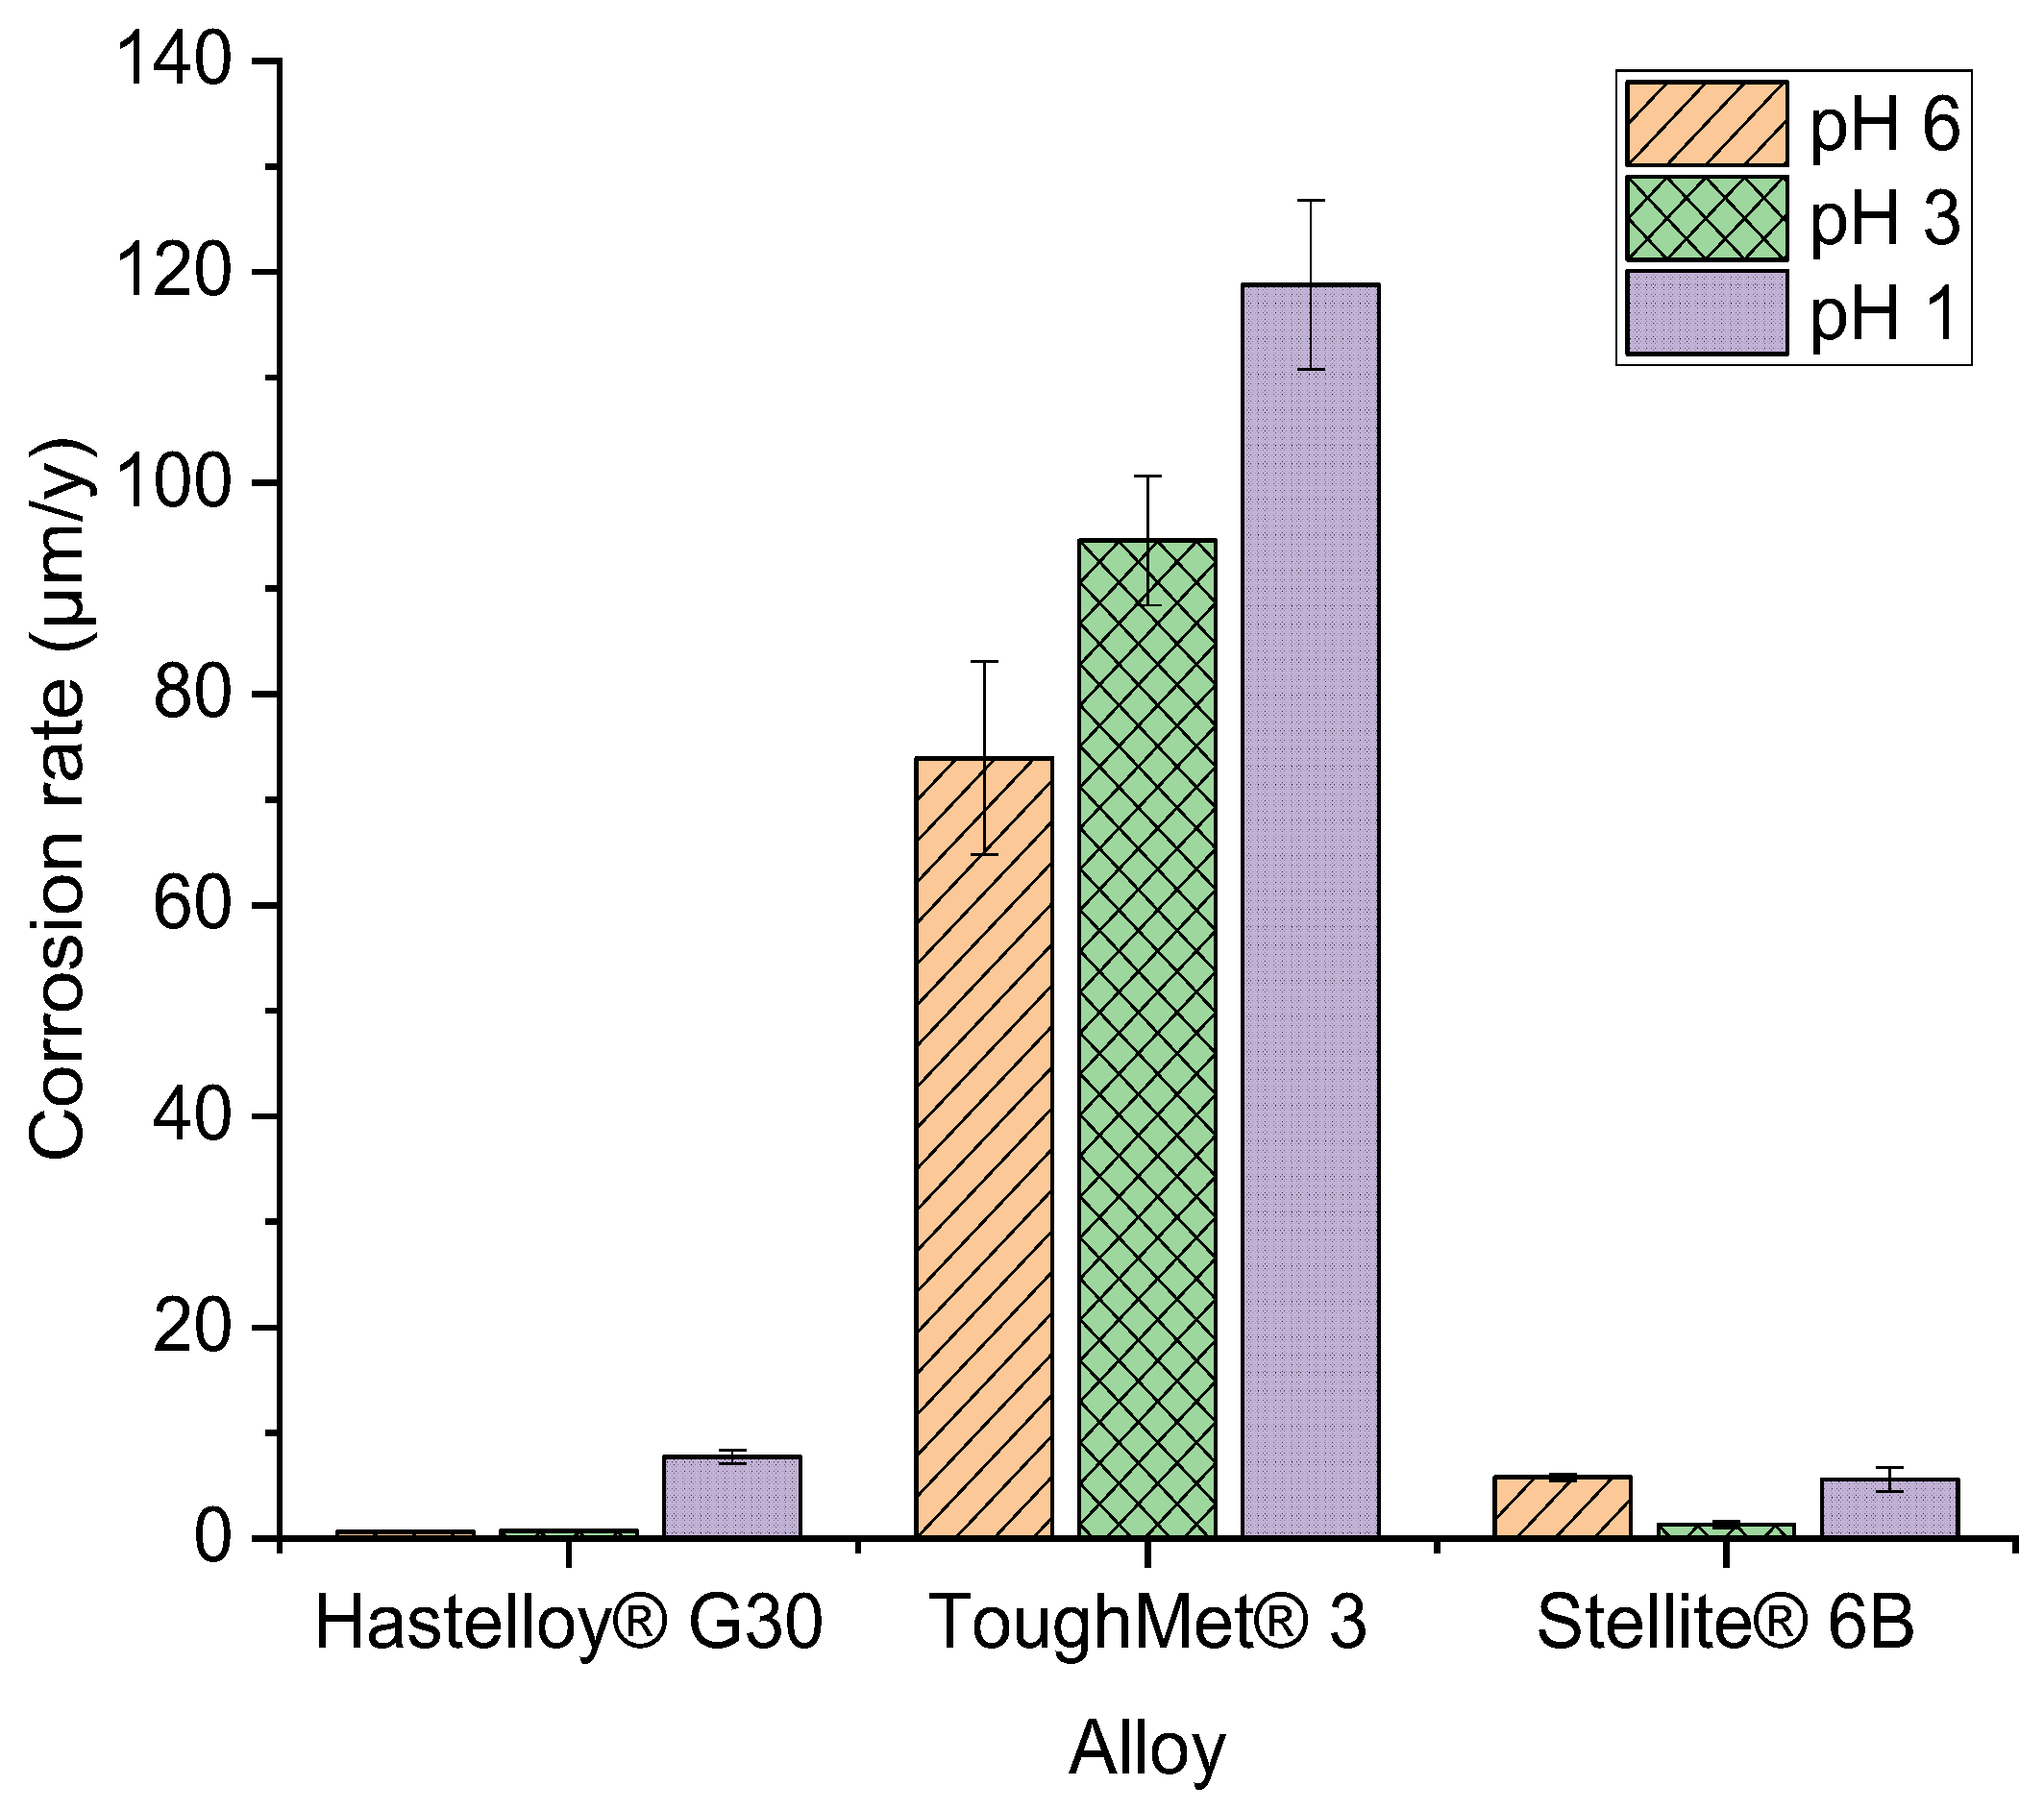
Table 4 presents the corrosion potentials (Ecorr), current densities (icorr), and corrosion rates of Hastelloy® G30, ToughMet® 3, and Stellite® 6B hard alloys in synthetic mine water at pH levels of 6, 3, and 1 as deduced from corrosion results in Figure 6. Ecorr for Hastelloy® G30 changed to more negative values, icorr changed with no trends and corrosion rate increased when the pH was decreased. Ecorr for ToughMet® 3 changed from more to less negative values while icorr and corrosion rate increased when the pH was decreased. The corrosion potential for Stellite® 6B changed with no trends (but more negative at pH 3) and at pH 6 and 3, icorr was the same and high at pH 1 while corrosion rate also changed with no trends when the pH was decreased. It can be concluded that corrosion rate (µm/y) rankings at pH 6 was: ToughMet® 3 (73.93±9.12) > Stellite® 6B (5.81±0.33) > Hastelloy® G30 (0.63±0.01), at pH 3: ToughMet® 3 (94.54±6.11) > Stellite® 6B (1.32±0.34) > Hastelloy® G30 (0.74±0.05) and at pH 1: ToughMet® 3 (118.78±8.00) > Hastelloy® G30 (7.75±0.64) > Stellite® 6B (5.61±1.13). In average, Stellite® 6B demostrated better corrosion resistance in the synthetic mine water than Hastelloy® G30 and ToughMet® 3.
Table 4.
Potentiodynamic polarisation results of Hastelloy® G30, ToughMet® 3 and Stellite® 6B bulk alloys in synthetic mine water at pH level of 6, 3, and 1.
Table 4.
Potentiodynamic polarisation results of Hastelloy® G30, ToughMet® 3 and Stellite® 6B bulk alloys in synthetic mine water at pH level of 6, 3, and 1.
| pH | Bulk alloy | Ecorr (mV) | icorr (µA/cm2) | Corrosion rate (µm/y) |
|---|---|---|---|---|
| 6 | Hastelloy® G30 | -179.4±2.4 | 0.063±0.001 | 0.63±0.01 |
| ToughMet® 3 | -162.5±3.2 | 6.1±0.4 | 73.93±9.12 | |
| Stellite® 6B | -191.7±1.3 | 0.13±0.02 | 5.81±0.33 | |
| 3 | Hastelloy® G30 | -202.2±2.6 | 0.074±0.00 | 0.74±0.05 |
| ToughMet® 3 | -67.2±1.3 | 7.8±0.6 | 94.54±6.11 | |
| Stellite® 6B | -283.2±3.1 | 0.13±0.04. | 1.32±0.34 | |
| 1 | Hastelloy® G30 | -347.1±3.3 | 0.071±0.001 | 7.75±0.64 |
| ToughMet® 3 | -83.9±1.7 | 9.8±0.7 | 118.78±8.00 | |
| Stellite® 6B | -182.8±4.1 | 0.058±0.004 | 5.61±1.13 |
4. Discussion
4.1. Microstructures of the Hard Alloys
Hastelloy® G30 and Stellite® 6B alloys exhibited a polycrystalline structure characterized by γ matrices and carbides, whereas ToughMet® 3 alloy displayed a single-phase structure, each possessing inherent properties influenced by grain sizes and carbide distribution (excluding ToughMet® 3). The samples were not subjected to heat treatment for microstructure optimisation, although such treatment could potentially enhance their properties. Any microstructure optimisation would be reserved for future investigations. Decreasing grain sizes typically leads to increased hardness, but there is a concern regarding reduced corrosion resistance due to the greater grain boundary area, as grain boundaries are typically prone to corrosion initially [23].
Decreasing grain sizes typically leads to increased hardness, but there is a concern regarding reduced corrosion resistance due to the greater grain boundary area, as grain boundaries are typically prone to corrosion initially. A more uniform distribution of carbides could also prove beneficial, particularly for Stellite® 6B, which exhibited relatively large carbides at grain boundaries and within grains, and for Hastelloy® G30, where carbides were exclusively present within grains. The large grain sizes observed in ToughMet® 3 may result from the segregation of Cu–Ni–Sn alloy during solidification, driven by significant differences in the melting points of the constituent elements. This segregation enhances the mechanical properties of the alloy [13].
4.2. Hardness of the Alloys
The hardness of Hastelloy® G30, ToughMet® 3, and Stellite® 6B alloys (Figure 2 d is crucial in applications requiring wear resistance. The hardness values of ToughMet® 3 and Stellite® 6B were comparable to those reported by Yu et al. [13] and and Bozzi et al. [27]. for Haynes 6B and 25 alloys (310–466 HV2). However, other studies have reported significantly higher hardness values for various cobalt-based alloys. For instance, Ahmed et al. [28] cited hardness ranging from 419–704 HV2 for Stellite® 6 and 20, while Hango et al. quoted hardness of 419–704 HV2 for Stellite® 6 and 20, while Hango et al. [17] and Krell et al. [29] found Co-Cr-W-C alloys to have hardness in the range of 360–620 HV2, and lower hardness values of 230–390 HV2 for Co-Cr-W/Mo-Ni/Fe-C alloys.
Although with very lower hardness (201-235 HV2) than Stellite® 6B coatings, An et al. [30] studied hardness evolution in cobalt alloys (200-280 HV2), where hardness resulted from the formation of martensite and mechanical twins during cold rolling.
The higher hardnesses of the Stellite® 6B alloy was due to the presence of Cr3C2 which is added for wear resistance [31]. The higher C and W contents of Stellite® 6B than Hastelloy® G30 and ToughMet® 3 facilitated the formation of tungsten carbides [32,33] resulting in an increased overall hardness. The carbides were visible in the microstructures (Figure 1), and were observed in the XRD patterns (Figure 2).
To identify the best alloy, the corrosion rates and the hardness had to be considered. The corrosion rates of Hastelloy® G30 alloy at pH 6 and 3 were lowest of the alloys, but the alloy was much less hard than the ToughMet® 3 and Stellite® 6B alloys. On the other hand, ToughMet® 3 had the highest corrosion rates than Hastelloy® G30 and Stellite® 6B. In average, Stellite® 6B exhibited better corrosion rates at all pH values (Table 4) and had a high hardness compared to ToughMet® 3 and Hastelloy® G30, hence, it could be employed as a substitute for mild steels in applications subjected to corrosion and wear.
4.3. Potentiodynamic Polarisation Behaviours of the Hard Alloys
Figure 7 showed that Hastelloy® G30 and Stellite® 6B demonstrated evidence of the formation of protective oxide films, while ToughMet® 3 experienced a non-protective oxide film. Hastelloy® G30 exists as nickel oxide (NiO), Stellite® 6 as chromium oxide (Cr2O3), and ToughMet® 3 as copper oxide (Cu2O or Cu2Cl(OH)3). The equations (1)-(16) describe the chemical reactions that take place during the oxide film formation for Hastelloy® G30 ((1)-(4)) [34], ToughMet® 3 ((5)-(8)) [35], Stellite® 6B ((9)-(12)) [36] and Cr2O3 film ((13)-(16)) [36].
At the early stage of immersion, oxidation occurs, causing the metal solid to transform into metal ions (Mn+), where M represents Ni, Cu, Co, or Cr, and n+ is the oxidation state of the reaction (equations (1), (5), (9) and (13). This oxidation is supported by a cathodic reaction (equations (2), (6), (10) and (14)) resulting in the formation of hydroxide ions (OH−) (equations (3), (7), (11) and (15). The metal ions then react with the solution to form metal hydroxides M(OH)n, which further dissociate to form metal oxides (MO) (equations (4), (8), (12) and (16). Apart from ToughMet® 3, Hastelloy® G30 and Stellite® 6B may form Cr2O3 films due to the high content of Cr in their compositions.
The passivation behaviour results showed that the Hastelloy® G30 and Stellite® 6B alloys were more stable than the ToughMet® 3 alloy at all pH values due to a thin oxide film formed on their surfaces, lowering the corrosion rate [6,33]. The corrosion rates of all samples, except for Stellite® 6B, were higher at pH 1 compared to pHs 3 and 6 (Figure 7), attributed to the higher chloride content in the solution [1], which has the potential to degrade the passivity.
The corrosion behaviour of the Stellite® 6B alloy was different, showing the lowest corrosion rate at pH 3, followed by pH 1 and pH 6. This indicates that a stable passive film could be formed on Stellite 6B at pH 3 and 1 compared to pH 6, where the passive film was less effective [1,37]. The Stellite® 6B alloy exhibited both general and intergranular corrosion, evident from the presence of corrosion products and surface cracks (Figure 4 e and f).
Figure 4 e and f also show that the grain boundaries were more susceptible to corrosion [38]. Smolenska [39] found that carbides decomposed during sulphidation and within a cobalt-based clad layer, leading to severe corrosion along grain boundaries. However, this occurred at higher temperatures (800°C) and under sulphur partial pressures (10-8 and 10-10 atm) compared to the conditions in this investigation. The carbides served as anodes to the matrix and were preferentially attacked [40,41]. Stellite® 6B has 1.0 wt% C (Table 1) making it possible for the formation of Cr3C2, confirmed by XRD (Figure 2).
Figure 7.
Corrosion rates of Hastelloy® G30, ToughMet® 3 and Stellite® 6B hard alloys in synthetic mine water at different pH levels.
Figure 7.
Corrosion rates of Hastelloy® G30, ToughMet® 3 and Stellite® 6B hard alloys in synthetic mine water at different pH levels.
At high pH levels, it is probable that protective films formed (Figure 6), hindering the diffusion of hydrogen ions. In contrast, lower pH levels led to the disruption of these films due to hydrogen evolution, thereby exposing the metal to the surrounding solution. This exposure heightened oxygen depolarisation and hydrogen evolution, consequently elevating corrosion rates [42]. Additionally, the presence of increased chloride and sulphate ions in the solution further augmented the corrosion rate. These ions are known to degrade passive layers (as depicted around ~750 mV in Figure 6, and accelerate corrosion and expedite corrosion [43].
The wide range of spontaneous passivation behaviour (ranging from -150 mV to 750 mV) observed at pH 3, except for ToughMet® 3, was linked to the development of protective thin films consisting of Cr2O3 on the surface under low pH conditions [25,44,45,46]. This behaviour exhibited greater stability at pH 1 (ranging from approximately 150 mV to 900 mV), with pitting potentials falling between 670 mV and 900 mV, as evidenced by deep pits observed through SEM analysis (Figure 4).
The corrosion mechanisms differed notably between Hastelloy® G30 and Stellite® 6B hard alloys compared to ToughMet® 3. However, the corrosion rates of Hastelloy® G30 were considerably lower than those of Stellite® 6B (Table 4 and Figure 7) at pH 6 and 3, but higher at pH 1. However, Hastelloy® G30 was susceptible to pitting corrosion (Figure 4) and was less hard (Figure 2). On the other hand, Stellite® 6B displayed superior hardness and corrosion rates, making it a promising alternative to mild steel in various industrial applications, including slurry pump components such as casings, sleeves, and valves [1,16,47].
The limitation of this study was the lack of investigation into the corrosion behaviour of Ni-, Cu-, and Co-based alloys in real mine water environments, which could have offered valuable insights into actual corrosion mechanisms. Therefore, for future research, it is recommended to conduct tests using these alloys in real mine water conditions to ensure the applicability of findings to practical mining environments.
5. Conclusions
This study aimed to perform a systematic investigation and comparison on the corrosion behaviour of Hastelloy® G30, ToughMet® 3 and Stellite® 6B hard alloys in attempt to replace corroding mild steel pump components in corrosive mine water environment. The microstructural, hardness and corrosion behaviour of these alloys were studied, and the following important conclusions were made:
- Hastelloy® G30 composed of irregular and equiaxed shape γ-Ni grains with twinning and Cr3C2, ToughMet® 3 showed large and irregular grains, while Stellite® 6B consisted of γ-Co grains with twinning and large Cr3C2 precipitated at the grain boundaries.
- The presence of twins and Cr3C2 phases in the Hastelloy® G30 and Stellite® 6B alloys determine their hardness levels.
- Hastelloy® G30 and Stellite® 6B alloys displayed active-passive transition behaviours due to their ability to form protective thin films, and exhibited pitting and intergranular corrosion, while ToughMet® 3 experienced pseudo-passivation behaviour, pitting and selective corrosion in synthetic mine water at all pH values.
- The Stellite® 6B alloy experienced the lowest corrosion at pH 3 (1.32±0.34 µm/y), and then pH 1 (5.61±1.13 µm/y) and pH 6 (5.81±0.33 µm/y). It also had the highest hardness as ToughMet® 3 (368±13 HV2) than the Hastelloy® G30 (180±10 HV2) alloy.
- Stellite® 6B emerges as the optimal alloy to substitute mild steel in industrial applications, particularly in components for slurry pumps like casings, sleeves, and valves, where both corrosion resistance and hardness are to be considered.
Author Contributions
Conceptualization, S.I.H., L.A.C. and F.P.L.K; methodology, S.I.H.; validation, L.A., J.W.M., and F.P.L.K; formal analysis, S.I.H., L.A.C.; J.W.M, F.P.L.K and L.H.C; investigation, S.I.H., L.A.C., J.W.M. and F.P.L.K; resources, S.I.H. and J.W.M.; data curation, S.I.H., L.A.C. and J.W.M.; writing—original draft preparation, S.I.H. and L.A.C.; writing—review and editing, S.I.H., L.A.C.; J.W.M, F.P.L.K, and L.H.C.; supervision, L.A.C.; J.W.M, F.P.L.K and L.H.C. All authors have read and agreed to the published version of the manuscript.
Funding
This research received no external funding.
Institutional Review Board Statement
Not applicable
Informed Consent Statement
Not applicable.
Data Availability Statement
Data are contained within the article.
Acknowledgments
The authors wish to acknowledge the financial support received from the African Materials Science and Engineering Network (A Carnegie-IAS RISE network), as well as Multi Alloys, Midrand, South Africa, for the supply of the Hastelloy® G30, ToughMet® 3 and Stellite® 6B hard alloys and Mintek, Randburg, South Africa for corrosion experiments.
Conflicts of Interest
The authors declare no conflicts of interest.
References
- Hango, S.I.; Cornish, L.A.; van der Merwe, J.W.; Chown, L.H.; Kavishe, F.P.L. Corrosion Behaviour of Cobalt-Based Coatings with Ruthenium Additions in Synthetic Mine Water. Results Mater. 2024, 21, 100546. [Google Scholar] [CrossRef]
- Weatherly International, Central Operations Executive Summary. Available online: https://weatherlyplc.com/wp-content/uploads/2013/07/WI-Central-Ops-Exec-Sum_v2-17-06-13.pdf (accessed on 21 March 2024).
- Li, H.; Oraby, E.; Eksteen, J. Extraction of Precious Metals from Waste Printed Circuit Boards Using Cyanide-Free Alkaline Glycine Solution in the Presence of an Oxidant. Miner. Eng. 2022, 181, 107501. [Google Scholar] [CrossRef]
- Pitiya, R.; Jacob, L.; Emilinot, R.J. A Pilot Study on the Concentration of Heavy Metals in Sediments from the Lower Orange River, //Karas Region, Namibia. J. Mater. Sci. Chem. Eng. 2022, 10, 1–14. [Google Scholar] [CrossRef]
- Haynes International, HASTELLOY® G-30 Alloy: Principal Features. Available online: https://www.haynesintl.com/alloys/alloy-portfolio_/Corrosion-resistant-Alloys/HASTELLOY-G-30-alloy (accessed on 21 March 2024).
- Guo, C.; Shi, S.; Dai, H.; Yu, J.; Chen, X. Corrosion Mechanisms of Nickel-Based Alloys in Chloride-Containing Hydrofluoric Acid Solution. Eng. Fail. Anal. 2022, 140, 106580. [Google Scholar] [CrossRef]
- Chen, L.; Bai, S.L.; Ge, Y.Y.; Wang, Q.Y. Erosion-corrosion Behavior and Electrochemical Performance of Hastelloy C22 Coatings Under Impingement. Appl. Surf. Sci. 2018, 456, 985–998. [Google Scholar] [CrossRef]
- Wang, Q.Y.; Zhang, X.S.; Zheng, H.B.; Liu, T.Y.; Dong, L.J.; Zhang, J.; Xi, Y.C.; Zeng, D.Z.; Lin, Y.H.; Luo, H. Intergranular Corrosion Mechanism of Sub-Grain in Laser Additive Manufactured Hastelloy C22 Induced by Heat Treatment. Appl. Surf. Sci. 2023, 608, 155140. [Google Scholar] [CrossRef]
- Guo, S.; Xu, D.; Jiang, G.; Kuang, W. Corrosion Behavior and Mechanism of Ni-Based Alloys Hastelloy C2000 and Inconel 740 in Chloride-Containing Supercritical Water Oxidation. J. Alloys Compd. 2022, 907, 164452. [Google Scholar] [CrossRef]
- Tang, X.; Wang, S.; Qian, L.; Li, Y.; Lin, Z.; Xu, D.; Zhang, W. Corrosion Behavior of Nickel Base Alloys, Stainless Steel and Titanium Alloy in Supercritical Water Containing Chloride, Phosphate and Oxygen, Chem. Eng. Res. Des. 2015, 100, 530–541. [Google Scholar] [CrossRef]
- Materion, Brush Peformance Alloys: Problematic Bearing Applications. 2020. Available online: https://multialloys.co.za/wp-content/uploads/2018/11/toughmet-brochure.pdf (accessed on 27 June 2020).
- Loto, R.T. Correlative Investigation of the Corrosion Susceptibility of C70600 and C26000 Copper Based Alloys for Application in Seawater Environment. Mater. Today Proc. 2022, 65, 2151–2155. [Google Scholar] [CrossRef]
- Yu, Q.X.; Li, X.N.; Wei, K.R.; Li, Z.M.; Zheng, Y.H.; Li, N.J.; Cheng, X.T.; Wang, C.Y.; Wang, Q.; Dong, C. Cu–Ni–Sn–Si Alloys Designed by Cluster-Plus-Glue-Atom Model. Mater. Des. 2019, 167, 107641. [Google Scholar] [CrossRef]
- Lu, J.C.; Wang, Z.B.; Hu, H.X.; Zheng, Y.G. Understanding Localized Corrosion Mechanism of 90/10 Copper-Nickel Alloy in Flowing NaCl Solution Induced by Partial Coverage of Corrosion Products Films. Corros. Sci. 2024, 227, 111716. [Google Scholar] [CrossRef]
- Hamidah, I.; Solehudin, A.; Hamdani, A.; Hasanah, L.; Khairurrijal, K.; Kurniawan, T.; Mamat, R.; Maryanti, R.; Nandiyanto, A.B.D.; Hammouti, B. Corrosion of Copper Alloys in KOH, NaOH, NaCl, and HCl ELectrolyte Solutions and its Impact to the Mechanical Properties. Alex. Eng. J. 2021, 60, 2235–2243. [Google Scholar] [CrossRef]
- Prabhakaran, D.; Jegadeeswaran, N.; Somasundaram, B.; Raju, B.S. Corrosion Resistance by HVOF Coating on Gas Turbine Materials of Cobalt Based Superalloy. Mater. Today Proc. 2020, 20, 173–176. [Google Scholar] [CrossRef]
- Hango, S.I.; Cornish, L.A.; Chown, L.H.; van der Merwe, J.W.; Kavishe, F.P.L. Sliding Wear Resistance of the Co-balt-Based Coatings, ULTIMETTM and STELLITETM 6 with Ruthenium Additions. Eng. Fail. Anal. 2024, 155, 107717. [Google Scholar] [CrossRef]
- Mace, A.; Khullar, P.; Bouknight, C.; Gilbert, J.L. Corrosion properties of Low Carbon CoCrMo and Additively Manufactured CoCr Alloys for Dental Applications. Dent. Mater. 2022, 38, 1184–1193. [Google Scholar] [CrossRef]
- Wu, Y.; Schmitt, T.; Bousser, E.; Vernhes, L.; Khelfaoui, F.; Perez, G.; Klemberg-Sapieha, J.E.; Brochu, M. Microstructural and Mechanical Characterization of Stellite-Hardfaced Coatings with Two Types of Buffer Layers. Surf. Coat. Technol. 2020, 390, 125611. [Google Scholar] [CrossRef]
- Garcia-Falcon, C.M.; Gil-Lopez, T.; Verdu-Vazquez, A.; Mirza-Rosca, J.C. Electrochemical characterization of some cobalt base alloys in Ringer solution. Mater. Chem. Phys. 2021, 260, 124164. [Google Scholar] [CrossRef]
- Muangtong, P.; Rodchanarowan, A.; Chaysuwan, D.; Chanlek, N.; Goodall, R. The corrosion behaviour of CoCrFeNi-x (x = Cu, Al, Sn) high entropy alloy systems in chloride solution. Corros. Sci. 2020, 172, 108740. [Google Scholar] [CrossRef]
- Kennametal Stellite, Wrought Wear-Resistant Alloy. Available online: https://www.stellite.com/us/en/products/stellite-6b.html (accessed on 20 December 2020).
- Hango, S.I. Failure of Pump Systems Operating in Highly Corrosive Mine Water at Otjihase Mine, PhD Thesis, Uni-versity of the Witwatersrand, Johannesburg, South Africa, 2018. Available online: http://wiredspace.wits.ac.za/handle/10539/25666.
- Al-Qawabah, S.; Mostafa, A.; Al-Rawajfeh, A.; Al-Qawabeha, U. Effect of Heat Treatment on the Grain Size, Microhardness and Corrosion Behavior of the Cold-Working Tool Steels Aisi D2 and Aisi O1. Mater. Tehnol. 2020, 54, 785–790. [Google Scholar] [CrossRef]
- Zhang, Y.; Zhang, X.; Chen, S.; Liu, J.; Li, T.; Wang, L.; Wu, K. Corrosion Behavior and Passive Film Properties of Nickel-Based Alloy in Phosphoric Acid, Corros. Commun. 2023, 9, 77–88. [Google Scholar] [CrossRef]
- Qin, P.; Chen, L.Y.; Liu, Y.J.; Zhao, C.H.Y.; Lu, J.; Sun, H.; Zhang, L.C. Corrosion Behavior and Mechanism of Laser Powder Bed Fusion Produced Cocrw in an Acidic NaCl Solution. Corros. Sci. 2023, 213, 110999. [Google Scholar] [CrossRef]
- Bozzi, A.C.; Ramos, F.D.; Vargas, D.B.O. Microabrasive Wear Behavior of Different Stellites Obtained by Laser Cladding and Casting Processes. Wear 2023, 524–525, 204857. [Google Scholar] [CrossRef]
- Ahmed, R.; de Villiers Lovelock, H.L.; Davies, S. Sliding wear of Blended Cobalt Based Alloys. Wear 2021, 466–467, 203533. [Google Scholar] [CrossRef]
- Krell, J.; Röttger, A.; Theisen, W. Comprehensive Investigation of the Microstructure-Property Relationship of Differently Manufactured Co–Cr–C Alloys at Room and Elevated Temperature. Wear 2020, 444–445, 203138. [Google Scholar] [CrossRef]
- An, X.; Li, Y.; Ni, S.; Wang, Z.; Song, M. Microstructural and Hardness Evolutions of a Cold-Rolled Cobalt. Mater. Sci. Eng. : A 2021, 803, 1–9. [Google Scholar] [CrossRef]
- Kevin, P.S.; Tiwari, A.; Seman, S.; Mohamed, S.A.B.; Jayaganthan, R. Erosion-Corrosion Protection due to Cr3C2-NiCr Cermet Coating on Stainless Steel. Coatings 2020, 10, 1042. [Google Scholar] [CrossRef]
- Jia, L.; Cui, H.; Yang, S.; Lv, S.; Xie, X.; Qu, J. Effect of Carbon Addition on Microstructure and Mechanical Properties of a Typical Hard-to-Deform Ni-Base Superalloy. Prog. Nat. Sci. Mater. Int. 2023, 33, 232–243. [Google Scholar] [CrossRef]
- Sedlaček, M.; Zupančič, K.; Šetina Batič, B.; Kosec, B.; Zorc, M.; Nagode, A. Influence of Precipitation Hardening on the Mechanical Properties of Co-Cr-Mo and Co-Cr-W-Mo Dental Alloys. Metals 2023, 13, 637. [Google Scholar] [CrossRef]
- Jeyaprakash, N.; Yang, C.H.; Karuppasamy, S.S.; Duraiselvam, M. Stellite 6 Cladding on AISI Type 316L Stainless Steel: Microstructure, Nanohardness and Corrosion Resistance. Trans. Indian Inst. Met. 2023, 76, 491–503. [Google Scholar] [CrossRef]
- Su, Y. Li, L., Yin, W., Chu, C., and Guan, Y. Investigation of Corrosion Behavior and Film Formation on 90Cu-10Ni Alloys Immersed in Simulated Seawater. Int. J. Electrochem. Sci. 2023, 18, 100244. [Google Scholar] [CrossRef]
- Jeyaprakash, N.; Yang, C.H.; Karuppasamy, S.S.; Dhineshkumar, S.R. Evaluation of Microstructure, Nanoindentation and Corrosion Behavior of Laser Cladded Stellite-6 Alloy on Inconel-625 Substrate. Mater. Today Commun. 2022, 31, 103370. [Google Scholar] [CrossRef]
- Long, Y.; Jiang, W.; Chen, G.; Luo, J.; Fan, Y.; Jin, Q.; Xie, J.; Feng, Y.; Xie, J. Study on Corrosion Behavior of 13Cr Gate Valve Using Weld Deposited Gate and Seat in Well Operation Environments. Eng. Fail. Anal. 2023, 148, 107198. [Google Scholar] [CrossRef]
- Zhang, X.; Li, Y.; Tang, N.; Onodera, E.; Chiba, A. Corrosion behaviour of CoCrMo alloys in 2 wt% sulphuric acid solution. Electrochim. Acta 2014, 125, 543–555. [Google Scholar] [CrossRef]
- Smolenska, H. Cobalt Base Clad Layer Resistance on the Corrosion Under Low Sulfur Pressure. Solid State Phenom. 2010, 165, 173–176. [Google Scholar] [CrossRef]
- Marimuthu, V.; Kannoorpatti, K. Corrosion Behaviour of High Chromium White Iron Hardfacing Alloys in Acidic and Neutral Solutions. J. Bio-Tribo-Corros. 2016, 2, 1–12. [Google Scholar] [CrossRef]
- Handoko, W.; Anurag, A.; Pahlevani, F.; Hossain, R.; Privat, K.; Sahajwalla, V. Effect of selective-precipitations process on the corrosion resistance and hardness of dual-phase high-carbon steel. Sci. Rep. 2019, 9, 1–11. [Google Scholar] [CrossRef]
- Ahmed, M.; Talib, N.; Al-Gebory, L. Investigation of Corrosion Behavior of Carbon Steel for Petroleum Pipeline Applications Under Turbulent Flow Conditions. J. Inf. Sci. Eng. 2020, 36, 217–229. [Google Scholar] [CrossRef]
- Cui, Y.; Qin, Y.; Dilimulati, D.; Wang, Y. The Effect of Chlorine Ion on Metal Corrosion Behavior under the Scratch Defect of Coating. Int. J. Corros. 2019, 2019, 1–11. [Google Scholar] [CrossRef]
- Guo, S.; Xu, D.; Li, Y.; Guo, Y.; Wang, S.; Macdonald, D.D. Corrosion Characteristics and Mechanisms of Typical Ni-Based Corrosion-Resistant Alloys in Sub- and Supercritical Water. J. Supercrit. Fluids 2021, 170, 105138. [Google Scholar] [CrossRef]
- Zheng, C.; Liu, Z.; Liu, Q.; Li, Y.; Liu, C. Comparative Investigation on Corrosion Behavior of Laser Cladding C22 Coating, Hastelloy C22 Alloy and Ti–6Al–4V Alloy In Simulated Desulfurized Flue Gas Condensates. J. Mater. Res. Technol. 2020, 18, 2194–2207. [Google Scholar] [CrossRef]
- Li, W.; Cao, R.; Xu, L.; Qiao, L. The Role of Hydrogen in the Corrosion and Cracking of Steels - A Review. Corros. Commun. 2021, 4, 23–32. [Google Scholar] [CrossRef]
- Que, Z.; Ahonen, M.; Virkkunen, I.; Nevasmaa, P.; Rautala, P. Study of Cracking and Microstructure in Co-Free Valve Seat Hardfacing. Nucl. Mater. Energy 2022, 31, 101202. [Google Scholar] [CrossRef]
Disclaimer/Publisher’s Note: The statements, opinions and data contained in all publications are solely those of the individual author(s) and contributor(s) and not of MDPI and/or the editor(s). MDPI and/or the editor(s) disclaim responsibility for any injury to people or property resulting from any ideas, methods, instructions or products referred to in the content. |
© 2024 by the authors. Licensee MDPI, Basel, Switzerland. This article is an open access article distributed under the terms and conditions of the Creative Commons Attribution (CC BY) license (http://creativecommons.org/licenses/by/4.0/).
Copyright: This open access article is published under a Creative Commons CC BY 4.0 license, which permit the free download, distribution, and reuse, provided that the author and preprint are cited in any reuse.


