
Submitted:
05 December 2024
Posted:
06 December 2024
You are already at the latest version
Abstract
Mine tailings are a byproduct of mineral extraction and often pose an environmental challenge due to the contamination of soil and water bodies with dissolved metals. However, this type of waste offers the opportunity for the recovery of valuable metals such as silver (Ag). In the present investigation, an integral analysis of a sample of tailings was carried out, addressing its granulometry, elemental composition, neutralization potential (NP) and acid potential (AP), as well as its mineralogy; for the dissolution of silver from this type of waste. For this purpose, thiourea (CH₄N₂S) was used as a leaching agent due to its low toxicity and potassium oxalate (K₂C₂O₄) as an organic additive to improve the leaching of the silver phases (argentite and polybasite) present in the tailings. The effects of CH₄N₂S and K₂C₂O₄ concentrations, temperature, and pH on the leaching efficiency of silver (Ag), copper (Cu), iron (Fe), and arsenic (As) were systematically studied. The results revealed that the maximum silver dissolution rate reached 90.75% under optimal conditions: 0.2 M L⁻¹ of thiourea, 0.2 M L⁻¹ of potassium oxalate, at 35°C and a pH of 2.
Keywords:
Thiourea-oxalate system leaching
; Mineral tailings
; Argentite
; Polybasite and arsenopyrite
1. Introduction
Tailings are mining residues originating from the ore beneficiation process, where valuable minerals were extracted, leaving behind mineral phases such as iron sulfides, silicates, silica, and minerals containing toxic metals, which are of low economic value [1]. Unfortunately, this type of waste had no environmental regulation during its open-pit disposal, leaving it exposed to weathering factors and microbial activity (e.g., the presence of Thiobacillus ferrooxidans). This exposure results in the oxidation of sulfide-type mineral phases (mainly pyrite) leading to the generation of acid (H+) and, as a consequence, the dissolution of heavy metals that accompany the mineral phases of low economic value. The leachates obtained directly contaminate soil and water [2,3,4,5,6,7].
Based on the above, in this type of waste, it is important to evaluate the acid-base balance, concentration of toxic metals, as well as to propose alternatives that help to totally or partially reduce future acid generation. And due to the content of metallic values of commercial interest (copper, lead, zinc, gold and silver) use these wastes as raw material in hydrometallurgical processes for the dissolution of metals of interest.
This implies a thorough characterization to help identify the mineral phases that provide the metal of interest, analyze the degree of liberation since the metals of interest such as gold and silver can be found in carbonaceous, argillaceous, arsenosulfide, sulfide, sulfide, sulfosalt and refractory mineral matrices [8,9,10,11,12], necessitating pretreatments such as intensive grinding, roasting, autoclave oxidation, or bioleaching [13,14]. However, these processes often increase operational costs, limiting their economic feasibility.
On the other hand, it is well known that cyanidation is the most widely used process for the recovery of metals such as gold and silver. However, the environmental problems caused by cyanidation have encouraged the search for new leachants to replace sodium cyanide. Proposed alternatives include chlorides [15], thiosulfate (S₂O₃²⁻) [16], thiocyanate (SCN⁻) [17], and thiourea (TU, CS(NH₂)₂) [18]. Similarly, oxidants such as manganese dioxide (MnO₂), monopersulfate compounds (HSO₅), ozone, hydrogen peroxide (H₂O₂), and ferric ion (Fe³⁺) have been studied, the latter being the most commonly used in TU leaching (Eq. 1) [19,20,21,22].
Acid thioureation (TU in acid medium) has proven to be the most attractive alternative for the treatment of silver ores [23] due to its high efficiency and low environmental toxicity [20,24,25]. The use of TU involves the formation of formamidine disulfide (FDS, (NH₂)₂CSSC(NH₂)₂²⁺) (Eq. 2) [26], which acts as an oxidant in the presence of dissolved oxygen. However, FDS is unstable and decomposes into TU, cyanamide (CH₂N₂), and elemental sulfur (S⁰) (Eq. 3) [27,28]. The formation of S⁰ is undesirable because it causes mineral surface passivation, which decreases the leaching efficiency of valuable metals [26,29,30].
According to the study by D. Calla et al. (2016, 2019), TU oxidation is potentiated by an increase in the redox potential (about 0.5 V vs SHE) caused by the dissolved iron (Fe³⁺) and copper (Cu²⁺) themselves. Moreover, the ferric ion alone promotes the oxidation of TU (Eq. 4), negatively affecting silver leaching [19,31]:
Another negative aspect of the use of thiourea is the ease of forming complexes as metal ions (Eq. 5 to 7) which implies adding additional TU so as not to mismatch the TU needed in the complex with silver.
In attention to the problems of TU oxidation Chandra et al. (2005) and D. Calla et al. (2020, 2021) have implemented the use of the organic ligand oxalate (Ox, C₂O₄²⁻) as a way to decrease the activity of copper and iron ions (Eq. 8 to 11) thus allowing the availability of thiourea for silver dissolution [32,33,34].
Based on the aforementioned issues, this research conducted a characterization and leaching study of mine tailings to evaluate their use as a value-added raw material for silver leaching in a Thiourea-Oxalate medium. Consequently, the study examines the acid drainage potential through acid-base balance assessments, silver (Ag), copper (Cu), iron (Fe), and arsenic (As) leaching profiles as a function of TU and Ox concentrations, as well as the direct influence of pH and temperature on this leaching process.
2. Materials and Methods
2.1. Chemical and Mineralogical Characterization
The tailings sample used in this study was provided by the mining company 'El Espiritu', which is located in the mining district of Zimapan, Hidalgo, Mexico [35]. From the total sample, a quartering process was performed to obtain five kilograms of a representative sample. Subsequently, particle size analysis was conducted using Tyler series sieves, following the methodology outlined by [36].
Each retained fraction was processed through digestion. For this purpose, one gram of each fraction was weighed separately and mixed with 20 mL of aqua regia (HCl and HNO₃ in a 3:1 ratio) for 60 minutes. The digestion solutions, along with the samples from the leaching experiments, were analyzed using Inductively Coupled Plasma Optical Emission Spectroscopy (ICP-OES) with a Perkin Elmer Model 8300 instrument.
The neutralization potential (NP) was determined using the modified acid-base accounting test (PM-ABA) established in the standard [37] and suggested by A. Ruiz-Sánchez [5]. For the determination of NP, one gram of the representative sample was placed on a watch glass, and 0.25 mL of 25% v/v HCl was added to observe its degree of effervescence (caused by the reaction of calcium carbonate with HCl), which was categorized as none, low, moderate, or strong.
Next, 2 grams of the sample were placed in a 250 mL Erlenmeyer flask containing 90 mL of distilled water, and magnetic stirring was set at a speed of 400 rpm. Based on the recorded effervescence level, volumes of 1 N HCl were added at the times indicated in Table 1. After 22 hours of stirring, the pH was measured. If the pH was greater than 2.5, additional HCl was added until a pH value of 2 was achieved. However, if the pH measured after 24 hours was less than 2, the measurement was repeated due to the possibility of excessive HCl addition at the beginning of the procedure. Finally, the titration was completed with 0.1 N sodium hydroxide (NaOH).
The NP value (g CaCO₃/kg) was calculated based on the stoichiometry of the reaction in Equation 12, which indicates a proportion of 1.37 g of CaCO₃ per gram of HCl consumed when neutralizing one kilogram of mine tailings.
The acid potential (AP) was determined based on studies conducted by Petersen, (1969), Edwards et al. (1982) and A. Ruiz-Sanchez et al. (2022) [5,38,39], which approximate AP using the pyrite content in mine tailings through acid digestion. First, 0.2 g of the representative sample was digested with aqua regia (HCl and HNO₃ in a 3:1 ratio). Subsequently, another 0.2 g of the representative sample was digested with hydrochloric acid (HCl) to remove all iron except that from pyrite. The difference in iron concentrations was attributed to the iron from pyrite.
Additionally, 0.2 g was digested with nitric acid (HNO₃) to dissolve all forms of iron, including pyrite and sulfur. According to the standard [40], the difference in readings between digestion with HNO₃ and HCl corresponds to pyrite content. The AP value (g CaCO₃/kg) was determined from the pyrite content and the stoichiometry of the reaction (Eq. 13), which indicates a ratio of 1.67 g CaCO₃ per gram of FeS₂ for every kilogram of mine tailings.
Characterization of the mine tailings sample was performed using X-ray Diffraction (XRD) with an EQUINOX 2000 X-ray diffractometer using Co-Kα1 radiation (1.789010 Å) at 30 mA, 20 kV, and 220 V. The powdered samples were embedded in epoxy resin to form a pellet, which was polished to a mirror finish and analyzed via Scanning Electron Microscopy with Energy Dispersive Spectroscopy (SEM-EDS) using a JEOL JSM-6610LV system. More details on sample characterization can be found in a preliminary study by Erick Muñoz et al. 2023 [41].
2.2. Leaching Tests
Leaching experiments were designed to evaluate the dissolution behavior of silver, copper, iron, and arsenic from the tailings under varying conditions.
The following analytical-grade reagents were used for the experiments: Thiourea (CH₄N₂S, 99%, Sigma-Aldrich), Potassium Oxalate (K₂C₂O₄, 99.5%, Analytyka), Sulfuric Acid (H₂SO₄, 98%, Jalmek), and Deionized Water (1 μS/cm).
Based on the granulometric and metal content analysis (section 3.1), mine tailings with a particle size (r₀) of -53 +37 μm were selected. Unless otherwise specified, all experiments lasted 60 minutes. The initial TU and Ox concentrations were based on prior research D. Calla et al. (2016, 2019, 2020, 2021), I. Chandra et al. (2005), Xue-yi Guo et al. 2020 and Erick Muñoz et al. 2022 [19,31,32,33,34,42,43,44]. Reference parameters were set as follows: [TU]= 0.2 M, [Ox]= 0.2 M, 10 g sample, pH= 2, T= 30°C, and stirring speed= 600 rpm.
The leaching experiments used a Thermo Scientific HP88857190 heating plate, equipped with a 0.5 L reactor and a stirring system integrated with an IKA EW 20 motor and a Teflon propeller. The pH and temperature values were recorded using a pH/ATC electrode connected to a Thermo Scientific Orion potentiometer.
The pH value (1, 1.5, or 2) was adjusted in 0.5 L of the leaching solution (TU-Ox) before stirring was initiated at a constant speed of 600 rpm (determined in a prior study not included in this work). The temperature was set to 20, 30, or 35°C. Once the solution reached the target temperature, 20 g of mine tailings were added per liter of leaching solution. The moment the mineral was added was considered the start of the leaching process (t = 0 minutes). Every 10 minutes, approximately 10 mL of the leaching liquor was carefully sampled, filtered, and analyzed via ICP-OES to quantify the concentrations of Ag, Cu, Fe, and As.
Where CE is the concentration of the element measured by ICP-OES (mg/L) in the leaching reactor, V is the total volume of solution (L), x is the mass fraction of the metal (%), and M is the mass of tailings used during leaching (g).
3. Results and Discussion
3.1. Granulometric Analysis and Metal Content
Figure 1 illustrates the percentage of mine tailings retained on each sieve during the granulometric analysis. As shown, 29.62% of the sample has a particle size greater than 150 μm, while 25.87%, 15.77%, 13.85%, and 6.33% correspond to -150 +105 μm, -105 +74 μm, -74 +53 μm, and -53 +37 μm, respectively.
Additionally, due to the presence of fine particles smaller than 37 μm (approximately 8.5% of the total sample), it is recommended to securely confine this type of waste. These fine particles pose a risk of being transported by wind, potentially reaching humans through inhalation, which can lead to respiratory diseases such as silicosis [47].
The elemental composition for each particle size range is presented in Table 2. As observed, the silver and copper content tends to increase as the particle size decreases, suggesting that silver phases are more likely to be liberated in smaller particles. Conversely, the composition of Fe and As remains nearly identical for particles within the -150 +105 μm to -74 +53 μm size range, with the highest concentration observed in the 37 μm sieve fraction. These results suggest that Fe and As originate from the same mineral phase, most likely arsenopyrite (FeAsS), which is confirmed by SEM in Section 3.3.
The variation in the metal contents shown in Table 2 is evidence that mine tailings are heterogeneous, for this reason in the leaching tests it is necessary to consider an overall composition () as a reference to help calculate the leaching percentages. For this, equation (15) reported in the work of Ruiz-Sánchez et al. (2022) was used where n corresponds to each of the 6 particle sizes, is the percentage of mass retained in each fixed particle size n (Figure 1) present in the tailing, and represents the metallic composition for each particle size (Table 2), as a result an average concentration of 50 g/t, 1180 g/t, 77600 g/t and 5280 g/t was obtained for Ag, Cu, Fe and As, respectively.
Another important aspect about the particle size distribution and metallic composition (Table 3) is that about 72% and 52% of the total silver and copper are in particles smaller than 74 μm, so for a hydrometallurgical process of silver dissolution it is not necessary to perform an additional milling. Therefore, it is necessary to consider this type of waste as a value-added raw material to establish a complete hydrometallurgical process for silver dissolution.
Although the silver leaching process proposed in this study should ideally be conducted using the tailings sample as collected from the deposit site, it is evident that such processing complicates conversion calculations for the target metal. This is because the mass balance would require digesting the entire solid residue after each leaching experiment. Therefore, in the present study, only the -53 +37 μm fraction was selected, as it contains a nearly uniform silver concentration.
3.2. Neutralization Potential (NP) and Acid Potential (AP)
As a result of adding 0.25 mL of 25% v/v HCl for the NP calculation, a strong effervescence was observed, indicating a significant presence of alkaline species such as calcite (CaCO3) and microcline (Al1.03K0.986Na0.014Si2.97O8) identified in section 3.3. Accordingly, the neutralization potential was determined to be 116.5 g CaCO3/kg (Table 5). The pyrite content determined by chemical methods showed comparable results with a minimal difference of approximately 1%. This discrepancy could be attributed to the higher aggressiveness of aqua regia, which can dissolve a greater amount of iron, or to the heterogeneity of the sample. Nevertheless, it is important to note that the sample contains at least 8% pyrite, which resulted in a calculated acid potential of 140 g CaCO3/kg (Table 5).
The NP/AP ratio was 0.83 (Table 5). According to the standard [37], the tailings are classified as potential acid drainage generators. This highlights the importance of studying metal dissolution from this type of residue and suggests a way to utilize these residues as raw materials. Additionally, the addition of neutralizing agents such as CaCO3, Ca(OH)2, CaO, Al(OH)3, Na2CO3, or NaOH is recommended to mitigate their environmental impact and enhance their industrial reuse potential [48].

Table 4.
Pyrite content analysis in tailings using chemical methods.
| Iron content% | |||
| Aqua regia | HCL | Pyritic iron | Pyrite content (%) |
| 4.3 | 0.6 | 3.8 | 8.1 |
| HNO3 | HCL | Pyritic iron | Pyrite content (%) |
| 3.9 | 0.6 | 3.3 | 7.1 |
Table 5.
Neutralization potential and acid potential relationship.
| Parameter | Value |
|---|---|
| NP (g CaCO3 /kg) | 116.5 |
| AP (g CaCO3 /kg)* | 140 |
| Relación NP/AP | 0.83 |
| *Estimation considering 8.1% FeS2 obtained by chemical method. | |
3.3. X-Ray Diffraction Analysis (XRD) and Scanning Electron Microscopy Analysis (SEM)
Figure 2 presents the diffractogram of the tailings sample along with the corresponding mineral identification using Match 3 software. The peaks identified in the diffractogram correspond to calcite [(CaO3) (96-101-0963)] and microcline [(Al1.03K0.986Na0.014Si2.97O8) (96-900-5304)], pyrite [(FeS2) (96-901-0596)], sphalerite [(Zn0.66Fe0.34S) (96-101-1234)], argentite [(Ag2S) (96-101-1338)], and polybasite [(Ag31As0.203CuSb3.797S22) (96-901-3300)]. These results suggest that silver leaching may not be fully efficient since part of the silver is present in the form of polybasite, a sulfosalt that is difficult to oxidize [49]. Additionally, it is worth mentioning that the mineral phases identified in this study have also been reported in other research exploring similar tailings [50,51], albeit from a different area within the deposit.
The spot analyses using energy dispersive spectroscopy (EDS) confirmed the abundant presence of calcite (CaCO₃, Figure 3a) and feldspar (KAlSi₃O₈, Figure 3b), the latter associated with microcline. This characterization also identified mineral phases such as sphalerite (ZnS, Figure 4a) and arsenopyrite (FeAsS, Figure 4b). EDS analysis further confirmed the presence of pyrite (FeS₂, Figure 5a) and wüstite (FeO, Figure 5b) as iron-contributing mineral phases. Consequently, the presence of sulfides suggests that pyrite, sphalerite, and arsenopyrite may lead to acid drainage. This occurs because the exposure of these sulfides to moisture and an oxidizing agent, such as atmospheric air, promotes the generation of acid drainage (Equations 16 to 23) [52,53,54].
If sufficient Fe³⁺ ions are present at the deposition site, they act as an oxidizing agent [55], enabling the oxidation of other sulfides, such as sphalerite (Equation 24) [56]:
On the other hand, for the mineral phases contributing copper and silver, EDS analyses confirmed the presence of polybasite ((Ag,Cu)₁₆Sb₂S₁₁, Figure 6a) and a silver sulfide (argentite), both phases previously identified by XRD (Figure 6b). However, the micrographs reveal a natural association between polybasite and argentite, similar to that observed with other sulfides such as galena, pyrite, and arsenopyrite [57,58].
3.4. Thiourea Concentration
Figure 7a shows the percentage of silver leaching. As can be seen, the percentage of silver leaching increases with higher TU concentration. The maximum value of silver leaching at 60 min is 52.96%, 65.05%, and 82.40% for 0.03 M, 0.1 M, and 0.2 M, respectively. However, the results show that the presence of TU is important since in its absence (0 M TU) about 15% is leached.
A tentative explanation for the low percentage of silver leaching with only oxalate is due to the fact that Ag(I)-Ox complexes has lower stability (lower log K values) which means that the presence of Ox2- ligands do not promote the increase in solubility since the only oxidant in the medium is dissolved oxygen around 8 mg/L. Instead, the increase in silver leaching rates is due to the fact that Ag(I)-TU complexes are more stable (higher log K) compared to Ag(I)-Ox complexes as shown in Equations 25 to 27.
In addition, the presence of TU not only helps the stability of Ag(I)-TU complexes but also promotes the formation of formamidine disulfide ((CS(NH₂)₂)₂²⁺), as shown in reactions 28 and 29. The species CS(NH₂)₂)₂²⁺ being one more oxidizing species together with oxygen to promote the oxidation of silver, which in the case of Ag2S can be represented by the reactions.
As for copper (Figure 7b), it is observed that in the absence of TU the percentage of copper leaching was around 5.22% at 20 minutes. This percentage does not increase probably because in the leaching solution equilibrium is reached for the formation of copper oxalate as shown by the Pourbaix type diagram in Figure 8 and described by equation 32. The increase of at least 5% more in silver dissolution can be attributed to the formation of TU-Cu(II) complexes that promote the solubility of copper in the form of solid copper oxalate. While the increase in copper solubility from solid copper oxalate is not as significant due to the higher log K (Equation 33) for the Ox-Cu(II) complexes compared to the TU-Cu(II) complexes whose thermodynamic constants are shown in equations 34 to 37.
The analysis of iron (Figure 9a) and arsenic (Figure 9b) leaching shows similar behaviors, suggesting that the leaching process for these metals originates from the oxidation of arsenopyrite. This is deduced from the dissolution percentage ratios of Fe and As at 60 minutes in the presence of 0.2 M TU, with values of 19.44% and 25.68% (As/Fe ratio of 1.32), which is numerically close to the 1.34 ratio derived from the molecular weights of As and Fe in the arsenopyrite chemical formula.
On the other hand, the behavior during the first 20 minutes of Fe and As leaching percentages does not show a clear trend, possibly due to sample heterogeneity, the natural association of arsenopyrite with other mineral phases, or the occlusion of arsenopyrite within other mineral phases present in the tailings. However, it is evident that TU presence promotes arsenopyrite dissolution, as oxalate stabilizes thiourea, preventing its oxidation by arsenopyrite itself or by the Fe (III) resulting from arsenopyrite oxidation, as suggested by Ke Li et al. (2024) in their study on arsenopyrite oxidation using Fe (III) ions with thiourea. Based on Ke Li et al.’s work, the arsenopyrite leaching process can be described by reaction 38 [60].
3.5. Oxalate Concentration
To evaluate the impact of oxalate ion concentration on the leaching of Ag, Cu, Fe, and As, the TU concentration was fixed at 0.2 M, along with the parameters defined in the methodology (see Section 2.2: Leaching System). Figure 10a shows the silver percentages obtained with and without the presence of oxalate. In the absence of oxalate, the maximum silver dissolution percentage reached was 25.77%. However, it is evident that the presence of oxalate, ranging from 0.0012 M to 0.3 M L⁻¹, promotes an increase in silver leaching percentages up to 87.70%.
The benefit of using oxalate in silver leaching is that it prevents the decomposition of TU by arsenopyrite. In the absence of oxalate, as reported by Ke Li et al. (2024), arsenopyrite catalyzes the decomposition of thiourea into formamidine disulfide, an unstable species that easily decomposes. Consequently, TU is depleted, and the leaching process reaches equilibrium within 5 minutes [60].
In addition to the above analysis, it is also observed that the increase in the oxalate concentration from 0.2M to 0.3M does not significantly benefit the dissolution of silver in the form of Ag(CS(NH₂)₂)₃⁺. This is probably due to the fact that the Ag(I)-Tu complexes have a larger solubility window in potential and pH as shown in the Pourbaix diagram (Figure 11); which does not occur for the Ag(I)-Ox system where the formation of the Ag(Ox)⁺ complex (Figure 12) is at the limit of the maximum pH value in the experiments of this study.
According to Figure 11 and Figure 12, both TU and oxalate ions can form complexes with silver. This suggests a synergistic interaction that explains the improved leaching percentages within a shorter time frame. This complex interaction between silver, thiourea and oxalate suggests it has also been reported by Xiyun Yang et al. (2011) [61] when using thiourea with thiocyanate. For the above mentioned, it is considered that the best leaching conditions are the use of 0.2M of Tu and Ox, respectively.
The copper leaching profiles (Figure 10b) show that in the absence of oxalate ions, the maximum copper concentration (30.63%) is achieved, which simultaneously implies maximum dissolution of silver associated with copper, specifically from polybasite. Given that the Ag/Cu mass ratio in polybasite is approximately 1.64, it can be inferred that about 50% of the total leached silver (87.7%) originates from polybasite. Additionally, it is observed that increasing the oxalate concentration to 0.3 M results in a decrease in dissolved copper due to the formation of solid copper oxalate (Figure 8), as demonstrated by Ruiz-Sánchez et al. (2020) in the chalcopyrite leaching process using organic ligands [62].
Consequently, the competition between Cu ions and Ag ions for the formation of complexes with thiourea is reduced.
Figure 13a,b show leaching profiles for iron and arsenic with similar trends and relationships to the results in Figure 9, supporting the assertion that these metals in aqueous form originate from arsenopyrite oxidation. Interestingly, in the absence of oxalate, the dissolution of copper and iron follows an almost linear trend, suggesting rapid and preferential dissolution of arsenopyrite. This behavior indicates that, without oxalate ions, arsenopyrite catalyzes the decomposition of thiourea into formamidine disulfide, an unstable species that leads to cyanamide (CH₂N₂) and elemental sulfur (S⁰) [27]. Consequently, the silver phases present are not significantly oxidized, resulting in a silver recovery of only about 20% (Figure 10).
3.6. pH Effect
Figure 14a presents the silver leaching percentages as a function of the initial pH of the leaching solution. The results indicate that acidic pH levels enhance the dissolution of silver phases, achieving 88%, 87%, and 86% silver recovery within the first 5 minutes for pH values of 1, 1.5, and 2, respectively. This behavior is attributed to the precipitation of copper as copper oxalate (Figure 14b) on the surface of silver phases at pH = 1, which creates a transport resistance for reactants toward the reaction surface. This phenomenon is reflected in the slower increase in silver leaching profiles for pH = 1 and 1.5 during the first 5 minutes.
Iron (Figure 15a) and arsenic (Figure 15b) leaching experienced a notable increase as the pH decreased. For Fe, leaching percentages of 29.48% and 21.16% were observed at pH = 1 and 1.5, respectively. In the case of As, leaching percentages reached 27.23% and 17.55%. Lowering the pH triggers significant changes in species chemistry, favoring the formation of soluble species such as Fe(Ox)+, Fe(Ox)₂⁻ and Fe(Ox)₃³⁻, as illustrated in the species distribution diagram (Figure 16).
3.7. Temperature Effect
Figure 17a shows the silver leaching profiles as a function of temperature. The results indicate that increasing the temperature enhances the dissolution of silver phases. This effect suggests chemical reaction control, as raising the temperature from 20°C to 35°C allows for the recovery of 90% of the available silver. Additionally, it is observed that higher temperatures accelerate equilibrium attainment, requiring only 5 minutes of operation at 35°C. This effect implies that higher temperatures improve the dissolution kinetics of silver but simultaneously promote the rapid decomposition of thiourea, preventing the leaching of the remaining 10% of silver. In fact, regardless of the operating temperature, it was found that after 45 minutes, thiourea concentration had decreased by more than 70% from its initial value (0.2 M), which was already in excess relative to the stoichiometry of reactions 31 and 32.
4. Conclusions
- The TU-Ox system represents a suitable option for recovering precious metals present in tailings. This approach adds value to these residues, which are rich in sulfides and may potentially generate acid drainage in the future.
- The most critical variables for optimizing this process are the temperature and the concentrations of thiourea and oxalate.
- The TU-Ox system demonstrated improvements in the leaching process, particularly in the presence of arsenopyrite—a mineral phase that catalyzes the decomposition of thiourea.
- Oxalate helps stabilize thiourea, ensuring its availability to form complexes with silver. However, increasing oxalate concentration can lead to the formation of solid copper oxalate, which creates resistance to the transport of reagents and products.
- Higher temperatures enhance silver leaching, suggesting that the process is chemically controlled. However, elevated temperatures also accelerate thiourea decomposition.
Author Contributions
Research: Erick Muñoz, Martín Reyes, AM Teja-Ruiz, Jesús Martínez, Gabriel Flores, and Julio Juárez; Methodology: Mizraim U. Flores, Jesús Martínez, and Gabriel Flores; Resources: Martín Reyes and Ivan Reyes-Domínguez; Writing – original draft: Erick Muñoz and Norman Toro; Writing – review and editing: Ivan Reyes-Domínguez, AM Teja-Ruiz, and Julio Juárez.
Funding
This research did not receive external funding.
Acknowledgments
We thank the National Council for Humanities, Sciences and Technologies (CONAHCyT) for the scholarship awarded to E. J. Muñoz Hernández (No. CVU: 1077834), Autonomous University of the State of Hidalgo (UAEH) and Autonomous University of San Luis Potosí (UASLP) for the facilities to carry out the present project.
Conflicts of Interest
The authors declare no conflicts of interest.
Appendix A
Equilibrium constants (Log K) of the relevant redox reactions and complexes used in the MEDUSA program at 25°C, thiourea with Ag [63].
References
- G.R.Hancock, T.J. G.R.Hancock, T.J.Coulthard. Tailings dams: Assessing the long-term erosional stability of valley fill designs. Science of The Total Environment, November of 25, Volume 849. [CrossRef]
- Juan Lorenzo-Tallafigo, Nieves Iglesias-González, Aurora Romero-García, Alfonso Mazuelos, Pablo Ramírez del Amo, Rafael Romero, Francisco Carranza.. The reprocessing of hydrometallurgical sulphidic tailings by bioleaching: The extraction of metals and the use of biogenic liquors. Minerals Engineering, 2022, Volume 176. [CrossRef]
- Xin Hu, Hong Yang, Keyan Tan, Shitian Hou, Jingyi Cai, Xin Yuan, Qiuping Lan, Jinrong Cao, Siming Yan., Treatment and recovery of iron from acid mine drainage: a pilot-scale study. Journal of Environmental Chemical Engineering, 2022, Vols. Volume 10. [CrossRef]
- Jason Berberich, Tao Li, Endalkachew Sahle-Demessie. Biosensors for Monitoring Water Pollutants: A Case Study With Arsenic in Groundwater. Separation Science and Technology, 2019,Volume 11.
- Ruiz-Sanchez, Julio C. Juárez Tapia, G.T. Lapidus. Evaluation of acid mine drainage (AMD) from tailings and their valorization by copper recovery. 2022, Vol. 191. [CrossRef]
- Glen, T. Nwailaa, Yousef Ghorbanib, Steven Zhangc, Hartwig Frimmel, León CK Tolmay, Derek H. Rose, Phumzile C. Nwaila, Julie Bourdeauc. Valorisation of mine waste - Part I: Characteristics of, and sampling methodology for, consolidated mineralised tailings by using Witwatersrand gold mines (South Africa) as an example. 2021, Vol. 295. [CrossRef]
- Glen, T. Nwaila, Yousef Ghorban, Steven E. Zhang, Leon C.K. Tolmay, Derek H. Rose, Phumzile C. Nwaila, Julie E. Bourdeau, Hartwig E. Frimme. Valorisation of mine waste - Part II: Resource evaluation for consolidated and mineralised mine waste using the Central African Copperbelt as an example. 2021, Vol. 299. [CrossRef]
- Ömer Canıeren, Cengiz Karagüzel. Silver Metal Extraction from Refractory Silver Ore Using Chloride-Hypochlorite and Hydrochloric Acid Media Under High Pressure. Mining, Metallurgy & Exploration, 2021, Vol. 38. [CrossRef]
- Julio, C. Juárez Tapia, Francisco Patiño Cardona, Antonio Roca Vallmajor, Aislinn M. Teja Ruiz, Iván A. Reyes Domínguez, Martín Reyes Pérez, Miguel Pérez Labra and Mizraim U. Flores Guerrero. Determination of Dissolution Rates of Ag Contained in Metallurgical and Mining Residues in the S2O32−-O2-Cu2+ System: Kinetic Analysis. 2018, Vol. 8. [CrossRef]
- Margarita Merkulova, Olivier Mathon, Pieter Glatzel, Mauro Rovezzi, Valentina Batanova, Philippe Marion, Marie-Christine Boiron, and Alain Manceau*. Revealing the Chemical Form of “Invisible” Gold in Natural Arsenian Pyrite and Arsenopyrite with High Energy-Resolution X-ray Absorption Spectroscopy. ACS publications, 2019. [CrossRef]
- Denis Rogozhnikov, Kirill Karimov, Andrei Shoppert, Oleg Dizer, Stanislav Naboichenko. 105525. Kinetics and mechanism of arsenopyrite leaching in nitric acid solutions in the presence of pyrite and Fe(III) ions. Hydrometallurgy, February de 2021, Volume 199. [CrossRef]
- CELEP, İ. ALP, H. DEVECİ, M. VICIL. Characterization of refractory behaviour of complex gold/silver ore by diagnostic leaching. 2009, Pages 707-713. [CrossRef]
- Piervandi, Zeinab. Pretreatment of refractory gold minerals by ozonation before the cyanidation process: A review. 2023, Vol. 11. [CrossRef]
- Gonzalo Larrabure, Juan Carlos F. Rodríguez-Reyes. A review on the negative impact of different elements during cyanidation of gold and silver from refractory ores and strategies to optimize the leaching process. Minerals Engineering, 2021, Vol. 173. [CrossRef]
- Chang Lei, Bo Yan, Tao Chen, Xiao-Liang Wang, Xian-Ming Xiao. Silver leaching and recovery of valuable metals from magnetic tailings using chloride leaching. Journal of Cleaner Production, 2018, Vol. 181. [CrossRef]
- Eleazar Salinas-Rodríguez, Juan Hernández-Ávila, Isauro Rivera-Landero, Eduardo Cerecedo-Sáenz, Ma. Isabel Reyes-Valderrama, Manuel Correa-Cruz, Daniel Rubio-Mihi. Leaching of silver contained in mining tailings, using sodium thiosulfate: A kinetic study. Hydrometallurgy, 2016. [CrossRef]
- Gregory, J. Olson, Corale L. Brierley, Andrew P. Briggs, Ernesto Calmet. Biooxidation of thiocyanate-containing refractory gold tailings from Minacalpa, Peru. 2006, Vol. 81. [CrossRef]
- Muñoz-Hernandez, E. J. , Teja-Ruíz, A. M., Reyes-Pérez, M., Cobos-Murcia, J. Ángel, Reyes-Cruz, V. E., & Juárez-Tapia, J. C. Estudio preliminar de lixiviación de Polibasita: efecto de la temperatura. Pädi Boletín Científico De Ciencias Básicas E Ingenierías Del ICBI, 2023, Vol. 10. [CrossRef]
- Calla-Choque, D. , Nava-Alonso, F., & Fuentes-Aceituno, J. C. Acid decomposition and thiourea leaching of silver from hazardous jarosite residues: Effect of some cations on the stability of the thiourea system. Journal of Hazardous Materials, 2016. [CrossRef]
- Li Jing-ying, Xu Xiu-li, Liu Wen-quan. Thiourea leaching gold and silver from the printed circuit boards of waste mobile phones. 2012, Vol. 32. [CrossRef]
- WOODCOCK, GRAHAM J. SPARROW &JAMES T. Cyanide and Other Lixiviant Leaching Systems for Gold with Some Practical Applications. Mineral Processing and Extractive Metallurgy Review, 1995, Vol. 14. [CrossRef]
- Miller, Jinshan Li & Jan D. A REVIEW OF GOLD LEACHING IN ACID THIOUREA SOLUTIONS. Mineral Processing and Extractive Metallurgy, 2006, Vol. 27. [CrossRef]
- Prasad, M. S. , Mensah-Biney, R., & Pizarro, R. S. Modern trends in gold processing overview. Minerals Engineering, 1991. [CrossRef]
- Bandehzadeh Masoud1, Aryanimehr Amir, Rezai Bahram. Investigate of Effective Factors on Extraction of Silver from Tailings of Lead Flotation Plant Using Thiourea Leaching. Scientific Research Publishing, 2016. ISSN Online: 2331-4249. [CrossRef]
- Ahamed Ashiq, Janhavi Kulkarni, Meththika Vithanage. Electronic Waste Management and Treatment Technology. Editors: Majeti Narasimha Vara Prasad and Meththika Vithanage. Chapter 10 - Hydrometallurgical Recovery of Metals From E-waste. Butterworth-Heinemann, 2019. [CrossRef]
- BERG, PAUL W. PREISLER AND LOUIS. Oxidation-Reduction Potentials of Thiol-Dithio Systems: Thiourea-Formamidine Disulfide. Journal of the American Chemical Society, 1947. [CrossRef]
- J.D Miller, JLi and. [ed.] Gamini Senanayake. Reaction kinetics for gold dissolution in acid thiourea solution using formamidine disulfide as oxidant. Hydrometallurgy, 2002, Pages 215-223. [CrossRef]
- Aylmore. Chapter 27 - Alternative Lixiviants to Cyanide for Leaching Gold Ores. MG. Australia: Gold Ore Processing (Second Edition), 2016, Vols. Pages 447-484. [CrossRef]
- M. Elena Poisot-Díaz, Ignacio González, Gretchen T. Lapidus. Electrodeposition of a Silver-Gold Alloy (DORÉ) from Thiourea Solutions in the Presence of Other Metallic Ion Impurities. Hydrometallurgy, 2008, Vol. 93. [CrossRef]
- Marsden, J.O. House, C.I. The chemistry of gold extraction. SME, 2006. ISBN: 978-0-87335-240-6.
- Calla-Choque, D. , & Nava-Alonso, F. THIOUREA DETERMINATION FOR THE PRECIOUS METALS LEACHING PROCESS BY IODATE TITRATION. 2019. [CrossRef]
- Chandra, M.I. Jeffrey. A fundamental study of ferric oxalate for dissolving gold in thiosulfate solutions. Hydrometallurgy, 2005. [CrossRef]
- D.Calla-Choque, G.T. D.Calla-Choque, G.T.Lapidus and. [ed.] Gamini Senanayake. Acid decomposition and silver leaching with thiourea and oxalate from an industrial jarosite sample. Hydrometallurgy, 2020. [CrossRef]
- D. Calla-Choque, G.T. D. Calla-Choque, G.T. Lapidus. Jarosite dissolution kinetics in the presence of acidic thiourea and oxalate media. Hydrometallurgy, 21, Vol. 200. doi.org/10.1016/j.hydromet.2021.105565. 20 March.
- SGM. Panorama Minero del Estado de Hidalgo. Mexicano, Servicio Geológico. [En línea] 29 de Julio de 2021. [Citado el: 2022 de 08 de 11.] https://www.gob.mx/sgm/es/articulos/consulta-los-panoramas-mineros-estatales.
- Ángel Ruiz-Sánchez, Gretchen T. Lapidus. Study of chalcopyrite leaching from a copper concentrate with hydrogen peroxide in aqueous ethylene glycol media. Hydrometallurgy, 2017. [CrossRef]
- NOM-141-SEMARNAT-2003, Norma Oficial Mexicana. Norma Oficial Mexicana NOM-141-SEMARNAT-2003, Que establece el procedimiento para caracterizar los jales, así como las especificaciones y criterios para la caracterización y preparación del sitio, proyecto, construcción, operación y postoperación de presa. Diario Oficial de la Federación.
- Petersen, Leif. Chemical Determination of Pyrite in Soils. Acta Agriculturae Scandinavica, 1969. [CrossRef]
- Edwards, J.T. Patent and Trademark Office. No. 4,334,882. Washington, DC: U.S, 1982.
- NMX-B-021-1982, Norma Mexicana. Determinación de las formas de azufre en el carbón. Dirección General de Normas. Secretaría de Comercio y Fomento Industrial.
- Erick Jesús Muñoz Hernández, Aislinn Michelle Teja Ruiz, Martin Reyes Pérez, Gabriel Cisneros Flores, Miguel Pérez Labra, Francisco Raúl Barrientos Hernández & Julio Cesar Juárez Tapia. Leaching of Arsenopyrite Contained in Tailings Using the TU-OX System. Springer, 2023. [CrossRef]
- Xue-yi Guo, Lei Zhang, Qing-hua Tian, Hong Qin. Stepwise extraction of gold and silver from refractory gold concentrate calcine by thiourea. Hydrometallurgy, 2020. [CrossRef]
- Muñoz-Hernandez, E. J. , Teja-Ruíz, A. M., Reyes-Pérez, M., Reyes-Domínguez, I. A., Urbano-Reyes, G., & Juárez-Tapia, J. C. Lixiviación de Pb y Zn empleando el sistema Tiourea-EDTA. 2022, Vol. 10.
- Ke Li, Qian Li, Yongbin Yang, Bin Xu, Tao Jiang, Rui Xu.. The Role of Oxalate on Thiourea Leaching of Gold in the Presence of Jarosite. SSRN, 2022. [CrossRef]
- Prasetyo, E, et al. Monosodium Glutamate as Selective Lixiviant for Alkaline Leaching of Zinc and Copper from Electric Arc Furnace Dust. Metals, 2020. [CrossRef]
- Yukun Huang, Dasong Wang, Hongtu Liu, Guixia Fan, Weijun Peng, Yijun Cao. Selective complexation leaching of copper from copper smelting slag with the alkaline glycine solution: An effective recovery method of copper from secondary resource. Separation and Purificacion Technology, 2023, Vol. 326. [CrossRef]
- Andrew Churg MD, Nestor L. Muller MD. Update on Silicosis. Surgical Pathology Clinics, 2023. [CrossRef]
- Ilhwan Park, Carlito Baltazar Tabelin, Sanghee Jeon, Xinlong Li, Kensuke Seno, Mayumi Ito, Naoki Hiroyoshi. A review of recent strategies for acid mine drainage prevention and mine tailings recycling. Chemosphere, 2019. [CrossRef]
- Laura, J. Swinkels, Mathias Burisch, Constantin M. Rossberg, Marcus Oelze, Jens Gutzmer, Max Frenzel. Gold and silver deportment in sulfide ores – A case study of the Freiberg epithermal Ag-Pb-Zn district, Germany. 2021. [CrossRef]
- Moreno Tovar, Raúl, & Barbanson, Luc, & Coreño Alonso, Oscar. Neoformación mineralógica en residuos mineros (jales) del distrito minero Zimapán, estado de Hidalgo, México. Minería y Geología, 2009. ISSN: 0258-8959.
- Raúl MORENO TOVAR, Jesús TÉLLEZ HERNÁNDEZ y Marcos G. MONROY FERNÁNDEZ. Influencia de los minerales de los jales en la bioaccesibilidad de arsénico, plomo, zinc y cadmio en el distrito minero Zimapán, México. Revista internacional de contaminación ambiental, 2012. http://www.scielo.org.mx/scielo.php?script=sci_arttext&pid=S0188-49992012000300003&lng=es&tlng=es.. ISSN 0188-4999.
- C.L. Corkhill, D.J. C.L. Corkhill, D.J. Vaughan. Arsenopyrite oxidation – A review. Applied Geochemistry, 2009. [CrossRef]
- D.W. Blowes, C.J. D.W. Blowes, C.J. Ptacek, J.L. Jambor, C.G. Weisener, D. Paktunc, W.D. Gould, D.B. Johnson. 11.5 - The Geochemistry of Acid Mine Drainage. Treatise on Geochemistry, 2014.
- Nelson Belzile, Stephanie Maki, Yu-Wei Chen, Douglas Goldsack. Inhibition of pyrite oxidation by surface treatment. Science of The Total Environment, 1997. [CrossRef]
- Anssi Karppinen, Sipi Seisko, Mari Lundström. Atmospheric leaching of Ni, Co, Cu, and Zn from sulfide tailings using various oxidants. Minerals Engineering, 2024. [CrossRef]
- A.N. Buckley, H.J. A.N. Buckley, H.J. Wouterlood, R. Woods. The surface composition of natural sphalerites under oxidative leaching conditions. Hydrometallurgy, 1989. [CrossRef]
- S.K.Halda, Josip Tišljar. Chapter 1 - Rocks and Minerals. Introduction to mineralogy and petrology. Elsevier, 2014. [CrossRef]
- S.A. Kissin, H. S.A. Kissin, H. Mango. 13.16 - Silver Vein Deposits. Treatise on Geochemistry. Elsevier Science, 2014, Vol. 13.
- Puigdomenech, I. MEDUSA: make equilibrium diagrams using sophisticated algorithms. Inorganic chemistry, 2004.
- Ke Li, Qian Li, Yan Zhang, Xiaoliang Liu, Yongbin Yang, Tao Jiang. Thiourea leaching of gold: Elucidating the mechanism of arsenopyrite catalyzed thiourea oxidation by Fe3+ and the beneficial role of oxalate through experimental and density functional theory (DFT) investigations. Minerals Engineering, 2024. [CrossRef]
- Xiyun Yang, Michael S. Moats, Jan D. Miller, Xuming Wang, Xichang Shi, Hui Xu. Thiourea–thiocyanate leaching system for gold. Hydrometallurgy, 2011, Vol. 106. [CrossRef]
- Ruiz-Sánchez, I. Lázaro, G.T. Lapidus. Improvement effect of organic ligands on chalcopyrite leaching in the aqueous medium of sulfuric acid hydrogen peroxide-ethylene glycol. Hydrometallurgy, 2020, Volume 193. [CrossRef]
- M.E. Poisot-Diaz, I. M.E. Poisot-Diaz, I. Gonzalez, G.T. Lapidus. Electrodeposition of a silver-gold alloy (DORE) from thiourea solutions in the presence of other metallic ion impurities. Hydrometallurgy, 2008. [CrossRef]
- Martell, A. E. , Smith, R. M. Critical stability constants. Volume 6: Second supplement. Plenum press, 1974.
- Smith, R. M. , Martell, A. E.. Critical stability constants: volume 2: amines. Springer Science & Business Media, 1975.
Figure 1.
Percentage of mass retained from the tailings of the “El Espiritu” mine.
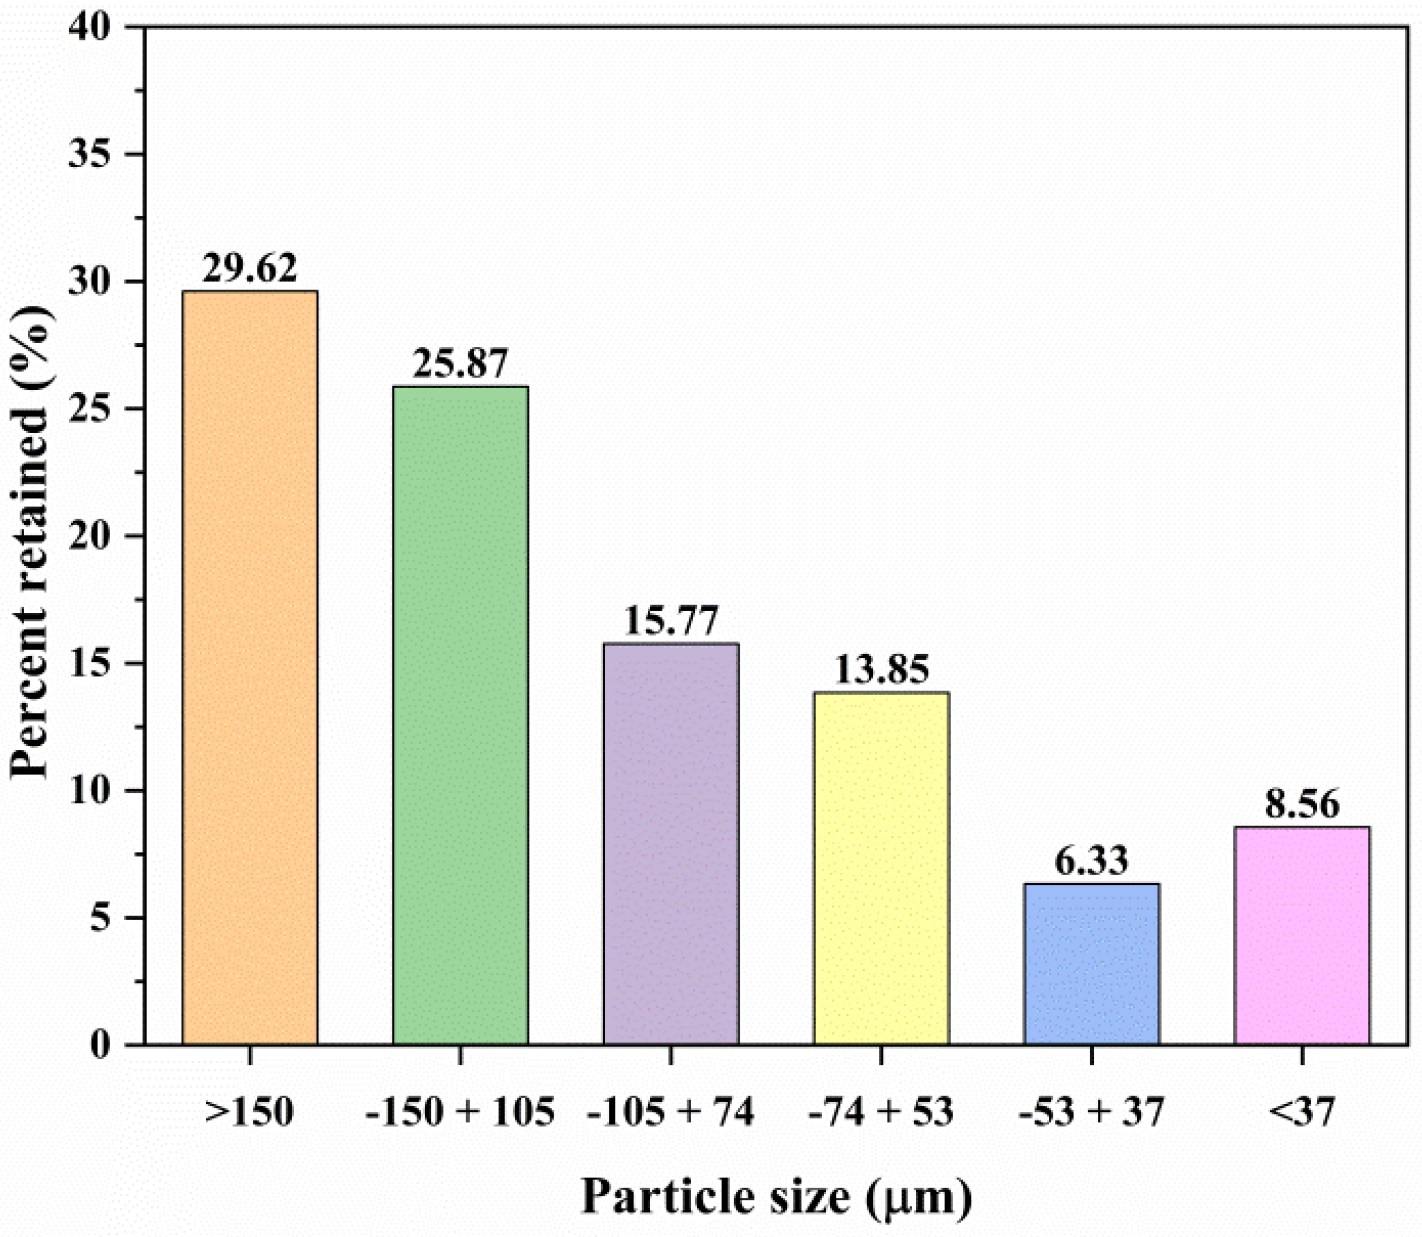
Figure 2.
X-ray diffractogram of tailings from the “El Espiritu” mine.
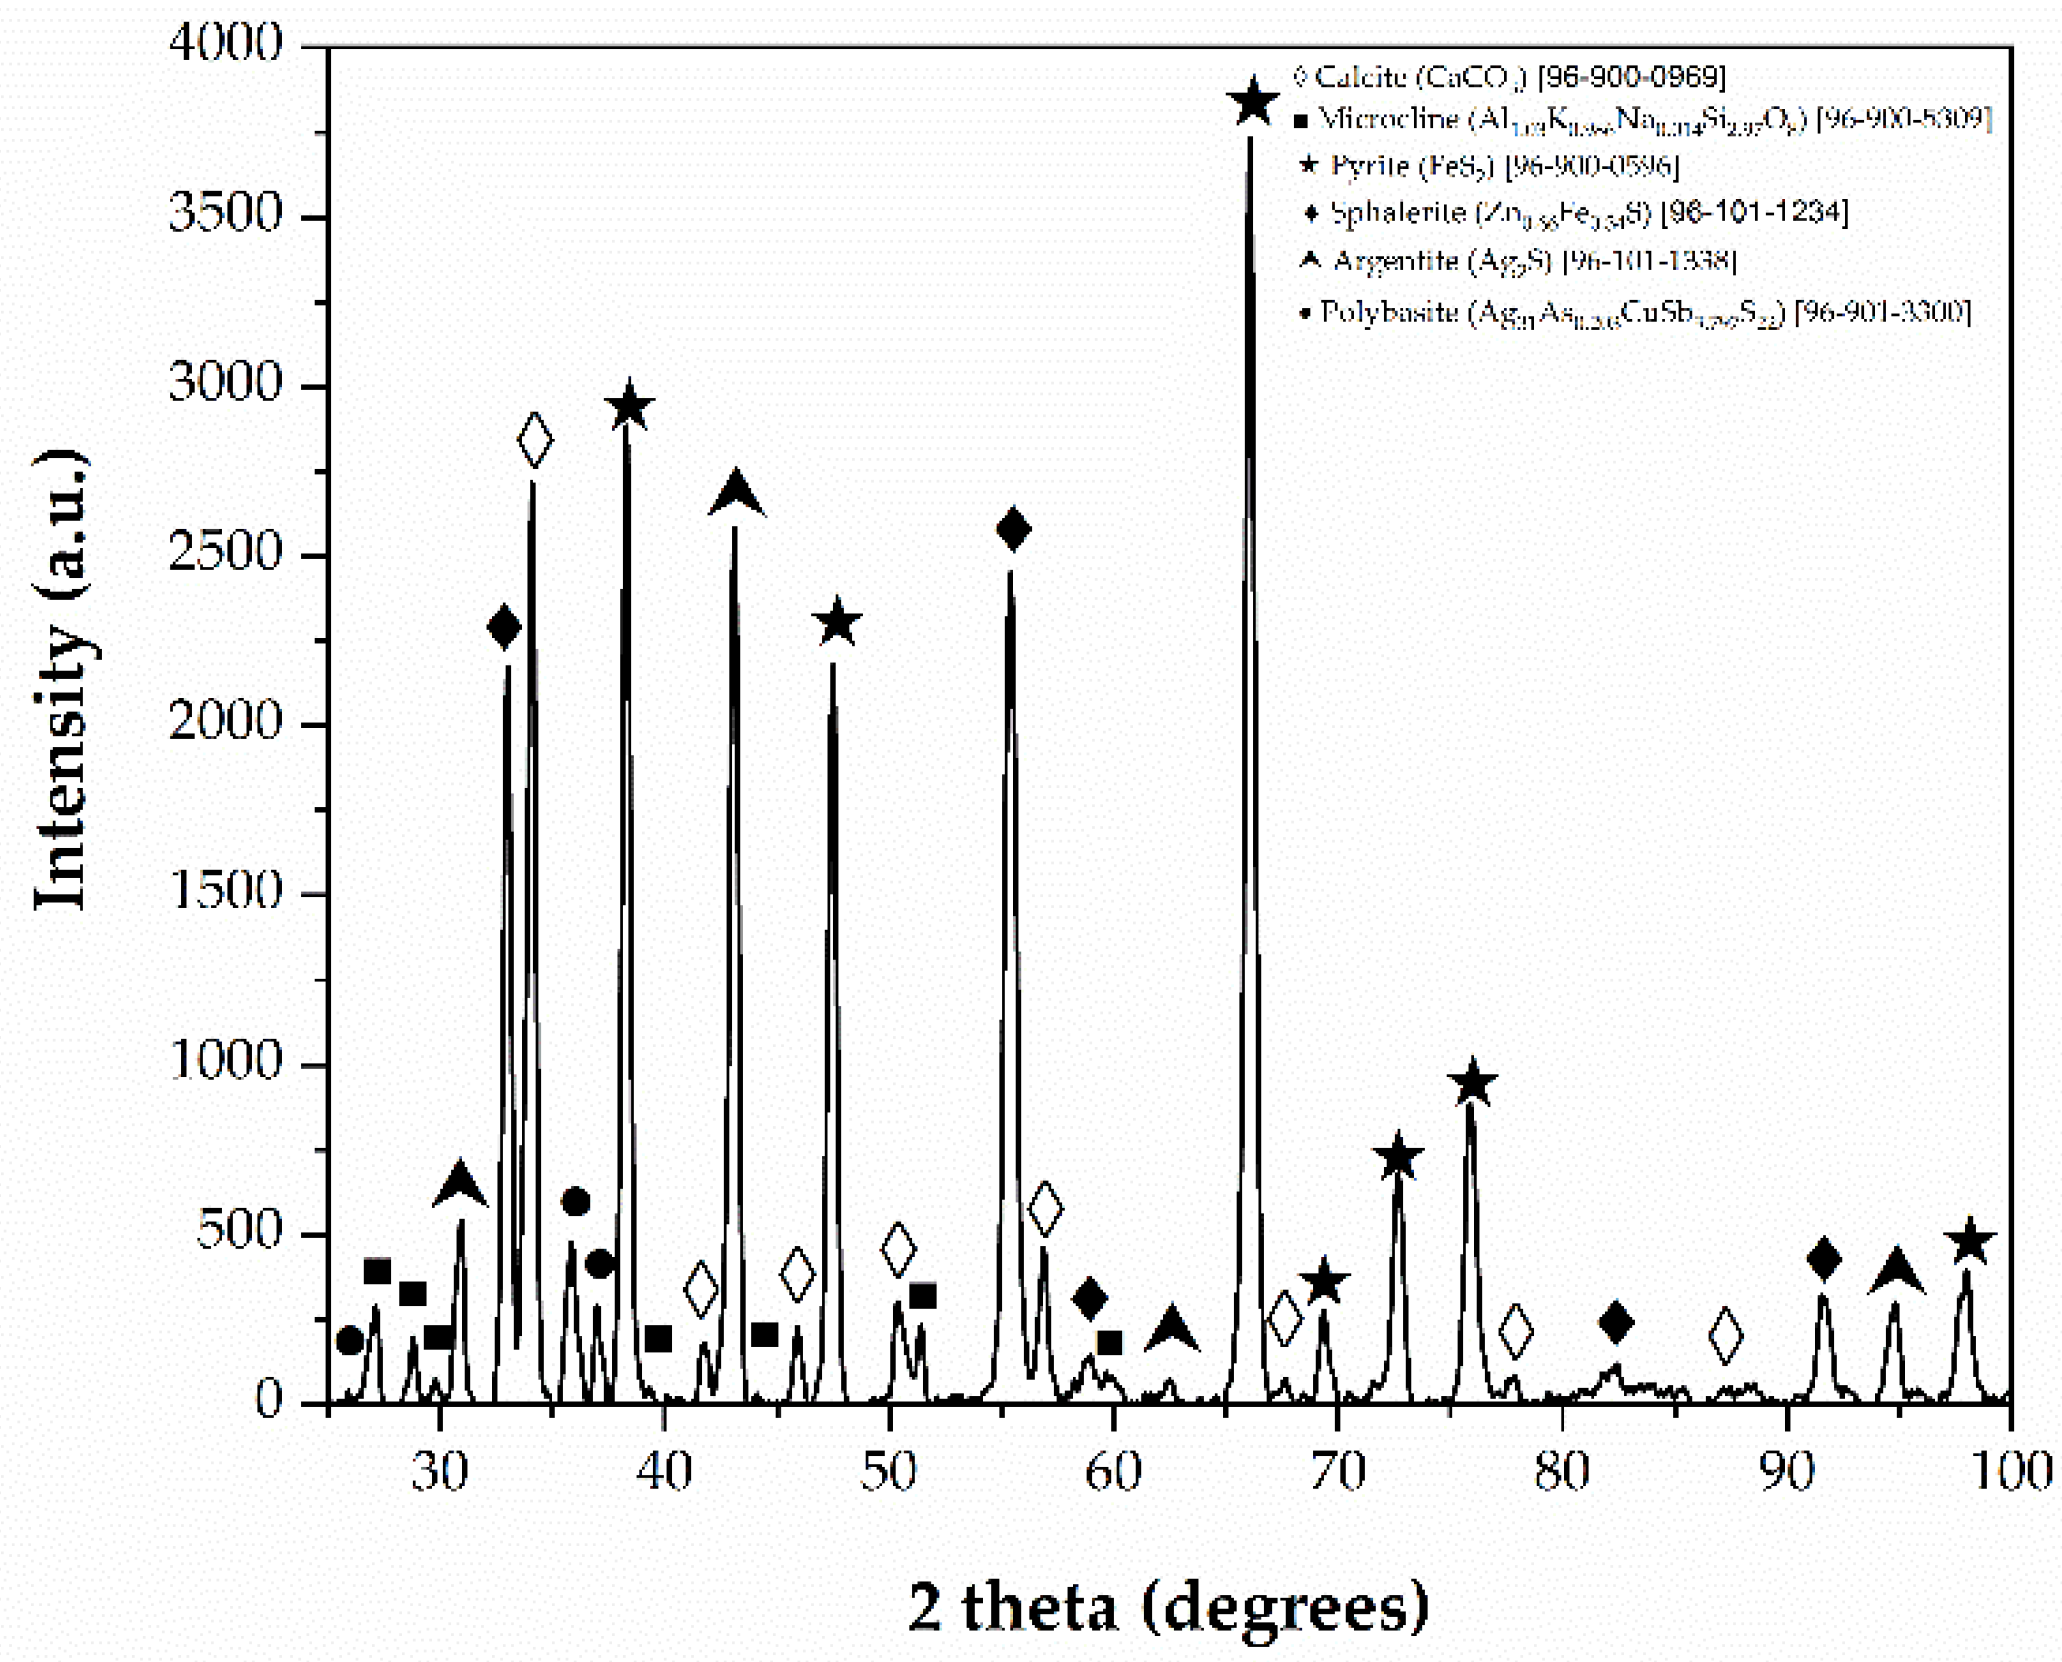
Figure 3.
EDS micrographs obtained with backscattered electrons corresponding to the head mineral. a) Calcite (CaCO₃) and b) Feldspar (KAlSi₃O₈).
Figure 3.
EDS micrographs obtained with backscattered electrons corresponding to the head mineral. a) Calcite (CaCO₃) and b) Feldspar (KAlSi₃O₈).
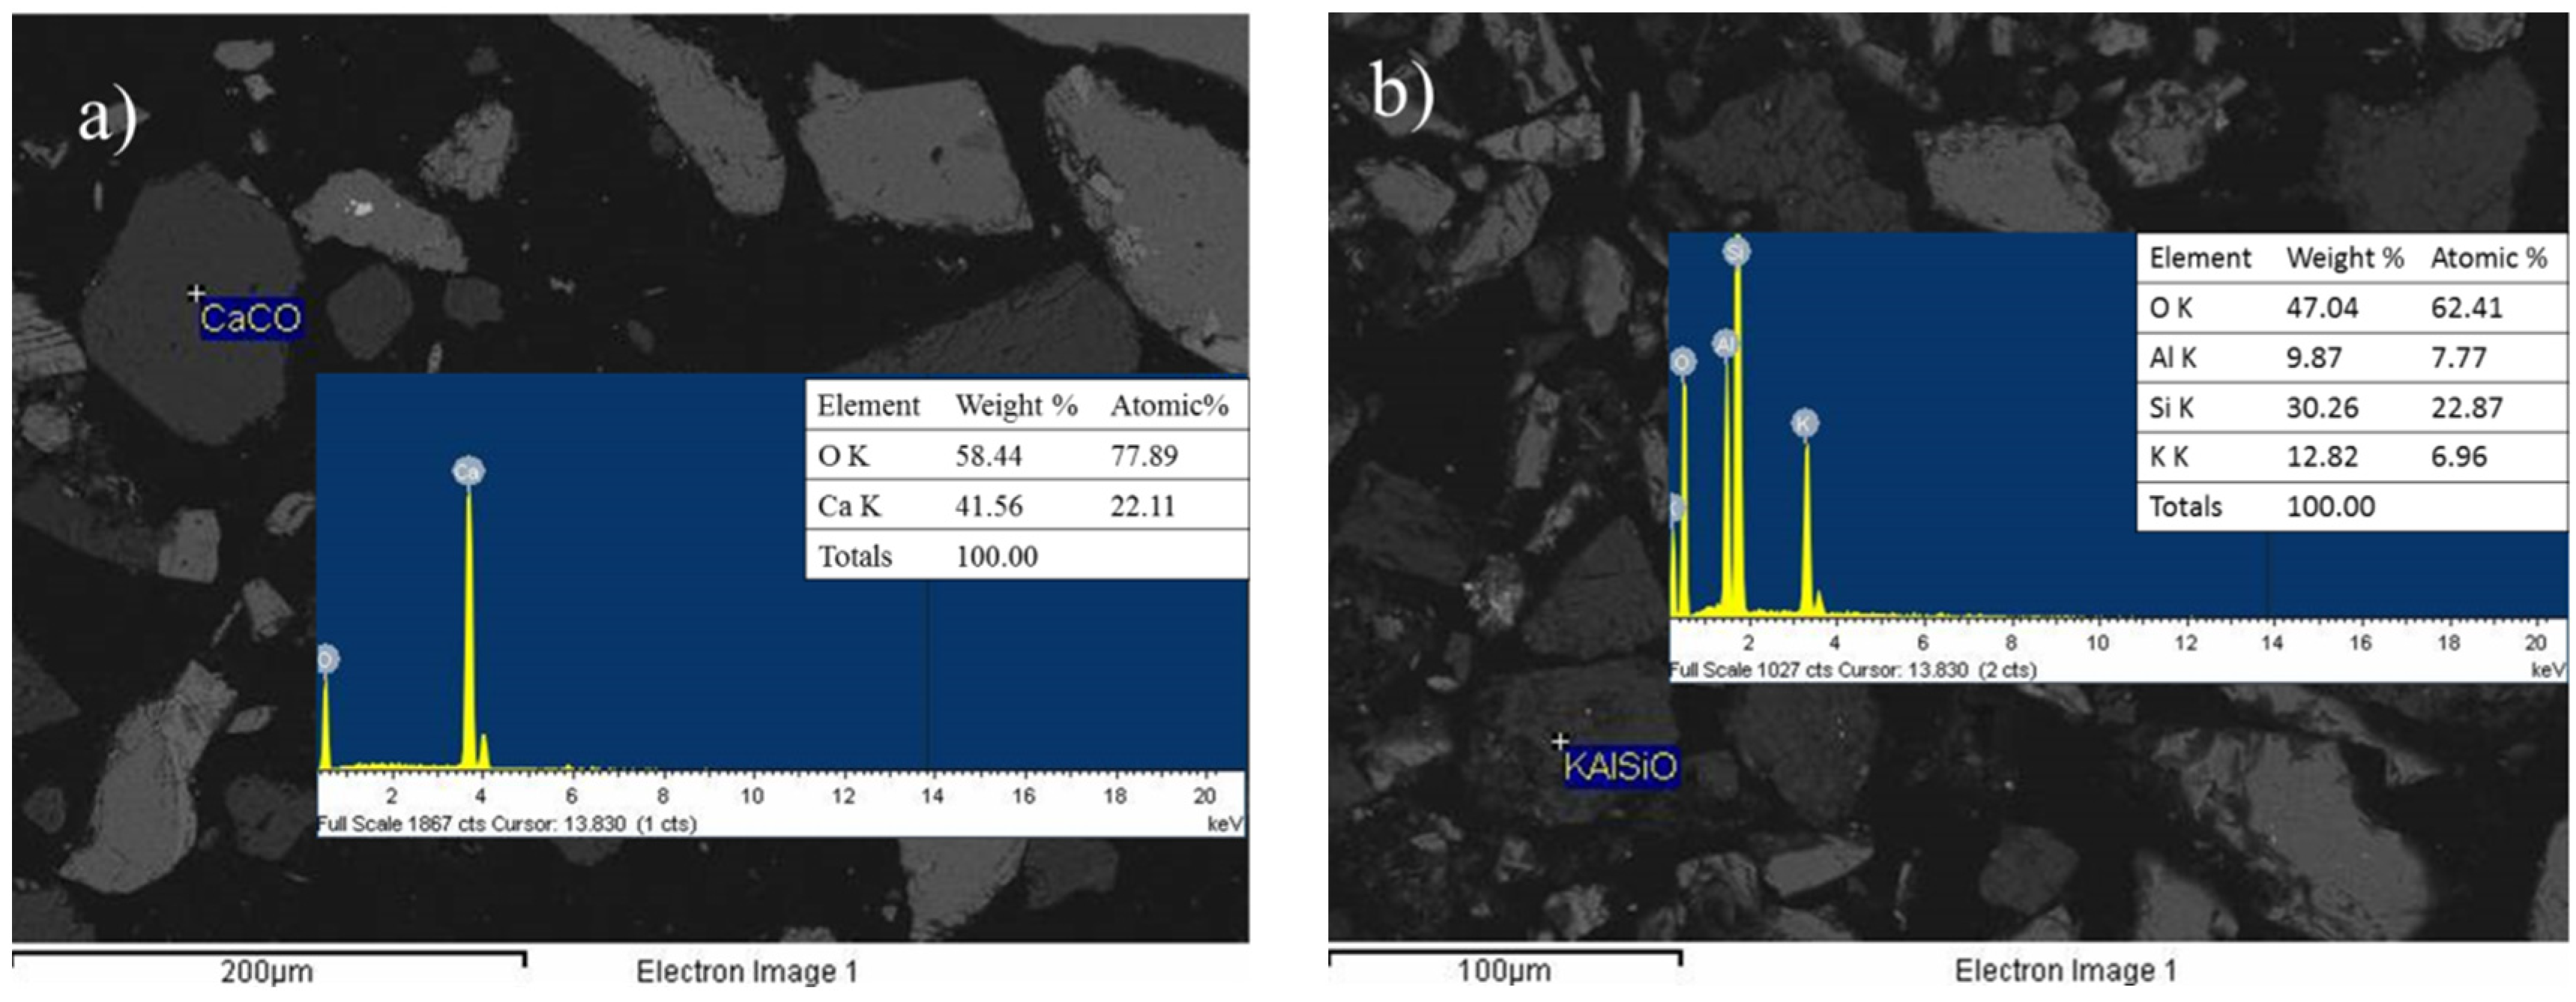
Figure 4.
Micrograph and EDS spectra obtained through backscattered electrons of zinc (ZnS, (a) and iron (FeAsS, (b) species.
Figure 4.
Micrograph and EDS spectra obtained through backscattered electrons of zinc (ZnS, (a) and iron (FeAsS, (b) species.
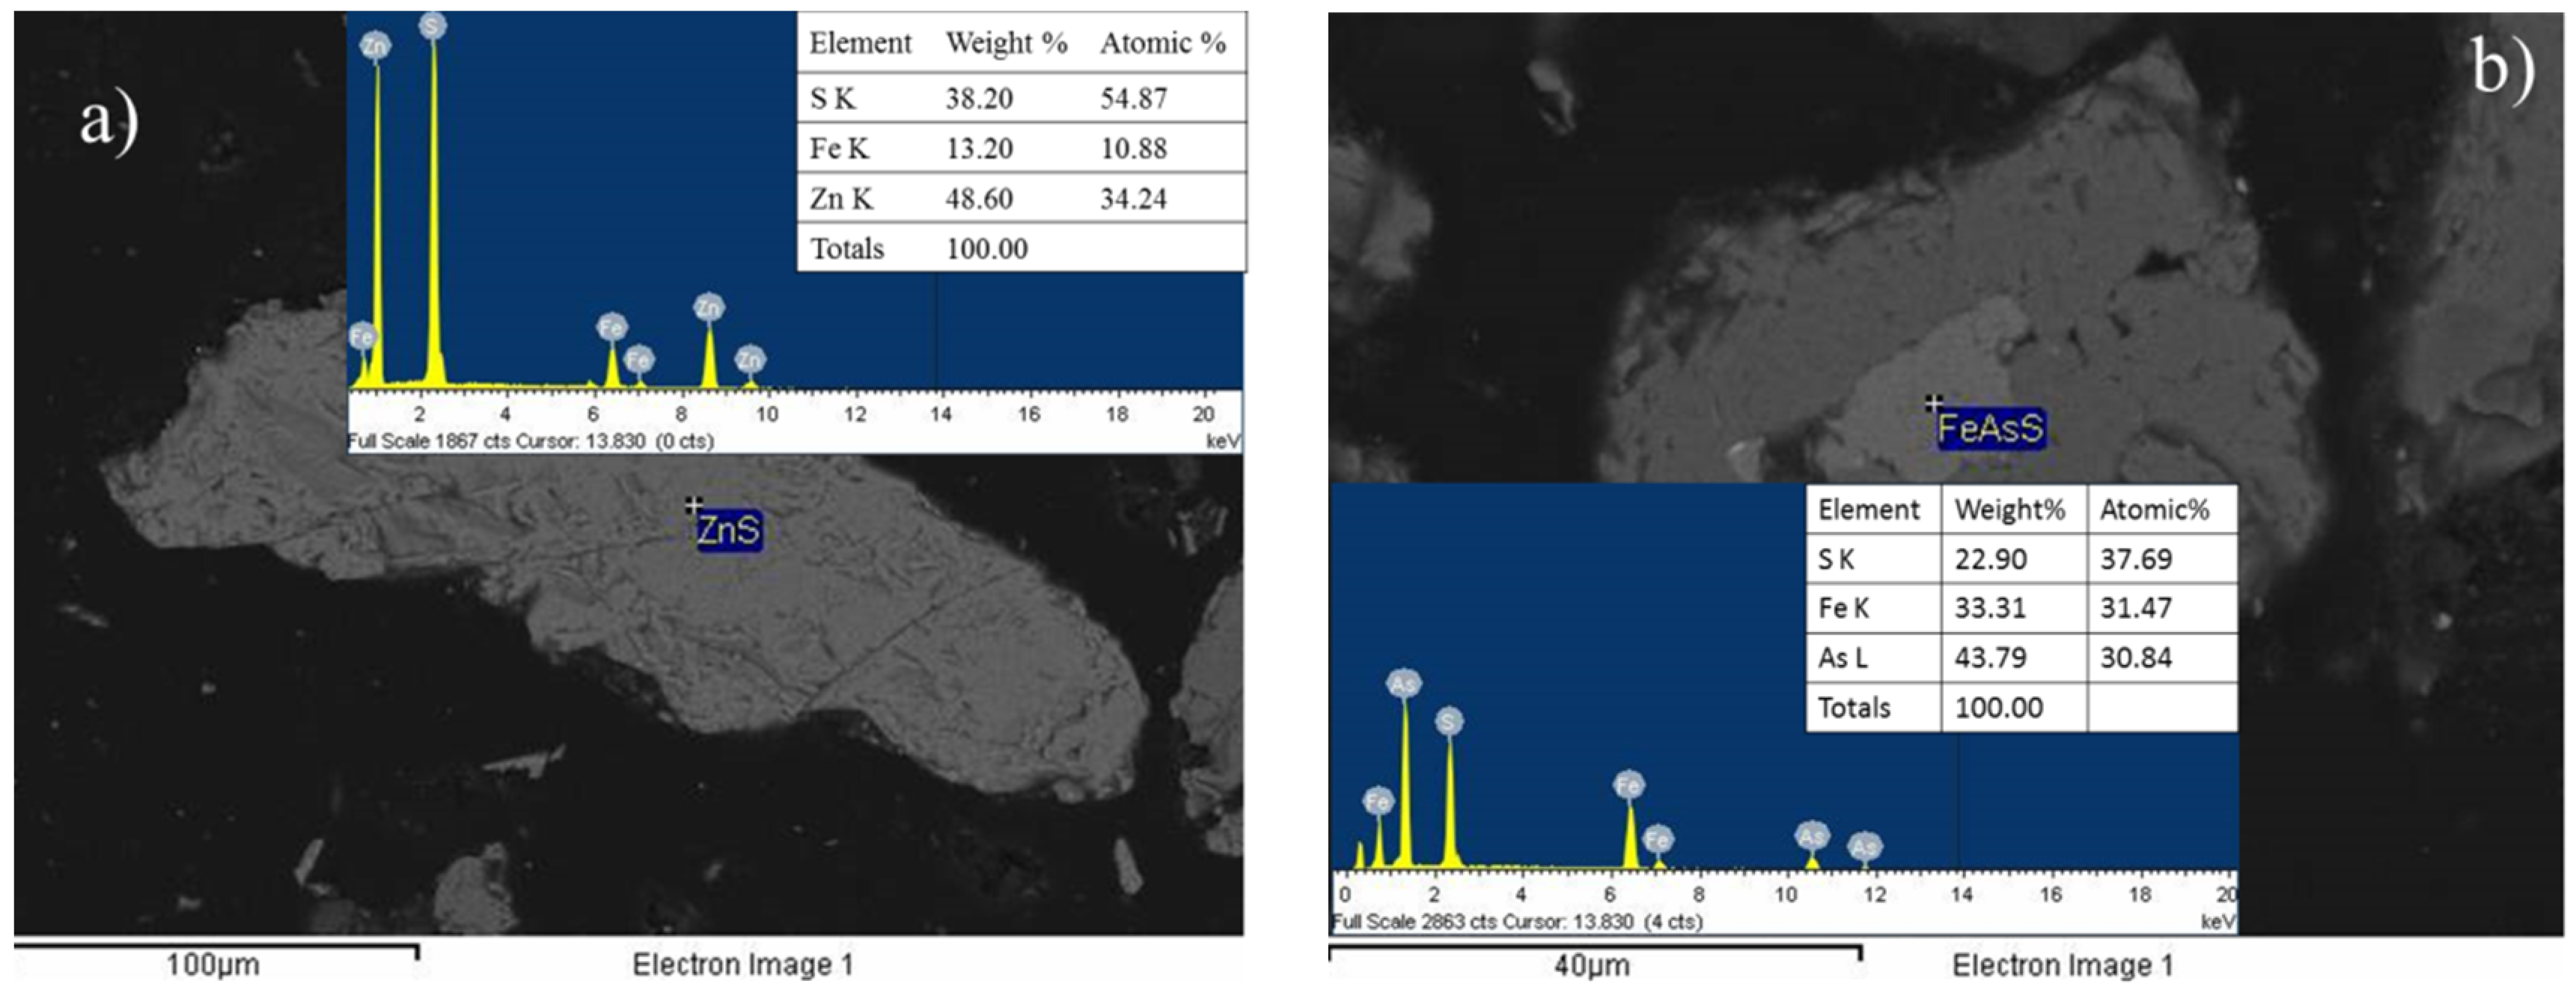
Figure 5.
a) Pyrite (FeS2) and b) wustite (FeO). Micrograph obtained through backscattered electron imaging of the mineral species related to iron content.
Figure 5.
a) Pyrite (FeS2) and b) wustite (FeO). Micrograph obtained through backscattered electron imaging of the mineral species related to iron content.

Figure 6.
Micrograph obtained by backscattered electrons and EDS spectrum of particles identified as a) Polybasite (Ag,Cu)16Sb2S11) and b) Argentite (Ag2S).
Figure 6.
Micrograph obtained by backscattered electrons and EDS spectrum of particles identified as a) Polybasite (Ag,Cu)16Sb2S11) and b) Argentite (Ag2S).
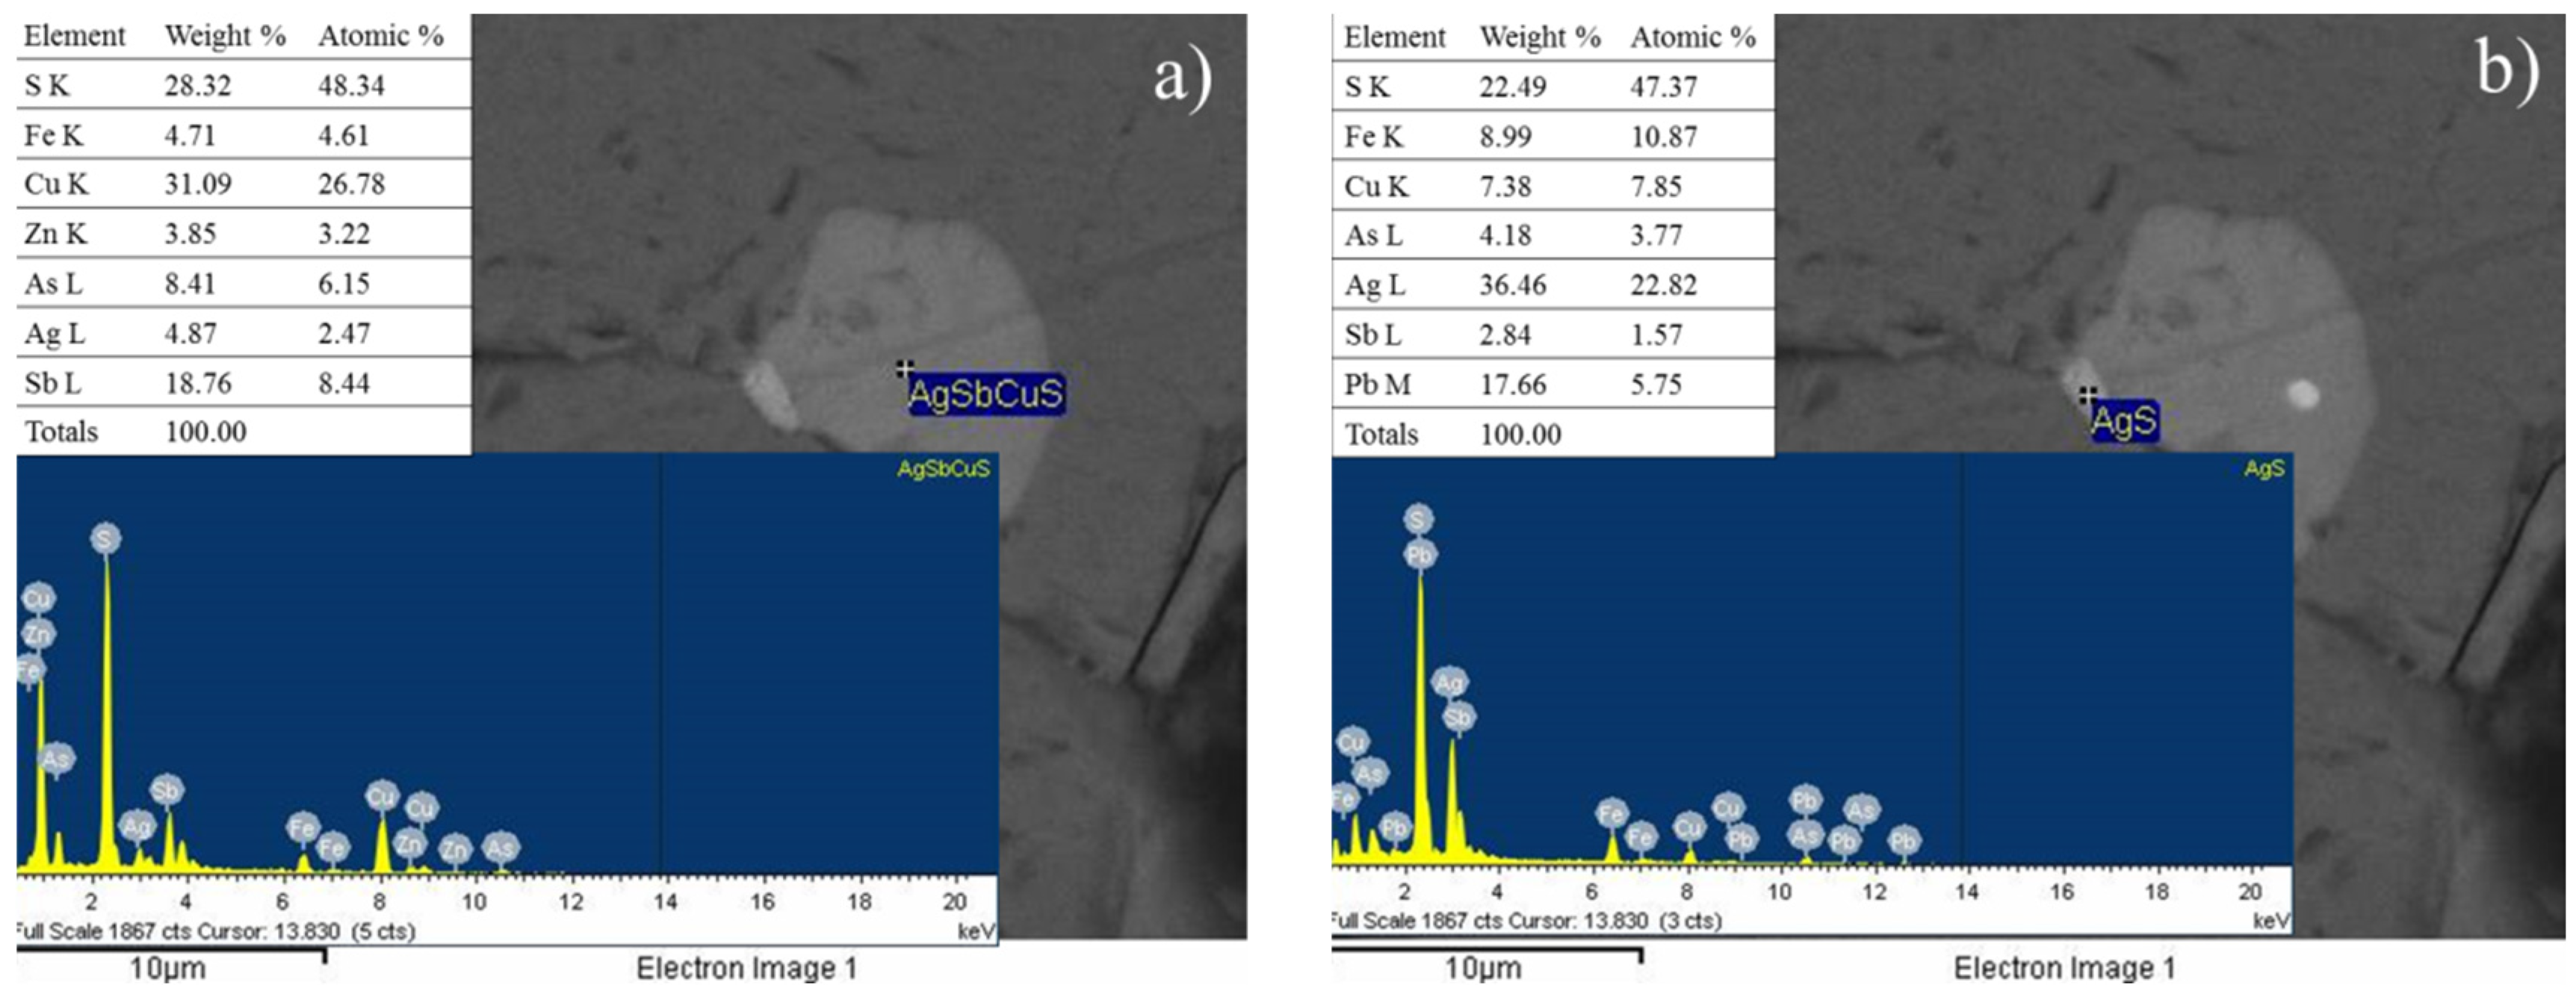
Figure 7.
Leaching curves for silver (a) and copper (b). Experimental conditions: [TU] = 0.2, 0.1, 0.03, and 0 M L-1, [Ox] = 0.2 M Lg008, sample weight = 10 g, pH = 2, temperature = 30°C, stirring speed = 600 rpm, solution volume = 0.5 L, particle size = -53 +37 μm
Figure 7.
Leaching curves for silver (a) and copper (b). Experimental conditions: [TU] = 0.2, 0.1, 0.03, and 0 M L-1, [Ox] = 0.2 M Lg008, sample weight = 10 g, pH = 2, temperature = 30°C, stirring speed = 600 rpm, solution volume = 0.5 L, particle size = -53 +37 μm
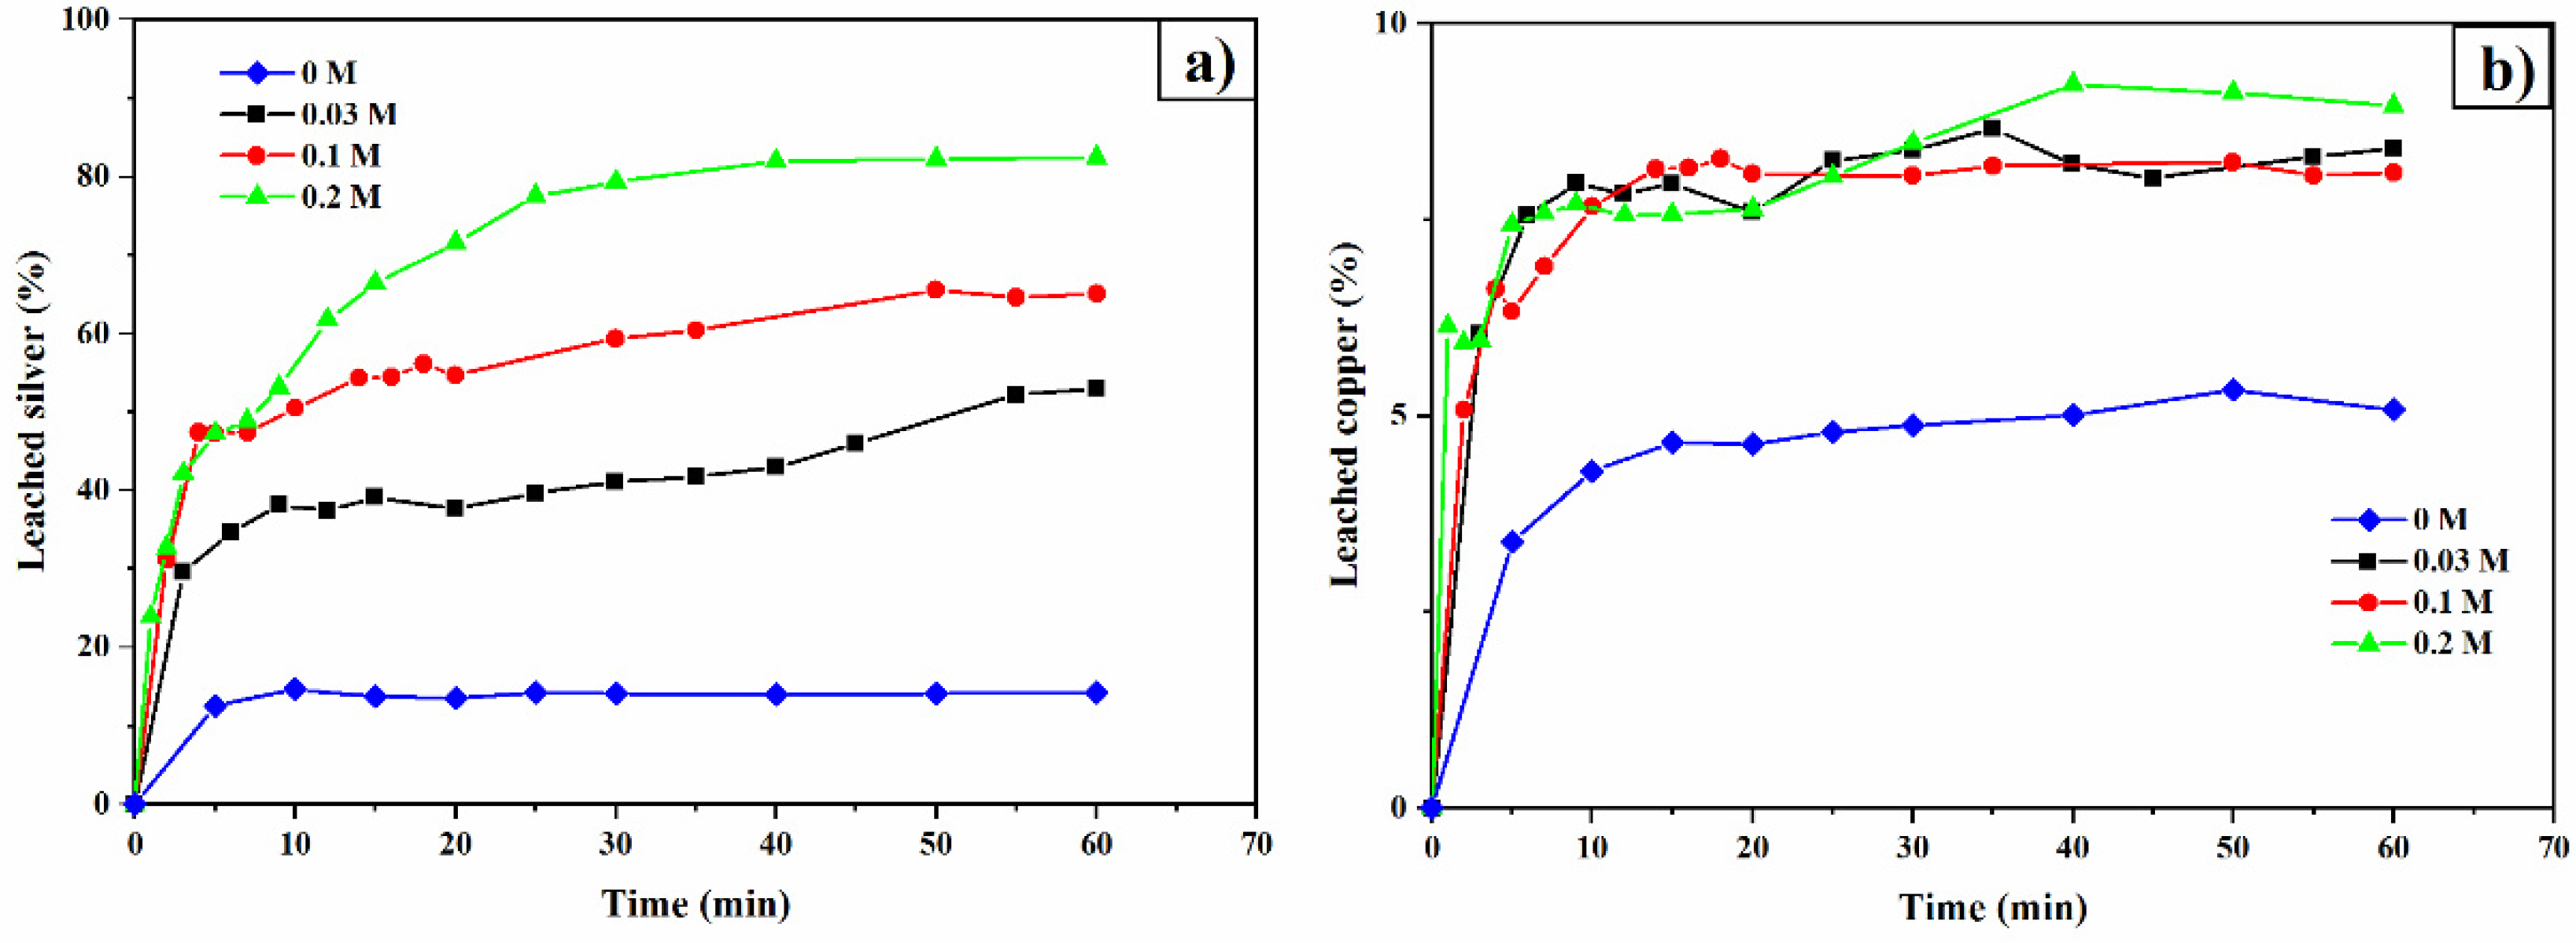
Figure 8.
Eh-pH diagram for [Cu²⁺] = 3.726 × 10⁻⁴ M with 0.3 M oxalate at 25°C. Diagram generated using MEDUSA© software [59].
Figure 8.
Eh-pH diagram for [Cu²⁺] = 3.726 × 10⁻⁴ M with 0.3 M oxalate at 25°C. Diagram generated using MEDUSA© software [59].
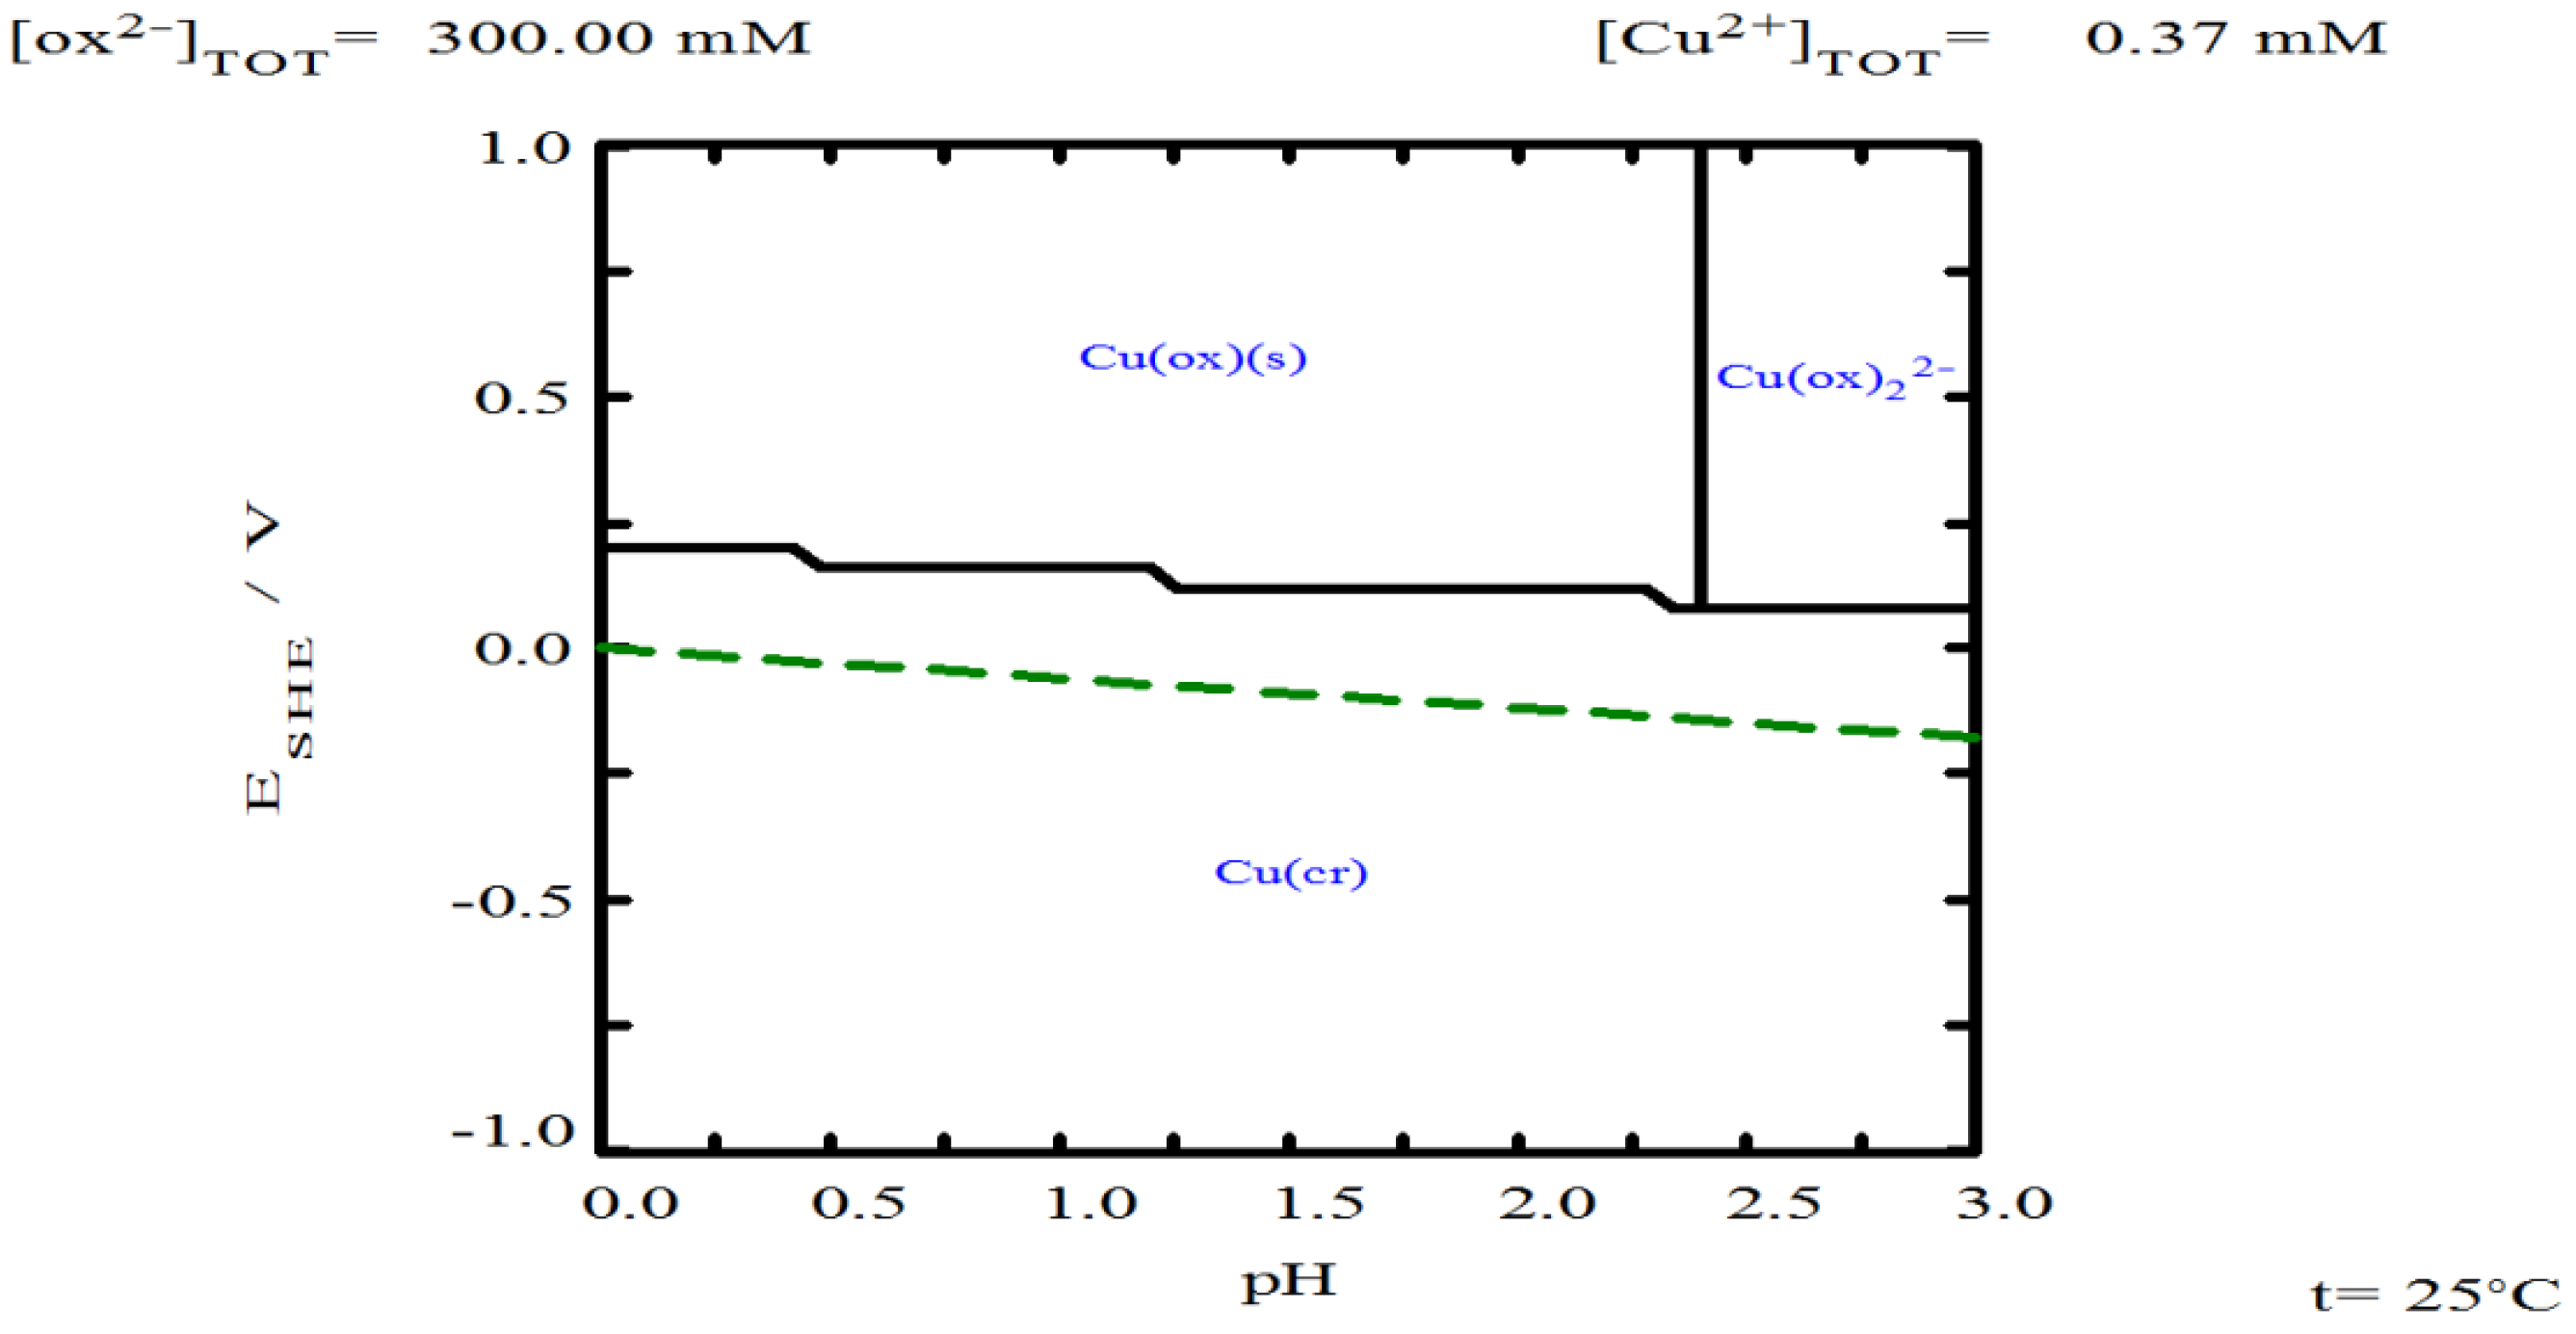
Figure 9.
Leaching curves for iron (a) and arsenic (b). Experimental conditions: [TU] = 0.2, 0.1, 0.03, and 0 M L⁻¹, [Ox] = 0.2 M L⁻¹, sample: 10 g, pH = 2, T = 30°C, stirring speed = 600 rpm, solution volume = 0.5 L, particle size = -53 +37 μm.
Figure 9.
Leaching curves for iron (a) and arsenic (b). Experimental conditions: [TU] = 0.2, 0.1, 0.03, and 0 M L⁻¹, [Ox] = 0.2 M L⁻¹, sample: 10 g, pH = 2, T = 30°C, stirring speed = 600 rpm, solution volume = 0.5 L, particle size = -53 +37 μm.
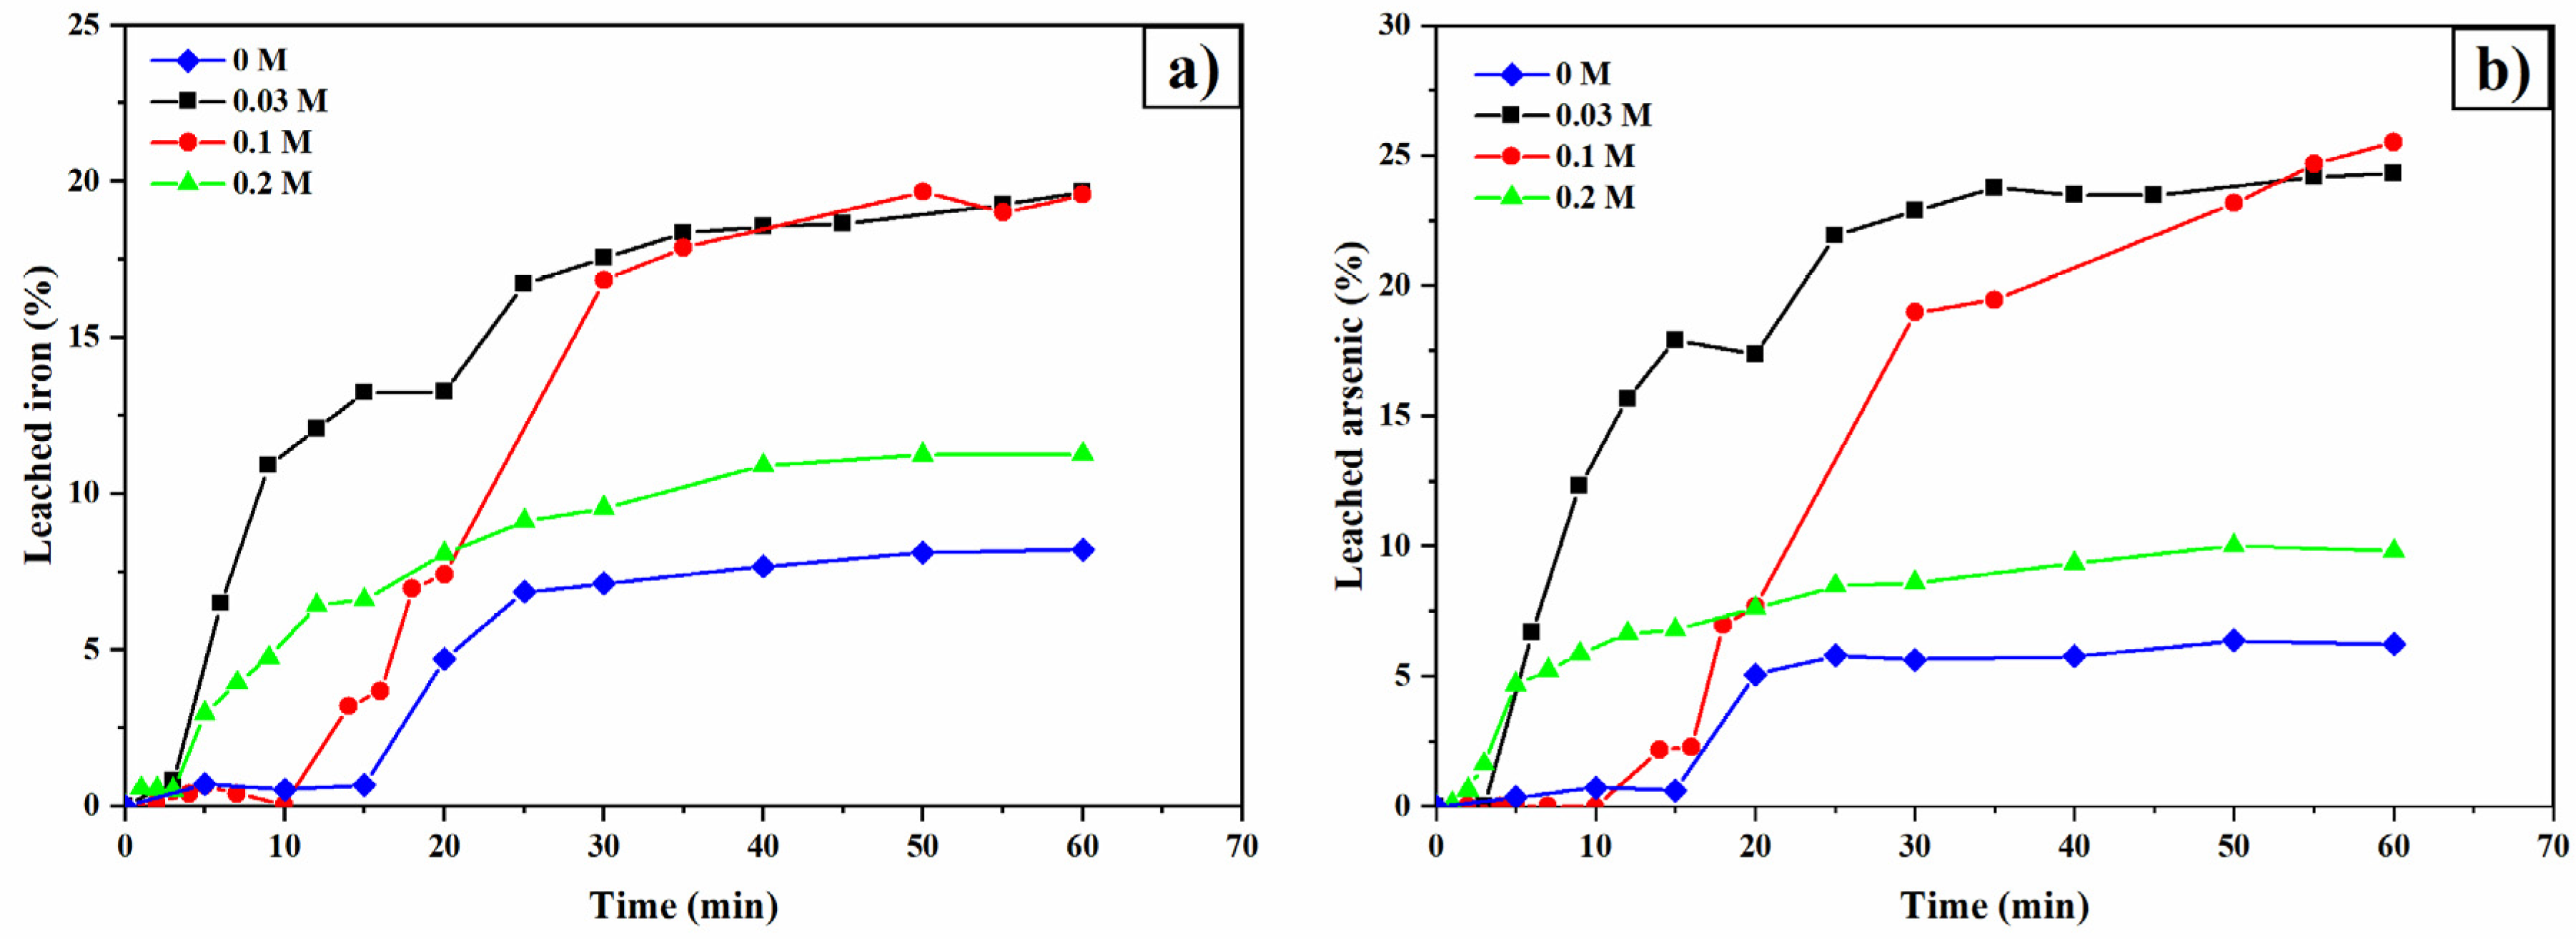
Figure 10.
Leaching curves for silver (a) and copper (b). Experimental conditions: [TU] = 0.2 M L⁻¹, [Ox] = 0.3, 0.2, 0.0012, and 0 M L⁻¹, sample: 10 g, pH = 2, T = 30°C, stirring speed = 600 rpm, solution volume = 0.5 L, particle size = -53 +37 μm.
Figure 10.
Leaching curves for silver (a) and copper (b). Experimental conditions: [TU] = 0.2 M L⁻¹, [Ox] = 0.3, 0.2, 0.0012, and 0 M L⁻¹, sample: 10 g, pH = 2, T = 30°C, stirring speed = 600 rpm, solution volume = 0.5 L, particle size = -53 +37 μm.
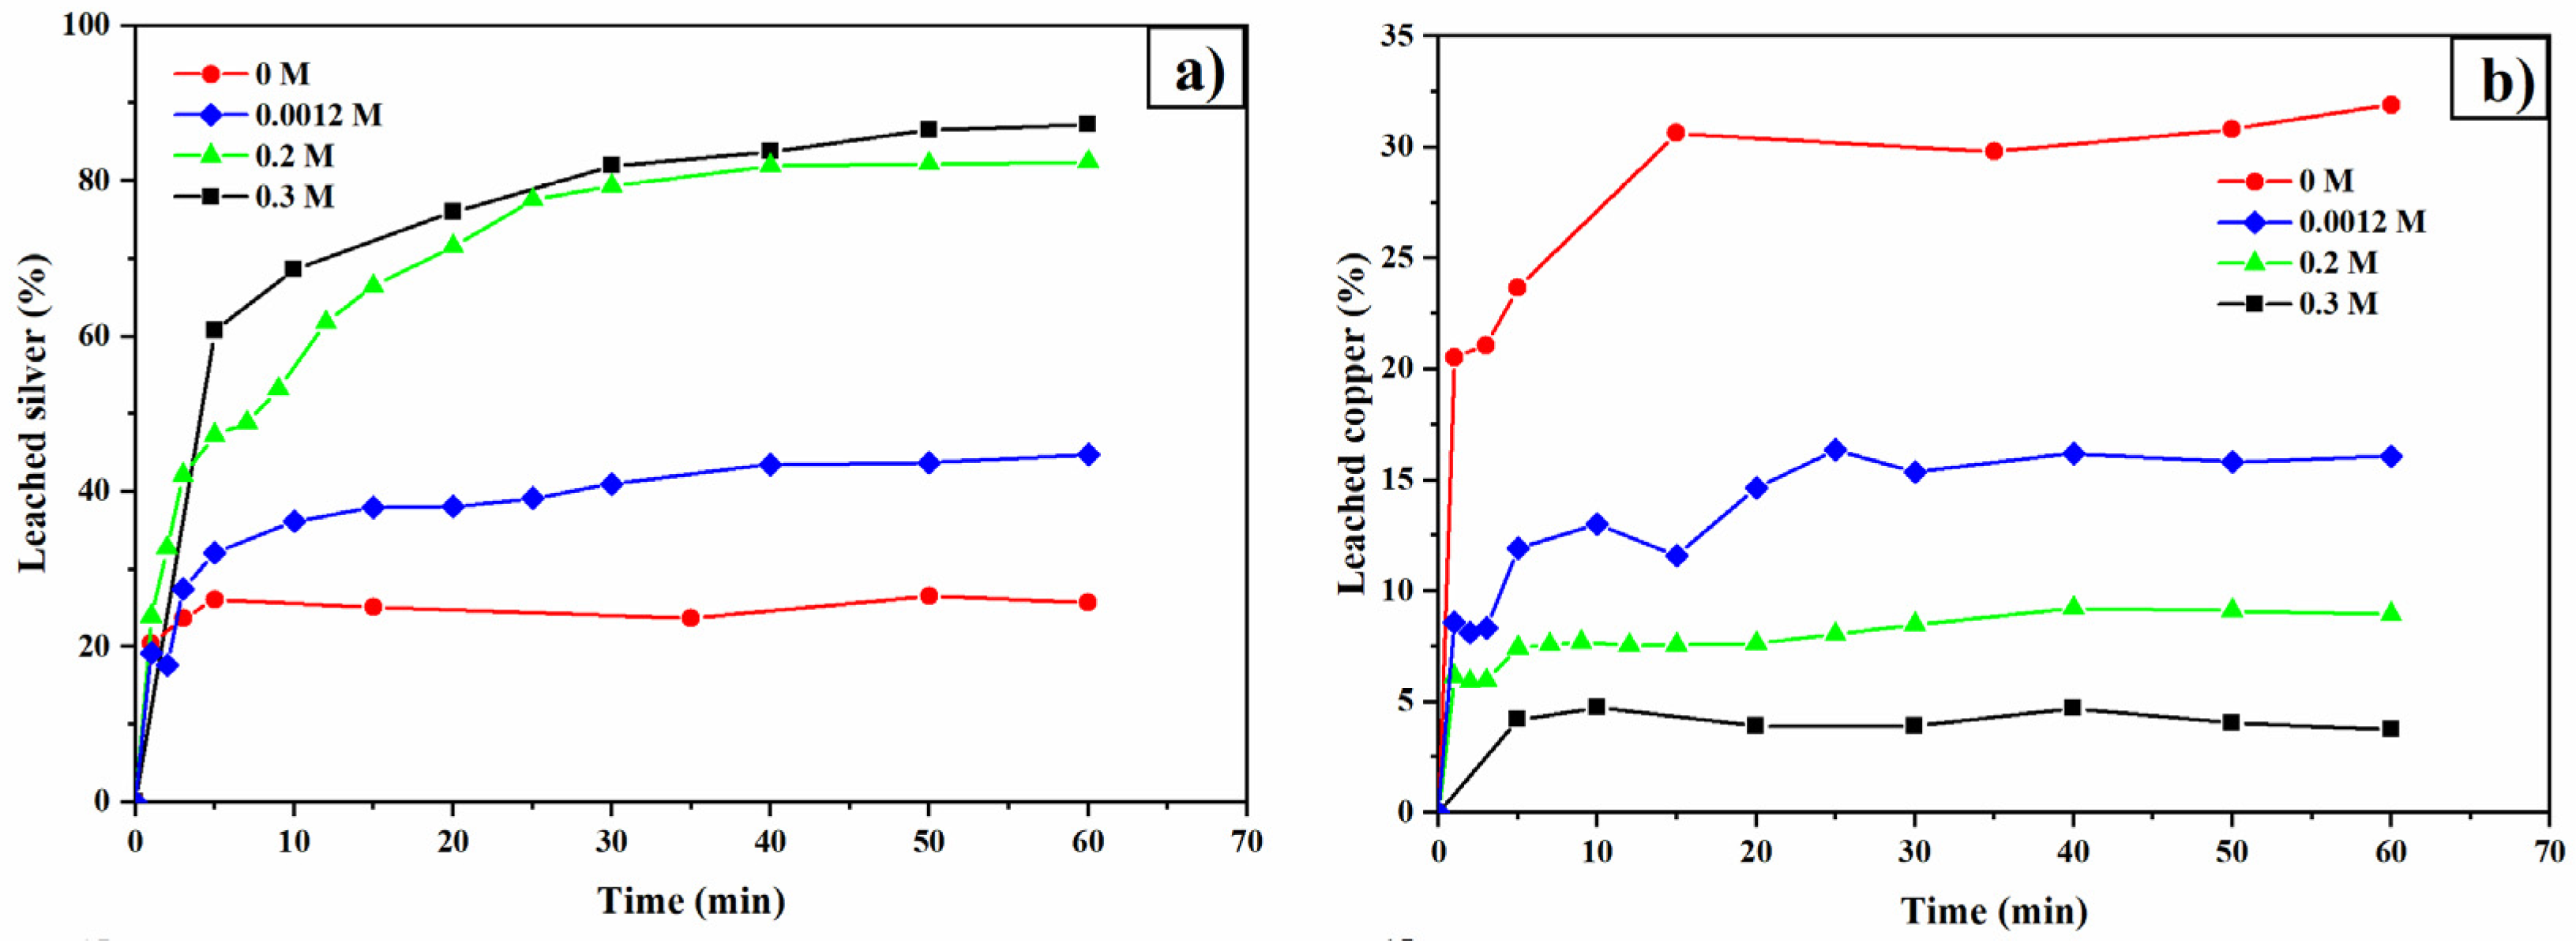
Figure 11.
Eh-pH diagram for [Ag] 9.7×10⁻⁶ M with 0.2 M Thiourea at 25°C. Diagram generated using the MEDUSA© software [59].
Figure 11.
Eh-pH diagram for [Ag] 9.7×10⁻⁶ M with 0.2 M Thiourea at 25°C. Diagram generated using the MEDUSA© software [59].
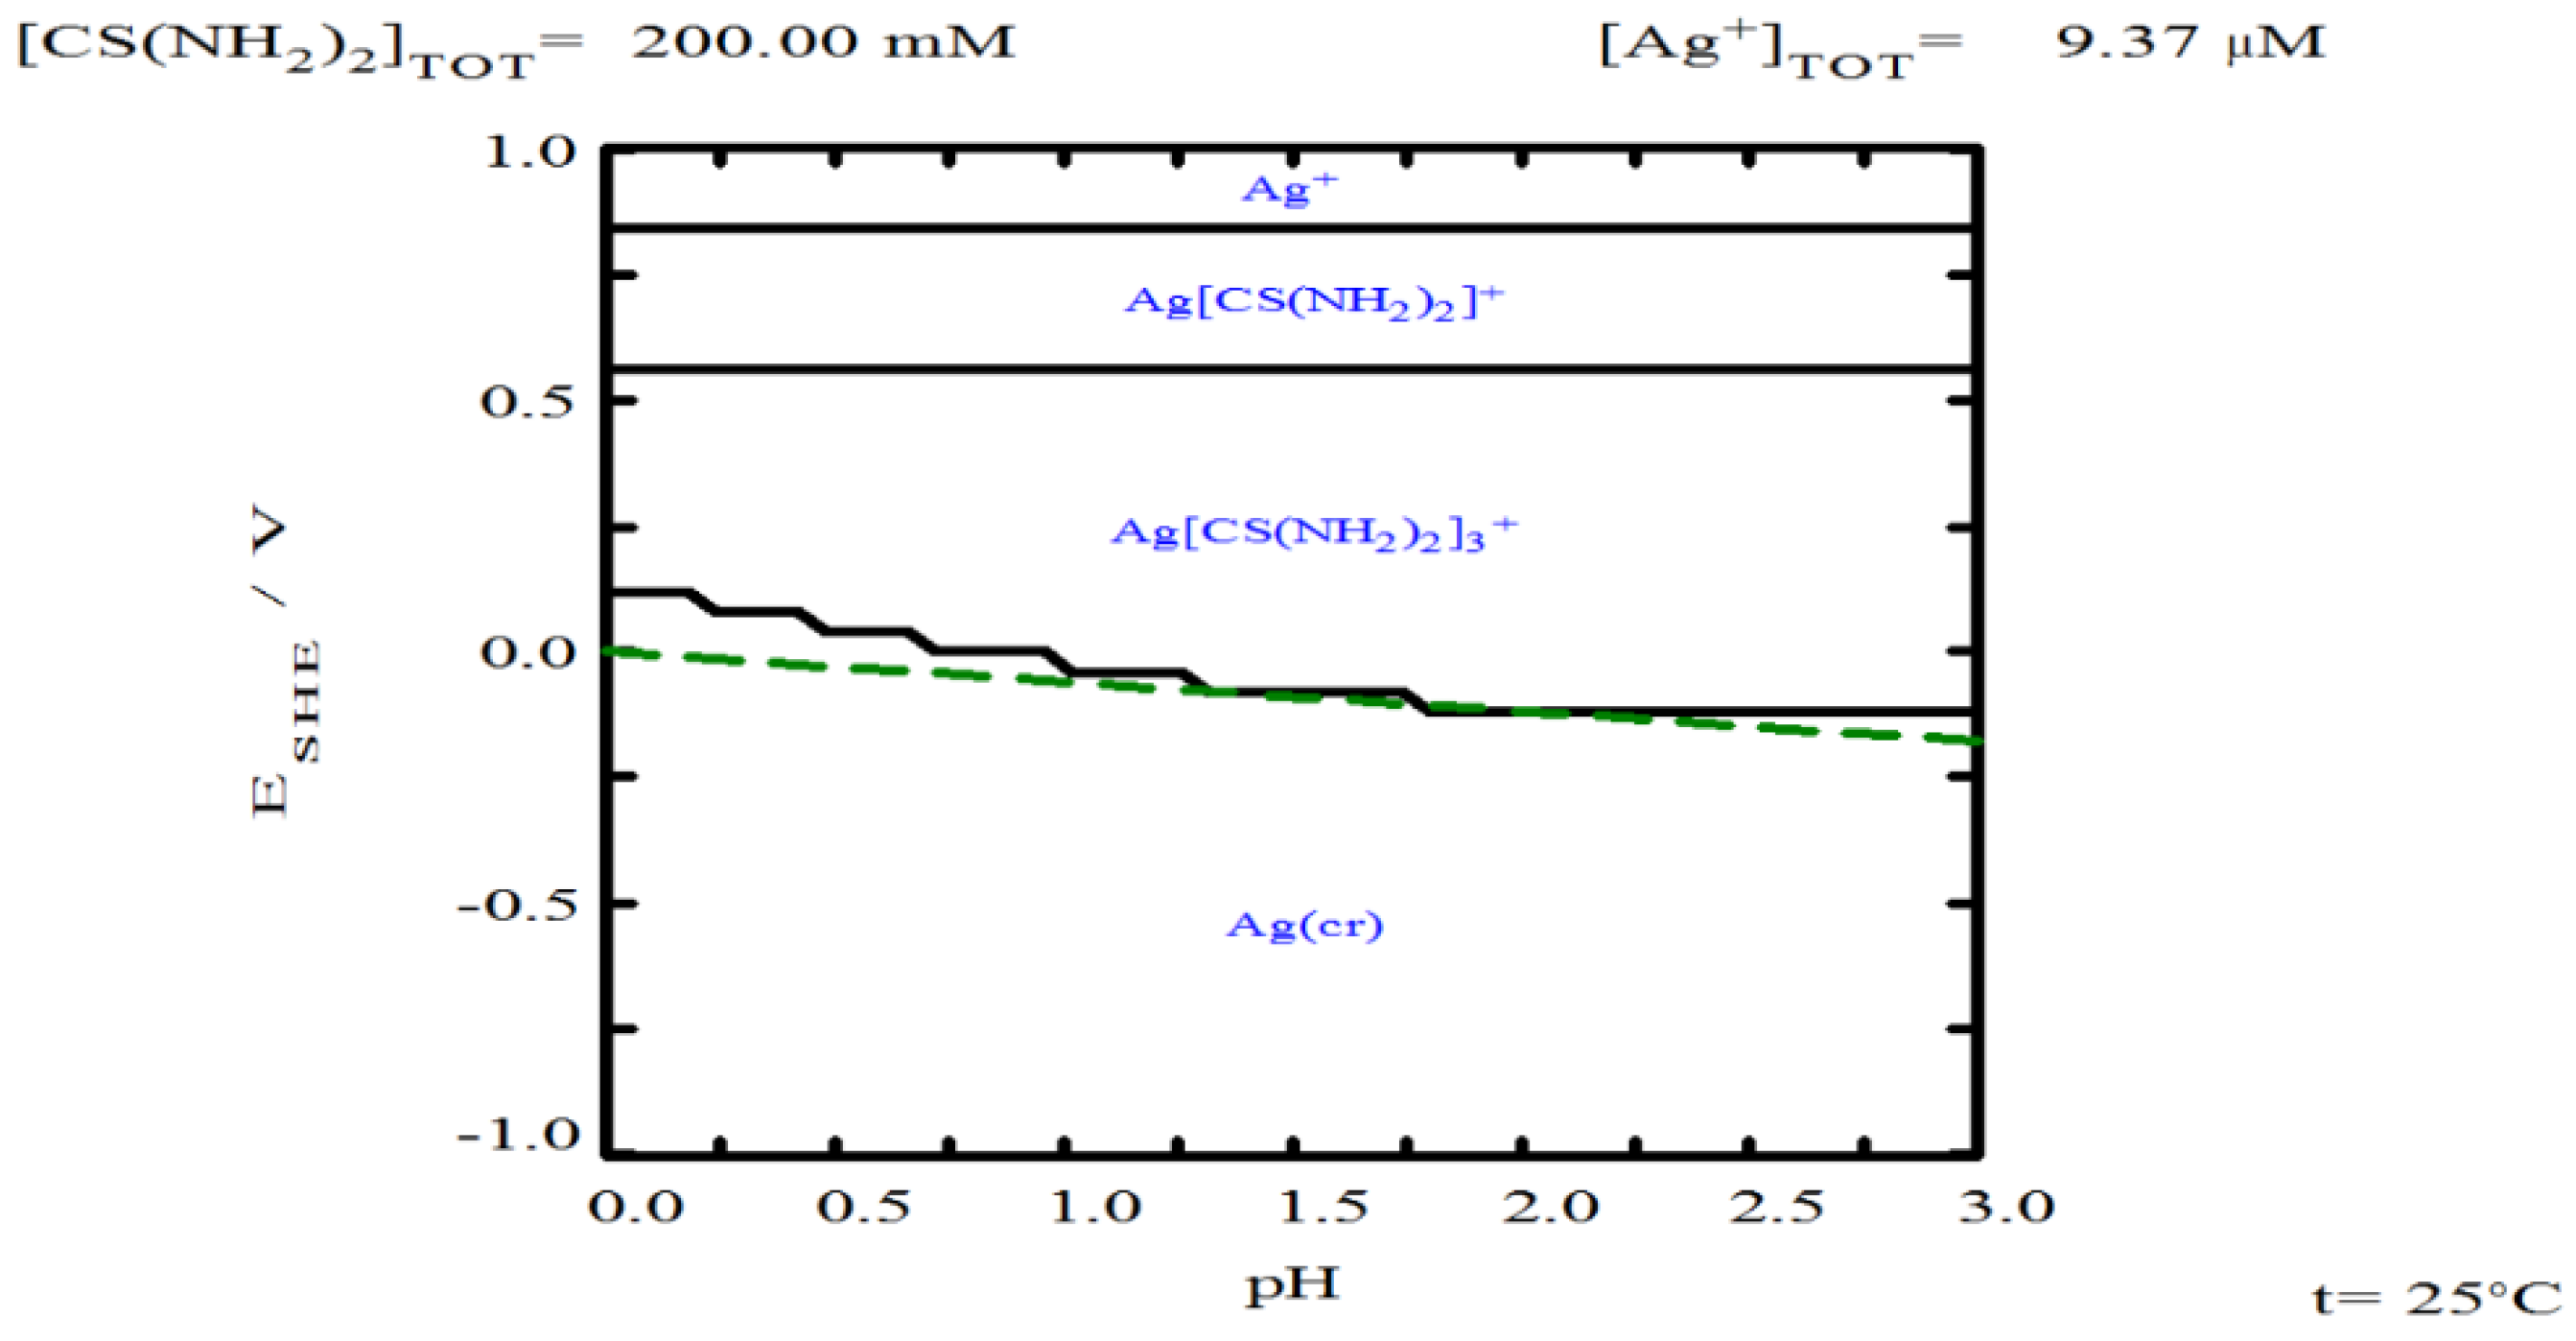
Figure 12.
Eh-pH diagram for [Ag] 9.37×10⁻⁶ M with 0.3 M Oxalate at 25°C. Diagram generated using the MEDUSA© software [59].
Figure 12.
Eh-pH diagram for [Ag] 9.37×10⁻⁶ M with 0.3 M Oxalate at 25°C. Diagram generated using the MEDUSA© software [59].
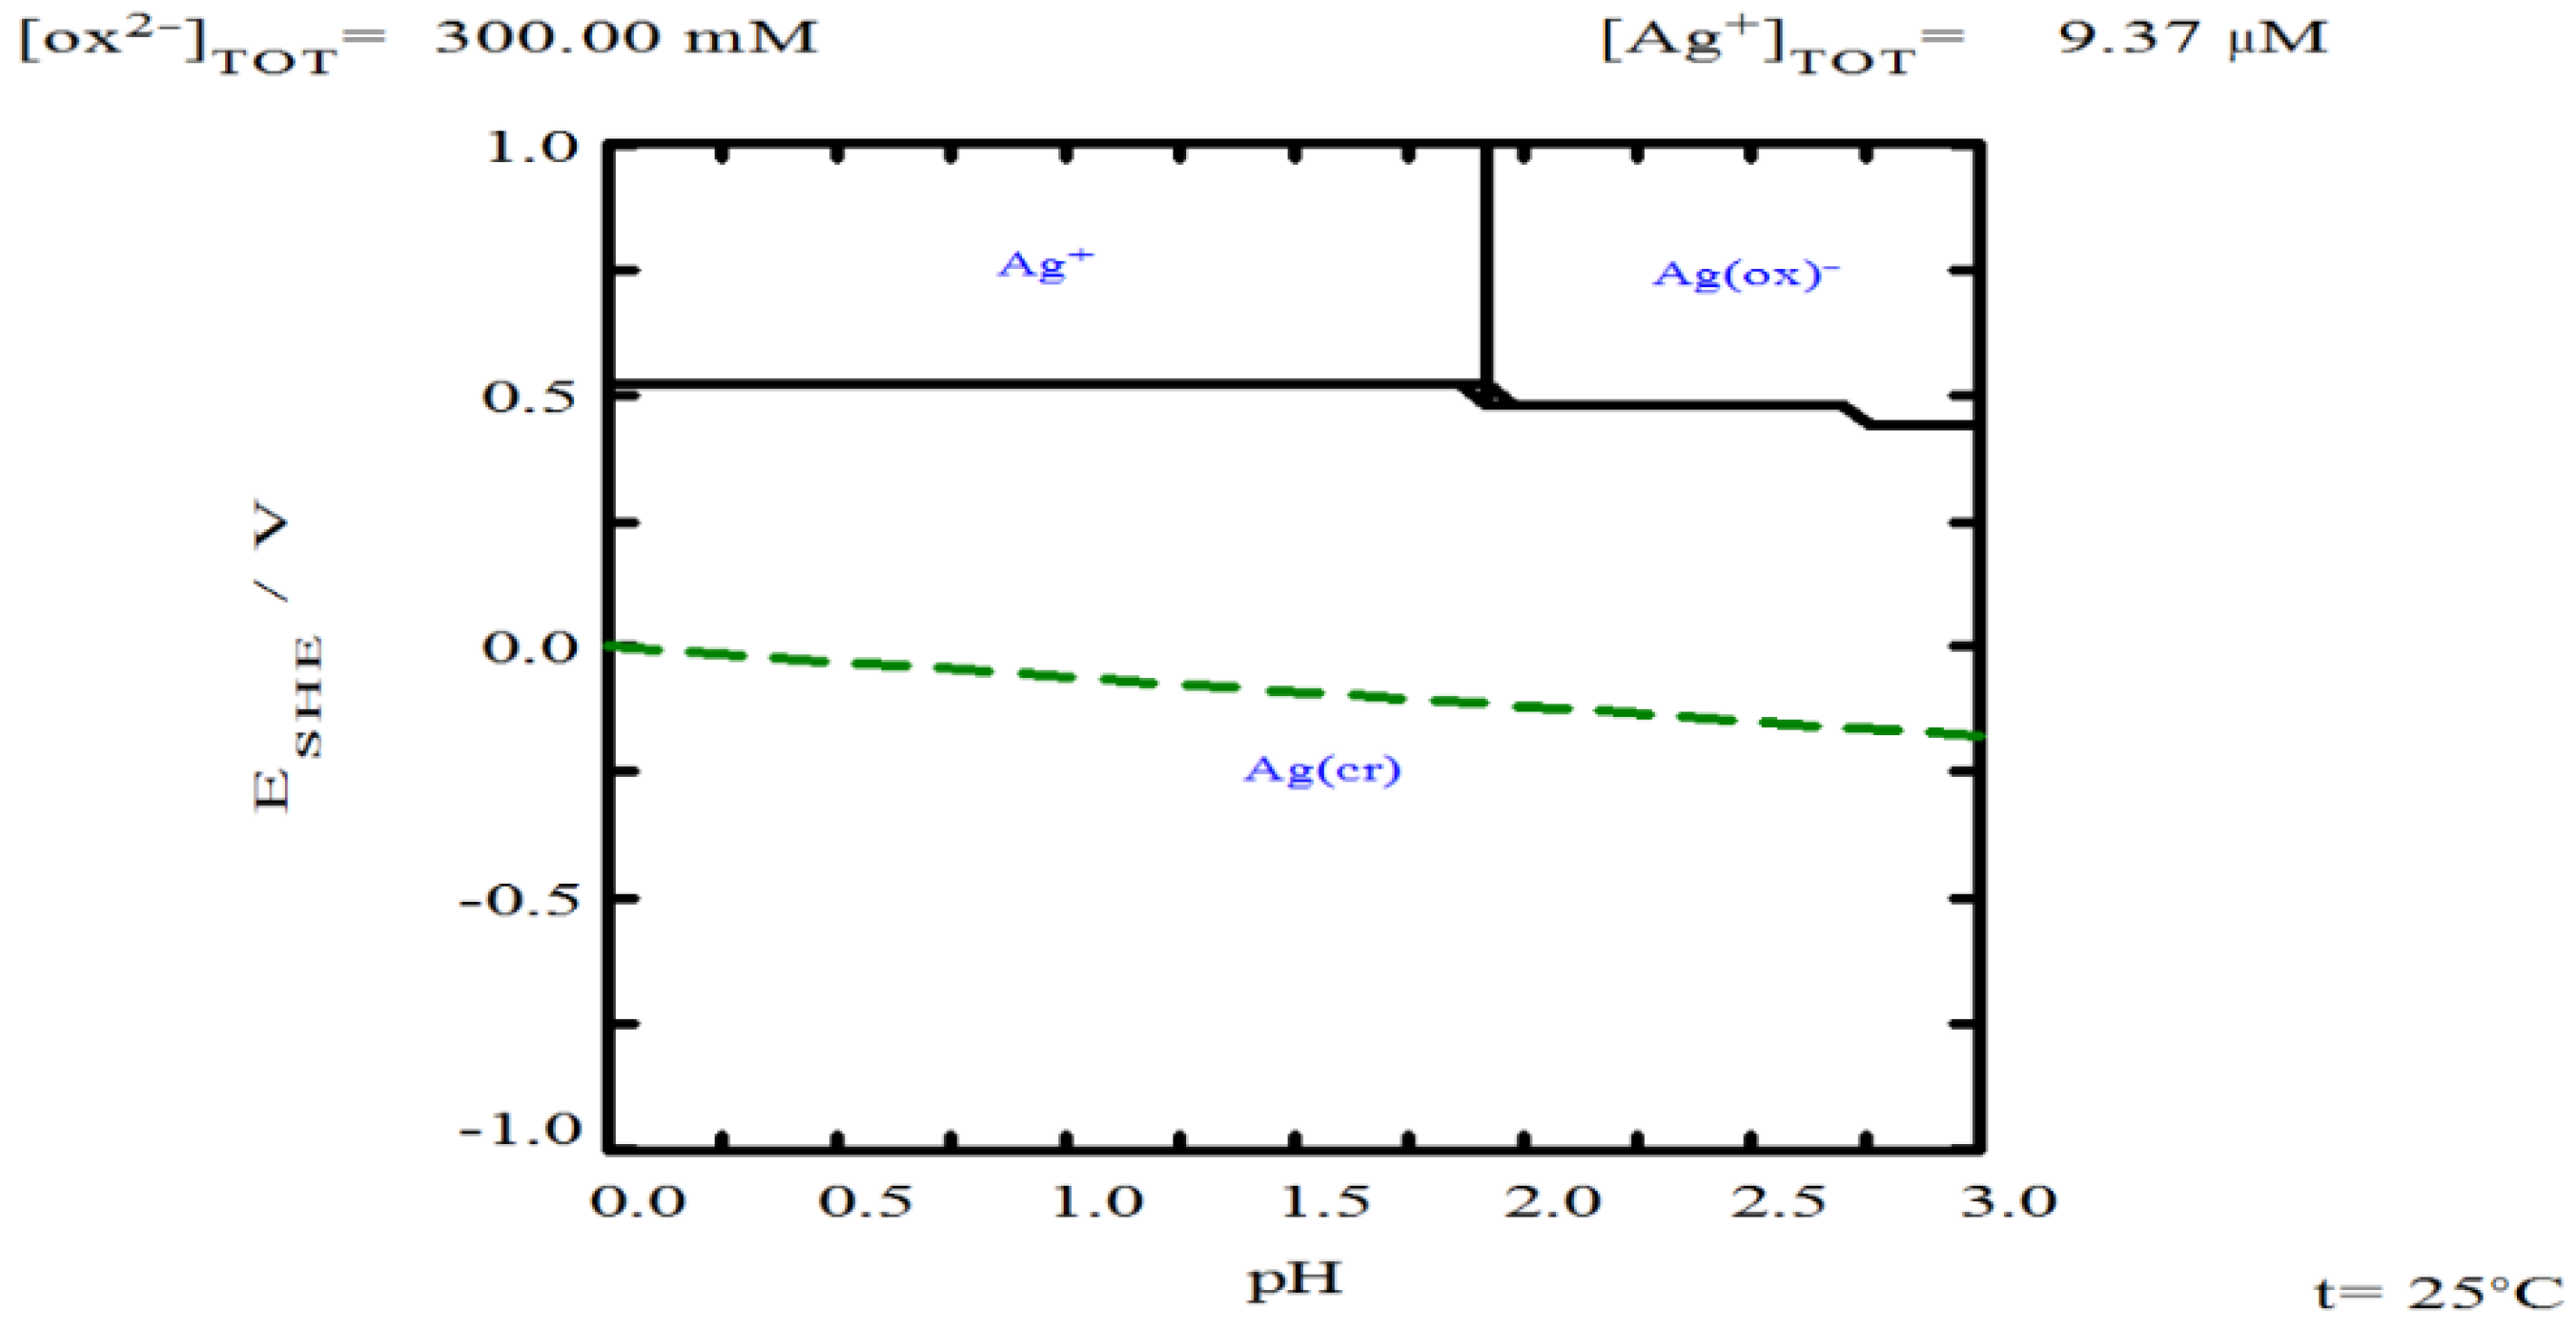
Figure 13.
Leaching curves for iron (a) and arsenic (b). Experimental conditions: [TU] = 0.2 M L⁻¹, [Ox] = 0.3, 0.2, 0.0012, and 0 M L⁻¹, sample = 10 g, pH = 2, T = 30°C, stirring speed = 600 rpm, solution volume = 0.5 L, particle size = -53 +37 μm.
Figure 13.
Leaching curves for iron (a) and arsenic (b). Experimental conditions: [TU] = 0.2 M L⁻¹, [Ox] = 0.3, 0.2, 0.0012, and 0 M L⁻¹, sample = 10 g, pH = 2, T = 30°C, stirring speed = 600 rpm, solution volume = 0.5 L, particle size = -53 +37 μm.
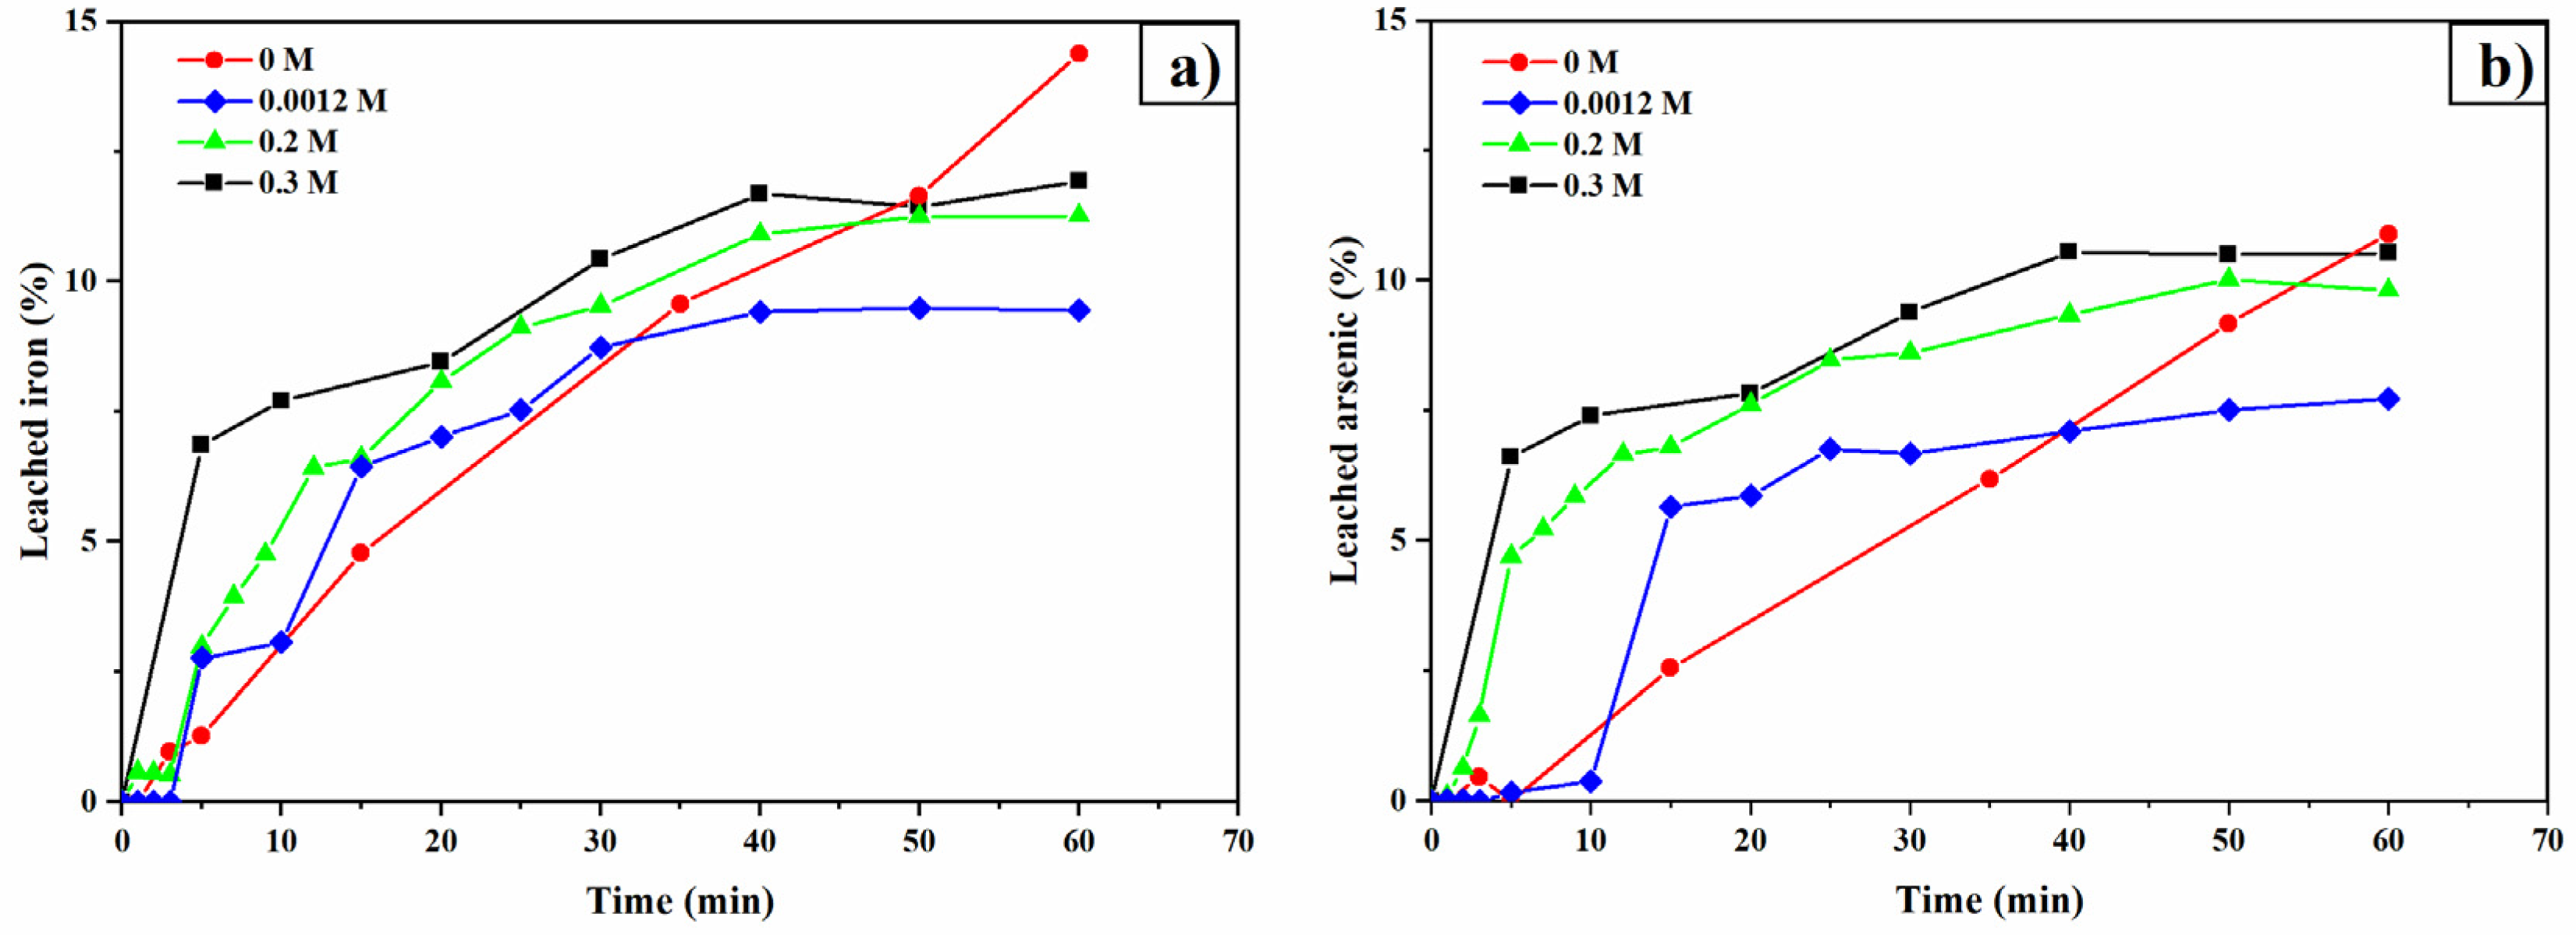
Figure 14.
Leaching curves for silver (a) and copper (b). Experimental conditions: [TU] = 0.2 M L⁻¹, [Oxalate] = 0.2 M L⁻¹, sample = 10 g, pH = 1, 1.5, and 2, T = 30 °C, stirring speed = 600 rpm, solution volume = 0.5 L, particle size = -53 +37 μm.
Figure 14.
Leaching curves for silver (a) and copper (b). Experimental conditions: [TU] = 0.2 M L⁻¹, [Oxalate] = 0.2 M L⁻¹, sample = 10 g, pH = 1, 1.5, and 2, T = 30 °C, stirring speed = 600 rpm, solution volume = 0.5 L, particle size = -53 +37 μm.
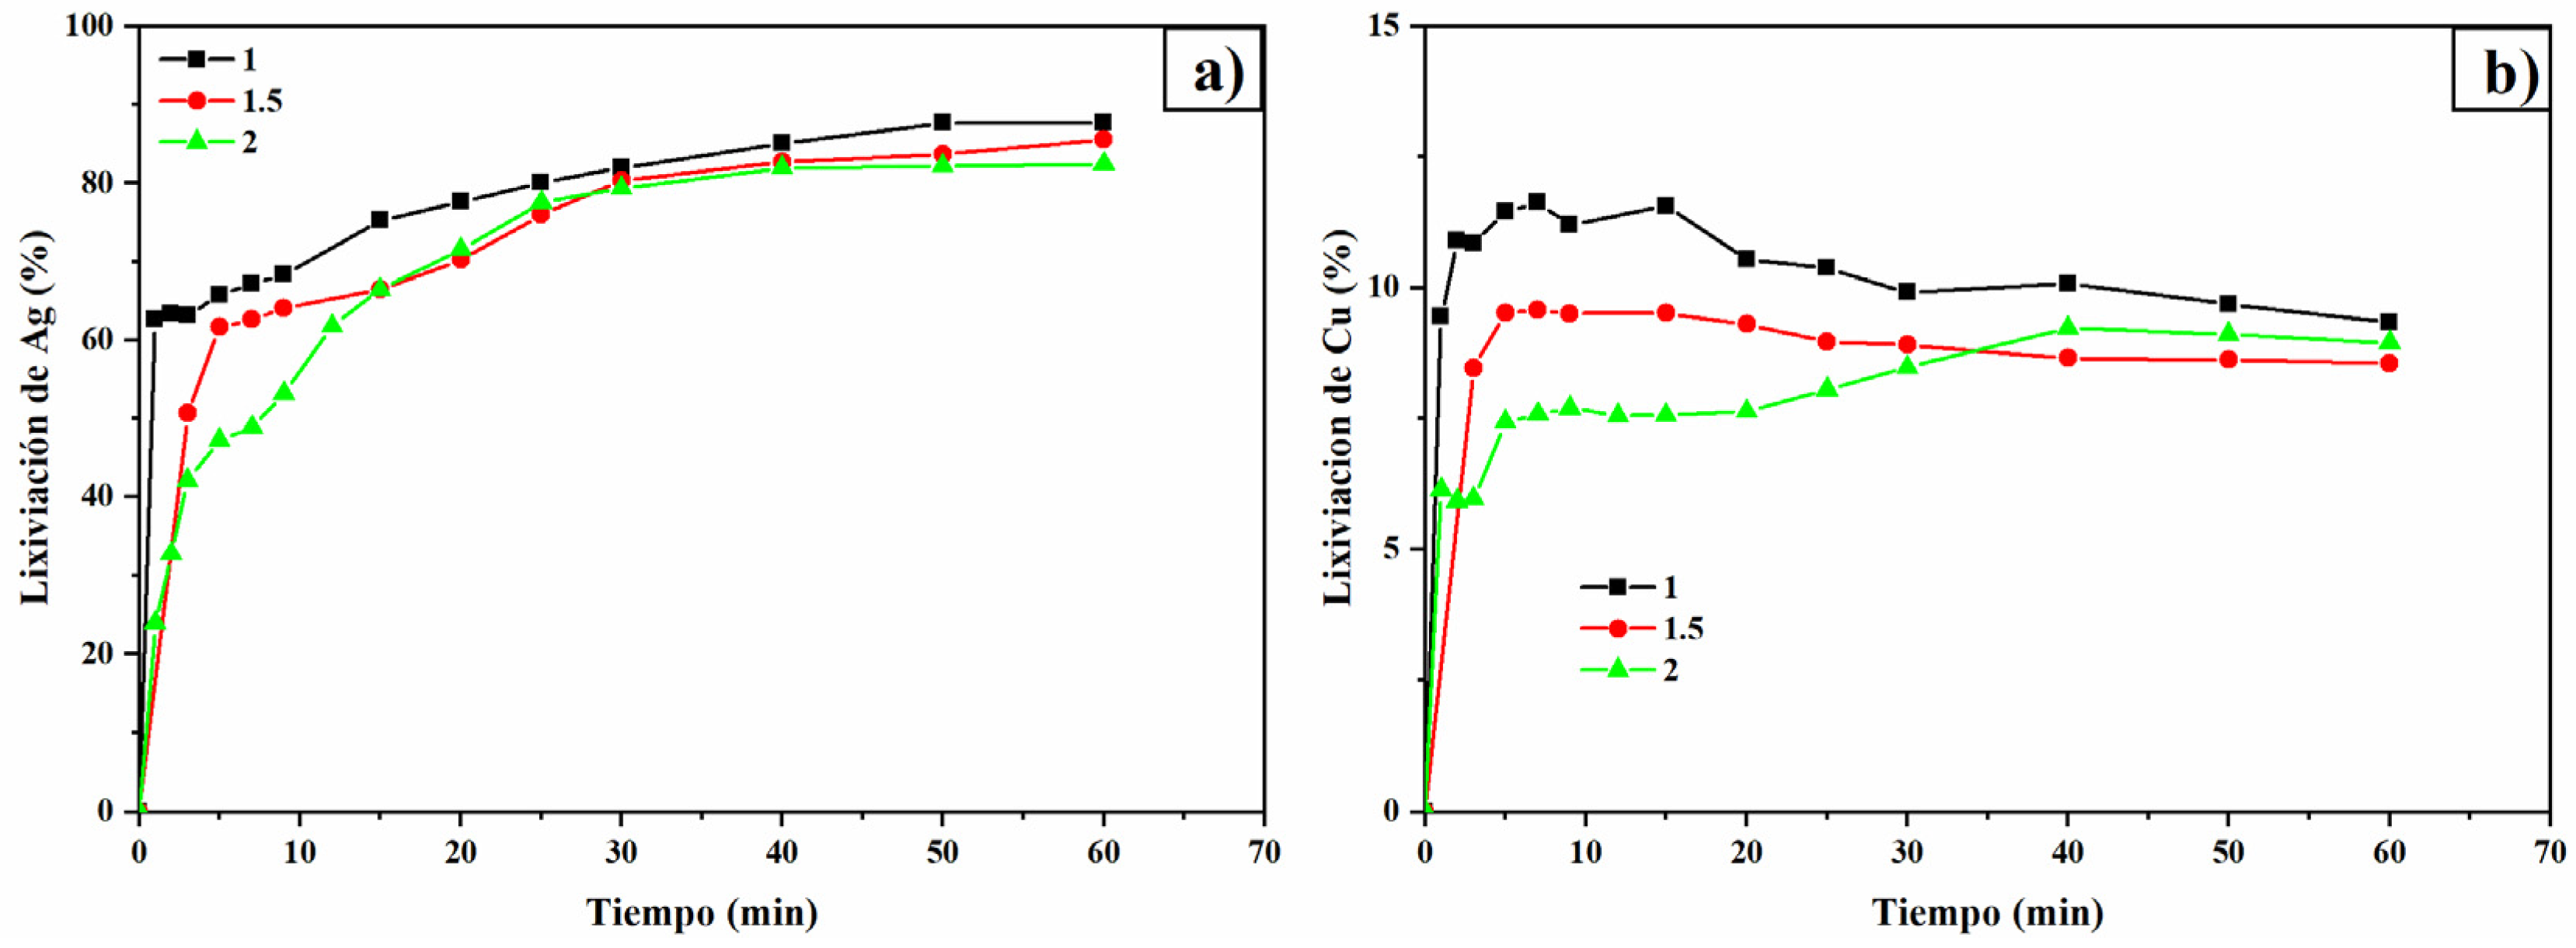
Figure 15.
Leaching curves for iron (c) and arsenic (d). Experimental conditions: [TU] = 0.2 M L⁻¹, [Oxalate] = 0.2 M L⁻¹, sample = 10 g, pH = 1, 1.5, and 2, T = 30 °C, stirring speed = 600 rpm, solution volume = 0.5 L, particle size = -53 +37 μm.
Figure 15.
Leaching curves for iron (c) and arsenic (d). Experimental conditions: [TU] = 0.2 M L⁻¹, [Oxalate] = 0.2 M L⁻¹, sample = 10 g, pH = 1, 1.5, and 2, T = 30 °C, stirring speed = 600 rpm, solution volume = 0.5 L, particle size = -53 +37 μm.
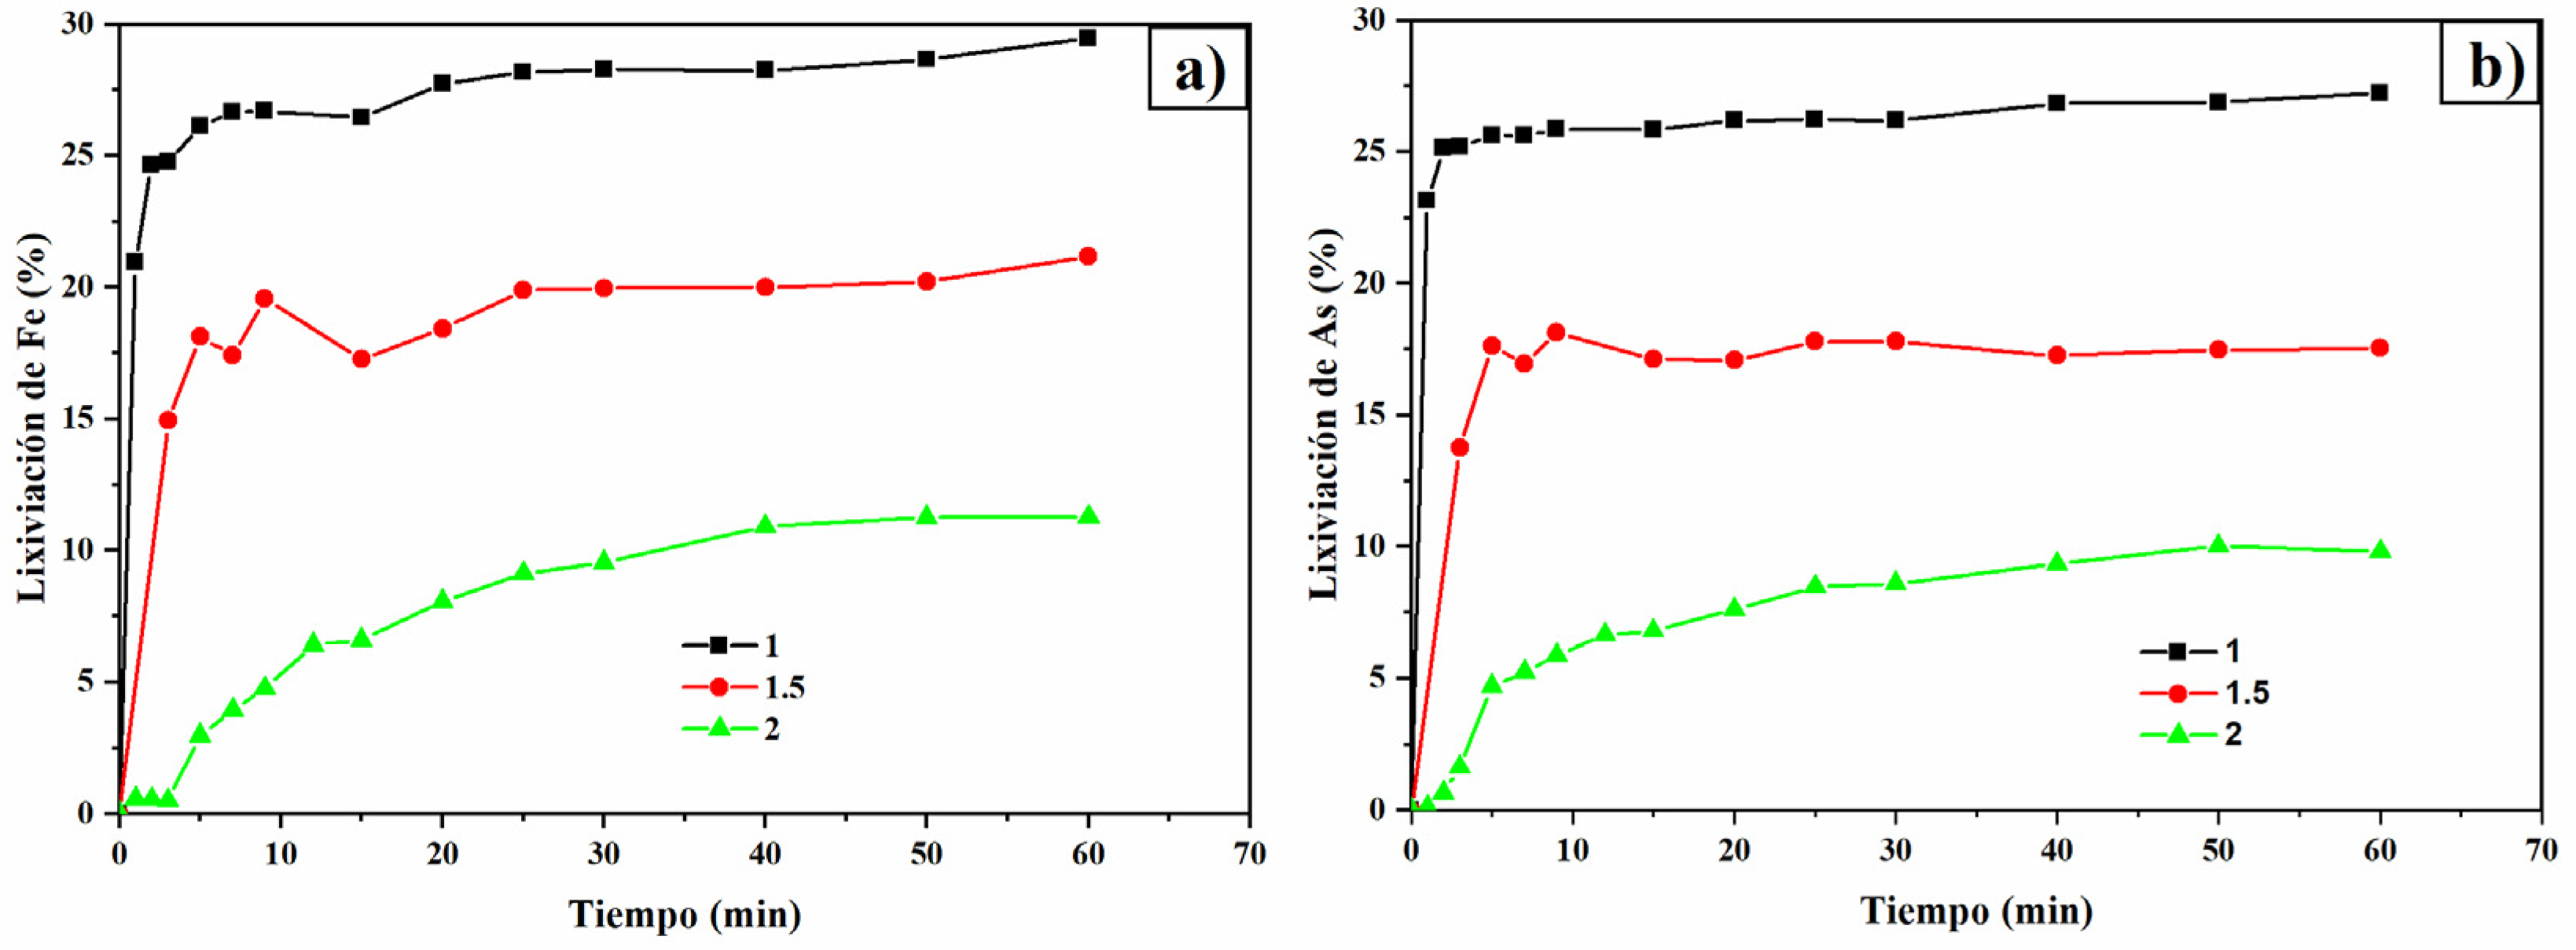
Figure 16.
Species distribution diagram for Fe with 0.2 M Oxalate as a function of pH. Conditions: 0.02779 M Fe and 0.2 M Oxalate at 25°C. Diagram generated using MEDUSA© software [59].
Figure 16.
Species distribution diagram for Fe with 0.2 M Oxalate as a function of pH. Conditions: 0.02779 M Fe and 0.2 M Oxalate at 25°C. Diagram generated using MEDUSA© software [59].
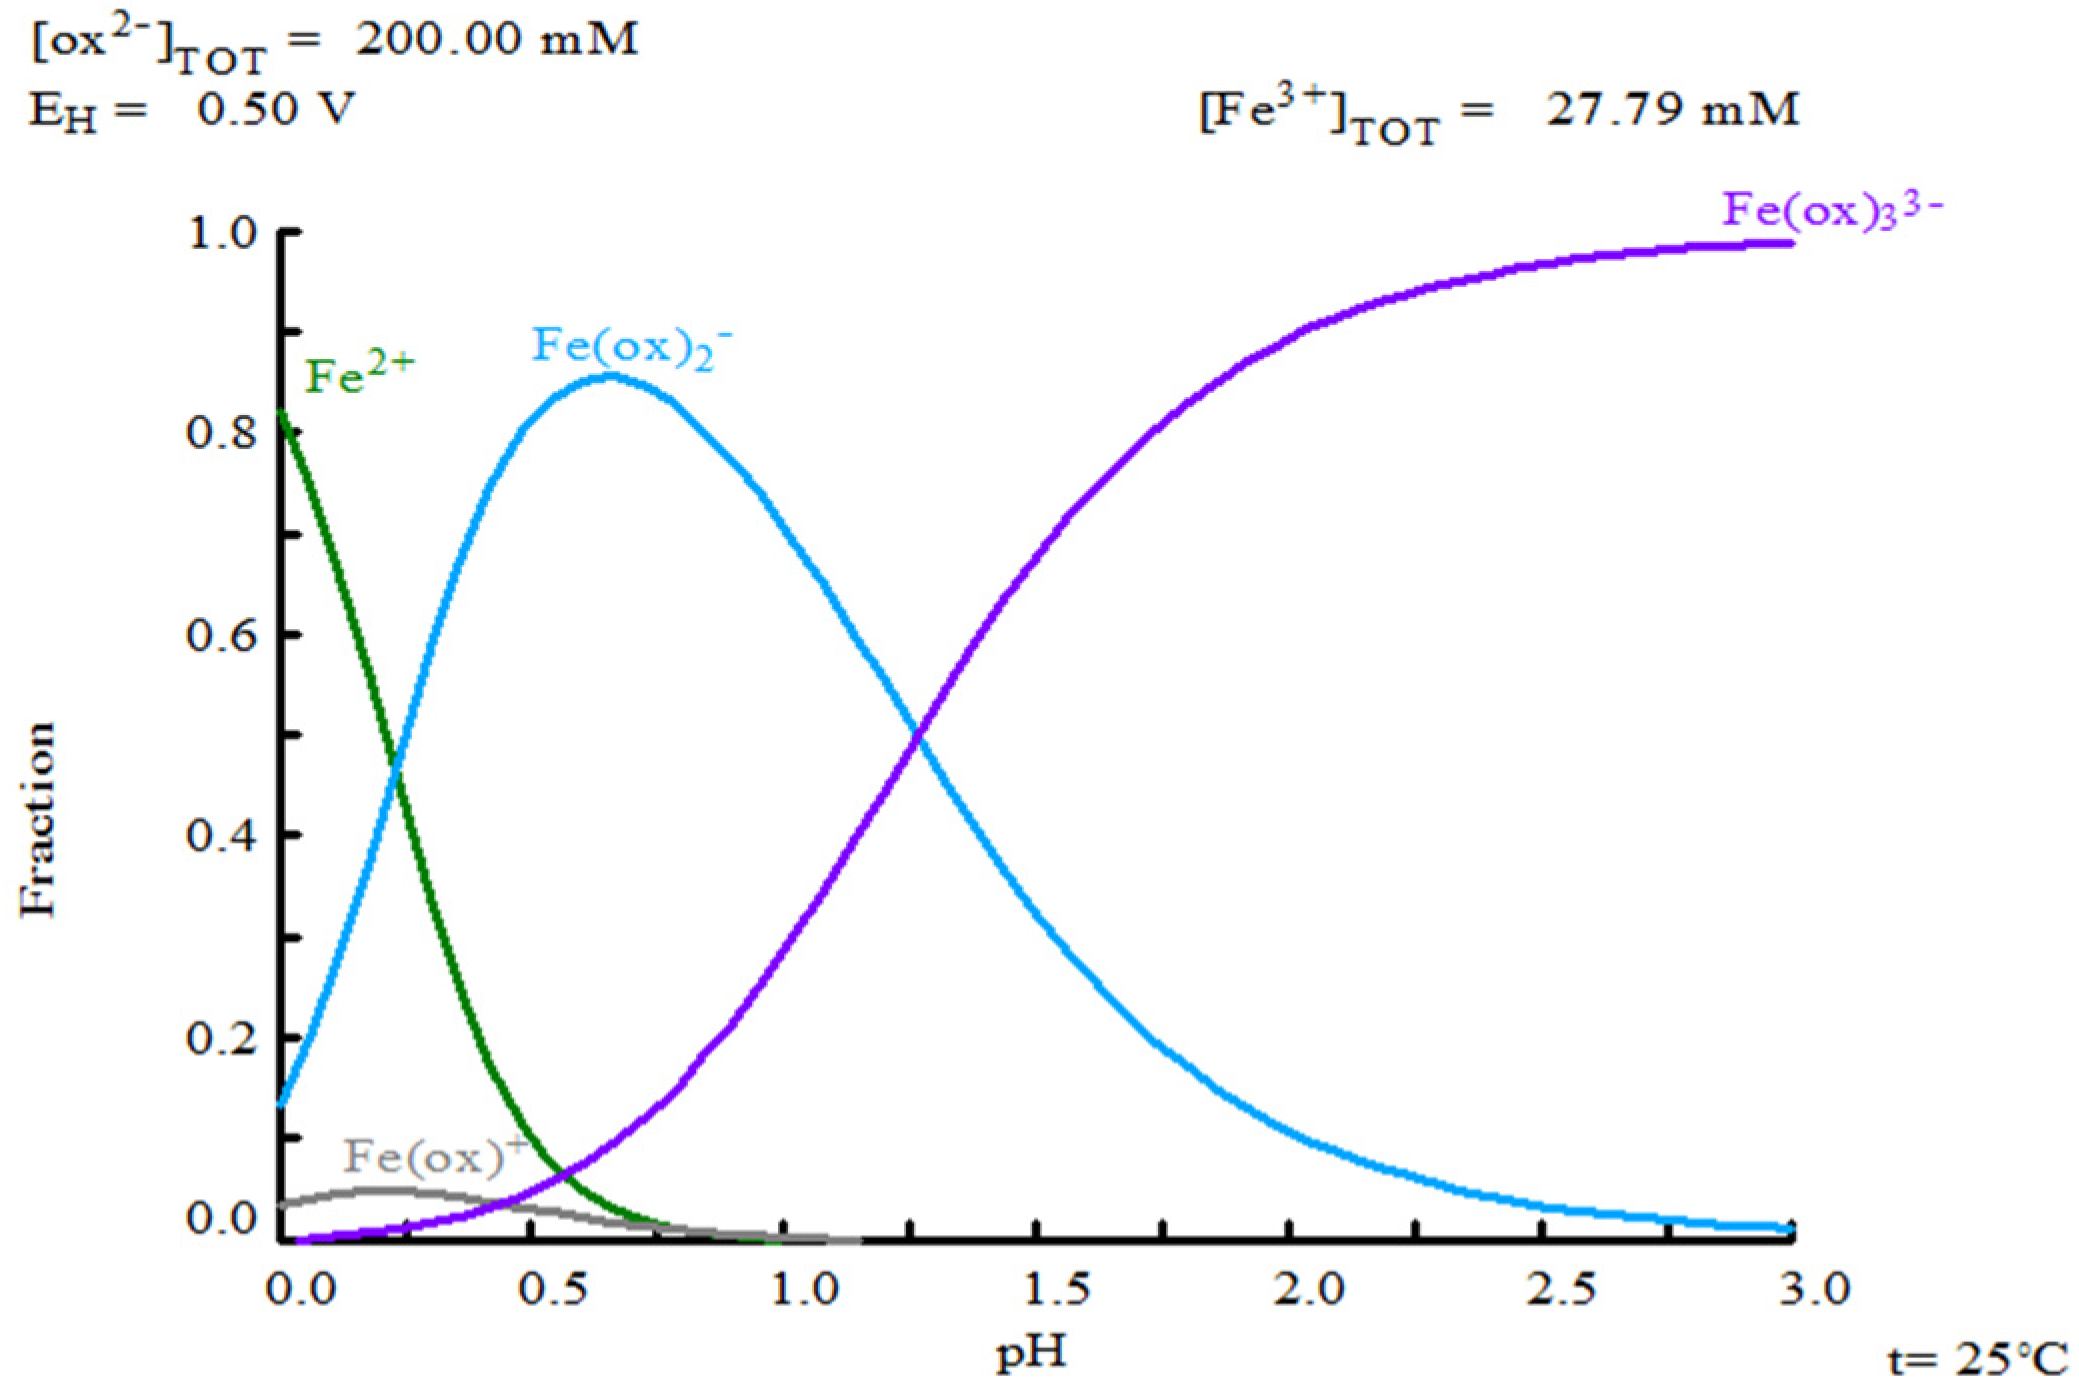
Figure 17.
Leaching curves for silver (a) and copper (b). Experimental conditions: [TU] = 0.2 M L⁻¹, [Ox] = 0.2 M L⁻¹, sample weight = 10 g, pH = 2, temperatures = 20, 30, and 35°C, stirring speed = 600 rpm, solution volume = 0.5 L, particle size = -53 +37 μm.
Figure 17.
Leaching curves for silver (a) and copper (b). Experimental conditions: [TU] = 0.2 M L⁻¹, [Ox] = 0.2 M L⁻¹, sample weight = 10 g, pH = 2, temperatures = 20, 30, and 35°C, stirring speed = 600 rpm, solution volume = 0.5 L, particle size = -53 +37 μm.
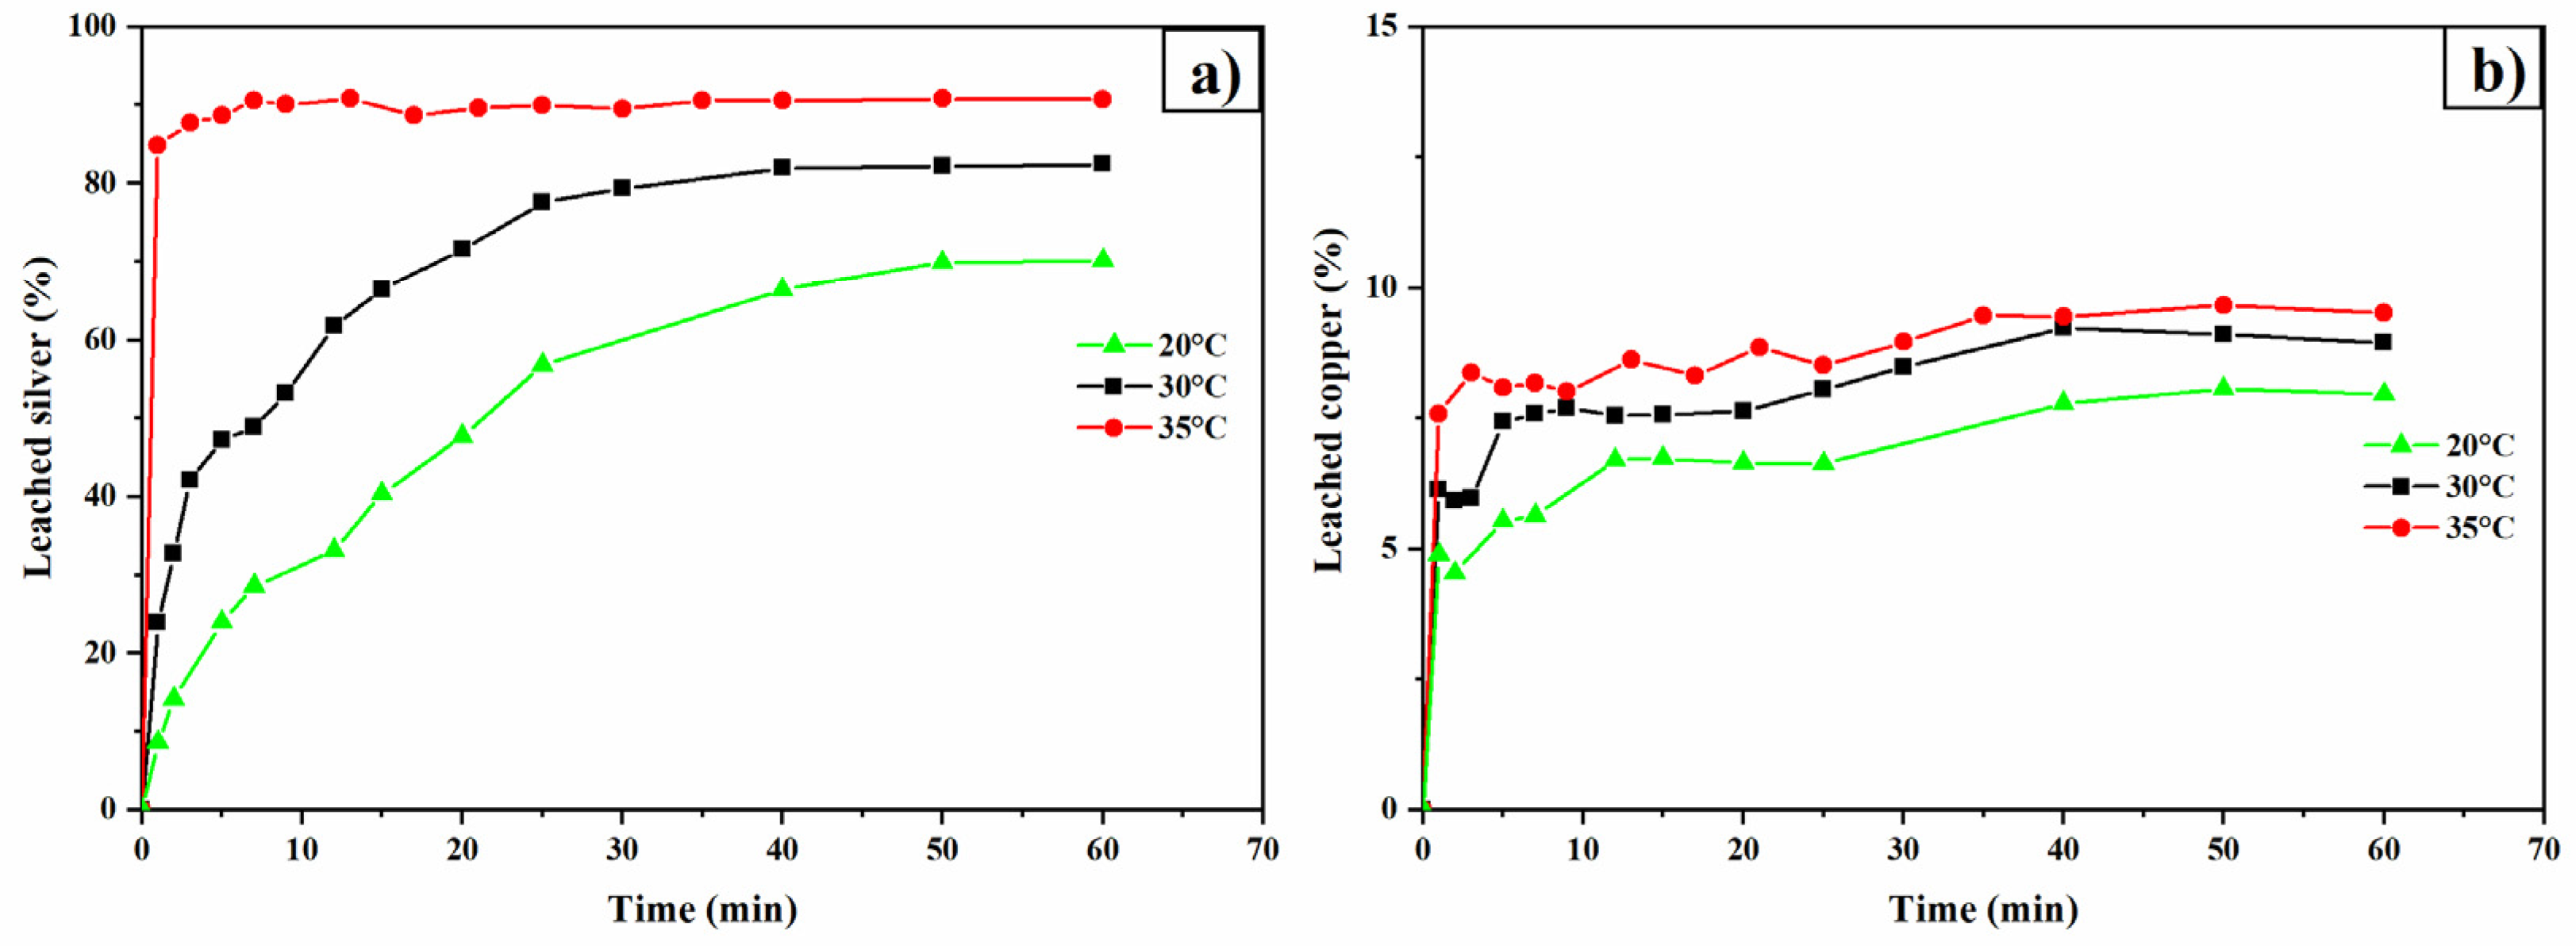
Figure 18.
Leaching curves for iron (c) and arsenic (d). Experimental conditions: [TU] = 0.2 M L⁻¹, [Ox] = 0.2 M L⁻¹, sample weight = 10 g, pH = 2, temperatures = 20, 30, and 35°C, stirring speed = 600 rpm, solution volume = 0.5 L, particle size = -53 +37 μm.
Figure 18.
Leaching curves for iron (c) and arsenic (d). Experimental conditions: [TU] = 0.2 M L⁻¹, [Ox] = 0.2 M L⁻¹, sample weight = 10 g, pH = 2, temperatures = 20, 30, and 35°C, stirring speed = 600 rpm, solution volume = 0.5 L, particle size = -53 +37 μm.
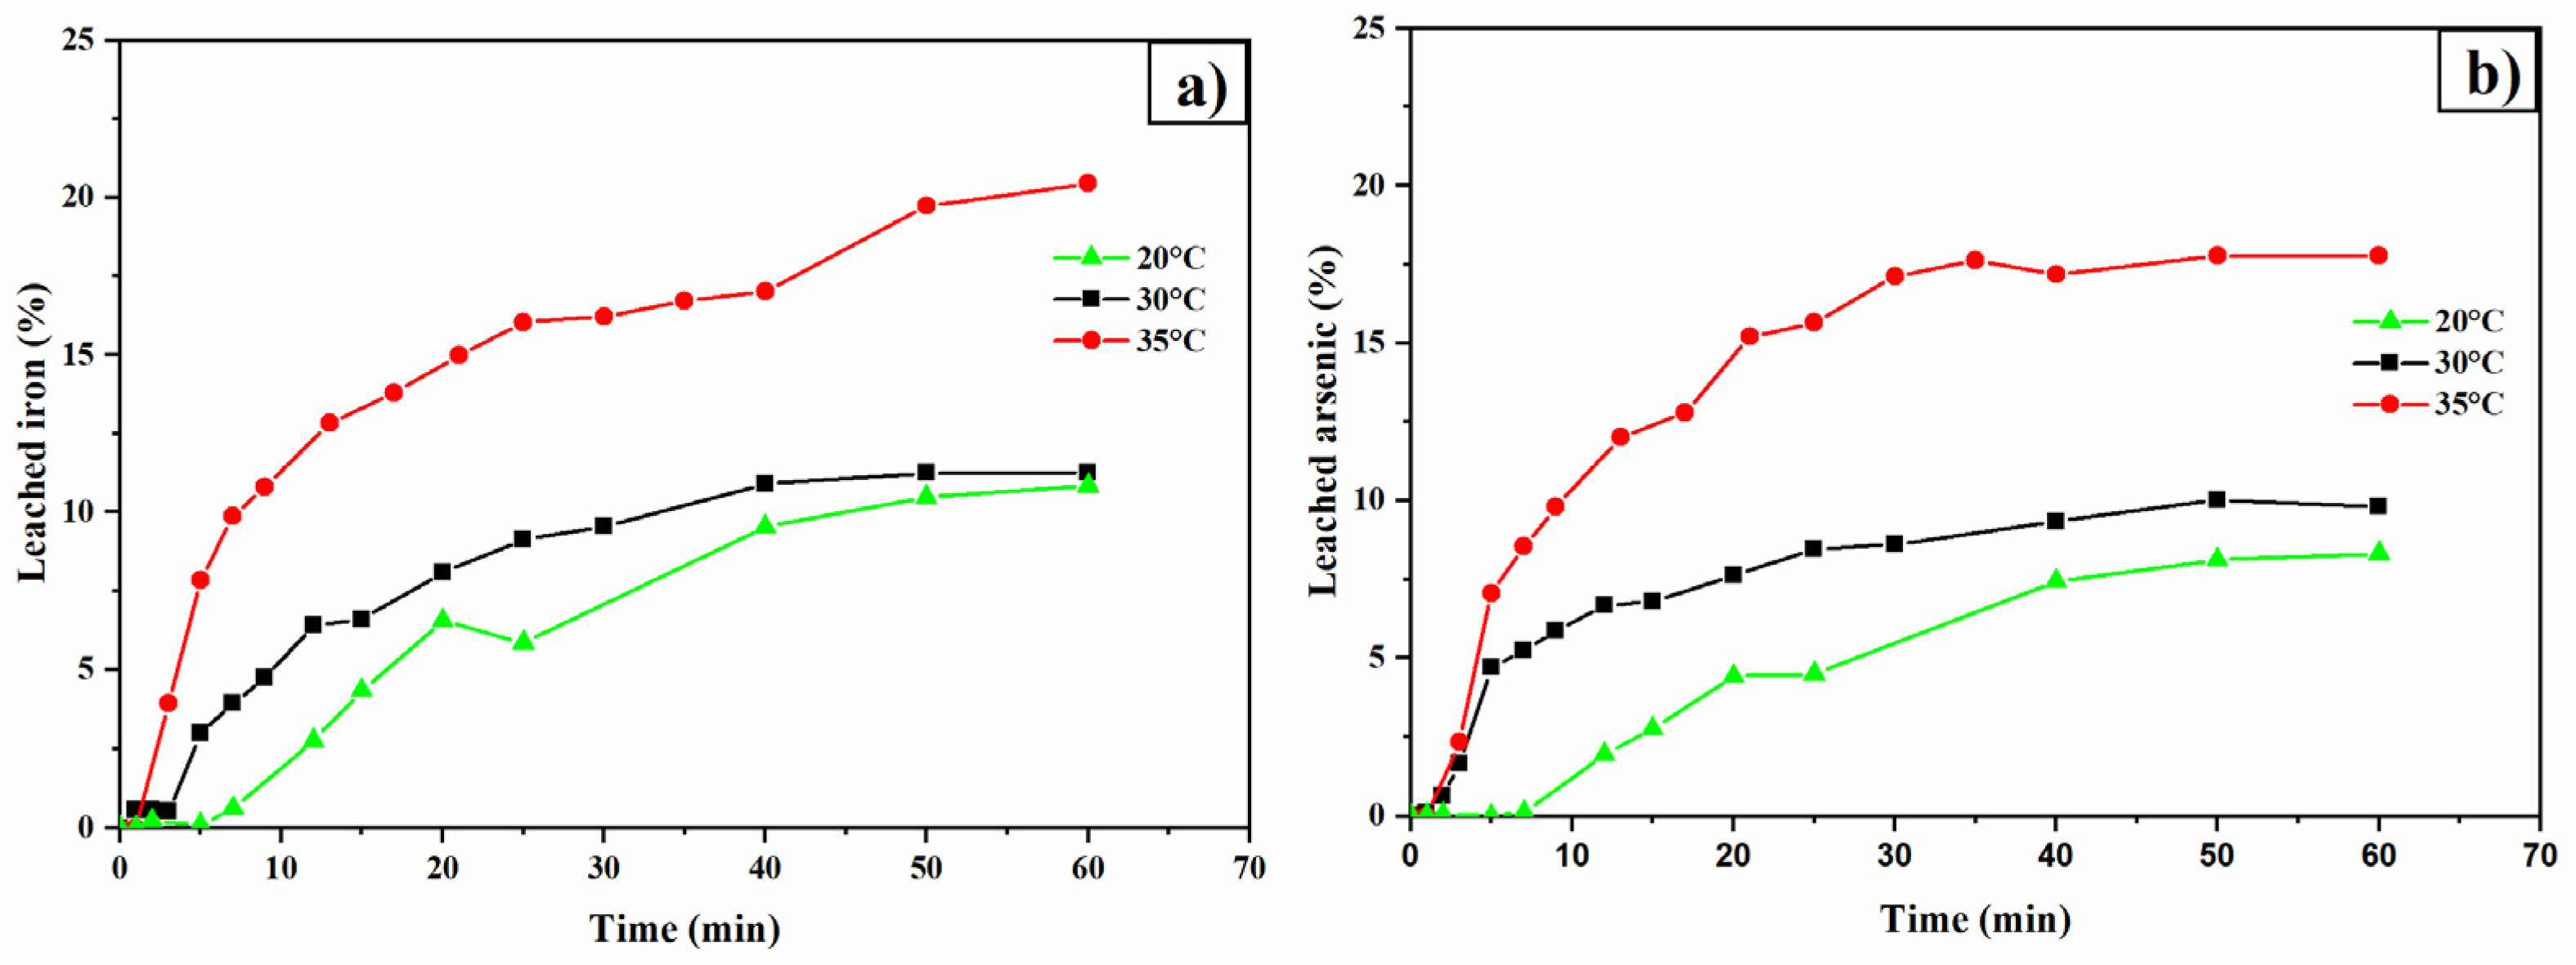
Table 1.
HCl addition for NP determination.
| Effervescence Degree (Carbonate Neutralization) | HCl 1 N Volume (mL) | |
|---|---|---|
| 0 hours | 24 hours | |
| None | 1 | 1 |
| Low | 2 | 1 |
| Moderate | 2 | 2 |
| Strong | 3 | 2 |
Table 2.
Elemental composition of tailings at different particle sizes.
| Particle Size (μm) | Elemental Composition (Kg/t) | |||
|---|---|---|---|---|
| Ag* | Cu | Fe | As | |
| >150 | 30 | 1.13 | 65.69 | 2.52 |
| -150 + 105 | 20 | 1.01 | 78.60 | 4.39 |
| -105 + 74 | 20 | 0.82 | 78.51 | 4.81 |
| -74 + 53 | 70 | 0.45 | 68.37 | 8.60 |
| -53 + 37 | 120 | 2.65 | 152.38 | 13.05 |
| <37 | 180 | 2.68 | 73.75 | 7.33 |
| *Composition expressed in g/ton | ||||
Table 3.
Distribution of Ag, Cu, Fe and As content at different particle sizes.
| Particle Size (μm) | (%) | |||
|---|---|---|---|---|
| Ag | Cu | Fe | As | |
| >150 | 17.06 | 28.18 | 25.07 | 14.10 |
| -150 + 105 | 10.91 | 21.99 | 26.20 | 21.49 |
| -105 + 74 | 6.03 | 10.98 | 15.95 | 14.34 |
| -74 + 53 | 20.54 | 5.32 | 12.20 | 22.55 |
| -53 + 37 | 15.39 | 14.18 | 12.43 | 15.63 |
| <37 | 30.08 | 19.36 | 8.14 | 11.88 |
Disclaimer/Publisher’s Note: The statements, opinions and data contained in all publications are solely those of the individual author(s) and contributor(s) and not of MDPI and/or the editor(s). MDPI and/or the editor(s) disclaim responsibility for any injury to people or property resulting from any ideas, methods, instructions or products referred to in the content. |
© 2024 by the authors. Licensee MDPI, Basel, Switzerland. This article is an open access article distributed under the terms and conditions of the Creative Commons Attribution (CC BY) license (http://creativecommons.org/licenses/by/4.0/).
Copyright: This open access article is published under a Creative Commons CC BY 4.0 license, which permit the free download, distribution, and reuse, provided that the author and preprint are cited in any reuse.


