
Submitted:
26 September 2024
Posted:
30 September 2024
You are already at the latest version
Abstract
This study aims to investigate the effectiveness of sustainable urban regeneration projects in mitigating Urban Heat Island (UHI). A place-based approach utilizing Geographic Information Systems (GIS) integrates spatial data and satellite imagery on the urban environment, human ac-tivity, demographics, and climate conditions, facilitating a deeper understanding of UHI dy-namics. Data-driven modelling with Machine Learning algorithms were developed to identify key variables influencing UHI effects, such as building density, greening extent, and surfaces’ albedo. A comparative pre- and post-intervention analysis in Turin (Italy), focusing on the Teksid ex-industrial area, was investigated. This analysis reveals a reduction in surface UHI intensity of -0.94 in summer and -0.54 in winter, highlighting the positive impact of mitigation strategies employed in the regeneration plan. The implications for urban and territorial policies were in-vestigated, focusing on urban planning tools for UHI mitigation. Specifically, the Local Climate Zones method was examined and compared with actual urban morphologies to find more effective and tailored solutions for policy makers and urban planners. The combined approach of geo-graphical and satellite information, Machine Learning models and Local Climate Zones joins quantitative and qualitative data, allowing to find more tailored, effective and alternative solu-tions in critical contexts such as the urban ones.
Keywords:
Urban Heat Islands (UHIs)
; Surface Urban Heat Island (SUHI)
; Remote Sensing
; Satellite images
; Geographic Information System (GIS)
; Data-driven modelling
; Machine Learning (ML)
; Local Climate Zones (LCZ)
; Settlement morphologies
; Mitigation measures
; Urban Planning
1. Introduction
The Urban Heat Island (UHI) phenomenon is of particular interest to the scientific community due to its significant impacts in large cities, including rising air temperatures and worsening air quality. UHI contributes also to health problems, thermal and air quality discomfort, and increased energy consumptions, particularly during the cooling season. These consequences are exacerbated by climate changes, leading to more global warming and extreme weather events. In 2022, the United Nations estimated that 2100 cities are experiencing twice the rate of warming compared to rural areas, causing substantial damages to both population and environment [1].
According to the United Nations Conference on Trade and Development's Handbook of Statistics 2023, the global urban population surpassed 8 billion in 2022, with 57% residing in urban areas [2]. Considering the ongoing population growth in cities, it is necessary to accelerate strategies and actions to mitigate UHI [3].
The UHI phenomenon has been known and studied for many years. Already in 1833, Howard demonstrated that urban areas influence local climate conditions by exhibiting higher air temperatures compared to nearby rural regions. In the London urban area, Howard identified the main causes for differences in air temperature between urban and rural zones [4]: i) higher human activities emitting heat in urban areas; ii) denser built environment in urban areas trapping solar radiation and obstructing the movement of wind and the heat exchanges by thermal radiation between the buildings and the sky; iii) greater presence of vegetation and moisture in rural areas. Oke continued Howard's studies on UHI and, in 1976, he postulated that urbanization creates two layers: the first, defined as “Urban Canopy Layer UCL”, is composed by the air trapped between buildings and is influenced by the materials and geometries of the built environment; the second, known as the “Urban Boundary Layer UBL”, consists of the atmosphere situated directly above the urban canopy [6,7]. Then, the urban heat island can be measured considering the UCL by the canopy urban heat island (CUHI or UHI) with standard air-temperature sensors or the UBL with thermal remote sensors on satellite platforms that observe the surface urban heat island (SUHI).
More recently, with urban expansion, cities have developed boundaries that are not clearly defined, leading to interpretative challenges in distinguishing heat islands between urban and rural areas. To address this uncertainty, Oke and Stewart [8] analysed the correlation between UHI effects and the recognizable typologies of urban contexts. Their analysis led to the identification of 17 Local Climate Zones (LCZs) based on combinations of built geometries and land covers. Moreover, Oke identified a strong correlation between the size of a settlement (measured by its population and human activities) and the magnitude of the UHI [7,8].
In this work, the case study of the city of Turin in North-West Italy was investigated and specifically with an in-depth analysis at the former industrial area of the Teksid company. The complete description of the urban environment was implemented thought Geographical Information System (GIS) data and remote sensing imagery. This analysis provided insights into SUHI intensity (SUHII) distribution, evolution, and drivers by integrating data from various sources with geospatial analytical methods. Then, data-driven modelling using Machine Learning (ML) techniques was used to evaluate the complex relationships between SUHI intensity and urban geometries, land use and urban materials, by uncovering hidden patterns in large datasets for the city of Turin. Finally, the LCZs method was associated with the settlement morphologies identified and regulated by the Regional Landscape Plan (RLP) of the Piedmont Region. This analysis added further insights into the SUHII variation according to typical urban morphologies across the study area, adding a practical approach for urban planners on UHI mitigation measures.
The aim of this work is to achieve a comprehensive approach to analyse the main effects of SUHI employing together GIS data, satellite images, data-driven modeling and the LCZs method.
Paragraph 2 describes the case study of Turin and the methodology. After the data collection, a geo-package was used to collect all information for the city of Turin and the main variables influencing the SUHII were identified. Through ML algorithms, the study addresses the real complexity of urban environment and the key determinants with their non-linear relationships with the SUHII were evaluated. The Random Forest ML algorithm was chosen for its ability to handle large datasets, manage complex data interactions, provide robust predictions, and offer insights into the intricate spatial and temporal dynamics of SUHII. Then, the SUHII was compared with the morphologies of LCZs.
Paragraph 3 describes the results of this methodology applied in the city of Turin. The characteristics of the city of Turin that influence the SUHII were identified, and the ML modelling was used to measure the impact of UHI considering the spatial distribution and the different seasons. Then, the ML model was applied to the LCZs showing similarities and it was used to estimate the effects of mitigation measures and compensative solutions that could be adopted in specific critical urban contexts with many constrains and regulations.
2. Material and Methods
The description of the methodology is presented in Figure 1. The methodology adopted in this work was guided by the state of art in Appendix A about the use of: i) a place-based analysis to describe the geo-localized characteristics of the urban environment with Geographic Information System (GIS) [10,11,12,13,14]; ii) remote sensing imagery completing the description of the features of urban environment and the SUHI [15,16,17,18]; iii) data-driven model to describe the SUHI with Machine Learning algorithm [19,20,21,22,23,24]; and iv) Local Climate Zones method to describe typical urban contexts and solutions to mitigate the UHI effects. A comprehensive methodological approach with these four elements has not been found in the literature.
The methodology adopted in this work is described in Figure 1.
The pre-modeling phase is one of the more important ones because it lays the foundations for subsequent analyses. Data collection was conducted, encompassing satellite images, urban data, climate variables, and land use patterns, to create geo-datasets of candidate variables for modelling SUHII. GIS tools and coding techniques can greatly simplify spatial data analysis when working on large spaces such as major cities. The time-period of the analyses was chosen on the basis of the pre- and post-requalification of the industrial area of the Teksid company with the years 2001 and 2018. All information for the city of Turin about 2001 and 2018 periods were collected, organized, cleaned and geo-localized to be used in the subsequent modelling phase of the work. In this way, the data were organized taking into account their spatial-temporal variability. The data for the years 2001 and 2018 were collected by spatial units approximately with the dimension of the buildings’ blocks of the city and also by month characterizing the different seasons. Then further data were pre-processed to find other variables that could influence the UHI effects. And finally, all data were organized in a geo-package containing various geo-datasets with the information for each territorial unit in the city of Turin. A first sensitivity analysis was used to identify the more SUHI-related variables.
The modeling phase began processing data from the geo-package with the aim to create a data-driven model to simulate SUHI intensity. The geo-package was divided in training and test datasets with an iterative process to enhance model accuracy. The Random Forest regression algorithm was selected for the data-driven modelling because of the possibility to use its plugin in ArcGIS Pro and because of its robustness in over-fitting. The performance of Machine Learning algorithms was optimized by tuning the hyperparameters, and finally, the errors were reduced by the calibration phase.
The SUHII model was applied to the LCZs, commonly used by urban planner. The association of LCZs with the typical urban morphologies of the city of Turin was applied and then, the characteristics of LCZs were correlated with the drivers of the SUHII model. This analysis offers deeper insights into the relationships between urban heat island effects and specific typical urban geometries, materials, and human activities. The use of urban planning practices together with the quantification of SUHII allows establishing a compensation system of mitigation measures. This can be useful in urban practice especially in very dense urban contexts where there are many constraints and standard mitigation measures cannot be adopted.
2.1. Investigation Area
Turin played a significant industrial role in Italy. The city was once a hub for automotive manufacturing with Fiat factories. This industrial past shaped the urban landscape and contributed to the city's economic development. In recent years, Turin has undergone a transformation with numerous regeneration interventions aimed at revitalizing the urban spaces left by industry. These interventions have focused on repurposing former industrial sites, integrating green spaces, and fostering innovation hubs. The city has embraced initiatives to enhance liveability, reduce pollution, and promote cultural and recreational amenities, marking a transition towards a more sustainable and resilient urban environment [25,26,27].
Moreover, the choice of the former Teksid area, situated in the Northern part of the city (in Figure 2), was driven by the necessity to examine UHI dynamics within the framework of urban regeneration initiatives. The notable industrial zone of Teksid played a pivotal role in steel production and, after its closure in 1992, has been undergoing through an extensive urban regeneration since the end of ’90 [28,29].
2.2. Data Collection and Pre-Processing
The data of the city of Turin were organized in datasets with the Geographic Information System (GIS) considering the following sources for the information of:
- -
- buildings, rivers, parks, greenings, public spaces, squares, parking areas, roads, … : BDTRE (Banca Dati Territoriale di Riferimento degli Enti, in Italian) 2018 - https://www.geoportale.piemonte.it/geonetwork/srv/ita/catalog.search#/search?any=BDTRE and the municipal technical map of Torino CTC 1999 (Carta Tecnica Comunale, in Italian) http://geoportale.comune.torino.it/geocatalogocoto/?sezione=catalogo ;
- -
- land use: Corine land cover 2000 and 2018: https://land.copernicus.eu/en/products/corine-land-cover/cha-2000-2006; https://land.copernicus.eu/en/products/corine-land-cover/clc2018;
- -
- population and families in 2001, 2011 and 2021 from the National Institute of Statistics (ISTAT in Italian): https://www.istat.it/notizia/aggiornamento-basi-territoriali-2021-2/ ;
- -
- climate data: weather station of Politecnico di Torino collected by the LivingLAB: https://smartgreenbuilding.polito.it/; other weather stations in Turin: https://www.arpa.piemonte.it/rischi_naturali/snippets_arpa_graphs/map_meteoweb/?rete=stazione_meteorologica.
About the use of remote sensing imagery, the Landsat images from NASA Open-Source Science Initiative were downloaded from: https://landsat.gsfc.nasa.gov/data/. In this work, for the data collection of satellite images "STAC API Browser” plugin of QGIS was utilized [30]. The pre-processing phase integrated the "Semi-automatic Classification Plugin" (SCP) addressing radiometric, geometric, atmospheric correction, and cloud masking tasks [31]. SCP capabilities significantly enhance the accuracy, reliability, and interpretability of raw satellite images.
The selected images represent the period when industrial morphology prevailed, dating back to 2001, providing a baseline for a comprehensive understanding of historical conditions. To accurately depict recent urban regeneration interventions in the pre-COVID-19 era, images from 2018 were chosen. This minimizes anomalies related to the pandemic influence on human activities considering also similar climatic conditions with the year 2001. Table 1 shows similar air temperatures and cloud cover conditions for both years, enhancing the analysis's comparability. Additionally, the selection process considered different seasons, including typical days in winter, summer, and mid-season, to maintain methodological rigor.
Then, a comprehensive geo-package with satellite images was created for calculating key variables to understand the dynamics of SUHI considering both spatial and temporal components [13].
The retrieval of data from Landsat 7 and Landsat 8 satellites was pivotal, given the long-term data record they offer [33]. Extensive temporal coverage is essential for historical analyses and understanding trends in UHI.
The shapefiles of the European model proposed by EAGLE (https://eagle-science.org/about/) have been utilized to directly calculate the variables using satellite bands. Regional topographic database (BDTRE) and other geo-datasets were used to enrich the variables with geometrical, thematic and population data. Most of the variables that characterize the buildings, and the geometry of the urban environment were calculated from the BDTRE and Corine Land Conver; as an example, the building density was calculated with the Kernel SAGA QGIS tool [33] using the BDTRE. Furthermore, novel insights extracted from satellite imagery (Copernicus and “Telerilevamento Piemonte” in Italian) have been added and cross-referenced with cadastral mapping parcels. To ensure compatibility of the data maintaining the accuracy, the territorial unit utilized is a cell size of 30 m x 30 m.
A comprehensive geo-package is crucial for calculating key variables necessary to understand the dynamics of SUHI development at territorial scale.
2.3. Candidate Variables
A sensitivity analysis on the variables elaborated in the pre-modeling phase allowed the insight of candidate variables considering them as potential inputs for the upcoming modelling phase; for each variable, formulas and references have been indicated in Table 2. Moreover, the identification of these variables aimed to optimize the model's predictive capabilities and ensure its effectiveness in capturing the SUHII development in the Municipality of Turin.
Satellite imagery—with its spectral bands—contributed crucially to the calculation of the SUHII. Landsat 7 and 8 data have unique spectral characteristics and band configurations, leading to variations in the sensitivity and response of each band to different surface features. In fact, most of the variables were calculated using the different bands of satellite images in the “raster calculator tool” within QGIS. Other variables, such as the Sky View Factor and building density, were calculated using the BDTRE and other sources and processed by plugins within QGIS environment [34].
To automate the process, Python scripts have been developed using QGIS Python console, considering that the calculations have been performed for each of the variables listed in Table 2. This process involved 6 selected Landsat images for the three seasonal days of 2001 and 2018 and all census sections and cells 30 m x 30 m (i.e., 144,826 cells) of the city of Turin. These scripts (in Supplementary Materials) allowed the automatic execution of the analyses by simply modifying the file paths corresponding to Landsat 7 and Landsat 8 bands.
A distinct method was employed for the variables measured by the weather stations, where data were point-specific and their interpolation was necessary. To address this concern, Kriging interpolation was operated utilizing the “Smart Map” plugin in QGIS [35]. Kriging interpolation is a geo-statistical technique offering a robust means of filling gaps and generating continuous spatial representations [36]; it is widely acknowledged as the most effective multiquadric method for unbiased interpolations [37]. Also, the Kernel Density Estimator (in the ArcGIS Spatial Analyst) was used to represent the BCR considering its spatial probability of concentration.
In this work, the use of many geographical raster and shape files caused non-uniform spatial properties, requiring a harmonization process to ensure the consistency of the modeling. This process involves reprojection and resampling techniques to align all raster data. By harmonizing the spatial properties of the raster files, a unified geo-package (with geo-datasets) was generated, facilitating seamless integration into the process. Some examples of spatial representation of the candidate variables are presented in Figure 4 and Figure 5.
Figure 4 represent the Kernel analysis on Building Coverage Ratio (BCR) which provides information on the extent of built-up areas in the city of Turin in 2001 and 2018. High BCR values indicate a greater concentration of built areas. The comparison between the images in the years 2001 and 2018 shows a different accuracy due to different geographical information from different BDTRE cartographies; overall, there is an increase of BCR especially in the peripheric areas of the city of Turin.
In Figure 5, the Normalized Difference Vegetation Index (NDVI) is represented. The NDVI was elaborated from satellite imagery to assess the density of green vegetation. It was calculated using the information of near-infrared (NIR) and RED wavelengths (as shown in Table 2) and is expressed on a scale from -1 to 1. By analysing the image in 2001, in Turin the NDVI is near 0, meaning concrete, sand or rock with low presence of vegetation. However, due to regeneration processes occurring throughout Turin's municipality, there's a noticeable increase in vegetation density in 2018 up to values near to 1.
2.4. Evaluation of the Surface Urban Heat Island Intensity (SUHII)
The SUHI phenomenon was quantified using Land Surface Temperature (LST) values within the area of analysis, the Turin’s Municipality. The solution adopted in this work was to use the SUHII to distinguish automatically the boundary between the centre urban area and the suburbs; this solution allowed not depending on the definition of urban and peripheric-rural areas. The SUHI intensity was calculated by subtracting the local LST value from its mean value and then dividing by the dispersion of LST data around the mean value (i.e., standard deviation) [46]:
A positive SUHII indicated warmer LST compared to the average value in Turin’s area, usually highlighting intensified urban areas, while a negative value suggested colder LST in the surroundings peripherical areas. This approach enabled context-independent assessments of LST variations, facilitating meaningful comparisons across diverse landscapes.
The SUHII elaborated from satellite imagery for the city of Turin and its surroundings is represented in Figure 6. SUHII is notably pronounced in areas characterized by significant industrial activity, high building density, and no vegetation. Conversely, in some areas, where regeneration efforts have been undertaken, improvements in SUHII are evident with cooling effects, indicating a mitigation of the UHI effects. One of these areas is the ex-industrial Teksid area (with a grey contour).
2.5. Correlation Analysis with SUHII
To calculate the relationships between two datasets, for example SUHII and the variable X, the Pearson’s correlation coefficient r was used:
This coefficient is one of the most used and simple methods to evaluate the linear correlation of each variable with the SUHII; in this work r was evaluated for a first sensitivity analysis considering all the census sections and cells 30 m x 30 m of the city of Turin. The main limitation of the Pearson’s coefficient is that it considers linear correlations which does not always describe the complexity of the urban environment.
2.6. Machine Learning Modeling
In this paragraph, the modeling developed to calculate the SUHII is presented. It was chosen a data-driven model with ML Random Forest algorithms due to the opportunity to use an ArcGIS Pro plugin and its ability to manage a large amount of data, capturing the intricate patterns and non-linear relationships between variables within an urban area [35]. Before integrating parameters into the Random Forest algorithm, a crucial step involved the tuning of hyperparameters using libraries such as Optuna and Scikit-learn [49]. This process optimizes the model's performance by systematically exploring and adjusting hyperparameters (e.g., variables’ range, leaf size and tree depth), ensuring the algorithm operates at its best.
The geo-package was organized with SUHII as the target variable and the other data and calculated variables as predictors. Following, the geo- package was split into training (80%) and testing datasets (20%), so that, firstly, the Random Forest regression model was trained to learn the relationships between predictor variables and SUHII data. Subsequently, the trained model was validated using the testing dataset, employing metrics such as Mean Squared Error (MSE), Root Mean Squared Error (RMSE), and R-squared. Model's accuracy and reliability was then improved with the calibration phase and the adjustment of some input parameters-variables. The final model was finally used to simulate the SUHII in past, present, and future scenarios.
Figure 7 illustrates the operational framework of the SUHII data-driven modelling with Random Forest (RF) algorithm. Starting from the input data organized in a geo-package, the model uses Machine Learning algorithms to simulate SUHII combining variables and, with iterative processes, trying to reduce the errors between the measured and predicted SUHII. The RF model uses multiple decision trees that are generated using various combinations of data. Each tree acts as a decision-making unit, considering variables such as:
- -
- the leaf (node) size that is defined by the minimum number of variables, when the tree stops splitting;
- -
- the tree depth that is the number of levels a decision tree can have.
The final model decides by averaging the predictions from each tree. The more trees there are in “the forest”, the more accurate and robust is the final prediction.
To perform the RF algorithm, it was used the ArcGIS Pro tool called “Forest-Based Classification and Regression” [49] with a common personal computer. This tool has the purpose to implement both training and test datasets and to develop the predictive model using a large database as the one for a city. Subsequently, the results of the predictive model were compared with the SUHII processed by satellite images; the residuals analysis aims to uncover any disparities between the observed and predicted values.
During the modeling phase, six predictive models were evaluated, encompassing three seasons for the year 2018 (winter, mid-season and summer), and other three seasons for the years 2000-2001. This choice aimed to comprehensively assess and measure the SUHII across different seasons and years; then, the models together gain a more holistic understanding of the SUHII dynamics, capturing spatial variations and trends over the time.
2.7. The Urban Heat Island Effects of Local Climate Zones and Settlement Morphologies
This paragraph examines the application of the qualitative method of Local Climate Zones (LCZs) method, as firstly defined by Stewart and Oke [9], at the actual settlement morphologies m.i. (“morfologie insediative” in Italian) of the Regional Landscape Plan (RLP) for the City of Turin. The aim was to quantitatively evaluate similarities of LCZ and m.i. characteristics with the SUHII values.
During the initial phase, some atypical LCZs were excluded for Italian cities, such as LCZ 1 (high-rise business districts) and LCZ 7 (informal settlements).
Then, the thermal, radiative, and metabolic properties of each LCZ were assigned to the settlement morphologies m.i.. Thermal properties of LCZ were quantified with:
- -
- surface admittance, the surface's capacity to exchange heat that is influenced by material type, orientation, soil moisture, and wind velocity,
- -
- radiative properties, indicated by surface albedo, describe the ratio of reflected to incident solar radiation, which depends on surface colour, roughness, and moisture content and
- -
- metabolic properties, quantified as anthropogenic heat output, representing the annual average heat flux from human activities and fuel combustion.
Similarities between LCZs-m.i. characteristics and SUHII values were analysed and, finally, typical mitigation interventions were proposed highlighting their thermal, radiative and metabolic properties.
The aim of this analysis was to understand if the SUHII model could be used together with LCZs and m.i. to quantify the effects of different mitigation interventions to access more tailored urban planning strategies.
3. Results
This section presents the findings from the analysis aimed at quantifying variations in SUHII across the municipal area of Turin and the industrial Teksid district from 2001 to its ex-industrial period in 2018.
Firstly, the variables influencing SUHII were calculated, and the 17 most correlated ones were identified in Turin and in the ex-industrial Teksid area. The contribution of each variable to SUHII was quantified using Pearson’s correlation coefficients (r) and Random Forest (RF) Importance Scores.
This systematic analysis provides a comprehensive understanding of the variables driving the SUHI phenomenon, which is crucial for urban planning and the development of effective UHI mitigation strategies. These strategies are proposed through the methodology of associating LCZs with urban morphologies, and then overlaying these with the SUHII map.
3.1. Linear Correlation Analysis between SUHII and Urban Variables
To calculate the relationships between two variables, one of the simplest and most used method is the Pearson’s correlation coefficient r. This coefficient evaluates the linear correlation of each variable with the SUHII. Table 3 reports the results obtained by grouping 1000 SUHII values and averaging all the data. Averaging the data, disturbing factors or anomalous data become negligible. Table 3 shows the field of application and the Pearson’s correlation coefficient of the main analysed variables for the City of Turin considering each cell 30 m x 30 m (i.e., 144,826 cells). The variables with low correlation were not reported (as for example the heat loss surfaces and the heights of buildings). It is possible to observe that there is a positive correlation (the SUHII increase with the increase of the variable) with NDBI, representing the built-up density, NDWI indicating the water content, BD the building density and V the buildings’ volume. Instead, there is a negative correlation with the presence of: vegetation (NDVI) and vegetation considering also atmospheric variations (PVI), moisture (NDMI), emissivity of the surfaces (EMISSIVITY), albedo (ALBEDO), the capacity of surfaces to reflect solar radiation and emit thermal radiation (SRI), and the sky view factor (SVF). About the Sky View Factor, buildings’ density and buildings’ volume, the correlations with these values are very low. These correlations are tailored for the City of Turin and valid only for this case-study but this methodology can be applied to other cities.
In Figure 8, the dependence of the SUHII with the change of the variables in Table 4 was tested confirming the sign of Person’s correlations. The trend is clearly defined by the high coefficient of determination R2 with some exceptions for very low and high SUHII values when other variables influence the UHI effects.
The independence of the variables was tested, and a multilinear regression for the evaluation of SUHII was investigated. The results of this analysis are shown in Figure 9 where NDVI, NDBI, ALBEDO and PVI are the only independent variables with a p-value lower than 0.05 and the multilinear regression for SUHII has a good coefficient of determination R2 = 0.9872 (close to 1).
3.2. SUHII Modelling with Random Forest Algorithm
The variables collected by the geo-package were processed by the RF algorithm after having optimized its performance with the Optuna tool. Table 4 describes the results of the optimization phase of the RF modeling by Optuna tool. These hyperparameters were identified to reach the best performance in the training and test phases of the modeling. With RF algorithm, the accuracy depends on the number of trees, then high values are expected; the number of randomly sample variables was 4 and 5 for the years 2001 and 2018 respectively, considering that the total variables were more than 17; the leaf size represents the number of sub-samples in each tree’s node (the leaf size means the number of variables to be changed in the iterative process); the tree depth is the number of levels of the tree.
To improve the accuracy of the RF model, the Mean Squared Error (MSE) and the Root Mean Squared Error (RMSE) were calculated. In Table 5, the MSE and RMSE are reported; they provided a comprehensive evaluation of the model's predictive capabilities, considering both the magnitude and distribution of errors (a good model has errors closer to zero). The model shows acceptable errors clodes to zero with MSEs lower than 0.08 and RMSE lower than 0.283. To describe the behaviour of SUHII regression, the coefficient of determination R2 and the p-value were also calculated (in Table 5). R2 indicates the model's effectiveness considering variations of the SUHII and a good model should have R2 closed to 1. The p-value measures the probability of obtaining the observed results, assuming that there is no statistical significance between observations and predictions (the null hypothesis is true). The lower the p-value, the greater the statistical significance of the observed difference; p-value should be lower than 0.05 or 5%. Table 5 demonstrates also the accuracy and robustness of model's performance in predicting the SUHII across different seasons and years.
Also the residuals, representing the differences between observed and predicted values are pivotal in assessing a model's predictive performance. In Table 6, the mean residuals suggests that, on average, the model's predictions closely align with the actual observed values. The proximity of mean residuals to zero indicates the model's capability to minimize systematic errors. Additionally, the standard deviations of residuals provide insight into the variability of errors around the mean values with variations across different seasons. In summary, the model maintains a good level of accuracy in its predictions with minimal deviations from zero for mean residuals demonstrating a well-balanced predictive performance across various timeframes.
After the calibration, the RF model was used to investigate the impact of variables on SUHII for the city of Turin in 2001 and 2018. In Table 7 the variables’ importance score or features’ importance is reported, indicating how "important" the various variables are to the model. In 2001, DTM, NDBI, and Solar Radiation were key factors in the evaluation of SUHII, highlighting topography, built-up areas, and solar exposure. NDMI, Albedo, Air Temperature, NDVI, Emissivity, and SRI (Solar Reflectance Index) emphasized moisture content, vegetation, and surface properties in mitigating SUHII. In 2018, the built environment gained prominence, with Building Coverage Ratio as the top influential variable for the SUHII, followed by DTM, NDMI, Sky View Factor, NDVI, Emissivity, NDWI, and Wind Speed. Other significant variables included the climate conditions.
The consistent importance of built environment, vegetation, surface properties, and climate conditions in both years (in the industrial and post-industrial periods) underscores their persistent influence on SUHII, highlighting the key roles of built and urban characteristics that can be driven by urban planning.
3.2. Assessing SUHII in the Ex-Industrial Area Teksid
Analysing the SUHII dynamics in the Teksid ex-industrial area before and after urban regeneration allows to evaluate the efficacy of interventions undertaken. Figure 10 illustrates the graphical results of SUHII across different seasons in 2001 and 2018 predicted by RF model described in the previous section. Comparing pre- and post-regeneration SUHII variations, a notable decrease in SUHII values was observed in 2018, particularly during the summer months.
The variations of SUHII for the years 2001 and 2018, and in different areas of Turin are represented in Table 8. It can be observed a significant decrease in SUHII over the 2018 period, indicating the efficacy of urban regeneration interventions in mitigating SUHII (and LST). Notably, this reduction is most pronounced during summer and spring months, when SUHII effects are typically more perceptible, suggesting a considerable cooling impact. However, reductions in SUHII during winter and spring are less pronounced, underscoring the complexity of UHI dynamics across different seasons and highlighting the need for tailored strategies to address specific climatic and urban conditions.
The percentage fluctuations among SUHII key variables (specifically NDMI, NDVI, and albedo) was studied through a comparative analysis between the two years and the three seasons, in Table 9. It can be observed the high increase of vegetation (NDVI) that was adopted non only in ex-Teksid area and in the nearby district but also in the whole City of Turin with respectively +22-17-11% (in spring). Also, the Albedo and NDMI, characterizing the urban surfaces’ characteristics, were significantly improved in all the areas more homogeneously and these variations are more visible in winter. About the NDMI, the average negative values in spring indicate only the lower rain precipitations in 2018.
With the use of QGIS, some results can be represented with maps, to give a graphical overview of the changes over the years and seasons. NDVI, NDMI and Albedo are reported below to show their variation in the ex-industrial Teksid area. In Figure 11 the map with NDVI indicates an increase in vegetation and greenery in 2018; it is clearly visible the new Dora Park in the centre of the area. It is important to observe that NDVI is also influenced by the season: during winter for leaf shedding and in mid-seasons with full bloom.
Soil moisture levels can be detected by the NDMI and show a significant variability attributed to diverse land use patterns and soil characteristics. Figure 12 shows the differences in NDMI in the midseason of 2001 and 2018; the content of moisture influences the SUHII by impacting the thermal properties of surfaces, encompassing heat storage and heat transfer processes. In both the 2001 and 2018 figures, the Dora Riparia River crossing the area is clearly visible with the new parks in 2018. Whether manifested as soil moisture, vegetation, or air humidity, moisture has a cooling influence that mitigates the UHI effects.
Regarding the Albedo, Figure 13 show the differences between 2001 and 2018. Initially, in 2001, regions with low reflectance capacity, in darker colours, dominated the landscape. However, following urban regeneration, a notable transformation has occurred in 2018, with areas now showing greater solar reflectance, represented by lighter colours. This variation with increased albedo is also observed in winter and mid-season periods, signifying an improvement in the reflective properties of urban surfaces in all seasons.
In Figure 14 it is possible to note that, across the entire municipal territory, there is a significant decrease in SUHII in 2018. When considering all three seasons (summer, winter, and spring/autumn), there was an average SUHII decrease of -0.614. This decrease can be attributed to an increase of vegetation and greening in the area, surfaces with higher albedo and the regeneration and conversion of industrial areas throughout the territory with more residential ones.
Utilizing the weights-importance scores in the RF model, the more significant variables were identified: the quota of built area BCR, the moisture content NDMI (e.g., in green vegetation), health and density of vegetation NDVI, the reflected solar radiation Albedo and the capacity of a surface in emitting energy Emissivity.
Knowing the key contributors and their weight on UHI effects should be important in urban practices. This modelling can also provide a measure of the mitigation potential that a city has based on its specific characteristics.
3.3. The Evaluation of SUHII and Its Mitigation Interventions with Local Climate Zones
In this paragraph the UHI effects were compared with the characteristics of the LCZs and typical urban settlements for the City of Turin [50].
Table 10 provides average values for surface admittance, albedo, and anthropogenic heat output for the City of Turin [9]. The LCZs consider typical urban areas with low-rise (1-3 stories, height < 9 m), mid-rise (4-9 stories, height 9-24 m), and high-rise (10+ stories, height > 24 m) buildings. The albedo of asphalt surfaces typically ranges from 0.15 to 0.30, though studies in Italy report values between 0.05 and 0.20 [51]; then a value of 0.10 was considered. For asphalt surfaces such as those at airports and on roads, a value of 0.10 was used, while mining and extractive areas were assigned a value of 0.225.
These metrics facilitate the understanding of local climatic characteristics that can be useful to access sustainable urban planning strategies. Some LCZs are not present in the urban area of the City of Turin and then were neglected in this study: LCZ 1, LCZ 7, LCZ A, LCZ C, LCZ F, and LCZ G (in grey).
Table 11 joins the characteristics of the LCZs' with the settlements’ morphologies m.i. (“morfologie insediative” in Italian) typical of the territories in the City of Turin and Piedmont Region. The settlements’ morphologies m.i. were defined for the implementation of the Regional Landscape Plan [52] and are widespread use in urban practices in Piedmont Region.
Then in Table 12 the average characteristics of surface admittance, surface albedo and anthropogenic heat output were associated at the settlements’ morphologies m.i. of the Metropolitan City of Turin. For some specific land uses such as large commercial structures, hospitals, prison areas, logistics hubs, motorway infrastructures, sports facilities and cemeteries, different characteristics were associated as more similar to different LCZs.
Figure 15 represents the homogeneous characteristics of the territory by LCZs and m.i.. In the urban area it is possible to distinguish the LCZ 2 (compact midrise), the LCZ 3 (compact low rise) and the LCZ 4 (open high rise); in the suburbs, the LCZ 9 (sparsley built), the LCZ 10 (heavy industry) and LCZ E (bare rock or paved).
Working in a GIS environment allows to represent and visualize data and variables through cartographic maps which improves the understanding results and correlations. For example, Figure 16 shows the comparison between the anthropogenic heat output of LCZs and SUHII values (for August 2021) and their clear correspondences. Particularly, these are most evident in productive areas, such as the industrial zone of Mirafiori in the South-West of Turin (light-green circles) and in the North-East in the Pescarito area (yellow circle); but also, in the park area of Dora Riparia River (light-blue circle). From this comparison, the relationship between settlement morphologies, LCZs, land use, and the SUHII emerges clearly.
Then, the settlement morphologies on which it is necessary to intervene with priority due to their thermal, radiative, and metabolic properties were identified. With the comparison with SUHII maps, it was possible to observe that the highest values of surface admittance occur in the consolidated urban fabric of major centres (m.i. 1), specialized islands (m.i. 8), infrastructure complexes (m.i. 9), consolidated specialized islands (m.i. 5) *, as well as in the urban fabric outside urban centre (m.i. 4).
Regarding surface albedo values, the settlement morphologies with the lowest ratio were observed in specialized islands (m.i. 8), infrastructure complexes (m.i. 9), consolidated urban fabrics of major and minor centres (m.i. 1, m.i. 2), and organized specialised settlements (m.i. 5).
In Figure 16, the highest values related to anthropogenic heat output were found in organized specialist settlements (m.i. 5), in the consolidated urban fabrics of major and minor centres (m.i. 1, m.i. 2), in urban fabrics outside center (m.i. 3), and in dispersed areas mainly residential (m.i. 7).
Based on these results, in Table 13, it was possible to identify an order of priority for settlement morphologies for UHI mitigation interventions. This simple approach, applied to the General Municipal Regulatory Plan, can support interventions at both the building and urban levels, both consolidated and expanding areas, as a programming and planning tool for energy governance.
The type of intervention to mitigate UHI, however, greatly depend on the type of territorial context.
In expanding urban fabric, it is possible to apply bioclimatic planning and design measures to take advantages with the right layout and sizing of neighbourhoods, roads, etc., controlling solar exposition, wind direction, presence of water, distribution of green infrastructures, availability of renewable energy sources, etc. Then, in a second step, UHI effects will be controlled also by the types of urban surfaces (i.e., buildings, roofs, squares, roads), that do not absorb and accumulate solar energy and release it as heat into the surrounding environment. Therefore, without constrains, the limit in soil use and sealing allows to reduce the first causes of UHI.
The recurring UHI challenge is in consolidated urban fabric, where bioclimatic urban planning and UHI mitigation measures can only be partially applied. Then, is important to identify various types of interventions that can be implemented both by public and private actors. LCZ method suggests intervening on thermal, radiative, and metabolic properties of urban areas by acting differently based on different settlement morphologies. Table 14 proposes some of these interventions.
To achieve better UHI mitigation results within cities, compensatory measures can also be used in expanding or retrofit fabric if the consolidated urban fabric does not allow to introduce sufficient measures; also, the use of compensatory spaces (greening areas, bodies of water, etc) can be a valid solution.
This work shows that the combined use of LCZs method and RF modelling can respectively identify, and measure tailored solutions for specific territorial conditions to mitigate UHI effects. Especially in high-density contexts, where the heat island problem is increasingly perceived, the same target objective can be reached with alternative solutions; so, to take into account all technical, historical, landscape, economic, social constraints that limit the adoption of same solutions.
These strategies could be linked to other policies for example the ones aimed at reducing energy consumption and greenhouse gas emissions (GHG) emissions with energy efficiency measures or renewable technologies. These interventions are regulated by European (e.g., "Mayors Pact" and "Mayors Adapt"), national and regional (e.g., Regional Energy-Environmental Plans PEARs) initiatives whose goal is to reduce GHG emissions with mitigation and adaptation measures to climate changes. Furthermore, environmental protocols at building, neighbourhood, urban scale with their structure by categories and indicators could be integrated more in urban planning strategies.
5. Conclusions
This research was driven by the primary objective of providing a comprehensive methodology to describe the UHI phenomenon. The employment of coding, alongside ML algorithms, proved invaluable in expediting the analysis process and extracting nuanced insights beyond the capabilities of traditional methodologies. Furthermore, the meticulous collection and retrieval of data from satellite imagery and geodatabases played a pivotal role in facilitating UHI comprehension. This has been explained further with the industrial Teksid area. By conducting evaluations across two distinct periods (2001 and 2018), the analysis not only revealed temporal changes but, more crucially, allowed for the quantitative assessment of the impact of urban mitigation interventions in a city with a significant industrial legacy like Turin. Moreover, the overlay of the quantitative analysis with the qualitative analysis of LCZs, associated with settlement morphologies, allowed the identification of tailored mitigation interventions and their quantification.
The utilization of the RF algorithm was particularly helpful, allowing for a thorough examination of the influence of the variables that drives the UHI in the specific urban environment of the City of Turin. Noteworthy among them were factors like BCR, NDMI, NDVI, Albedo, and surface emissivity, which emerged as significant contributors across all temporal periods (years and seasons).
This holistic approach not only enhanced our understanding of UHI dynamics but also underscored the multifaceted nature of the urban environment and the interplay of various factors shaping its thermal profile.
Particularly, in the ex-industrial Teksid area the SUHII has decreased by -0.94 in summer, and - 0.54 in winter, mainly because of a lower BCR (and fewer human activities), higher NDVI, and lower Albedo after the urban regeneration. SUHII modelling consents to quantify UHI mitigation also at district and urban level.
By quantifying the effects of mitigation interventions, this study provides a new approach for territorial/spatial planning, supporting the urban and regional planning tools and sectorial tools for energy, environment, and sustainability policies. Above all, those tools need to redefine strategic and operative solutions in urban planning. In fact, it is time to shift away from traditional planning methods and abandon the rationalist approach based on successive expansions in favour of systemic planning based on tailored, effective and alternative solutions for a more sustainable development. The new perspectives must necessarily consider the current climate conditions and, above all, future ones; the use of tailored simulation tools is mandatory. It is necessary to aim for a transformative adaptation of our cities and societies, employing integrated mitigation strategies to achieve a broader vision of a climate change-resilient future. Since this would not happen automatically, policies must provide the necessary positive impulses to do so, with a combination of prevention, preparedness, protection, promotion, and transformation measures. Transformations do not only involve technical and technological changes, but also cultural shifts, behavioural modifications, and institutional reforms.
Some insights about the mitigation strategies, planning practices and future development of this work are summarized below:
- A place-based approach that considers the so-called genius loci (spirit of the place) and therefore the multiple peculiarities of places in terms of geomorphology, climate, environment, social, economic, landscape, historical, architectural, and identity aspects, would allow containing or avoiding the construction of energy-intensive, polluting, and poorly resilient built environment, abandoning the universal style that continues to characterize and homogenize many cities despite very different contextual conditions.
To control a phenomenon, we must first measure it. The new possibilities of making models with artificial intelligence and using all the available information, even at a territorial scale, must be exploited, including satellite images. Artificial intelligence, with Machine Learning algorithms, associated with the use of satellite images and geo-databases that describe the urban environment, can be the perfect solution to measure, model, and simulate the actual and future UHI impacts. The methodology described in this work can create a tailored SUHII model for each territory and then measure the effectiveness of specific mitigation interventions and future scenarios.
- 2.
- An approach based on climate mainstreaming, i.e., the integration of climate issues within sectoral policies, would allow involving and activating multiple policy sectors. Not just construction, but also mobility, energy, air, water, environment, land use, biodiversity, etc.
Climate mainstreaming enables territorial and environmental government actors to jointly adopt prevention, preparedness, and response actions to climate impacts and their consequences. Policies and strategies should be updated based on climate impacts and coordinated, avoiding risky inconsistencies between disciplinary sectors. In this perspective, it is desirable to integrate adaptation and mitigation actions into existing instruments, avoiding new planning tools or sectoral strategies that would overlap but not effectively and promptly combine.
- 3.
- An holistic approach aimed at creating a sense of co-responsibility for public and private actions, in which everyone, within their competencies and fields of action, is aware of acting in a transformative and global adaptation process to the changing climate conditions. Synergy, cooperation, and dissemination by the entire community (social organizations, businesses, various professions, citizens, schools, etc.) as an active part of the entire adaptation and mitigation process are necessary.
The methodology, described in this work, can be replicated in most cities thanks to the ever-increasing availability of free data (GIS and satellite images) which allows the creation of increasingly accurate and specific models for the different characteristics of urban environments.
Supplementary Materials
The following supporting information can be downloaded at the website of this paper posted on Preprints.org. Python codes (referring to Table 2). Available online: https://1drv.ms/b/c/8e7ec8768139e3da/EQ_IikuGRxhNrBo6ArS2j7sBJgMnukcpl_gz74R4xH9i7A?e=r9KvJj.
Author Contributions
Conceptualization, G.M.; methodology, G.M., A.S., X.S., S.G.; software A.S., X.S.; investigation, G.M., A.S., X.S., S.G.; data curation, A.S., X.S., S.G.; writing—original draft preparation, G.M., A.S., X.S., S.G.; writing—review and editing, G.M., A.S., X.S., S.G.; supervision, G.M. All authors have read and agreed to the published version of the manuscript.
Funding
This research received no external funding.
Institutional Review Board Statement
Not applicable.
Informed Consent Statement
Not applicable.
Data Availability Statement
The results data of this study are not publicly available due to privacy and specific agreements.
Acknowledgments
the authors are grateful to Ahad Montazeri for helping with Machine Learning modeling and to the “Master di II Livello Metodi e Tecniche per il Governo di Territori Resilienti. Verso la gestione integrata dei rischi” of Politecnico di Torino which have inspired this research about the impact on territorial planning in mitigating the urban heat island.
Conflicts of Interest
The authors declare no conflict of interest.
Nomenclature
| BCR | Building Coverage Ratio |
| DTM | Digital Terrain Model |
| GIS | Geographic Information System |
| LCZ | Local Climate Zone |
| LST | Land Surface Temperature |
| m.i. | Settlements’ morphologies (“morfologie insediative”, in Italian) |
| MSE | Mean Squared Error |
| NDBI | Normalized Difference Built-up Index |
| NDMI | Normalized Difference Moisture Index |
| NDVI | Normalized Difference Vegetation Index |
| NDWI | Normalized Difference Water Index |
| NIR | Near InfraRed |
| PVI | Proportion Vegetation Index |
| QGIS | Quantum GIS |
| R2 | Coefficient of Determination |
| RF | Random Forest |
| RMSE | Root Mean Squared Error |
| S/V | Surface-to-Volume ratio of buildings |
| SRI | Solar Reflectance Index |
| SUHII | Surface Urban Heat Island Intensity |
| SVF | Sky View Factor |
| SWIR | Short-wave Infrared |
| UHI | Urban Heat Island |
| UHII | Urban Heat Island Intensity |
| V | Buildings’ Volume |
| VIS | Visible |
Appendix A
| N° | Year | Place | Scale | Object | Factors | Methodology | Results | Keyword |
| 3 | 1833 | LDN | Urban | Analysis and characterization of the climate of London | Atmospheric conditions | Systematic observations of factors at regular intervals throughout the day to assess long-term climate trends in the city | Howard provided a comprehensive understanding of London's climate detailing factors | Investigation |
| 4 | 1976 | VAN | Urban | Causes of the UHI: canopy and boundary-layer | Surface properties, land use, and atmospheric conditions | Differentiate spatial heat island patterns within urban canopy and boundary layers | The study found a clear differentiation between canopy and boundary-layer UHI, influenced by factors | Investigation |
| 5 | 1982 | VAN | Urban | Investigating the physical processes driving UHI effect | Surface cover, Building materials, Anthropogenic heat, Weather conditions, Urban morphology | Comparing energy fluxes between urban and rural areas quantifies the UHI effect on temperature disparities. | Urban areas have higher night-time temperatures than rural areas, highlighting the importance of urban energy balance | Investigation |
| 9 | 2017 | BRA | Urban | Develop and validate a GIS-based extension model capable of accurately calculating UHII | Urban geometry and meteorological data | They collected urban geometry and meteorological data, applied a mathematical model to estimate UHII, validated it using empirical data in MATLAB | The outcome is a computational tool named THIS enabling simulation of hypothetical urban scenarios and assessing the impact of urban geometry | GIS |
| 10 | 2018 | SZ | Urban | Ventilation corridor planning to mitigate UHI | Built environment, wind patterns, land use distribution | GIS-based case study to analyse wind environments, mapping urban features, assessing wind patterns, and pinpointing suitable corridors for natural ventilation. | Recommendations for urban planning in Shenzhen to improve air quality and comfort through strategic development of natural ventilation corridors. | GIS |
| 11 | 2018 | HK | Local | The study mapped the spatial distribution of nocturnal UHIs using the Local Climate Zone framework | Climate data & Urban morphology data (total street length, pervious surface fraction, sky view factor) | GIS, GPS, and Landsat 8 images were used alongside Multiple Linear Regression (MLR) and Partial Least Squares Regression (PLSR) to analyse the spatial distribution of nocturnal UHI. | Identification of UHI hotspots through the statistical models, with the statement that urban forms have significant influences on UHI development. | GIS |
| 12 | 2019 | HIJ | Urban | Develop and implement a GIS-based model for mitigating the UHI effect in Hiroshima | Urban Morphology, vegetation, density population, surface types | GIS to analyse with various urban parameters affecting heat absorption and retention. They collected data to create spatial models predicting heat distribution across the city. | The effectiveness of different mitigation strategies, such as green infrastructure and urban planning interventions, in reducing urban heat. | GIS |
| 13 | 2021 | TRN | Urban | Smart Rooftops | Roof suitability, context, codes, regulations. | Data analysis techniques (GIS), design strategies, and implementation frameworks to optimize the use of urban rooftops for sustainability. | A method to assess rooftop renovation opportunities, evaluating energy savings, thermal comfort, and environmental/economic benefits, was introduced. | GIS |
| 14 | 2022 | TRN | Urban | Outdoor thermal condition at urban scale | Urban Morphology, vegetation, outdoor thermal comfort, sky view factor, mean radiant temperature, urban surfaces | Utilized geospatial assessment QGIS [UMEP-SOLWEIG (QGIS)], DSM, and field measurements to evaluate outdoor thermal comfort on an urban scale. | SOLWEIG is a more suitable tool for assessment and analyses at the urban scale, while ENVI-met is more useful for feasibility studies with high spatial and temporal resolution or for the pre-design phase of little neighbourhoods | GIS |
| 15 | 2013 | XIA | Regional | Landsat 8 imagery for considering factors like climate, soil, vegetation, and acquisition timing | Pervious and impervious surface, LST | They conducted remote sensing analysis to grasp how impervious surface expansion affects local land surface temperature dynamics in the subtropical city. | Growing impervious surfaces increased land surface temperatures, showing urbanization's impact on subtropical city temperatures. | Remote sensing |
| 16 | 2019 | USA | Regional | UHI phenomenon in 54 US cities over 15 years, examining its correlation with temperature changes, weather conditions, and urban warming trends. | UHI, Temperature variation, Climate zones, Weather conditions, Urban Warming Trends | They analysed UHI intensity across cities using satellite data under different temperature conditions. Statistical methods evaluated changes in UHII concerning temperature variations. | In 38 of 54 US cities, UHI intensity decreases as temperatures rise, regardless of climate zones. This is propelled by rural area changes, particularly during moist weather, without a significant UHI effect increase in warming cities. | Remote sensing |
| 17 | 2021 | LX | Regional | Local weather types of data based on Copernicus Land Monitoring Service climate variables dataset | Thermal patterns (seasons); hourly air temperature, specific humidity, relative humidity and wind speed data |
Likely involved collecting and processing Lisbon's temperature and weather data, categorizing local weather types, and correlating them with UHI intensity variations across the metropolitan area. | UHI Intensity estimated in a R script using factors | Remote sensing |
| 18 | 2022 | CN | Urban | Ventilation corridor planning to mitigate UHI | LST, atmospheric data | A systematic approach combining data collection (satellite images), quantitative analysis, and validation to identify urban ventilation corridors effectively | Seven primary ventilation corridors primarily consisting of water bodies and green land areas, while four secondary ventilation corridors were mainly composed of roads. | Remote sensing |
| 19 | 2022 | SZ | Urban | Relationship between the morphological spatial pattern of green space and UHI intensity using machine learning methods. | Urban morphology, Land cover, morphological characteristics of green spaces, Population, Buildings | Employed machine learning methods to analyse the connection between the spatial arrangement of green spaces and the UHI effect. | The UHI intensity was negatively correlated with the cores, perforations, and loops of green space, but positively correlated with islets. | Machine Learning |
| 20 | 2021 | NAP | Urban | Predicting nocturnal (SUHI) during nigh, use of random forest approach to predict LST. | LCZ, Land cover, Air temperature, LST, short wave and long wave radiation, albedo, DEM | Random Forest in R, analysed Landsat-8 and MSG-SEVIRI data in QGIS, and used NASA Atmospheric calculator and GRASS-GIS to predict Naples heatwave nocturnal UHI. | Energy balance-based machine learning approach, to describe the daily cycle of the heat flux components and predict the nocturnal LST and SUHI, during an HW event. | Machine Learning |
| 21 | 2021 | WH | Urban | Machine learning to simulate and mitigate extreme UHI effects in a factory area. | Industrial morphology, type, production stage, scale, and internal structure. | Satellite data (Landsat-8) and ground measurements processed with ENVI and MATLAB to apply ML for simulating and mitigating extreme UHI effects in a factory area. | The results show that the scale of all types of factories affects LST | Machine Learning |
| 22 | 2022 | MAD | Urban | Modelling SHUI trough ArcGis plug-in, predict observed LST with high accuracy, using Random Forest Regression (RFR). | Building height, albedo, DTM, Land Cover map, LST | ArcUHI automates UHI modelling using GIS and machine learning, involving data preprocessing, feature selection, model training, validation, and mapping UHI patterns in urban areas. | Developing of an add-in (ArcUHI) for automated modelling the UHI effect. | Machine Learning |
| 23 | 2022 | AMD | Urban | Employed a machine learning algorithm to predict factors |
LULC maps, BI, NDVI, NDBI, NDMI, MNDWI |
Satellite imagery and ground-based measurements to train the algorithm, incorporating factors to characterize the surface UHI phenomena. | More than 70% area in summer and 40% in winter would likely face higher temperature zones than their respective present situation | Machine Learning |
| 24 | 2023 | AU | National | ML models to assess the link between health outcomes and heat and air quality exposure in diverse Australian urban areas. | Census, Health, Land use, Point of interest, Google earth engine, LST | Investigate the correlation between health metrics and exposure to heat and air quality in various urban areas across Australia | Social and built environmental factors are more influential to physical and mental health outcomes than heat and air pollution, especially in rural areas. | Machine Learning |
References
- United Nations Environment Programme (UNEP). UN Launches Challenge for Cities to Harness Power of Nature for Cooling. Available online: https://www.unep.org/news-and-stories/press-release/un-launches-challenge-cities-harness-power-nature-cooling (accessed on 5 January 2024).
- United Nations Conference on Trade and Development (UNCTAD) Handbook of Statistics 2023 https://unctad.org/publication/handbook-statistics-2023; https://www.un-ilibrary.org/content/periodicals/22253270. (accessed on 20 July 2024).
- United Nations Conference on Trade and Development (UNCTAD). Total and Urban Population. Available online: https://hbs.unctad.org/total-and-urban-population/ (accessed on 5 January 2024).
- Howard, L. (1833). The Climate of London. London, UK: Harvey and Darton.
- Oke T.R. (1976) The distinction between canopy and boundary-layer urban heat islands, Atmosphere, 14:4, 268-277. [CrossRef]
- Voogt, J.A., Oke, T.R. (2003). Thermal remote sensing of urban climates, Remote Sensing of Environment 86 370–384. [CrossRef]
- Oke, T. R. (1982). The energetic basis of the urban heat island. Quarterly Journal of the Royal Meteorological Society, 108(455), 1-24. [CrossRef]
- Oke, T. R. (1987). Boundary Layer Climates (2nd ed). Methuen.
- Stewart, I. D., & Oke, T. R. (2012). Local climate zones for urban temperature studies. Bulletin of the American Meteorological Society, 93(12), 1879-1900. [CrossRef]
- Nakata-Osaki, C. M., Souza, L. C. L., & Rodrigues, D. S. (2017). Tool for Heat Island Simulation: A GIS extension model to calculate urban heat island intensity based on urban geometry. Computers, Environment and Urban Systems, 65, 104-117. [CrossRef]
- Liu, X., Huang, B., Li, R., Zhang, J., Gou, Q., Zhou, T., & Huang, Z. (2018). Wind environment assessment and planning of urban natural ventilation corridors using GIS: Shenzhen as a case study. Building and Environment, 129, 100-113. [CrossRef]
- Liao, K., Hong, Y., & Heo, J. (2018). The effect of spatial heterogeneity in urban morphology on surface urban heat islands. Environmental Research Letters, 13(6), 064014. [CrossRef]
- Mutani, G., Todeschi, V., & Matsuo, K. (2019). Urban Heat Island Mitigation: A GIS-based Model for Hiroshima. Sustainability, 11(8), 2369. [CrossRef]
- Todeschi, V., Mutani, G., Baima, L., Nigra, M., & Robiglio, M. (2021). Smart Solutions for Sustainable Cities—The Re-Coding Experience for Harnessing the Potential of Urban Rooftops. Sustainability, 13(16), 8954. [CrossRef]
- Mutani, G., & Beltramino, S. (2022). Geospatial assessment and modeling of outdoor thermal comfort at urban scale. Sustainable Cities and Society, 77, 103245. [CrossRef]
- Xu, H., Lin, D., & Tang, F. (2013). The Impact of Impervious Surface Development on Land Surface Temperature in a Subtropical City: Xiamen, China. International Journal of Climatology, 33, 1873–1883. [CrossRef]
- Scott, A. A., Waugh, D. W., & Zaitchik, B. F. (2019). Reduced urban heat island intensity under warmer conditions. Environmental Research Letters, 14(9), 094011. [CrossRef]
- Reis, C., Lopes, A., & Santos Nouri, A. (2021). Urban heat island data by local weather types in Lisbon metropolitan area based on Copernicus climate variables dataset for European cities. Sustainable Cities and Society, 65, 102618. [CrossRef]
- Wang, W., Wang, D., Chen, H., Wang, B., & Chen, X. (2022). Identifying urban ventilation corridors through quantitative analysis of ventilation potential and wind characteristics. Building and Environment, 208, 108759. [CrossRef]
- Lin, J., Qiu, S., Tan, X., & Zhuang, Y. (2022). Measuring the relationship between morphological spatial pattern of green space and urban heat island using machine learning methods. Sustainable Cities and Society, 95, 103877. [CrossRef]
- Oliveira, A., Lopes, A., Niza, S., & Soares, A. (2021). An urban energy balance-guided machine learning approach for synthetic nocturnal surface Urban Heat Island prediction: A heatwave event in Naples. Building and Environment, 195, 107749. [CrossRef]
- Liu, S., Zhang, J., Li, J., Li, Y., Zhang, J., & Wu, X. (2021). Simulating and mitigating extreme urban heat island effects in a factory area based on machine learning. Sustainable Cities and Society, 70, 102977. [CrossRef]
- Espino, D. J., Manchado, C., Valcarce, A. R., & Moscardò, V. (2022). ArcUHI: A GIS add-in for automated modelling of the Urban Heat Island effect through machine learning. Environmental Modelling & Software, 146, 105176. [CrossRef]
- Mohammad, P., Goswami, A., Chauhan, S., & Nayak, S. (2022). Machine learning algorithm-based prediction of land use land cover and land surface temperature changes to characterize the surface urban heat island phenomena over Ahmedabad city, India. Sustainable Cities and Society, 96, 103952. [CrossRef]
- Wang S., W. Cai, Y. Tao, Q. Chayn Sun, P. Pui Yun Wong, X.Huang, Y. Liu, (2023). Unpacking the inter- and intra-urban differences of the association between health and exposure to heat and air quality in Australia using global and local machine learning models. Science of The Total Environment. Volume 871. 162005, ISSN 0048-9697. [CrossRef]
- Martini, A.F.; Pirulli, N. (a cura di). "Torino: Storia di una città". Rivista TORINO. ISSN 2038-4068. Marzo 2011. MuseoTorino. Available online: http://www.museotorino.it/ (in Italian, accessed on 5 January 2024).
- Carlin, A.; Lo Verso, VRM; Invernizzi, S.; Polato, A. (2016). Optimised daylighting for comfort and energy saving for the factory of the future, International Journal of Mechanics and Control 18(1):15-29.
- Museo Torino. Scheda: Ex stabilimento Teksid, ex Ferriere Fiat Vitali. Available online: https://www.museotorino.it/view/s/2ddd80eae7ca4555b51692f187cf20cd (accessed on 02/09/2023).
- Museo Torino. Scheda: Ex Stabilimento Teksid, ex Ferriere Fiat Ingest. Available online: https://museotorino.it/view/s/a0886cd0a4924bde964799ca9952b297#:~:text=Lo%20stabilimento%2C%20collocato%20nell%27area%20compresa%20tra%20le%20vie,Urbana%20che%20ha%20trasformato%20l%E2%80%99area%20di%20Spina%203 (accessed on 5 January 2024).
- QGIS STAC API Browser (stac-utils.github.io).
- Congedo, Luca, (2021). Semi-Automatic Classification Plugin: A Python tool for the download and processing of remote sensing images in QGIS. Journal of Open-Source Software, 6(64), 3172. [CrossRef]
- Mancino, G.; Ferrara, A.; Padula, A.; Nolè, A. (2020). Cross-Comparison between Landsat 8 (OLI) and Landsat 7 (ETM+) Derived Vegetation Indices in a Mediterranean Environment. Remote Sensing, 12, 291. [CrossRef]
- Favretto A. (2018) Urban Heat Island analysis with Remote Sensing and GIS methods: an application in the Trieste area (North-East of Italy). Bollettino della Società Geografica Italiana serie 14, 1(1): 215-229. [CrossRef]
- Boehner, J., Antonic, O. (2009). Land-surface parameters specific to topo-climatology. In T. Hengl & H. Reuter (Eds.), Geomorphometry - Concepts, Software, Applications (pp. 195-226). Elsevier. [CrossRef]
- Pereira, G.W.; Valente, D.S.M.; Queiroz, D.M.d.; Coelho, A.L.d.F.; Costa, M.M.; Grift, T. (2022). Smart-Map: An Open-Source QGIS Plugin for Digital Mapping Using Machine Learning Techniques and Ordinary Kriging. Agronomy, 12, 1350. [CrossRef]
- Guo, Q., Su, Y., Hu, T. (2023). "LiDAR Data Filtering and Digital Elevation Model Generation." In: Guo, Q., Su, Y., Hu, T. (Eds), LiDAR Principles, Processing and Applications in Forest Ecology, Academic Press, 171-214. ISBN: 9780128238943. [CrossRef]
- Thompson, J.A., Roecker, S., Grunwald, S., & Owens, P.R. (2012). Digital Soil Mapping: Interactions with and Applications for Hydropedology. In H. Lin (Ed), Hydropedology (pp. 665-709). Academic Press. [CrossRef]
- Vermote, E., Justice, C., Claverie, M., & Franch, B. (2016). Preliminary Analysis of the Performance of the Landsat 8/OLI Land Surface Reflectance Product. Remote Sensing of Environment, 185, 46-56. [CrossRef]
- Masek, J.G., et al. (2006). A Landsat surface reflectance dataset for North America, 1990-2000. IEEE Geoscience and Remote Sensing Letters, 3(1), 68-72. [CrossRef]
- Kshetri, T. (2018). NDVI, NDBI & NDWI Calculation Using Landsat 7, 8. https://www.researchgate.net/publication/327971920_NDVI_NDBI_NDWI_Calculation_Using_Landsat_7_8.
- McFeeters, S. K. (1996). The use of the Normalized Difference Water Index (NDWI) in the delineation of open water features. International Journal of Remote Sensing, 17(7), 1425-1432. [CrossRef]
- Ozelkan, E. (2019). Water Body Detection Analysis Using NDWI Indices Derived from Landsat-8 OLI. Polish Journal of Environmental Studies, 29. [CrossRef]
- Shastri, S., Singh, Prof., Verma, P., Rai, P., & Singh, A. (2020). Land Cover Change Dynamics and their Impacts on Thermal Environment of Dadri Block, Gautam Budh Nagar, India. Journal of Landscape Ecology, 13, 1-13. [CrossRef]
- Jumari, N.A.S.K., et al. (2023). Analysis of urban heat islands with Landsat satellite images and GIS in Kuala Lumpur Metropolitan City. Heliyon, 9(8), e18424. [CrossRef]
- Asdrubali, F., & Desideri, U. (2019). Building Envelope. In F. Asdrubali & U. Desideri (Eds), Handbook of Energy Efficiency in Buildings (pp. 295-439). Butterworth-Heinemann. [CrossRef]
- Rahman, M. N., Rony, M. R. H., Jannat, F. A., Chandra Pal, S., Islam, M. S., Alam, E., & Islam, A. R. M. T. (2022). Impact of Urbanization on Urban Heat Island Intensity in Major Districts of Bangladesh Using Remote Sensing and Geo-Spatial Tools. Climate, 10, 3. [CrossRef]
- Chunyang He, Peijun Shi, Dingyong Xie, & Yuanyuan Zhao. (2010). Improving the normalized difference built-up index to map urban built-up areas using a semi-automatic segmentation approach. Remote Sensing Letters, 1(4), 213-221. [CrossRef]
- Hantzschel, J., Goldberg, V., Bernhofer, C. (2005). GIS-based regionalisation of radiation, temperature and coupling measures in complex terrain for low mountain ranges. Meteorological Applications, 12(1), 33-42. [CrossRef]
- Cerba, Otakar & Charvat, Karel & Janecka, Karel & Jedlička, Karel & Ježek, Jan & Mildorf, Tomáš. (2012). The Overview of Spatial Data Harmonization Approaches and Tools.
- Grasso S. (2022-23), Isole di calore e Local Climate Zones. Verso un catalogo di azioni per la mitigazione e l'adattamento ai cambiamenti climatici (in Italian), Master di II Livello in “Metodi e Tecniche per il Governo di Territori Resilienti. Verso la gestione integrata dei rischi, Politecnico di Torino (in Italian).
- Latini A., Gatti L., Giagnacovo G., Muleo R., De Rossi P. (2021). "Albedo delle superfici vegetali e benefici dell’inverdimento urbano nella riduzione dell’isola di calore nelle città," in Gli ecosistemi vegetali per la rigenerazione ecologica delle città, RT/2021/13/ENEA. Available online: https://iris.enea.it/retrieve/dd11e37d-0561-5d97-e053-d805fe0a6f04/RT-2021-13-ENEA.pdf.
- Piano Paesaggistico Regionale della Regione Piemonte 2017 (in Italian). Available online: https://www.regione.piemonte.it/web/temi/ambiente-territorio/paesaggio/piano-paesaggistico-regionale-ppr (in Italian, accessed on 5 January 2024).
Figure 1.
Flow-chart of the methodology to evaluate the UHI effects.
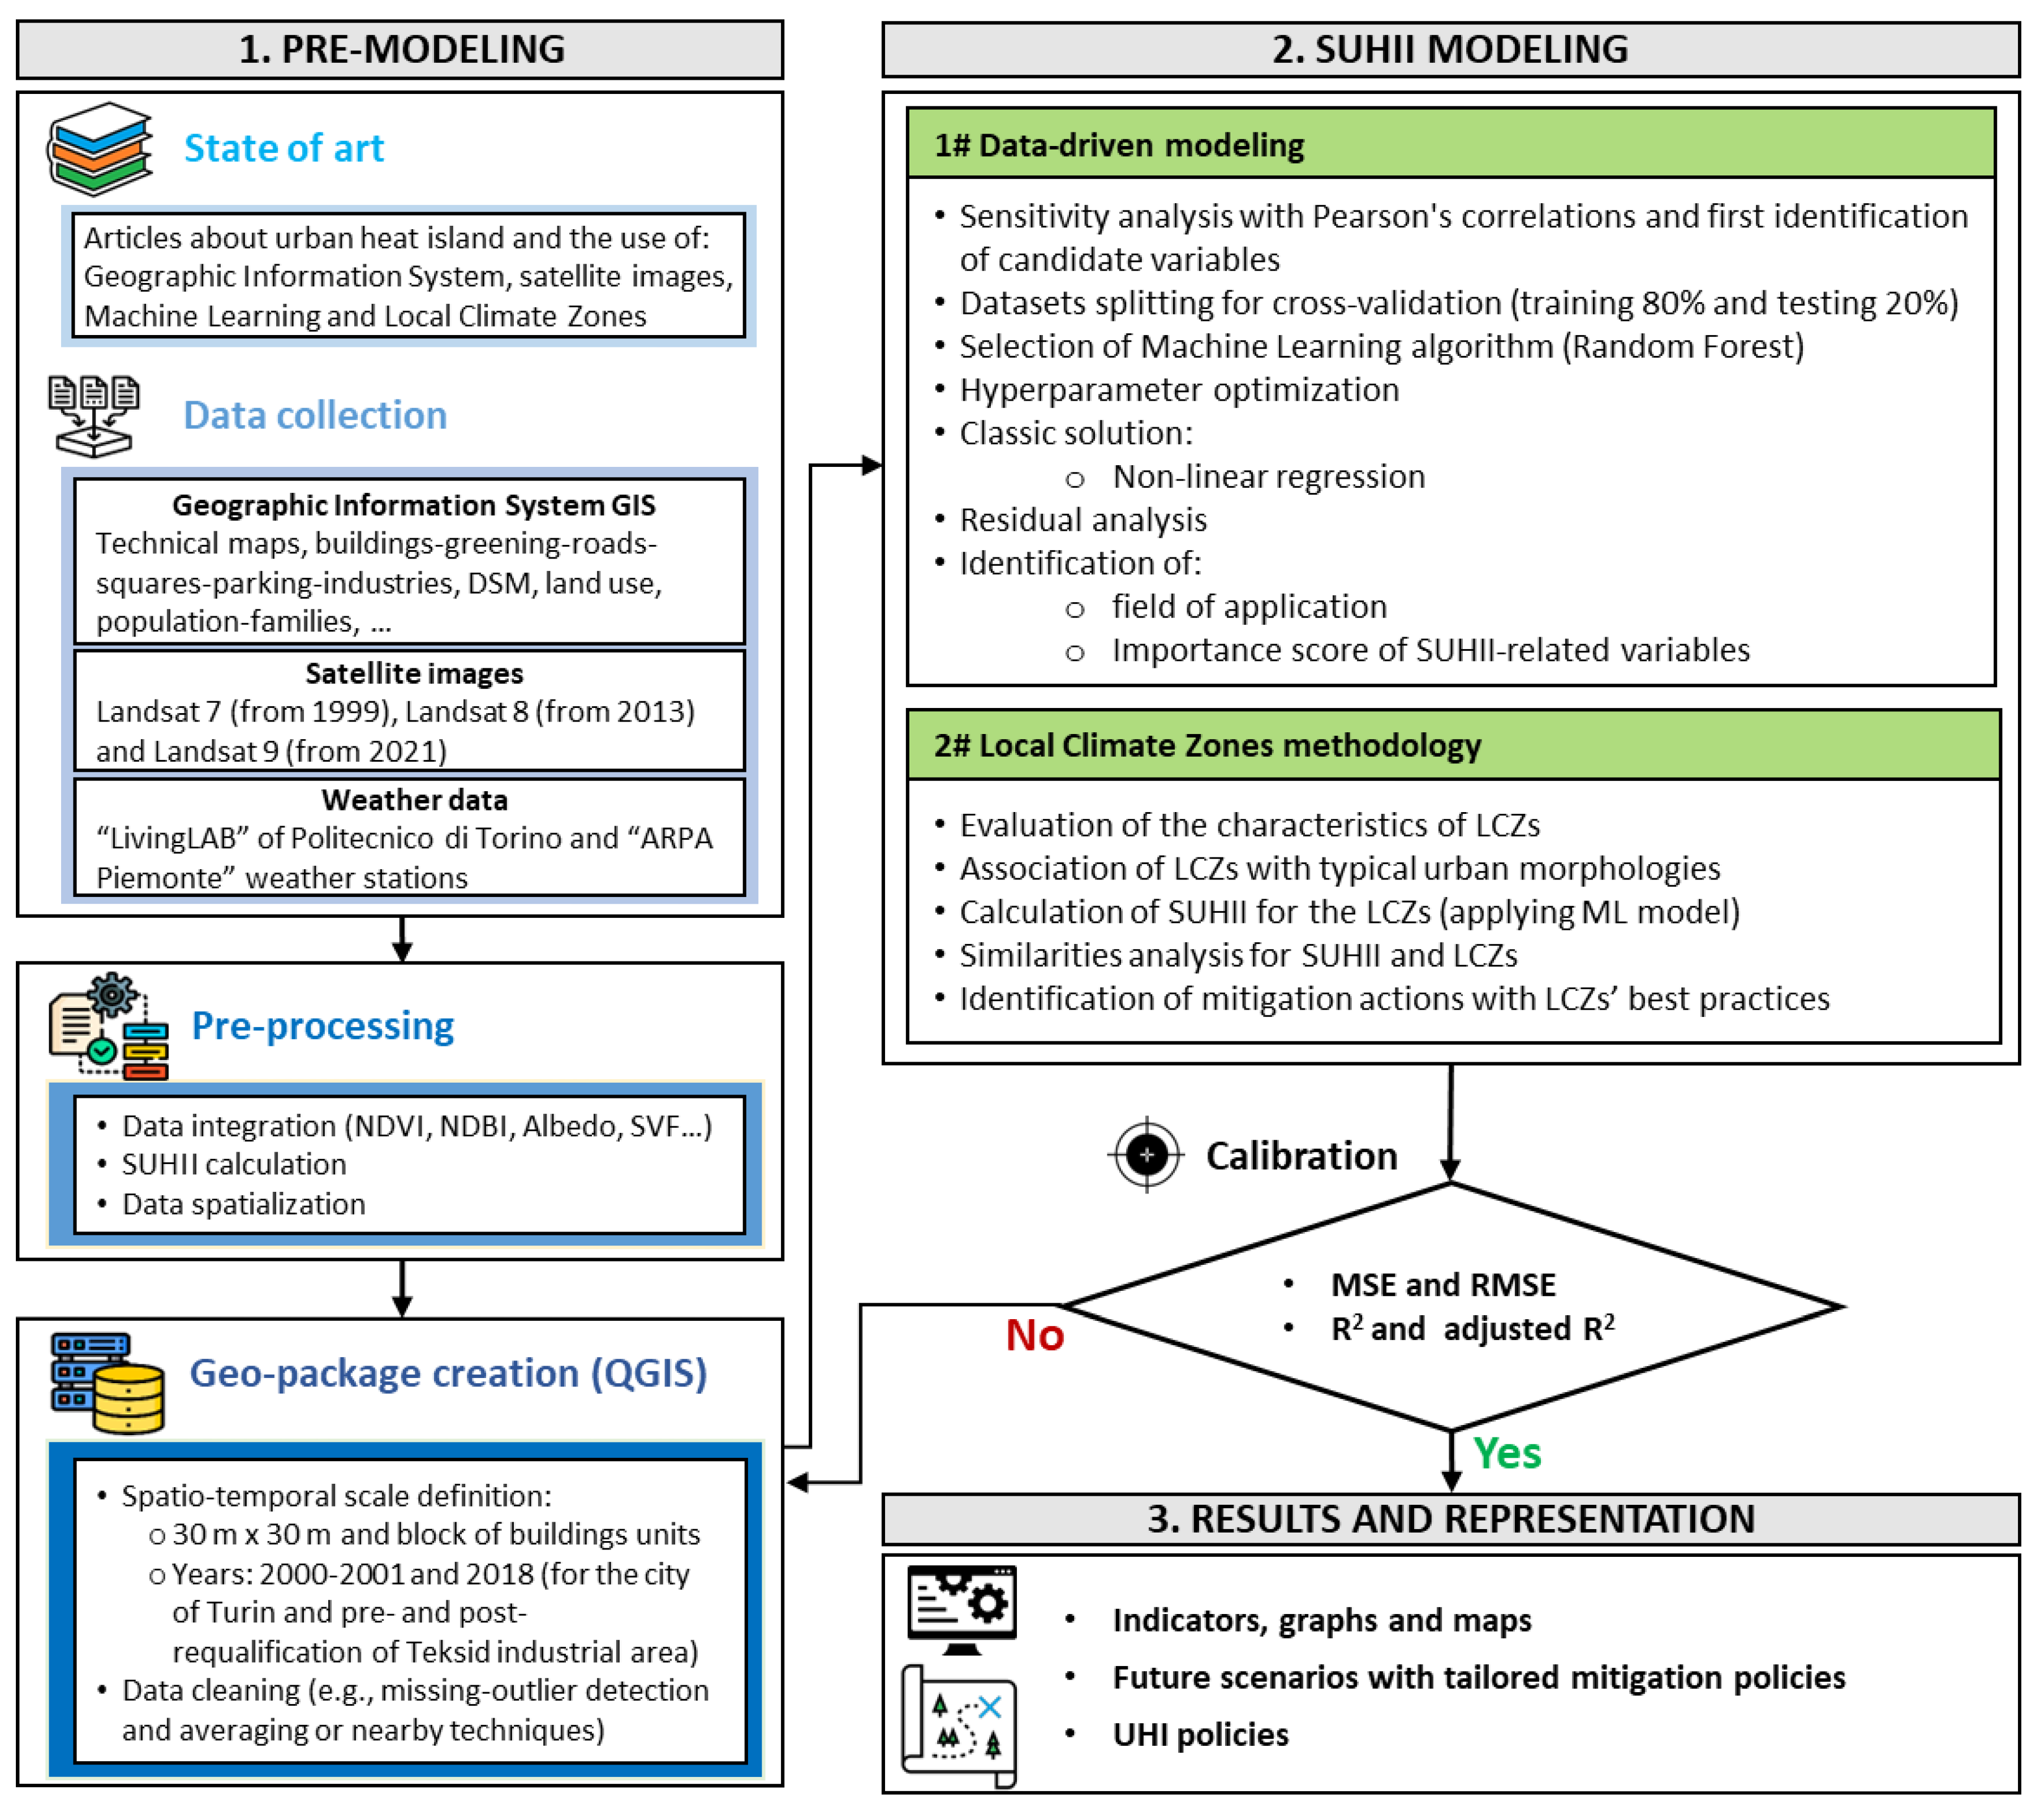
Figure 2.
Technical cartography plant (1955-1969), City of Turin.
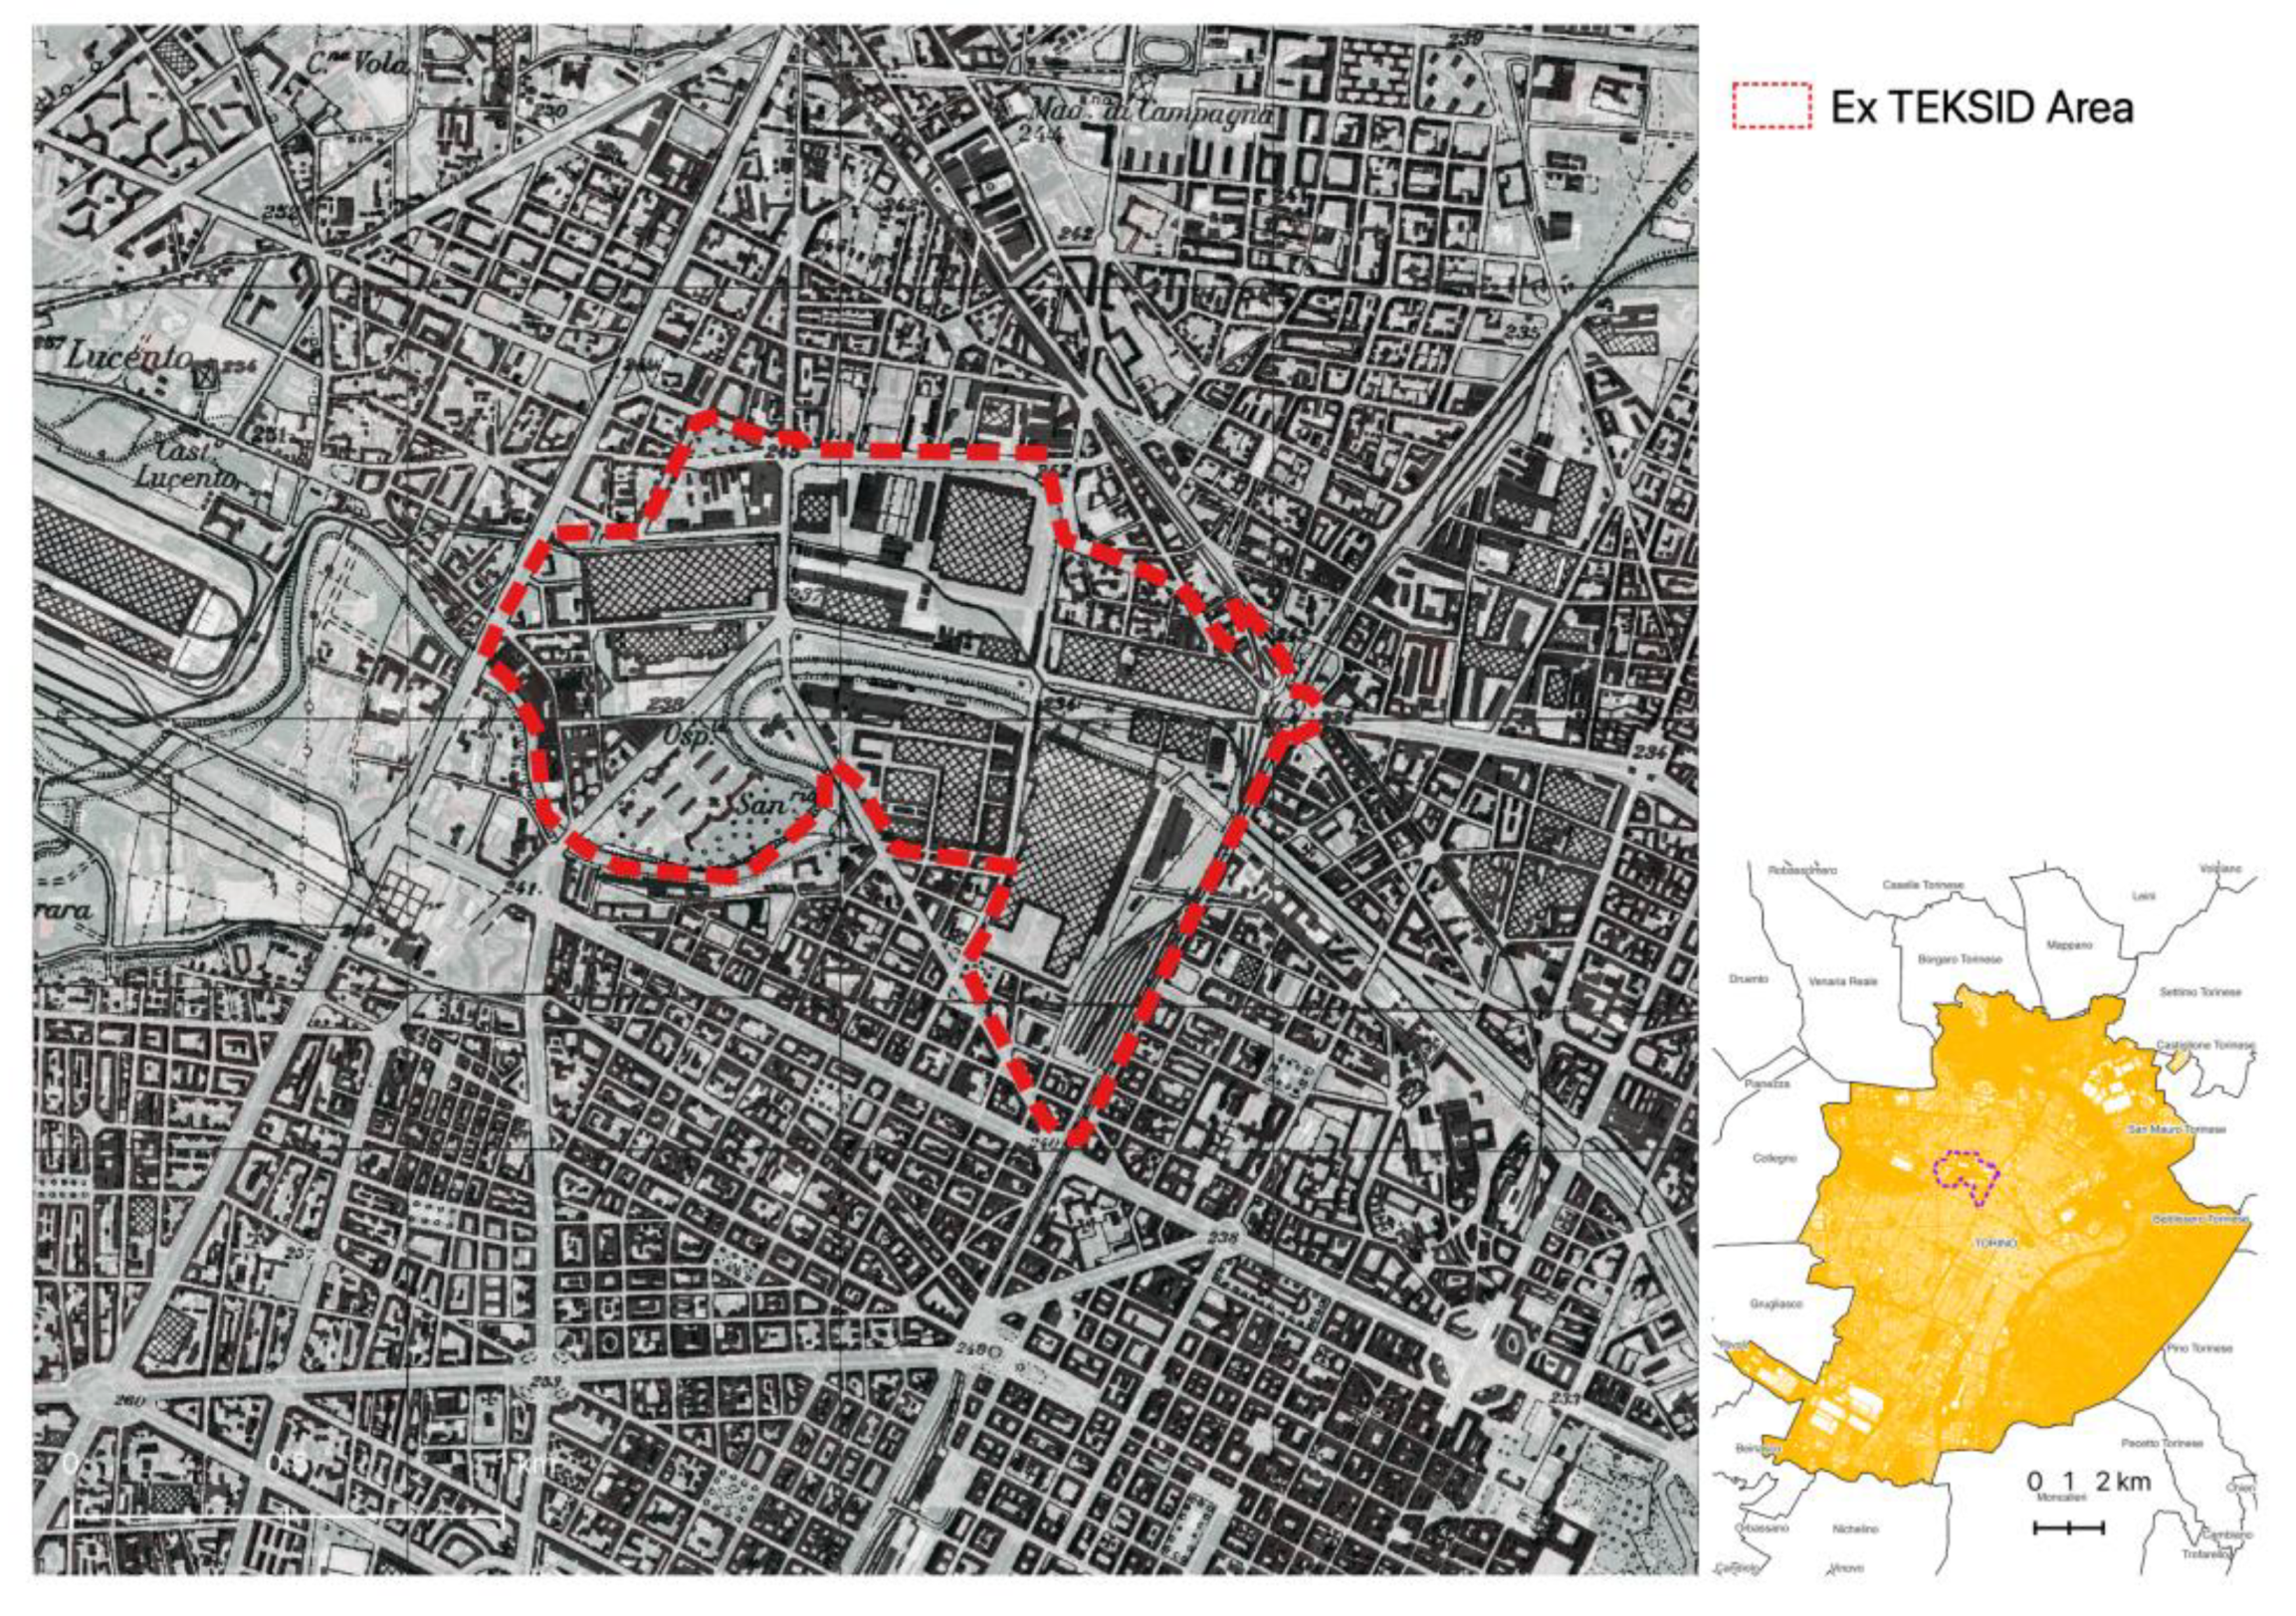
Figure 3.
(a) Former industrial Teksid area in Turin, 1920 (Immagini del cambiamento, archivio CDS5, https://areeweb.polito.it/imgdc/schede/PD04.html).; (b) Regeneration program in Spina 3. Google Cartographical Data, 2018.
Figure 3.
(a) Former industrial Teksid area in Turin, 1920 (Immagini del cambiamento, archivio CDS5, https://areeweb.polito.it/imgdc/schede/PD04.html).; (b) Regeneration program in Spina 3. Google Cartographical Data, 2018.
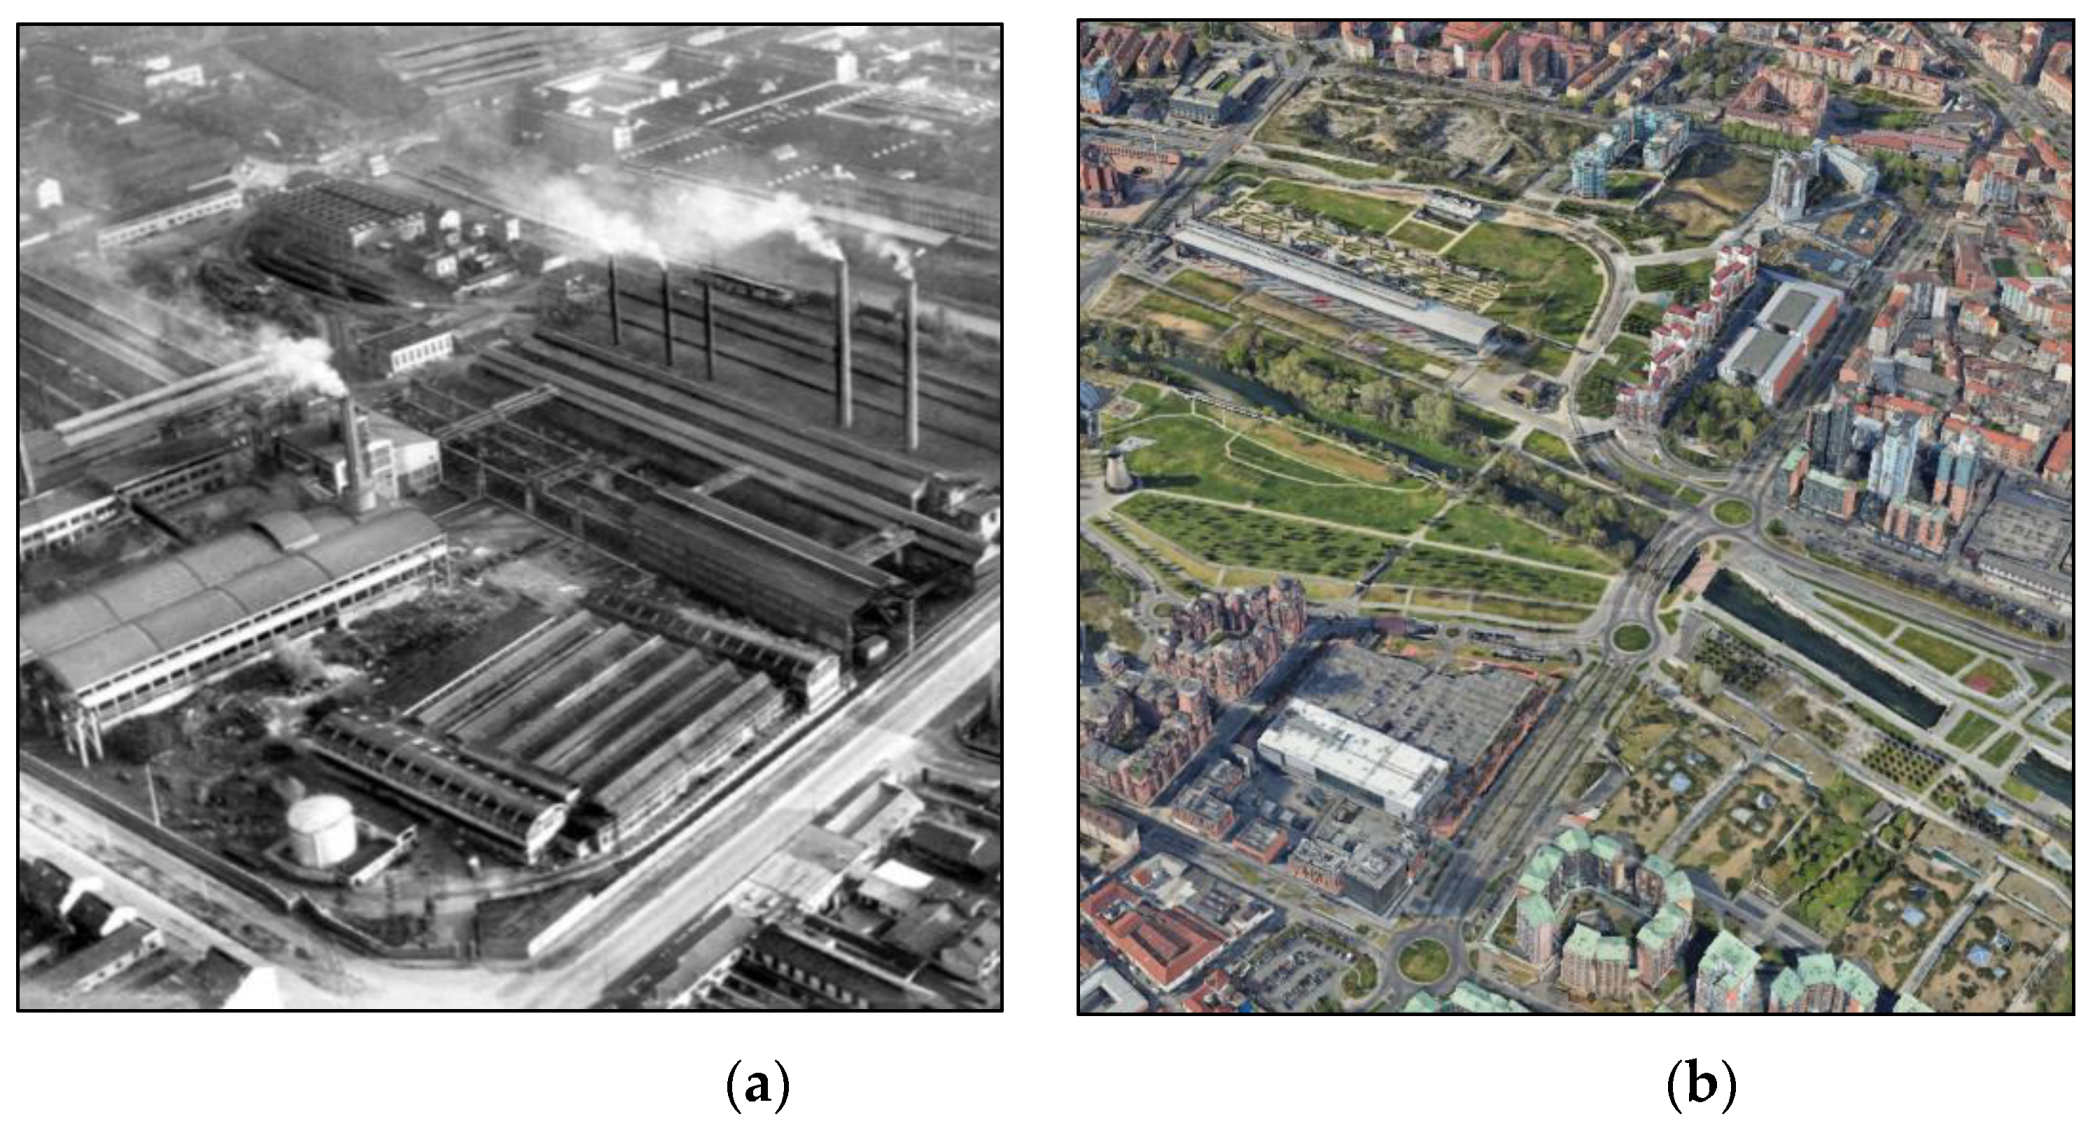
Figure 4.
Representation maps of BCR in Turin (m2/m2) in the years: (a) 2001; (b) 2018.
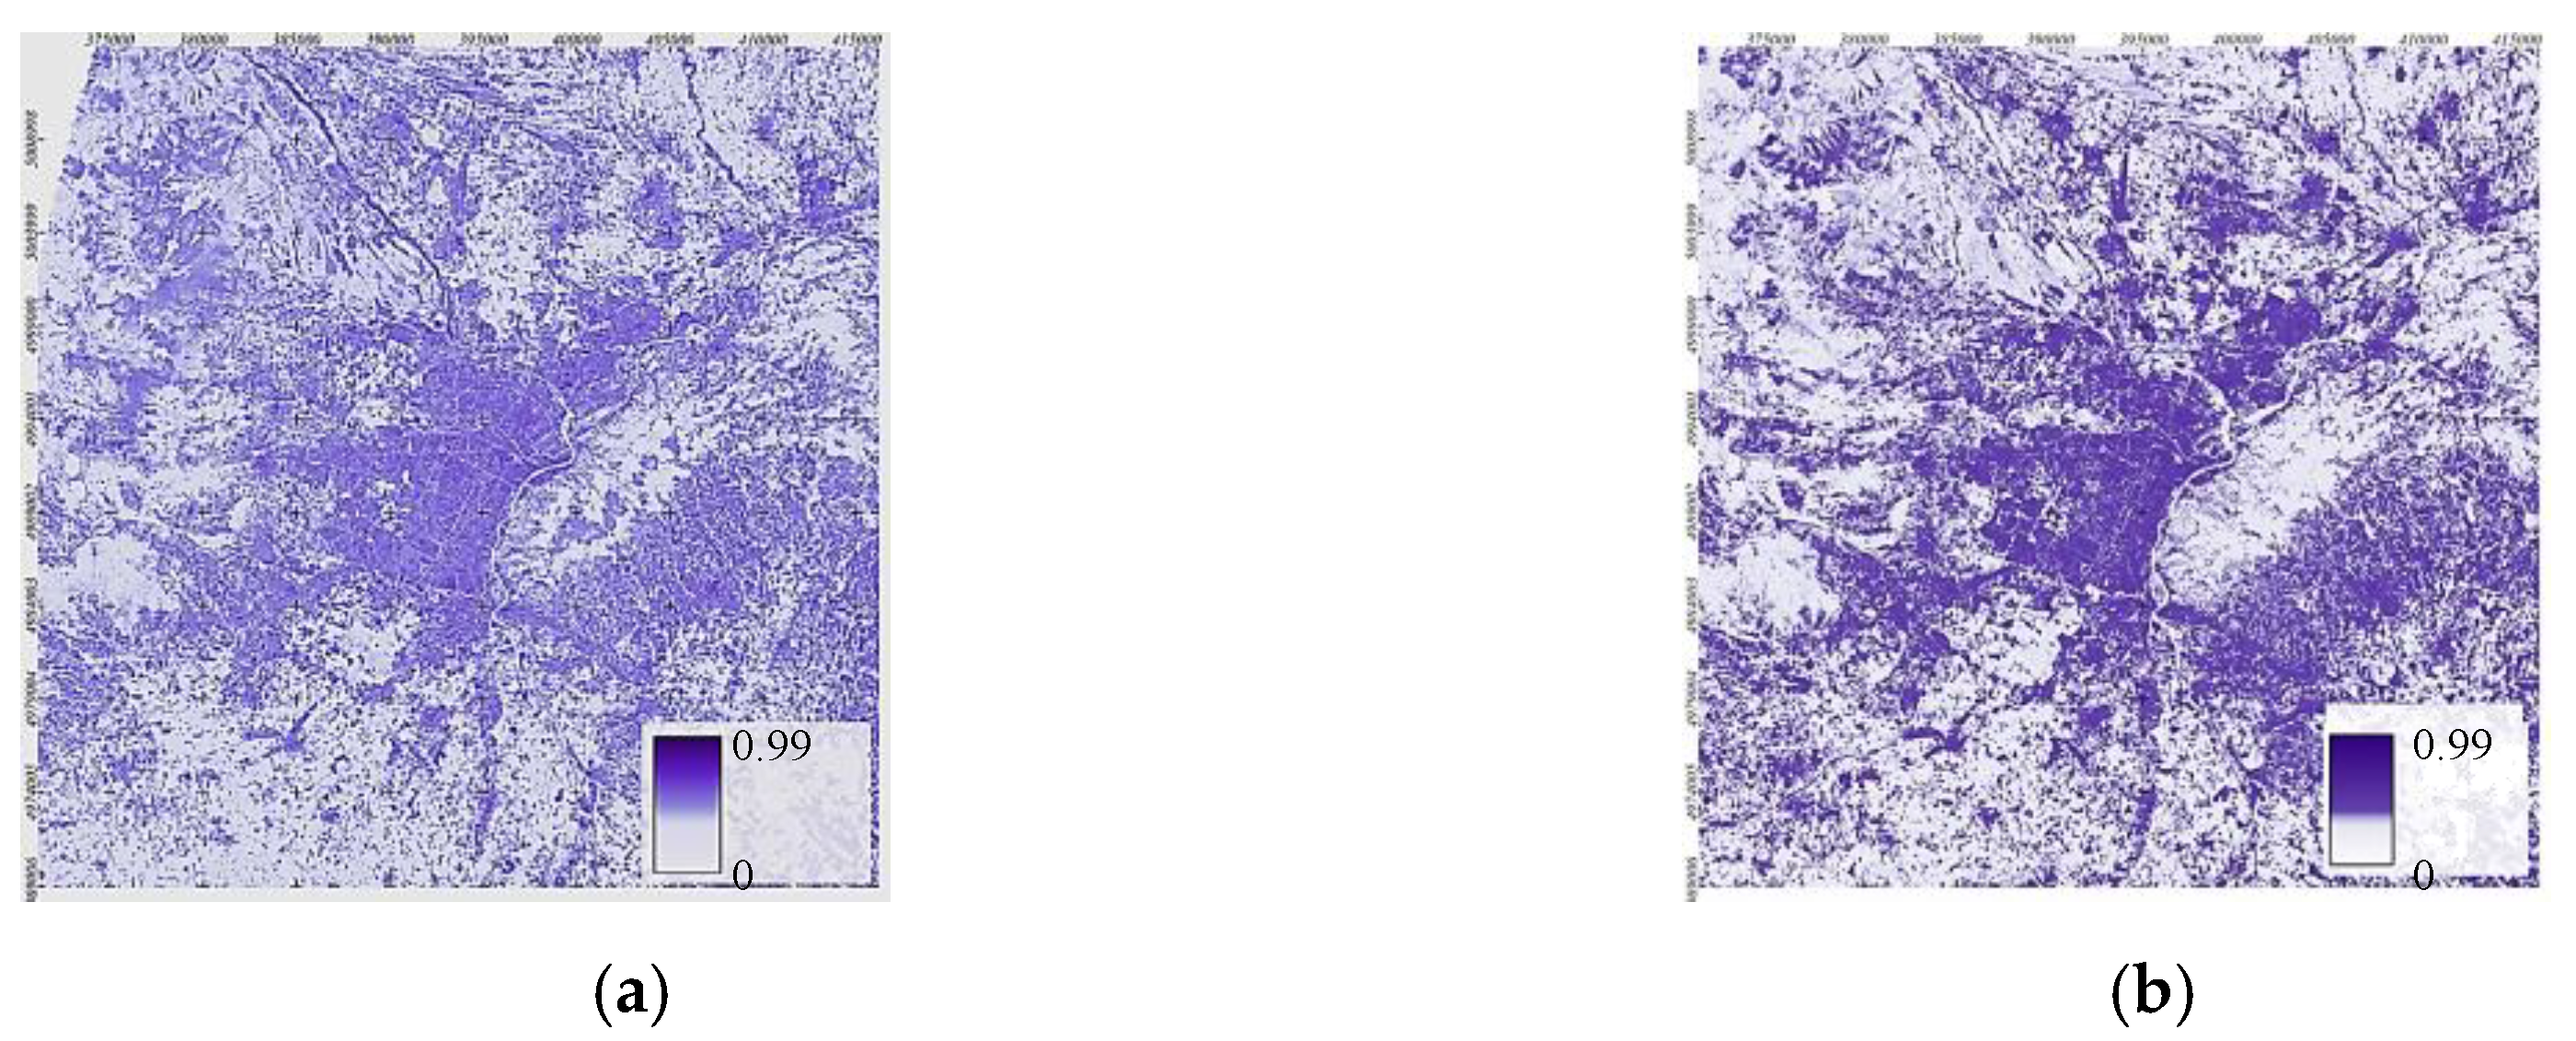
Figure 5.
Representation maps of NDVI in August in the years: (a) 2001; (b) 2018.
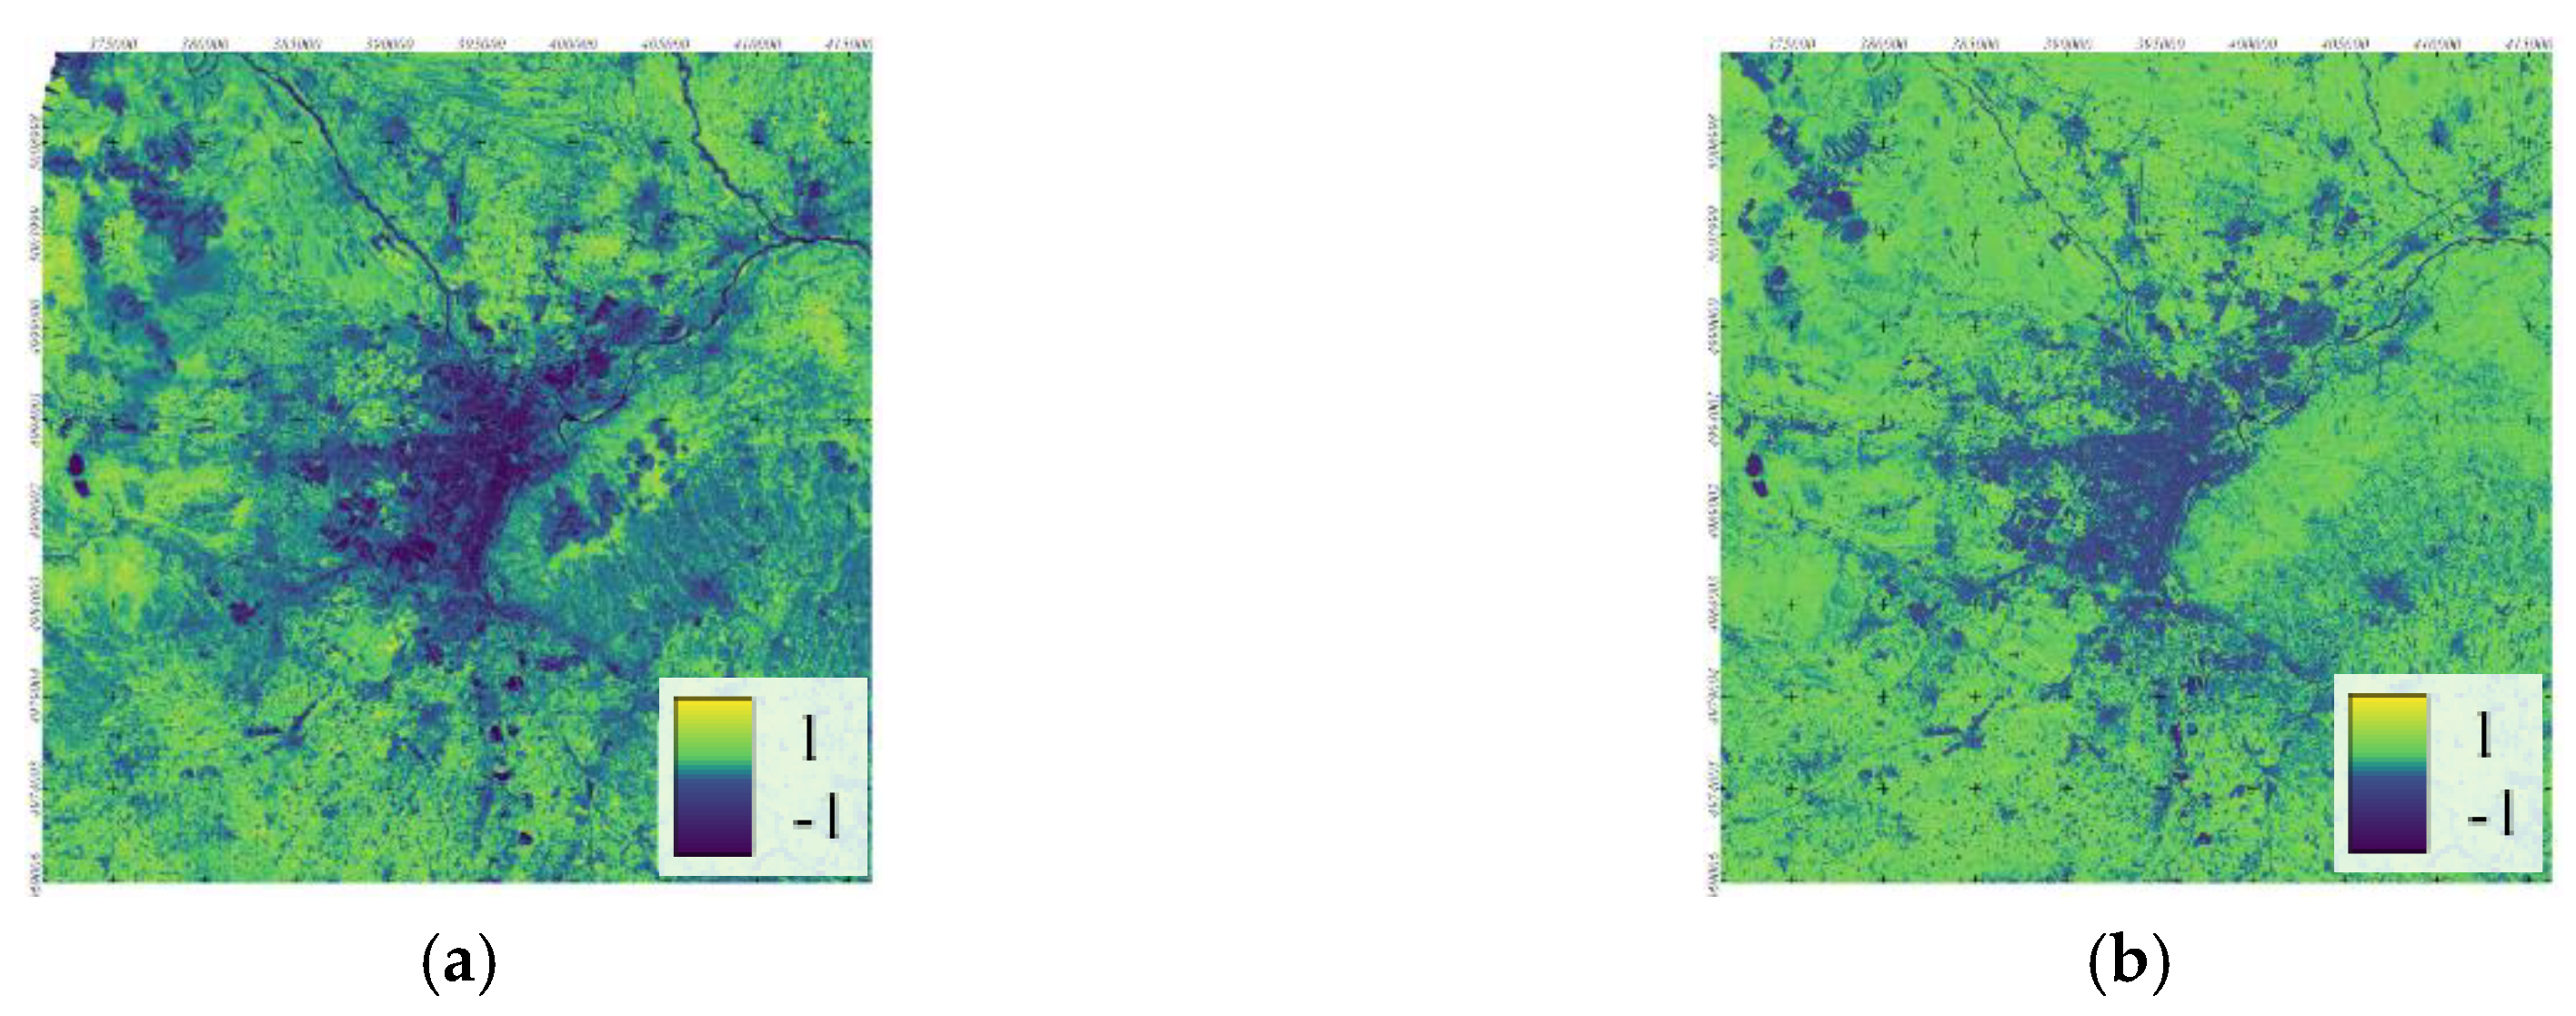
Figure 6.
SUHII elaborated from satellite imagery in August: (a) 2001; (b) 2018.
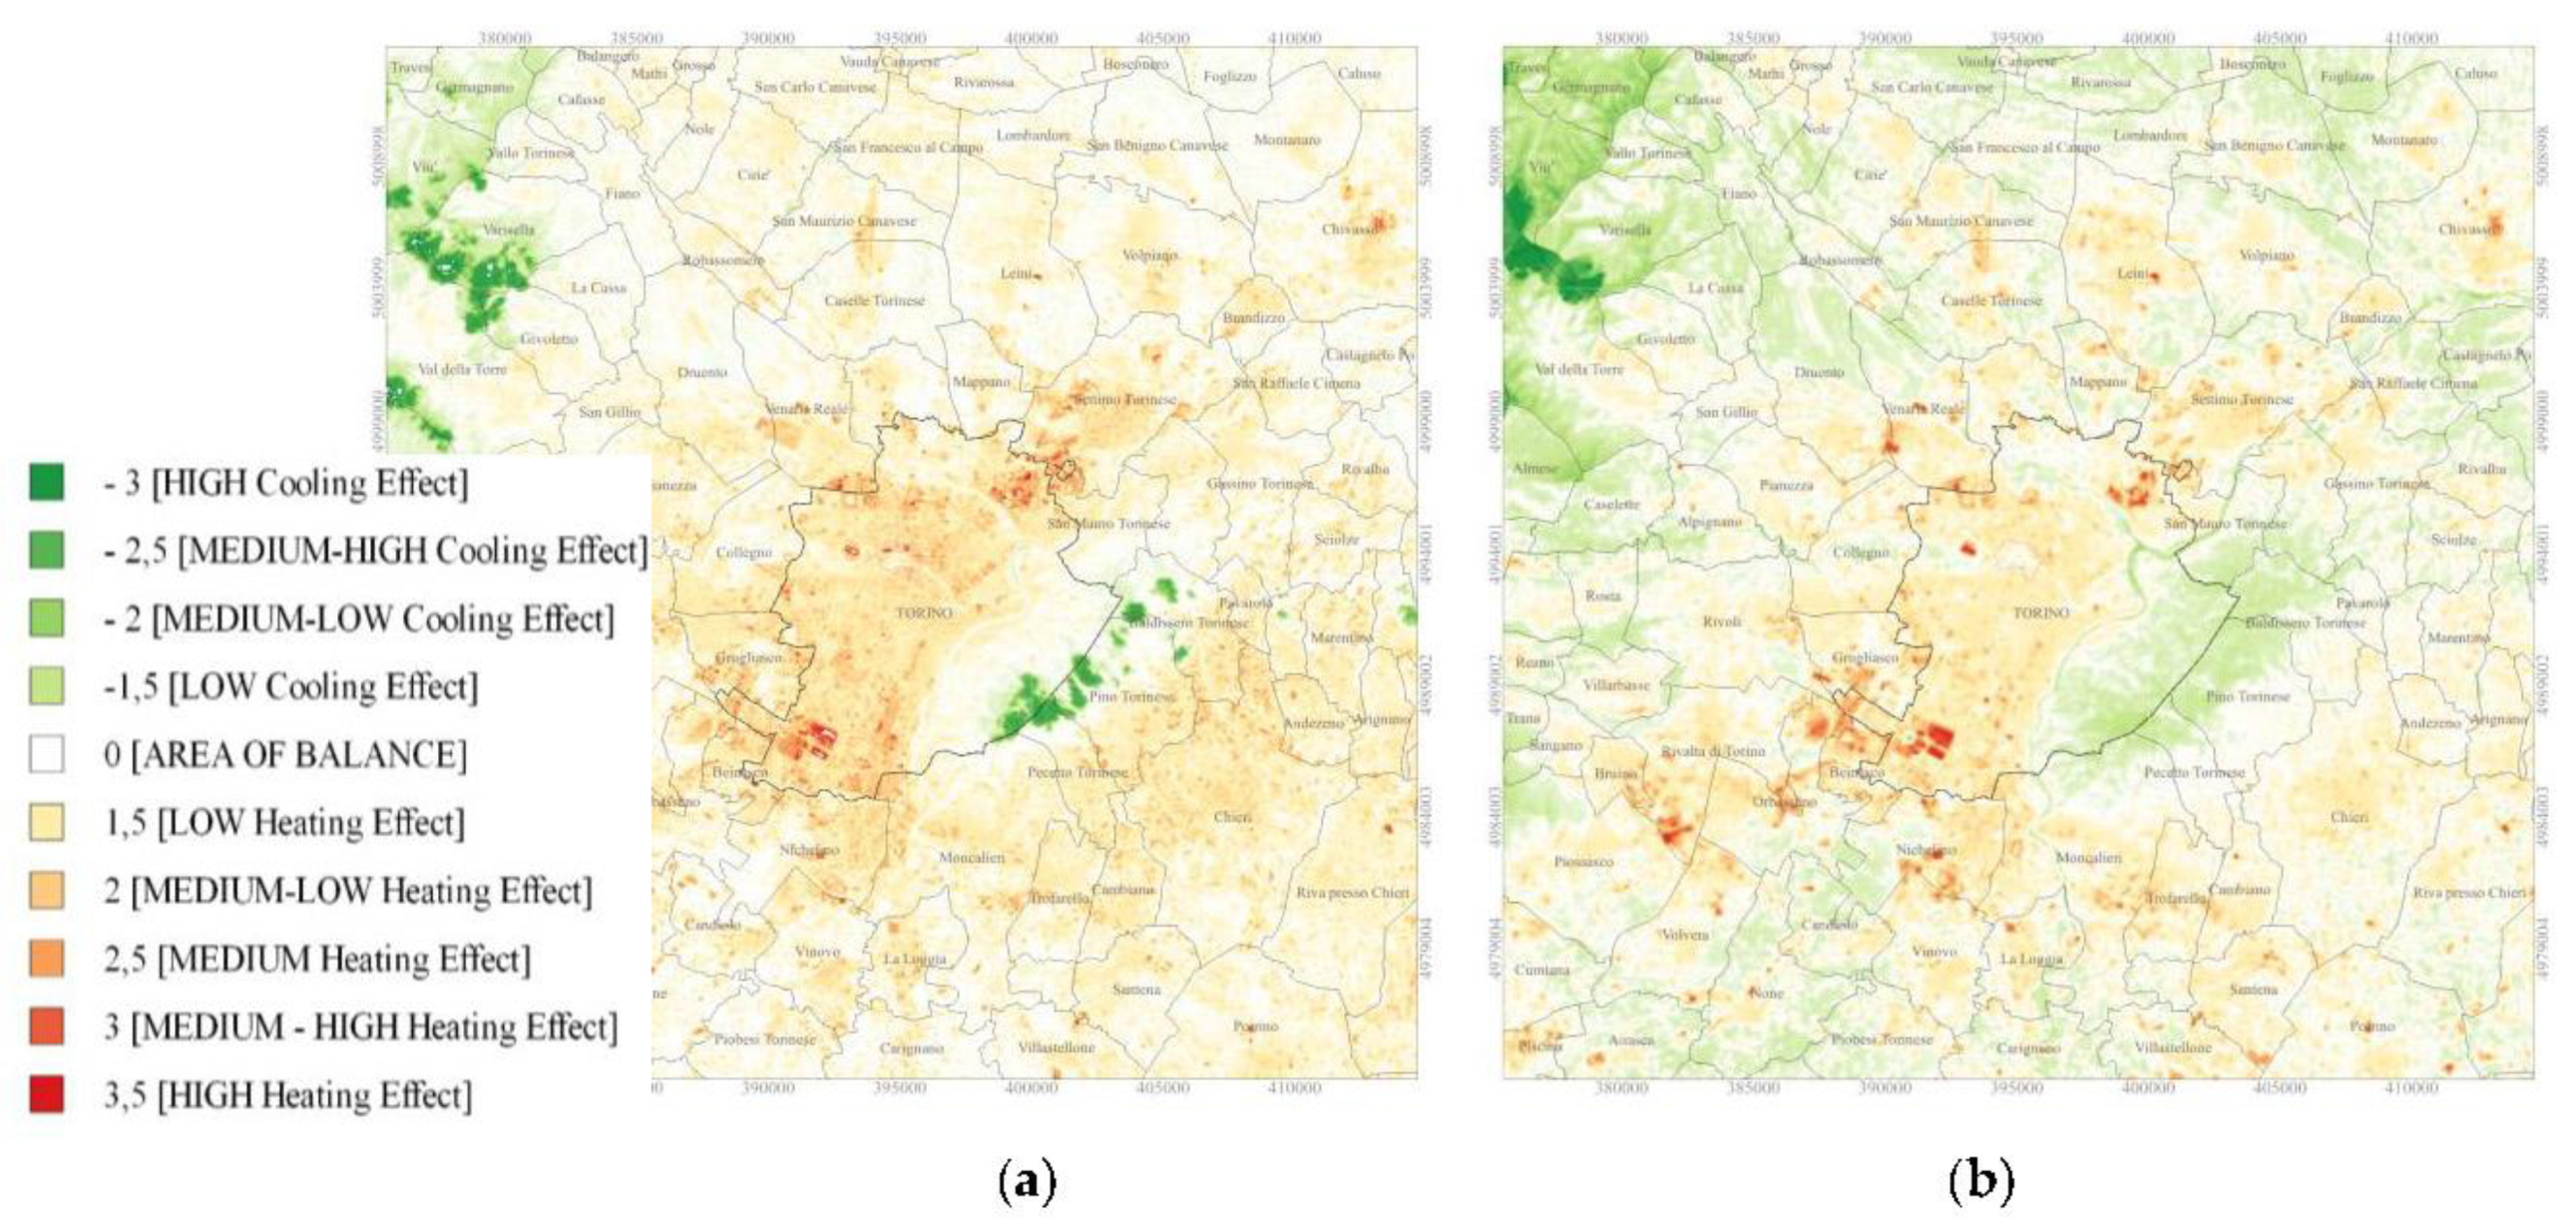
Figure 7.
Random Forest regression modeling (authors’ own elaboration).
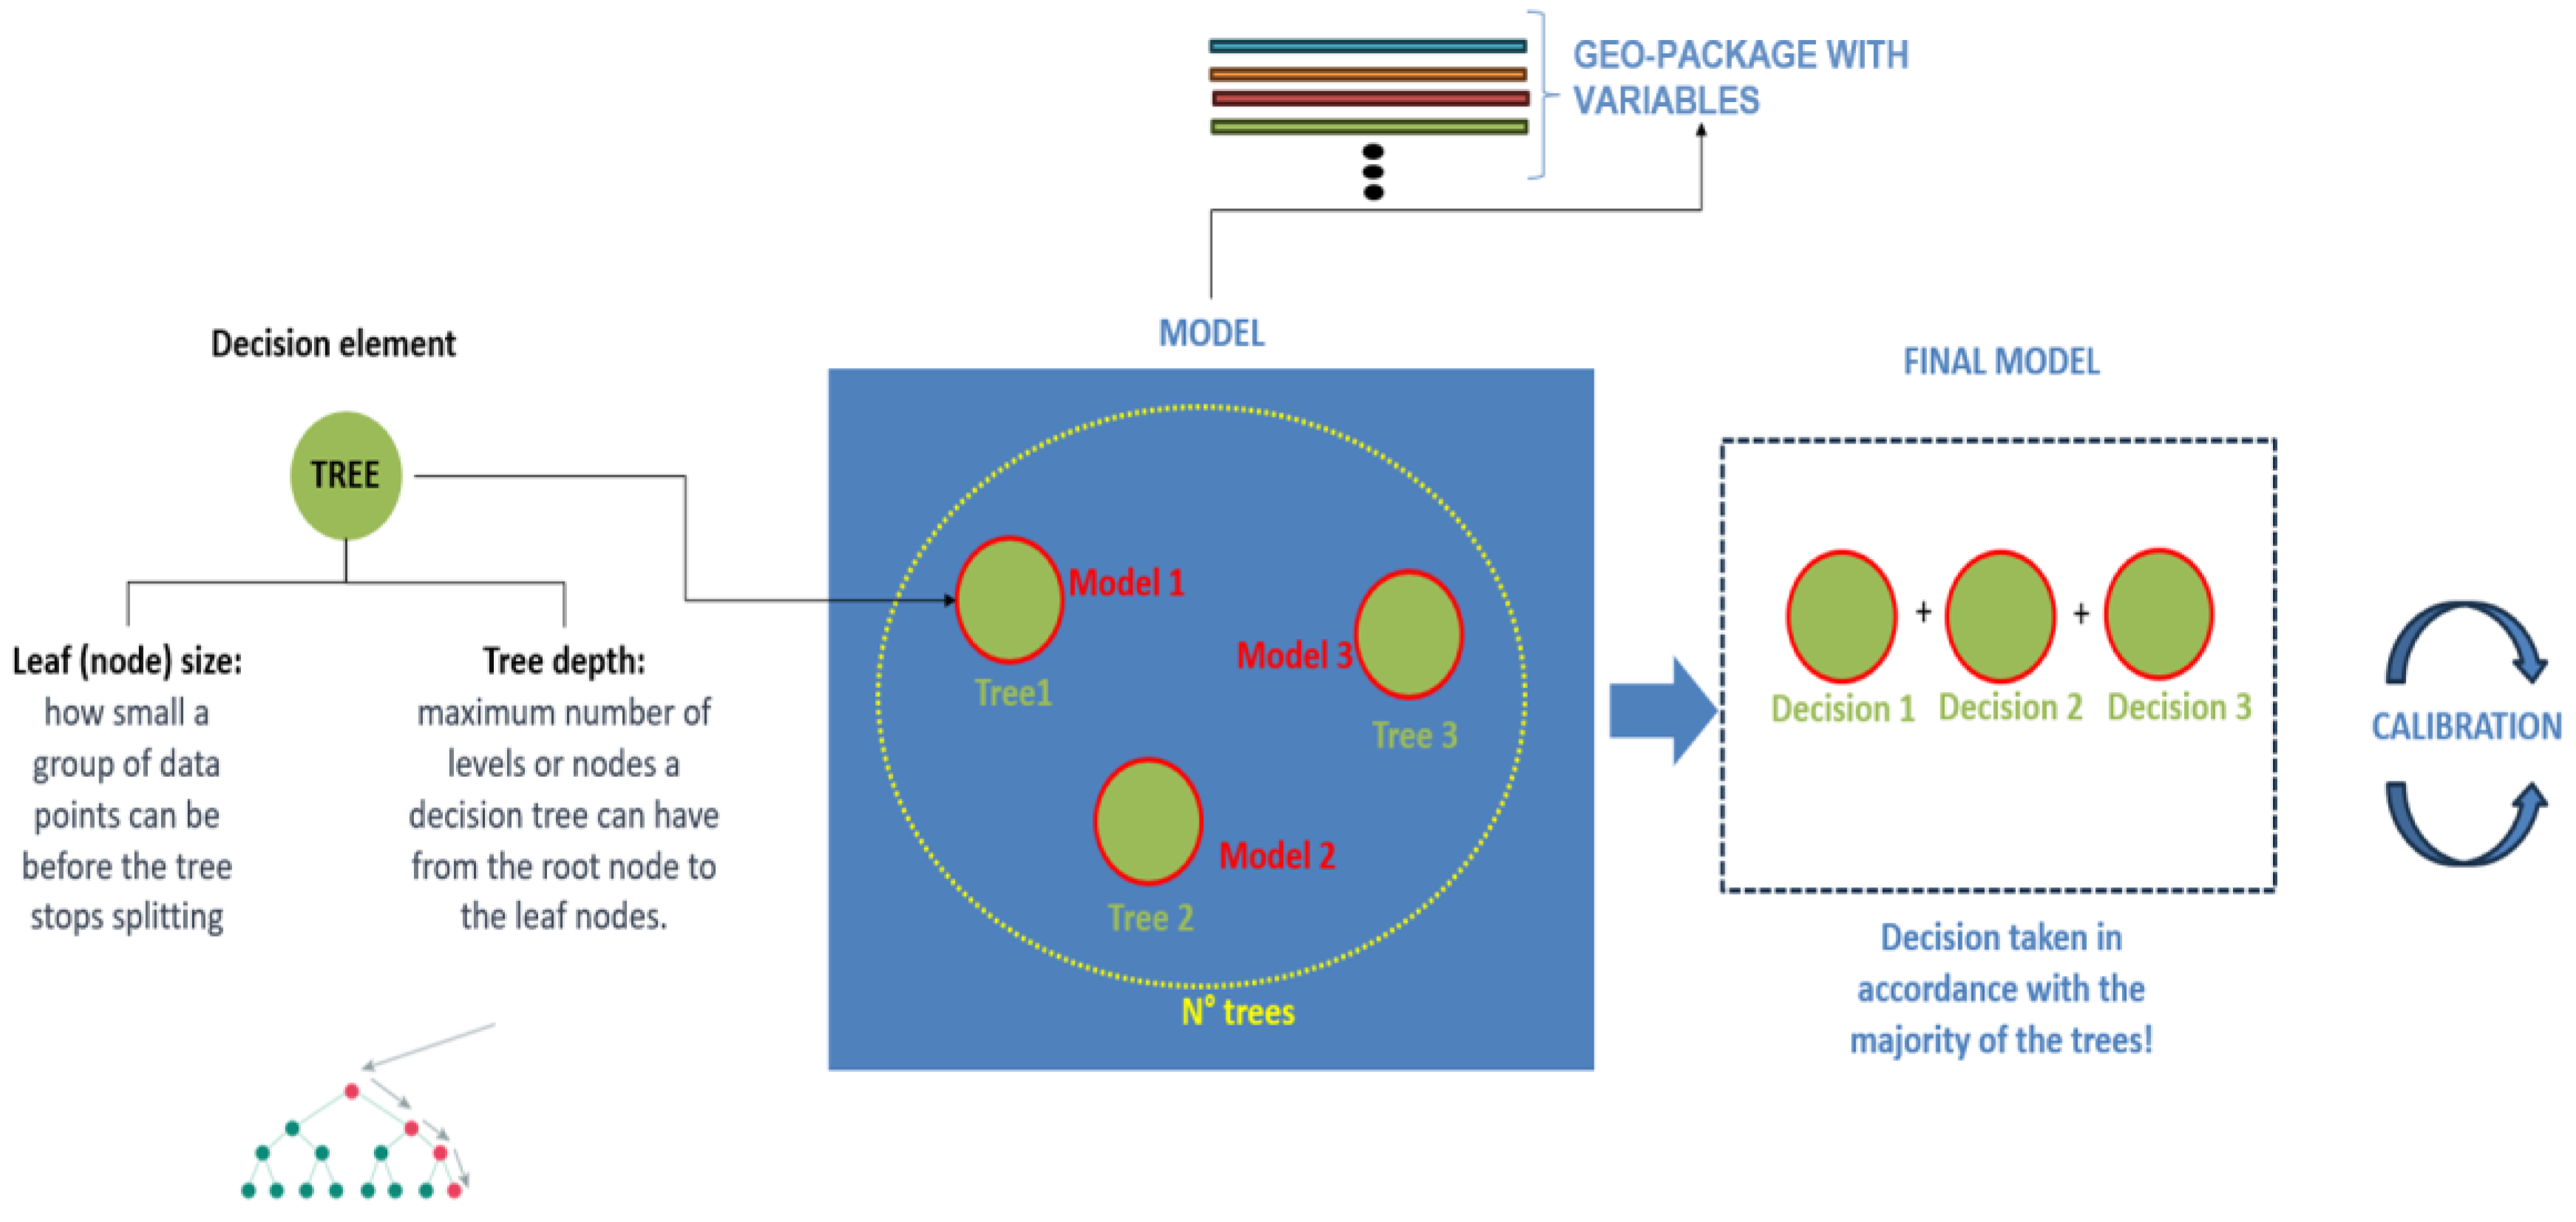
Figure 8.
Line fit plots of SUHII-related variables.
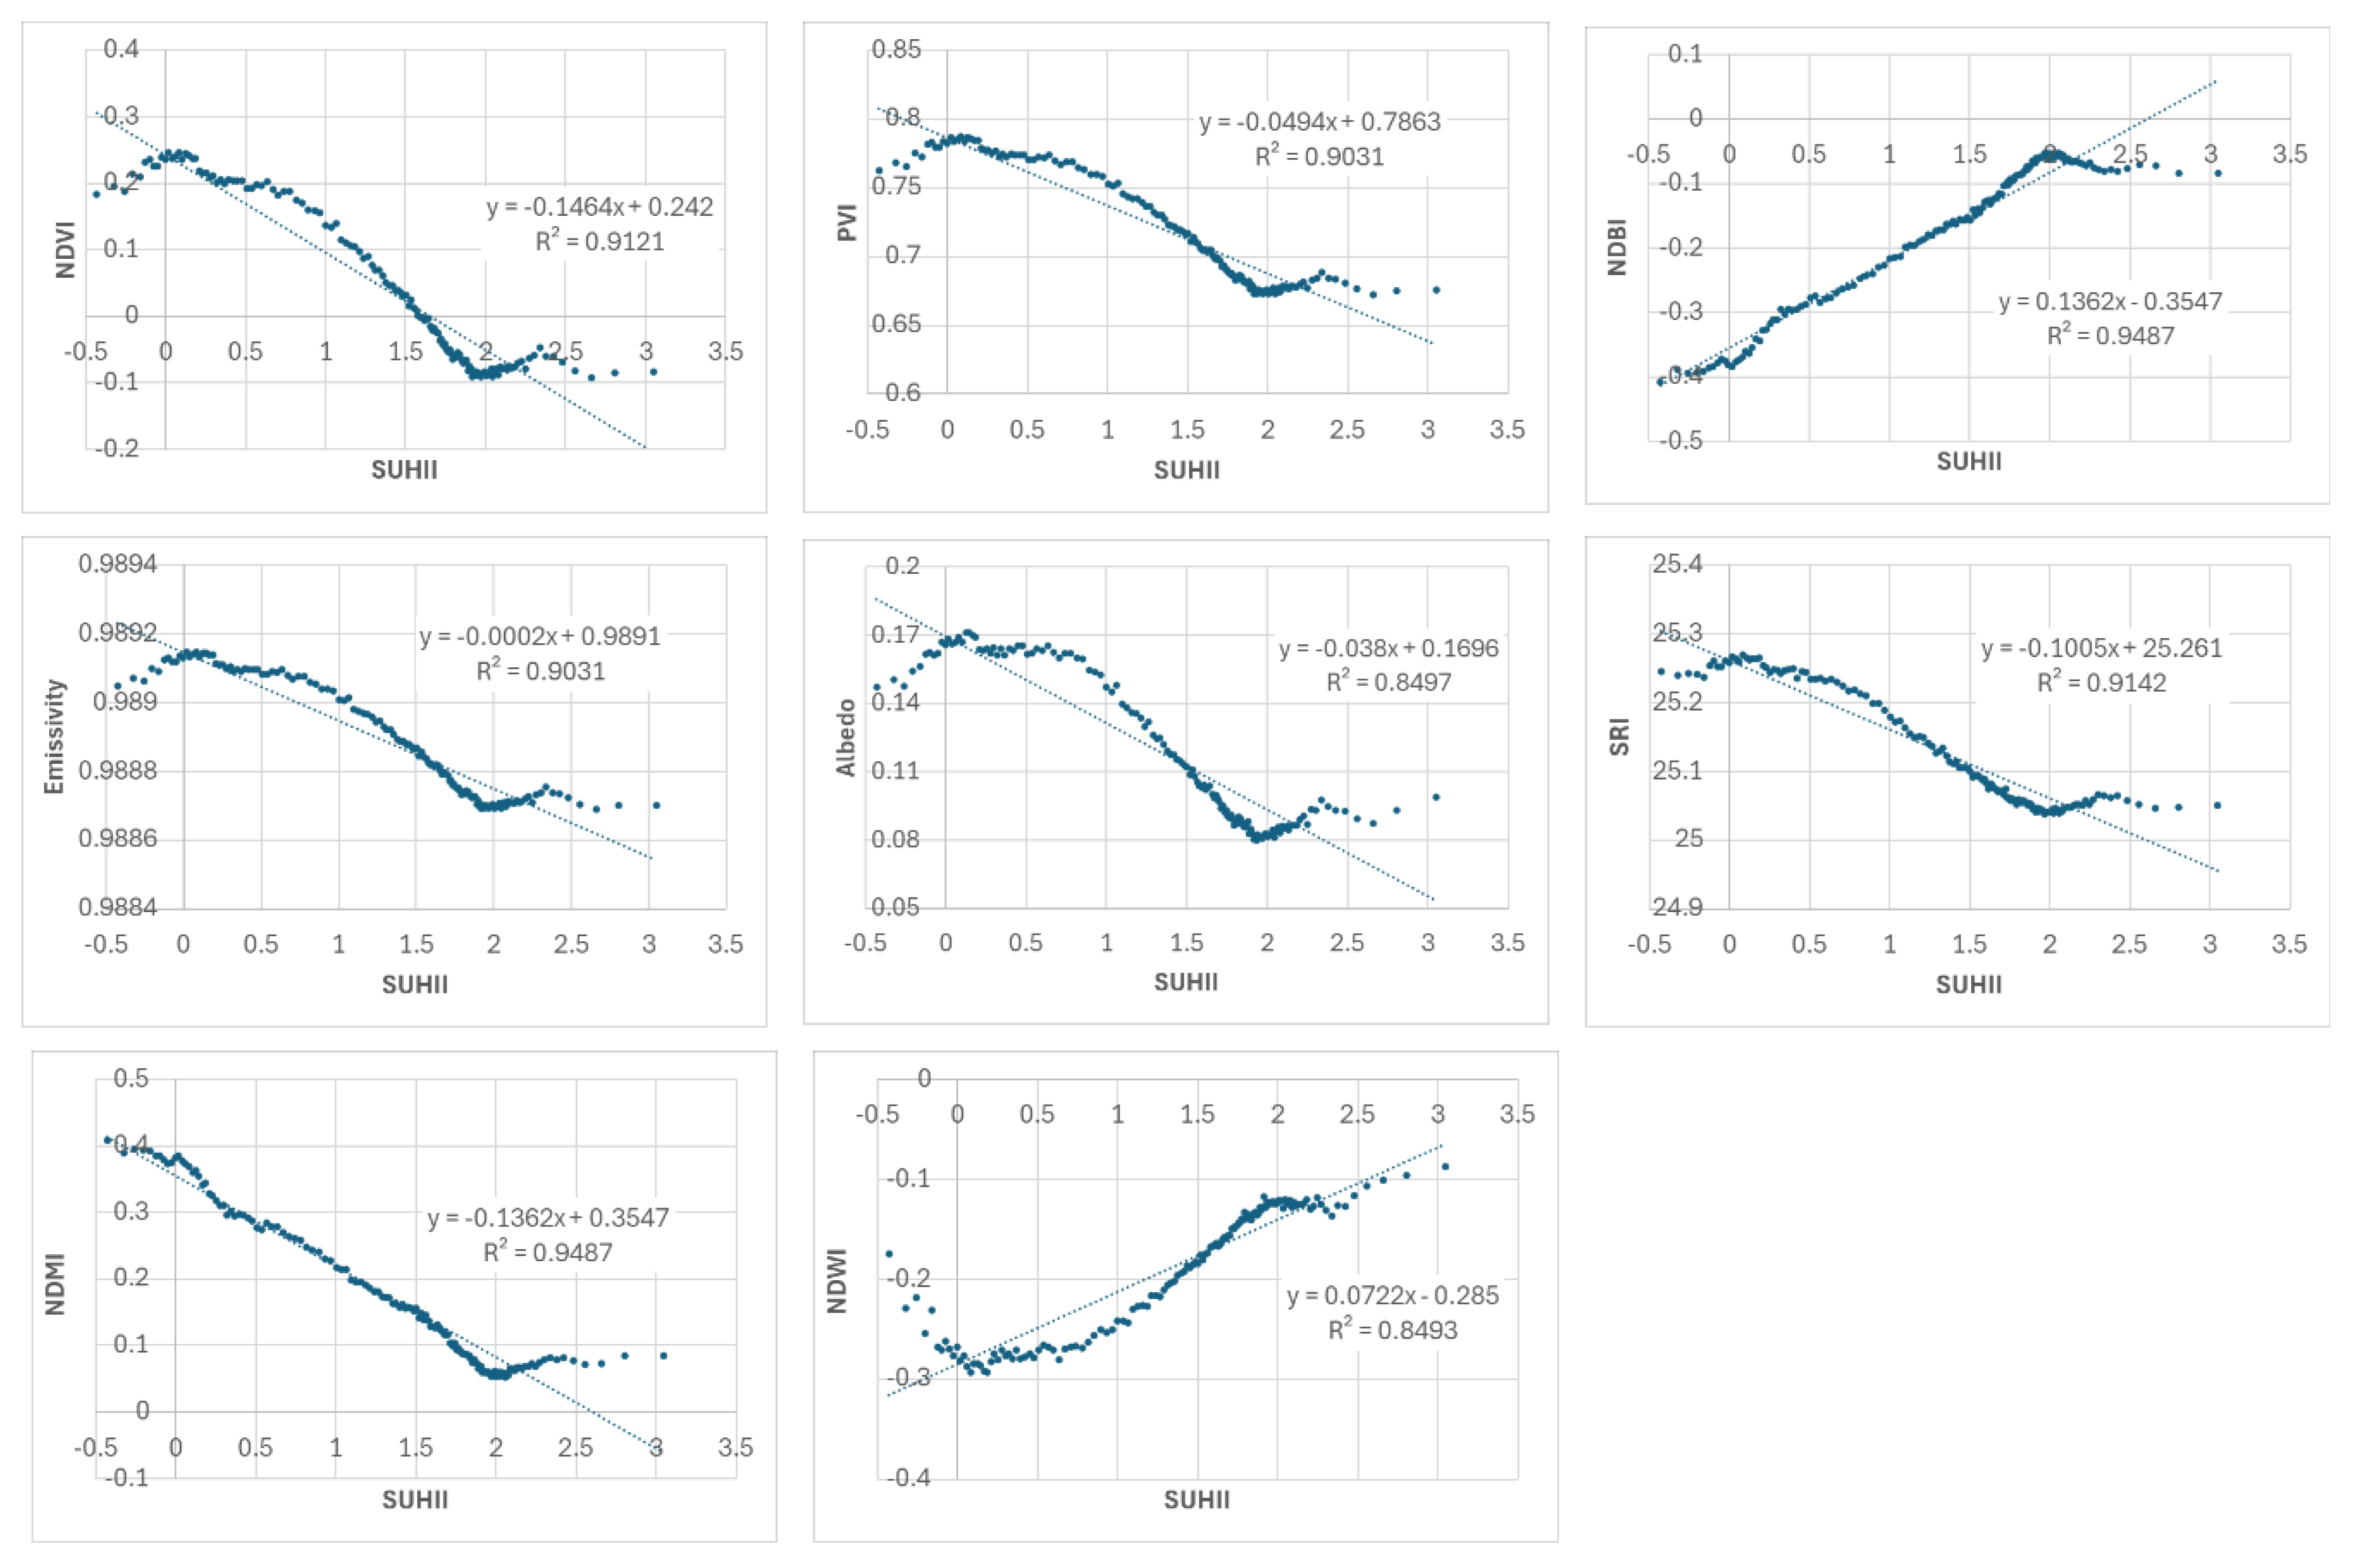
Figure 9.
Multilinear regression of SUHII.
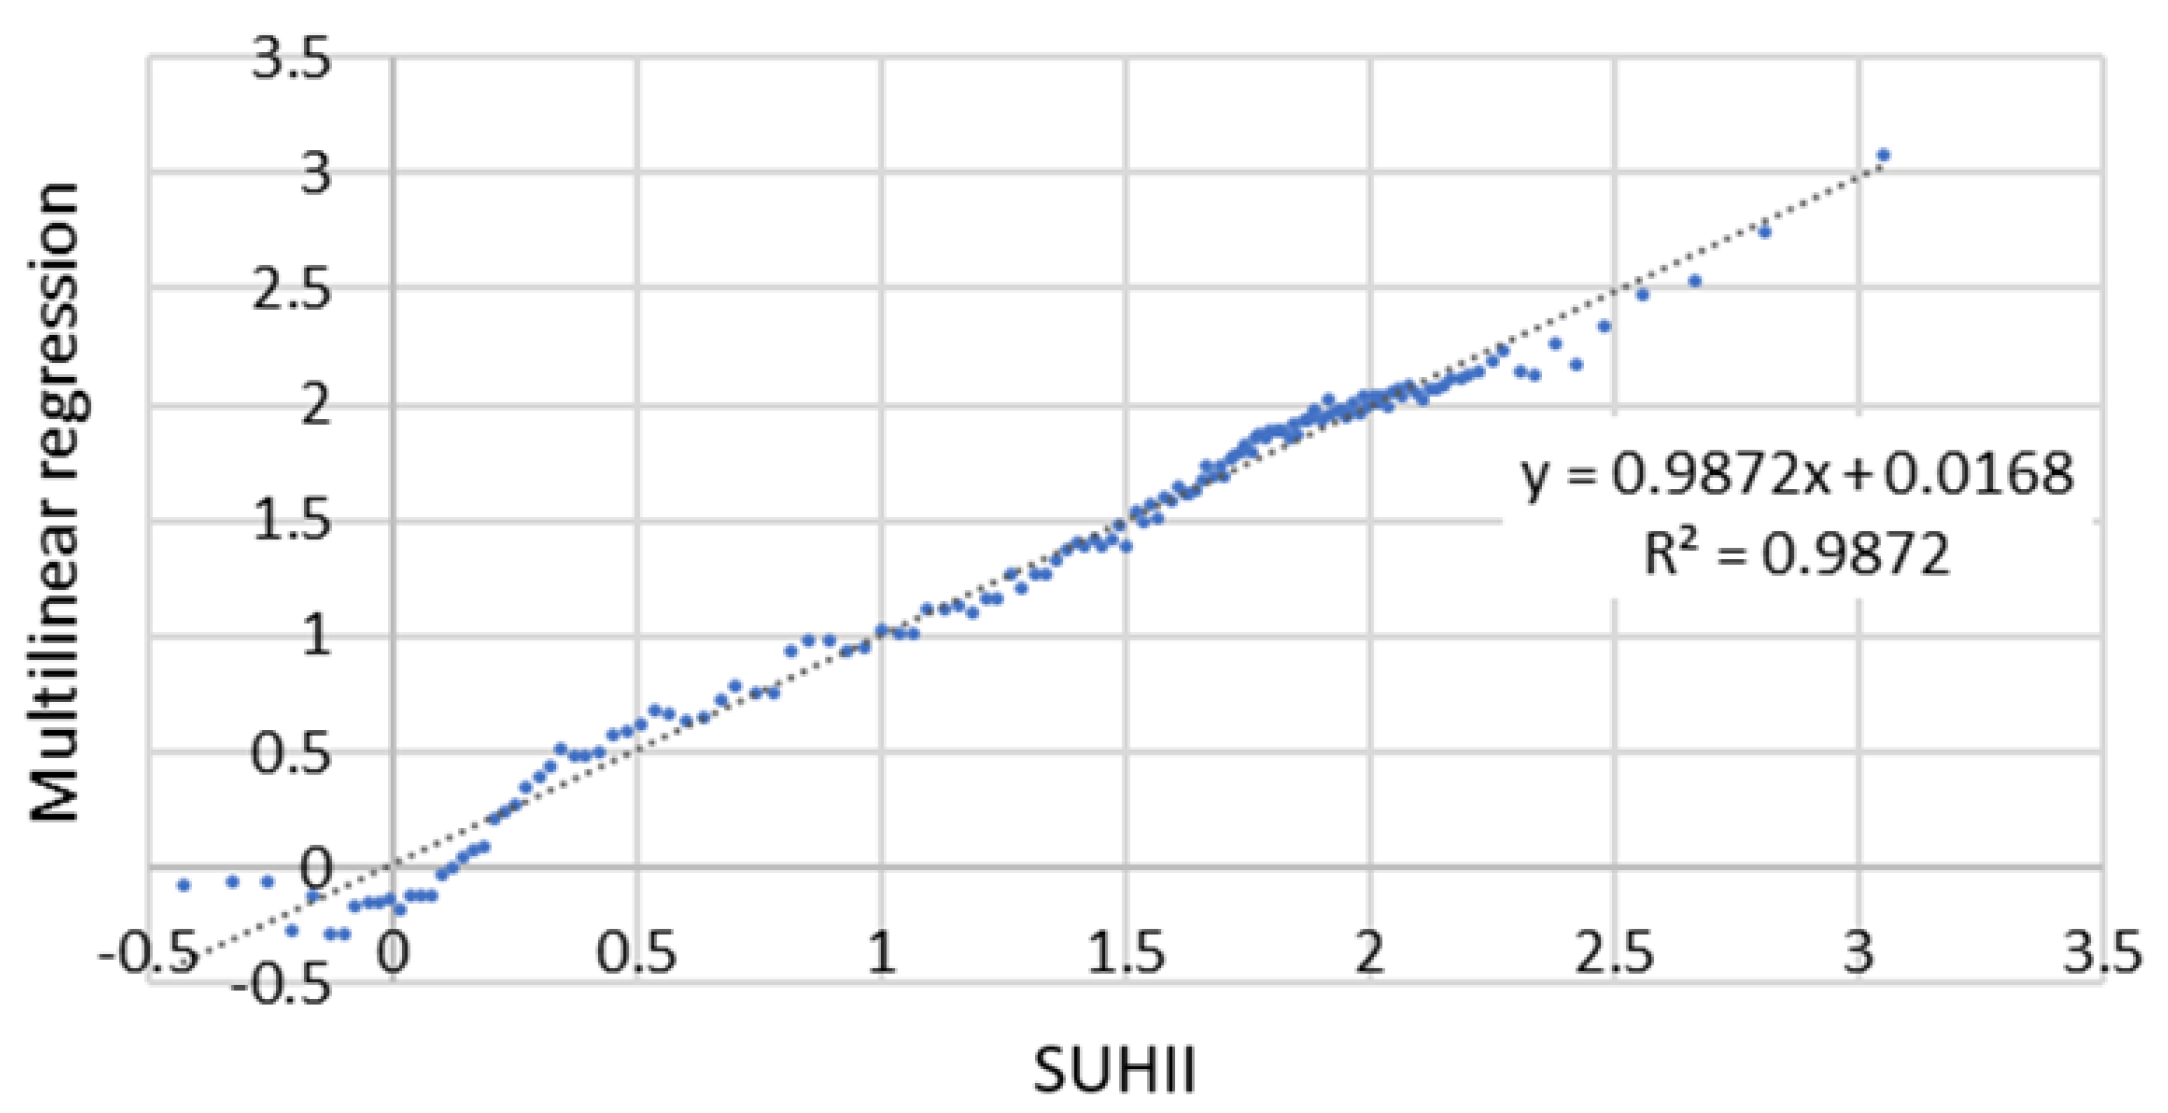
Figure 10.
Comparison of SUHII in the different seasons of 2001 and 2018 in the ex-Teksid area.
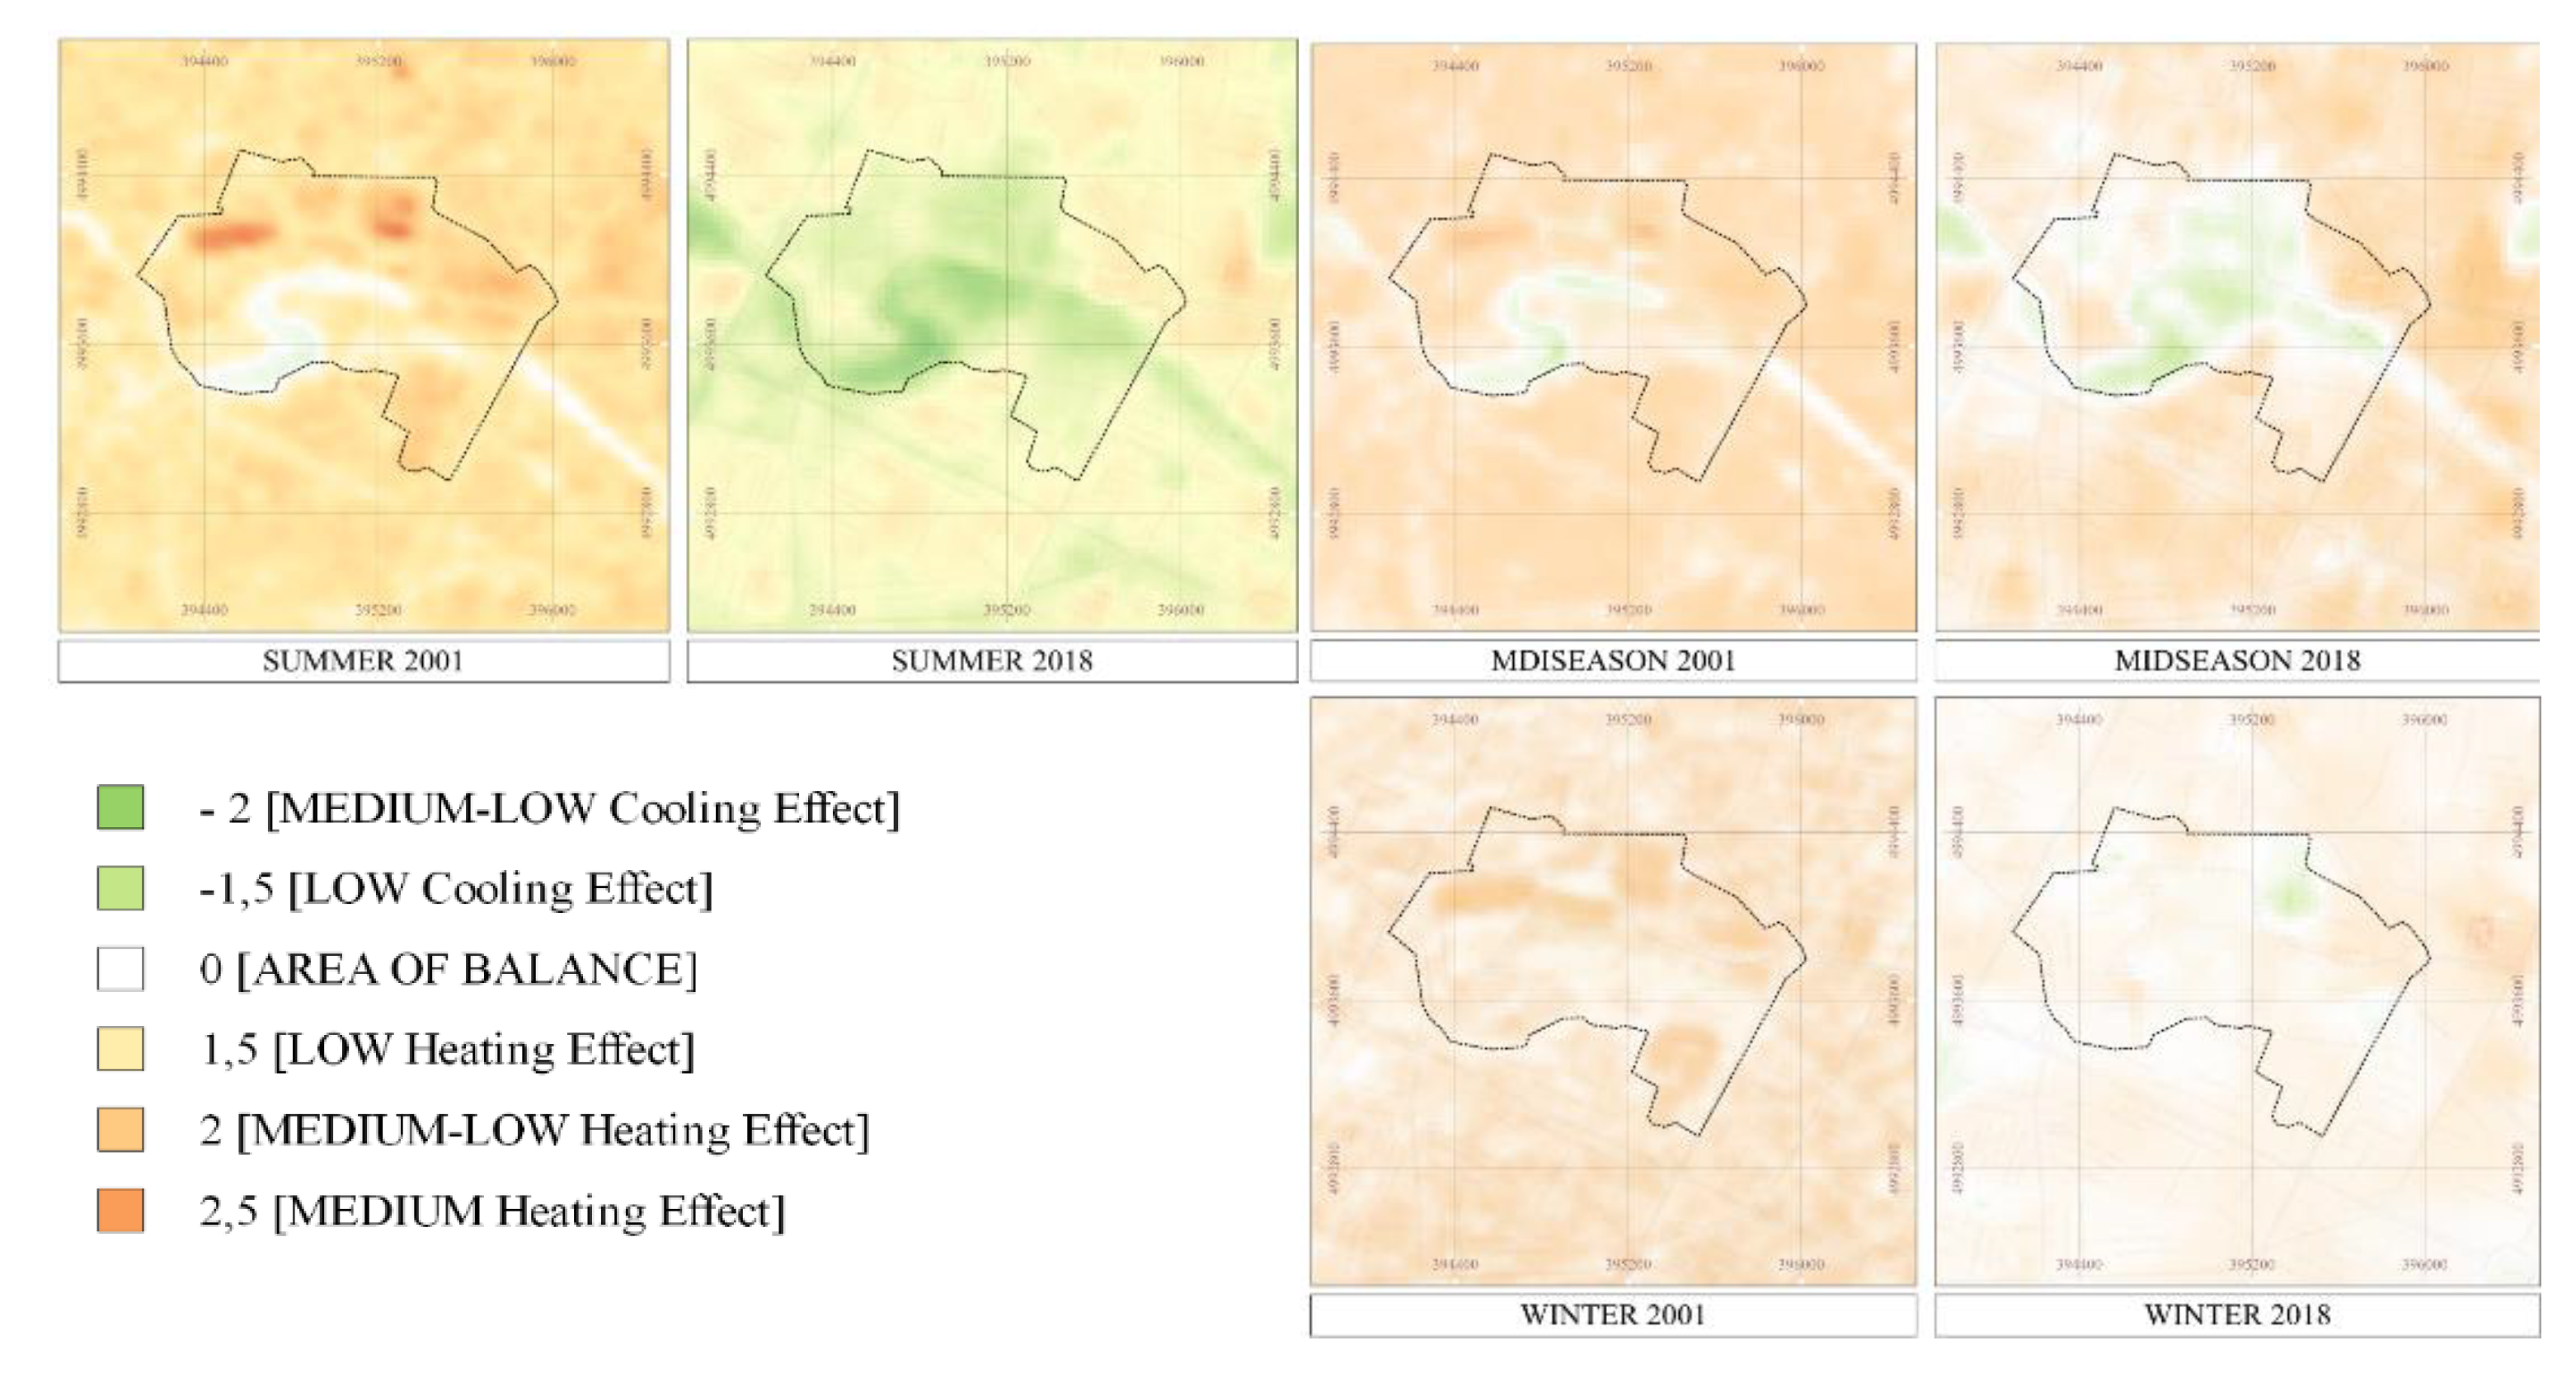
Figure 11.
NDVI during summer in 2001 and 2018 in the ex-Teksid area.
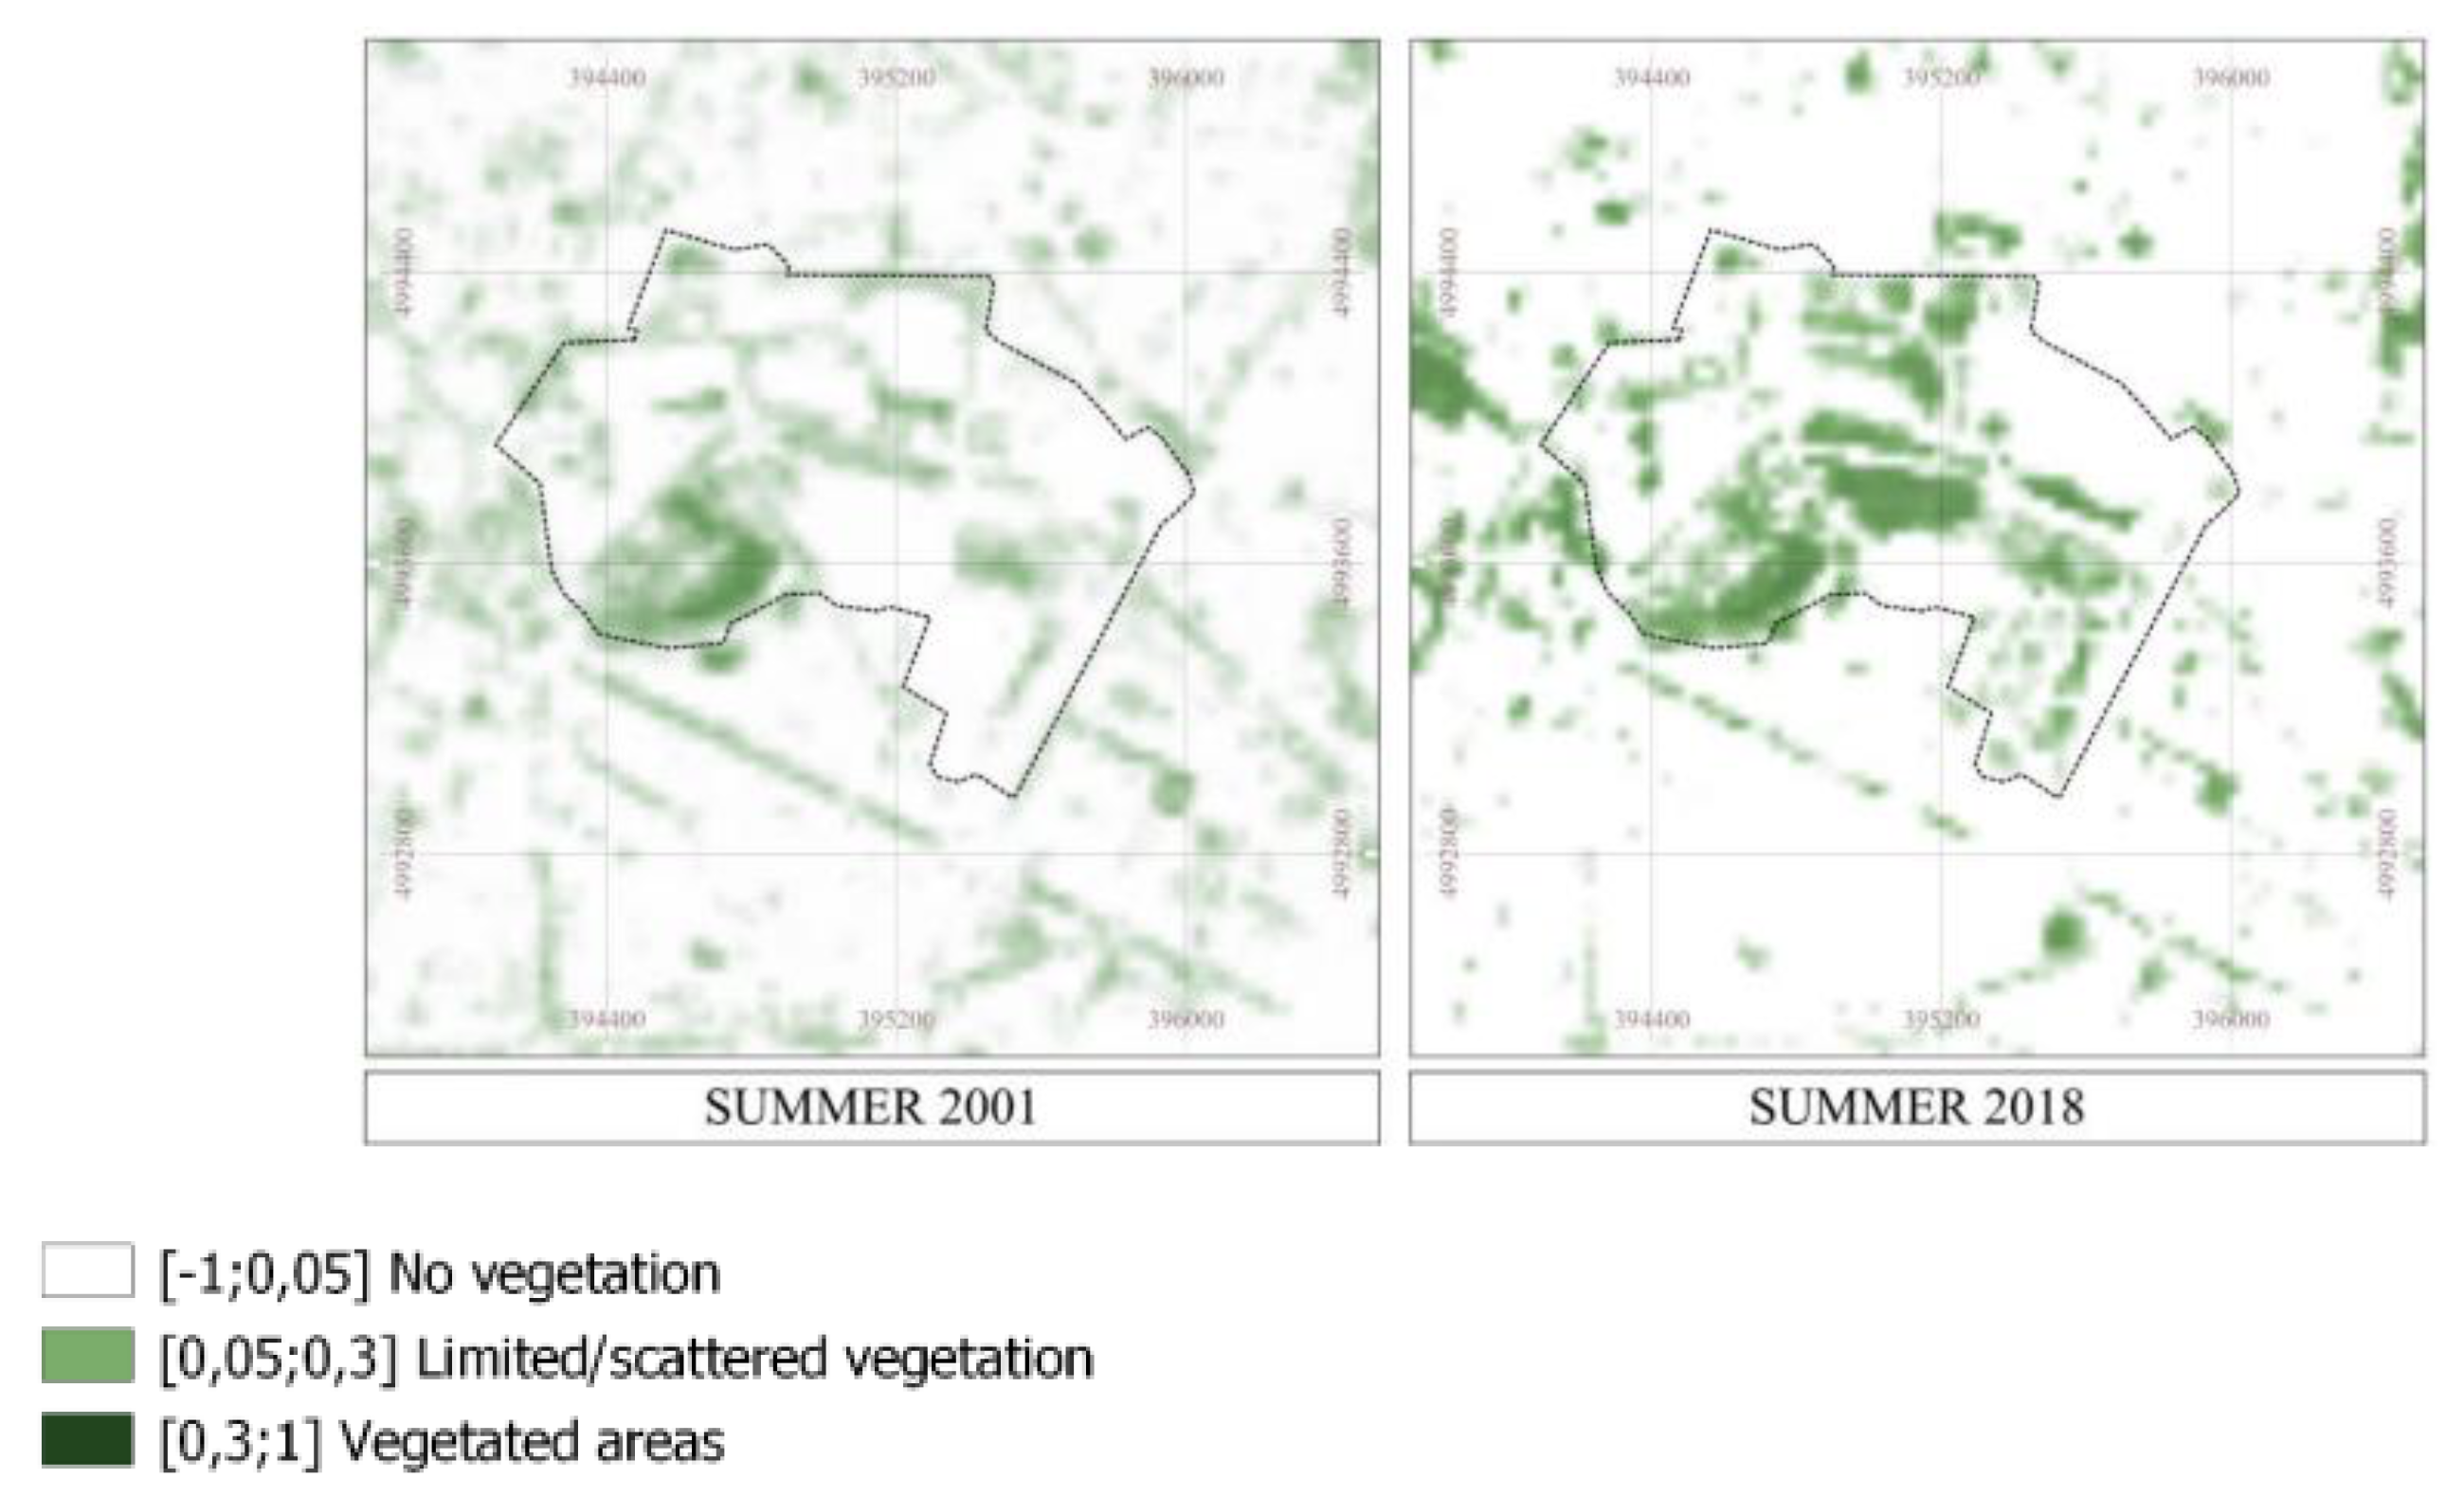
Figure 12.
NDMI during midseason in 2001 and 2018 in the ex-Teksid area.
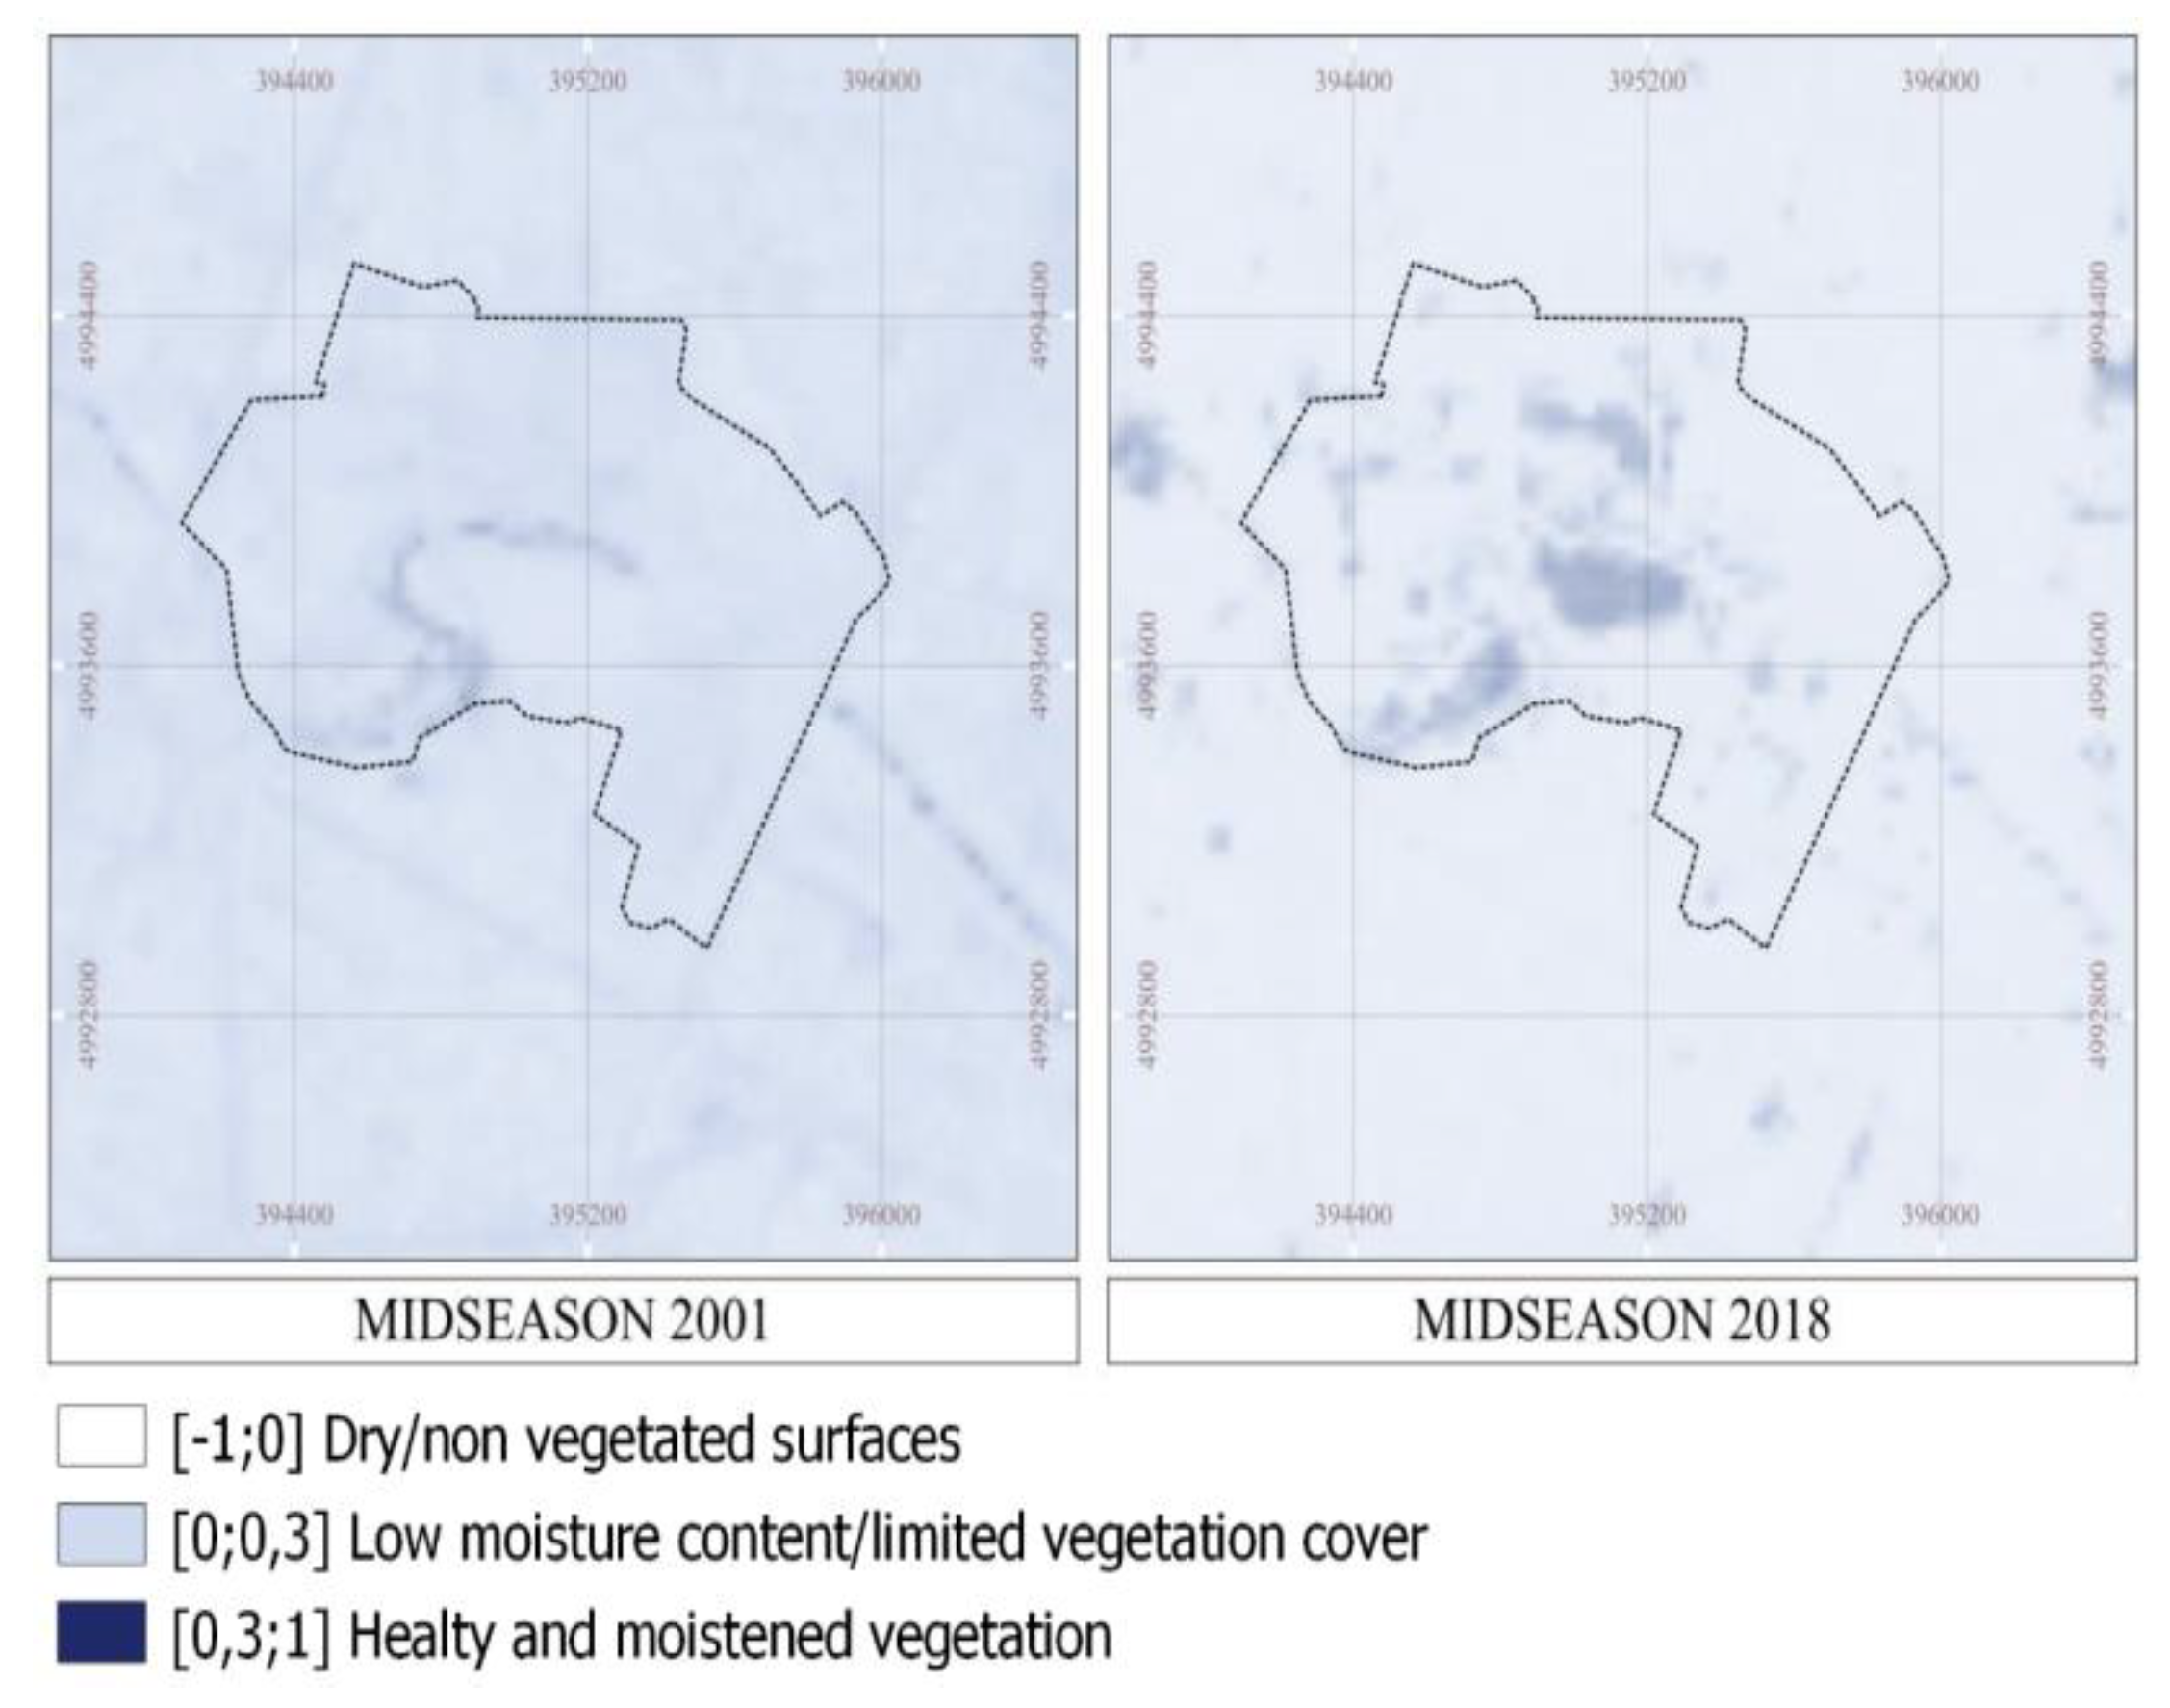
Figure 13.
Albedo during summer in 2001 and 2018 in the ex-Teksid area.
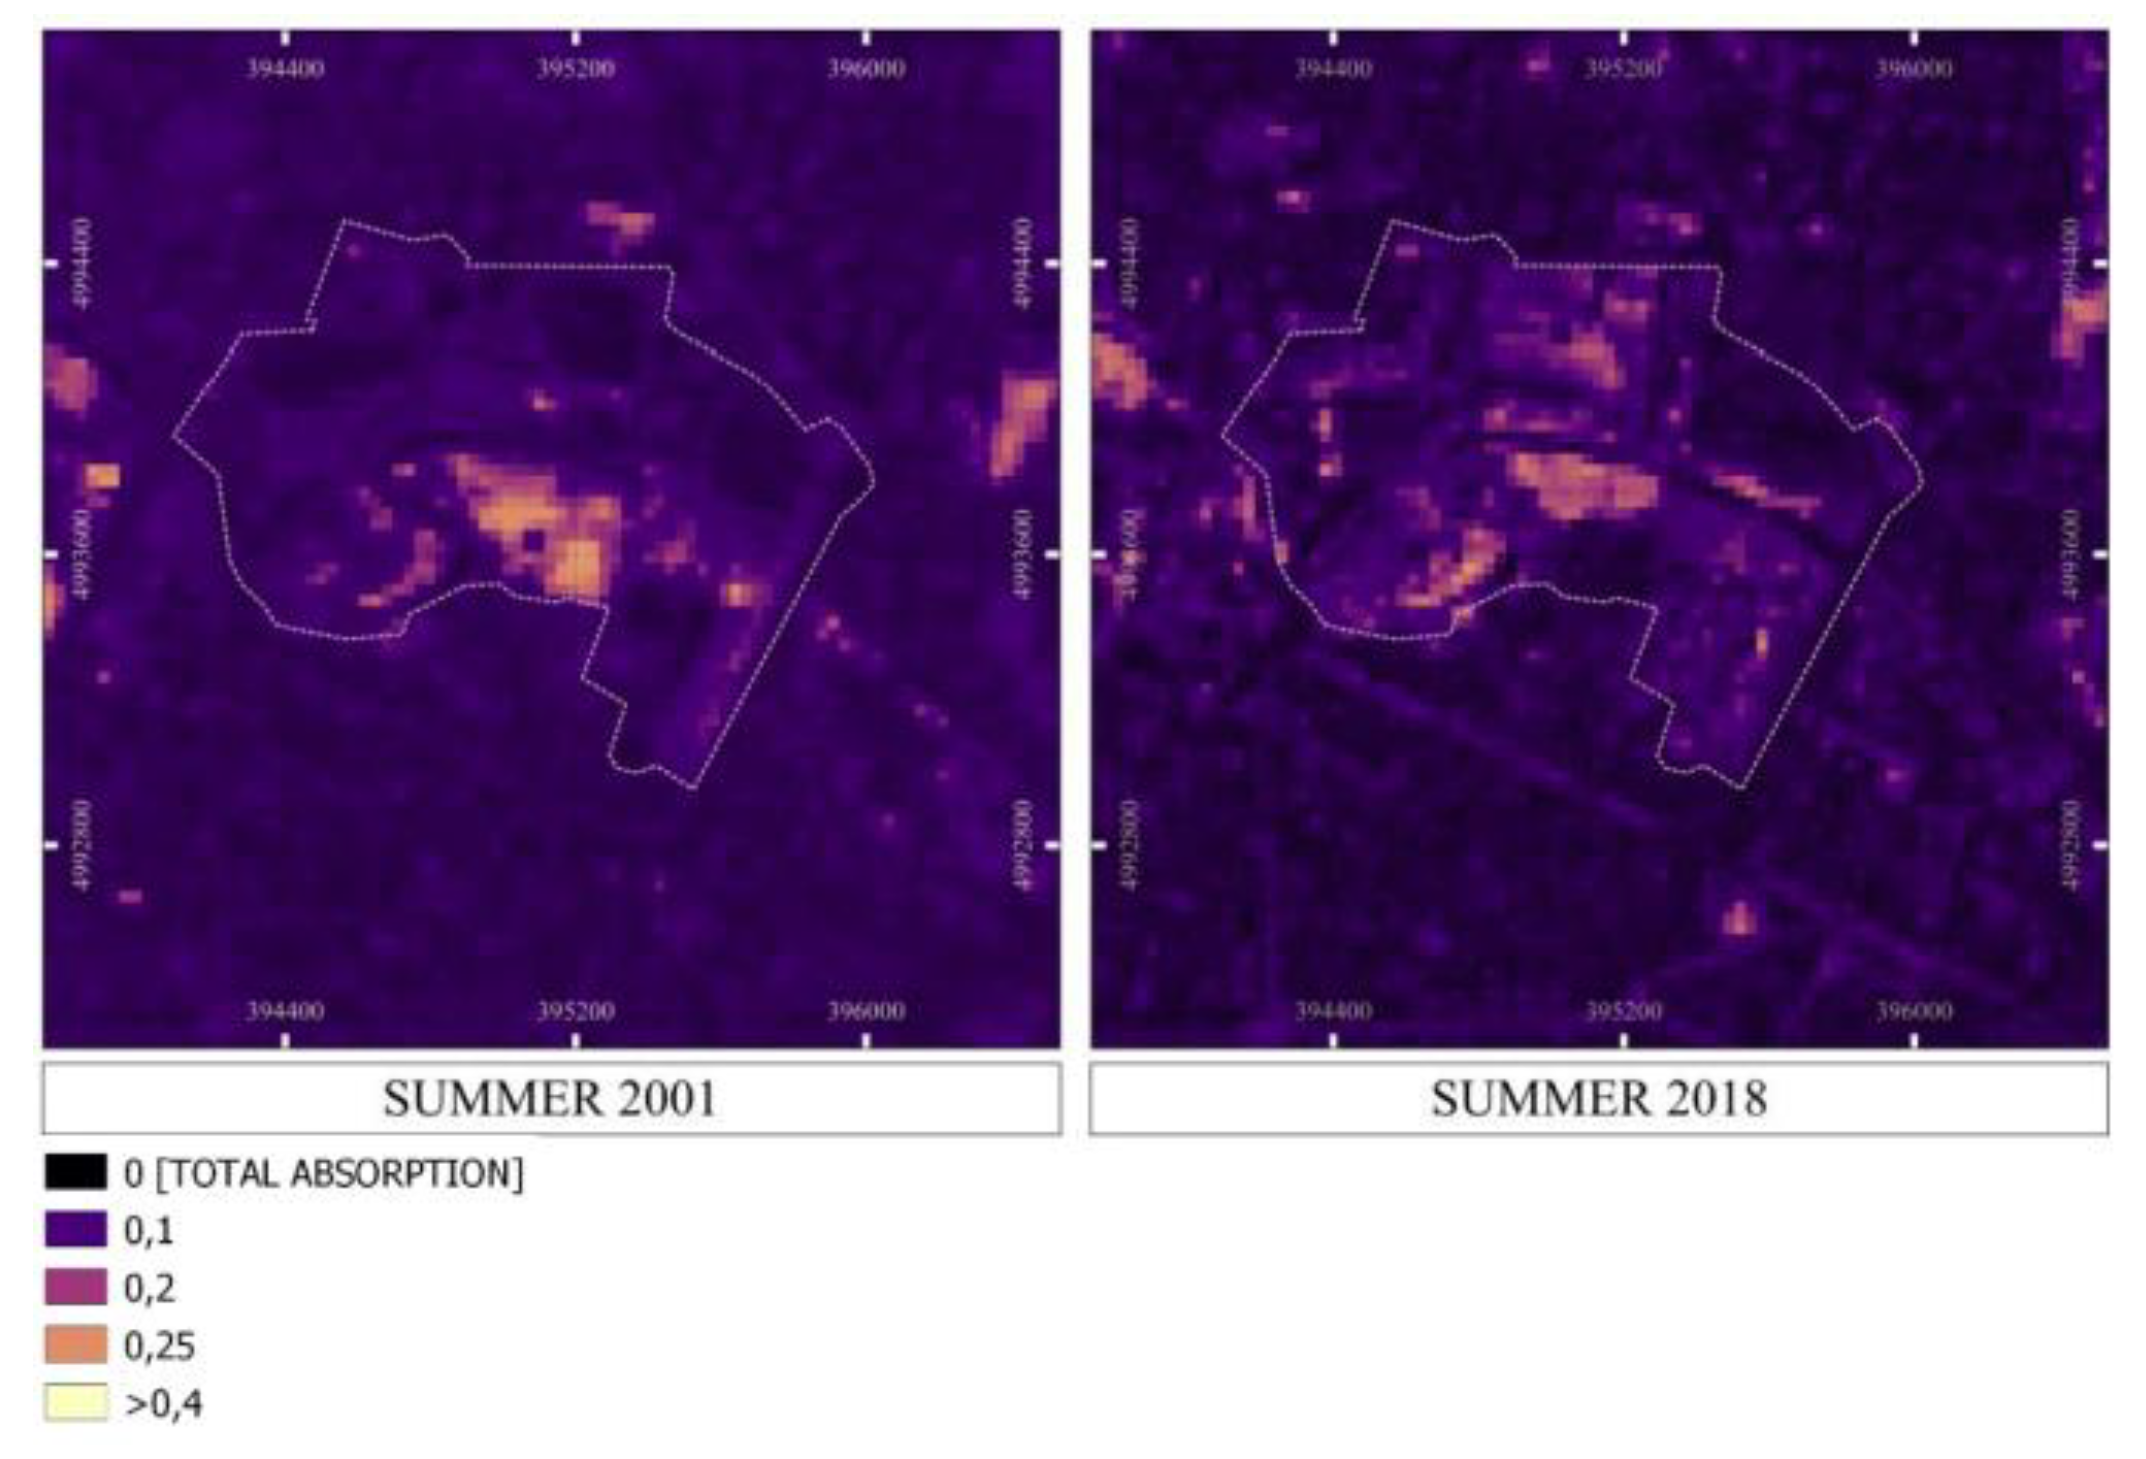
Figure 14.
The model of Surface Urban Heat Island Intensity (SUHII) in 2001 and 2018 using the Random Forest regression.
Figure 14.
The model of Surface Urban Heat Island Intensity (SUHII) in 2001 and 2018 using the Random Forest regression.
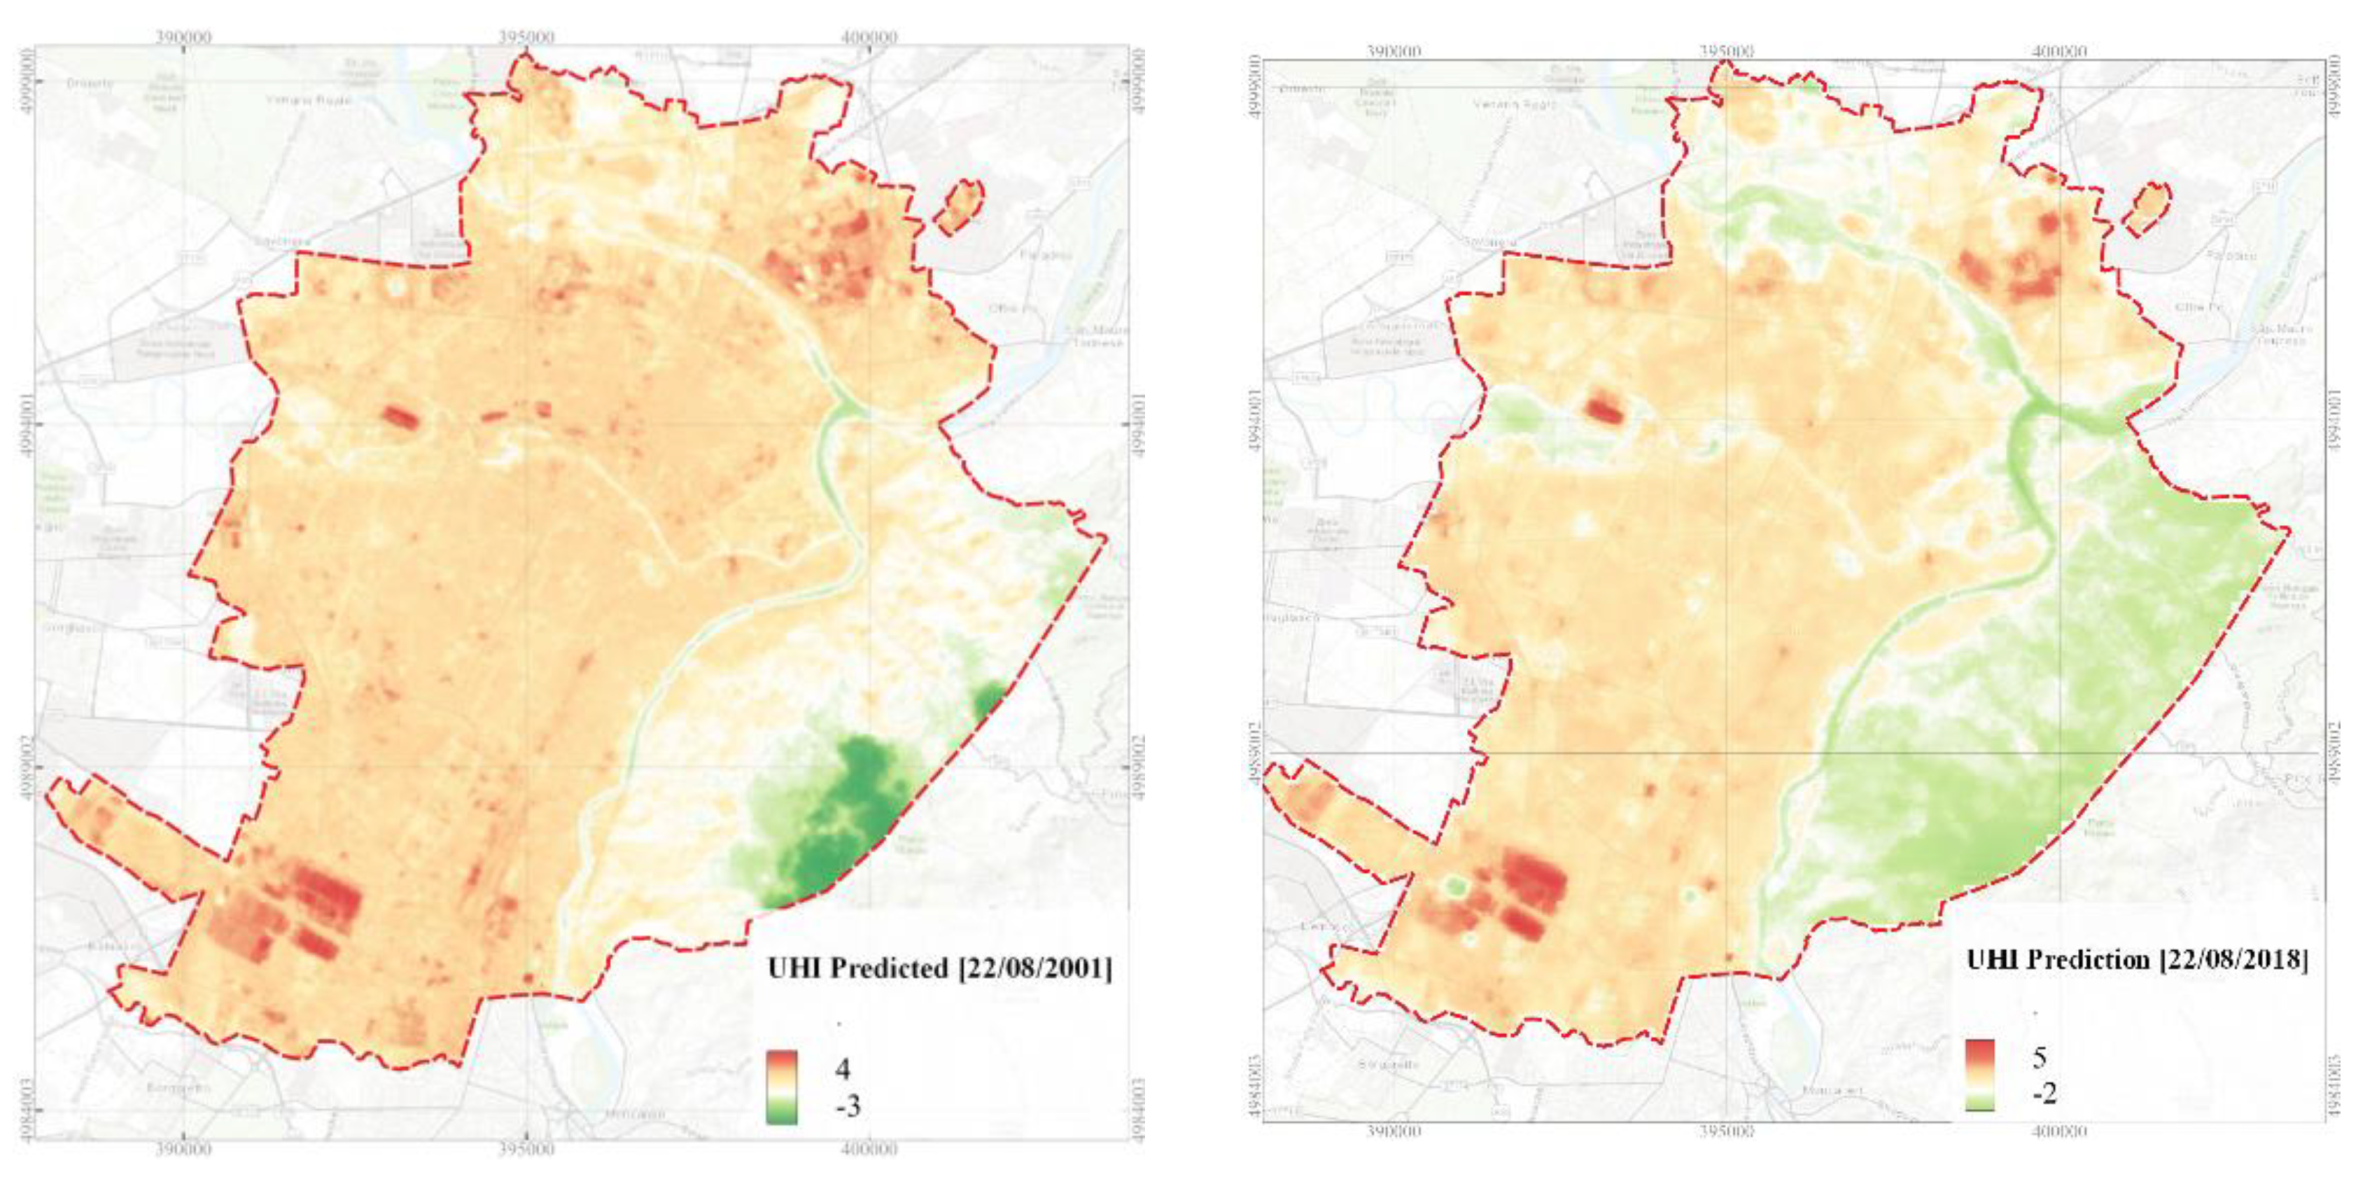
Figure 15.
Cartographic representation of LCZs and urban settlements m.i. for the city of Turin and its surroundings.
Figure 15.
Cartographic representation of LCZs and urban settlements m.i. for the city of Turin and its surroundings.
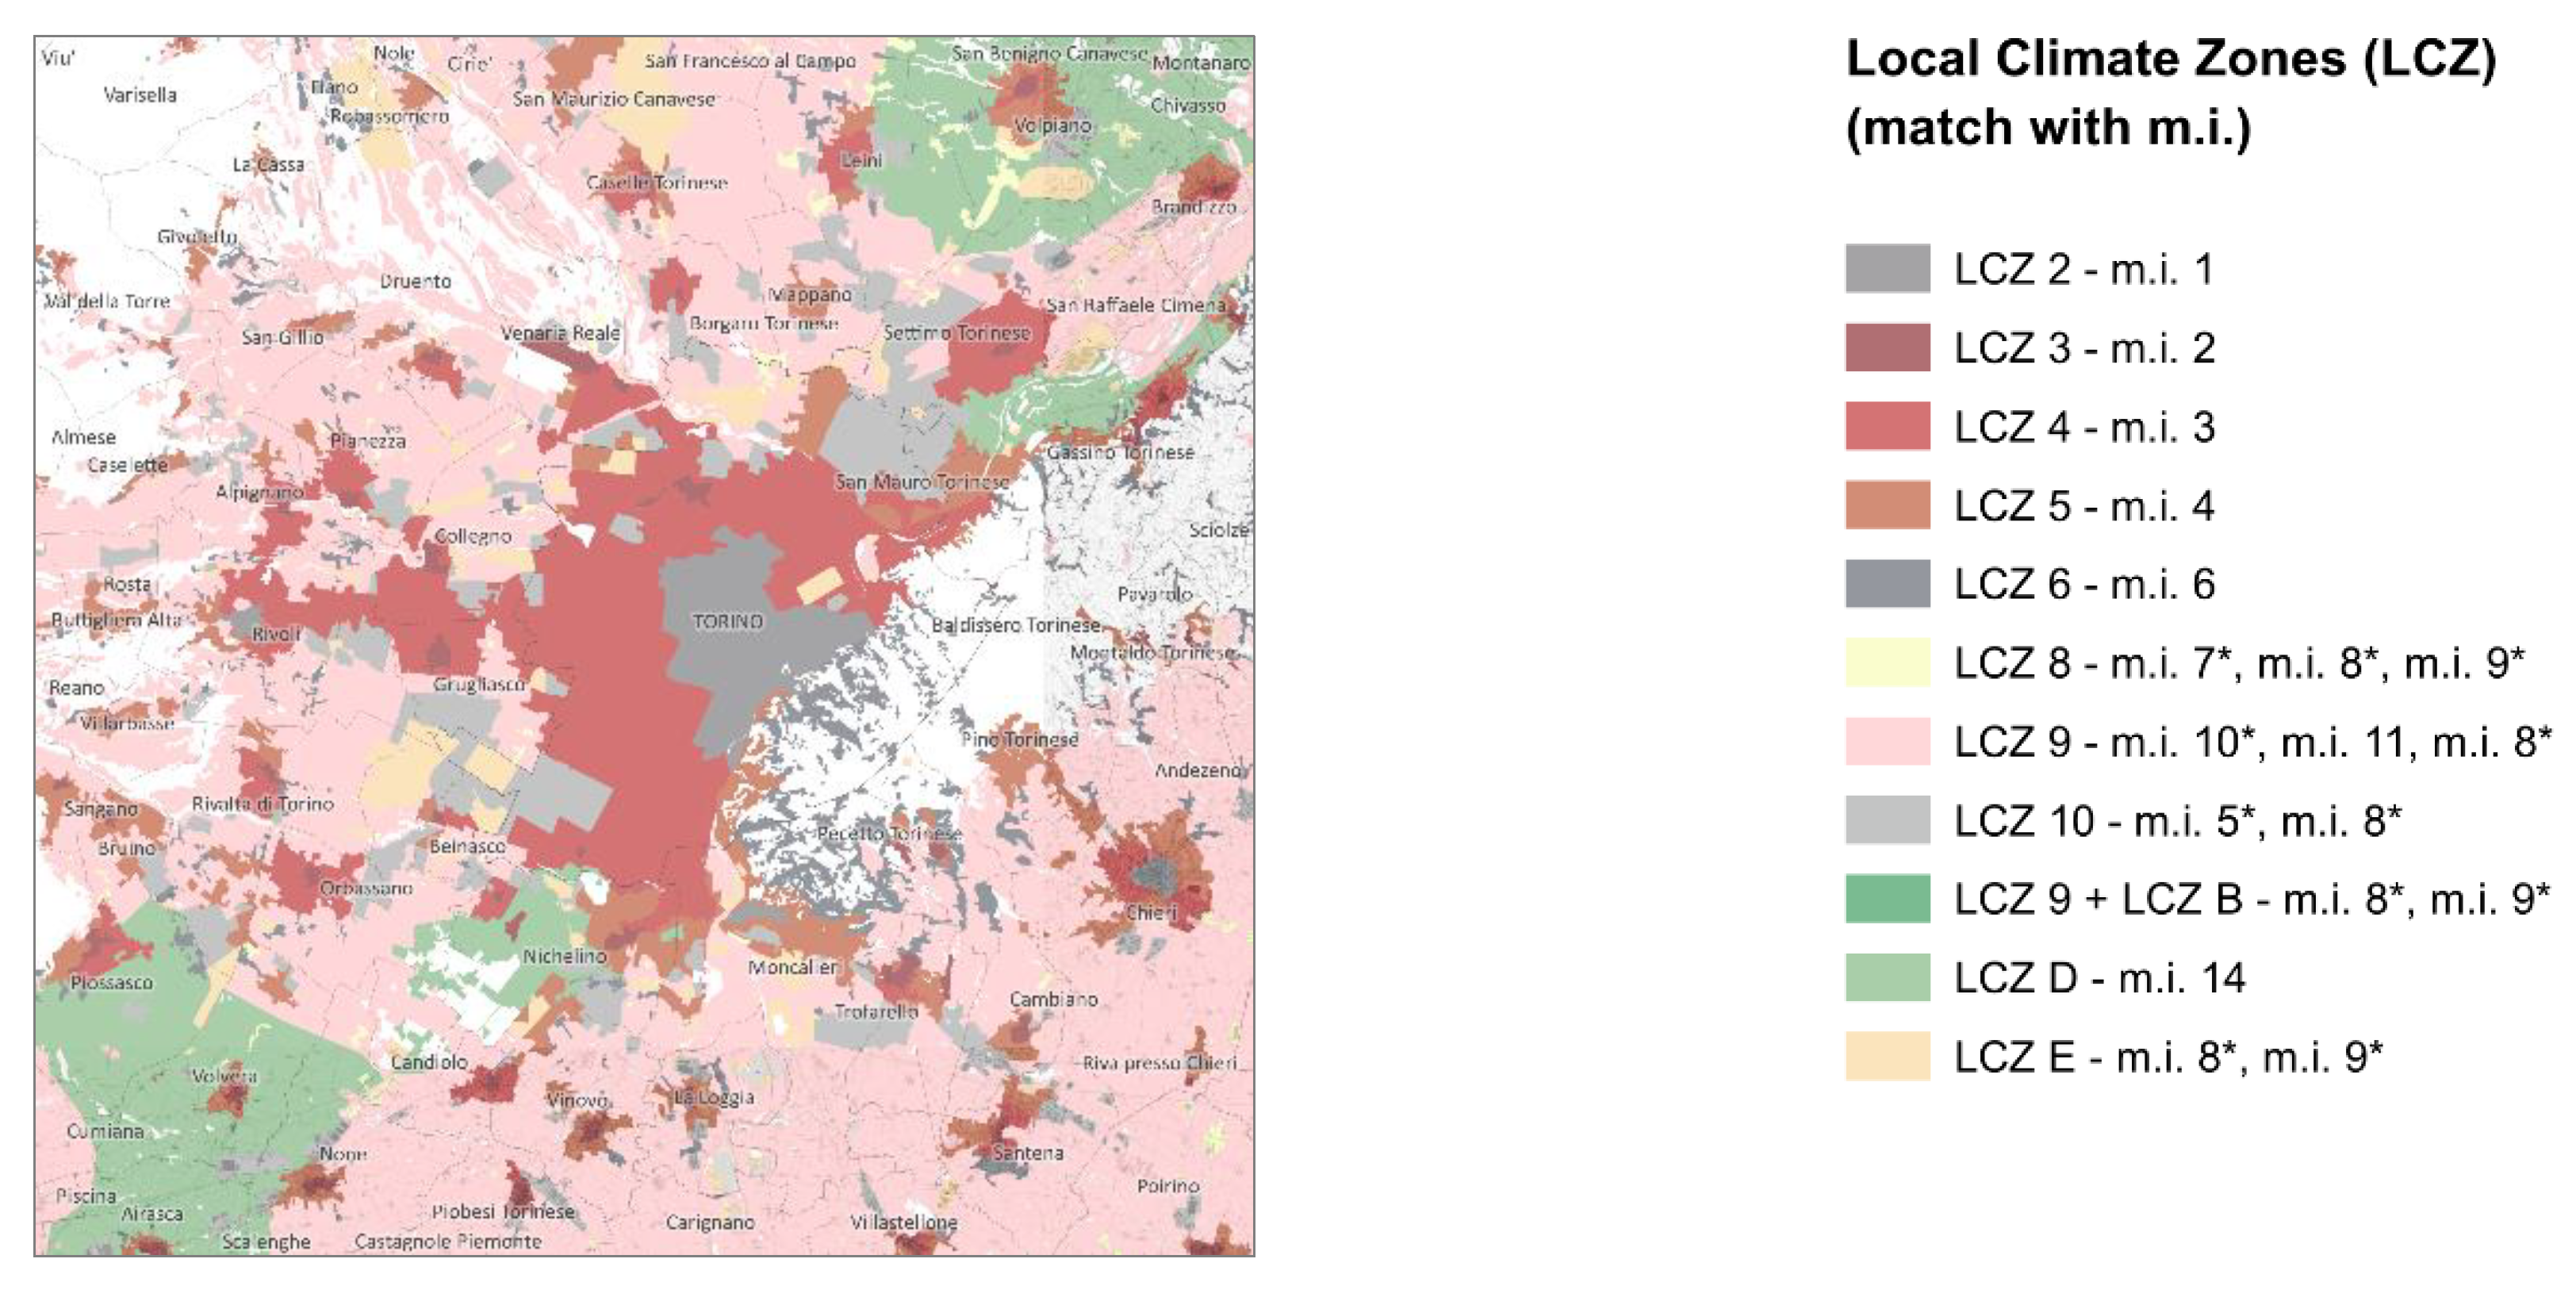
Figure 16.
Comparison between the result of SUHII model in August 2021 (on the left) and the anthropogenic heat output of Local Climate Zones (on the right).
Figure 16.
Comparison between the result of SUHII model in August 2021 (on the left) and the anthropogenic heat output of Local Climate Zones (on the right).
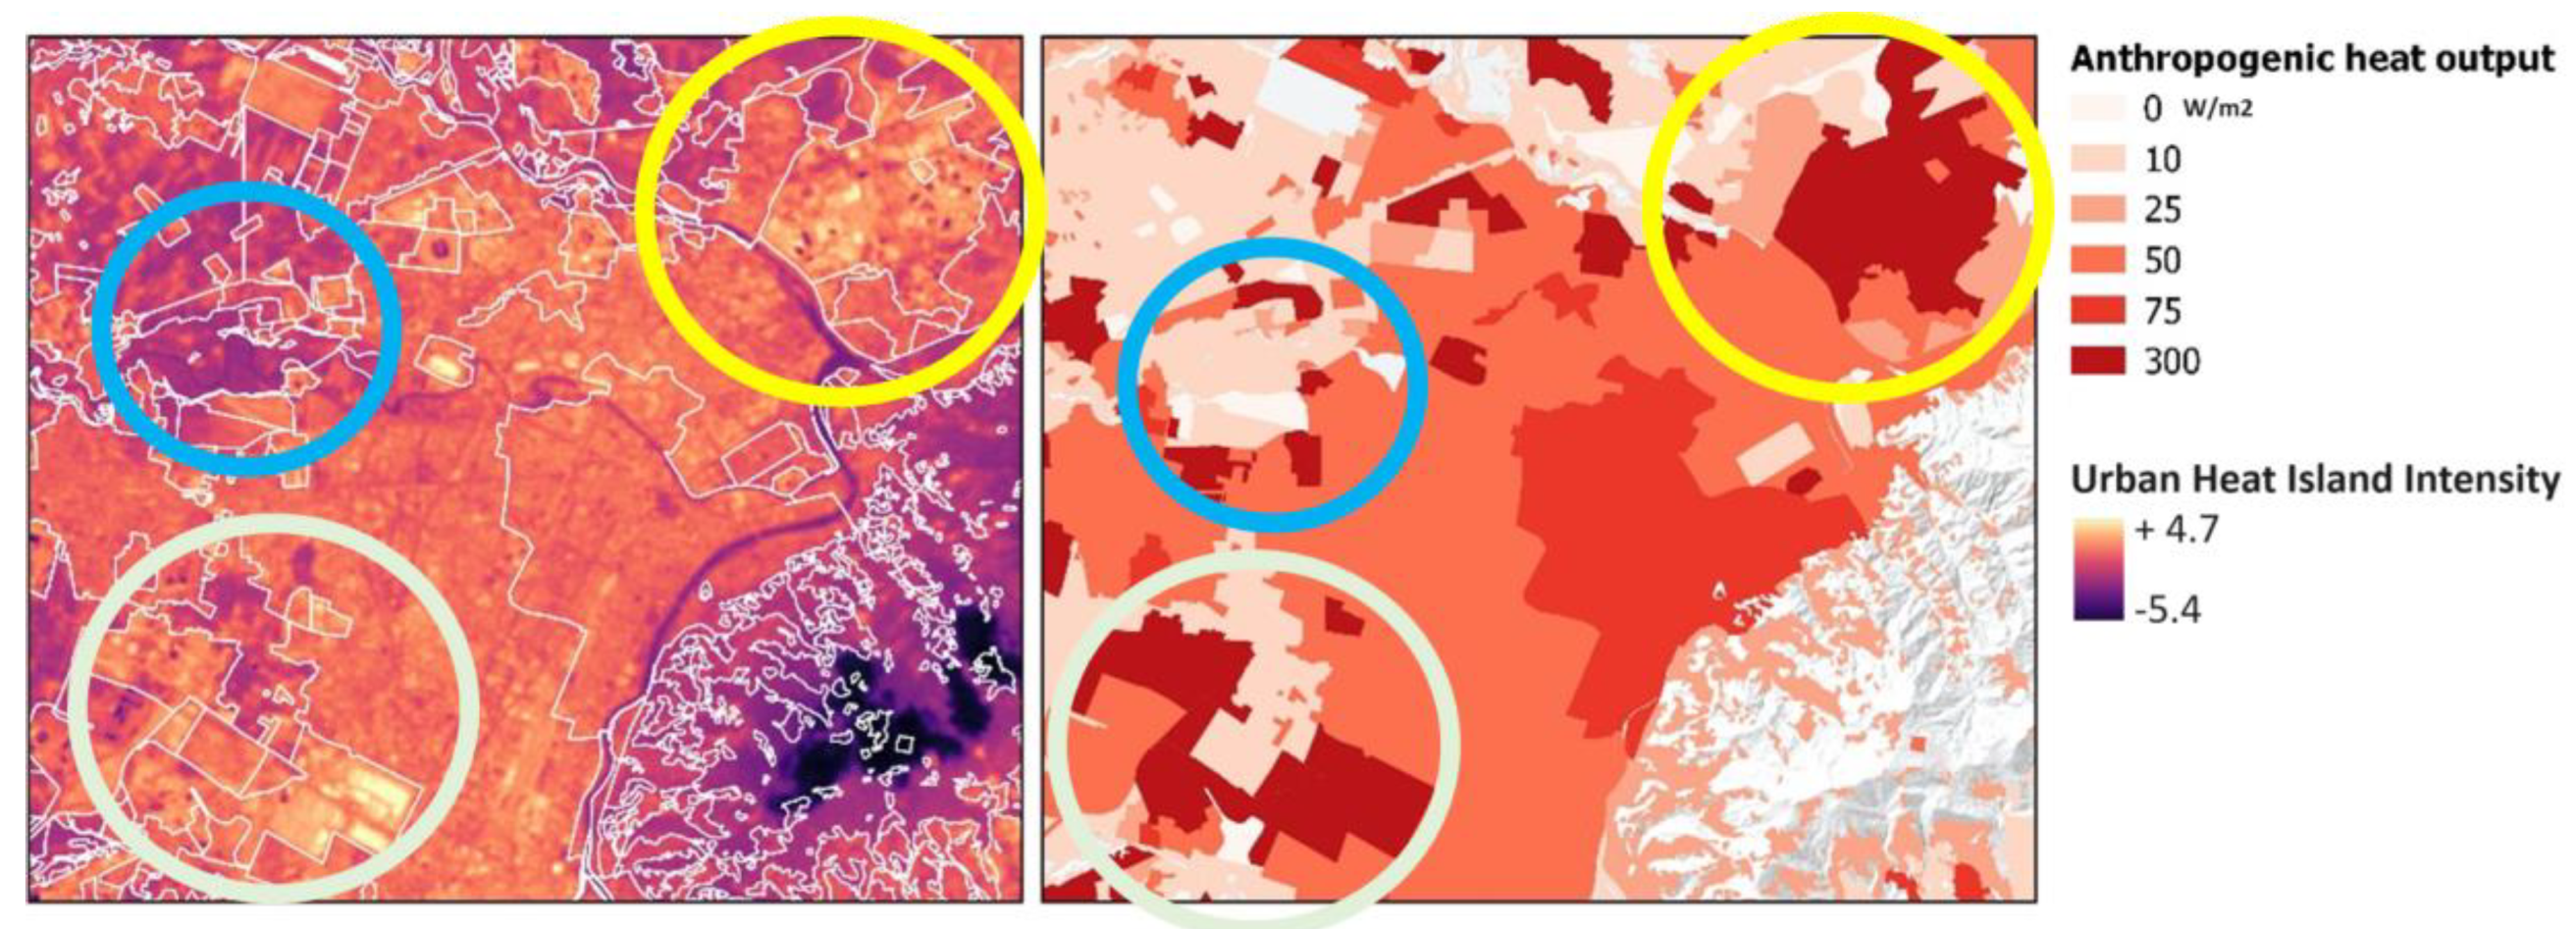

Table 1.
Selection of Landsat 7 (for typical days in 2000 and 2001) and Landsat 8 (for typical days in 2018) satellite images for the City of Turin.
Table 1.
Selection of Landsat 7 (for typical days in 2000 and 2001) and Landsat 8 (for typical days in 2018) satellite images for the City of Turin.
| Landsat product ID | Date | Time | Cloud Cover - |
Cell size m |
Season | Air Temp. °C |
|---|---|---|---|---|---|---|
| LC08_L2SP_195029_20180822_20200831_02_T1 | 2018-08-11 | 10:16 | 0.31 | 30 | Summer | 26.2 |
| LC08_L2SP_195029_20180211_20200902_02_T1 | 2018-02-22 | 10:17 | 0.23 | 30 | Winter | 3.8 |
| LC08_L2SP_195029_20180416_20200901_02_T1 | 2018-04-16 | 10:16 | 0.30 | 30 | Midseason | 17.9 |
| LE07_L1TP_194029_20010824_20200917_02_T1 | 2001-08-24 | 09:59 | 0.04 | 30 | Summer | 26.1 |
| LE07_L1TP_195029_20001218_20211122_02_T1 | 2000-12-18 | 10:07 | 0.05 | 30 | Winter | 2.1 |
| LE07_L1TP_195029_20010527_20200917_02_T1 | 2001-05-27 | 10:07 | 0.10 | 30 | Midseason | 23.2 |
Table 2.
Candidate Variables for Enhanced Modelling of SUHI Dynamics.
| Category | Variables | Formula | Reference |
|---|---|---|---|
| Land Cover | Normalized Difference Vegetation Index (NDVI) | (NIR-VIS)/(NIR+VIS) | [38,39,40] |
| Proportion Vegetation Index (PVI) | (NDVI-NDVImin)/(NDVI-NDVImin) | [38,39,40] | |
| Normal Difference Water Index (NDWI) | (GREEN-NIR)/(GREEN+NIR) | [41,42] | |
| Normal Difference Moisture Index (NDMI) | (NIRshort - SWIR)/ (NIRshort + SWIR) | [38,39] | |
| Albedo | [43,44] | ||
| Emissivity | (0.004*PVI) + 0.986 | [43,44] | |
| Solar Reflectance Index (SRI) | [(SR-SRmin)/(SRmax-NDVImin)] .100 | [45] | |
| Land Surface Temperature (LST) | Tc= (K2/ (ln (K1/Lγ+1)))−273.15 * | [46] | |
| Urban Geomorphology | Buildings and human activities | Kernel Density Estimation QGIS tool | [33] |
| Normalized Difference Built-Up Index (NDBI) | (SWIR - NIR)/ (SWIR + NIR) | [47] | |
| Sky View Factor (SVF) | SAGA QGIS tool | [34,48] | |
| Building Coverage Ratio, Building Density | BCR, BD | [14] | |
| Building Volume and Surface-to-Volume ratio | V, S/V | [14] | |
| Weather Stations | Relative Humidity | Weather stations’ measurements (Kriging interpolation in Smart Map QGis tool) | [35,36,37] |
| Wind Speed and Direction | |||
| Solar Irradiation | |||
| Air Temperature |
* K2, K1, Lγ must be retrieved from Landsat 7 and 8 imagery metadata.
Table 3.
Application field and linear correlation of the average variables with SUHII (for groups of 1000 data).
Table 3.
Application field and linear correlation of the average variables with SUHII (for groups of 1000 data).
| SUHII | NDVI | PVI | NDBI | EMISSIVITY | ALBEDO | SRI | NDMI | NDWI | SVF | BD | V | |
|---|---|---|---|---|---|---|---|---|---|---|---|---|
| minimum | -0.43 | -0.09 | 0.67 | -0.41 | 0.9887 | 0.08 | 25.04 | 0.05 | -0.29 | 0.62 | 0.03 | 2839.00 |
| average | 1.32 | 0.05 | 0.72 | -0.18 | 0.9889 | 0.12 | 25.13 | 0.18 | -0.19 | 0.74 | 0.19 | 3800.08 |
| median | 1.56 | 0.01 | 0.71 | -0.14 | 0.9888 | 0.11 | 25.09 | 0.14 | -0.17 | 0.73 | 0.20 | 3575.28 |
| maximum | 3.05 | 0.25 | 0.79 | -0.05 | 0.9891 | 0.17 | 25.27 | 0.41 | -0.09 | 0.94 | 0.30 | 8053.86 |
| Pearson’s Correlation r | -0.96 | -0.95 | 0.97 | -0.95 | -0.92 | -0.96 | -0.97 | 0.92 | -0.47 | 0.26 | 0.18 |
Table 4.
Parameters used to optimize the performance of RF regression algorithms.
| Season | Number of Trees | Number of randomly sampled variables |
Leaf size | Tree depth range |
|---|---|---|---|---|
| Summer 2018 | 200 | 5 | 1 | 31 |
| Mid-season 2018 | 59 | 5 | 3 | 13 |
| Winter 2018 | 60 | 5 | 5 | 25 |
| Summer 2001 | 59 | 4 | 1 | 39-50 |
| Mid-season 2001 | 164 | 4 | 1 | 38-44 |
| Winter 2001 | 97 | 4 | 2 | 16 |
Table 5.
MSE, RMSE, R² and p-value of data-driven model with RF algoritm.
| Season | MSE | RMSE | R2 | p-value |
|---|---|---|---|---|
| Summer 2018 | 0.023 | 0.152 | 0.997 | 0.001 |
| Winter 2018 | 0.021 | 0.145 | 0.991 | 0.002 |
| Mid-season 2018 | 0.080 | 0.283 | 0.948 | 0.001 |
| Summer 2001 | 0.045 | 0.212 | 0.994 | 0.001 |
| Winter 2000 | 0.011 | 0.105 | 0.853 | 0.002 |
| Mid-season 2001 | 0.017 | 0.130 | 0.990 | 0.001 |
Table 6.
Residuals analysis (Mean and Standard deviation).
| Season | Mean Residuals |
Standard deviation of residuals |
|---|---|---|
| Summer 2018 | -0.00041 | 0.0786 |
| Winter 2018 | -0.00020 | 0.0756 |
| Mid-season 2018 | -0.00004 | 0.2378 |
| Summer 2001 | -0.00082 | 0.1052 |
| Winter 2000 | -0.00013 | 0.0793 |
| Mid-season 2001 | -0.00026 | 0.0682 |
Table 7.
The weight of variables for the UHII in 2001 and 2018.
| 2001 | 2018 | |||||
| Rank | Variable | Score | Rank | Variable | Score | |
| 1 | DTM | 6102.32 | 1 | BCR | 18023.83 | |
| 2 | NDBI | 5555.31 | 2 | DTM | 12137.12 | |
| 3 | Solar Irradiation | 4327.89 | 3 | NDMI | 11733.99 | |
| 4 | NDMI | 4197.91 | 4 | Sky View Factor | 5901.33 | |
| 5 | Albedo | 3251.13 | 5 | NDVI | 4767.62 | |
| 6 | Air Temperature | 2824.21 | 6 | Emissivity | 4509.74 | |
| 7 | NDVI | 2696.72 | 7 | NDWI | 4488.35 | |
| 8 | Emissivity | 1950.37 | 8 | Wind speed | 4368.62 | |
| 9 | SRI | 1801.58 | 9 | S/V Ratio | 3173.45 | |
| 10 | Wind direction | 1575.72 | 10 | Wind direction | 2875.59 | |
| 11 | NDWI | 1282.06 | 11 | Relative Humidity | 2757.80 | |
| 12 | Wind speed | 1090.55 | 12 | Air Temperature | 2680.04 | |
| 13 | Air Relative Humidity | 1035.66 | 13 | Solar Irradiation | 2603.21 | |
| 14 | - | - | 14 | SRI | 2572.03 | |
| 15 | - | - | 15 | Albedo | 2151.66 |
Table 8.
SUHII variation, between 2001 and 2018, in ex-Teksid area, Turin.
| Variable | Radius’ distance from intervention area [m] |
Summer | Spring | Winter | Mean |
|---|---|---|---|---|---|
| UHII (ex-Teksid area) | 0 | -0.944 | -1.037 | -0.544 | -0.841 |
| UHII (district area) | 500 | -0.413 | -0.524 | -0.476 | -0.471 |
| UHII (Turin’s municipal area) |
within administrative borders | -0.500 | -0.849 | -0.492 | -0.614 |
Table 9.
Variation (2001-2018) of key variables contributing to UHII.
| Variable | Scale | Summer | Spring | Winter | Mean |
|---|---|---|---|---|---|
| NDVI | ex-Teksid | +19.46% | +21.79% | +8.23% | +16.49% |
| district | +6.41% | +16.61% | +7.61% | +10.21% | |
| Turin | +6.17% | +11.09% | +1.53% | +6.26% | |
| NDMI | ex-Teksid | +10.07% | -7.41% | +17.89% | +6.85% |
| district | +6.77% | -4.27% | +17.69% | +6.73% | |
| Turin | +8.44% | -12.43% | +17.39% | +4.47% | |
| ex-Teksid | +3.09% | +0.63% | +14.86% | +6.19% | |
| ALBEDO | district | +1.18% | +0.11% | +13.46% | +4.92% |
| Turin | +3.72% | +0.23% | +15.40% | +6.30% |
Table 10.
Average values of surface admittance, albedo, and anthropogenic heat output; in grey the LCZs not identified in the Metropolitan City of Turin.
Table 10.
Average values of surface admittance, albedo, and anthropogenic heat output; in grey the LCZs not identified in the Metropolitan City of Turin.
| Local Climate Zone | Surface admittance (J m-2 s-1/2 K-1) |
Average | Surface albedo (-) |
Average |
Anthropogenic heat output (W m-2) | |||
|---|---|---|---|---|---|---|---|---|
| LCZ 1 compact high-rise | 1500 | 1800 | 0,10 | 0,20 | 50 | 300 | ||
| LCZ2 compact mid-rise | 1500 | 2000 | 1850 | 0,10 | 0,20 | 0,15 | >75 | |
| LCZ 3 compact low-rise | 1200 | 1800 | 1500 | 0,10 | 0,20 | 0,15 | >75 | |
| LCZ 4 open high-rise | 1400 | 1800 | 1600 | 0,12 | 0,25 | 0,185 | > 50 | |
| LCZ 5 open mid-rise | 1400 | 2000 | 1700 | 0,12 | 0,25 | 0,185 | >25 | |
| LCZ 6 open low-rise | 1200 | 1800 | 1500 | 0,12 | 0,25 | 0,185 | >25 | |
| LCZ 7 lightweight low-rise | 800 | 1500 | 0,15 | 0,35 | >35 | |||
| LCZ 8 large low-rise | 1200 | 1800 | 1500 | 0,15 | 0,25 | 0,20 | >50 | |
| LCZ 9 sparsely built | 1000 | 1800 | 1400 | 0,12 | 0,25 | 0,185 | >10 | |
| LCZ 10 heavy industry | 1000 | 2500 | 1750 | 0,12 | 0,20 | 0,16 | >300 | |
| LCZ A dense trees | unknown | 0,10 | 0,20 | 0 | ||||
| LCZ B scattered trees | 1000 | 1800 | 1400 | 0,15 | 0,25 | 0,20 | 0 | |
| LCZ C bush, scrub | 700 | 1500 | 0,15 | 0,30 | 0 | |||
| LCZ D low plants | 1200 | 1600 | 1400 | 0,15 | 0,25 | 0,20 | 0 | |
| LCZ E bare rock or paved | 1200 | 2500 | 1850 | 0,15 | 0,30 | 0,10*/ 0,225 | 0 | |
| LCZ F bare soil or sand | 600 | 1400 | 0,20 | 0,35 | 0 | |||
| LCZ G water | 1500 | 0,02 | 0,10 | 0 | ||||
| *Typical value for asphalt pavements in Italy | ||||||||
Table 11.
Association between the settlements’ morphologies (“m.i.” in Italian) and the LCZs.
| Association of settlement morphologies with Local Climate Zones | |
|---|---|
| Settlements’ morphologies (“morfologie insediative m.i.” in Italian) | Local Climate Zone (LCZ) |
| (m.i. 1) - Consolidated urban areas of major centers | LCZ 2 - compact midrise |
| (m.i. 2) - Consolidated urban areas of minor centers | LCZ 3 - compact low rise |
| (m.i. 3) - Urban fabrics outside urban center | LCZ 4 - open high rise |
| (m.i. 4) - Discontinuous suburban fabrics | LCZ 5 - open midrise |
| (m.i. 5) - Organized specialized settlements | LCZ 10 - heavy industry |
| (m.i. 6) – Dispersed areas mainly residential | LC6 - open low rise |
| (m.i. 7) - Dispersed areas mainly specialized | LC8 - large low rise |
| (m.i. 8) - Specialized islands | LCZ E - bare rock or paved |
| (m.i. 9) - Infrastructural complexes | LCZ E - bare rock or paved |
| (m.i. 10) - Rural areas in plains or hills | LCZ 9 - sparsley built |
| (m.i. 11) - Systems of rural nuclei in plains, hills, and low mountains | LCZ 9 - sparsley built |
| (m.i. 12) - Mountain villages | LCZ B - Scattered trees + LCZ 9 - sparsley built |
| (m.i. 13) - Rural areas in mountains or hills with scattered & dispersed buildings | LCZ B - Scattered trees + LCZ 9 - sparsley built |
| (m.i. 14) - Rural areas in plains | LCZ D – Low plants |
| (m.i. 15) - Mountain pasturelands and high-altitude rural settlements | LCZ D – Low plants + LCZ 9 - sparsley built |
Table 12.
Association between settlement morphologies and the characteristics of LCZs.
| Note | Association of LCZ and m.i. |
Surface admittance |
Surface albedo |
Anthropogenic heat output | |
|---|---|---|---|---|---|
| (J m-2 s-1/2 K-1) | (-) | (W m-2) | |||
| m.i. 1 | LCZ 2 | 1850 | 0,15 | 75 | |
| m.i. 2 | LCZ 3 | 1500 | 0,15 | 75 | |
| m.i. 3 | LCZ 4 | 1600 | 0,185 | 50 | |
| m.i. 4 | LCZ 5 | 1700 | 0,185 | 25 | |
| *With: Refineries (ex m.i. 8) | m.i. 5* | LCZ 10 | 1750 | 0,16 | 300 |
| m.i. 6 | LCZ 6 | 1500 | 0,185 | 25 | |
| * With large commercial structures, purification plants, hospitals, military and prison areas (ex m.i 8), warehouses, rail junction, logistics hubs, and nodes (ex m.i. 9) | m.i. 7* | LCZ 8 | 1500 | 0,20 | 50 |
| * Contains only: mining areas/extraction plants | m.i. 8* | LCZ E | 1850 | 0,225 | 0 |
| * Contains: runways (albedo value variation*) | m.i. 8* | LCZ E* | 1850 | 0,10* | 0 |
| * with energy production systems (e.g., photovoltaic systems) | m.i. 9* | LCZ E | 1850 | 0,225 | 0 |
| * with motorway infrastructures (change in albedo value*) | m.i. 9* | LCZ E* | 1850 | 0,10* | 0 |
| * with theme parks, campsites, sports facilities, golf clubs, cemeteries (ex m.i. 8) | m.i. 10* | LCZ 9 | 1400 | 0,185 | 10 |
| m.i. 11 | LCZ 9 | 1400 | 0,185 | 10 | |
| m.i. 12 | LCZ B + LCZ 9 | 1400 | 0,1925 | 10 | |
| m.i. 13 | LCZ B + LCZ 9 | 1400 | 0,1925 | 10 | |
| m.i. 14 | LCZ D | 1400 | 0,20 | 0 | |
| m.i. 15 | LCZ D + LCZ9 | 1400 | 0,1925 | 10 | |
| *for some specific categories of m.i. the associations with LCZs were re-defined as indicate in the column Note | |||||
Table 13.
Settlement morphologies with worse thermal, radiative, and metabolic properties (in a priority order for UHI-mitigation interventions).
Table 13.
Settlement morphologies with worse thermal, radiative, and metabolic properties (in a priority order for UHI-mitigation interventions).
| Priority order | Thermal properties | Radiative properties | Metabolic properties |
|---|---|---|---|
| 1 | Consolidated urban areas of major centers (m.i. 1) |
Specialized islands (m.i. 8) * | Organized specialized settlements (m.i. 5) |
| 2 | Specialized islands (m.i. 8) * | Infrastructural complexes (m.i. 9) * | Consolidated urban areas of major and minor centers (m.i. 1, m.i. 2) |
| 3 | Infrastructural complexes (m.i. 9) * | Consolidated urban areas of major and minor centers (m.i. 1, m.i. 2) |
Urban fabrics outside centers (m.i. 3) |
| 4 | Organized specialized settlements (m.i. 5) * | Organized specialized settlements (m.i. 5) * | Dispersed areas mainly specialized (m.i. 7) |
| 5 | Discontinuous suburban fabrics (m.i. 4) |
Table 14.
Intervention to mitigate the UHI based on improving thermal, radiative and metabolic properties of settlement morphologies.
Table 14.
Intervention to mitigate the UHI based on improving thermal, radiative and metabolic properties of settlement morphologies.
| Properties (to improve) |
Settlement morphologies | Types of interventions |
|---|---|---|
| Thermal properties | Consolidated urban areas of major centers (m.i.1) Specialized islands (m.i. 8) * Infrastructural complexes (m.i. 9) * Organized specialized settlements (m.i.5) * Discontinuous suburban fabrics (m.i. 4) |
|
| Radiative properties | Specialized islands (m.i. 8) * Infrastructural complexes (m.i.9) * Consolidated urban areas of major and minor centres (mm.ii. 1, 2) Organized specialized settlements (m.i. 5) * |
|
| Metabolic properties | Organized specialized settlements (m.i. 5) Consolidated urban areas of major and minor centres (m.i. 1, m.i. 2) Urban fabrics outside of centres (m.i. 3) Areas of predominantly specialized dispersion (m.i. 7) |
|
Disclaimer/Publisher’s Note: The statements, opinions and data contained in all publications are solely those of the individual author(s) and contributor(s) and not of MDPI and/or the editor(s). MDPI and/or the editor(s) disclaim responsibility for any injury to people or property resulting from any ideas, methods, instructions or products referred to in the content. |
© 2024 by the authors. Licensee MDPI, Basel, Switzerland. This article is an open access article distributed under the terms and conditions of the Creative Commons Attribution (CC BY) license (http://creativecommons.org/licenses/by/4.0/).
Copyright: This open access article is published under a Creative Commons CC BY 4.0 license, which permit the free download, distribution, and reuse, provided that the author and preprint are cited in any reuse.


