
Submitted:
11 April 2025
Posted:
15 April 2025
You are already at the latest version
Abstract
Urbanization has transformed natural landscapes, resulting in increased land surface temperatures and the intensification of Urban Heat Island (UHI) effects. This study explores the relationship between land use/land cover (LULC) changes and land surface temperature (LST) from 2017 to 2024, using satellite data from Landsat and Sentinel. Results from supervised classification reveal a 50.9% increase in built-up land, from 21,256 hectares in 2017 to 32,099 hectares in 2024, accompanied by a 6.3% decline in woodland. Analysis of LST data highlights rising temperatures in urbanized and deforested areas, with LST peaking at 36.96 °C in 2020 before slightly decreasing to 31.03 °C in 2024, potentially influenced by increased rainfall. However, hotspots of elevated LST persist, indicating sustained thermal stress. The Urban Thermal Field Variance Index (UTFVI) showed worsening ecological conditions, particularly in densely urbanized zones. The study highlights the pressing need for integrating Urban Heat Island (UHI) considerations into urban planning, as elevated urban temperatures threaten public health and escalated energy consumption. Additionally, the research aligns with Sustainable Development Goal 11 (SDG 11), emphasizing the creation of inclusive, safe, resilient, and sustainable cities. By providing policymakers with key UHI indices, this study contributes to climate-resilient urban environments, mitigating heat risks through green infrastructure and sustainable urban design.
Keywords:
urban heat island
; land use/land cover
; land surface temperature
; Bukidnon
1. Introduction
Urbanization is a defining characteristic of the modern era, significantly altering landscapes worldwide. By 2050, over 68% of the global population is expected to reside in urban areas, necessitating expanded infrastructure to support human activity. This expansion often results in land cover changes, such as converting vegetation and agricultural lands into built-up environments, leading to increased land surface temperatures (LST) and intensifying the Urban Heat Island (UHI) effect [1,2,3,4,5]. Urban Heat Island (UHI) phenomenon, where urban areas experience higher temperatures than their surrounding rural regions, has significant environmental and societal implications, including increased energy consumption, air pollution, and adverse health outcomes [6,7,8,9,10,11]. This effect has been widely observed across different countries and regions, with urbanization-driven land use and land cover changes playing a crucial role in exacerbating UHI intensity [9,12,13].
Research indicates that the UHI effect is primarily influenced by factors such as decreased vegetation cover, the thermal and reflective properties of urban materials, urban geometry, anthropogenic heat emissions, and local climatic conditions [14,15,16]. The U.S. Environmental Protection Agency (USEPA) has also highlighted these contributing factors, emphasizing the importance of sustainable urban planning and mitigation strategies [10,11]. Addressing these challenges requires a comprehensive understanding of land surface temperature (LST) variations and their relationship with urban expansion to develop effective climate adaptation strategies.
Land use and land cover (LULC) changes, along with Urban Heat Island (UHI) intensification, have been extensively studied in various regions. A study conducted in Northeast India by [17] found that between 2000 and 2022, built-up areas expanded by over 200%, while vegetation cover declined by more than 30%, leading to an almost 50% increase in Land Surface Temperature (LST). Similarly, the study of [18] in Bangladesh revealed an alarming 1000% increase in built-up areas, accompanied by a 50% reduction in vegetation, which resulted in a 17% rise in LST. Additionally, research by [1,2,19] reported comparable findings, where the expansion of built-up areas occurred at the expense of vegetated land, leading to LST increases ranging from 11% to 30%, collectively highlighting the strong relationship between urban expansion, vegetation loss, and rising surface temperatures.
Remote sensing technologies, particularly Landsat and Sentinel satellites, have been widely utilized in monitoring land cover changes and temperature dynamics. These tools play a crucial role in detecting land use transformations, assessing their environmental impacts, and analyzing their contribution to Urban Heat Island (UHI) intensification [20,21,22]. Recent advancements in artificial intelligence and remote sensing have further enhanced land cover change detection, enabling more precise and efficient analysis of urbanization trends [23,24]. Several studies have demonstrated the significance of remote sensing in evaluating land surface temperature (LST) variations and their correlation with land cover properties [13,25]. For instance, research in Dhaka City, Bangladesh, and Islamabad, Pakistan, has shown that rapid urban expansion, as detected through satellite imagery, has led to significant increases in LST and exacerbated the UHI effect [15,26,27]. Additionally, studies have highlighted how urban heat island dynamics are intricately linked to land use modifications, emphasizing the need for continuous monitoring to support climate adaptation and mitigation strategies [28]. However, challenges such as accessing high-resolution LST data and errors in index-based LST estimation persist [19,29,30,31]. Addressing these challenges is crucial for ensuring that urban development aligns with the Sustainable Development Goals (SDGs), particularly SDG 11, which focuses on creating sustainable and resilient cities (United Nations, 2019).
While extensive research has addressed UHI effects globally, limited analysis exists on the dynamics of UHI in provincial urbanizing regions such as Bukidnon. Previous studies often focus on metropolitan centers, overlooking larger and rapidly developing areas where land cover transformation and agricultural expansion play a critical role [32,33]. Bukidnon is Northern Mindanao's most populous province, with over 1.5 million residents (Philippine Statistics Authority, 2020). Its evolving landscape, driven by urban expansion, poses challenges to local climate patterns, necessitating an in-depth analysis of how land cover changes contribute to LST variations and UHI intensification [17,34,35,36,37]. Bukidnon’s dual identity as an agricultural hub and an emerging urban center positions it as a key area for studying the intersection of urbanization, land cover change, and climate variability. Its significant contributions to national agricultural output contrast with the accelerating pace of urban infrastructure development, emphasizing the need for localized UHI assessments [38,39].
Given the rapid urban transformation and declining forest cover, understanding UHI dynamics in Bukidnon is crucial for formulating sustainable urban strategies. This study addresses these gaps by conducting a multitemporal analysis, examining LST trends, and offering insights to guide climate-resilient urban planning. Specifically, this study aims to conduct a multitemporal analysis of land cover change and its impact on UHI dynamics in Bukidnon from 2017 to 2024. The trends in land conversion from 2005 to 2018, as documented by the Environmental Science for Social Change and the Global Forest Watch, indicate a significant decline in forest cover, primarily driven by the expansion of agricultural land and the proliferation of built-up and impervious surfaces. This widespread transformation not only alters the natural landscape but also disrupts local climate patterns. Consequently, these land cover changes contribute to variations in Land Surface Temperature (LST), potentially exacerbating the Urban Heat Island (UHI) effect and intensifying thermal disparities across the region. By leveraging satellite imagery and Geographic Information Systems (GIS), this research seeks to fill critical knowledge gaps, offering insights into the relationship between land cover changes and UHI effects [10,15,17,35,40,41,42,43].
To clearly articulate the focus of this study, a set of research questions was developed to guide the investigation. These include: How have land use and land cover (LULC) changes in Bukidnon Province evolved between 2017 and 2024? What is the relationship between these changes and variations in land surface temperature (LST)? To what extent do built-up areas and other land cover types contribute to the intensification of the Urban Heat Island (UHI) effect? How do elevation and population density influence the spatial patterns of LST and UHI intensity? Based on these questions, the study assumes that the expansion of urban and agricultural areas has likely led to an increase in land surface temperatures and intensified the UHI effect. It also considers that woodland cover may help reduce surface temperatures due to its cooling effect, and that elevation tends to lower LST, while higher population density may be associated with increased temperatures.
2. Study Area
The study was conducted in the Province of Bukidnon, Philippines. It is situated in Mindanao Island, the southern island of the Philippines; with a population of over 1.5 million, Bukidnon is the most populated province in Northern Mindanao (Philippine Statistics Authority, 2020). In 2023, it led the country in agricultural and fisheries production, contributing approximately 6.8% to the national total, with an output valued at ₱155.28 billion (Philstar, 2024). This significant contribution highlighted Bukidnon's role as a major producer of crops such as rice, corn, sugarcane, and various fruits and vegetables. The province's agricultural prominence is further highlighted by its substantial land area dedicated to farming. As of 2022, Bukidnon's gross value added (GVA) in agriculture, forestry, and fishing was ₱125.4 billion, accounting for 7% of the sector's national GVA (PSA, 2023). This extensive agricultural activity has led to land use changes, including the conversion of forestlands into agricultural areas.
The province's agricultural landscape is characterized by a mix of traditional farming and large-scale plantations. In 2005, about 16.4% of Bukidnon's land was devoted to agriculture, with corn cultivation occupying 7.3% (approximately 66,400 hectares), making it the second-largest corn-producing province in the Philippines (Environmental Science for Social Change, 2005). This extensive agricultural activity has implications for land use and environmental sustainability.
The conversion of land for agricultural purposes has raised concerns about deforestation and its environmental impacts. In 2010, Bukidnon had 448,000 hectares of natural forest, covering more than 50% of its land area. However, by 2018, the remaining natural forest was about 213,066 hectares, indicating significant deforestation and land conversion over the years (Global Forest Watch, 2018; Forest Foundation Philippines, 2024). This reduction in forest cover is attributed to the expansion of agricultural lands and other land use changes.
The province’s growing urban areas are likely experiencing significant land cover changes, contributing to the exacerbation of UHI effects. These changes can lead to heightened energy demands, increased air pollution, and adverse health outcomes. Understanding these impacts through precise, localized studies is essential for developing effective urban planning and mitigation strategies that align with sustainable development goals.
3. Materials and Methods
As shown in Figure 1, this study utilized Landsat and Sentinel imagery. Landsat 8, and Sentinel-2 and Sentinel-3 data were sourced from their respective platforms: USGS Earth Explorer (https://earthexplorer.usgs.gov/) and Copernicus Data Space (https://browser.dataspace.copernicus.eu/).
Land cover maps were generated using Landsat 8 and Sentinel-2 imagery. These datasets were mosaicked and corrected for the years 2017, 2020, and 2024. Meanwhile, Sentinel-3 data captured Land Surface Temperature (LST). Landsat imagery has a spatial resolution of 30m, while Sentinel-2 offers a 10m resolution. To ensure consistency across datasets, Sentinel-2 data were resampled to 30m to match Landsat imagery. Resampling Landsat to 10m was not performed, as it would not enhance the actual resolution, making the resampling of Sentinel-2 a more appropriate and reliable choice to maintain data integrity.
LST data were derived from Sentinel-3, which provides daily surface temperature measurements through the Sea and Land Surface Temperature Radiometer (SLSTR) sensor. This allowed for a continuous dataset throughout the year. To calculate the mean LST, daily LST data were acquired and averaged. Sentinel-3 images with distortions or sensor errors, such as negative temperatures, fragmented images, and no data images, were excluded to ensure accuracy and reliability. On average, between 15 and 30 LST observations per month were included in the analysis. The data were reprojected to the appropriate coordinate reference system to ensure compatibility across datasets. Using GIS software, the monthly average LST values were computed by applying standard mean formulas, resulting in an accurate representation of temperature trends across the study period.
3.1. Land Cover Classification
Multispectral images from Landsat and Sentinel satellites were obtained via the USGS Earth Explorer and Copernicus Browser platforms. These images underwent preprocessing steps to ensure accuracy and consistency, including atmospheric and geometric corrections. The land cover classification was performed using advanced algorithms within Geographic Information System (GIS) software, categorizing the landscape into four primary classes: Cropland, Woodland, Water Body, and Built-up Land. This classification methodology was adapted from [48] which focused on similar studies in Vietnam. While the Water Body class was included in the classification, it was not analyzed in detail due to its minimal area and limited influence on land surface temperature [48].
Using the Support Vector Machine (SVM) as the primary classification algorithm, land cover was categorized based on 100 polygon training samples for each class. Although an equal number of training samples were used across all classes, the actual area covered by each sample varied. This variation arises because some land cover types, such as woodland and cropland, naturally occupy larger expanses in the imagery, whereas built-up areas and water bodies are more spatially constrained.
To ensure the accuracy and quality of the classification, the output map was initially generated in raster format. However, to facilitate detailed verification and refinement, the classified raster was subsequently converted into a polygon format. This conversion enabled a direct, side-by-side comparison with the original satellite imagery, allowing for the identification and correction of any misclassified regions. By integrating GIS-based classification techniques with manual verification and refinement, this approach enhances the overall accuracy and reliability of the final land cover map.
The classified results were mapped and visualized using GIS tools, generating detailed land cover maps that highlight spatial distributions and temporal trends. The classification accuracy was assessed and validated using a confusion matrix, comparing ground truth data and classified images within the GIS software, ensuring the reliability of the findings.
3.2. Land Surface Temperature Retrieval
The land surface temperature (LST) data were acquired from the Copernicus Browser, specifically utilizing Sentinel-3’s Sea and Land Surface Temperature Radiometer (SLSTR) sensor. A series of LST datasets were downloaded for the years 2017, 2020, and 2024. Approximately 30 LST images per month were available for download; however, not all could be included in the analysis due to distortions and potential sensor errors.
An example of such issues includes occurrences of negative temperature values (e.g., below 0°C) within the Province of Bukidnon. As the Philippines is a tropical country, such negative temperature readings are unrealistic and were excluded from the analysis. On average, a minimum of 15 and a maximum of 30 valid LST datasets per month were processed. Having more than half of the total available sample to be included in the analysis
To ensure compatibility and consistency, the LST data were reoriented by reprojecting them to the appropriate coordinate reference system. Using the GIS calculator, monthly average LST values were computed by applying the basic mean formula, resulting in a more refined and accurate representation of temperature trends.
After retrieving the LST and generating an average raster image, a critical data enhancement process was conducted. While Sentinel-3 offers high temporal resolution, its coarse spatial resolution of 1 kilometer poses challenges in analyzing localized temperature variations, limiting the ability to assess micro-scale UHI effects. To address this limitation, the raster image was converted into point-based vector data using the centroid principle. Each pixel, measuring 1 km × 1 km, was assumed to have a uniform temperature value, with its centroid representing this value. This transformation maintained the integrity of the original temperature data while enabling further spatial refinement.
To enhance spatial resolution, the Natural Neighbor interpolation method was applied within a Geographic Information System (GIS) environment. This technique preserved the original pixel values while estimating intermediate values between points, resulting in a smoother and more continuous temperature surface. In this study, the interpolation output was set to a resolution of 3 meters, significantly improving pixel density and spatial detail. The refined dataset facilitated a more precise analysis of UHI patterns and localized temperature variations, effectively bridging the gap caused by Sentinel-3's coarse resolution.
3.3. Urban Heat Island Index Calculation
Urban Heat Island (UHI) is a phenomenon in which urban areas exhibit higher temperatures than their surrounding rural regions (NASA, 2024). When traveling from mountainous regions to urban centers, one can often perceive a noticeable difference in temperature simply by feeling it. In high-altitude areas, even under direct sunlight, the temperature may remain comfortable, whereas urban centers tend to feel significantly warmer. This observable contrast exemplifies the Urban Heat Island (UHI) effect.
By definition, the UHI effect can be quantified by subtracting temperature values recorded in rural areas from those in nearby urban zones. However, while this approach provides a basic understanding, it does not fully capture the complexity of temperature variations across different locations. Factors such as diverse land surface characteristics, varying elevations, and the influence of climate change make it challenging to quantify UHI accurately, especially across large regions.
A more precise approach to studying this phenomenon involves utilizing satellite-derived Land Surface Temperature (LST) data. Remote sensing technologies offer spatially continuous, high-resolution temperature measurements, enabling a more detailed analysis of UHI dynamics and their driving factors. LST data obtained from satellites, such as Sentinel-3, are stored as image attributes containing thousands of temperature data points for a given area.
Due to the sheer volume of data, simple calculations may be insufficient to quantify UHI effectively. To refine and interpret this information, Geographic Information System (GIS)-based spatial techniques can be applied to compute temperature differentials between urban and rural areas. One widely used metric for this purpose is the Urban Heat Island Index (UHII), which provides a clear measure of temperature variation between these areas. While UHII calculations are relatively straightforward for small-scale analyses, the process becomes significantly more complex when assessing larger regions, such as entire provinces, where diverse land cover types, topographical variations, and microclimatic conditions must be considered. To address this challenge, the researchers propose a technique for quantifying UHI values by adopting the formula introduced by [48] in their research and as presented by [18] and [49] expressed as follows :
where UHII is the Urban Heat Island (UHI) Index, LST_i and LST_m are the Land Surface Temperature (LST) of a particular area and the mean LST of the area, respectively, and SD is the computed Standard Deviation of LST.
UHII = (LST_i – LST_m)/SD,
3.3. Urban Thermal Field Variance Index Calculation
While the Urban Heat Island Index (UHII) effectively captures temperature variations between different locations, it may not fully encapsulate the broader impact of the Urban Heat Island (UHI) effect on a given area. To provide a more comprehensive assessment, this study proposes the incorporation of the Urban Thermal Field Variance Index (UTFVI), as adapted from [50]. UTFVI offers a more detailed evaluation by not only quantifying UHI intensity but also correlating it with ecological conditions. Higher UTFVI values indicate stronger UHI effects and poorer ecological health, making it a valuable tool for assessing urban thermal environments.
The Urban Thermal Field Variance Index (UTFVI) is a quantitative measure used to evaluate the impact of urban heat intensity on urban surfaces [50], calculated using the equation below. By calculating UTFVI, the ecological implications of urban heat intensity can be visualized, offering a clearer understanding of both ecological conditions and the Urban Heat Island (UHI) effect. The UTFVI is determined using the equation (2), with the threshold levels categorized into six classes, as outlined in Table 1.
where UTFVI is the Urban Thermal Field Variance Threshold Index, LST_i and LST_m are the Land Surface Temperature (LST) of a particular area and the mean LST of the area, respectively.
UTFVI = (LST_i – LST_m)/LST_i,
4. Results
4.1. Land Cover Classification and Analysis
A supervised classification technique was employed using the support vector machine algorithm to analyze data from the years 2017, 2020, and 2024. Four distinct land cover classes were identified: Cropland, Woodland, Water Body, and Built-up Land. The descriptions of these classes are provided in Table 2.
The accuracy assessment of the land cover classification for 2017, 2020, and 2024 was evaluated using a confusion matrix based on 1,000 randomly selected points compared with the classified map. In this accuracy assessment matrix, the user's accuracy quantifies how well the classified image aligns with the reference samples. Specifically, it indicates the proportion of correctly classified pixels for each land cover class relative to the total number of pixels assigned to that class. For example, as shown in Table 3, cropland has a user's accuracy of 0.810084, meaning that 81% of the predicted cropland pixels were correctly classified when compared to the reference data. On the other hand, the producer’s accuracy measures how accurately each land cover class in the reference map was classified in the output map. It represents the proportion of correctly classified reference pixels relative to the total number of actual pixels in the reference dataset. For example, a producer’s accuracy of 0.821535 means that 82% of the reference pixels were correctly classified in the output map based on the referenced points. Furthermore, the Kappa index, which is a statistical measure used to evaluate the accuracy of a classification map by comparing the observed agreement with the expected agreement (random chance), was used to evaluate the overall accuracy of the classification. For example, a Kappa index of 1 indicates flawless agreement, meaning that 100% of the classification outputs perfectly match the reference points. Conversely, a Kappa index of 0 implies that none of the classifications correspond to the reference, highlighting a complete lack of agreement. Table 3 presents the threshold values of the Kappa index followed by the classification standards proposed by Landis and Koch (1977).
The results demonstrated acceptable classification performance across all years. The User’s Accuracy for the Cropland class was consistently high, ranging from 0.810 in 2017 to 0.859 in 2020, with a slight decrease to 0.815 in 2024. The Woodland class also performed well, achieving User’s Accuracy values between 0.777 in 2020 and 0.840 in 2017. In contrast, the Built-up class showed variability, with its lowest accuracy recorded in 2020 at 0.619 but recovering to 0.720 in 2024. The Waterbody class displayed significant variation, achieving perfect accuracy (1.000) in 2017 but declining to 0.700 in 2020 and slightly improving to 0.714 in 2024. The Producer’s Accuracy remained relatively consistent across all years, with values close to 0.82, indicating a reliable performance in correctly identifying ground truth pixels. The Kappa index, which measures classification agreement while accounting for chance, exceeded 0.61 for all years, with values of 0.655 (2017), 0.648 (2020), and 0.647 (2024). According to the threshold established by [51] as shown in Table 4, these Kappa values indicate a substantial level of agreement between the classified maps and reference data.
From 2017 to 2024, significant shifts in land cover were observed, marked by an increase in built-up areas and a reduction in vegetative cover, particularly woodland. Built-up land expanded from 21,256 hectares in 2017 to 32,099 hectares by 2024 (see Table 5), indicating rapid urbanization in Bukidnon. Woodland areas experienced a decline, shrinking from 392,463 hectares in 2017 to 367,737 hectares in 2024 (refer to Figure 3). This reduction suggests a substantial conversion of natural landscapes into urban and agricultural areas.
4.2. Land Surface Temperature Analysis
Figure 4 illustrates the spatiotemporal variations in Land Surface Temperature (LST) across the study area for the years 2017 (a), 2020 (b), and 2024 (c). This multitemporal analysis highlights shifts in surface temperature, reflecting the influence of land cover changes and urban development over the period.
In 2017, LST values ranged from 15.9783°C to 34.4996°C, with higher temperatures concentrated in the southern and central regions. Areas with lower LST values, depicted in green, are primarily distributed in the northern and mid-central portions, likely corresponding to woodland or heavily vegetated and less urbanized zones.
By 2020, the LST range increased to 17.5329°C - 36.9591°C, indicating a notable rise in land surface temperatures. This trend suggests intensified urban heat island (UHI) effects or reduced vegetation cover, with expanded red and orange zones across the map.
In contrast, the year 2024 reveals a reduction in maximum LST to 31.0354°C, while the minimum LST decreases to 12.9585°C. Despite the lower overall LST values, the spatial distribution of high-temperature zones remains widespread, highlighting persistent thermal hotspots likely driven by ongoing land use dynamics.
4.3. Urban Heat Island Index and Urban Thermal Field Variance Index Analysis
Figure 5 presents a comparative analysis of the Urban Heat Island Index (UHII) across three temporal maps: 2017 (a), 2020 (b), and 2024 (c). The UHII is spatially visualized, illustrating variations in surface temperature intensities across the study area.
In 2017, higher UHII values, indicated by red to orange hues, were predominantly concentrated in the central and southern regions, signifying elevated land surface temperatures. Conversely, the northern and select mid-central areas exhibit cooler UHII indices, marked by green shades. By 2020, there is a noticeable reduction in the extent of high UHII zones, suggesting potential improvements in vegetation cover or land-use changes. However, the 2024 projection reveals a resurgence of elevated UHII values, indicating a possible increase in urbanization or reduction in vegetative cover.
The UHII values reflect a subtle fluctuation over time. In 2017, the highest recorded UHII value was 2.16133, which slightly decreased to 2.00838 in 2020, before rising to 2.06475 in 2024. Conversely, the lowest UHII demonstrates a gradual increase from -3.53954 in 2017 to -2.9478 in 2020, with a slight decrease to -3.11711 by 2024.
Figure 6 illustrates the zonal distribution of the Urban Thermal Field Variance Index (UTFVI) across barangays for the years 2017 (a), 2020 (b), and 2024 (c). This visualization provides insight into the spatial and temporal shifts in ecological conditions and the intensity of the Urban Heat Island (UHI) phenomenon.
In 2017, a significant portion of the study area exhibited "Excellent" ecological conditions, represented by dark blue, indicating no UHI phenomenon. However, localized areas of weak to strong UHI intensity (depicted in purple to orange) appear along the periphery, and selected barangays corresponding to urbanized zones.
By 2020, there is a noticeable expansion of zones classified as "Normal" to "Bad" ecological conditions (yellow and light orange), reflecting an increase in middle to strong UHI phenomena. This trend suggests urban expansion and the corresponding rise in surface temperatures. The presence of "Worst" ecological conditions (represented by yellow) becomes more pronounced, highlighting critical areas experiencing the most severe thermal stress.
The 2024 illustration reveals a mixed pattern. While some regions show improvements, returning to "Excellent" conditions, areas with "Worst" ecological conditions persist in densely populated or highly urbanized sectors. The spread of "Weak" and "Middle" UHI zones suggests ongoing urbanization and land use change, necessitating targeted mitigation efforts. The shift in land surface temperatures observed in 2024, which subsequently affects the UTFVI index, indicates the presence of additional influencing factors. One notable factor could be the persistence of tropical cyclones in the Philippines during this period, leading to increased rainfall in the study area. This heightened precipitation likely enhances the cooling effect, contributing to the observed changes in surface temperature and ecological conditions.
4.3. Correlation between LandCover Classes and Land Surface Temperature (LST)
Pearson correlation analysis was employed to examine the relationship between Land Surface Temperature (LST) and land cover classes, incorporating population and elevation as additional variables. The Province of Bukidnon comprises a total of 464 barangays, providing 464 data points for each variable in the study. Population data were sourced from the Philippine Statistics Authority (PSA). Since PSA data were available only for 2015 and 2020, linear interpolation was performed at the barangay level to estimate population values for 2017 and 2024. Elevation data were derived from the Philippine Geoportal (https://www.geoportal.gov.ph/) and processed using zonal averaging techniques. For land cover classification, spatial normalization was conducted to express the data as percentages. Table 6 and Table 7 present the correlation matrices for the years 2017 through 2024, respectively.
The correlation matrices for the years 2017, 2020, and 2024 reveal significant relationships between Land Surface Temperature (LST) and various variables. Elevation consistently shows a strong negative correlation with LST across all years (-0.817 in 2017, -0.775 in 2020, and -0.761 in 2024), indicating that higher elevations are associated with lower temperatures. Population exhibits a weak positive correlation with LST (0.165 in 2017, 0.152 in 2020, and 0.190 in 2024), suggesting a minor influence of population density on temperature. Built-up areas demonstrate a moderate positive correlation with LST, ranging from 0.197 to 0.283, highlighting the impact of urbanization on temperature increase. Cropland consistently shows the strongest positive correlation with LST among all land cover types, peaking in 2020 (0.667) compared to 2017 (0.521) and slightly declining in 2024 (0.551), highlighting the role of agricultural activities in temperature dynamics. Water bodies display a weaker positive correlation with LST, fluctuating across the years (0.233 in 2017, 0.109 in 2020, and 0.167 in 2024), reflecting a lesser influence on temperature patterns. While woodland demonstrates a strong negative correlation with LST, reflecting its cooling effect. This correlation strengthens from 2017 (-0.683) to 2020 (-0.794) before slightly weakening in 2024 (-0.697).
The results consistently reveal the variables that are highly correlated, with a notable observation that cropland and woodland consistently exhibit a strong negative relationship. This is evidenced by correlation values of -0.864 in 2017, -0.880 in 2020, and -0.798 in 2024. These findings indicate that areas with a higher proportion of cropland tend to have significantly less woodland, suggesting an ongoing land conversion process where cropland expansion occurs at the expense of woodland areas.
5. Discussions
The results of the study reveal substantial land cover changes in Bukidnon Province from 2017 to 2024, driven by urban expansion and agricultural development. The increase in built-up areas and the corresponding decline in woodland highlights the extent of urbanization, which is a significant contributing factor to the intensification of the Urban Heat Island (UHI) effect observed in the area. This aligns with global trends indicating that urban growth often significantly alters local land cover, leading to elevated land surface temperatures (LST) [6,7,8].
Land cover classification revealed that built-up land expanded by nearly 10,000 hectares between 2017 and 2024, while woodland areas experienced a considerable reduction. These shifts indicate a progressive conversion of natural and agricultural lands into urban environments. The reduction of vegetative cover, which serves as a natural cooling mechanism, has been directly linked to increased LST across Bukidnon. This pattern is consistent with existing literature demonstrating that replacing vegetation with impervious surfaces leads to higher heat retention and exacerbates UHI effects [13,15].
The analysis of LST data shows a clear upward trend in surface temperatures, particularly in urbanized and deforested areas. From 2017 to 2020, LST values increased notably, reflecting the peak of urban expansion during this period. Interestingly, by 2024, there was a slight decrease in maximum LST, which may be attributed to increased rainfall.
Despite this decline, the spatial distribution of high-temperature zones remained widespread, indicating persistent thermal hotspots. When comparing the Land Surface Temperature (LST) across different land cover types, it is evident that woodland areas consistently maintain lower LST values. In contrast, croplands and built-up areas consistently exhibit higher LST, reflecting the influence of vegetation density and urbanization on surface temperature dynamics. The decline in observed LST in 2024 may be attributed to persistent rainfall associated with tropical cyclones. This is supported by PAGASA records, which indicate that 2024 experienced slightly higher rainfall. The increased rainfall and cooler atmospheric conditions likely contributed to the reduction in surface temperatures. However, the trend in LST and corresponding land cover remains consistent across 2017, 2020, and 2024, with woodland areas consistently exhibiting lower temperatures than other land cover types. Conversely, the water bodies cannot be clearly analyzed in relation to LST due to their minimal coverage, making them nearly indistinguishable in the maps.
While the slight decrease in LST observed in 2024 is potentially attributable to increased rainfall, likely associated with persistent tropical cyclone activity, this interpretation remains largely qualitative due to limitations in ground-based climatic data. Specific monthly rainfall totals and cyclone frequencies were not included in this study, as only one operational synoptic station exists in Bukidnon, constraining localized climate validation. Additionally, no quantitative correlation analysis was conducted between rainfall amounts and LST decline. Future research should incorporate satellite-based climate datasets, such as the Tropical Rainfall Measuring Mission (TRMM) or the Global Precipitation Measurement (GPM), to support rainfall-based interpretation and allow a more robust statistical assessment of this relationship.
Moreover, other potentially influential factors—such as shifts in land use policies, increased urban greening efforts, or reforestation programs—were not quantitatively evaluated due to a lack of spatial policy data. It is plausible that such interventions, particularly in ecologically sensitive zones, could have contributed to localized cooling effects. These should be explored in future studies, possibly through NDVI (Normalized Difference Vegetation Index) trend analysis or policy change mapping.
Although LST values were analyzed for the years 2017, 2020, and 2024, a clearer year-by-year temperature trend could enhance the interpretation of the 2024 decline. Future work is encouraged to use annual or seasonal LST composites to capture more refined temporal dynamics and to better assess whether the cooling trend is sustained or anomalous.
The Urban Heat Island Index (UHII) analysis further highlights the relationship between land cover changes and surface temperature dynamics. High UHII values were consistently recorded in urban centers and the cropland area, while cooler indices were observed in woodland and rural areas. This variation highlights the critical role of vegetation in mitigating the effects of urban heating [7,15]. The resurgence of elevated UHII values in 2024 suggests that urban expansion continues to exert pressure on local temperature patterns. The Urban Heat Island Intensity (UHII) follows a similar trend to LST, with higher LST values correlating with increased UHII. These elevated temperatures are consistently observed in cropland and built-up areas. The Urban Thermal Field Variance Index (UTFVI) provides additional insights into the ecological implications of rising temperatures. The expansion of areas labeled as having "Bad" and "Worst" ecological conditions suggests that the intensifying Urban Heat Island (UHI) effect contributes to environmental degradation [50]. This raises serious concerns about how these changes could affect biodiversity, agricultural productivity, and public health. It's important to recognize that each crop has specific climatic requirements, particularly concerning temperature thresholds. Elevated temperatures not only challenge irrigation management across both irrigated and rain-fed lands but also increase water consumption, which can adversely affect plant growth and the availability of irrigation water. Furthermore, the rise in Urban Heat Island (UHI) effects can exacerbate public health issues, leading to increased heat stress, respiratory difficulties, and overall reduced quality of life for urban populations. As Urban Heat Island (UHI) effects continue to intensify, it becomes imperative to implement effective mitigation strategies. These should include preserving existing woodland areas, intensifying greening projects led by government agencies, and promoting agroforestry practices. Such measures are essential to counteract the rising temperatures associated with UHI and safeguard agricultural sustainability and environmental health.
The Pearson correlation analysis highlights the complex interplay between Land Surface Temperature (LST), land cover classes, elevation, and population in Bukidnon Province. The findings offer valuable insights into how these variables influence thermal environments and underscore the implications of land use changes on local climate dynamics. The consistent strong negative correlation between elevation and LST across all years (-0.817 in 2017, -0.775 in 2020, and -0.761 in 2024) underscores the well-documented relationship where higher altitudes experience lower temperatures. This trend is expected given the adiabatic cooling effect of elevation, emphasizing the role of Bukidnon's mountainous terrain in moderating LST. The weak but positive correlation between population and LST (0.165 in 2017, 0.152 in 2020, and 0.190 in 2024) suggests that population density alone may not be a primary driver of LST changes in the province but could indirectly contribute through urbanization and land use modifications. Built-up areas demonstrate a moderate positive correlation with LST, which ranges from 0.197 to 0.283 over the study years, reflecting the contribution of urbanization to the Urban Heat Island (UHI) effect. This result aligns with global findings where impervious surfaces such as concrete and asphalt exacerbate temperature increases. Similarly, cropland exhibits the strongest positive correlation with LST among land cover types, peaking in 2020 (0.667) and slightly declining in 2024 (0.551). This trend highlights the influence of agricultural activities on LST, possibly due to reduced vegetation cover and changes in soil moisture levels associated with farming practices.
Woodland consistently exhibits a strong negative correlation with LST (-0.683 in 2017, -0.794 in 2020, and -0.697 in 2024), reflecting its cooling effect. This finding underscores the critical role of forest cover in mitigating LST through evapotranspiration, shading, and other ecosystem services. The inverse relationship between cropland and woodland (-0.864 in 2017, -0.880 in 2020, and -0.798 in 2024) is particularly striking. It reveals an ongoing land conversion process where cropland expansion occurs at the expense of forested areas. This pattern contributes to higher LST and raises concerns about biodiversity loss, carbon sequestration, and watershed stability.
This study underscores the need for significant urban planning and the development of green infrastructure to help combat UHI effects. Increasing green spaces in cities, preserving existing forests, and encouraging sustainable farming practices can minimize the negative impacts of urbanization on local climates. Looking ahead, research should aim to improve predictive models that take into account the socioeconomic factors driving changes in land use and their long-term effects on urban heat dynamics [19,31], particularly in Bukidnon and similar areas.
6. Conclusions
This study highlights the significant impact of land cover changes on Land Surface Temperature (LST) dynamics in the Province of Bukidnon from 2017 to 2024, driven primarily by urban expansion and agricultural development. The findings reveal that built-up areas and cropland consistently exhibit higher LST values, while woodland demonstrates a strong cooling effect, emphasizing its critical role in regulating local temperatures. The consistent negative correlation between elevation and LST underscores the influence of Bukidnon’s topography in moderating surface temperatures. In contrast, the weak positive correlation with population suggests that urbanization, rather than population density itself, is a key driver of LST increase.
The reduction in woodland and cropland expansion highlights an ongoing land conversion process, which contributes to elevated LST and raises concerns about biodiversity loss, carbon sequestration, and watershed stability. Furthermore, the intensification of the Urban Heat Island (UHI) effect, as evidenced by the Urban Heat Island Index (UHII) and Urban Thermal Field Variance Index (UTFVI), suggests that urbanization and agricultural practices are placing significant pressure on the local climate and ecological balance.
These findings highlight the urgent need for sustainable land management practices, including the preservation of forested areas, the expansion of urban green spaces, and the adoption of climate-smart agricultural techniques. Mitigating the adverse effects of land cover changes on local climates requires a multifaceted approach involving proactive urban planning and evidence-based policymaking.
Urban planners should integrate nature-based solutions, such as green infrastructure, urban forests, and permeable surfaces, to counteract the heat island effect and enhance urban resilience. Policymakers must enforce stringent land-use regulations that balance urban expansion with ecological conservation, promoting mixed-use zoning strategies that minimize environmental degradation.
Furthermore, local governments should prioritize investments in climate-resilient infrastructure and leverage smart city technologies to monitor and manage urban climate conditions effectively. Public awareness campaigns and stakeholder engagement initiatives are also crucial in fostering community-driven sustainability efforts, ensuring long-term environmental stewardship and adaptive urban development.
This study is limited by the absence of high-resolution, ground-based climatic data such as rainfall patterns and cyclone activity which restricts the ability to validate satellite-derived findings and confidently attribute observed changes in land surface temperature. While satellite-based LST and land cover data provide valuable insights, a more comprehensive understanding of Urban Heat Island (UHI) dynamics requires integrating multiple data sources. Future research should prioritize the development of predictive models that incorporate both climatic and socio-economic drivers of land use change. In particular, the inclusion of satellite-derived rainfall datasets, and spatial land management policy data would enhance the accuracy of climate assessments, improve attribution of observed thermal patterns, and support the design of more effective mitigation strategies balancing urban and agricultural development with environmental sustainability in Bukidnon and similar regions.
Author Contributions
Conceptualization, methodology, software, validation, formal analysis, investigation, resources, data curation, writing—original draft preparation, writing—review and editing, visualization, supervision, and project administration were conducted by Jecar Dadole. Kristine Companion, Elizabeth Edan Albiento, and Raquel Masalig contributed to reviewing and critiquing the manuscript, refining the methods, and addressing grammatical improvements, they also served as the technical panel advisers. All authors have read and agreed to the published version of the manuscript.
Funding
This research was partially funded by the Department of Science and Technology—Engineering Research and Development for Technology (DOST-ERDT) through the thesis allowance provided to Jecar Dadole as a scholar. Additionally, the dissemination of this research was partially supported by the DOST-ERDT and the Josefina H. Cerilles Sate College (JHCSC) through funding for conference participation.
Institutional Review Board Statement
Not Applicable.
Informed Consent Statement
Not Applicable.
Data Availability Statement
The data supporting the findings of this study are available from the corresponding author upon reasonable request. Some datasets, such as population data sourced from the Philippine Statistics Authority (PSA) and elevation data from the Philippine Geoportal are publicly accessible through their respective platforms. However, specific processed data and results may not be publicly available due to ethical and privacy considerations.
Acknowledgments
This research was made possible through the funding support of the Department of Science and Technology—Engineering Research and Development for Technology (DOST-ERDT). The technical assistance provided by Josefina H. Cerilles State College (JHCSC) through access to necessary computational resources is gratefully acknowledged. Gratitude is also extended to Mindanao State University–Iligan Institute of Technology (MSU-IIT) for their invaluable guidance and academic support throughout the course of this study. Appreciation is also extended to the personnel of the Philippine Atmospheric, Geophysical and Astronomical Services Administration (PAGASA) for their assistance in obtaining relevant data.
Conflicts of Interest
The funders had no role in the design of the study; in the collection, analyses, or interpretation of data; in the writing of the manuscript; or in the decision to publish the results.
Abbreviations
The following abbreviations are used in this manuscript:
| DOST-ERDT | Department of Science and Technology – Engineering Research development for Technology |
| GIS | Geographic Information System |
| GVA | Gross Value Added |
| JHCSC | J. H. Cerilles State College |
| LST | Land Surface Temperature |
| LULC | Land Use/Land Cover |
| MSU-IIT | Mindanao State University - Iligan Institute of Technology |
| NASA | National Aeronautics and Space Administration |
| PAGASA | Philippine Astronomical, Geophysical and Astronomical Services Administration |
| PSA | Philippine Statistics Authority |
| SD | Standard Deviation |
| SDG | Sustainable Development Goals |
| SLSTR | Sea and Land Surface Temperature Radiometer |
| UHI | Urban Heat Island |
| UHII | Urban Heat Island Index |
| UTFVI | Urban Thermal Field Variance Index |
| USGS | United States Geological Survey |
References
- Adeleke, S.O.; Moshood, F.J. Impact of Urbanization on Land Cover Changes and Land Surface Temperature in Iseyin Local Government Area, Oyo State, Nigeria. Journal of Tropical Forestry and Environment 2022, 12, 33–43. [Google Scholar] [CrossRef]
- Akomolafe, G. F.; Rosazlina, R. Land use and land cover changes influence the land surface temperature and vegetation in Penang Island, Peninsular Malaysia. Scientific Reports 2022, 12, 21250. [Google Scholar] [CrossRef]
- Dharani, M.; Sreenivasulu, G. Land Use and Land Cover Change Detection Using Principal Component Analysis and Morphological Operations in Remote Sensing Applications. International Journal of Remote Sensing Applications 2019, 8, 98–109. [Google Scholar] [CrossRef]
- Zargari, H.; Esmaili, A.; Mahmoudi, R. Assessing Urban Heat Island Intensity and Mitigation Strategies: A Comprehensive Review. Urban Climate 2024, 42, 101337. [Google Scholar] [CrossRef]
- Malik, Z.; Kalotra, S. Urbanization, and LST Variations: A Study Using Landsat and Sentinel Data. Sustainable Development and Climate Change 2024, 30, 54–65. [Google Scholar]
- Munsyi, K.; Huang, Y.; Tang, B. Comparative Analysis of Urban Heat Islands Using Landsat and Sentinel Data in Southeast Asia. Environmental Monitoring and Assessment 2024, 196, 1169. [Google Scholar] [CrossRef]
- Ifreey, A.; Alwi, M.; Wahid, T. Sustainable Mitigation Strategies for Urban Heat Island Effects in Urban Areas. International Journal of Urban Sustainable Development 2023, 15, 343–357. [Google Scholar] [CrossRef]
- Shi, J.; Li, Y.; Chen, X. Urban Heat Island Intensity Variability Using Sentinel-2 and Landsat-8. Remote Sensing Applications 2021, 25, 512–526. [Google Scholar] [CrossRef]
- Qiao, Z.; Wang, Y.; Huang, J.; Zhou, X. Impact of Urbanization on Urban Heat Island Intensity and Mitigation Strategies. Environmental Research Letters 2020, 15, 105005. [Google Scholar] [CrossRef]
- He, T.; Wang, N.; Chen, J.; Wu, F.; Xu, X.; Liu, L.; Han, D.; Sun, Z.; Lu, Y.; Hao, Y.; Qiao, Z. Direct and indirect impacts of land use/cover change on urban heat environment: A 15-year panel data study across 365 Chinese cities during summer daytime and nighttime. Landscape Ecology 2024, 39, 67. [Google Scholar] [CrossRef]
- Hou, X.; Fan, J.; Zhang, P. Remote sensing analysis of urban thermal patterns in response to land use dynamics. Urban Environment 2022, 19, 123–140. [Google Scholar] [CrossRef]
- Todeschi, V.; Pappalardo, S. E.; Zanetti, C.; Peroni, F.; Marchi, M. D. Climate Justice in the City: Mapping Heat-Related Risk for Climate Change Mitigation of the Urban and Peri-Urban Area of Padua (Italy). ISPRS International Journal of Geo-Information 2022, 11, 490. [Google Scholar] [CrossRef]
- Imran, H.M.; Habib, S.; Niazi, Z. Impact of land cover changes on land surface temperature and human thermal comfort in Dhaka City, Bangladesh. Urban Forestry and Urban Greening 2021, 59, 126846. [Google Scholar] [CrossRef]
- Alkaradaghi, K.; Ali, S.S.; Al-Ansari, N.; Laue, J. Land Use Classification and Change Detection Using Multi-temporal Landsat Imagery in Sulaimaniyah Governorate, Iraq. In Advances in Remote Sensing and Geo-Informatics Applications. CAJG 2018. Advances in Science, Technology & Innovation; El-Askary, H., Lee, S., Heggy, E., Pradhan, B., Eds.; Advances in Science, Technology & Innovation; Springer, 2018; pp. 117–120. [Google Scholar] [CrossRef]
- Rashid, N.; Alam, J.A.M.M.; Chowdhury, Md. A; Ul Islam, S.L. Impact of land-use change and urbanization on urban heat island effect in Narayanganj city, Bangladesh: A remote sensing-based estimation. Environmental Challenges 2022, 8, 100571. [Google Scholar] [CrossRef]
- Tian, L.; Li, Y.; Lu, J.; Wang, J. Review on Urban Heat Island in China: Methods, Its Impact on Buildings Energy Demand and Mitigation Strategies. Sustainability 2021, 13, 762. [Google Scholar] [CrossRef]
- Choudhury, U.; Singh, S.K.; Kumar, A.; Meraj, G.; Kumar, P.; Kanga, S. Assessing land use/land cover changes and urban heat island intensification: A case study of Kamrup Metropolitan District, Northeast India (2000–2032). Earth 2023, 4, 503–521. [Google Scholar] [CrossRef]
- Rahman, Md. N.; Rony, Md. R. H.; Jannat, F. A.; Chandra Pal, S.; Islam, Md. S.; Alam, E.; Islam, A. R. Md. T. Impact of Urbanization on Urban Heat Island Intensity in Major Districts of Bangladesh Using Remote Sensing and Geo-Spatial Tools. Climate 2022, 10, 3. [Google Scholar] [CrossRef]
- Igun, E.; Williams, M. Impact of urban land cover change on land surface temperature. Journal of Urban Ecology 2018, 12, 23–37. [Google Scholar] [CrossRef]
- Salman, Md. A.; Nomaan, Md. S. S.; Sayed, S.; Saha, A.; Rafiq, M. R. Land Use and Land Cover Change Detection by Using Remote Sensing and GIS Technology in Barishal District, Bangladesh. Earth Science Malaysia 2020, 5, 33–40. [Google Scholar] [CrossRef]
- Seyam, M. M. H.; Haque, M. R.; Rahman, M. M. Identifying the land use land cover (LULC) changes using remote sensing and GIS approach: A case study at Bhaluka in Mymensingh, Bangladesh. Case Studies in Chemical and Environmental Engineering 2023, 7, 100293. [Google Scholar] [CrossRef]
- Suharyanto, A.; Maulana, A.; Suprayogo, D.; Devia, Y.; Kurniawan, S. Global Journal of Environmental Science and Management Land surface temperature changes caused by land cover/ land use properties and their impact on rainfall characteristics. Global J. Environ. Sci. Manage 2023, 9, 35. [Google Scholar] [CrossRef]
- Gu, Z.; Zeng, M. The Use of Artificial Intelligence and Satellite Remote Sensing in Land Cover Change Detection: Review and Perspectives. Sustainability 2023, 16, 274. [Google Scholar] [CrossRef]
- Alonzo, M.; Van Den Hoek, J.; Murillo-Sandoval, P. J.; Steger, C. E.; Zinda, J. A. Mapping and quantifying land cover dynamics using dense remote sensing time series with the user-friendly pyNITA software. Environmental Modelling and Software 2021, 145, 105179. [Google Scholar] [CrossRef]
- Wang, X.; Jiang, W.; Deng, Y.; Yin, X.; Peng, K.; Rao, P.; Li, Z. Contribution of Land Cover Classification Results Based on Sentinel-1 and 2 to the Accreditation of Wetland Cities. Remote Sensing 2023, 15, 1275. [Google Scholar] [CrossRef]
- Khan, M.S.; Ullah, S.; Sun, T.; Rehman, A.U.; Chen, L. Land-Use/Land-Cover Changes and Its Contribution to Urban Heat Island: A Case Study of Islamabad, Pakistan. Sustainability 2020, 12, 3861. [Google Scholar] [CrossRef]
- Miah, M. T.; Fariha, J. N.; Jodder, P. K.; Al Kafy, A.; Raiyan, R.; Usha, S. A.; Hossan, J.; Rahaman, K. R. Urban Heat Island and Environmental Degradation Analysis Utilizing a Remote Sensing Technique in Rapidly Urbanizing South Asian Cities. World 2024, 5, 1023–1053. [Google Scholar] [CrossRef]
- Lo, C.P.; Quattrochi, D.A. Land-Use and Land-Cover Change, Urban Heat Island Phenomenon, and Health Implications: A Remote Sensing Approach. Photogrammetric Engineering and Remote Sensing 2003, 69, 1053–1063. [Google Scholar] [CrossRef]
- Purio, M. A.; Yoshitake, T.; Cho, M. Assessment of Intra-Urban Heat Island in a Densely Populated City Using Remote Sensing: A Case Study for Manila City. Remote Sensing 2022, 14, 5573. [Google Scholar] [CrossRef]
- Onačillová, K.; Gallay, M.; Paluba, D.; Péliová, A.; Tokarčík, O.; Laubertová, D. Combining Landsat 8 and Sentinel-2 Data in Google Earth Engine to Derive Higher Resolution Land Surface Temperature Maps in Urban Environment. Remote Sensing 2022, 14, 4076. [Google Scholar] [CrossRef]
- Van Thong, D.; Tuan Cuong, H.; Ha Phuong, T.; Lam, N.T.N.; Nguyen, T.P.C.; Lap Xuan, T.T.; Le Quang, T. Analysis of urban heat islands combining Sentinel-2 and Landsat 8 satellite images in Ho Chi Minh City. IOP Conference Series: Earth and Environmental Science 2024, 1349, 012032. [Google Scholar] [CrossRef]
- Al-Taei, A. I.; Alesheikh, A. A.; Darvishi Boloorani, A. Land Use/Land Cover Change Analysis Using Multi-Temporal Remote Sensing Data: A Case Study of Tigris and Euphrates Rivers Basin. Land 2023, 12, 1101. [Google Scholar] [CrossRef]
- Guo, X.; Ye, J.; Hu, Y. Analysis of Land Use Change and Driving Mechanisms in Vietnam during the Period 2000–2020. Remote Sensing 2022, 14, 1600. [Google Scholar] [CrossRef]
- Jamei, Y.; Seyedmahmoudian, M.; Jamei, E.; Horan, B.; Mekhilef, S.; Stojcevski, A. Investigating the Relationship between Land Use/Land Cover Change and Land Surface Temperature Using Google Earth Engine; Case Study: Melbourne, Australia. Sustainability 2022, 14, 14868. [Google Scholar] [CrossRef]
- Benaomar, K.; Outzourhit, A. Exploring the Complexities of Urban Forms and Urban Heat Islands: Insights from the Literature, Methodologies, and Current Status in Morocco. Atmosphere 2024, 15, 822. [Google Scholar] [CrossRef]
- Mao, X.; Tang, G.; Du, J.; Tian, X. Biophysical Effects of Land Cover Changes on Land Surface Temperature on the Sichuan Basin and Surrounding Regions. Land 2023, 12, 1959. [Google Scholar] [CrossRef]
- Wellman, K.; White, M.; Robinson, P. Urbanization and its impact on local climates: A review of global trends. Environmental Sustainability 2020, 14, 233–245. [Google Scholar] [CrossRef]
- Gislason, P. O.; Benediktsson, J. A.; Sveinsson, J. R. Random Forests for land cover classification. Pattern Recognition Letters 2006, 27, 294–300. [Google Scholar] [CrossRef]
- Xian, G.; Shi, H.; Auch, R.; Gallo, K.; Zhou, Q.; Wu, Z.; Kolian, M. The effects of urban land cover dynamics on urban heat Island intensity and temporal trends. GIScience and Remote Sensing 2021, 58, 501–515. [Google Scholar] [CrossRef]
- Sadiq Khan, M.; Ullah, S.; Sun, T.; Rehman, A.; Chen, L. Land-Use/Land-Cover Changes and Its Contribution to Urban Heat Island: A Case Study of Islamabad, Pakistan. Sustainability 2020, 12, 3861. [Google Scholar] [CrossRef]
- Mas’uddin, M.; Karlinasari, L.; Pertiwi, S.; Erizal, E. Urban Heat Island Index Change Detection Based on Land Surface Temperature, Normalized Difference Vegetation Index, and Normalized Difference Built-Up Index: A Case Study. Journal of Ecological Engineering 2023, 24, 91–107. [Google Scholar] [CrossRef]
- Sahoo, S.; Majumder, A.; Swain, S.; Gareema; Pateriya, B.; Al-Ansari, N. Analysis of Decadal Land Use Changes and Its Impacts on Urban Heat Island (UHI) Using Remote Sensing-Based Approach: A Smart City Perspective. Sustainability 2022, 14, 11892. [Google Scholar] [CrossRef]
- Damayanti, A.; Hartati, K.; Widodo, W. Impacts of land cover changes on land surface temperature using Landsat imagery with the supervised classification method. International Journal of Remote Sensing 2023, 44, 1203–1218. [Google Scholar] [CrossRef]
- Rousta, I.; Sarif, M. O.; Gupta, R. D.; Olafsson, H.; Ranagalage, M.; Murayama, Y.; Zhang, H.; Mushore, T. D. Spatiotemporal Analysis of Land Use/Land Cover and Its Effects on Surface Urban Heat Island Using Landsat Data: A Case Study of Metropolitan City Tehran (1988–2018). Sustainability 2018, 10, 4433. [Google Scholar] [CrossRef]
- Traore, M.; Lee, M. S.; Rasul, A.; Balew, A. Assessment of land use/land cover changes and their impacts on land surface temperature in Bangui (the capital of Central African Republic). Environmental Challenges 2021, 4, 100114. [Google Scholar] [CrossRef]
- Jabbar, K.L.; Hamoodi, M.N.; Al-Hameedawi, A.N. Urban heat islands: A review of contributing factors, effects, and data. IOP Conf. Series: Earth and Environmental Science 2023, 1129, 012038. [Google Scholar]
- Garcia, D.H. Analysis of urban heat island and heat waves using Sentinel-3 images: A study of Andalusian cities in Spain. Journal of Environmental Management 2021, 296, 113234. [Google Scholar] [CrossRef]
- Guo, X.; Ye, J.; Hu, Y. Analysis of Land Use Change and Driving Mechanisms in Vietnam during the Period 2000–2020. Remote Sensing 2022, 14, 1600. [Google Scholar] [CrossRef]
- Sharma, U.; Jalan, S.; Kant, Y.; Vyas, A. Spatio-Temporal Dynamics of Urban Thermal Environment in Udaipur City, Rajasthan, India. The International Archives of the Photogrammetry, Remote Sensing and Spatial Information Sciences 2023, 48, 1545–1551. [Google Scholar] [CrossRef]
- Hassan, T.; Zhang, J.; Prodhan, F. A.; Pangali Sharma, T. P.; Bashir, B. Surface Urban Heat Islands Dynamics in Response to LULC and Vegetation across South Asia (2000–2019). Remote Sensing 2021, 13, 3177. [Google Scholar] [CrossRef]
- Landis, J.; Koch, G. The measurement of observer agreement for categorical data. Biometrics 1977, 33, 159–174. [Google Scholar] [CrossRef]
Figure 1.
Satellite imagery showing the geographical boundary: (a) the Philippines highlighting the (b) the Province of Bukidnon, the study area.
Figure 1.
Satellite imagery showing the geographical boundary: (a) the Philippines highlighting the (b) the Province of Bukidnon, the study area.
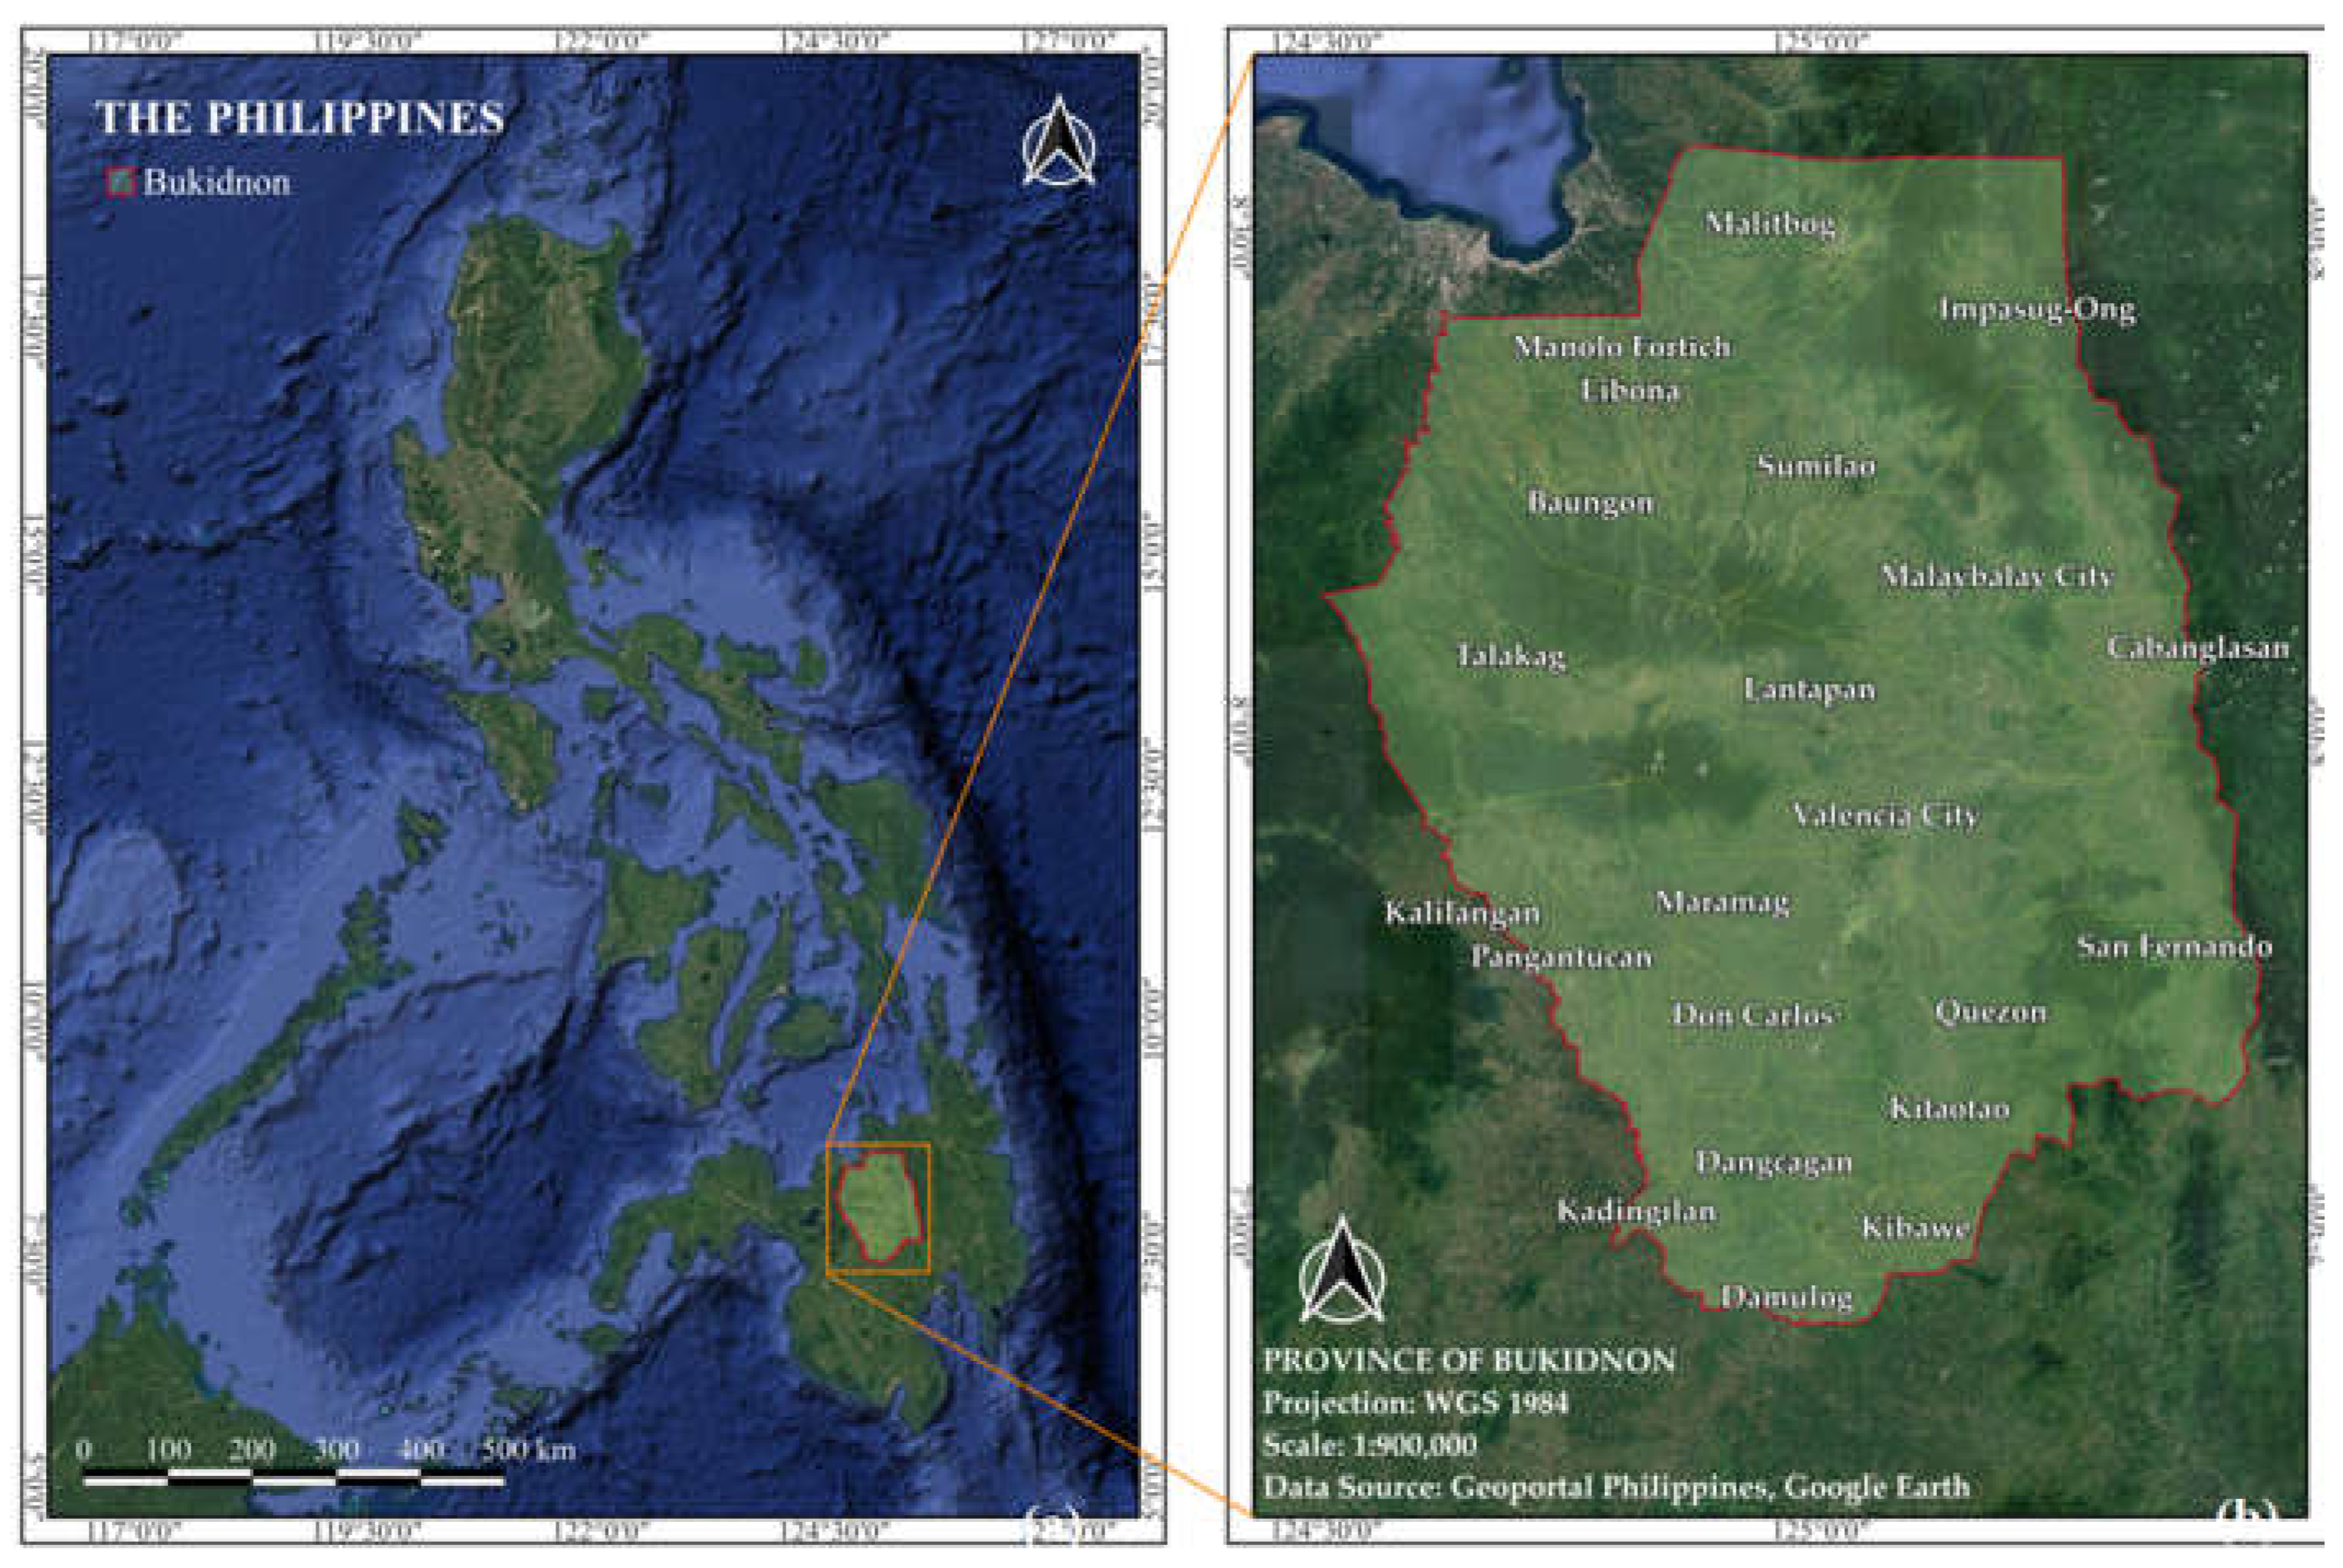
Figure 2.
Methodological Framework of the Study outlining the workflow and key outcomes of the research.
Figure 2.
Methodological Framework of the Study outlining the workflow and key outcomes of the research.
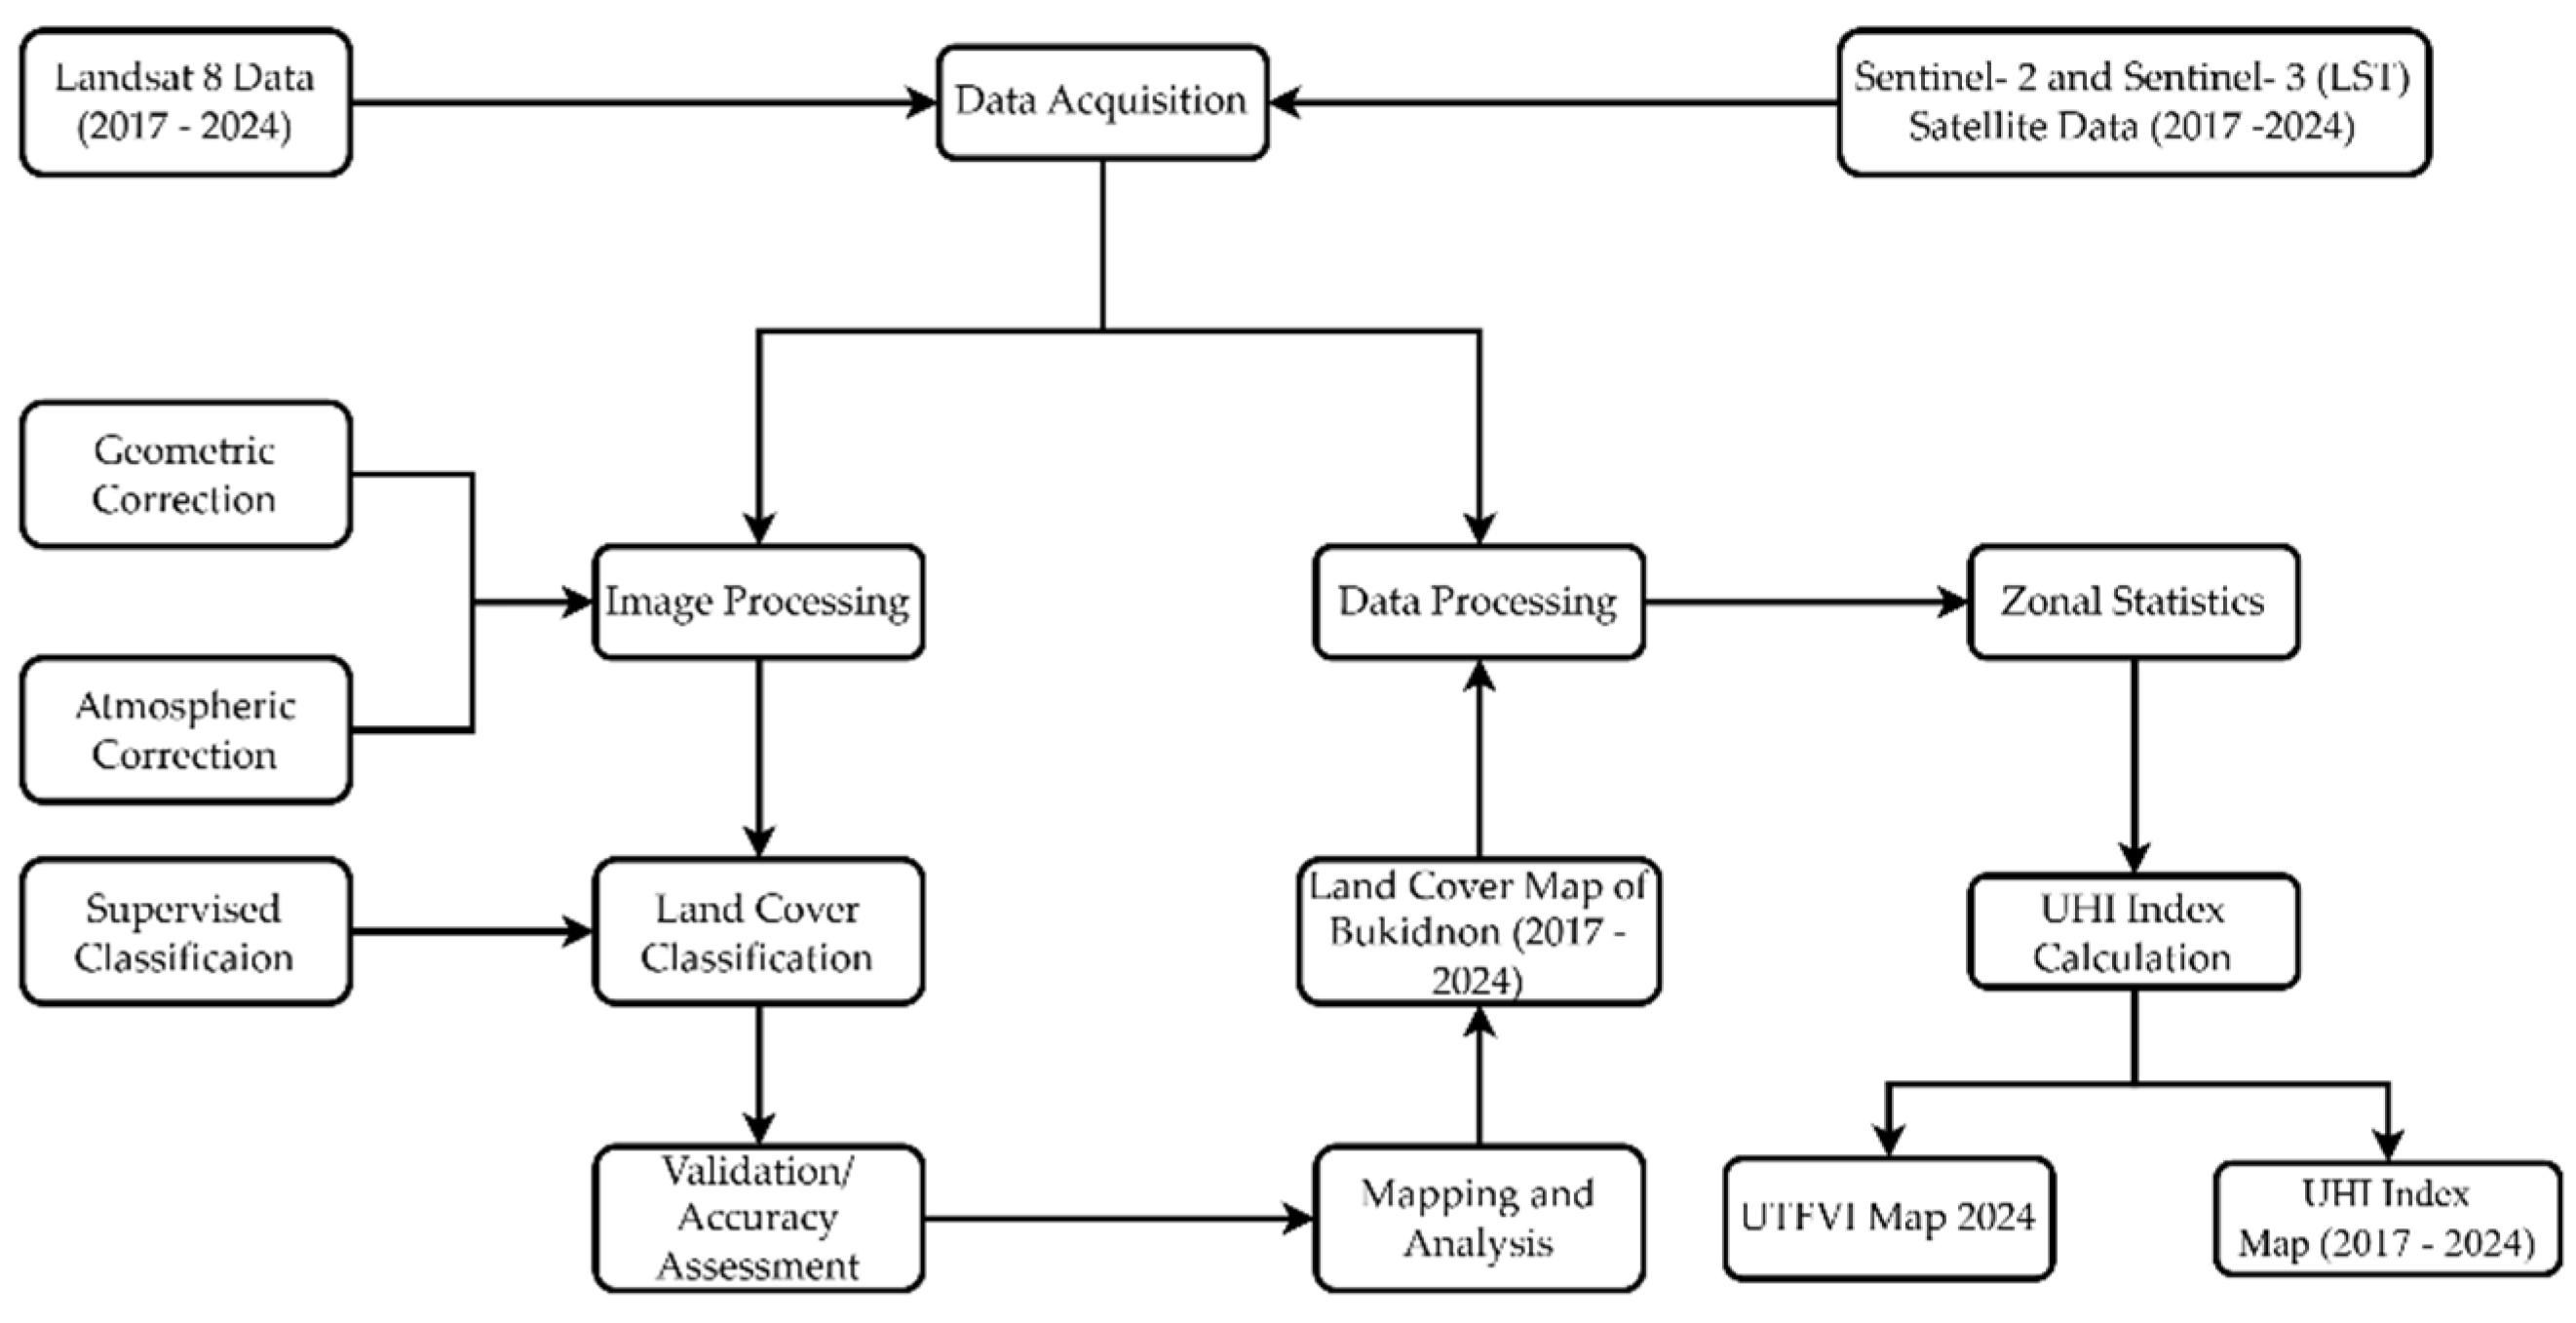
Figure 3.
Land Cover Classes of the Province of Bukidnon for the year (a) 2017, (b) 2020, and (c) 2024.
Figure 3.
Land Cover Classes of the Province of Bukidnon for the year (a) 2017, (b) 2020, and (c) 2024.
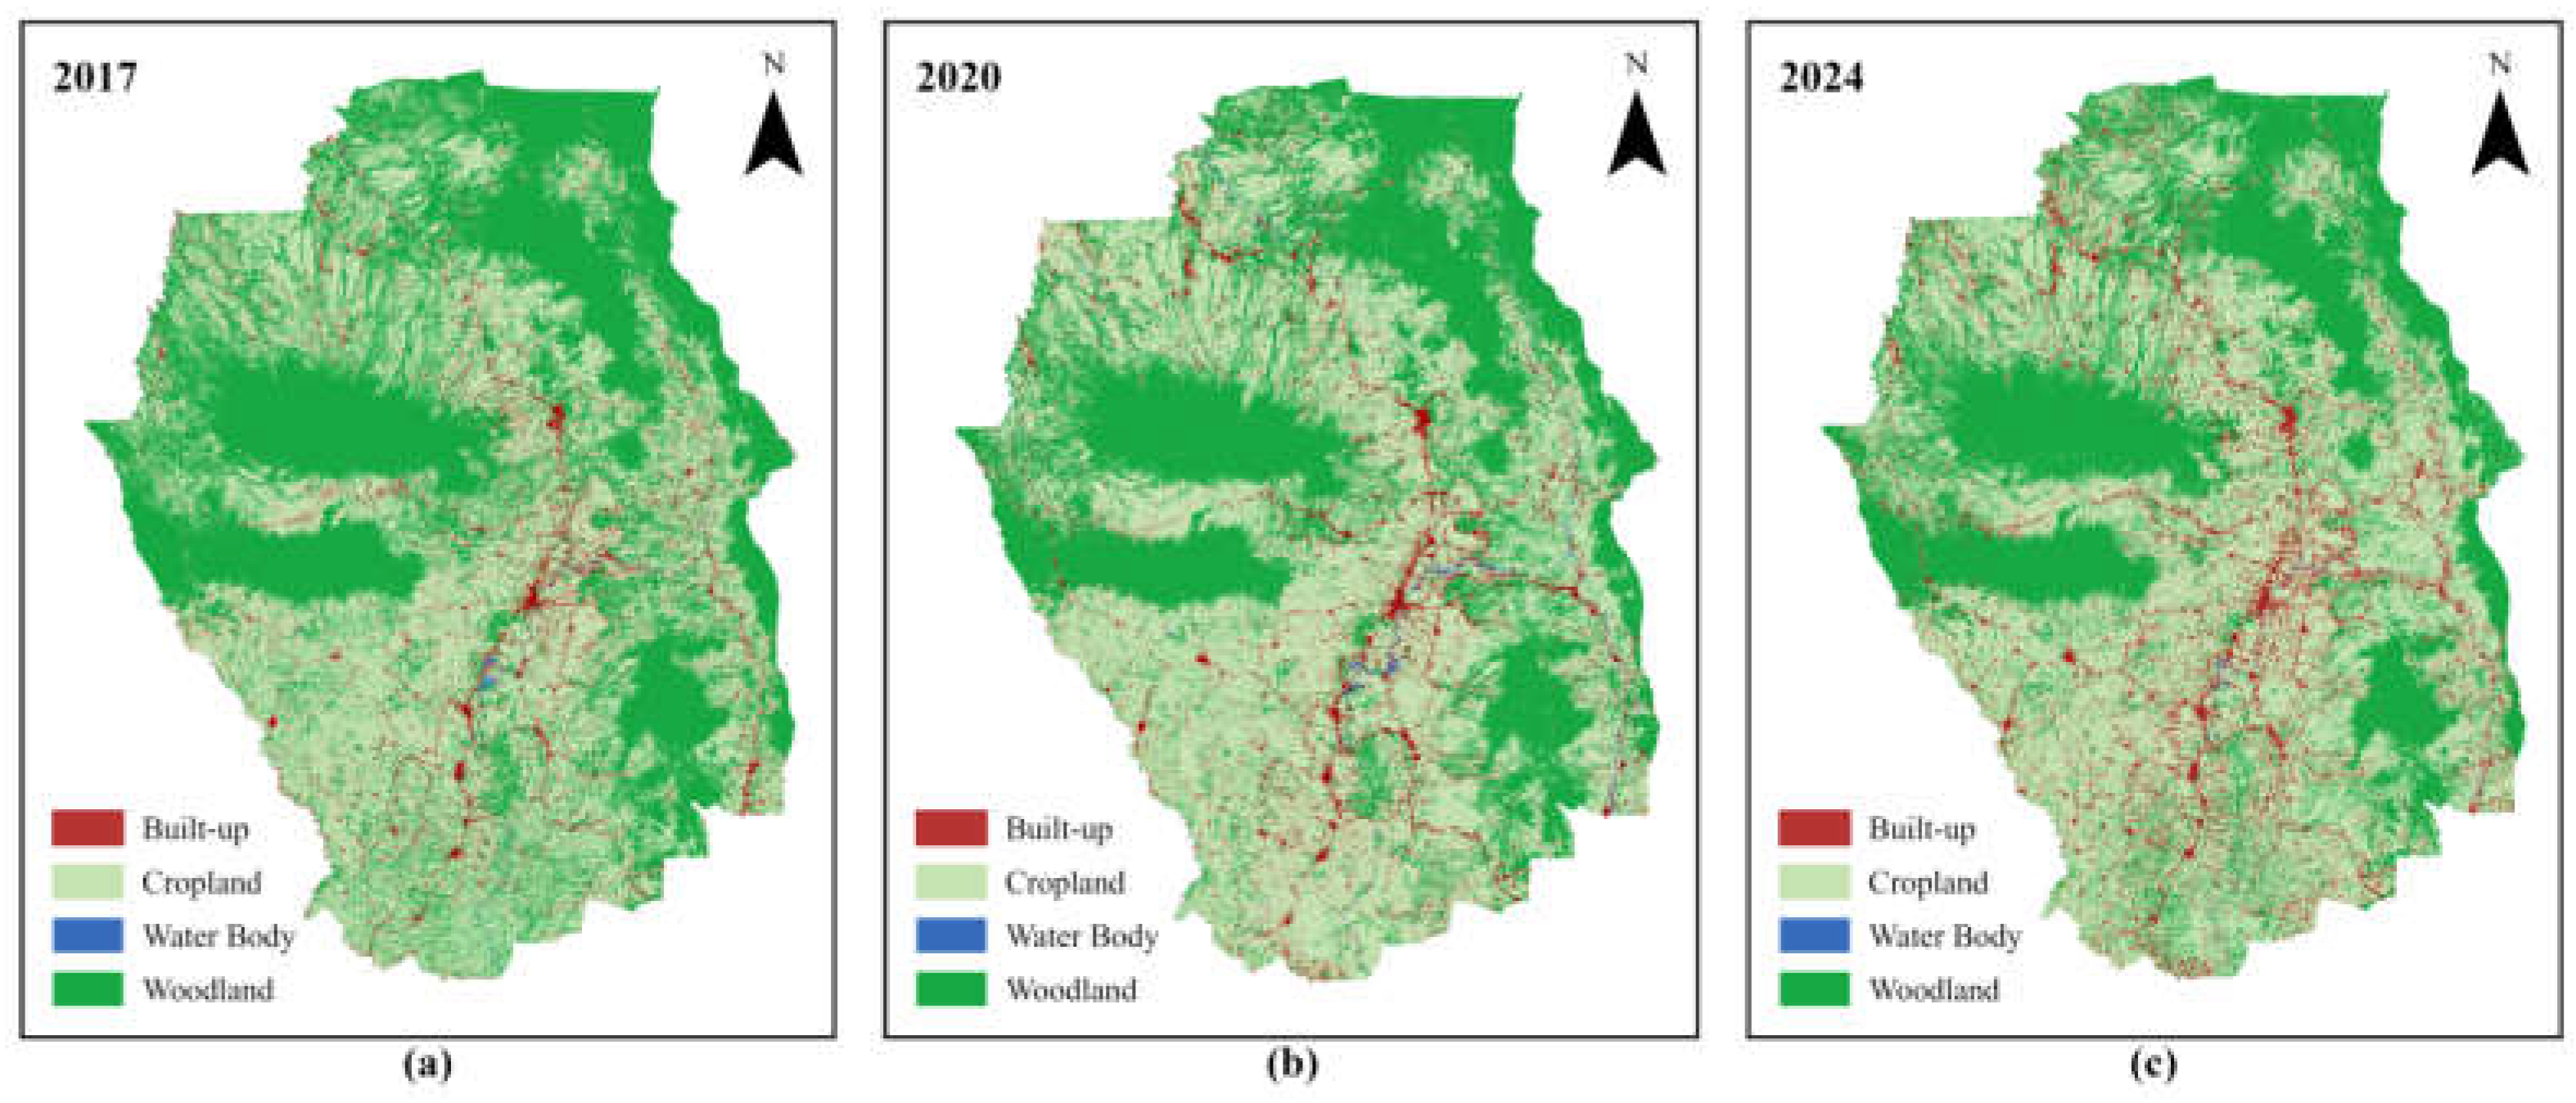
Figure 4.
Land Surface Temperature (LST) of the Province of Bukidnon for the year (a) 2017, (b) 2020, and (c) 2024.
Figure 4.
Land Surface Temperature (LST) of the Province of Bukidnon for the year (a) 2017, (b) 2020, and (c) 2024.
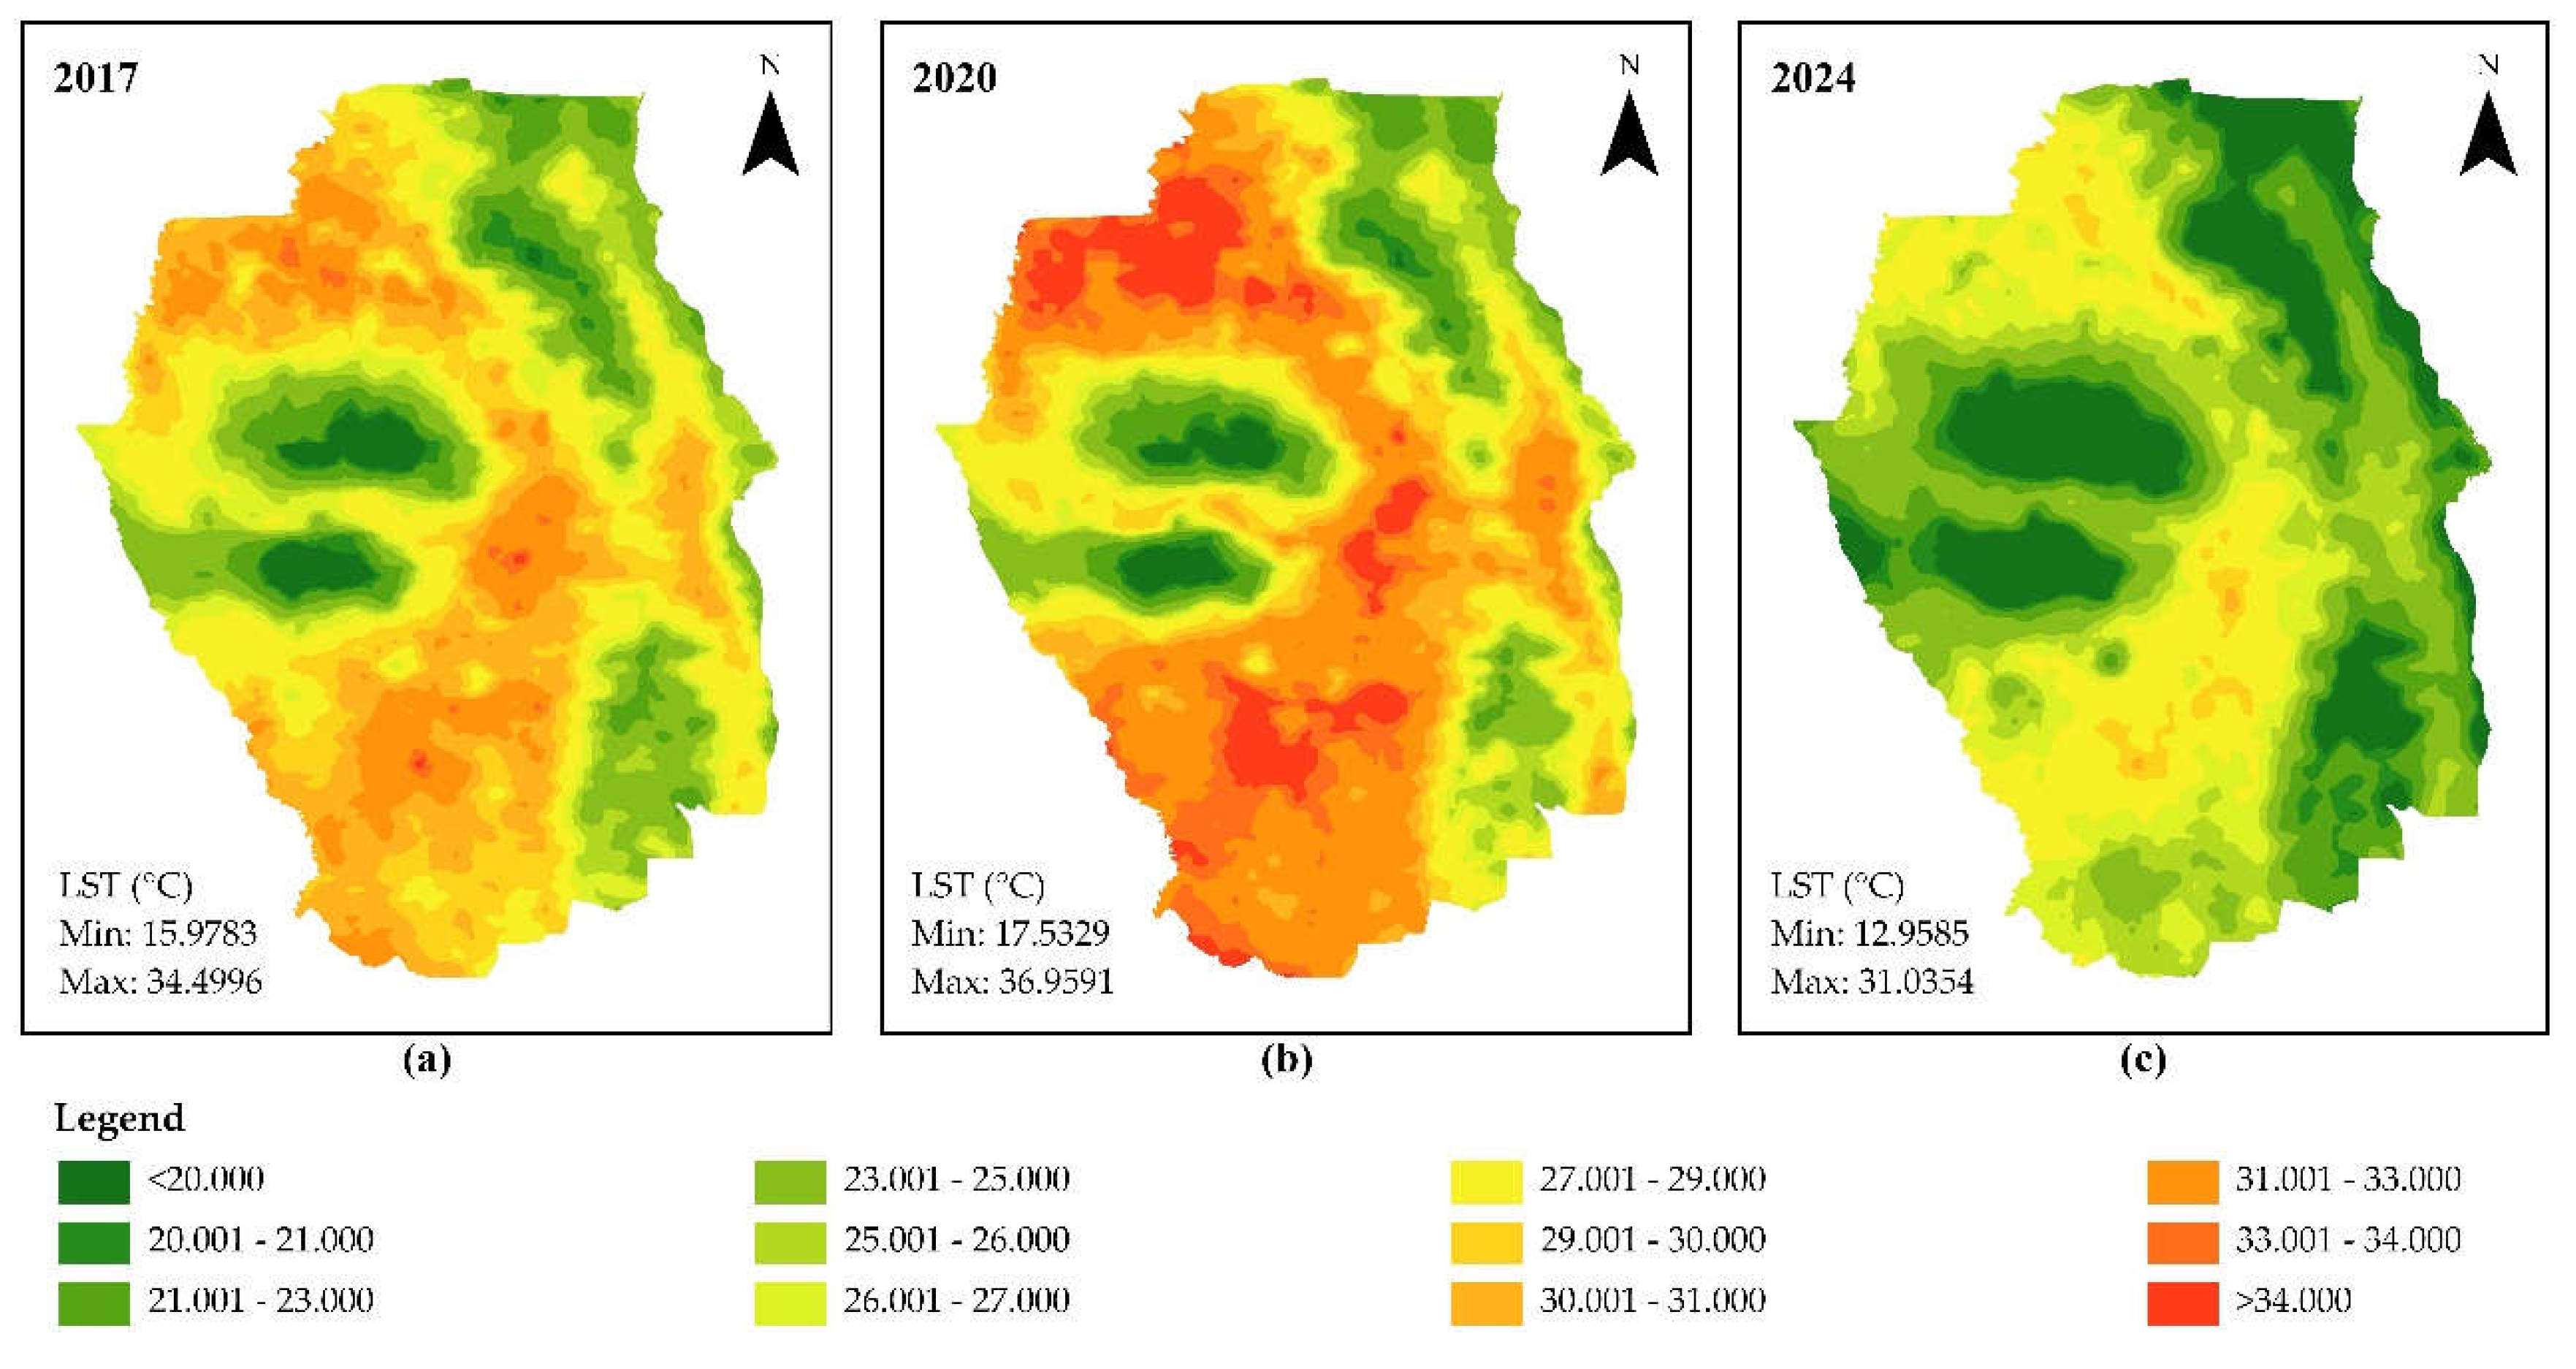
Figure 5.
Computed Urban Heat Island (UHI) Index of the Province of Bukidnon for the year (a) 2017, (b) 2020, and (c) 2024.
Figure 5.
Computed Urban Heat Island (UHI) Index of the Province of Bukidnon for the year (a) 2017, (b) 2020, and (c) 2024.
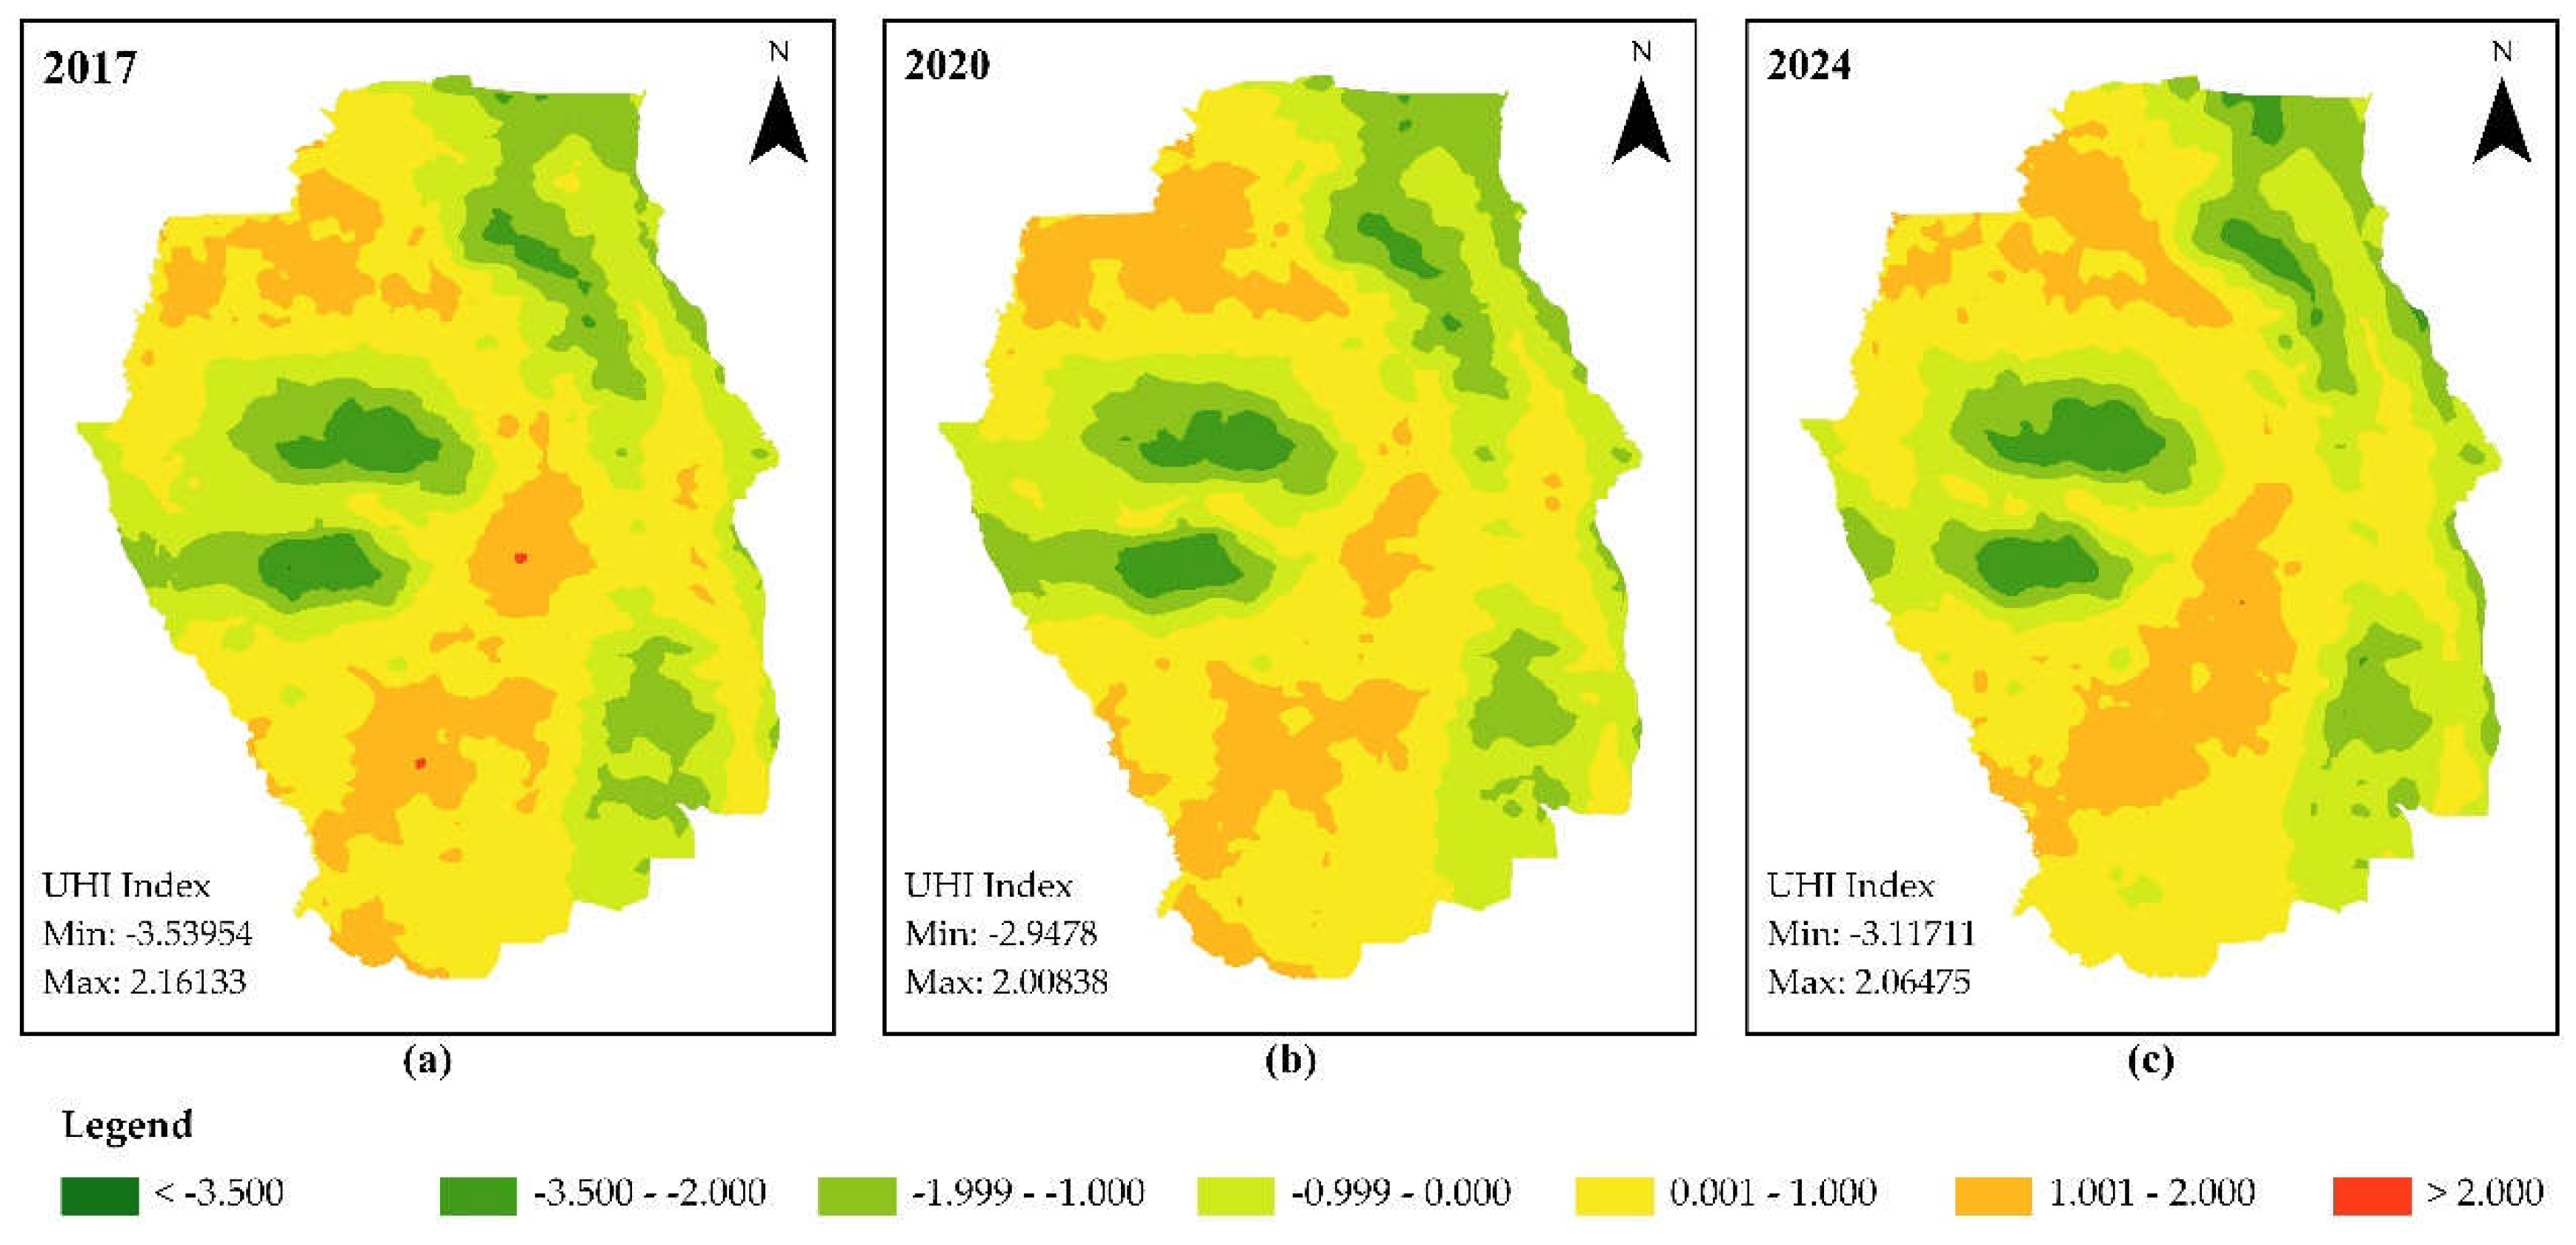
Figure 6.
Zonal distribution of Urban Thermal Field Variance (UTFVI) Index values across Barangays of the Province of Bukidnon for the year (a) 2017, (b) 2020, and (c) 2024.
Figure 6.
Zonal distribution of Urban Thermal Field Variance (UTFVI) Index values across Barangays of the Province of Bukidnon for the year (a) 2017, (b) 2020, and (c) 2024.
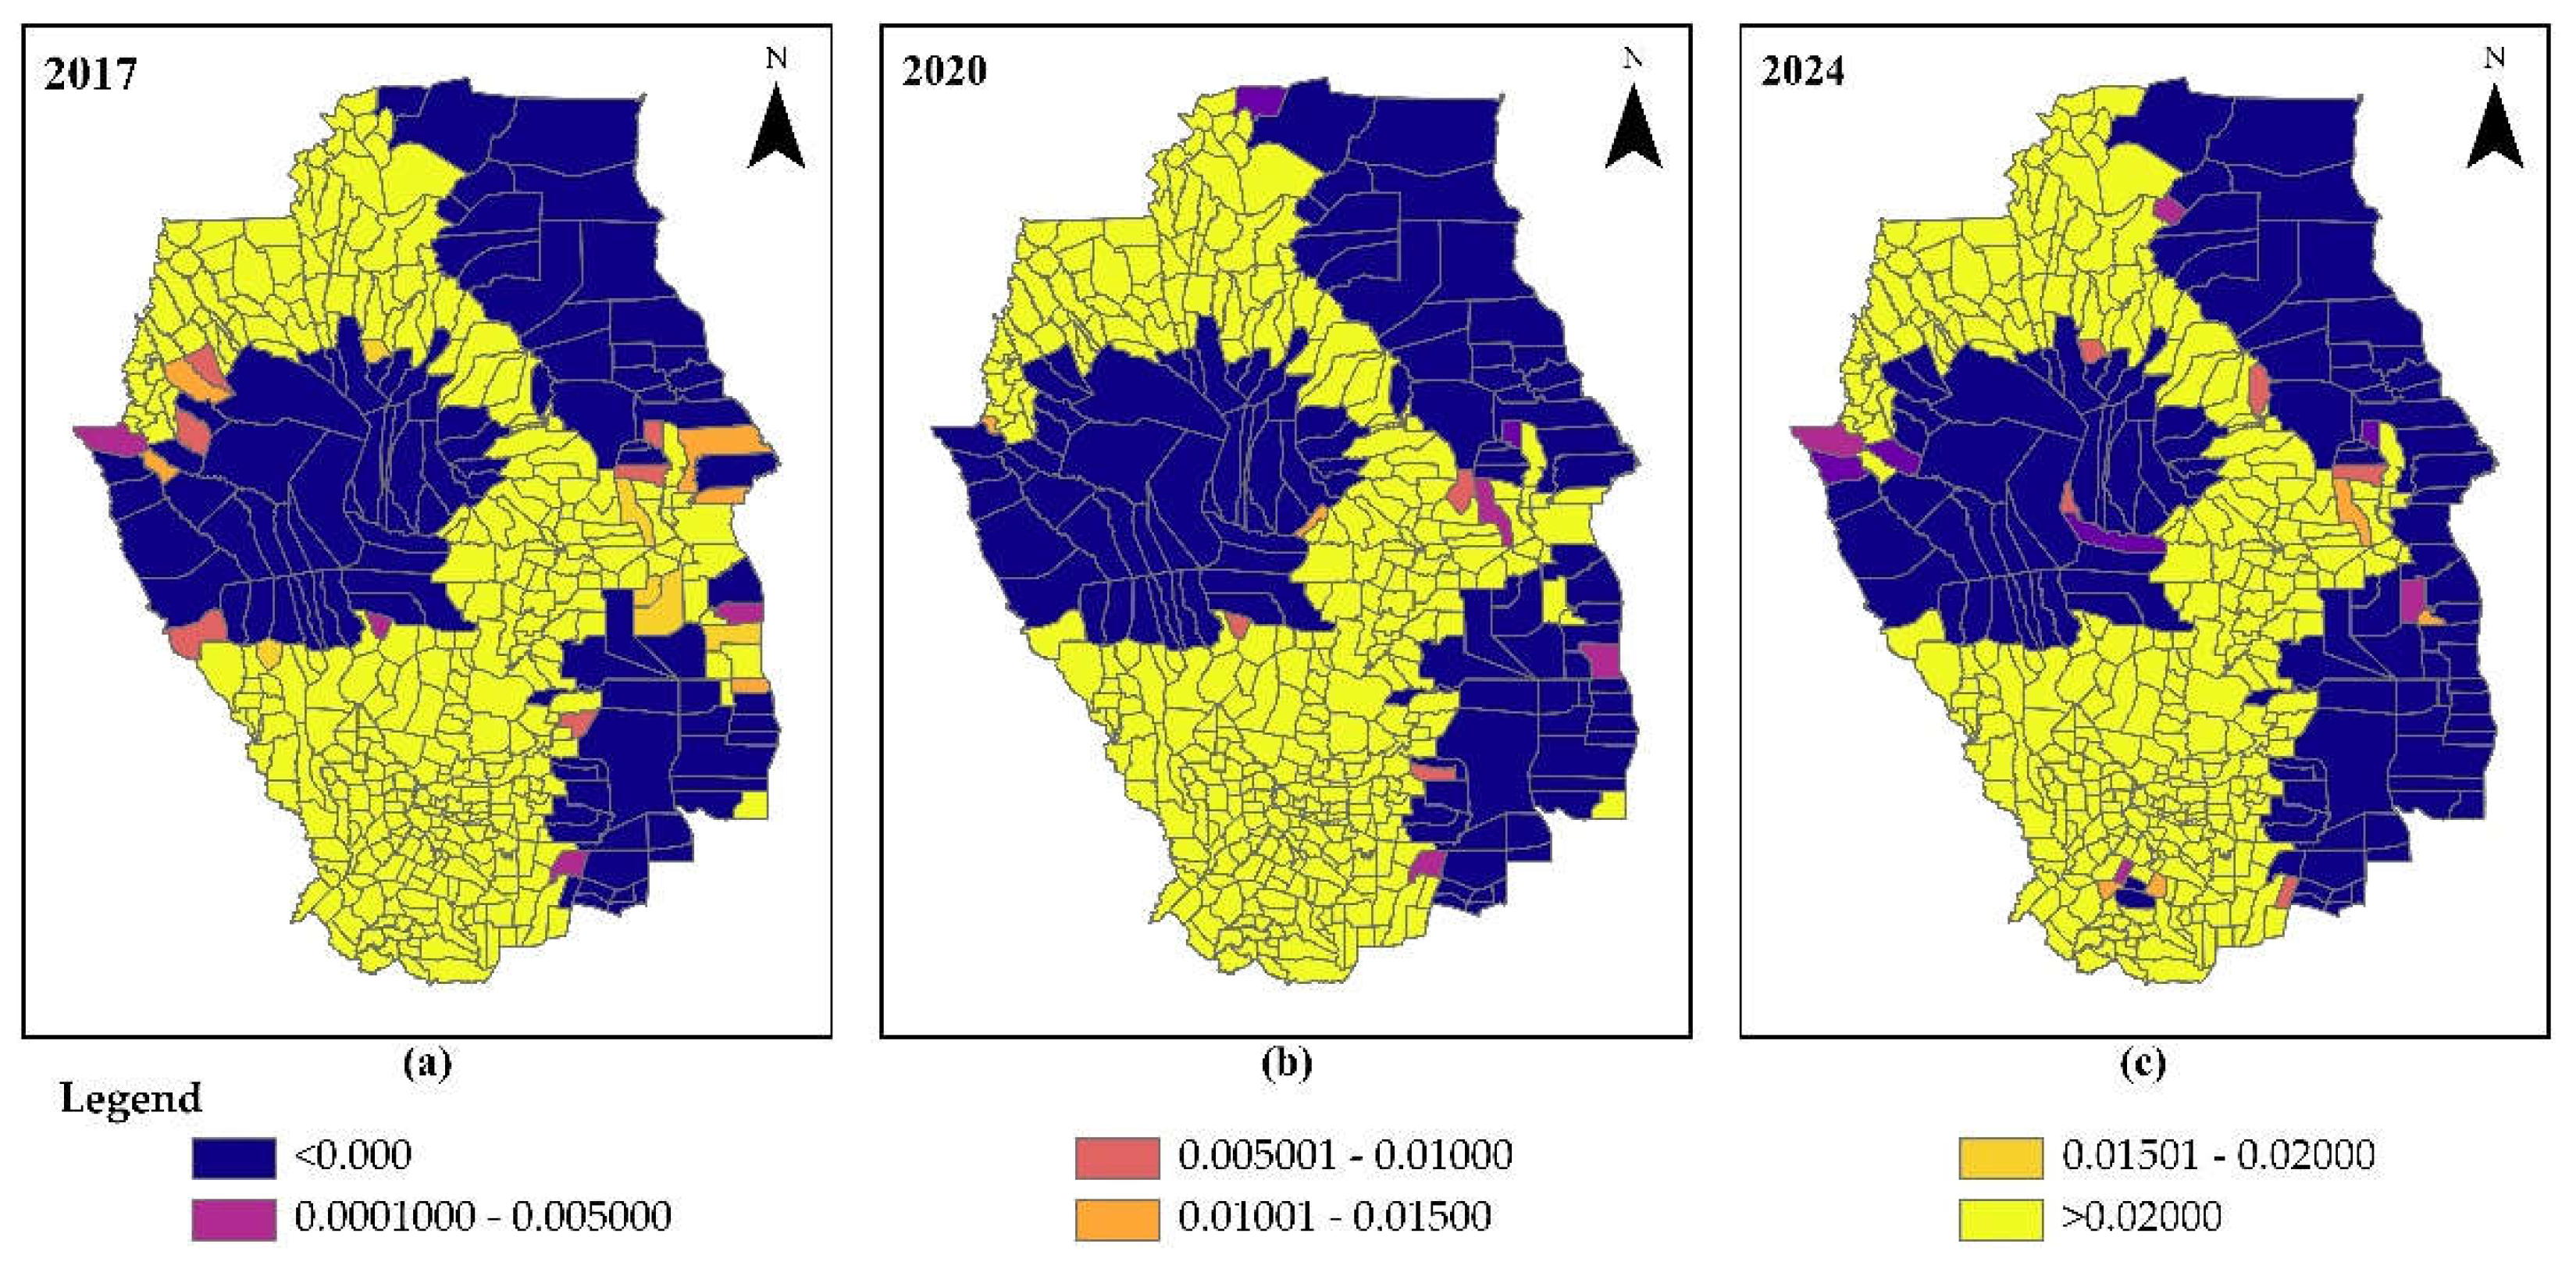

Table 1.
Urban Thermal Field Variance Threshold.
| Urban Thermal Field Variance Index Threshold | Urban Heat Island Phenomenon | Ecological Conditions Evaluation |
|---|---|---|
| < 0 | None | Excellent |
| 0.000 – 0.005 | Weak | Good |
| 0.005 – 0.010 | Middle | Normal |
| 0.010 – 0.015 | Strong | Bad |
| 0.015 – 0.020 | Stronger | Worse |
| >0.020 | Strongest | Worst |
Table 2.
Land cover types.
| Classes | Description |
|---|---|
| Cropland | Lands used for agriculture, horticulture, and gardens, including paddy fields and irrigated and dry farmland and vegetation. Lands covered with wetland plants and water. |
| Woodland | Lands covered with trees, including deciduous and coniferous woodlands and sparse woodland. |
| Water Body | Water bodies in the land area, including rivers, lakes, reservoirs, and fish ponds. |
| Built-up Land | Lands modified by human activities, including all kinds of habitation, industrial and mining areas, transportation facilities, and interior urban green zones and water bodies. |
Table 3.
Kappa Index Threshold (Landis and Koch, 1977).
| Kappa Index | Description/Agreement |
|---|---|
| <0.00 | Poor |
| – 0.20 | Slight |
| 0.21 – 0.40 | Fair |
| 0.41 – 0.60 | Moderate |
| 0.61 – 0.80 | Substantial |
| 0.81 – 1.00 | Almost Perfect |
Table 4.
Accuracy assessment using confusion matrix for land cover classification (2017, 2020, and 2024).
Table 4.
Accuracy assessment using confusion matrix for land cover classification (2017, 2020, and 2024).
| 2017 | 2020 | 2024 | ||
|---|---|---|---|---|
| User’s Accuracy | Cropland | 0.810084 | 0.858716 | 0.815466 |
| Built-up | 0.769231 | 0.619048 | 0.720000 | |
| Woodand | 0.840426 | 0.777518 | 0.823383 | |
| Water Body | 1.000000 | 0.700000 | 0.714286 | |
| Producer’s Accuracy | 0.821535 | 0.817547 | 0.815553 | |
| Kappa | 0.654973 | 0.648250 | 0.647020 |
Table 5.
Land cover classifications and changes from 2017 to 2024 in hectares.
| Land cover class | 2017 | 2020 | 2024 |
|---|---|---|---|
| Built-up Land | 21,256 | 26,321 | 32,099 |
| Woodland | 392,463 | 381,339 | 367,737 |
| Cropland | 513,212 | 521,200 | 532,008 |
| Waterbody | 3,111 | 5,315 | 3,586 |
Table 6.
Correlation Matrix for Year 2017.
| LST Average | Elevation | Population | Built-Up | Cropland | Water Body | |
|---|---|---|---|---|---|---|
| Elevation | -0.817 | |||||
| Population | 0.165 | -0.008 | ||||
| Built-Up | 0.283 | -0.078 | 0.120 | |||
| Cropland | 0.521 | -0.454 | -0.006 | -0.288 | ||
| Water Body | 0.233 | -0.322 | 0.119 | 0.014 | 0.136 | |
| Woodland | -0.683 | 0.514 | -0.063 | -0.232 | -0.864 | -0.198 |
Table 7.
Correlation Matrix for Year 2020.
| LST Average | Elevation | Population | Built-up | Cropland | Water Body | |
|---|---|---|---|---|---|---|
| Elevation | -0.775 | |||||
| Population | 0.152 | 0.018 | ||||
| Built-up | 0.197 | -0.101 | 0.109 | |||
| Cropland | 0.667 | -0.498 | 0.060 | -0.320 | ||
| Water Body | 0.109 | -0.217 | 0.035 | 0.141 | -0.012 | |
| Woodland | -0.794 | 0.582 | -0.117 | -0.163 | -0.880 | -0.134 |
Table 8.
Correlation Matrix for Year 2024.
| LST Average | Elevation | Population | Built-up | Cropland | Waterbody | |
|---|---|---|---|---|---|---|
| Elevation | -0.761 | |||||
| Population | 0.190 | -0.009 | ||||
| Built-up | 0.243 | -0.083 | 0.165 | |||
| Cropland | 0.551 | -0.433 | 0.049 | -0.286 | ||
| Waterbody | 0.167 | -0.223 | 0.113 | 0.167 | -0.018 | |
| Woodland | -0.697 | 0.486 | -0.156 | -0.346 | -0.798 | -0.140 |
Disclaimer/Publisher’s Note: The statements, opinions and data contained in all publications are solely those of the individual author(s) and contributor(s) and not of MDPI and/or the editor(s). MDPI and/or the editor(s) disclaim responsibility for any injury to people or property resulting from any ideas, methods, instructions or products referred to in the content. |
© 2025 by the authors. Licensee MDPI, Basel, Switzerland. This article is an open access article distributed under the terms and conditions of the Creative Commons Attribution (CC BY) license (http://creativecommons.org/licenses/by/4.0/).
Copyright: This open access article is published under a Creative Commons CC BY 4.0 license, which permit the free download, distribution, and reuse, provided that the author and preprint are cited in any reuse.


