
Submitted:
24 September 2024
Posted:
24 September 2024
You are already at the latest version
Abstract
This paper presents the validation of a numerical method for quantifying the physical quality parameters of apples through a comparative analysis with a traditional measurement method. The numerical method was applied to determine the parameters of batches of Kazakh apples according to standard requirements, using image analysis of apples. Five common varieties of Kazakh apples were selected: Aport Alexander, Ainur, Sinap Almatynski, Nursat and Kazakhski Yubileinyi. The geometric parameters of the apples and the percentage of red in the images were determined. The parameters of the 5 apple varieties were processed and measured both manually and digitally, revealing a close agreement between the obtained values. The developed digital method achieved high accuracy in determining the (diameters (d) and (D) in two perpendicular planes and height (h) of each apple), with maximum relative errors of 2.99% for (d), 3.03%, and 4.12% for the (h), and (D) parameters, respectively. Regression models were developed to determine and predict the mass and volume of apples via the digital method. The best results for the apple weight prediction were obtained for Sinap Almatynski variety by stepwise linear regression, and for the apple volume prediction were obtained for Nursat variety by linear regression. Regression equations for mass, volume and geometric dimensions constitute the basis for the development of a small instrument for automatically sorting apples by commercial variety.
Keywords:
apple
; fruit
; variety
; apple physical parameters
; methodology
; digital method
1. Introduction
Apple production in Kazakhstan is primarily concentrated in the southern region. The apple production industry in Kazakhstan includes 34 large companies, 195 medium-sized companies, 1370 small companies and several personal subsidiary farms, with a total area of 35.1 thousand hectares. In 2021, apple consumption in Kazakhstan totaled 374 thousand tons, of which only 230 thousand tons were grown by domestic producers. If we consider the processing of juices, purees and other products, then the demand for apple production is even greater. According to calculations, to fully meet the needs of the Republic of Kazakhstan’s population, approximately 1.3 million tons of apples need to be produced annually. This amount would be sufficient to provide each citizen with one apple a day, which is considered the best solution for improving population health. With the existing technologies for growing, harvesting, and transporting apples from gardens, the percentage of damaged and small fruits is quite high. Therefore, to effectively use refrigerated containers, it is necessary to separate substandard fruits before storage. After removal from storage, the products must be prepared for sale by sorting them in accordance with market requirements. An important step in postharvest and presale processing of apples is to determine whether the quality indicators meet the standard requirements. In accordance with the standard adopted by the Interstate Council for Standardization, Metrology and Certification (GOST 34314-2017), fresh apples are sold in the retail trade under technical conditions (effective 07/01/2018). Therefore, it is necessary to determine the weight, size and color of a selected sample of fruits to determine their commercial grade. This study focused on five varieties of Kazakh apples: Aport Alexander, Ainur, Sinap Almatynski, Nursat, and Kazakhski Yubileinyi. These apple varieties were selected on the basis of recommendations from pomological garden breeders. In this study, the relationship between apple quality indicators and informative quantitative features is examined, and algorithms, programs and digital tools for converting apple quality indicators into quantitative signs, as well as methods for implementing automated digital installation, are presented.
The purpose of this paper is to present a methodology based on a digital method for the quantitative determination of physical quality indicators of apples.
A promising direction for solving this problem is the digitalization of procedures for determining apple quality indicators via information technology progress.
2. Materials and Methods
2.1. Apple Samples and Fruit Measurement
Fresh apples are divided into three commercial grades on the basis of a set of quality indicators: the highest grade, the first grade, and the second grade. Apples are also classified into four groups on the basis of the color of all or part of the surface: Group A—red; B—heterogeneous red; C—pinkish or striped with red; E—no color requirements [1]. For example, the surface of highest grade apples (Group A) must be at least 3/4 red, and the surface of first-grade apples should be at least 1/2 red. The proportion of the color area is not normalized for second-grade apples. In addition to color, for each apple variety, there are requirements regarding skin defects, the degree of maturity, fruit condition, smell, taste, the presence or absence of a peduncle and numerous other indicators. The above indicators, as well as skin browning, pulp condition, presence of weed admixture, presence of agricultural pests, damage by agricultural pests, rotting, rotting with signs of wilting, overripening with pulp browning, and spoiling, are evaluated organoleptically. The organoleptic method has numerous significant disadvantages, including subjectivity, low accuracy and low productivity.
The weight or size of an apple is important for determining its commercial grade. In accordance with standard requirements, apples are calibrated on the basis of their largest transverse diameter or weight. The largest transverse diameter should be at least 60 mm. and the weight should be at least 90 g. Moreover, for apples calibrated by diameter, the difference in diameter in the same package should not exceed 5 mm for the highest, first and second grades. The weight ranges for commercial varieties are as follows: 70.0–90.0 g, 90.0–135.0 g, 135.0–200.0 g, and 200.0–300.0 g. The permissible weight deviations range from 15 to 50 g, depending on the weight category. To measure the mass and diameter, the following measuring instruments are used: a static weighing scale of average accuracy class, with a maximum weight limit of 25 kg and a calibration increment of 50 g; a scale of average accuracy class, with a minimum weight of 3 kg and a calibration increment is 2 g; a stainless steel tape measure of second-class accuracy, with a nominal length of 1 m and a measurement error of ±0.1 mm; a caliper of first-class accuracy, with a measurement error of 0.05 mm; a caliper of second-class accuracy, with a measurement error of 1 mm; a laboratory press; a juicer; a refractometer; and other auxiliary materials and measuring instruments. These instruments require manual operation. With the increase in apple production and shortage of skilled workers, improving the efficiency of apple quality assessment has become an urgent problem.
Objective quantitative methods for assessing the quality of vegetables and fruits have physical and chemical characteristics and can be categorized as follows: mechanical measurements of mass, size, volume, and density; physical measurements of thermal conductivity, acoustics, electrical conductivity, and permittivity; chemical measurements; electromagnetic measurements; and optical measurements of transmission and reflection coefficients in the visible and infrared regions. Optical measurement methods provide high measurement accuracy and meet the requirements for various crop quality evaluations [2,3]. Apples with surface defects can be classified relatively simply and safely via well-known sorting technologies [4,5]. Internal defects are "invisible", requiring new approaches and methods that provide information about the internal state of the fruits. In addition to internal defects caused by diseases and structural disorders, maturity, including the amounts of solids, proteins, vitamins and other components, is also evaluated. Known methods for determining internal qualities are based mainly on the optical permeability of products in different regions of the electromagnetic radiation spectrum.
In recent decades, technical vision systems (TVSs) have been widely used to determine the quantitative indicators of various objects. The advent of photoelectric transformation into object images, high spatial resolution, sufficient sensitivity, color video cameras and flexible digital image processing algorithms has facilitated the use of information about objects and their surrounding background. A classic example of such an approach for assessing the quality of fruits is the simultaneous measurement of fruit vegetable diameter, height, area, shape and color, followed by the calculation of quantitative parameters, defect classification and product category determination [6,7]. Kazakh National Agrarian Research University has some experience in developing TVS-based systems [8,9]. To obtain quantitative information about the size, shape, and color of apples, additional research is needed to substantiate informative quantitative signs that correspond to the verbal descriptions of various indicators.
The scientific novelty of this work lies in two aspects: the development of a digital method and computer program for assessing the quality indicators of apples and the results obtained from an experimental study involving apples from five varieties commonly found in the Republic of Kazakhstan.
On the basis of recommendations from pomological garden breeders, five apple varieties from the 2023 Kazakh harvest were chosen for research: Aport Alexander, Ainur, Sinap Almatynski, Nursat, and Kazakhski Yubileinyi. Fruit samples of these varieties were collected from the pomological garden at the Talgar regional branch of the Kazakh Research Institute of Fruit and Vegetable Growing in the second decade of September. Figure 1 shows a section of a pomological garden with apple trees of the Sinap Almatynski variety.
The fruits of the Sinap Almatynski variety are large and have an elongated-conical shape, with a dark red blurred blush covering the fruit. The flesh is white with a creamy tint, dense, juicy, sweet and sour and has a pleasant dessert taste. These fruits are transportable and can be stored for a long time (until May). The fruits of the Aport variety are large (280 g), attractive, and have a strong aroma. The flesh is white, grainy and juicy. These fruits ripen in September and are stored until February or March. The fruits of the Ainur variety are 170–200 g in size, round-conical, golden yellow with a slight blush, sweet and sour, and have a strong aroma. The flesh is creamy, juicy, dense and tender. These fruits ripen in mid-September and stored in a refrigerator until March. The fruits of the Nursat variety are large, with an average weight of 180 g and a maximum weight of 250 g. The main color is golden yellow. The flesh is greenish, has a medium density, and juicy. The taste is sweet and sour, with a moderate aroma. The fruits of the Kazakhski Yubileinyi variety are large and round-conical in shape with a strong waxy coating. They have a dark red, blurred, and striped blush with numerous large, bright subcutaneous spots. The flesh is white, medium density, juicy, crispy, fine-grained, aromatic, and has a good sweet and sour taste. For this study, 30 fruits of each variety were collected. The study was conducted in the research laboratory of the Department of Energy Saving and Automation of Kazakh National Agrarian Research University. The workstation for determining the apple parameters is shown in Figure 2.
The selected apple varieties include the main types of apple fruits on the basis of color, size (weight) and shape. The weight of each apple was determined on a DX1200 electronic scale with an accuracy of 0.01 g. The procedure for determining the weight of the fruit of the Aport Alexander variety is shown in Figure 3a.
An electronic caliper was used to measure the linear dimensions (diameters (D) and (d) in two perpendicular planes and height (h)) of each apple). The average time for measuring and recording these dimensions was 26 seconds. The measurement of the linear dimensions of an apple of the Ainur variety is shown in Figure 3b.
In addition to the standard parameters, the density of each fruit (ρ) was determined to identify the presence of possible defects and diseases. The density (ρ) was calculated as the ratio of the mass (m) to the volume (V) of the apple. The volume of the apple (V) was determined by measuring the volume of displaced water. The time for determining the density value was approximately 90 seconds. The procedure used for volume determination is shown in Figure 3c.
2.2. Algorithm for Assessing the Quality of Apple Fruits via a Digital Method
The digital method for estimating the apple quality indicators in this study is based on analyzing apple images captures in the visible range of optical radiation and determining the geometric determination of the fruit from these images. The data processing algorithm is developed and is shown in Figure 4.
First, an apple image must be captured via a digital camera or a similar device capable of capturing images. The image must be clear and well illuminated for more accurate analysis. In this study, a Varifocus camera, with a resolution of 1080 P, a focal length range of 5–50 mm, a complementary metal–oxide–semiconductor (CMOS) OV2710 sensor, and the ability to capture video in the MJPEG format at frame rates of 30 fps, 60 fps, and 120 fps, is used. The obtained images are in the RGB color space and have a resolution of 960 × 1280 pixels. Images of the variety Sinap Almatynski are shown in Figure 5.
Before an image is analyzed, preprocessing must be carried out. Preprocessing includes converting each image to the hue, saturation, value (HSV) color space for more accurate color analysis, as well as applying filters to reduce noise and improve contrast. To implement the digital method, an experimental setup and a computer program in Python have been developed [10,11]. The experimental software test results are shown in Figure 6.
The image captured by the camera is preprocessed via specialized algorithms and computer vision programs. Preprocessing includes outlining, segmenting the object, and analyzing the color information. Characteristics such as apple size, area, percentage of red, and shape are determined via the standard function in Python for image object analysis. By using the OpenCV library in the Python programming language, the main features of an apple, such as contour, shape and color, are identified. Edge extraction is performed via the Canny algorithm. After the apple contour features are extracted, the shape of the apple is analyzed via geometric analysis methods, such as finding the contour length, area, and aspect ratio. This process allows the size and shape of the apple to be determined. The duration of parameter evaluation for one apple is eight seconds.
Feature selection is based on the following algorithms: minimum redundancy maximum relevance (mRMR), F test and ReliefF. MATLAB software is used for feature ranking [12]. The mRMR algorithm sequentially ranks the features by minimizing redundancy and maximizing relevance. The F test algorithm is based on the informativeness of each trait, which is analyzed separately via an F test. The traits are then ranked using the p values of the F test statistic. Each F test tests the hypothesis that the response values grouped by values of the predictor variable are drawn from populations with the same mean against the alternative hypothesis that the population means are not the same. The results correspond to –log(p). The ReliefF algorithm penalizes the feature points that give different values to neighbors of the same class, and rewards the feature points that give different values to neighbors of different classes. This algorithm estimates the significance of features on the basis of an estimate of the distance between two pairs of measurements. The results here also correspond to "–log(p)".
The prediction of the main apple quality parameters, i.e., weight and volume, is based on the following main models in the Regression Learner App in MATLAB: trees–fine, medium and coarse; regression–linear, interactions linear, robust linear and stepwise linear; SVM–linear, quadratic, cubic, fine Gaussian, medium Gaussian and coarse Gaussian; ensemble–boosted trees and bagged trees; Gaussian process–Matern, exponential and rational; neural network–narrow, wide, bilayered and trilayered; and kernel–SVM and LSR.
3. Results
3.1. Determination of the Geometric Parameters of Fruits
The measured geometric parameters of the five apple varieties (D, d, h, m, V, and ρ) and the results obtained from the images (Dk, dk, hk, δr, and S) are shown in Table 1. The statistical values of the parameters, i.e., average, standard deviation, minimum and maximum, are also calculated and shown in Table 1.
The data in Table 1 indicate that there are no significant differences between the values of manually measured linear dimensions (D, d, and h) and the values determined from the images (Dk, dk, and hk), and they are nearly identical. The densities the "Sinap Almatynski" and "Nursat" apple varieties are slightly greater than those of other varieties. Through the digital method, together with the linear dimensions, the cross-sectional area of the fruit (S) and the percentage of redness (δr) are calculated. Apples from the "Aport Alexander", "Sinap Almatynski" and "Kazakhski Yubileinyi" varieties have a red color that corresponds to the appearance of the apples shown in Figure 2. Therefore, the obtained results confirm the possibility of quantifying the redness of fruits to determine their degree of conformity with a certain commercial grade.
To evaluate the accuracy of measuring the geometric parameters (D, d, and h) of apples via a digital method and analyzing their images, the absolute and relative errors are used. To assess how close the measured value is to the actual value of the corresponding parameter, the absolute error is calculated. The absolute error is the difference between the measured value and the actual value.
To compare the accuracy of both manual and digital measurements, the relative error, which is the ratio of the absolute error to the measured value of the parameter, is calculated.
where is the absolute error,
is the relative error,
is the measured value from the image analysis, and
is the manually measured value.
The calculated errors are shown in Table 2.
The results show that the absolute error is 0.45 on average for the three geometric parameters and that the maximum value is 1.7. The relative error for geometric parameter d is the smallest, averaging 0.79%, with a maximum error of 2.99%. For the geometric parameter h, the average value of the relative error is 0.80%, and the maximum error is 3.03%. For the geometric parameter D, the relative error is greater, with an average value of 1.08% and a maximum value of 4.12%.
The calculated relative errors are less than 5%, which is an appropriate value for agricultural measurements.
3.2. Determination of the Weight and Volume of Apples via Digital Methods
Twenty-six models are trained and tested to determine the weight and volume of the apples. The procedure includes the steps shown in Figure 7. Regression models have been developed to predict the data via supervised machine learning.
The training set includes 70% of data for each apple variety, and the remaining 30% of data is used for testing the models. The training and testing sets are compared, and the loss is estimated via cross-validation.
3.2.1. Apple Weight Prediction Results
The features of the images obtained through the analysis that are informative when building the models according to the three algorithms developed in MATLAB have been previously determined. The procedure for selecting informative characteristics to determine the mass for the Aport variety of apple is graphically presented. The results for the two applied algorithms are presented in Figure 8 and Figure 9.
For the remaining varieties, the results are summarized in Table 3.
The results show that feature combinations are more clearly separated when the F test is used. To reduce the time of calculation and training of the model, the first three most informative features are selected. For four of the varieties, these features are h, d, and S. D is informative only for the Ainur apple variety. The models are trained with the three most informative features ranked by the F test algorithm.
The predictions with the best trained model for the Aport apple variety are shown in Figure 10. The models are assessed via the root mean square error (RMSE) and training set. The application also provides information related to the accuracy of the models.
When a model is built, it is necessary to check how well it works. To evaluate the model quality, we can consider the values of various metrics, such as the coefficient of determination, mean absolute error (MAE), and mean squared error.
The MAE indicates how much, on average, the values determined by the model differ from the actual values. The advantage of the MAE is that the results obtained are in the same units as the target variable and are not as affected by the presence of extreme values in the sample.
where is the actual parameter value and
is the predicted parameter value.
The coefficient of determination (R2) indicates how well the values of the target variable are determined by the model when new data are introduced. R2 is a statistical metric that tells us what percentage of the variance of the target variable is predicted by the values of the independent variables.
where y is the mean value of the target variable.
Thus, it is an important measure of how well the regression model fits the data. The R2 value is always between zero and one, i.e., 0 ≤ R2 ≤ 1. An R2 value of 0.9 or above is very good, a value above 0.8 is good, and a value of 0.6 or above may be satisfactory in some applications.
The RMSE is the root mean square of the estimation error and is always positive. This metric is strongly affected by the presence of extreme values in the sample, as squaring further increases their weight.
Figure 11.
Predicted vs. actual plot for the weight training set.
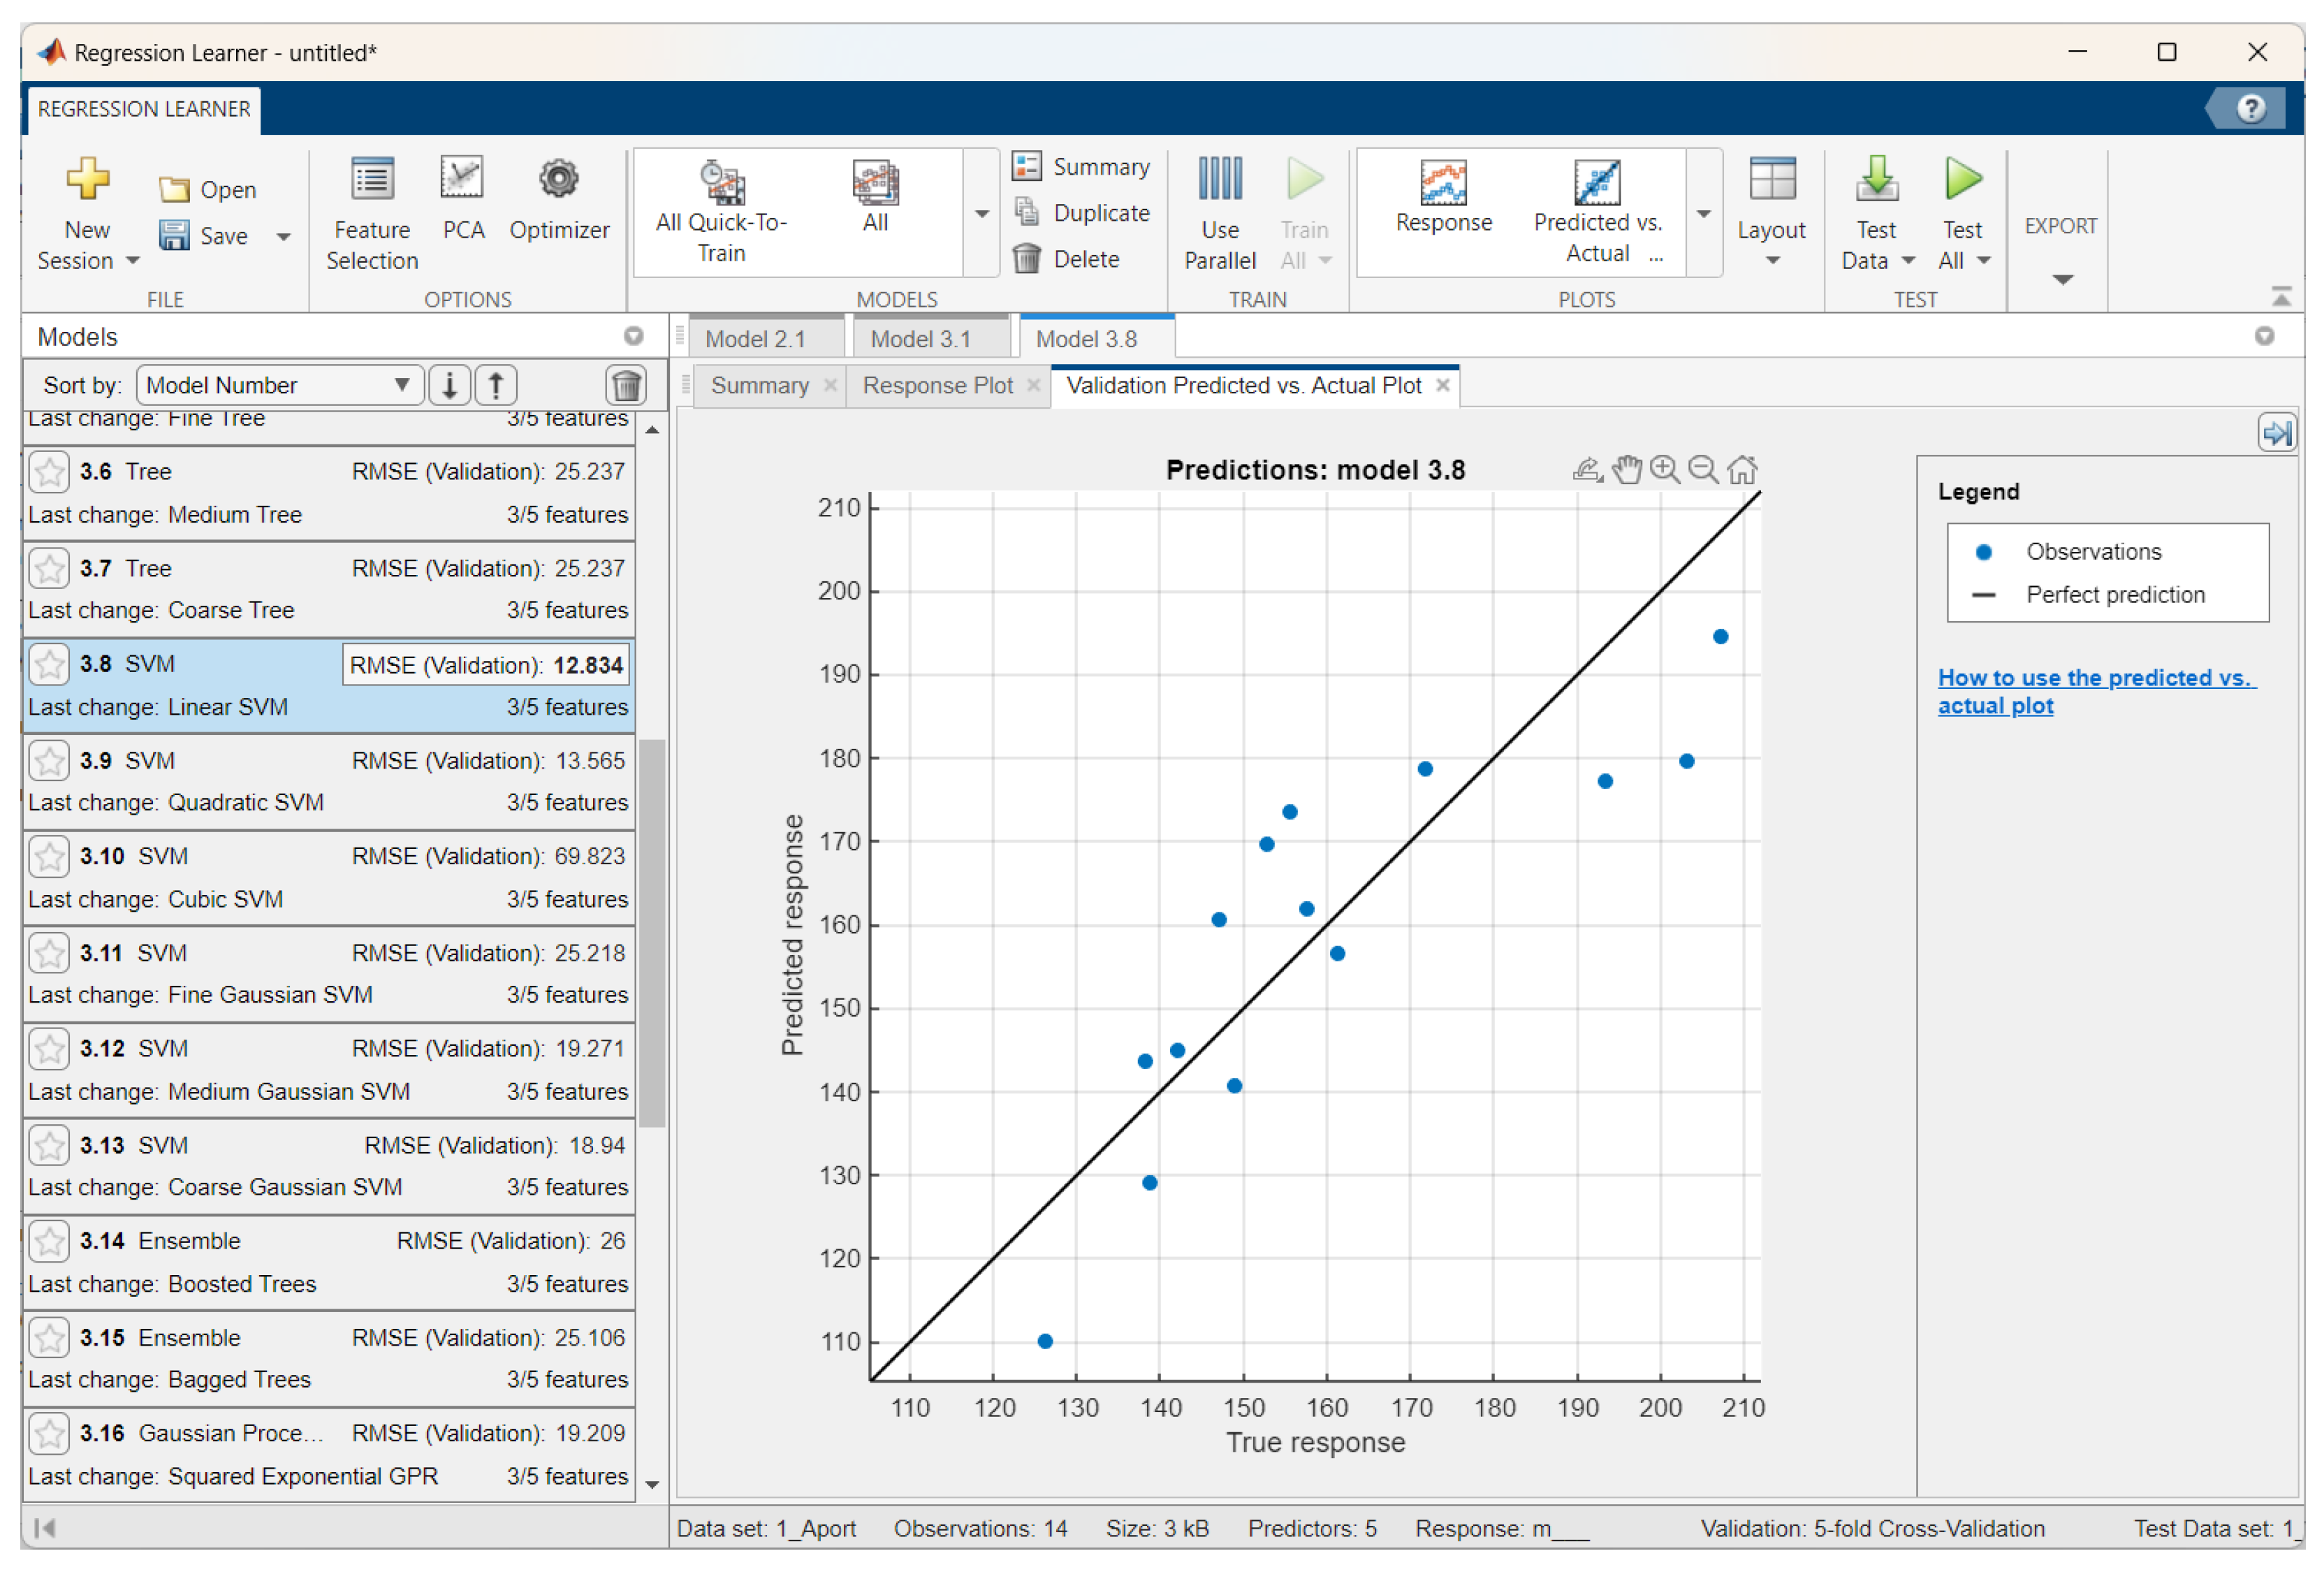
In an ideal regression model, the predicted responses would equal the true responses, resulting in all points lying on the diagonal line. The vertical distance from the line to each point is the prediction error. A good model has small errors, with predictions scattered close to the line.
The models are also evaluated via a residual plot, which is also used to evaluate the model performance (Figure 12). The residual plot shows the difference between the predicted and true responses. When the models are built, they are tested against the data specified for the test sample. The predicted and actual weight values are visualized in Figure 13.
The summarized data of the developed regression models and the evaluation of the best models in terms of the accuracy of predicting the weights of the apples with training and test samples are presented in Table 4.
The results show that different apple varieties require different models. The linear SVM is applicable only for two apple varieties—Aport and Ainur. The RMSE varies from 7.17 to 12.83 for the five apple varieties. According to the R2 values with the training set, the stepwise linear regression model is the best, followed by rational quadratic Gaussian process regression and linear regression. The linear SVM model is a satisfactory model. According to R2 values with the test set, stepwise linear regression is the best model for the Sinap Almatynski variety, and for the Ainur variety, the linear SVM yields better results than it does with the training sample. The MAEs for both the training and test samples do not exceed 12.29. The training time of the models ranges from 0.60 seconds to 4.27 seconds, with the stepwise linear regression model performing best in both training and testing at 1.88 seconds each.
The best results for the Sinap Almatynski apples via stepwise linear regression were as follows: RMSEs of 7.17 for training and 4.83 for testing, R2 values of 0.9–0.92 for training and 0.96 for testing, and MAEs of 6.12 for training and 4.14 for testing.
3.2.2. Apple Volume Prediction Results
In the developed models for apple volume prediction, informative parameters are again determined, and the three algorithms integrated into MATLAB are used. For the Aport variety, the results for the two applicable algorithms, i.e., the F test and ReliefF algorithms, are graphically presented in Figure 14 and Figure 15.
The summary information for the five apple varieties and the selection of informative characteristics are presented in Table 5. The results show that the mRMR algorithm is also applicable here. For three of the varieties, only the D parameter is informative. However, the F test algorithm is chosen for ranking the informative parameters.
The predictions with the best trained model for the Aport apple variety are shown in Figure 16. The predicted vs. actual plot for evaluating the performance of the model is shown in Figure 17, the residuals plot is shown in Figure 18, and the predicted and actual weight values for the testing set are shown in Figure 19.
The summarized data of the developed regression models and the evaluation of the best models in terms of the accuracy of predicting the volume of apples with training and test samples are presented in Table 6.
The results show that different apple varieties require different pattern types. The RMSEs range from 9.84 to 22.75 for training and 9.38 to 15.49 for testing for the five apple varieties. According to the R2 with the training data, the linear SVM and linear regression models are the best, followed by the quadratic SVM and robust linear regression. A satisfactory model is the quadratic exponential GPR. According to R2 with the test sample, linear regression is the best model for the Nursat variety, and for the Aport variety, linear regression yields better results than it does with the training data. The MAEs for both the training and test samples do not exceed 19.66. The training time of the models ranges from 0.41 seconds to 5.28 seconds, with the robust linear regression model performing best during both training and testing, with a time of 0.41 seconds.
The best results for the Nursat variety via linear regression were as follows: relatively small RMSEs of 9.84 for training and 9.65 for testing, R2 values of 0.9–0.91 for training and 0.92 for testing, and relatively small MAEs of 8.12 for training and 7.96 for testing.
5. Conclusions
- With the growth of apple production and the shortage of skilled workers in Kazakhstan, the development and implementation of digital technologies to improve the productivity of apple fruit quality assessment is an urgent issue.
- The literature analysis confirms that technical vision systems, which use color video cameras and flexible algorithms for digital image processing, contribute to the use of information about the object of study and the surrounding background and are widely used for determining the quantitative indicators of various objects to solve the problem of determining fruit quality.
- The developed digital method achieved high accuracy in determining the size d of the fruit, with maximum relative errors of 2.99%, 3.03%, and 4.12% for the e, h, and D parameters, respectively. This methods enables the quantification of the area and the percentage of color, which cannot always be detected with the naked eye, allowing for the automation and optimization of apple quality assessment.
- Experimental studies were conducted, and regression models were developed to determine and predict the mass and volume of apples via a digital method. The best results for the weight prediction of the Sinap Almatynski apples via stepwise linear regression were as follows: RMSEs of 7.17 for training and 4.83 for testing, R2 values of 0.9–0.92 for training and 0.96 for testing, and MAEs of 6.12 for training and 4.14 for testing. The best results for volume prediction of the Nursat variety via linear regression were as follows: relatively small RMSEs of 9.84 for training and 9.65 for testing, R2 values of 0.9–0.91 for training and 0.92 for testing, and relatively small MAEs of 8.12 for training and 7.96 for testing. The accuracy of the procedures could be improved by optimizing the models and increasing the number of datasets.
- The regression equations obtained from the relationship between mass, volume and geometric parameters, together with the numerical method for determining the color area, serve as the basis for the development of a compact instrument for the evaluation of quality indicators and the automatic sorting of apples by commercial variety.
Author Contributions
Conceptualization, Jakhfer Alikhanov; Data curation, Aidar Moldazhanov, Akmaral Kulmakhambetova and Zhandos Shynybay; Formal analysis, Tsvetelina Georgieva; Resources, Dimitriy Zinchenko and Alisher Nurtuleuov; Writing – review & editing, Plamen Daskalov.
Funding
The research was conducted within the framework the grant of the Ministry of Science and Higher Education of the Republic of Kazakhstan under the Project AP19678983 "Development of digital technology and a small-sized machine for quality control and automatic sorting of apples into commercial varieties" and by the European Union-NextGenerationEU through the National Recovery and Resilience Plan of the Republic of Bulgaria, project No. BG-RRP-2.013–0001-C01.
Data Availability Statement
The raw/processed data required to reproduce these findings cannot be shared at this time as the data also forms part of an ongoing study. Yet the data can be provided to readers when kindly asked.
Conflicts of Interest
The authors have no conflicts of interest to declare..
References
- Tekhnicheskie Usloviya Data Vvedeniya, GOST 34314-2017 Yabloki Svezhie, Realizuemye v Roznichnoj Torgovle, (2018).
- Y. Ozaki, W.F. McClure, A.A. Christy, Near-Infrared Spectroscopy in Food Science and Technology, (John Wiley & Sons, New Jersey, 2007).
- C.A. Roberts, J. Workman, J.B. Reeves, Near-Infrared Spectroscopy in Agriculture, (IM Publications, Boston, 2004).
- A.K. Bhatt, D. Pant, AI Soc. 2015, 30, 45. [CrossRef]
- M.M. Sofu, O. Er, M.C. Kayacan, B. Cetişli, Comput. Electron. Agric. 2016, 127, 395. [CrossRef]
- A.K. Pothula, Z. Zhang, R. Lu, Comput. Electron. Agric. 2023, 208, 107789. [CrossRef]
- P. Moallem, A. Serajoddin, H. Pourghassem, Inf. Process. Agric. 2017, 4, 33. [CrossRef]
- J. Alikhanov, S.M. Penchev, T.D. Georgieva, A. Moldazhanov, Z. Shynybay, P.I. Daskalov, J. Food Meas. Charact. 2018, 12, 87. [CrossRef]
- Nurtuleuov, A. Moldazhanov, A. Kulmahambetova, D. Zinchenko, Izdenister Natigeler 2021, 3, 125.
- L. Anjaneya, U. Mahanthesha, Int. J. Recent Sci. Res. 2023, 14, 4372. [CrossRef]
- V. Verdhan, Computer Vision Using Deep Learning: Neural Network Architectures with Python and Keras, (Apress, Berkeley, 2021).
- G. Roffo, arXiv 2016, arXiv:1607.01327.
Figure 1.
A section of a pomological garden with apple trees of the Sinap Almatynski variety.
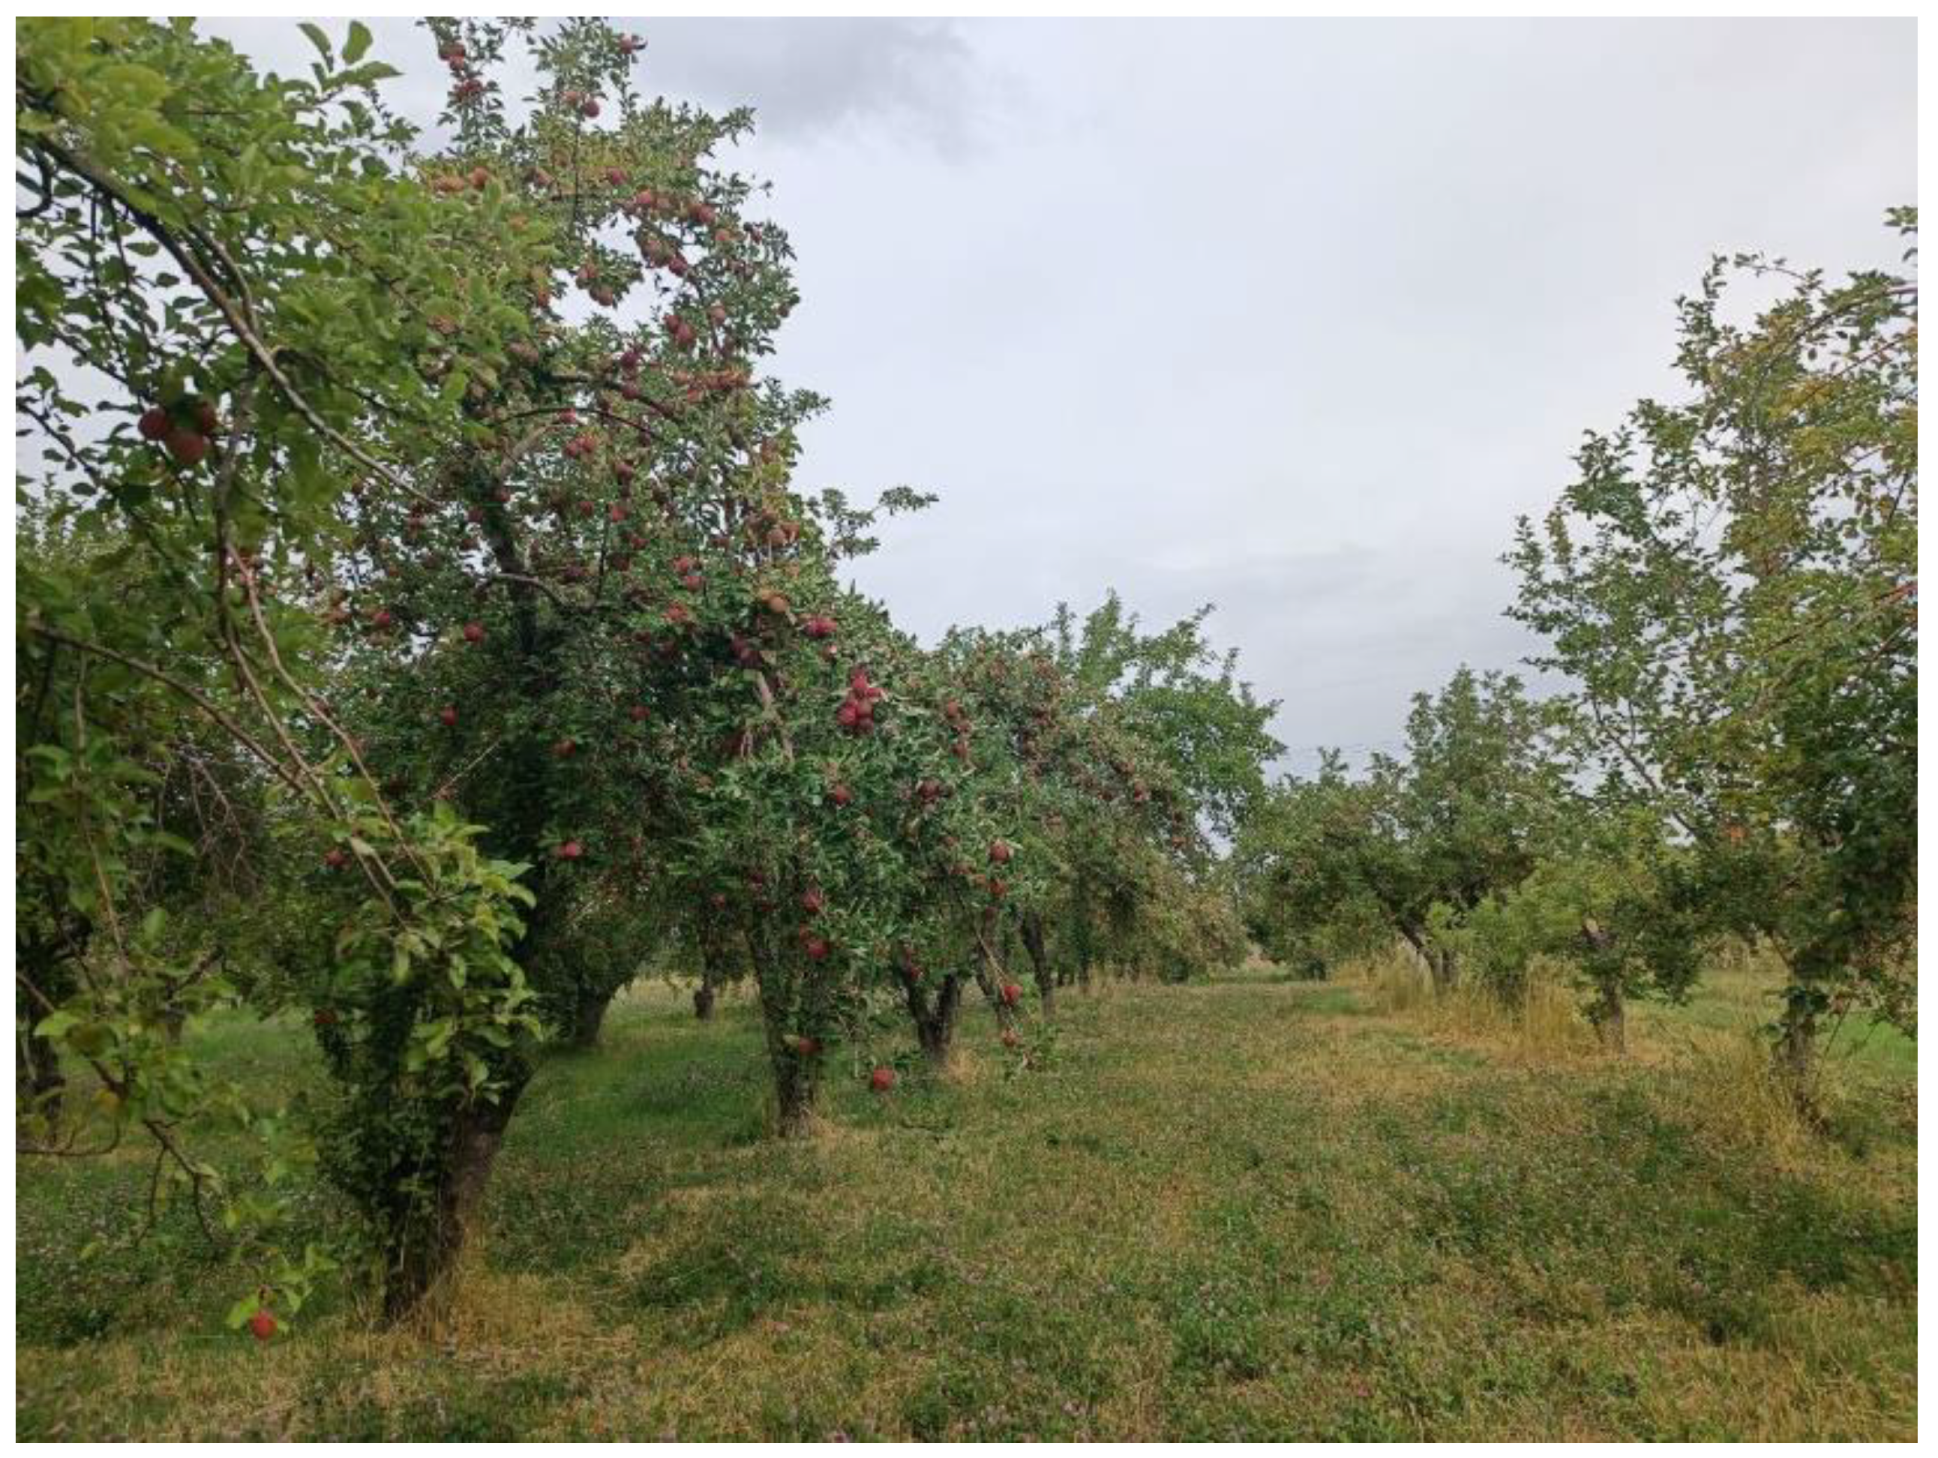
Figure 2.
Workstation for apple parameter determination - 1 – Studied apple varieties, 2 – filling table, 3 – caliper, 4 – electronic scales, 5 – dimensional flask.
Figure 2.
Workstation for apple parameter determination - 1 – Studied apple varieties, 2 – filling table, 3 – caliper, 4 – electronic scales, 5 – dimensional flask.
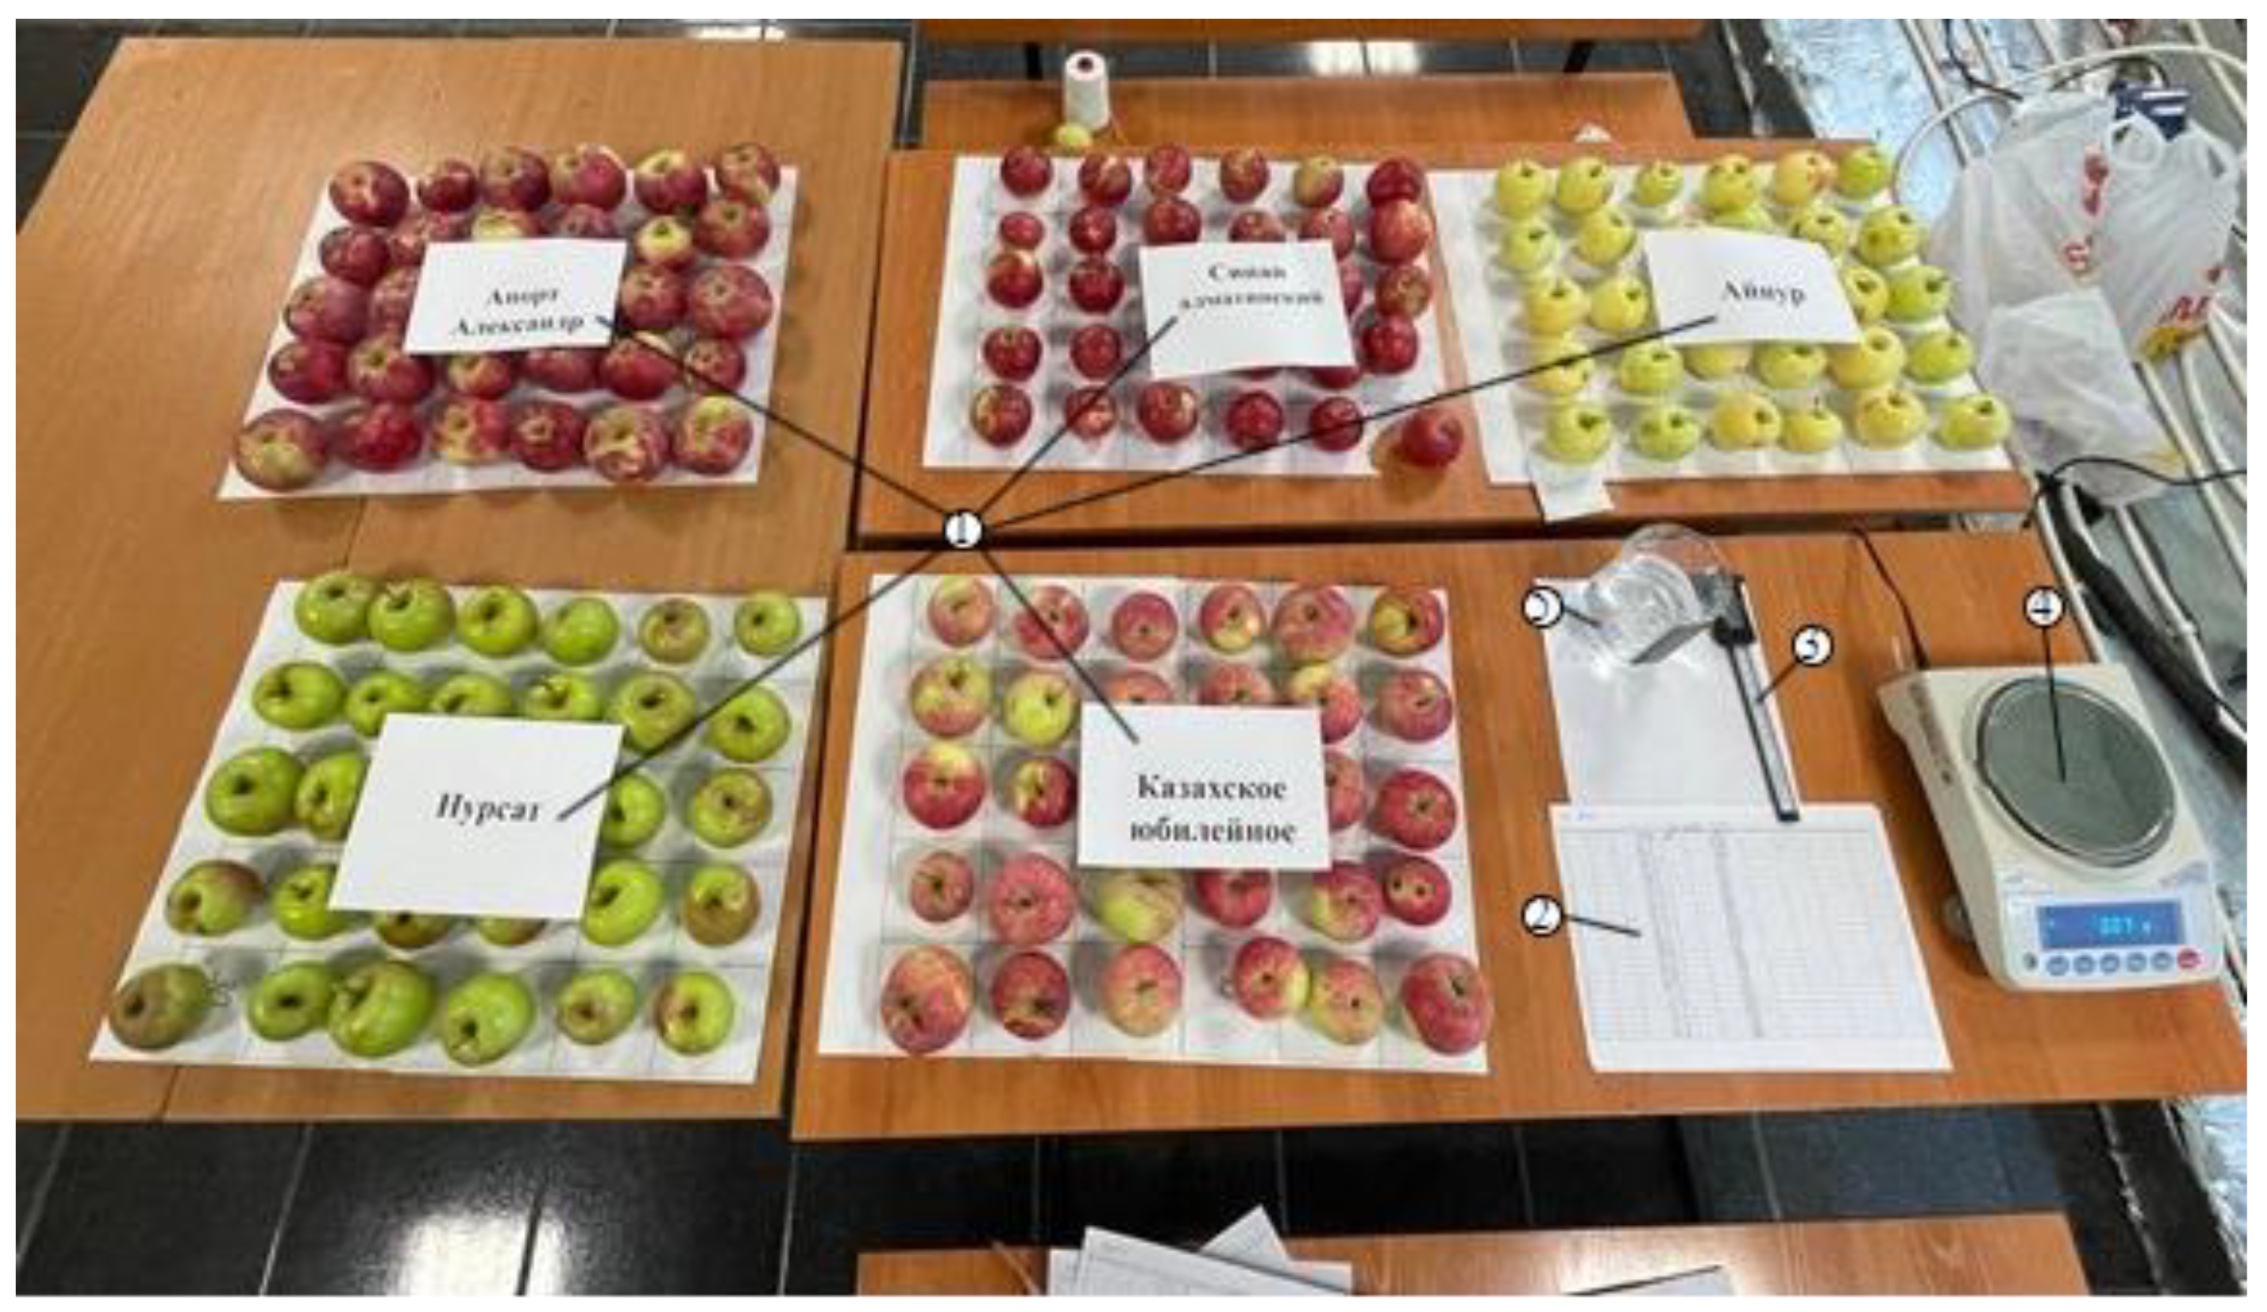
Figure 3.
a - Procedure for fruit mass determination, b – procedure for fruit linear dimensions, c – procedure for fruit volume determination.
Figure 3.
a - Procedure for fruit mass determination, b – procedure for fruit linear dimensions, c – procedure for fruit volume determination.
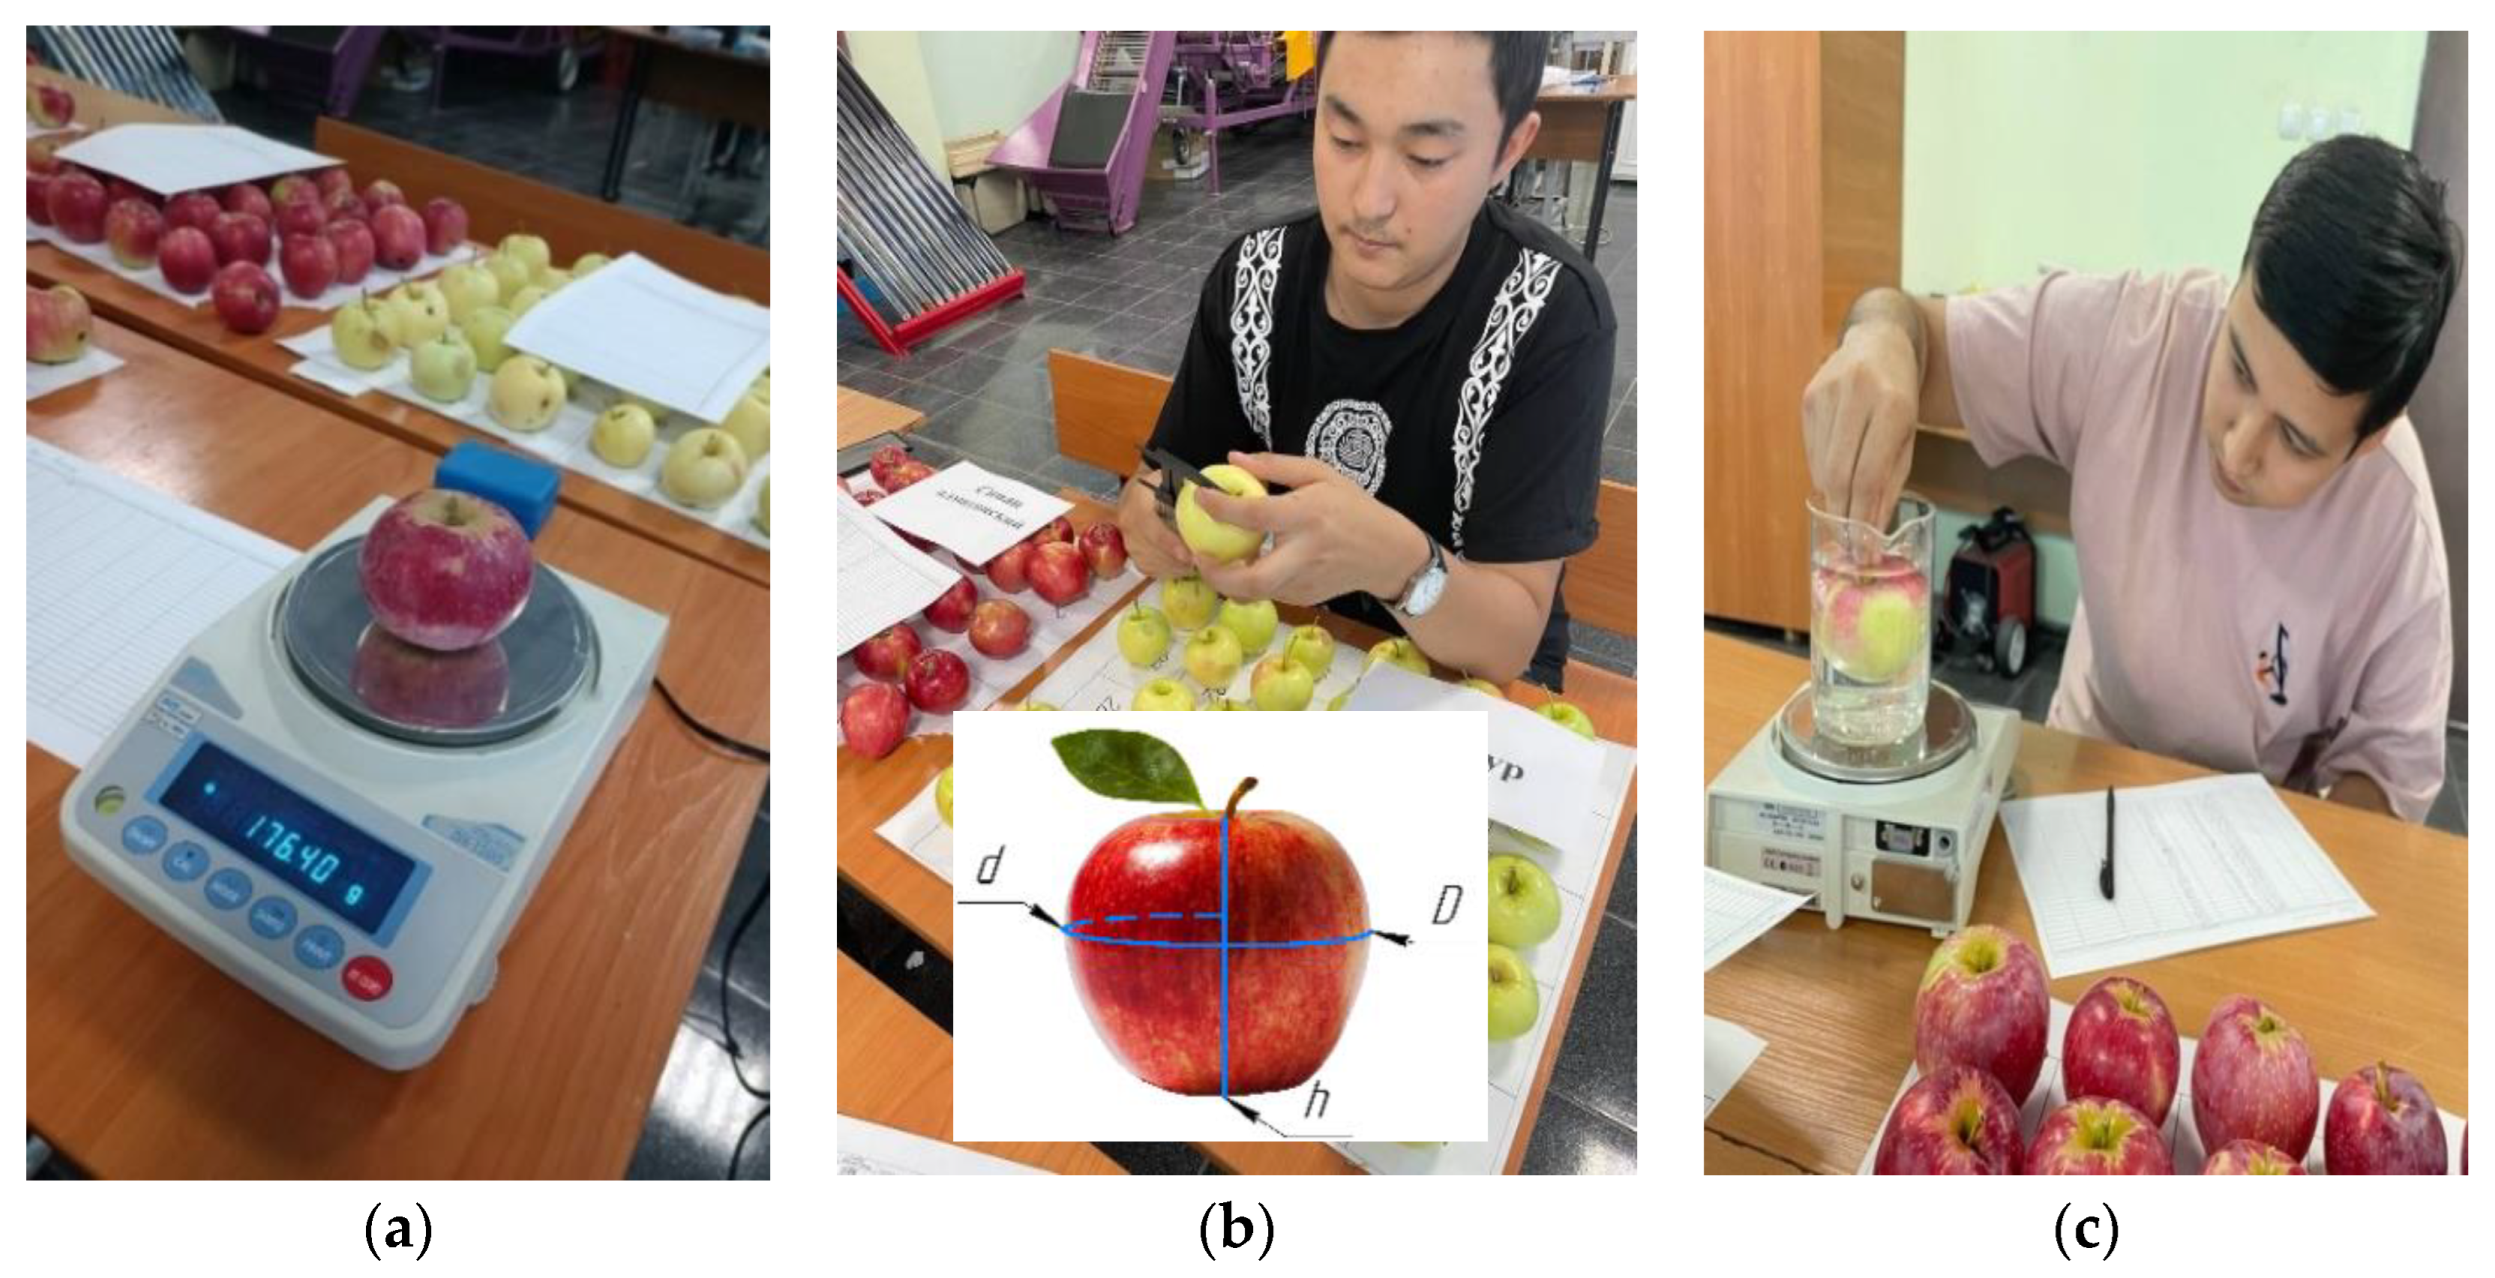
Figure 4.
Algorithm for assessing the quality of apples via a digital method.
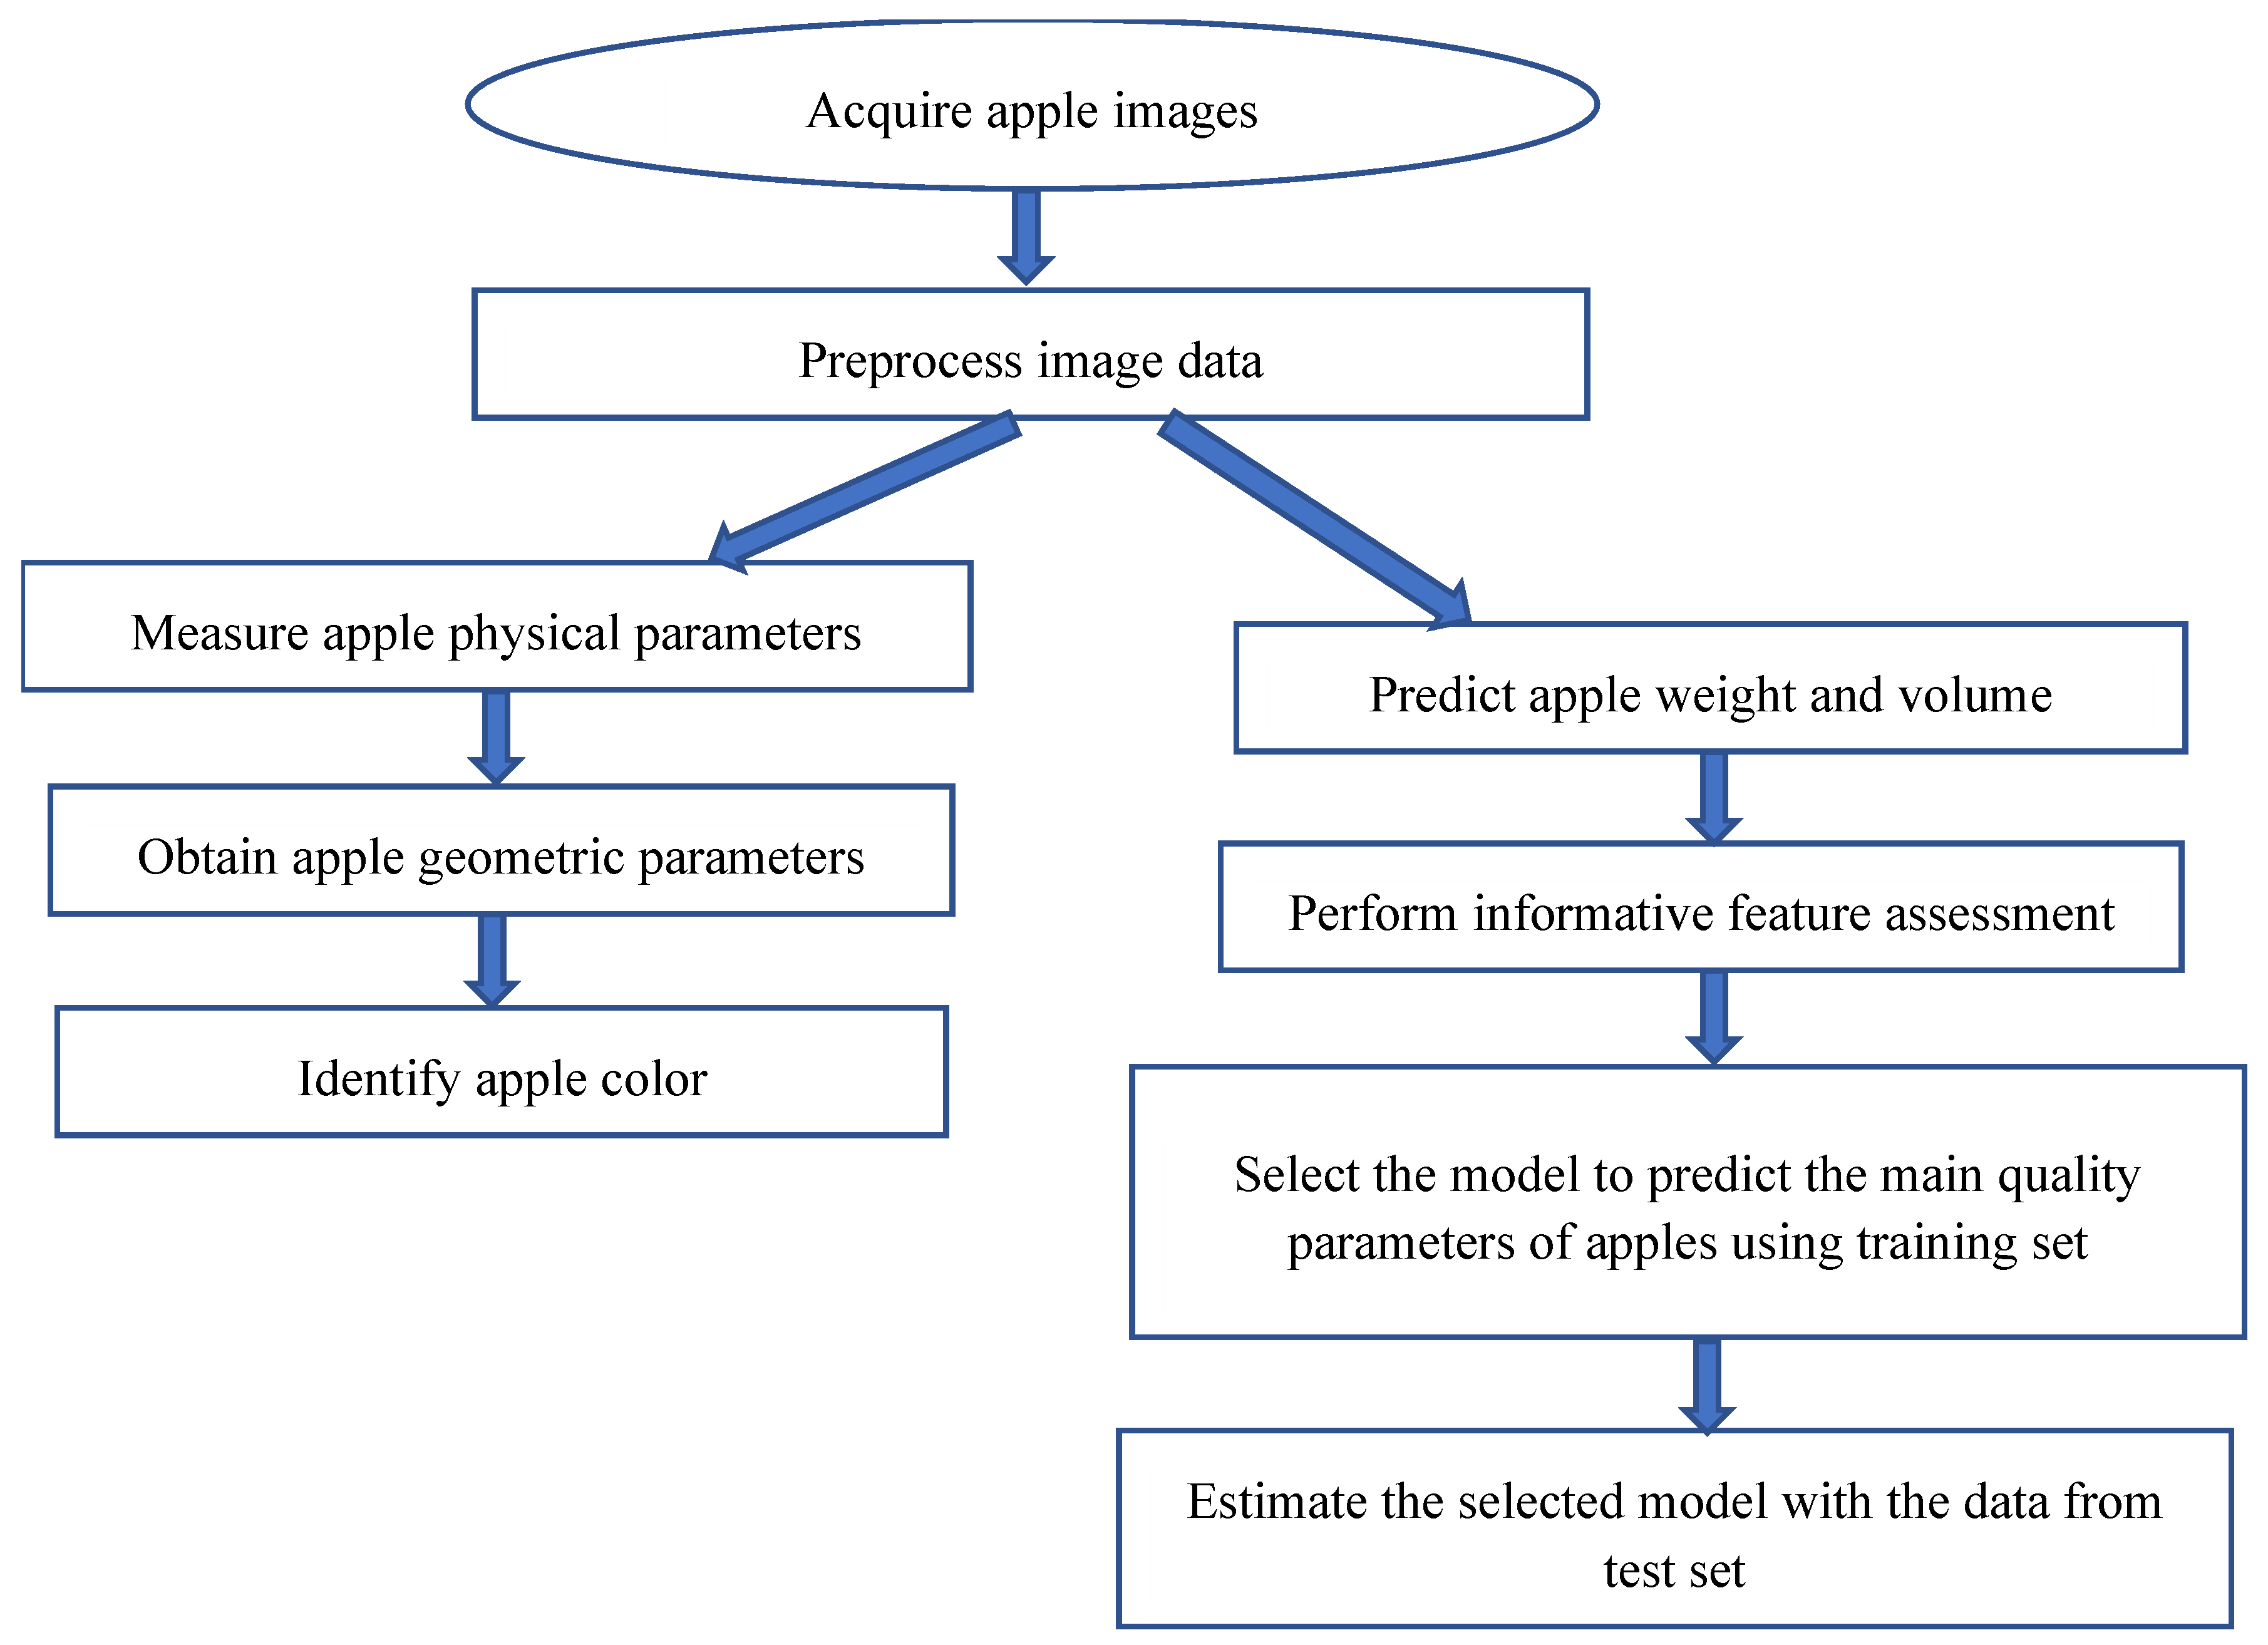
Figure 5.
Images of apples of the Sinap Almatynski variety.
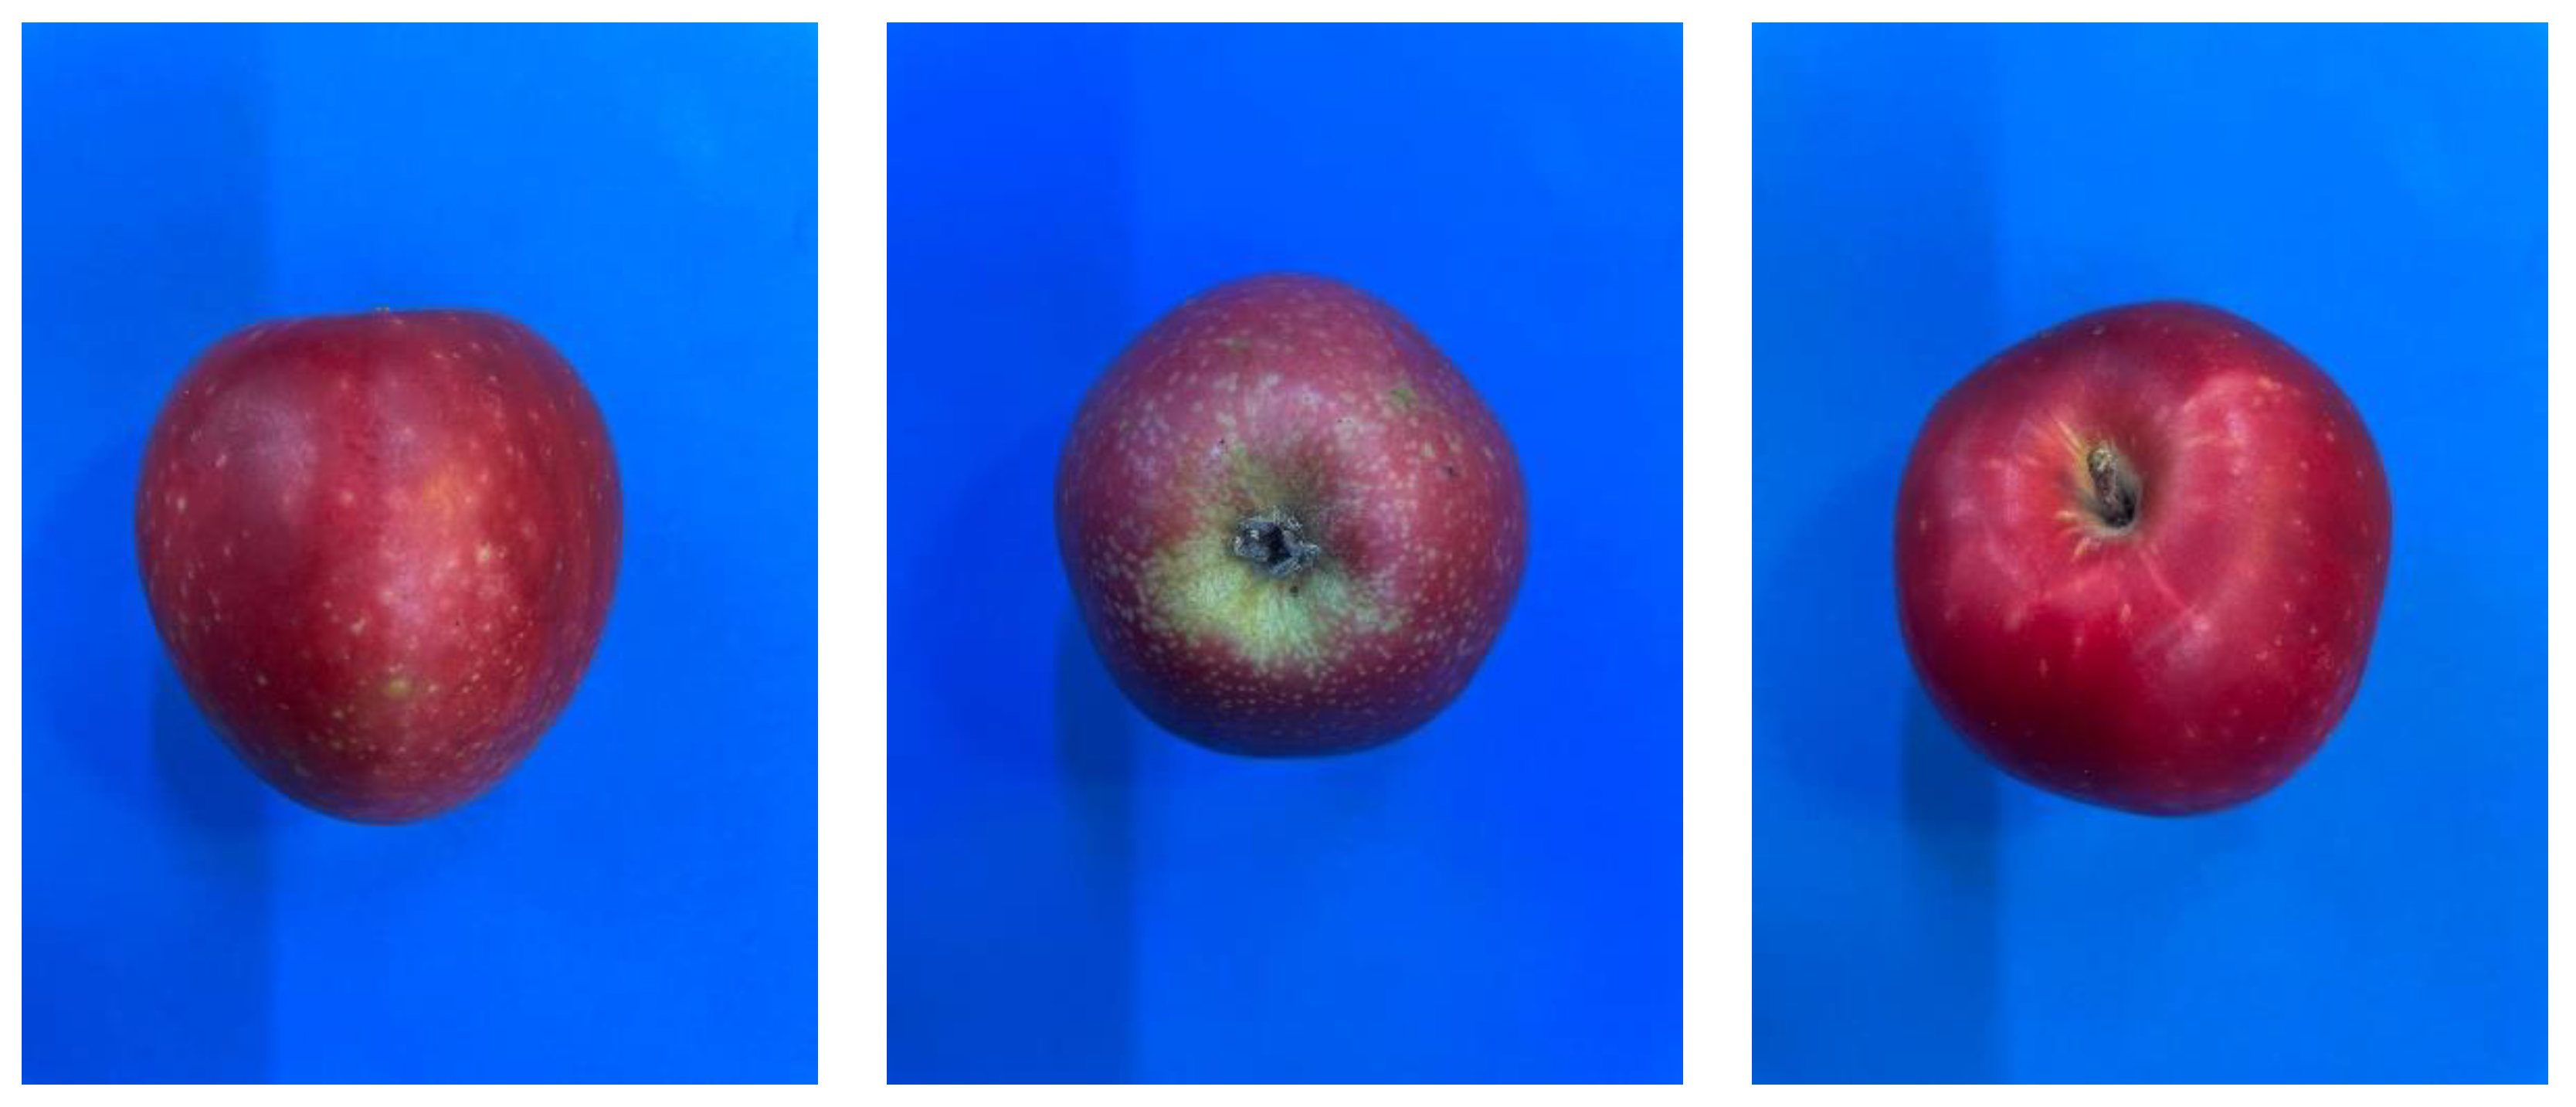
Figure 6.
Experimental software testing.
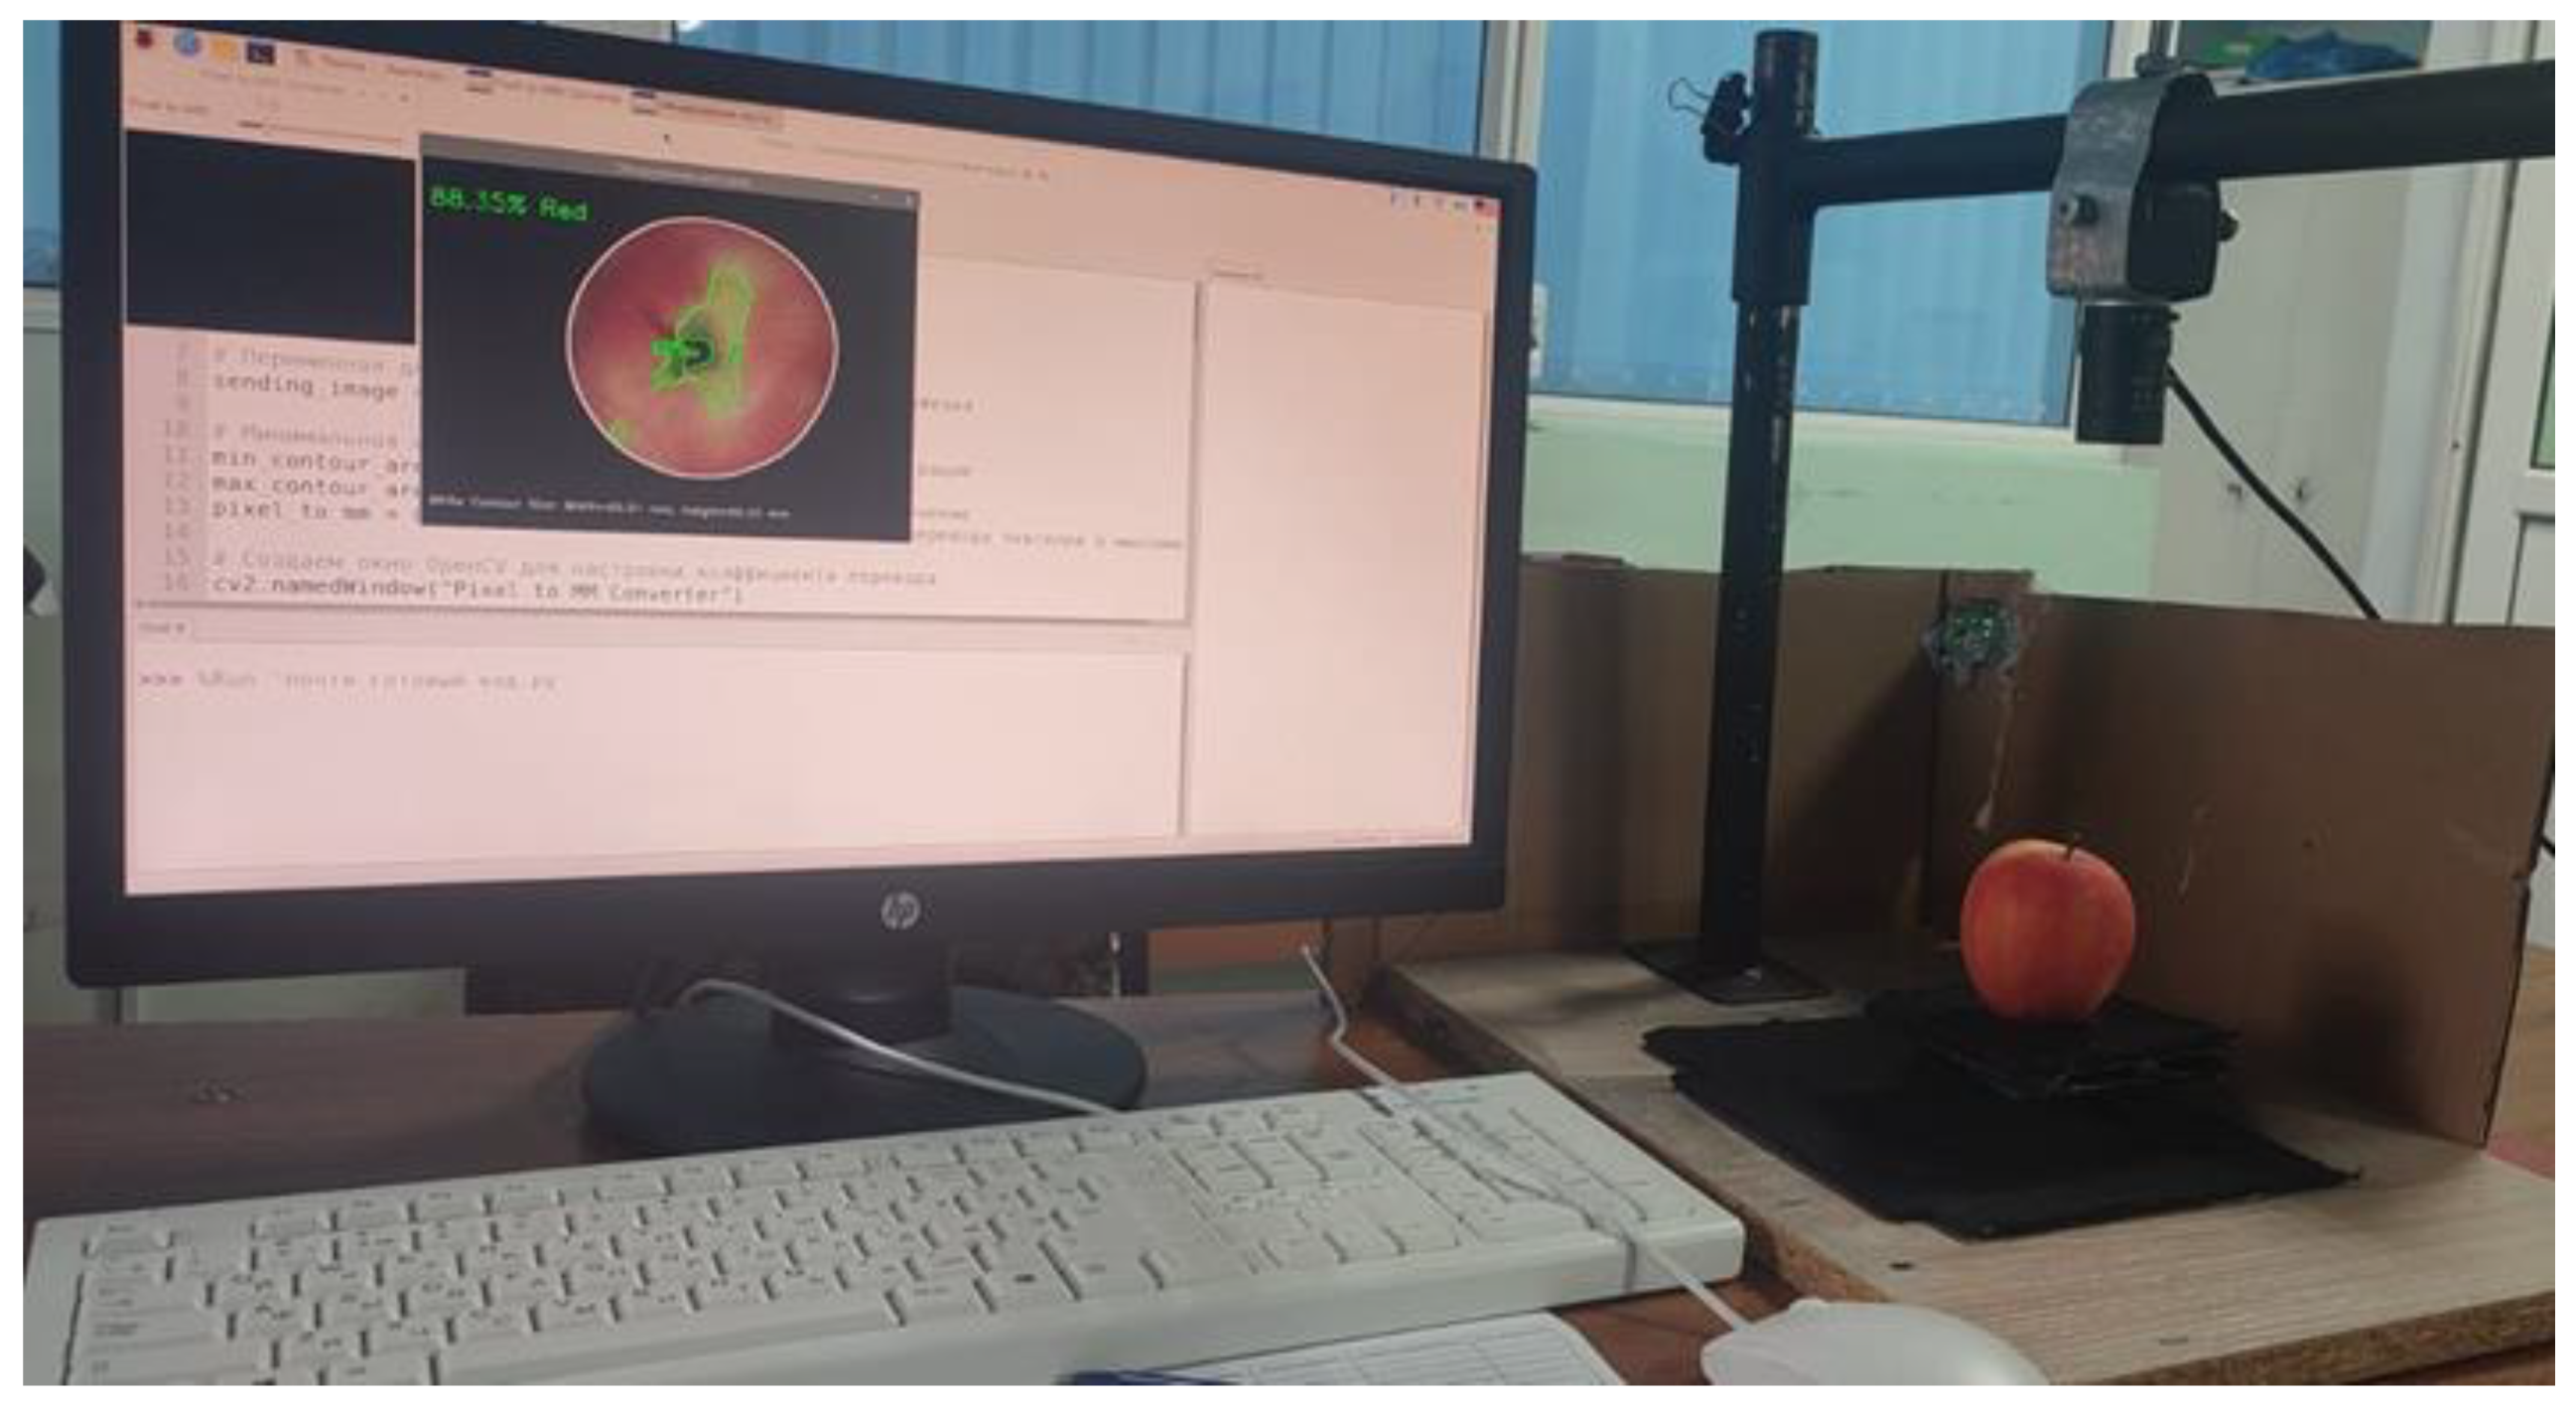
Figure 7.
The main steps of the procedure for determining the weight and volume of the apples.
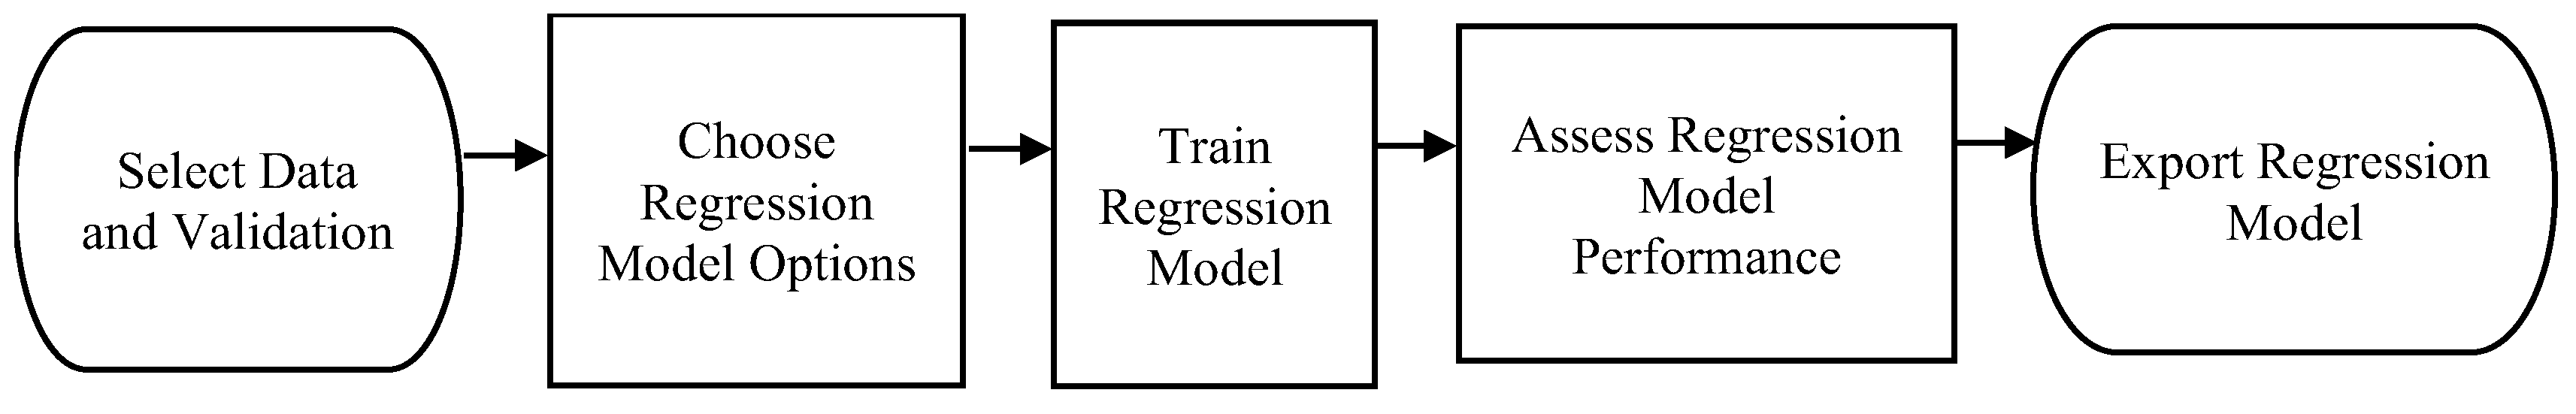
Figure 8.
Feature ranking via the F test for weight.
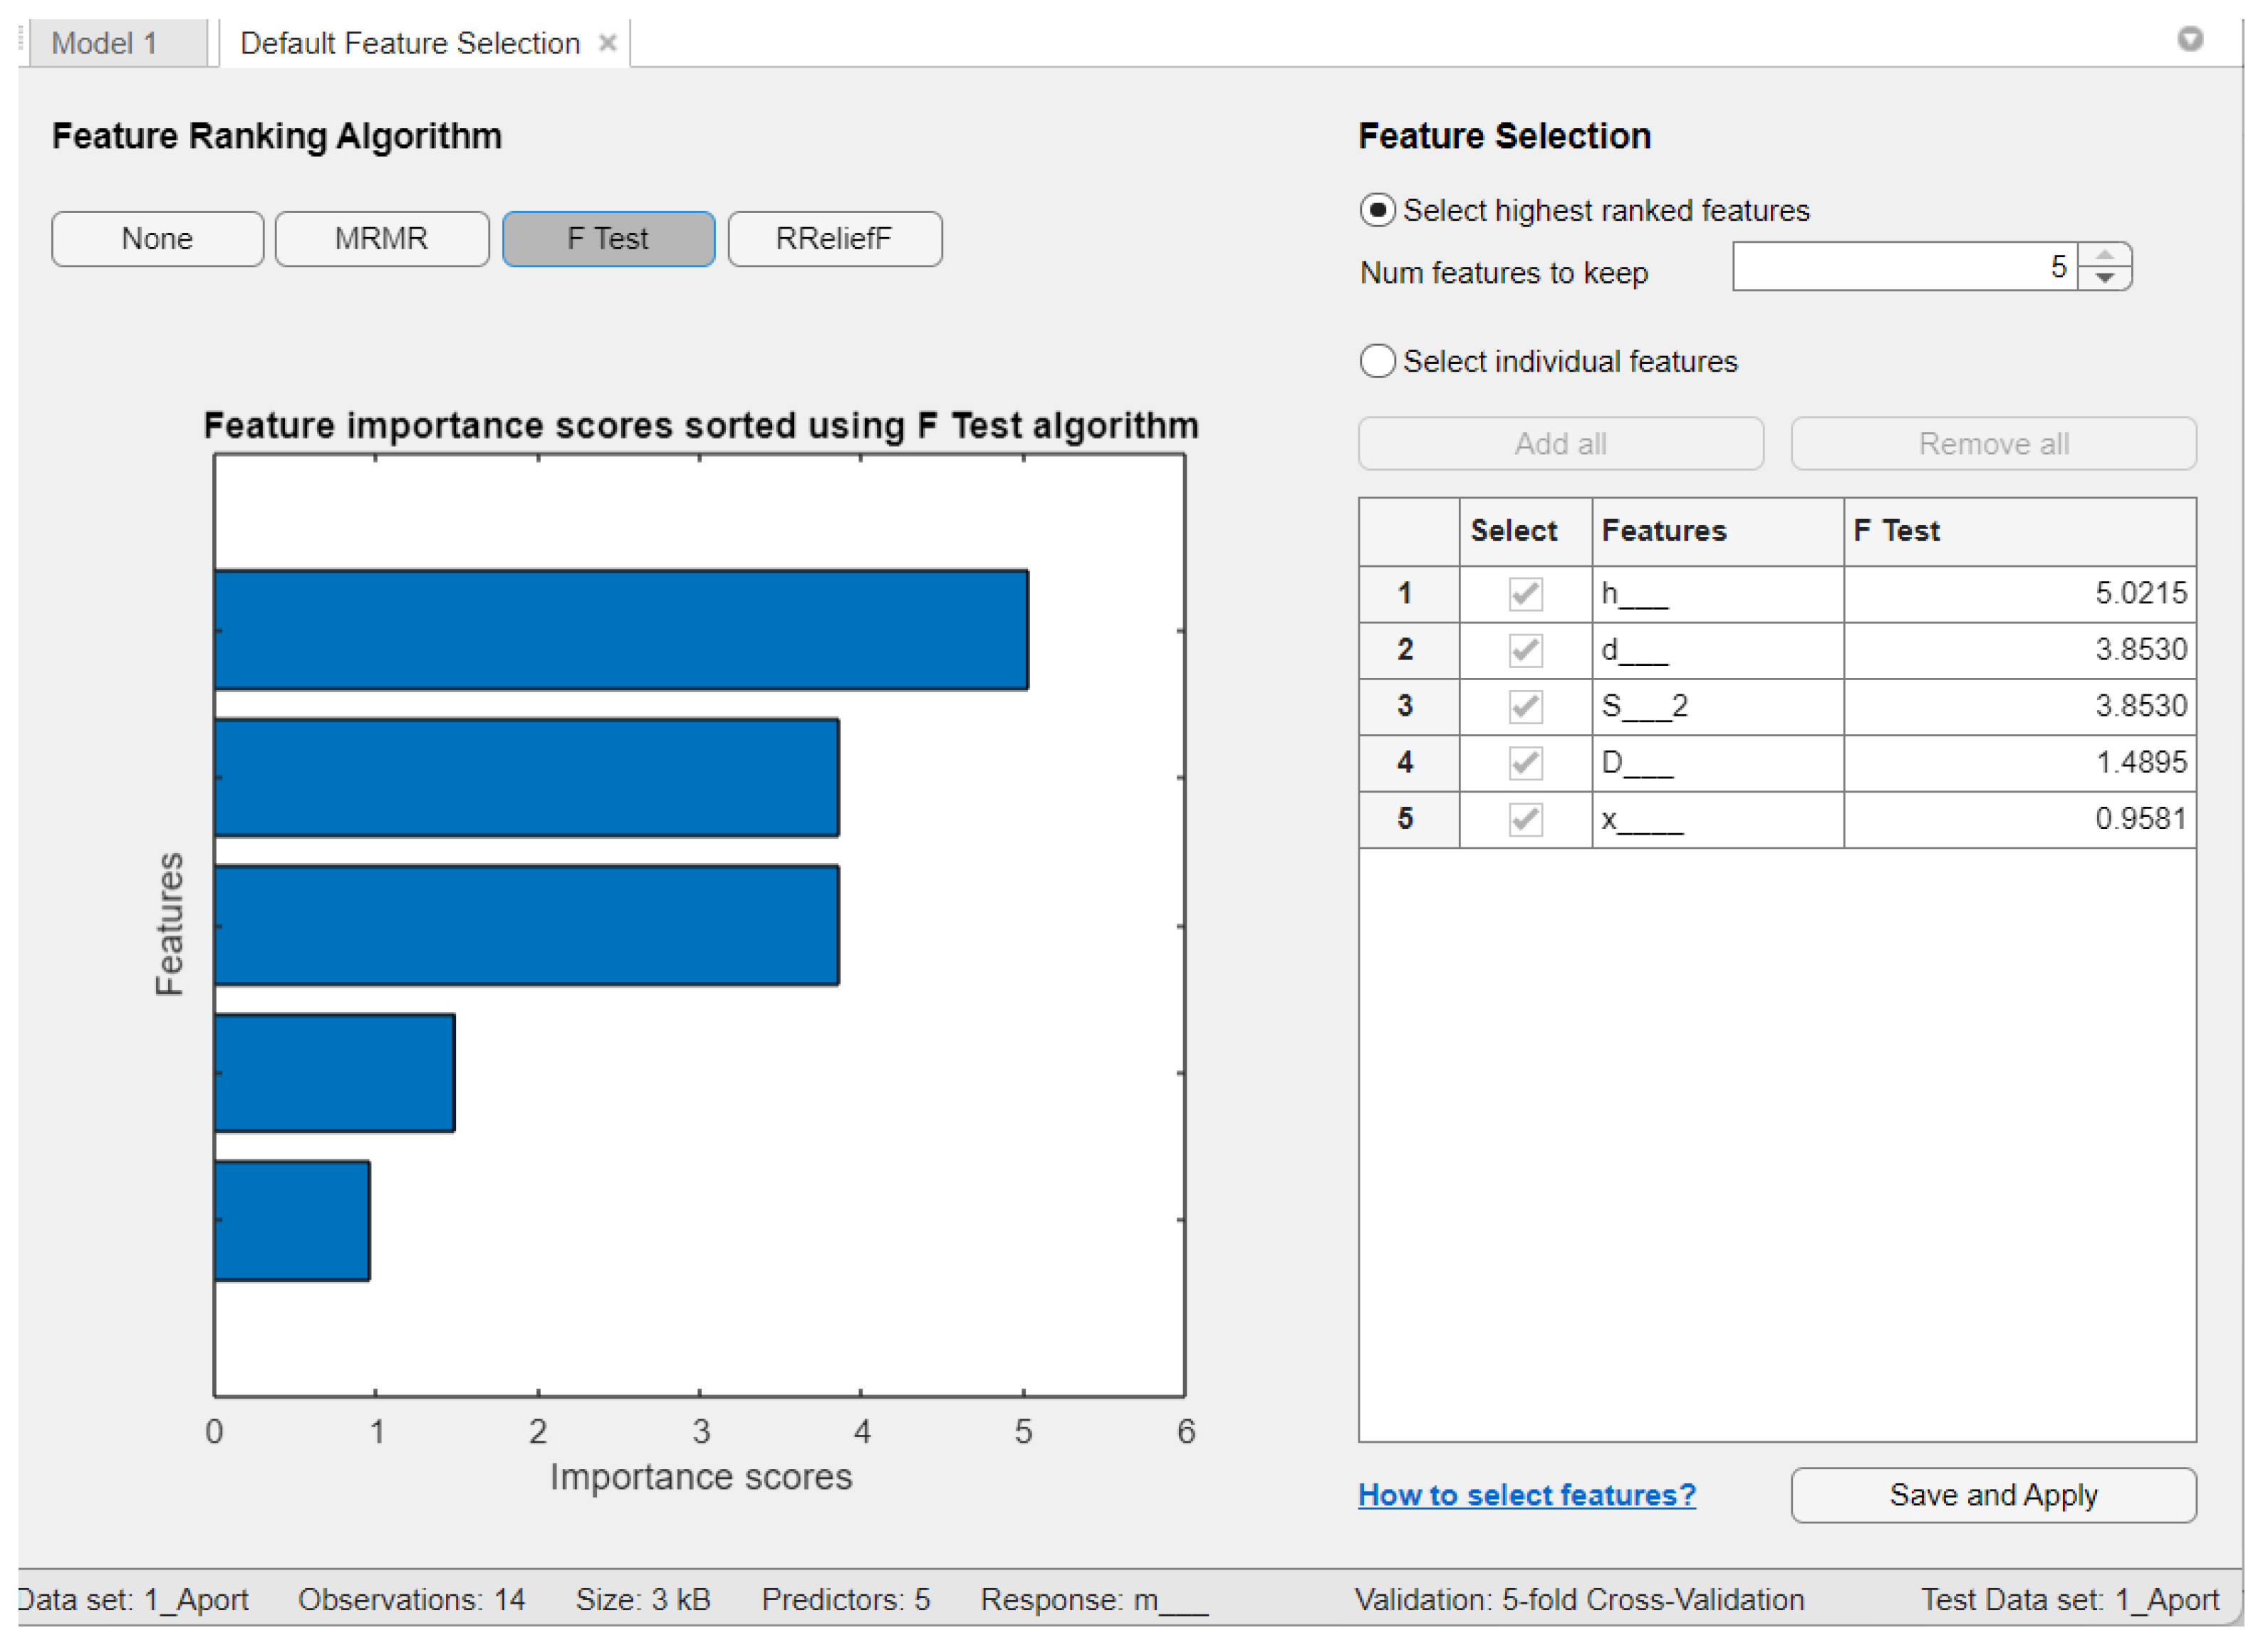
Figure 9.
Feature ranking via ReliefF for weight.
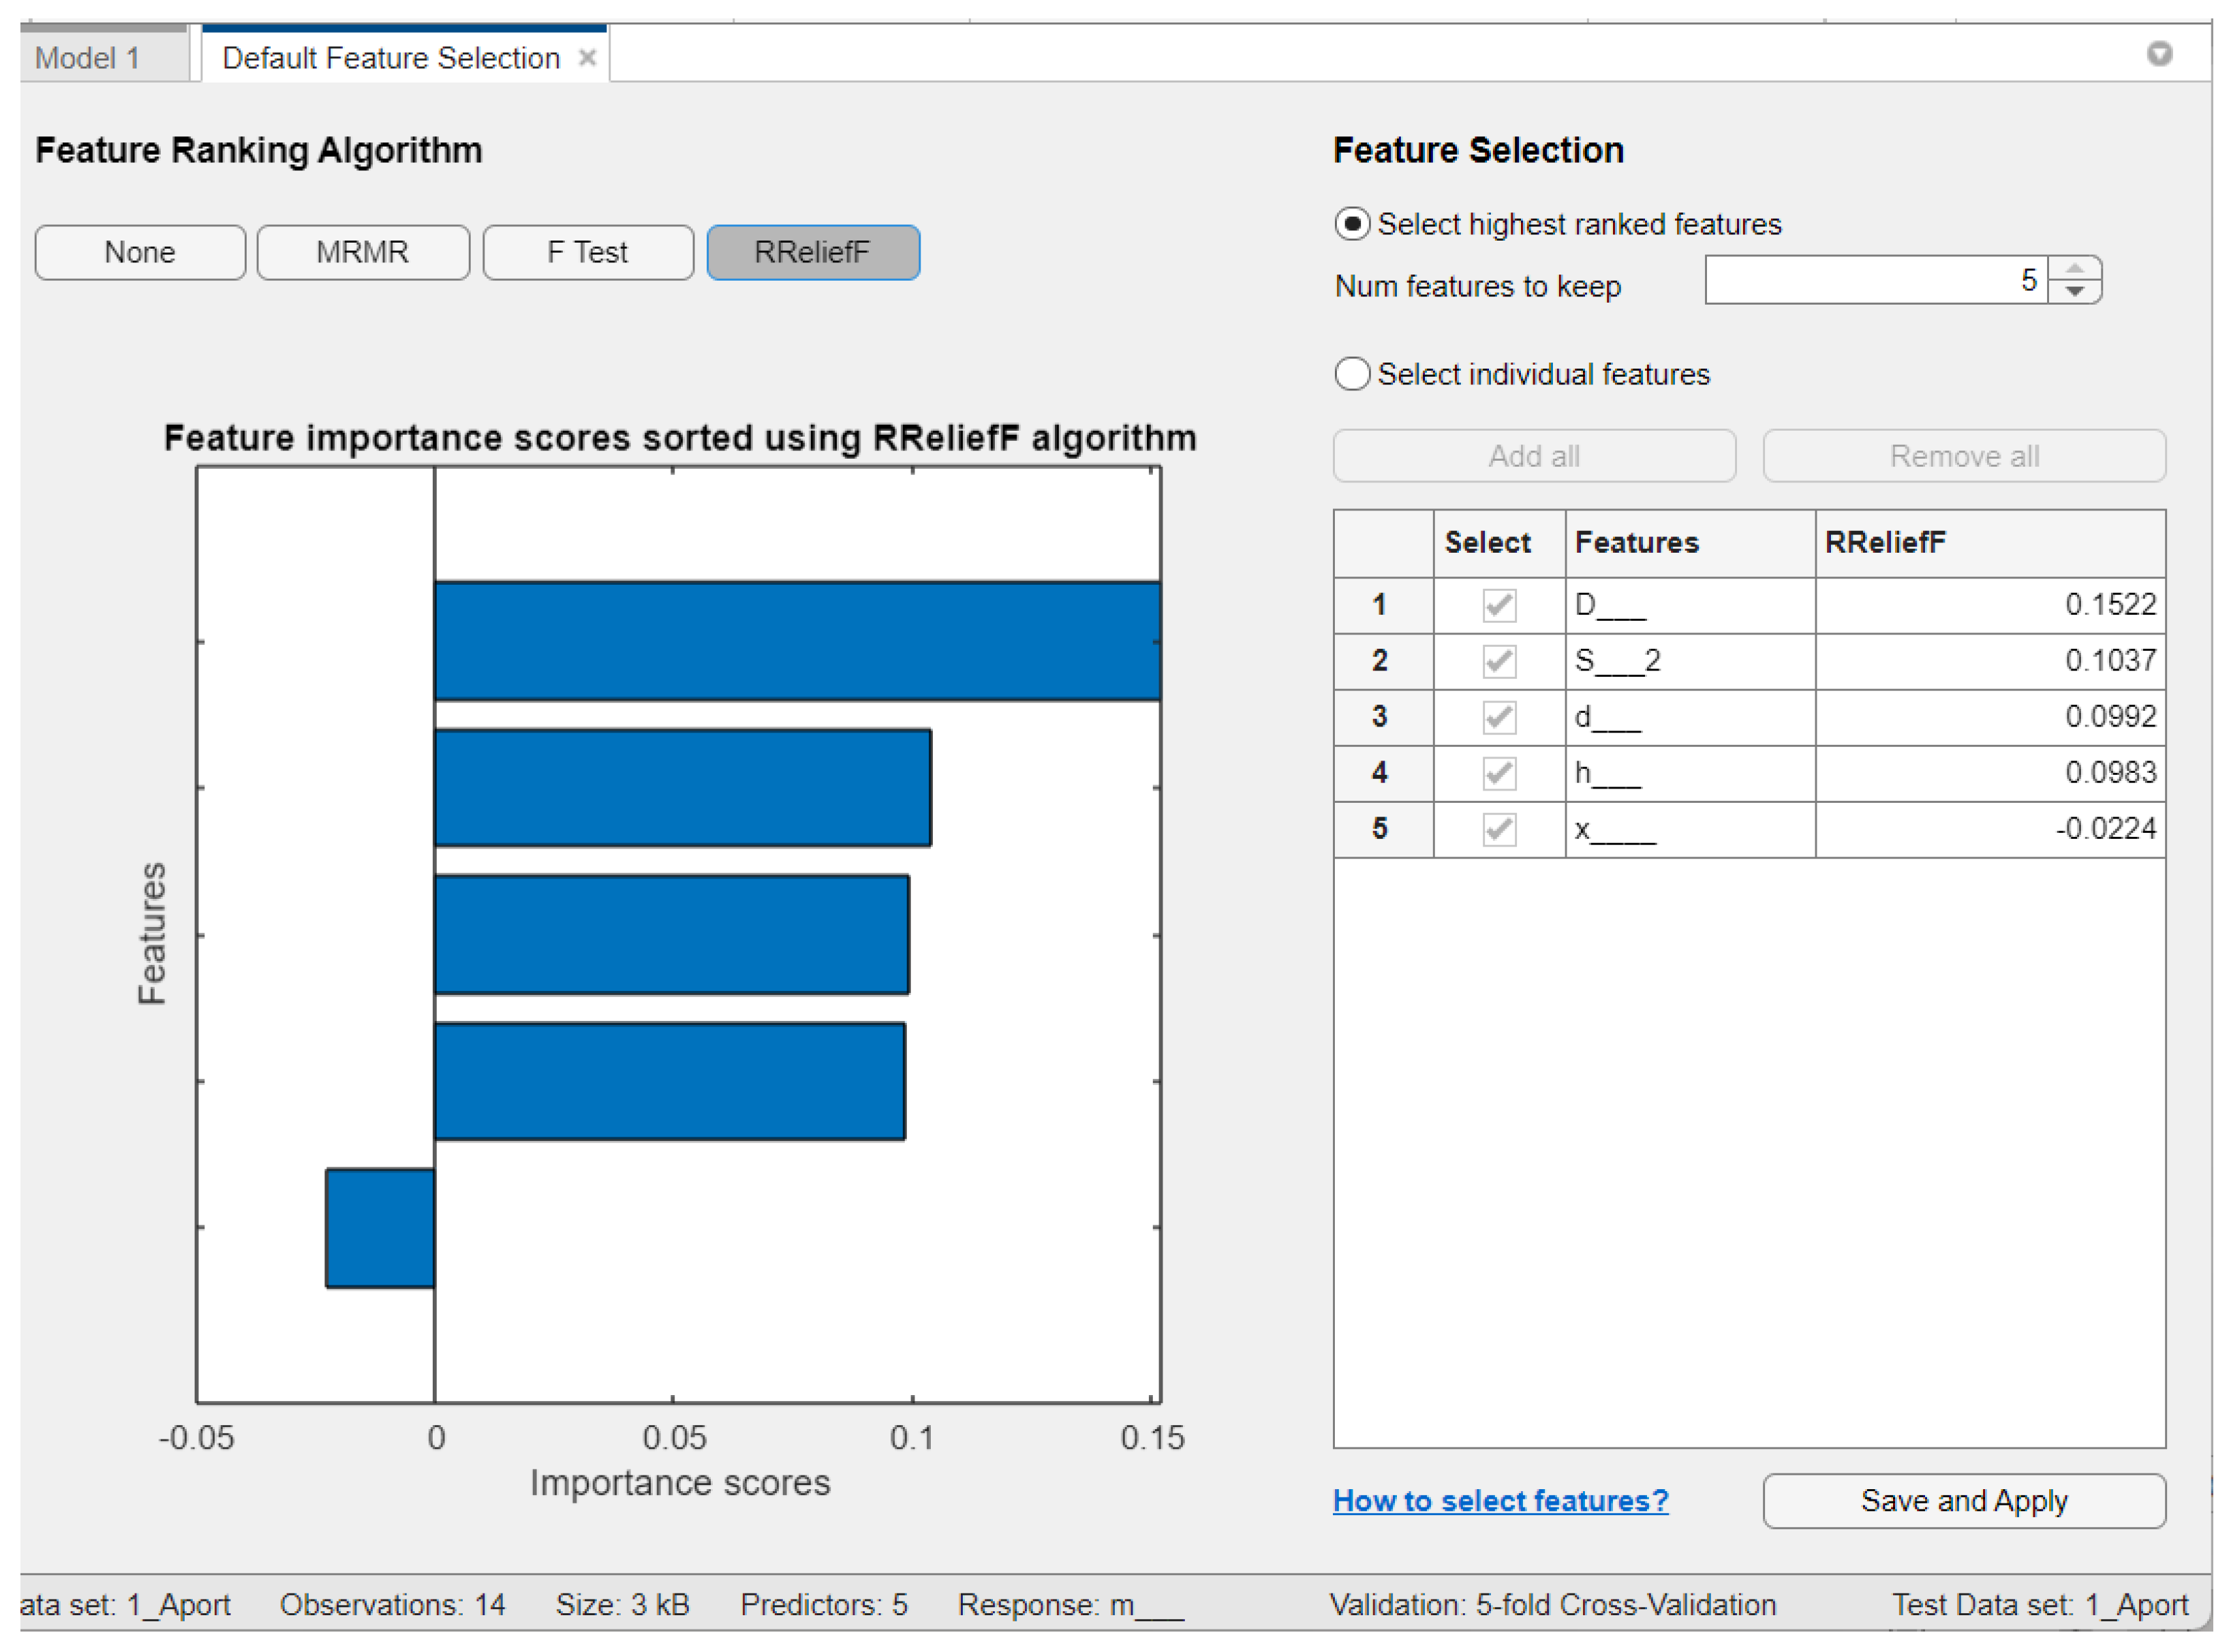
Figure 10.
Weight predictions with the best trained model for the Aport apple variety.
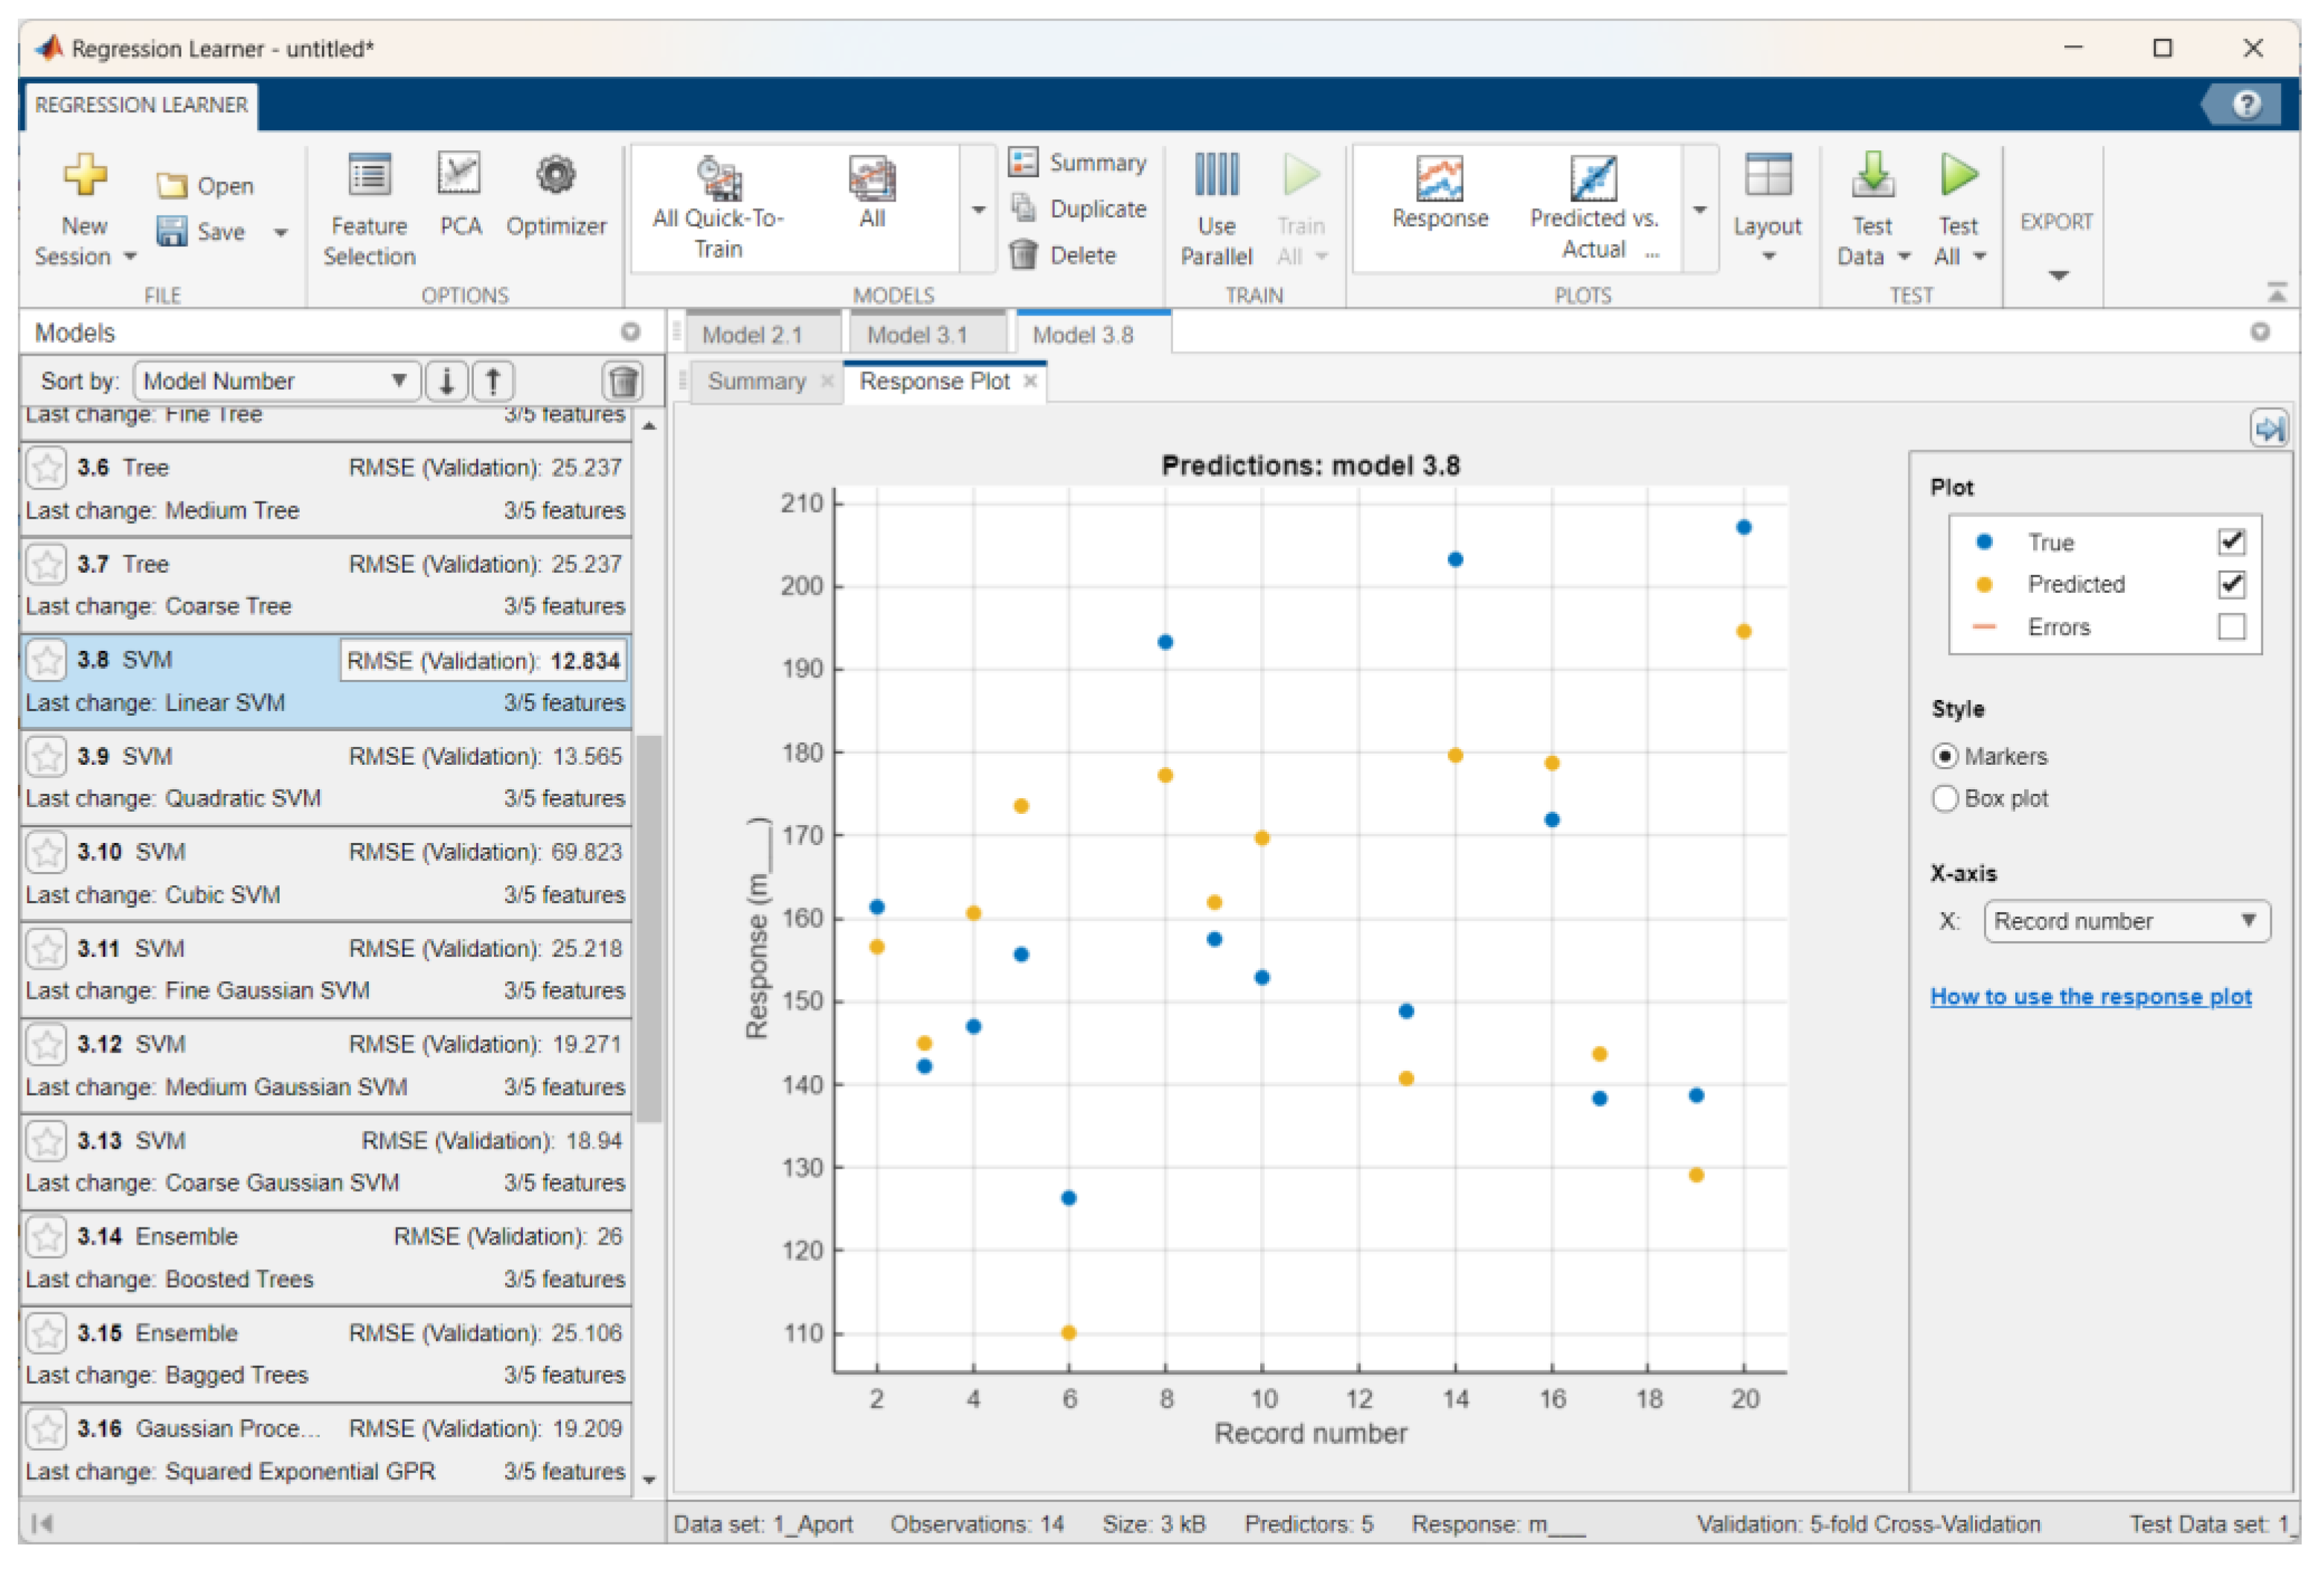
Figure 12.
The residuals plot for weight.
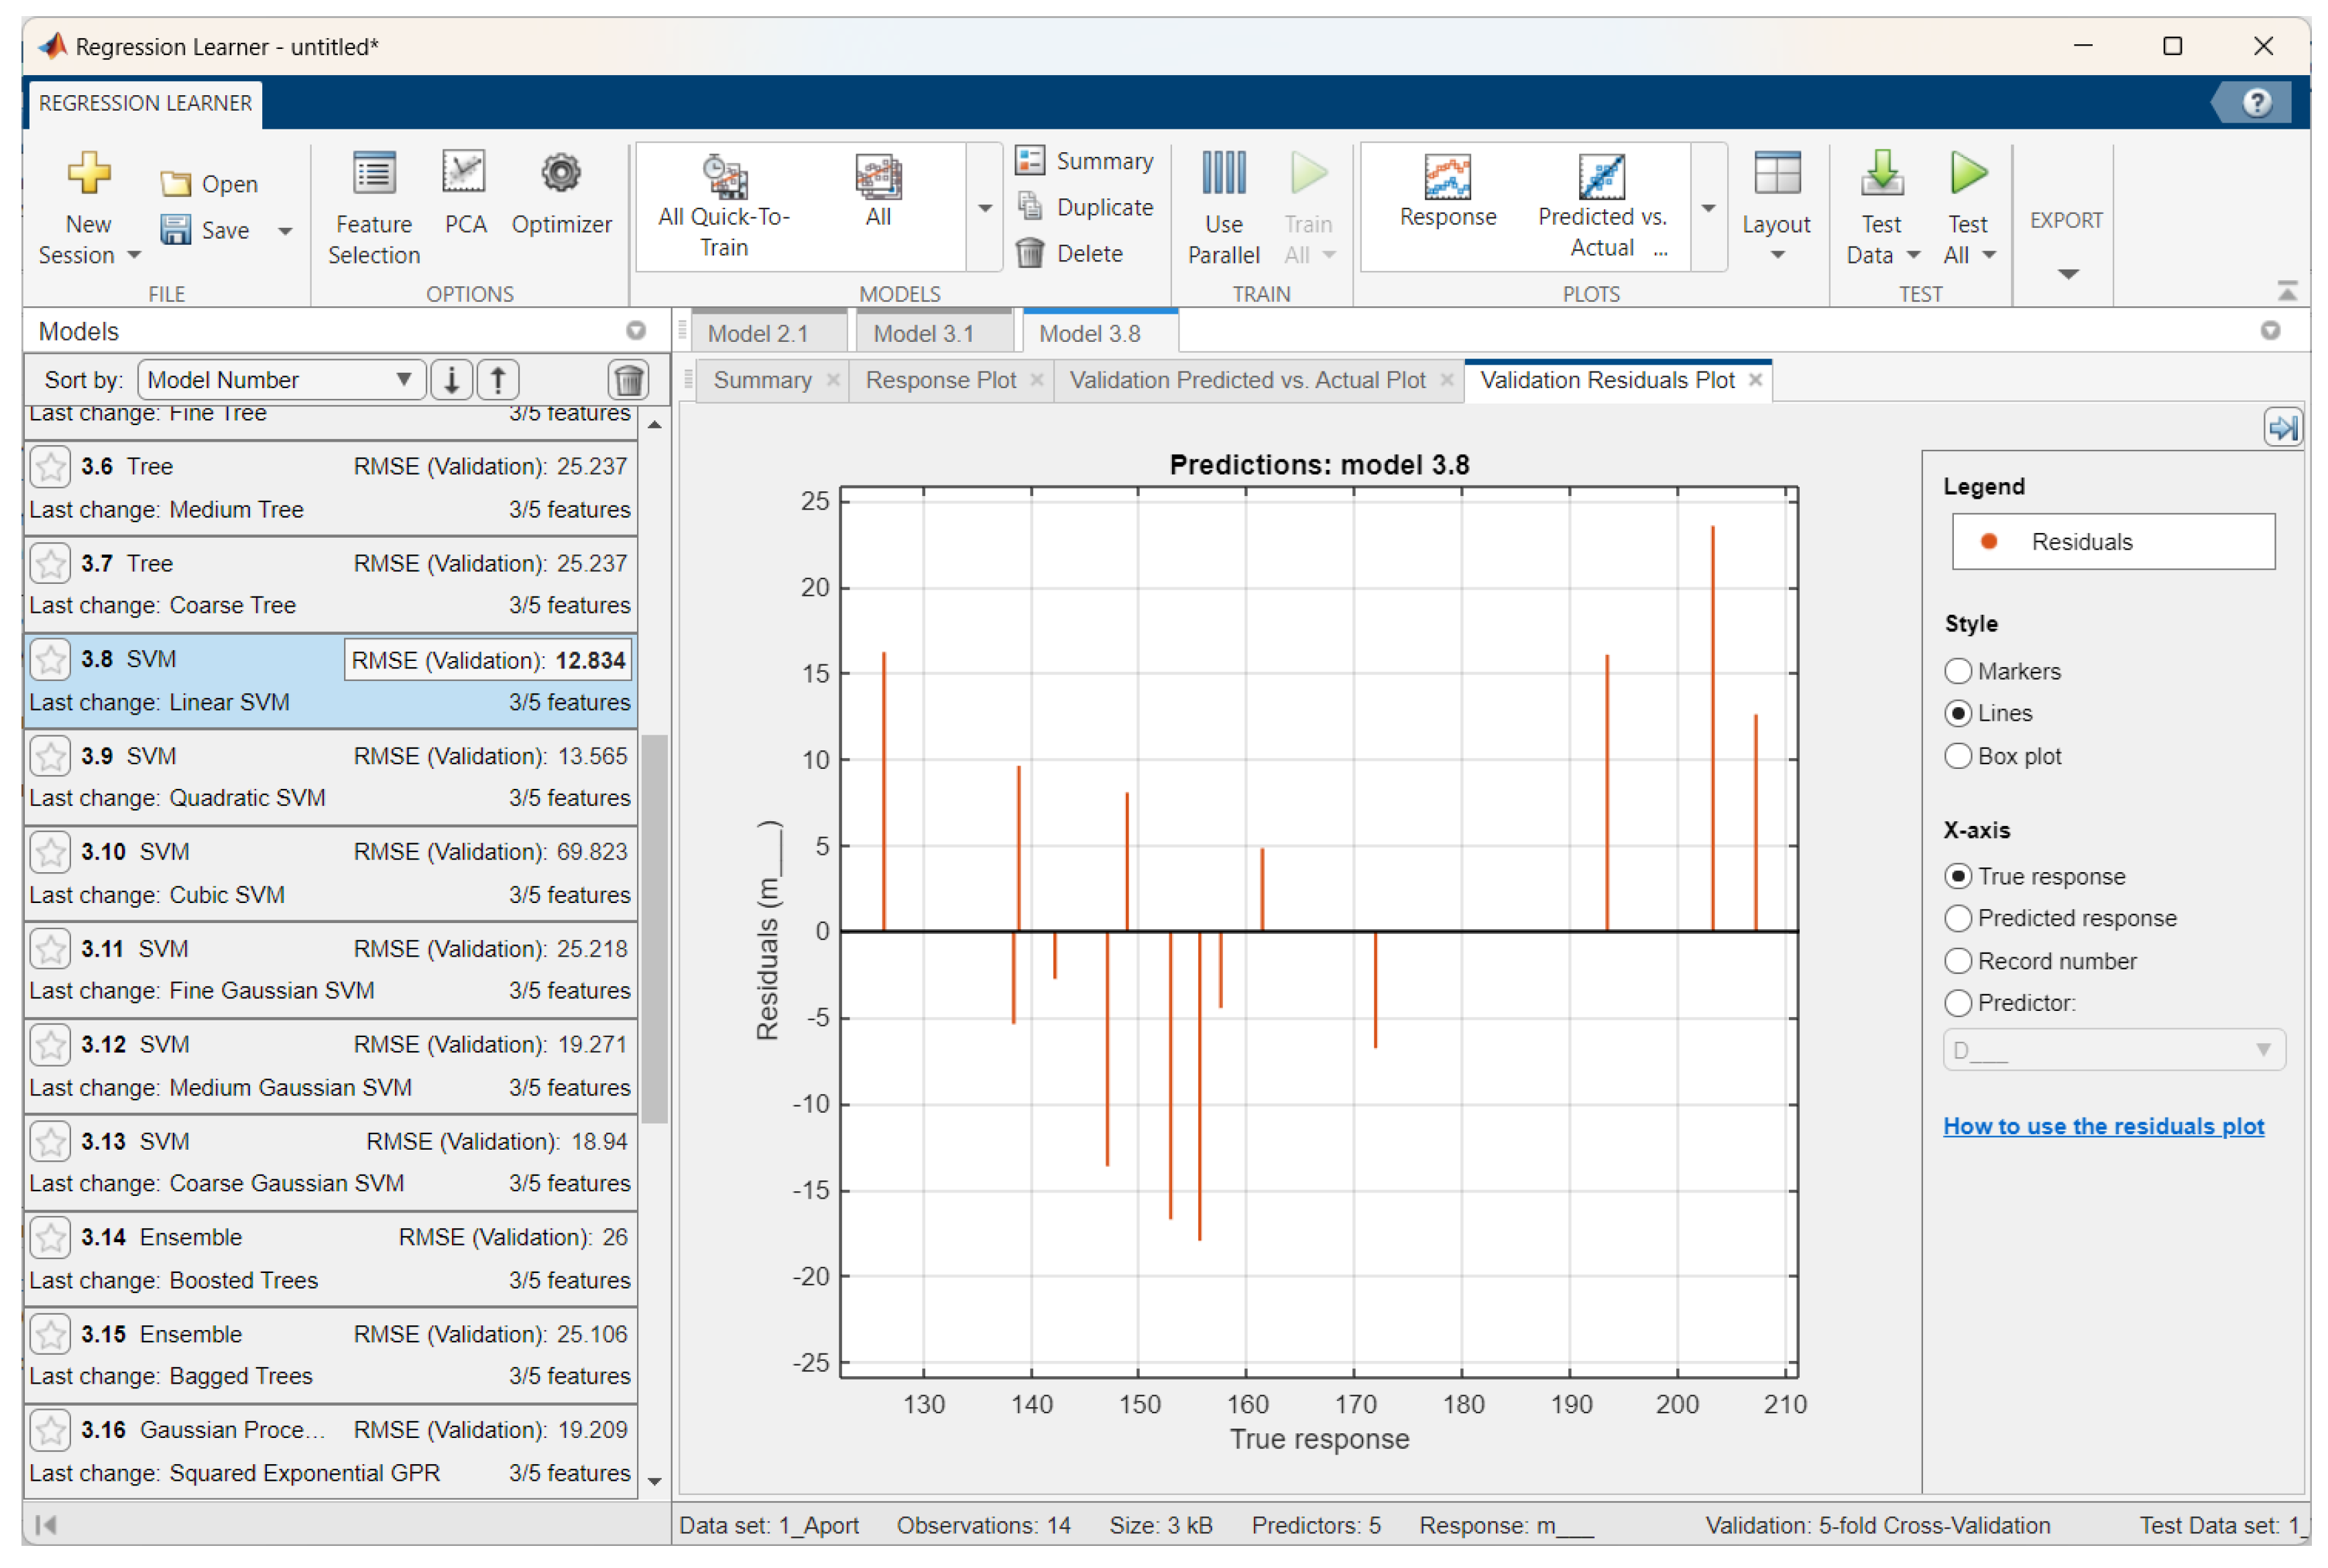
Figure 13.
Predicted vs. actual plot for the weight testing set.
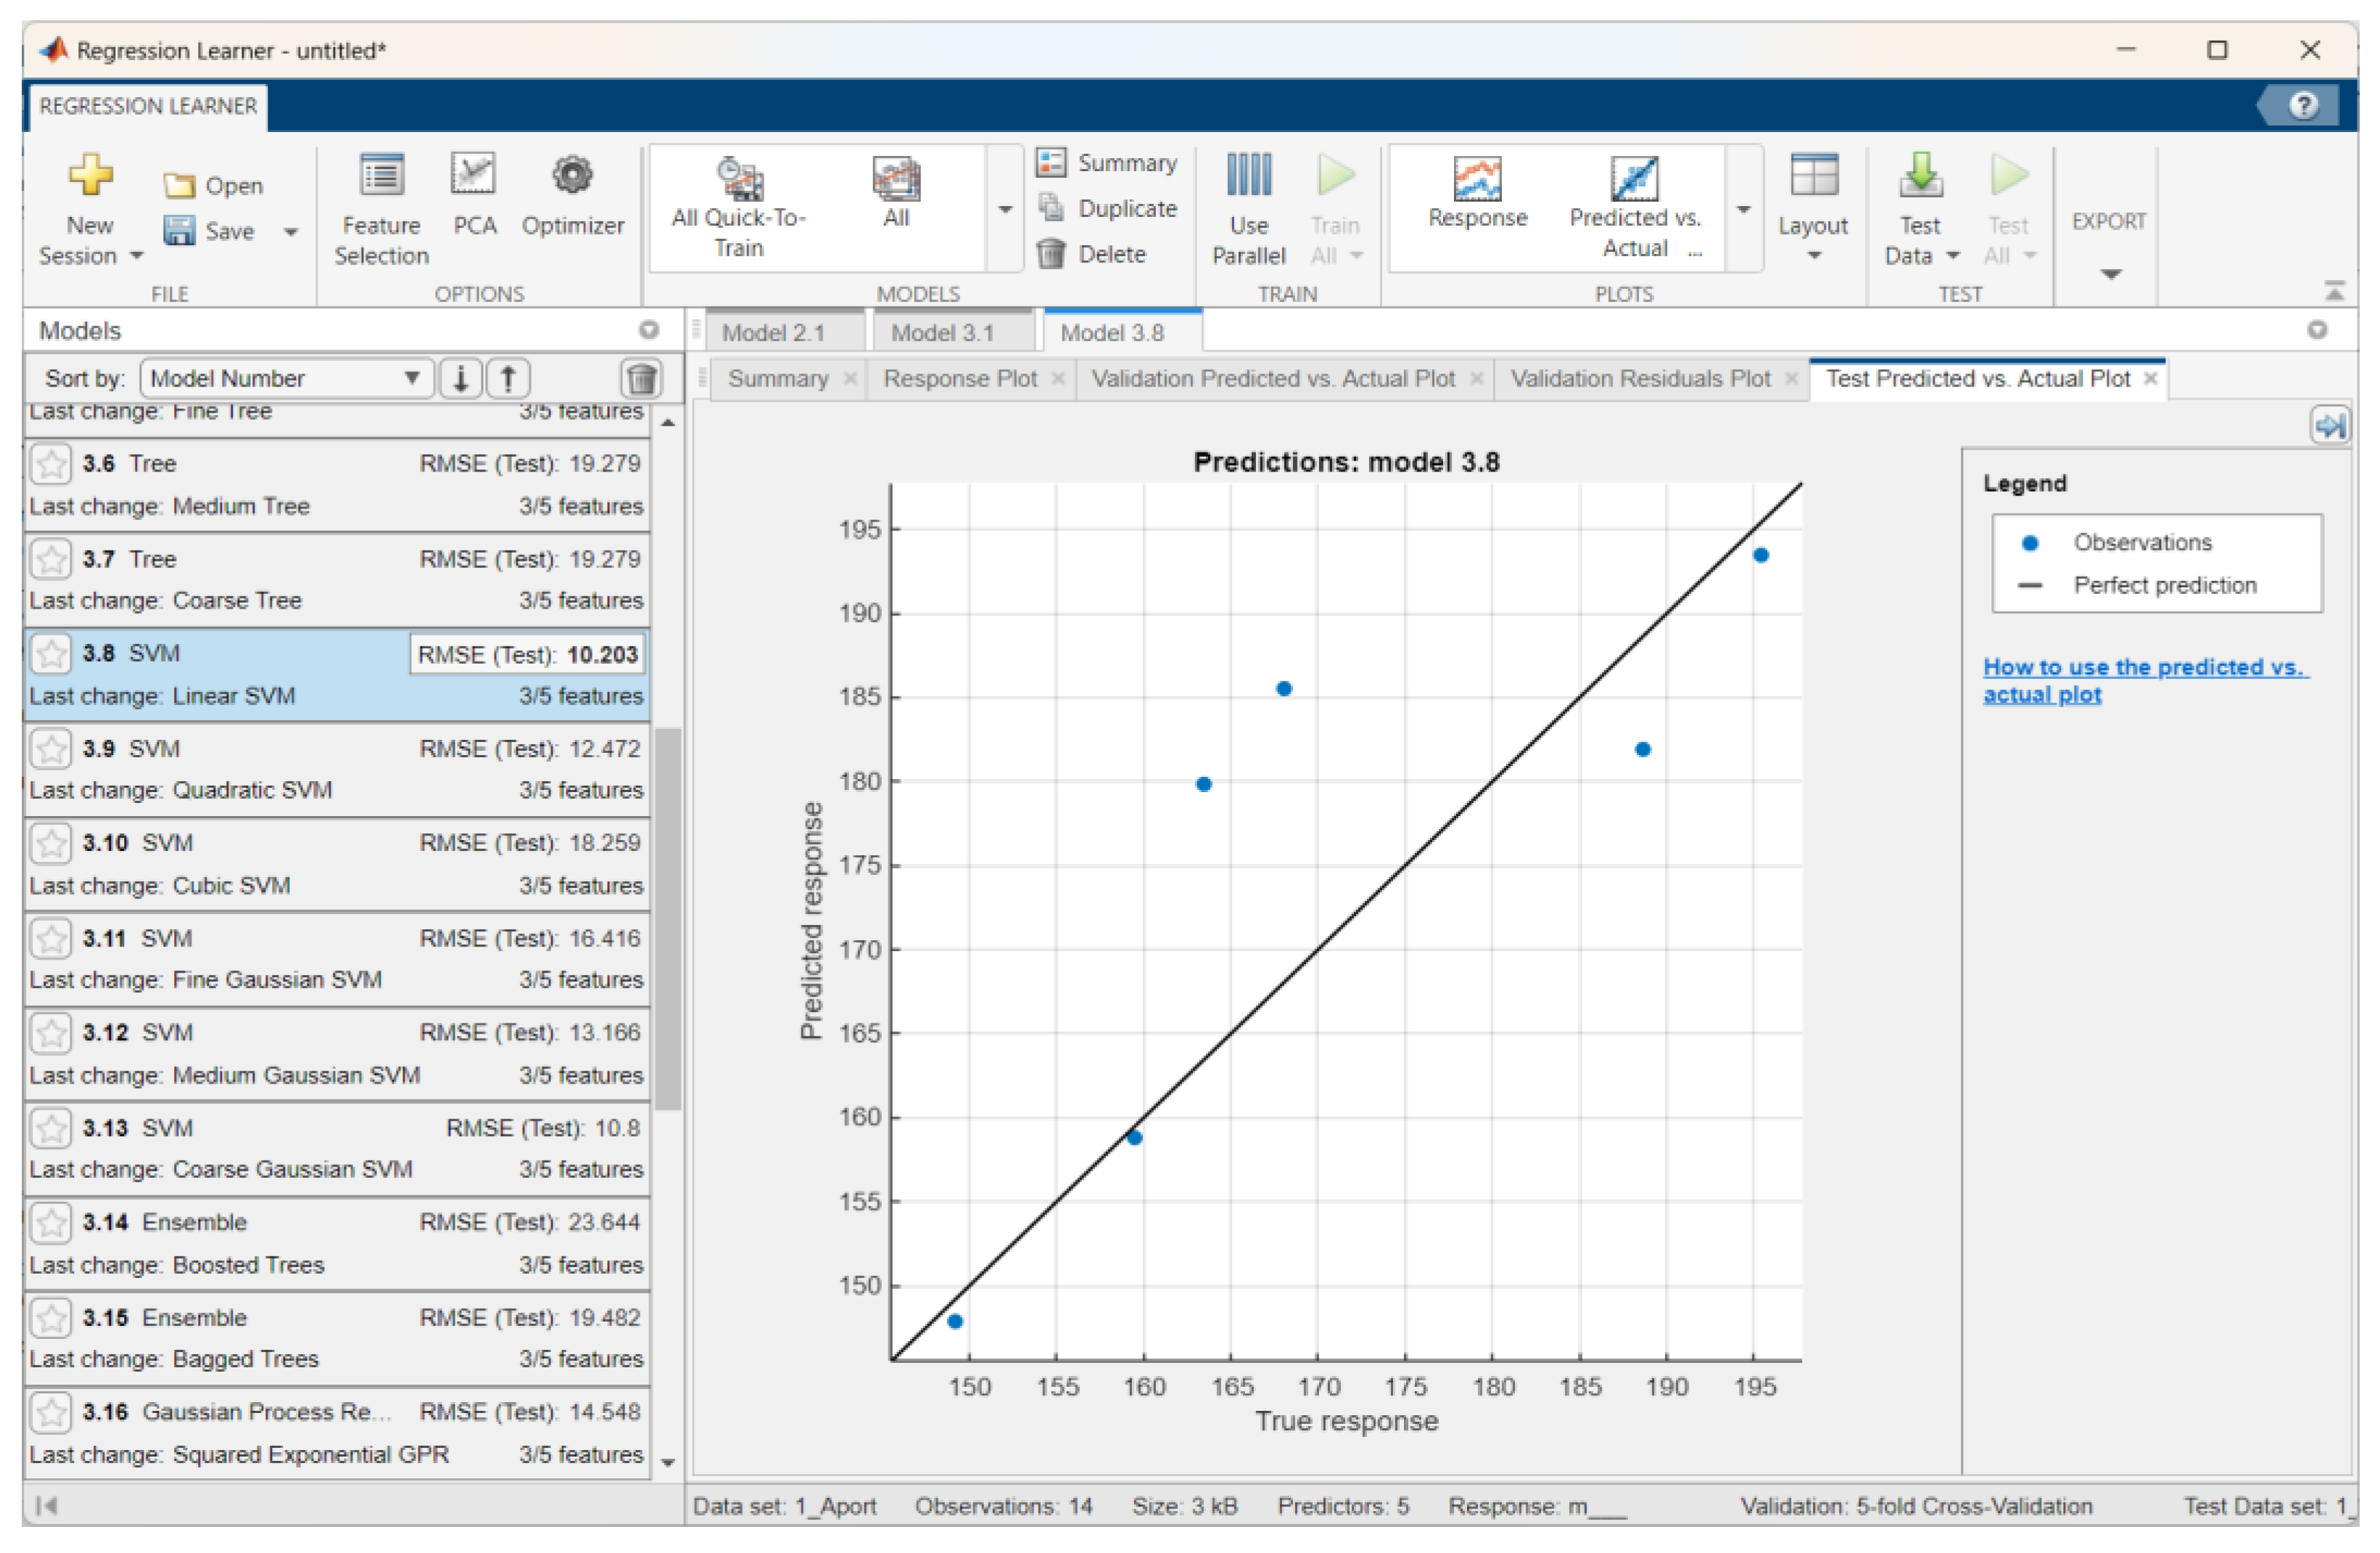
Figure 14.
Feature ranking via the F test for volume.
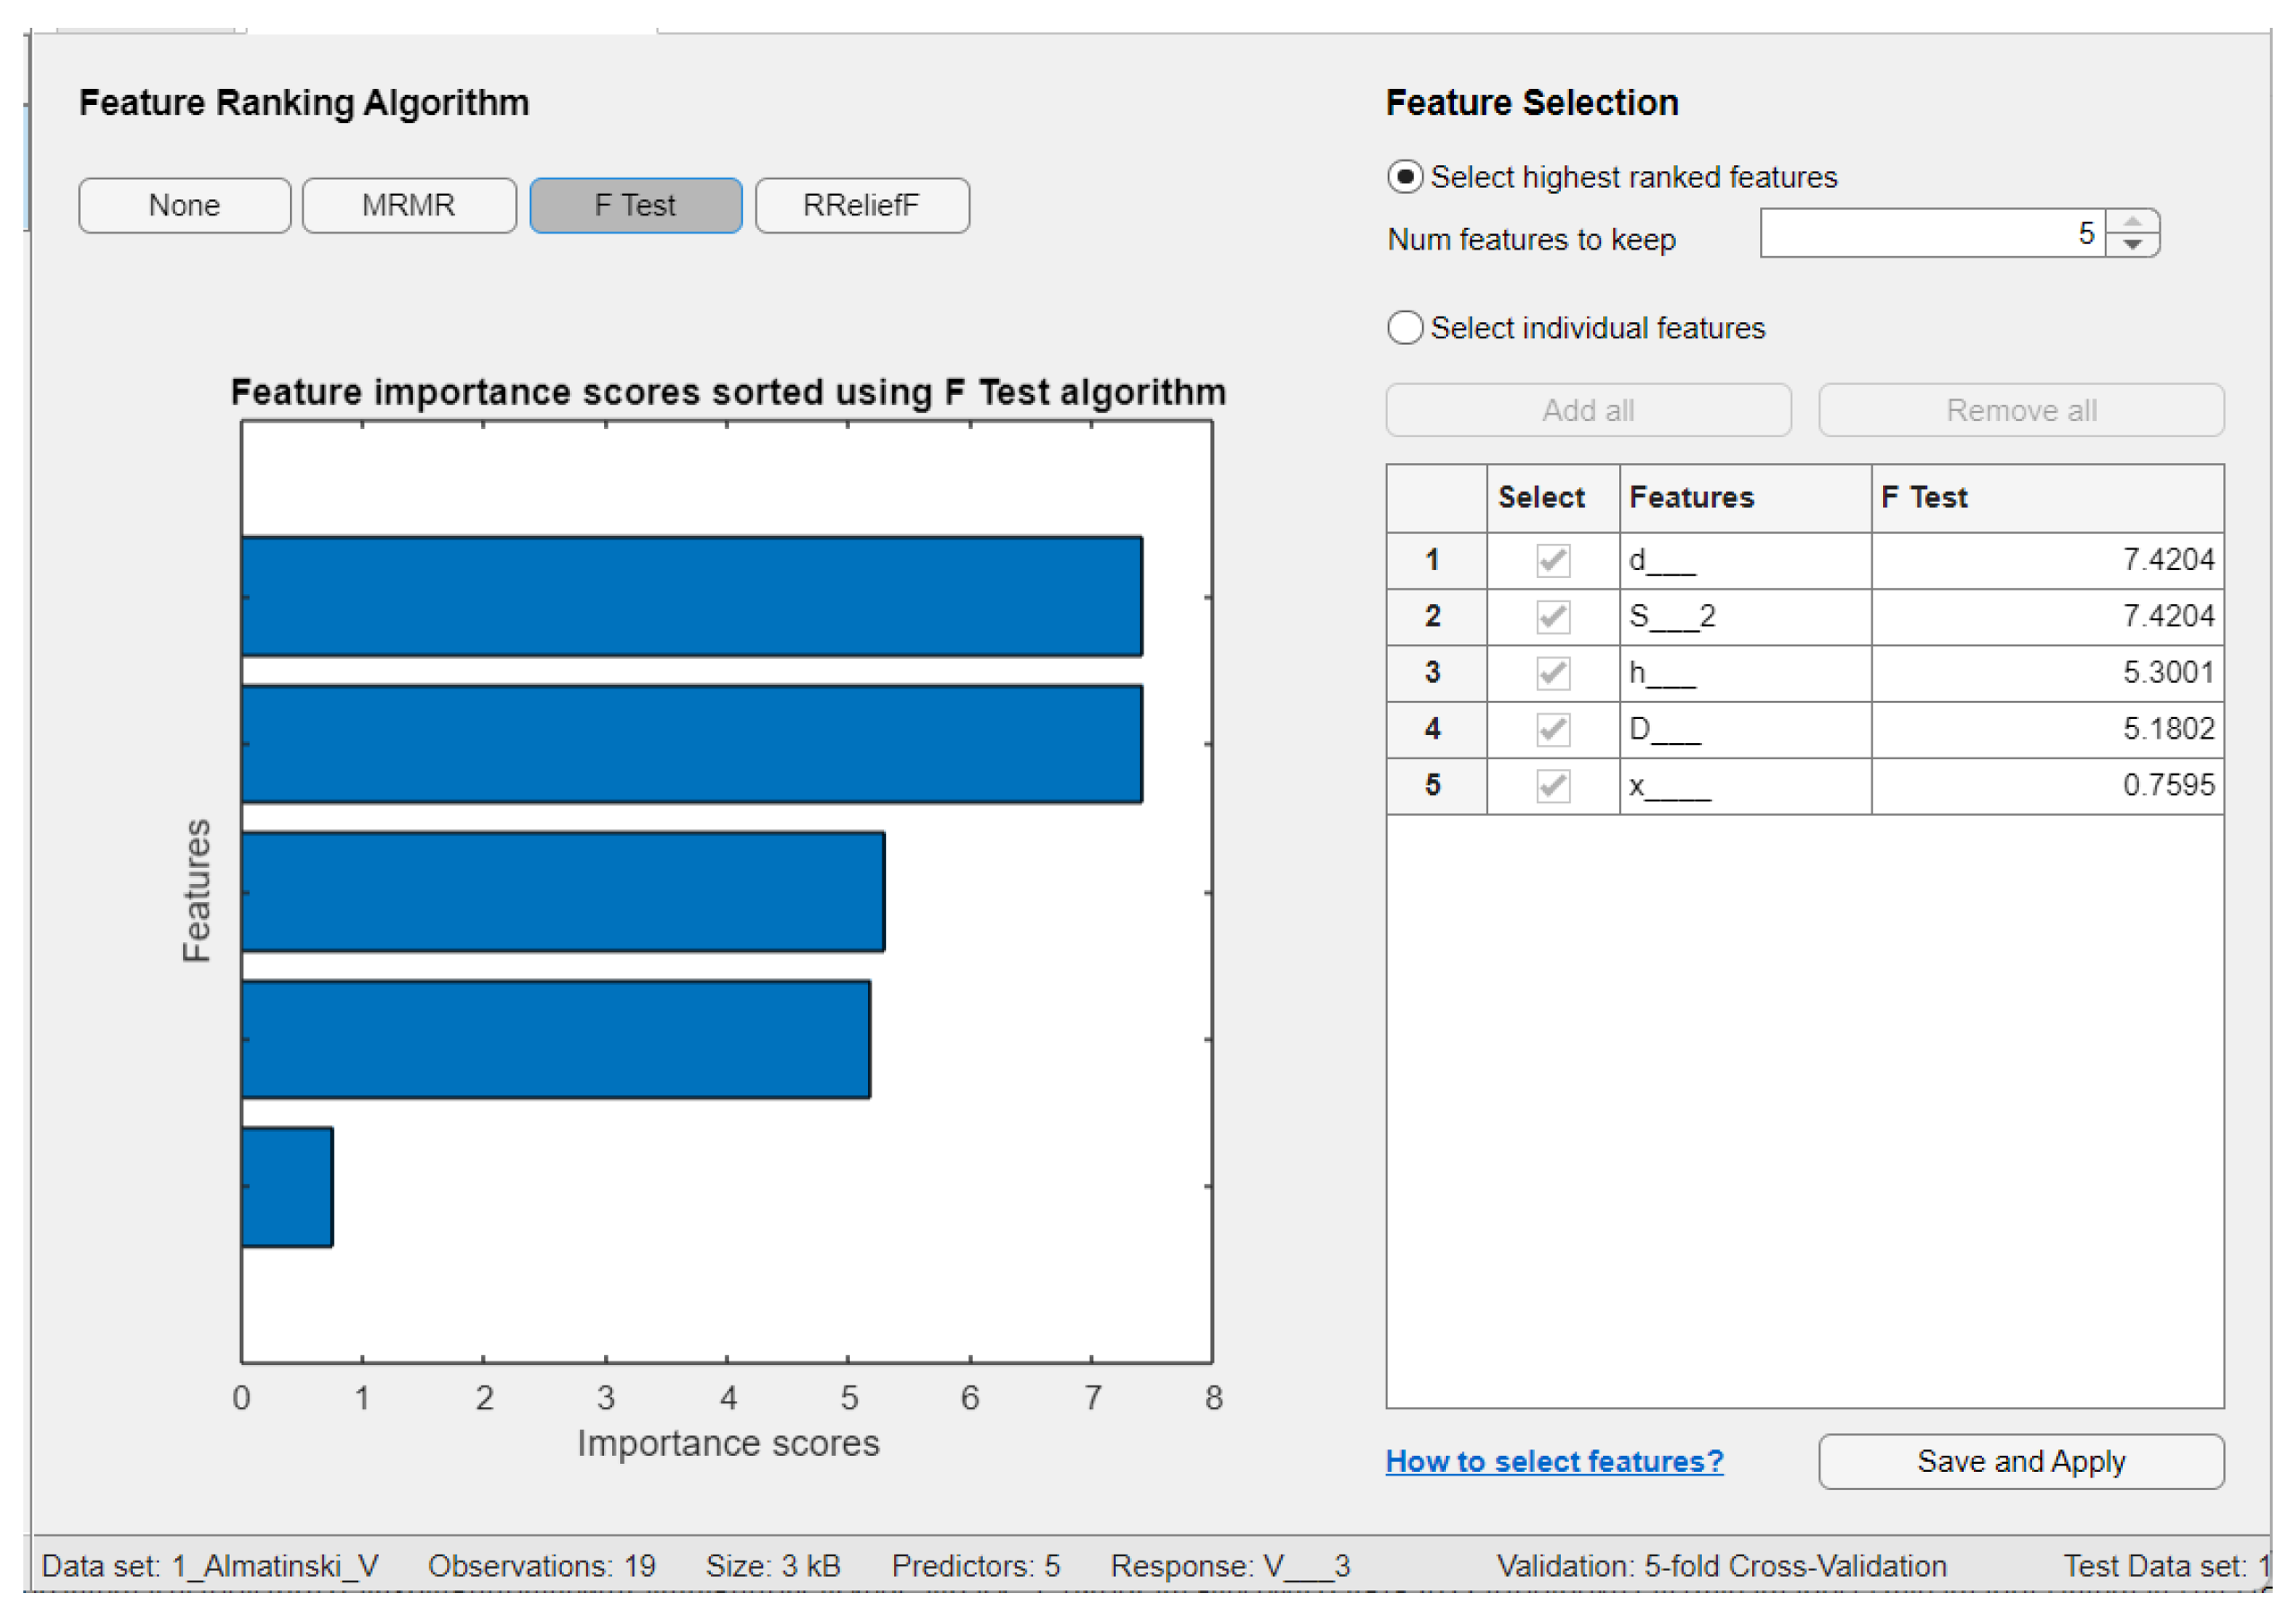
Figure 15.
Feature ranking via ReleifF for volume.
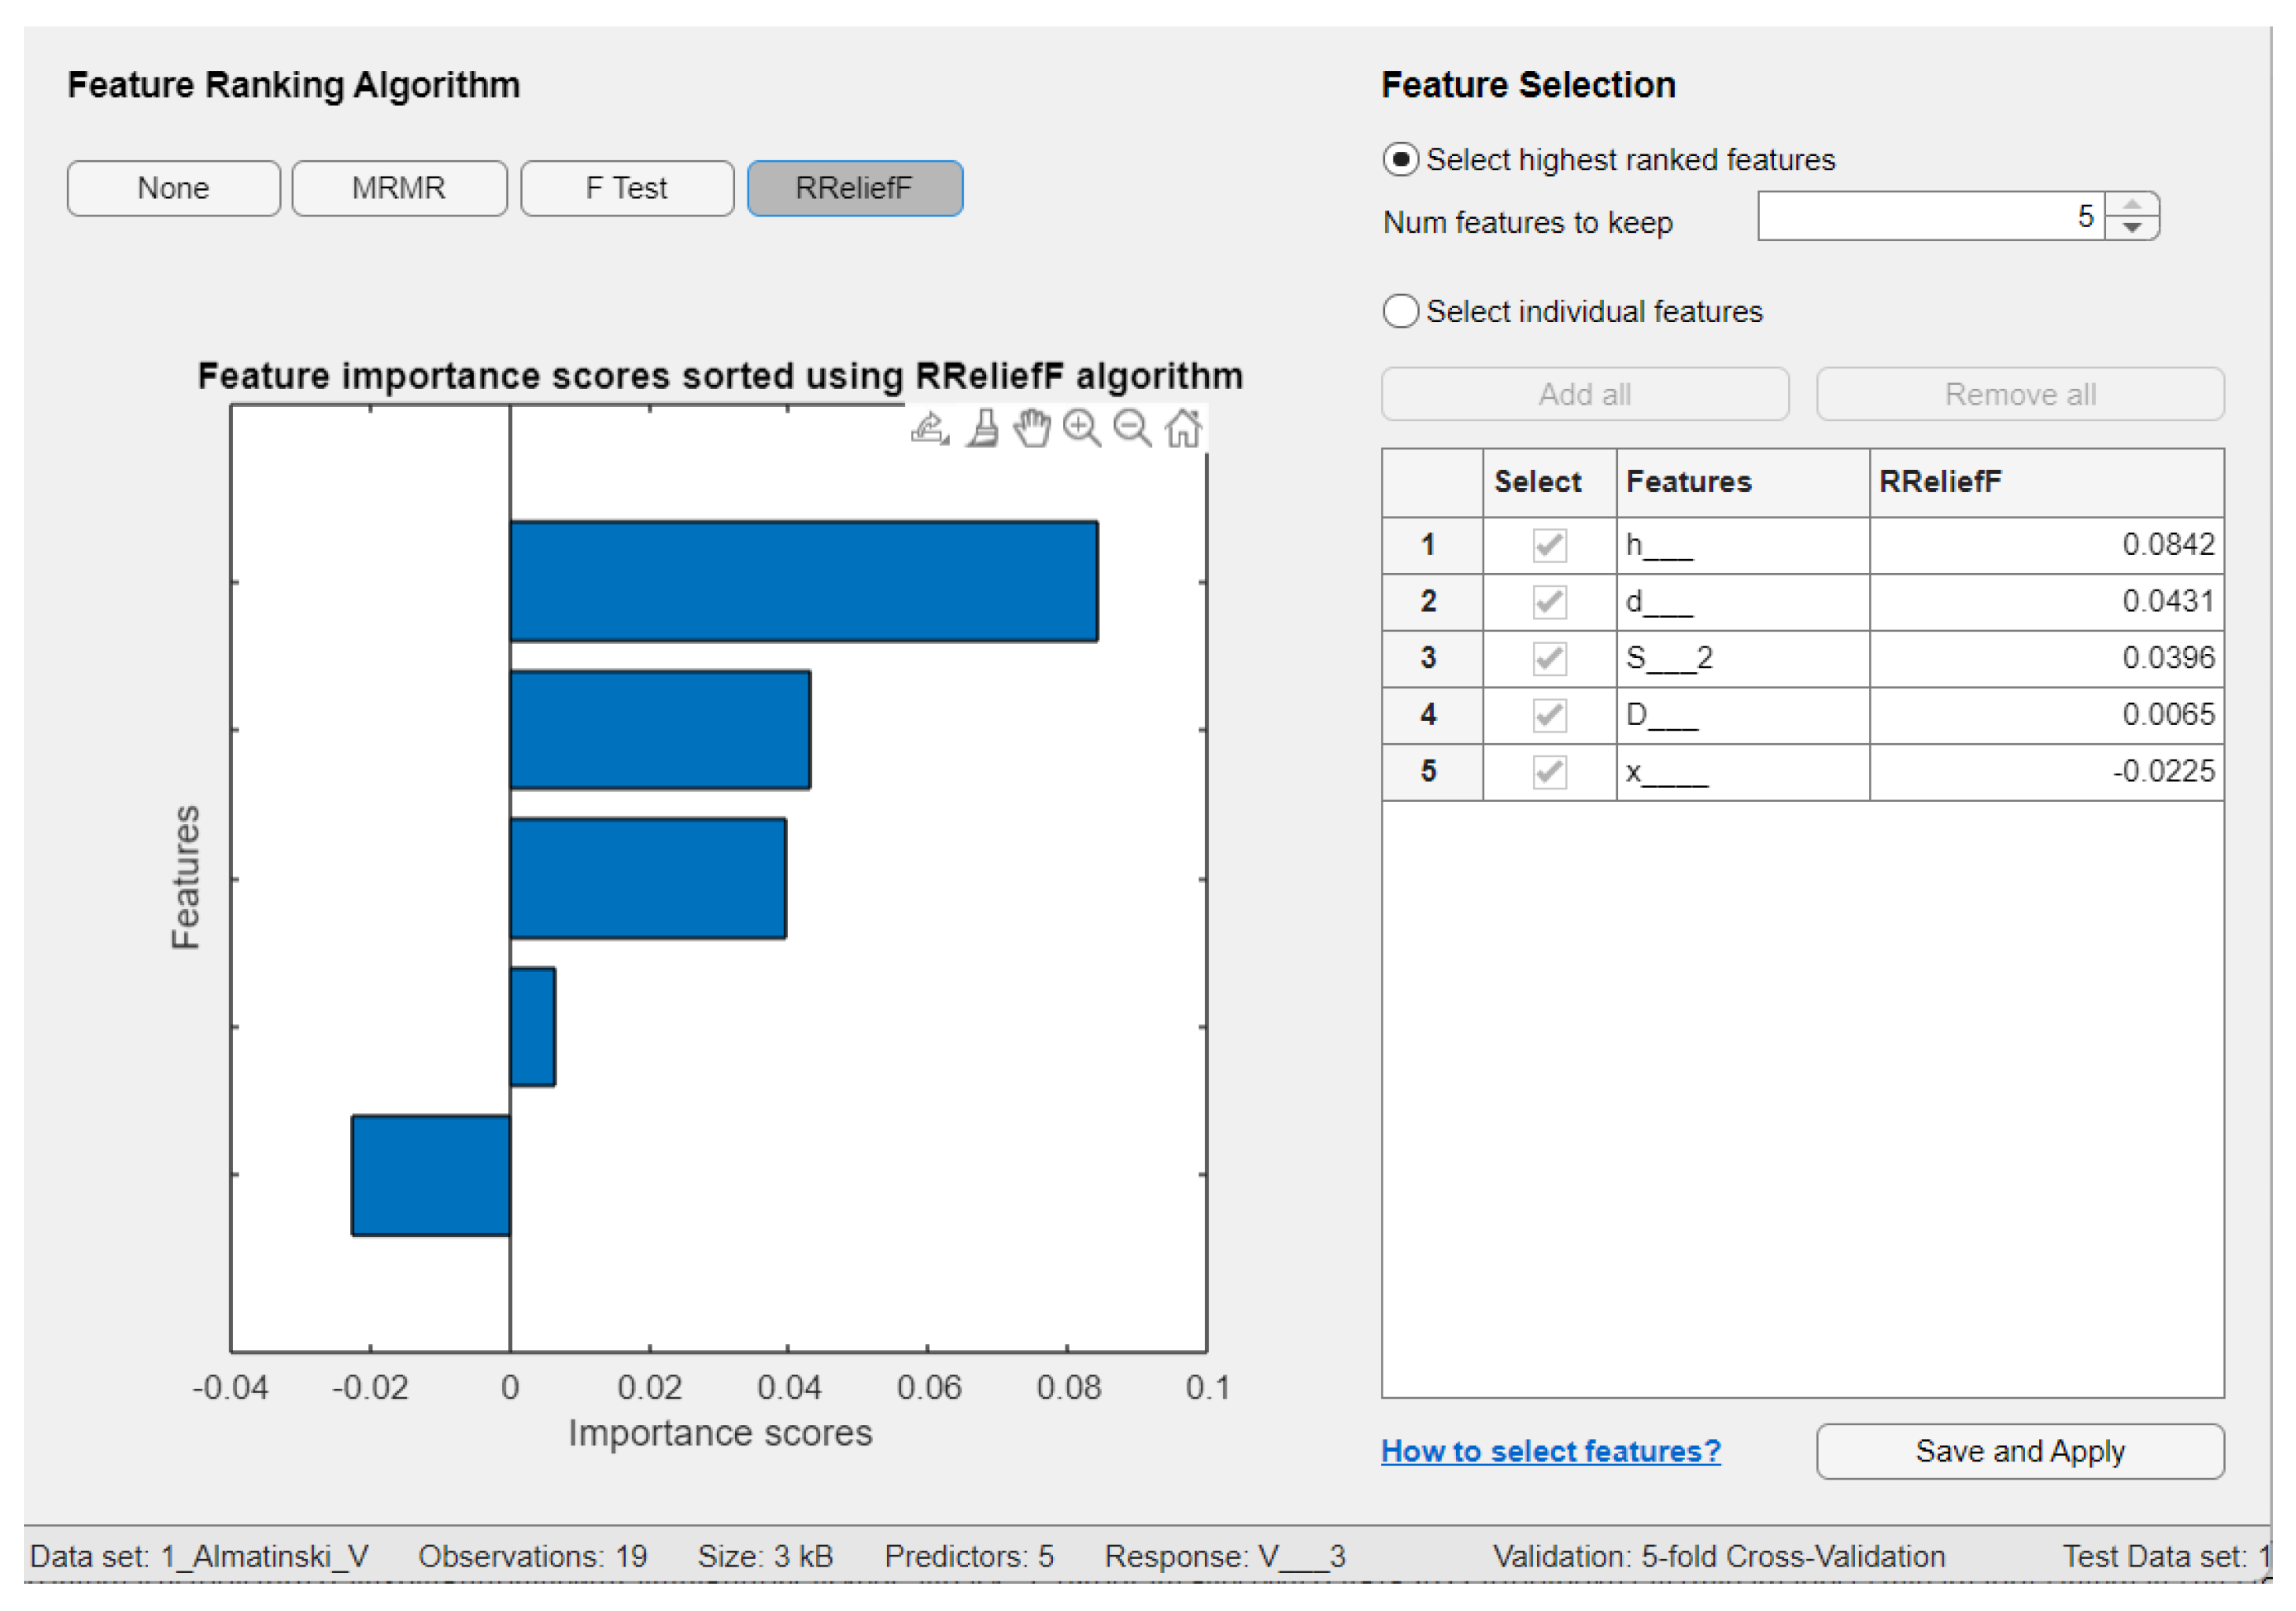
Figure 16.
The predictions with the best trained model for the Aport apple variety for volume.
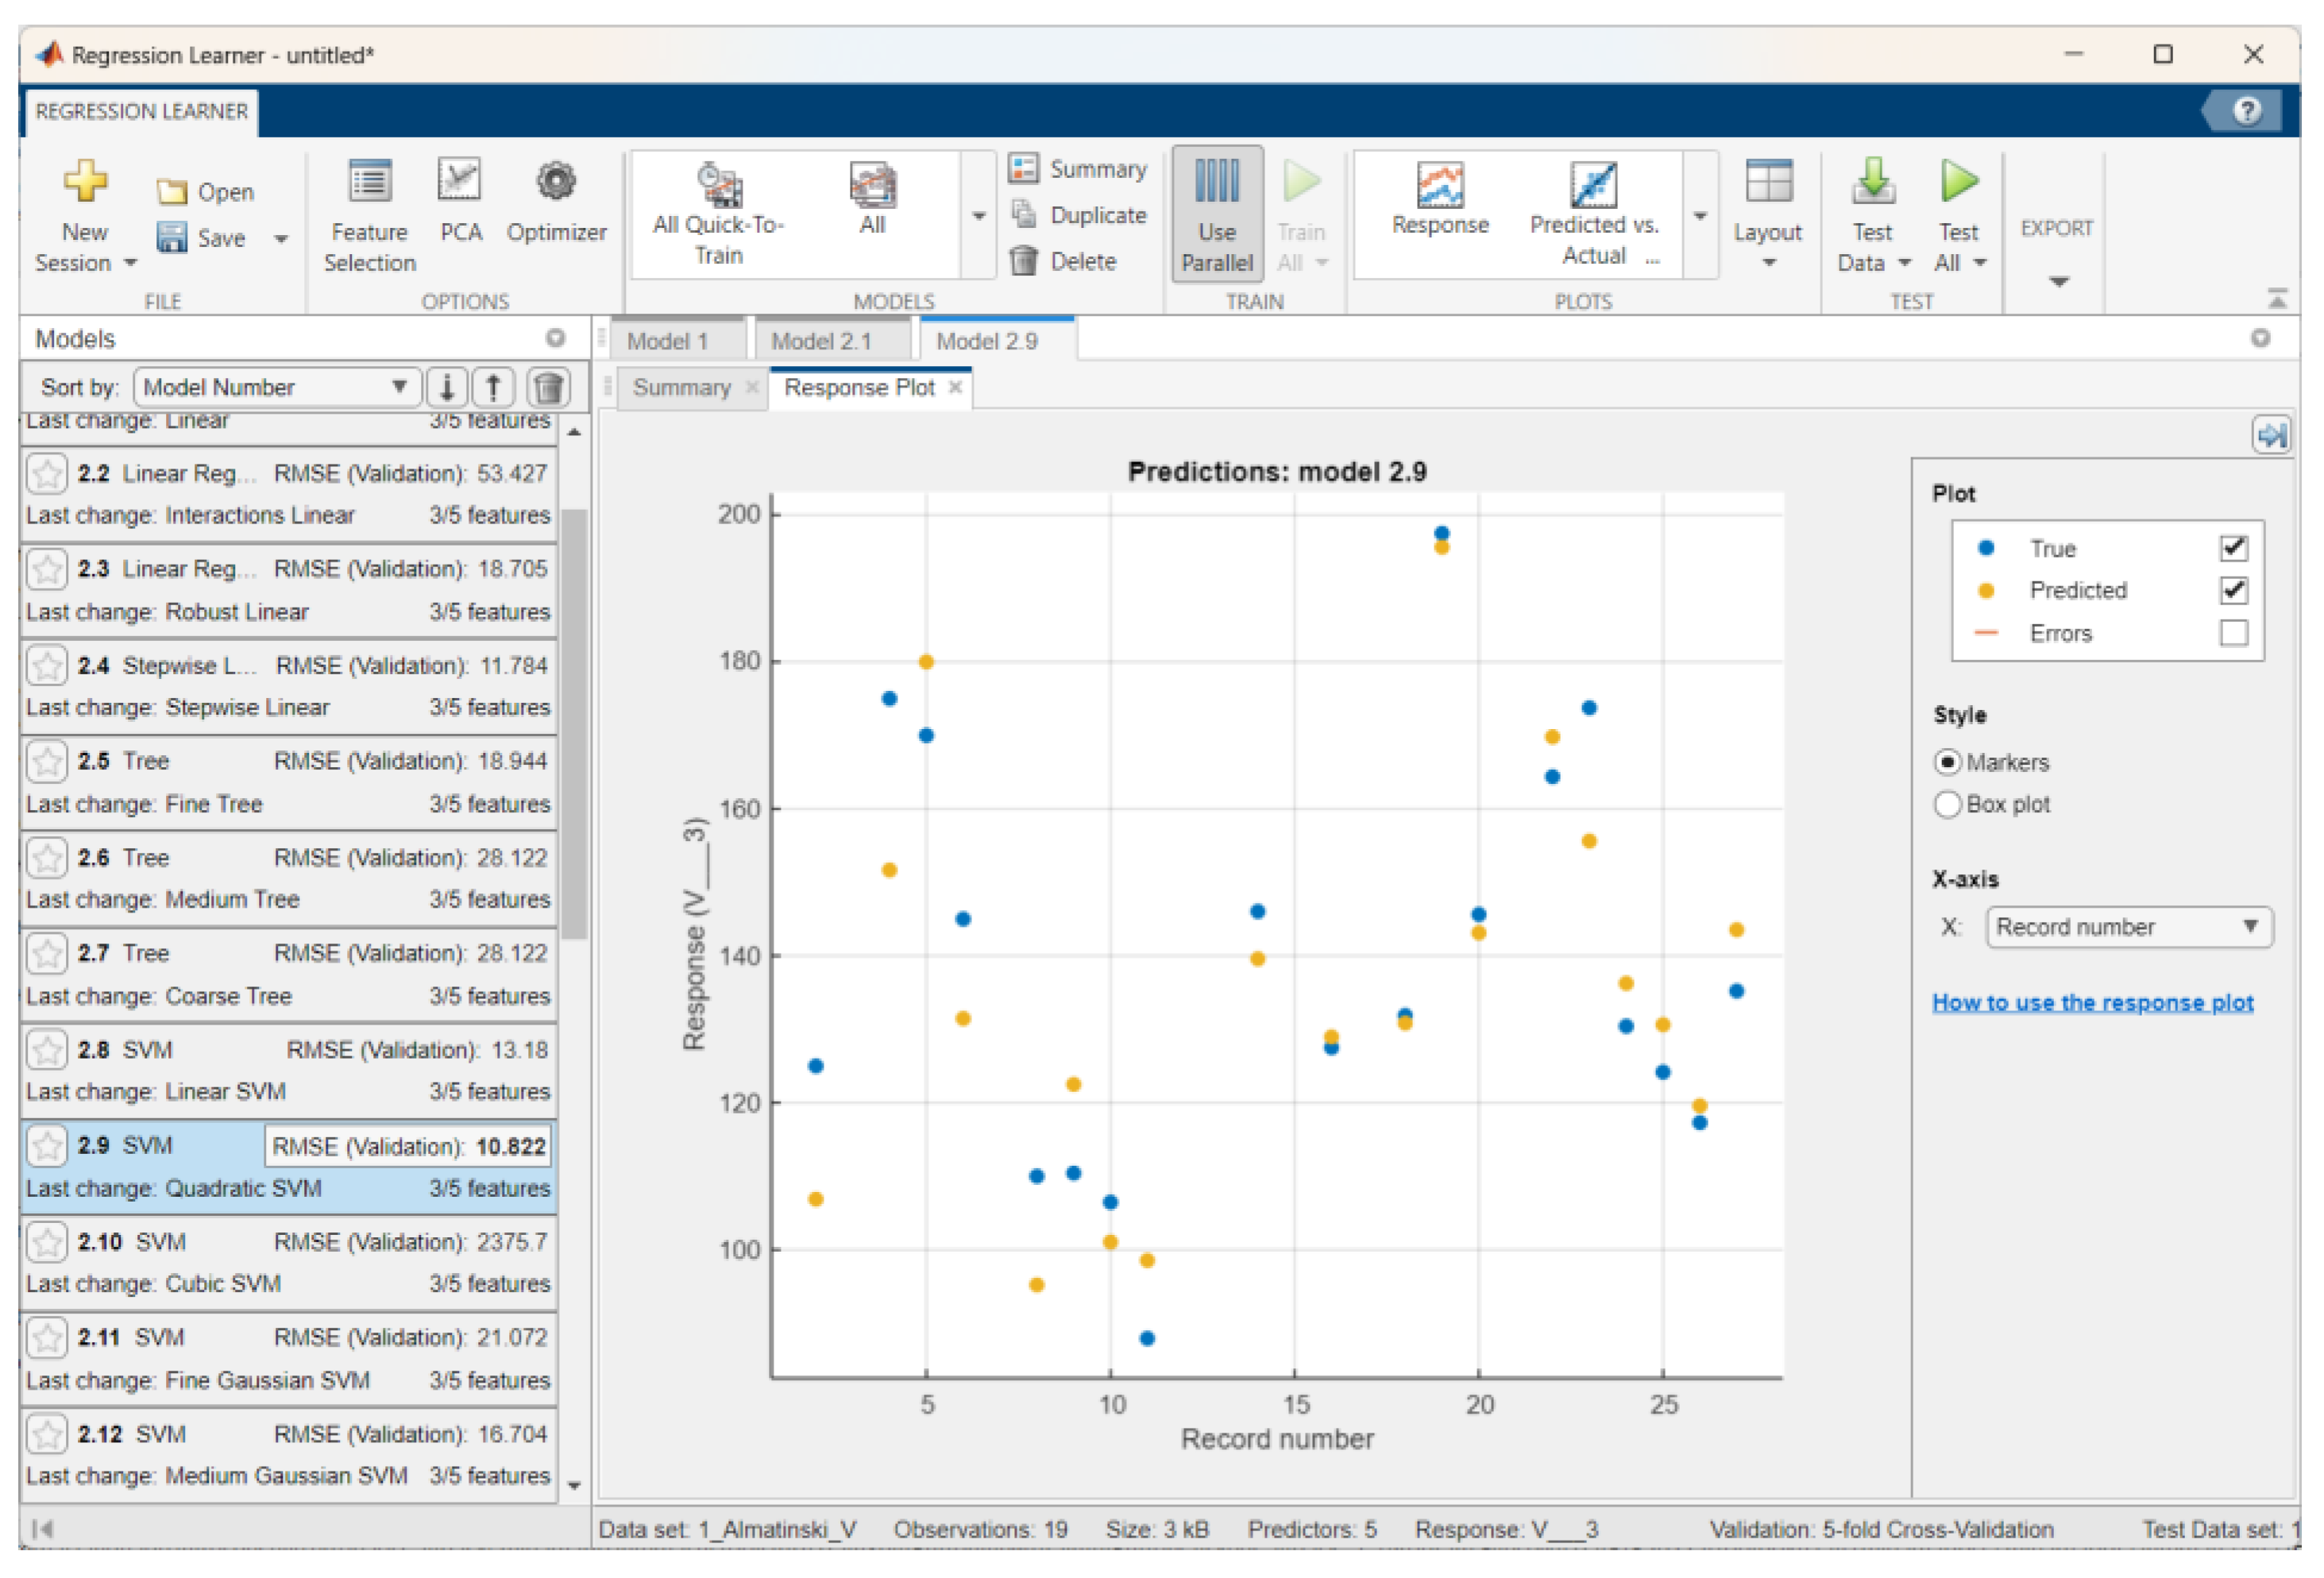
Figure 17.
Predicted vs. actual plot for the volume training set.
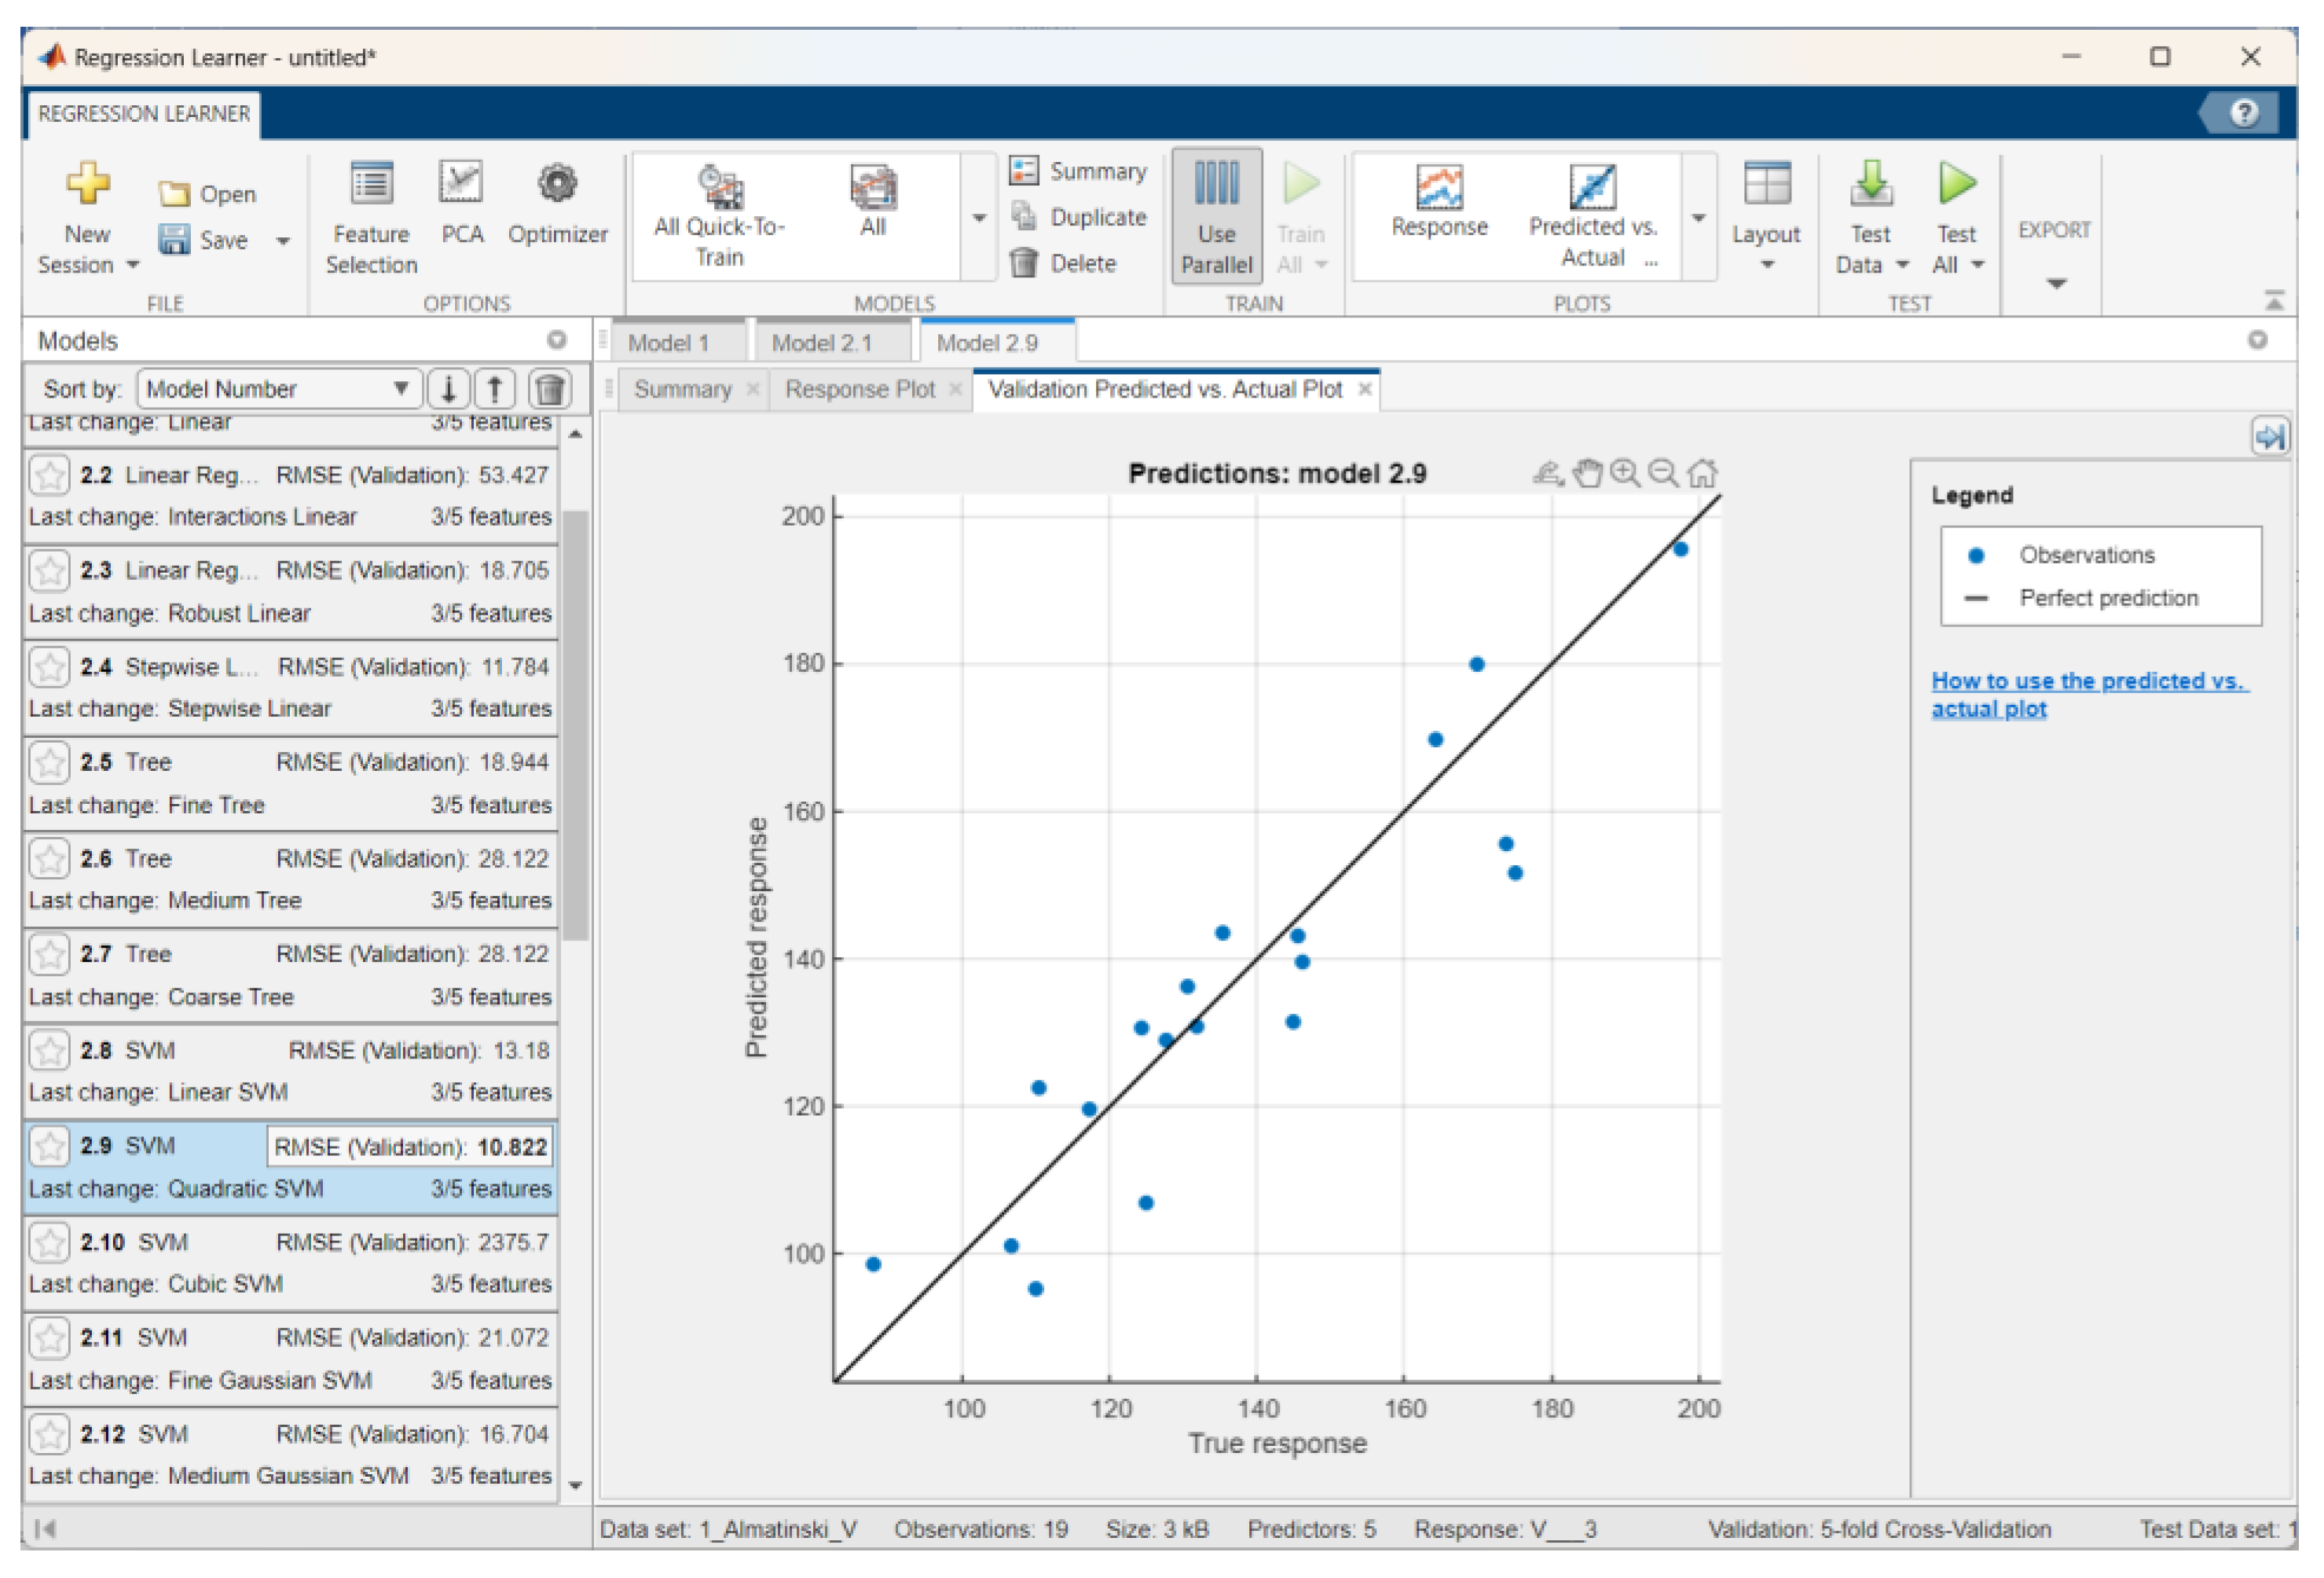
Figure 18.
Residuals plot for volume.
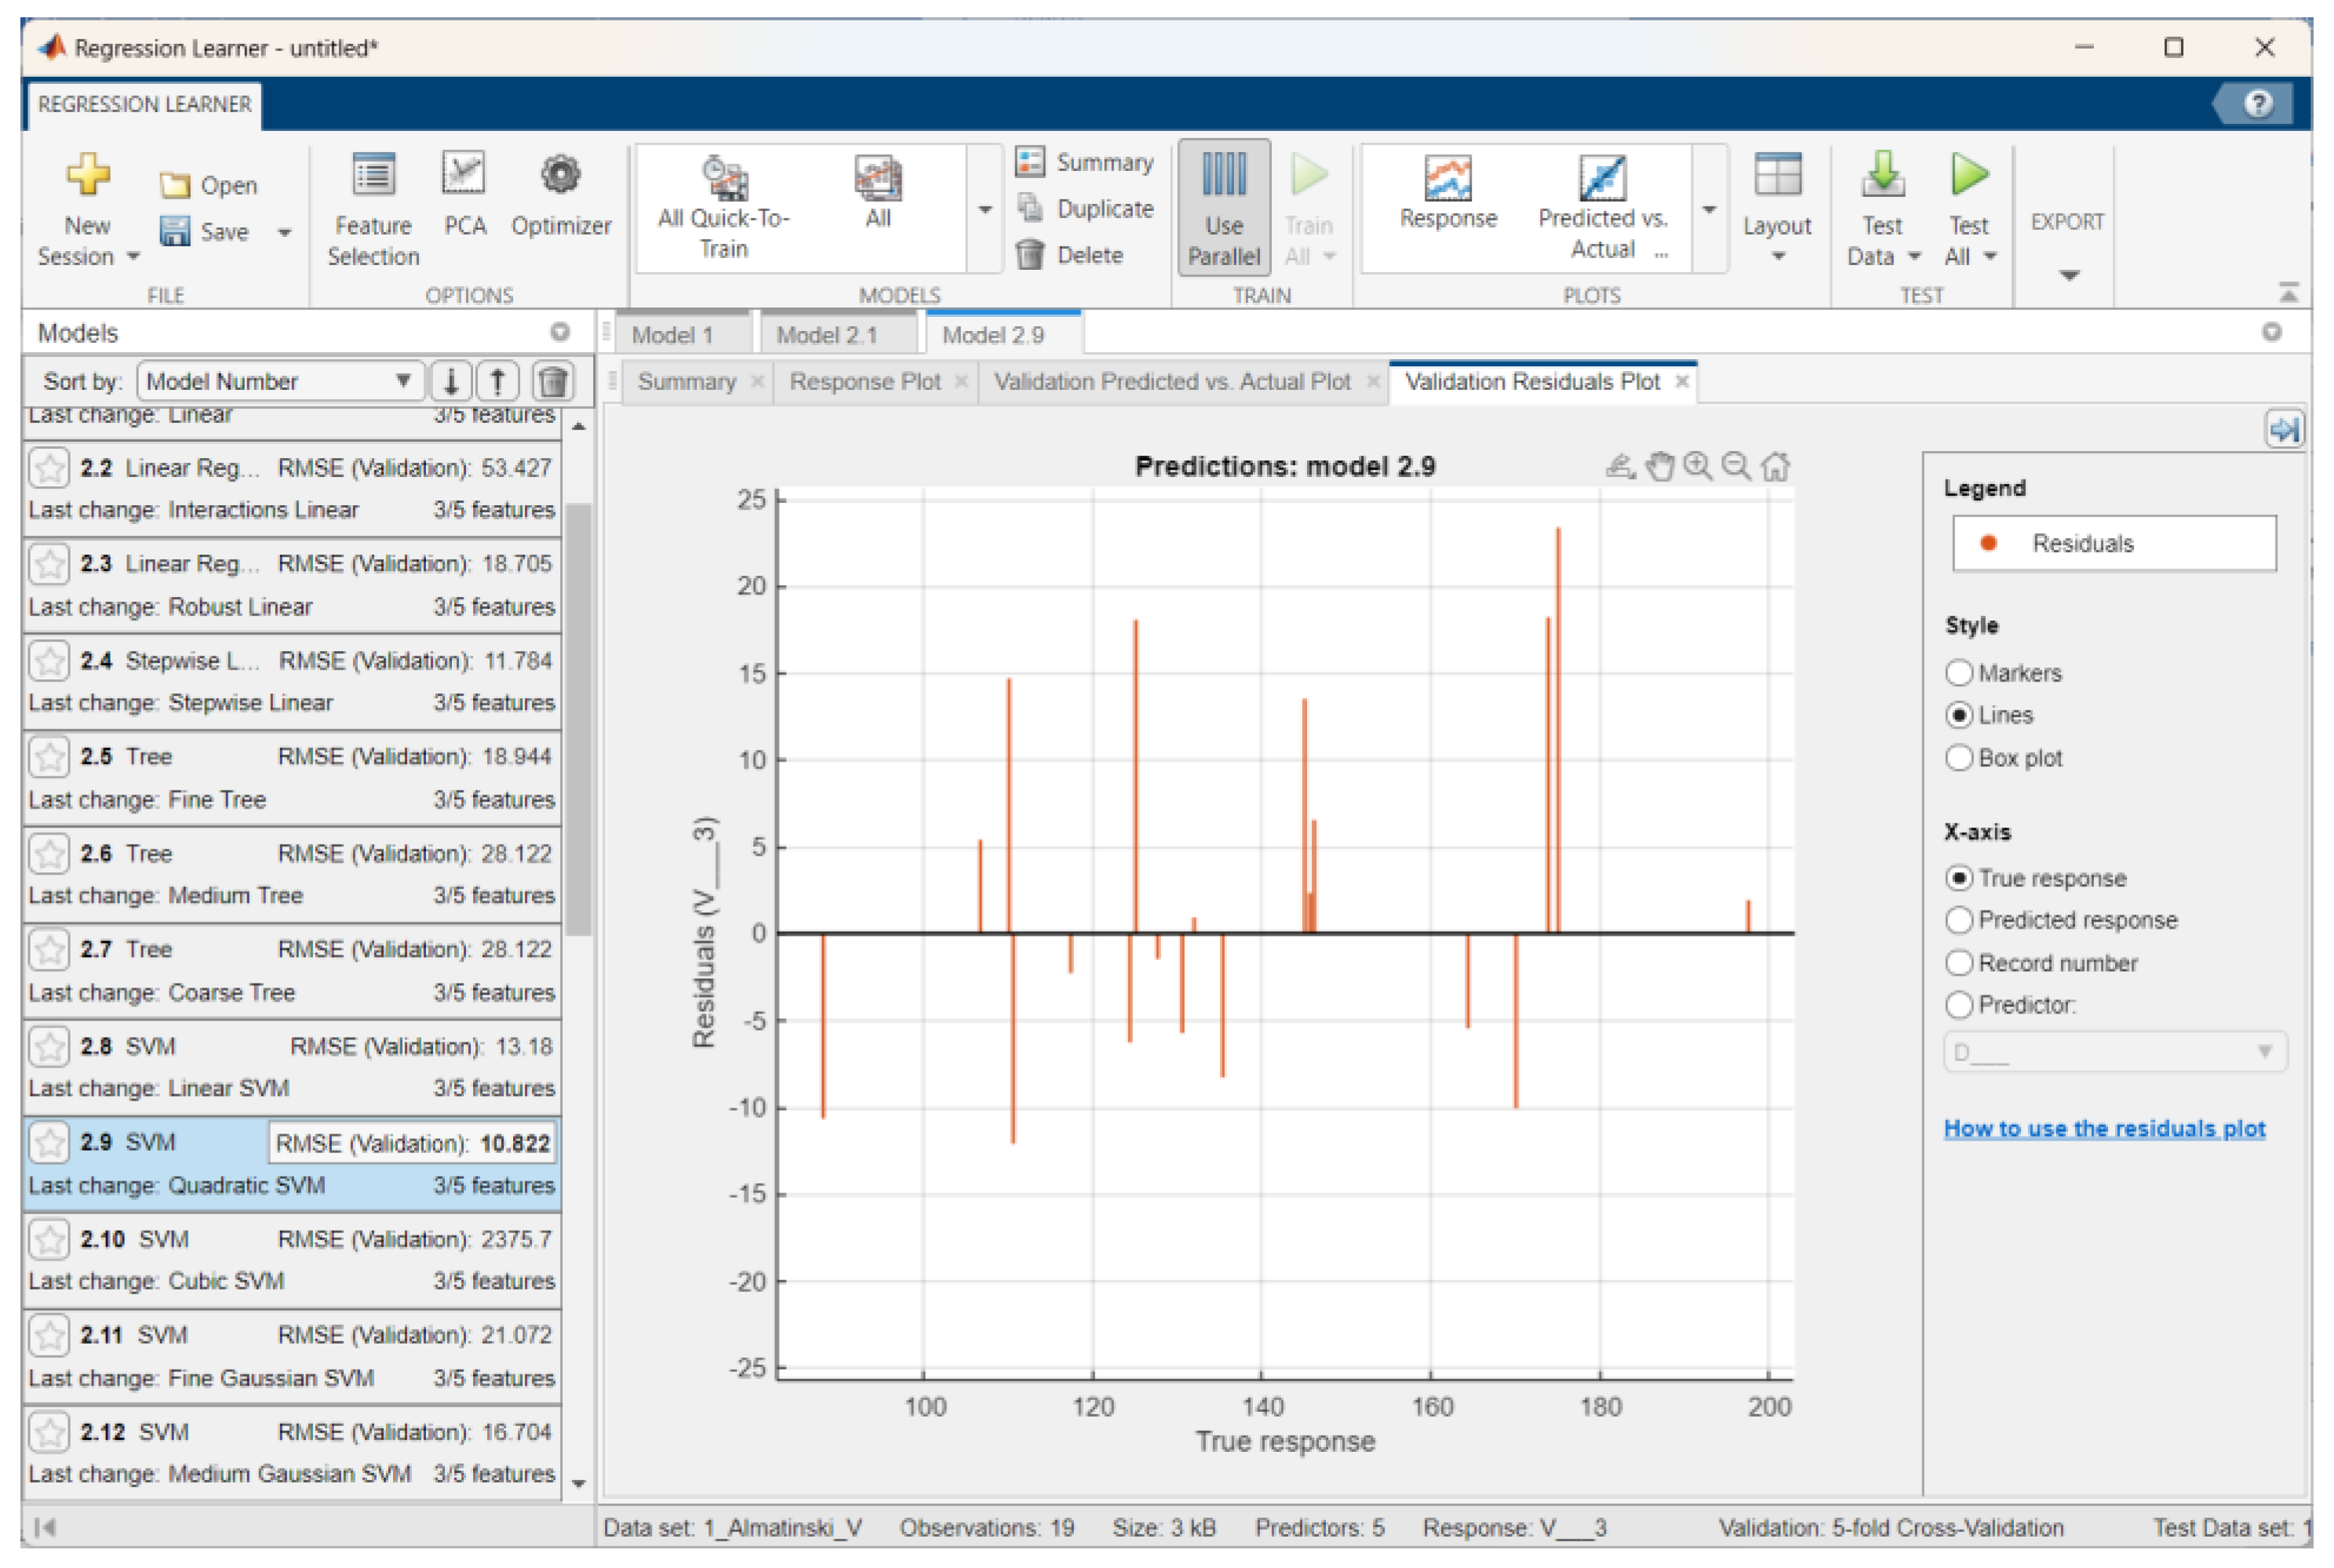
Figure 19.
Predicted vs. actual plot for the volume testing set.
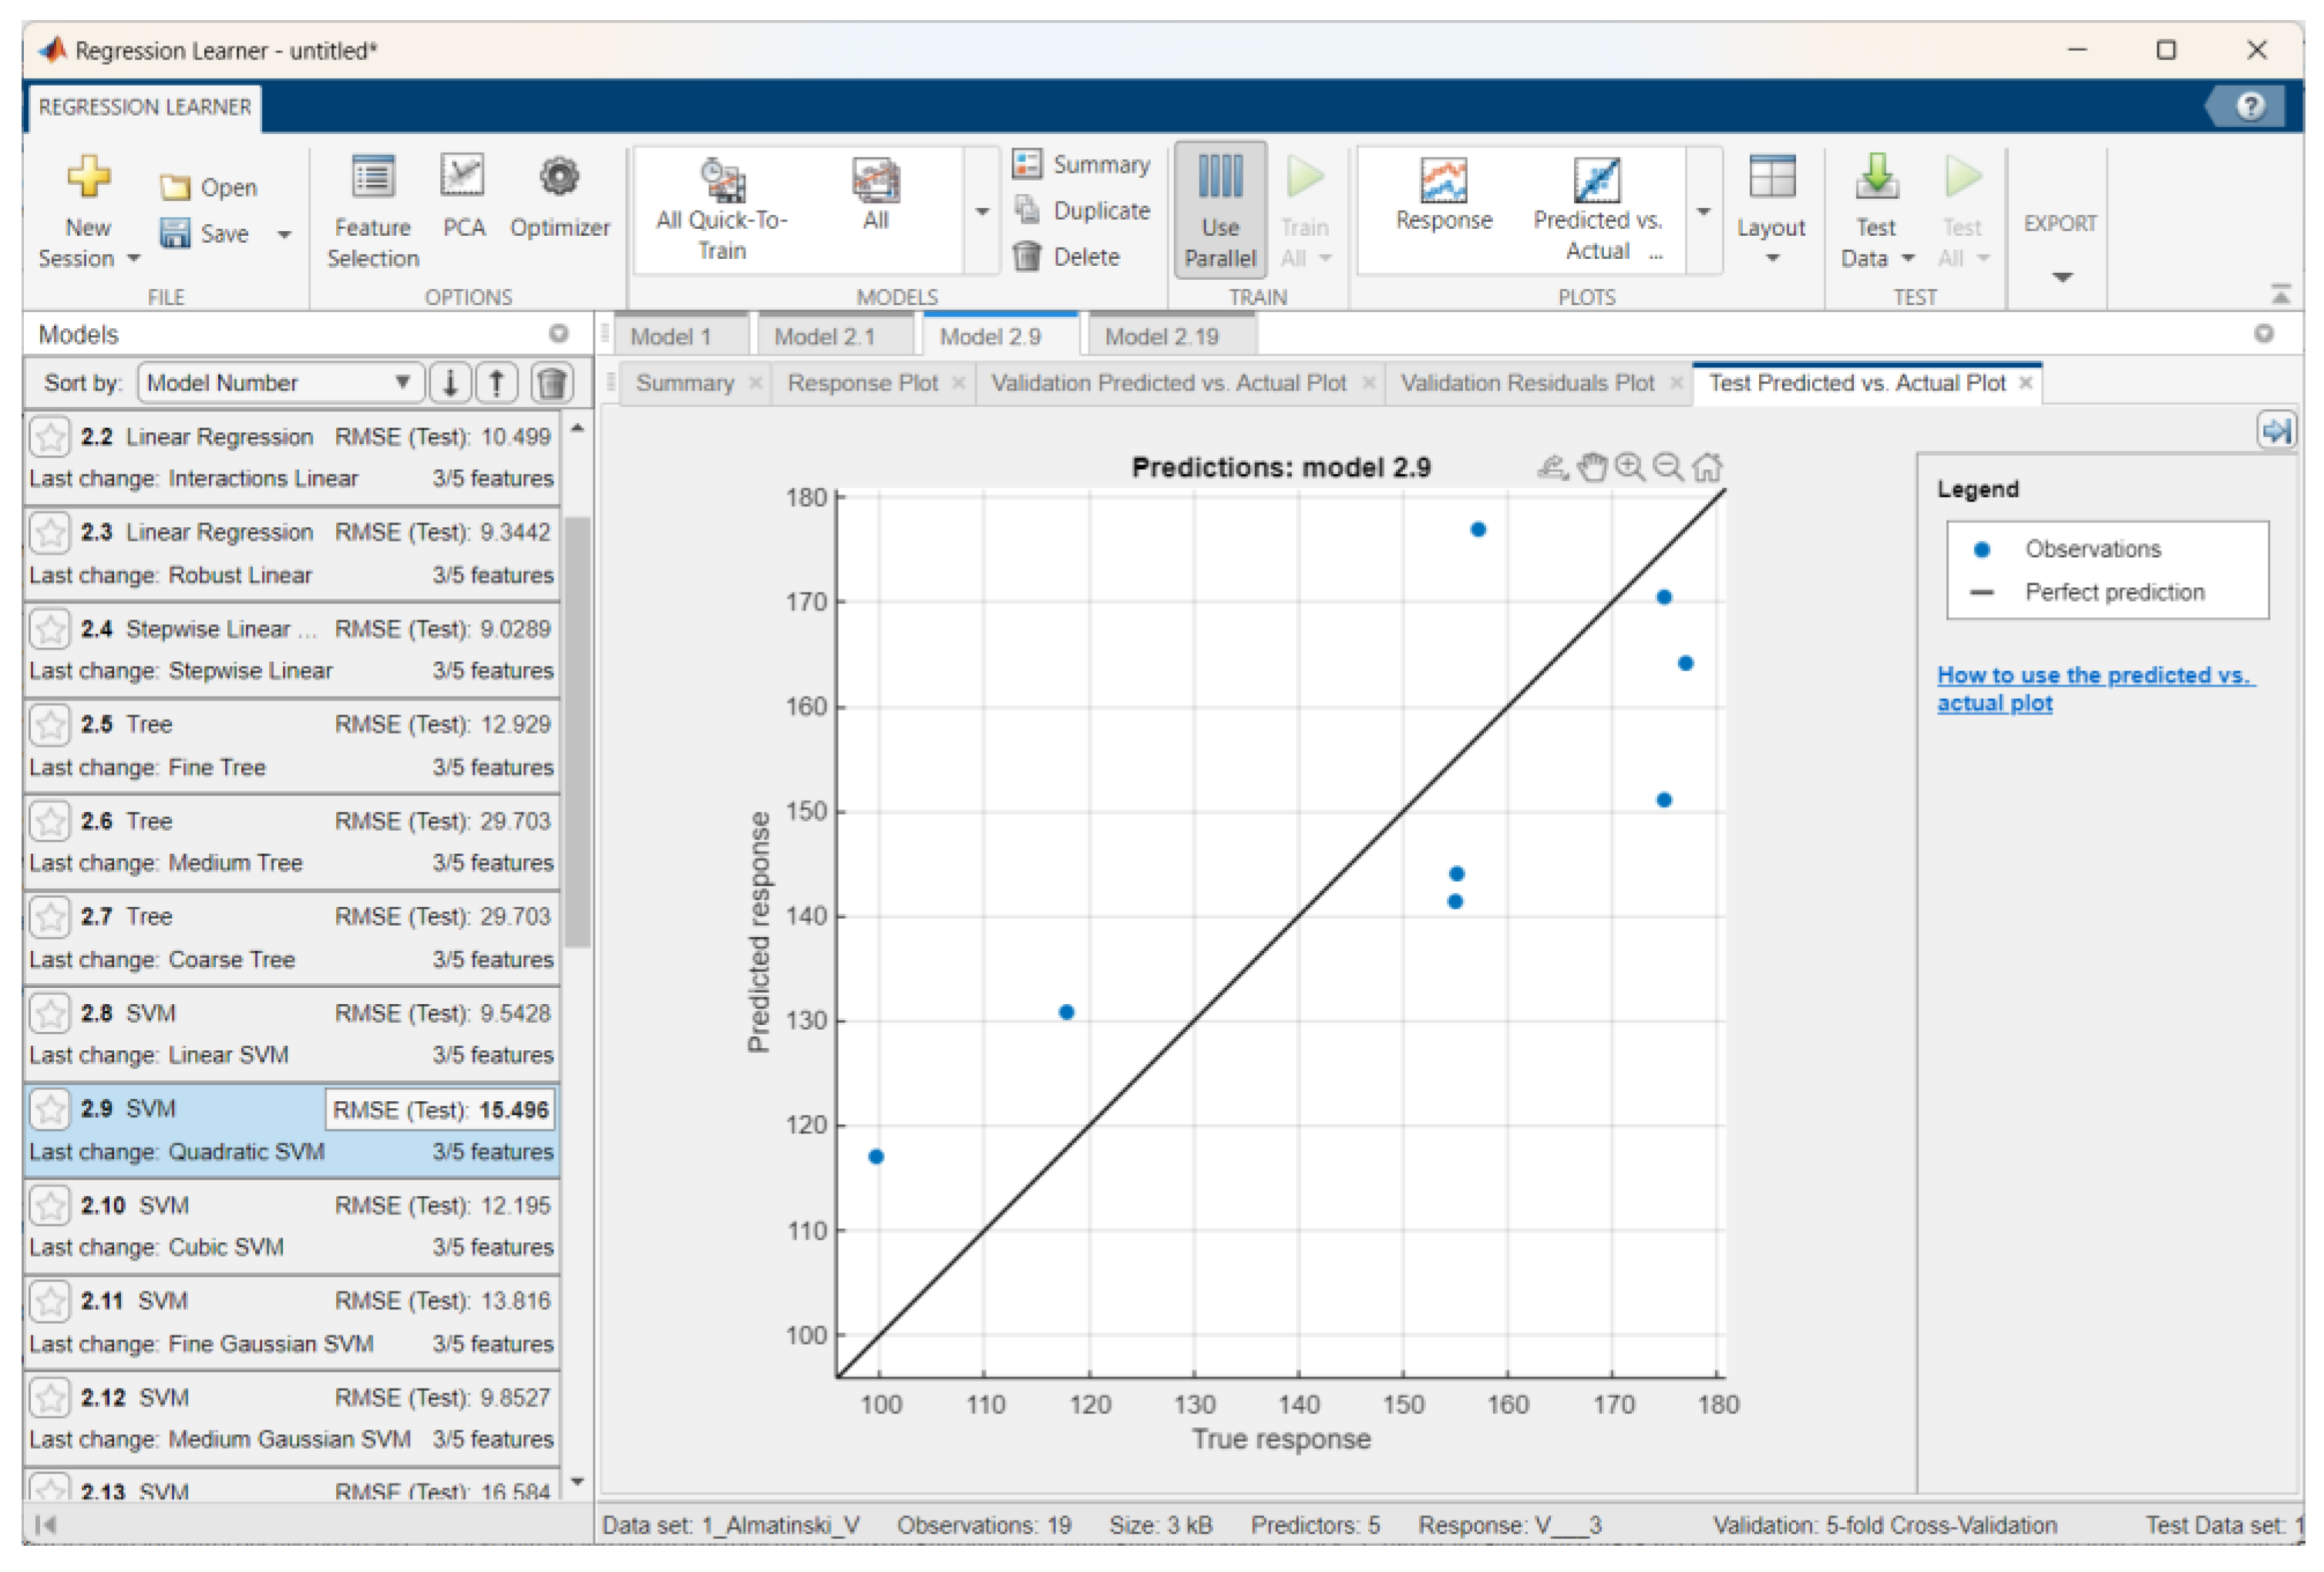

Table 1.
Experimental results.
| Statistical Value | D, mm | d, mm | h, mm | m, gr | V, cm3 | ρ, gr/cm3 | Dк, mm | dк, mm | hк, mm | δr, % | S, cm2 |
|---|---|---|---|---|---|---|---|---|---|---|---|
| Aport Alexander | |||||||||||
| Average value | 63.60 | 78.70 | 76.10 | 163.45 | 208.50 | 0.79 | 63.50 | 78.70 | 76.00 | 54.10 | 48.79 |
| Standard deviation | 5.30 | 4.89 | 3.85 | 23.09 | 34.72 | 0.03 | 5.30 | 4.89 | 3.85 | 8.63 | 6.01 |
| Min | 56.40 | 68.40 | 69.40 | 126.30 | 150.00 | 0.73 | 56.30 | 68.50 | 69.50 | 42.00 | 36.72 |
| Max | 72.40 | 86.40 | 82.40 | 207.19 | 270.00 | 0.84 | 72.30 | 86.40 | 82.30 | 70.00 | 58.59 |
| Sinap Almatynski | |||||||||||
| Average value | 65.60 | 65.00 | 62.00 | 122.17 | 142.10 | 0.86 | 65.50 | 64.90 | 62.40 | 54.70 | 33.62 |
| Standard deviation | 11.44 | 7.96 | 4.25 | 24.40 | 28.24 | 0.03 | 11.44 | 7.96 | 4.25 | 8.84 | 9.32 |
| Min | 35.90 | 54.40 | 55.00 | 77.18 | 88.00 | 0.74 | 35.80 | 54.50 | 55.20 | 40.00 | 23.23 |
| Max | 98.80 | 97.0 | 71.40 | 173.25 | 197.50 | 0.88 | 98.70 | 97.20 | 71.50 | 71.00 | 73.86 |
| Kazakhski Yubileinyi | |||||||||||
| Average value | 53.10 | 67.90 | 65.50 | 138.60 | 167.40 | 0.83 | 53.60 | 67.60 | 65.70 | 57.90 | 36.62 |
| Standard deviation | 6.91 | 6.80 | 5.60 | 28.59 | 34.33 | 0.02 | 6.91 | 6.80 | 5.60 | 10.20 | 7.50 |
| Min | 43.00 | 58.60 | 57.80 | 99.00 | 115.00 | 0.76 | 43.00 | 58.00 | 57.60 | 38.00 | 26.97 |
| Max | 66.50 | 82.70 | 77.70 | 187.00 | 230.00 | 0.86 | 66.50 | 82.50 | 77.80 | 68.00 | 53.72 |
| Ainur | |||||||||||
| Average value | 58.20 | 64.90 | 62.40 | 110.72 | 137.11 | 0.81 | 58.10 | 64.80 | 62.20 | 5.50 | 33.15 |
| Standard deviation | 3.40 | 3.36 | 4.25 | 16.72 | 22.49 | 0.06 | 3.40 | 3.36 | 4.25 | 0.92 | 3.50 |
| Min | 53.40 | 61.30 | 57.10 | 89.86 | 100.00 | 0.72 | 53.30 | 61.50 | 57.20 | 4.00 | 29.51 |
| Max | 66.30 | 72.70 | 73.40 | 152.5 | 190.00 | 0.90 | 66.40 | 72.90 | 73.40 | 7.00 | 41.51 |
| Nursat | |||||||||||
| Average value | 67.70 | 66.00 | 60.50 | 134.16 | 155.83 | 0.86 | 67.80 | 66.20 | 60.20 | 4.17 | 34.44 |
| Standard deviation | 4.72 | 5.54 | 5.20 | 27.48 | 33.61 | 0.02 | 4.72 | 5.54 | 5.20 | 1.09 | 5.80 |
| Min | 60.60 | 56.20 | 48.80 | 86.21 | 100.00 | 0.82 | 60.40 | 56.10 | 48.70 | 2.00 | 24.81 |
| Max | 76.50 | 75.90 | 69.60 | 189.33 | 230.00 | 0.90 | 76.00 | 76.00 | 69.40 | 5.00 | 45.25 |
Table 2.
Absolute and relative errors for geometric parameter measurements.
| Geometrical parameter and error | ||||||
|---|---|---|---|---|---|---|
| Alexander | 0.15 | 0.27 | 0.15 | 0.22 | 0.15 | 0.22 |
| Sinap Almatynski | 0.24 | 0.67 | 0.24 | 0.44 | 0.24 | 0.44 |
| Kazakhski Yubileinyi | 1.70 | 4.12 | 1.70 | 2.99 | 1.70 | 3.03 |
| Ainur | 0.11 | 0.21 | 0.11 | 0.18 | 0.11 | 0.19 |
| Nursat | 0.07 | 0.12 | 0.07 | 0.12 | 0.07 | 0.14 |
| Statistical values of the errors | ||||||
| Average Value | 0.45 | 1.08 | 0.45 | 0.79 | 0.45 | 0.80 |
| Min | 0.07 | 0.12 | 0.07 | 0.12 | 0.07 | 0.14 |
| Max | 1.7 | 4.12 | 1.7 | 2.99 | 1.7 | 3.03 |
Table 3.
Summarized results for assessment of parameter informativeness.
| Feature selection algorithm | mRMR | F−test | RReliefF |
|---|---|---|---|
| Aport Alexander | - | h, d, and S | D, S, and d |
| Sinap Almatynski | D and h | d, S, and h | h, d, and S |
| Kazakhski Yubileinyi | - | h, d, and S | h, d, and S |
| Ainur | - | d, S, and D | h, S, and d |
| Nursat | D, d, and h | h, d, and S | D, h, and S |
Table 4.
The accuracy of the developed regression models for apple weight prediction.
| Training set | Testing set | |||||||
|---|---|---|---|---|---|---|---|---|
| Regression model | RMSE | R2 | MAE | Training time, s | RMSE | R2 | MAE | |
| Aport Alexander | Linear SVM | 12.83 | 0.74 | 11.33 | 2.77 | 10.20 | 0.61 | 7.42 |
| Sinap Almatynski | Stepwise Linear Regression | 7.17 | 0.92 | 6.12 | 1.88 | 4.83 | 0.96 | 4.14 |
| Kazakhski Yubileinyi | Rational Quadratic Gaussian Process Regression | 9.64 | 0.88 | 7.97 | 0.60 | 16.97 | 0.68 | 12.29 |
| Ainur | Linear SVM | 9.09 | 0.70 | 6.64 | 1.71 | 4.96 | 0.92 | 3.84 |
| Nursat | Linear Regression | 10.10 | 0.89 | 8.38 | 4.27 | 8.95 | 0.66 | 6.36 |
Table 5.
Summarized results for assessment of parameter informativeness.
| Feature selection algorithm | mRMR | F−test | RReliefF |
|---|---|---|---|
| Aport Alexander | - | D, S, and h | h, S, and d |
| Sinap Almatynski | d, D, and S | h, d, and S | d, S, and h |
| Kazakhski Yubileinyi | D | h, d, and S | d, h, and S |
| Ainur | D | d, S, and D | h, S, and d |
| Nursat | D | D, h, and δ | D, h, and δ |
Table 6.
Accuracy of the developed regression models for apple volume.
| Apple Variety | Training set | Testing set | ||||||
|---|---|---|---|---|---|---|---|---|
| Regression Model | RMSE | R2 | MAE | Training time, s | RMSE | R2 | MAE | |
| Aport Alexander | Squared Exponential Gaussian Process Regression | 22.75 | 0.65 | 19.66 | 2.26 | 9.38 | 0.92 | 7.65 |
| Sinap Almatynski | Quadratic SVM | 10.82 | 0.85 | 8.81 | 1.44 | 15.49 | 0.66 | 14.49 |
| Kazakhski Yubileinyi | Linear SVM | 11.77 | 0.91 | 9.11 | 1.02 | 13.95 | 0.68 | 11.16 |
| Ainur | Robust Linear Regression | 9.49 | 0.75 | 7.58 | 0.41 | 14.28 | 0.80 | 11.93 |
| Nursat | Linear Regression | 9.84 | 0.91 | 8.12 | 5.28 | 9.65 | 0.92 | 7.96 |
Disclaimer/Publisher’s Note: The statements, opinions and data contained in all publications are solely those of the individual author(s) and contributor(s) and not of MDPI and/or the editor(s). MDPI and/or the editor(s) disclaim responsibility for any injury to people or property resulting from any ideas, methods, instructions or products referred to in the content. |
© 2024 by the authors. Licensee MDPI, Basel, Switzerland. This article is an open access article distributed under the terms and conditions of the Creative Commons Attribution (CC BY) license (http://creativecommons.org/licenses/by/4.0/).
Copyright: This open access article is published under a Creative Commons CC BY 4.0 license, which permit the free download, distribution, and reuse, provided that the author and preprint are cited in any reuse.


