
Submitted:
23 September 2024
Posted:
24 September 2024
You are already at the latest version
Abstract
Solution combustion synthesis (SCS) is often utilized to prepare crystalline nanoparticles of transition metal oxides, in particular Mn oxides. The structure and composition of the final product depend on the conditions of the synthesis, in particular on the composition of metal precursors, its molar ratio to the fuel component, and the mode of heating. In the present work the study of chemical phenomena which may occur in the during SCS process has been studied for the conventional nitrate-glycine synthesis of Mn oxide, as well as for nitrate-citrate-glycine and nitrate-citrate-urea synthesis. In the case of nitrate-glycine synthesis, formation of a weak complex of Mn(II) and glycine provides the conditions of instantaneous SCS reaction upon heating, resulting in slight sintering of final oxide nanoparticles. However, partial hydrolysis of Mn precursor during slow solvent evaporation results in formation of mixture of oxides, namely MnO and Mn3O4. Formation of MnO is completely suppressed in the presence of ammonium citrate in the initial mixture, and pure Mn3O4 phase is obtained. SCS reaction in this case is slower, resulting in stronger sintering of the nanoparticles. The study of electrochemical properties of synthesized oxides demonstrated that the SCS with nitrate-citrate-urea mixture provides the highest charge capacitance in 1M NaOH: 130 F/g at 2 A/g. Impedance characterization of materials allowed to propose a tentative mechanism of degradation of electrode materials during the galvanostatic cycling.
Keywords:
Solution Combustion Synthesis
; Manganese oxide
; Hausmannite
; DRIFTS
; Supercapacitor
1. Introduction
The Transition metal oxides (TMO) are one of the main classes of materials used as electrodes in electrochemical energy storage devices (EESD), in particular in batteries [1,2], and pseudocapacitors [3]. Manganese oxides are historically among the most studied electrode materials for EESD [1,4,5]. In particular, spinel manganese oxide Mn3O4 have been intensively studied in the recent years as a promising electrode materials for pseudocapacitors [6,7,8] and anodes of Li-ion batteries [9,10]. The electrochemical properties of manganese oxides can be adjusted by tuning its composition, by partially or totally replacing one of the cations [5]. Dosaev et al. [11] have prepared a series of AMn2O4 substituted spinels with A=Li, Mg, Cd, thus controllably varying unit cell parameters and the oxidation state of Mn from +2.5 (in Mn3O4) to +3.5 (in LiMn2O4). They have observed a systematic dependence of the electrocatalytic activity of prepared oxides on the oxidation state of Mn.
Solution combustion synthesis (SCS) is known for decades as a low cost, low energy intake and versatile method of preparation of binary and mixed oxides [12,13], such as aluminates [14], chromates [15], manganates [16]. The method allows preparation of well-crystallized mesoporous oxide powders, consisting of particles within the size range from few tens nm to few μm. In SCS, the metal precursor salt, which is most commonly a nitrate, is dissolved in a solution with the fuel component, the most common of which are glycine, urea, sucrose, or citric acid [17]. The solvent is then evaporated until the fuel is ignited at relatively low temperature (100-200 oC), generating heat and resulting in fast decomposition of metal salt. Self-propagating character of the process ensures relatively short reaction time and uniform conditions of the reaction. Decomposition of both nitrates and fuels resulted in the formation of large amount of gaseous products, allowing the heat to be rapidly dissipated, minimizing sintering of solid products.
The main challenge of the SCS is to ensure a control on the morphology and composition of resulting oxide materials due to the complexity of the processes occurring during the synthesis in a short reaction time. In most common version of SCS the nitrates and glycine are used as precursor and fuel correspondingly, and the stoichiometric reactions of their decomposition are often expressed as simple reactions in equations (1) and (2).
The overall stoichiometric equation for the mixture containing glycine and nitrate in the molar ratio of φ is given by equation (3).
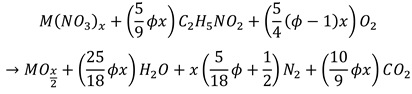 (3)
(3)The above equations are often used for categorizing the composition of initial system as fuel lean (φ<1), or fuel rich (φ>1) mixtures. In particular, when φ=1, the amount of oxygen consumed by glycine combustion is supposed to be equivalent to amount of oxygen produced by nitrate decomposition. In this case no oxygen depletion is expected in the reaction media despite the escape of large amount of hot gaseous products of decomposition.
However, it is also well recognized that the reactions (1) and (2) are oversimplifications of the complex mechanism of decomposition reactions occurring at high temperature of SCS synthesis. Some of the reactions which may occur during the SCS process with Mn(NO3)2 are listed in Table 1. The latter does not list all possible reactions and processes occurring during SCS. In particular, formation of metal complexes with fuel components, for example complexes of Mn with glycine [18] may occur during the evaporation of solvent, and result in change in ignition and adiabatic temperatures for the SCS process. The intermediate and final products of decomposition reactions may undergo phase transitions, also resulting in changes in reaction heat.
In numerous studies the analysis of thermodynamic effects of SCS reaction is done by calculating adiabatic temperature Tad from energy balance equation, taking into account enthalpies of decomposition reactions and phase transitions, and heat loss due to the escape of hot gaseous products [17,23]. This analysis gives valuable qualitative predictions of the dependence of Tad on the composition of initial SCS mixture. However, the maximal temperature detected in SCS process Tmax is systematically higher than predicted Tad values due to (i) uncertainty in thermodynamic parameters of reagents and intermediates of SCS processes and (ii) limitations in modelling of heat dissipation during fast SCS reactions. In order to better understand the nature of SCS processes and being able to adjust the conditions to synthesize the materials with desired structure and composition, a combination of thermodynamic analysis and detailed experimental studies is necessary.
Table 2 summarizes recent studies of SCS synthesis of Mn oxides.
From Table 2 it is clear that the composition and the structure of the final oxide product strongly depends on the conditions of SCS. Namely, the determining composition parameters are the composition of initial mixture, heating ramp, duration, and temperature. However, the effect of these parameters on the composition and structure of final products is not yet understood.
The goal of the present work is to understand better the processes occurring during the SCS synthesis, how they can be controlled, and how they influence the structure of the resulting oxides as well as their electrochemical properties as supercapacitor electrode materials. For this we have performed FTIR characterization of various dried precusors and their mixtures, as well as temperature-dependent FTIR study of their decomposition. Finally, we have tested the electrochemical properties of the formed oxides and evaluated their performance as electrodes for supercapacitors.
2. Materials and Methods
2.1. Synthesis of Mn Oxides
Different synthesis of manganese oxides were performed by varying the fuel-to-precursor ratio as well as the addition or not of a ligand as listed in the following Table 3. The nitrogen adsorption-desorption isotherms of the compounds are presented in the Supplementary Information.
Manganese nitrate tetrahydrate Mn(NO3)2·4H2O from Fischer Scientific (CAS: 20694-39-7, ≥97.5% purity, analytical) is used as the precursor, source of manganese and nitrate. The fuels are, from Thermo Scientific Chemicals, glycine (CAS: 56-40-6, 99% purity) and urea (CAS: 57-13-6, 99% purity, ACS reagent). The additional ligand is anhydrous ammonium citrate tribasic (NH4)3Cit (Sigma, ≥ 97% purity, CAS: 3458-72-8). Depending on the mixture, the reactants are added in a 250 mL Erlenmeyer flask with 10 mL of ultrapure water (18.2 Mohm·cm, TOC < 1 ppb) produced by UltraAnalytique Veolia device. The mixture is agitated for approximately 10 minutes until dissolution of all remaining crystals, followed by a 20 min sonication bath treatment. The Erlenmeyer flask is then placed in an oven at 80°C for 48h for a slow evaporation of the water solvent to obtain a dried xerogel. For the synthesis, the Erlenmeyer flask is placed on an already heated plate at 350°C to undergo auto-ignition. The self-propagating combustion is usually done in 30-60s accompanied by gas evaporation. After letting the flasks to cool down, ultrapure water is added and another step of sonication bath is performed for 5 min to disperse all the obtain particles. The dispersion is then filter and washed using water. Finally, the powder is dried overnight at 80°C prior to characterization. The obtained powder generally yields at 90% according a theoretical 1.0 g of desired phase product (i.e. Mn3O4).
2.1. Physicochemical Characterization of Manganese Oxides
Scanning electronic microscopy (SEM) imaging were done using a Zeiss 2600F microscope with a resolution of 5 nm. The carbon samples were deposited on a conductive carbon tape. X-ray diffraction (XRD) measurements were performed by Bruker D-8 Advance diffractometer with Cu Kα source (λ = 1.54184 Å). ATR-FTIR measurements were done by ThermoFisher IR spectrometer equipped by ATR Smart Orbit setup. Gas adsorption-desorption measurements were done using ASAP 2420 Micrometric analyzer measuring N2 physisorption isotherm at 77 K after degassing the samples at 150 °C for 12 h. Raman spectra were recorded using LabRAM HORIBA ARAMIS spectrometer with CDD detector and laser line from 532 nm / 100 mW (YAG) Laser Quantum MPC600 PSU. X-ray photoelectron spectroscopy (XPS) measurements were done using Multilab 2000 Thermoelectron spectrometer with Al Kα source (λ = 1486.6 eV). Thermogravimetric analysis (TGA) was performed with Q 5000 TA Instrument under air using platinum crucibles from room temperature to 800-900°C with 5°C/min ramp. Temperature-Dependent Diffuse Reflectance Infrared Fourier Transform Spectroscopy (TD-DRIFTS) was performed thanks to Vertex 70 Bruker IR spectrometer (4000 cm-1 to 600 cm-1) equipped with a one-pot sample compartment. The setup is equipped with a homemade chamber (ca. 7 mL of volume) for temperature-controlled analyses with ZnSe windows and a Praying Mantis ™ diffuse reflectance accessory from Harrick. The samples were diluted with KBr prior to analysis in the holder and purged with helium first. Then, the tests were conducted with air flow (5 mL/min) with heating ramp of 2°C/min up to maximum 440°C.
2.1. Electrochemical Measurements
2.3.1. Ink Preparation
First, a certain amount of oxide powder (active material), Vulcan XC-72 (conductive agent) and Nafion 0.5wt% (binder) is considered and all the products are weighted to obtain a 70:25:5 ratio respectively. The active material and conductive agent are mixed together in an agate mortar. Inks are prepared by adding a desired amount of the prepared mixture in a glass vial and the required volume of ultrapure water and Nafion 0.5wt% to obtain a 2 g/L concentrated ink. The ink is then shaken and sonicated in an ultrasonication bath for 20 minutes.
2.3.2. Ink Deposition on Glassy Carbon Rod
The active material was deposited by drop casting onto the surface of a glassy carbon rod electrode of 6 mm radius. The total deposited volume of ink is 75 µL divided by 5 deposition step of 15 µL in which the electrode is dried for 10 minutes in an oven at 80 °C between each step. The loading of active material is approximated to 0.75 mg/cm2. A final deposition of 15 µL Nafion 0.5 wt.% in mixture of lower aliphatic alcohols and water was added and dried to act as a binder.
2.3.3. Three-Electrode Cell Set-up
A three-electrode cell inside a Faraday cage is used for the electrochemical tests. A 100mL 1M NaOH electrolyte is poured in the cell followed by the addition of a platinum wire with a coil end counter electrode in the compartment separated by a fritted and a mercury/mercurous oxide electrode (Hg/HgO) in 1M NaOH internal solution in the compartment separated by Luggin capillary. The solution in the cell is then purged for at least 30 minutes under N2 gas. The glassy carbon rod electrode with active material – the working electrode - is placed in a holder and then placed inside the electrochemical cell in order to only have a contact with the surface of the electrode. The N2 gas is flushing above the electrolyte to keep a controlled atmosphere without O2. The electrodes are connected to a SP-300 potentiostat from BioLogic.
3. Results
3.1. Nitrate-Glycine Synthesis
3.1.1. FTIR and TGA Analysis of Decomposition Processes
Figure 1A shows ATR-FTIR spectra of selected solid products at ambient temperature : the Mn(II) nitrate, Glycine, and their mixtures with different molar ratio φ. The solids were prepared by complete evaporation of water from their aqueous solutions at 80oC for 48h. The attribution of the main IR bands is given in Table 4. In general, the spectra are in agreement with the structure of hydrated Mn(NO3)2 [32] and zwitterion solid glycine [33,34], as reported in the literature. Noticeably, FTIR spectrum of Mn(NO3)2.4H2O shows a complex νOH band in 3200-3600 cm-1 region, containing several contributions. In symmetrical octahedral structure of Mn(NO3)2.4H2O complex the position of all water molecules is equivalent [35]. Thus, the complex nature of νOH band is due to a different coordination energy of water ligand forming H-bonds between themselves and with nitrate ligand. In particular sharp νOH band at ≈3350 cm-1 can be attributed to H2O ligands weakly coordinated by intermolecular hydrogen bonds, while broader band located at lower wavenumbers is associated with water ligand forming long-range order intermolecular H-bonded network.
The IR spectrum of dried nitrate-glycine mixtures contains the similar IR bands of nitrate ligand (ν1-ν6) as Mn nitrate nearly at the same positions. The νOH band is gradually distorted as the ratio of glycine-to-nitrate φ increases : for φ=2 relatively broad band centered at ≈3500 cm-1 is observed, indicating disruption of the network of H-bonded water ligands. On the other hand, the IR bands of glycine are modified and shifted in the presence of Mn(II) nitrate comparing to pure glycine. Most remarkable is the absence of the peaks of δs(NH3+) at 1510 cm-1 and ρ(COO-) at 610 cm-1, and wider separation of peaks νa(COO-), which shifts from 1604 cm-1 to 1633 cm-1, and νs(COO-) , which shifts from 1412 cm-1 to 1390 cm-1. We attribute these changes to the formation of Mn-Gly complex [36,37] after the drying step, which also have been previously suggested [38] as a part of a mechanism of Mn nitrate-glycine SCS. Considering the presence of non-modified IR peaks related to NO3- in the spectrum of the mixture, and stoichiometry between nitrate and glycine, one may tentatively suggest the formation of [Mn(gly)(H2O)4](NO3)2 or [Mn(gly)(H2O)2](NO3)2 complex after drying step. It is not possible to evaluate more exactly the composition of the dried solids based on only ATR-FTIR data.
TGA curves of in air decomposition of Mn nitrate - glycine mixture also differs from the curves of pure solids (Figure 1B). In order to have more detailed interpretation of the processes happening during these decomposition reactions we performed temperature dependent DRIFT analysis of the composition of Mn(II) nitrate, Glycine, and their dried mixture (Figure 2). The interpretation of DRIFT spectra and TGA curves is given below.
3.1.2. Mn(II) Nitrate (Figure 2A)
As TGA curve shows, in the range from ambient temperature to ca. 100-120 oC there is a gradual dehydration of Mn(NO3)2.4H2O; the weight loss at 120 oC correspond to the loss of two molecules of H2O par nitrate, i.e. formation of Mn(NO3)2·2H2O. The IR peaks of nitrate remaining nearly unchanged in this temperature range, while peaks of ν(OH) at 3400 cm-1 and δ(HOH) at 1650 cm-1 are gradually disappearing. In the range 120oC-180oC the weight loss is accelerating, reaching Mn(NO3)2·H2O stoichiometry at 140-150 oC. At ca. 180 oC the weight loss correspond to anhydrous Mn(NO3)2; however, it is not possible to exactly evaluate the stoichiometry of remaining solid above 150 oC, because of the onset of low-temperature Mn(NO3)2 decomposition assisted by water evaporation [19]. In fact, anhydrous Mn(NO3)2 decomposes only at temperatures above 200 oC [19,39], while decomposition of hydrated complex starts at ≈150 oC.
The IR peaks related to nitrate are changing in the range 120-180 oC: the intensities of peaks ν1-ν4 in the range 1300-1600 cm-1 is decreasing, and the peaks are gradually transforming into a strong single IR peak centered around 1380 cm-1. The latter peak remains relatively strong up to high temperature (above 500 oC). Similar changes in nitrate IR bands have been observed for alkaline metal nitrates above melting point [40], and explained by fusion of nitrate salt. The nitrate IR bands remaining even at high temperature have been observed before [41] and attributed to the remaining traces of nitrate, most probably, in a molten state. We note also that this strong band at 1500 cm-1 is absent in the ATR-FTIR spectra of final product after filtering, washing, and drying.
The weight of nitrate sample is stabilized at ca. 220 oC at the value of 35% of initial mass, corresponding to the formation of MnO2. At t>550 oC there is additional 5% of weight loss indicating transformation of MnO2 to Mn2O3. Reported results are agreement with reported studies of Mn(NO3)2 thermal decomposition [20,39,41]. The weight loss measured at transformation of dehydrated Mn(NO3)2 to MnO2 allowed to suggest formation of unstable intermediate of oxonitrate MnOx(NO3)2-x at ca. 180 oC [20,41]. However, no direct experimental evidence of formation of this intermediate were ever reported. Neither presented DRIFT spectra also allow to claim or to reject the observation of oxonitrate intermediate.
It is important to note that the main gaseous products of hydrated Mn(NO3)2 decomposition at 180 oC are NO2 and NO, and N2O in a smaller quantities [41], while O2 is produced in significantly smaller amounts comparing to nitrogen oxides. A noticeable amount of oxygen is formed around 500oC and again above 600 oC due to transformation of MnO2 first to Mn2O3 and then to Mn3O4. Nevertheless, the total amount of oxygen produced by Mn nitrate decomposition is smaller than stoichiometric. This is an important observation, considering that for the calculation of fuel-to-salt ratio φ is typically based on the assumption stoichiometric quantity of oxygen produced by decomposition of nitrate. Considering this uncertainty in the stoichiometry of O2 production from nitrates decomposition it makes more sense to calculate the value of fuel-to-salt ratio φ simply as a molar ratio of nitrate and fuel precursors, rather than base it on the stoichiometry of reactions (1)-(3).
For the comparison with the decomposition of nitrate-glycine mixture, it is important to note now that, according to the thermodynamic analysis of thermal decomposition of hydrated Mn(NO3)2, that dehydration of Mn nitrate requires relatively low activation energy (ca. 60 kJ/mol), while its decomposition have much higher activation barrier (210 kJ/mol).
3.1.3. Glycine (Figure 2B)
There are no changes in the structure of glycine below ca. 220 oC, as indicated by no weight losses in TGA, and no changes in DRIFT spectra. However, in the range 220-230 oC there is a significant weight loss of ca. 50%. In DRIFT spectra one observes new pair of peaks at 1640 cm-1 and 1680 cm-1, and broad peak at 3300-3500 cm-1, which can be attributed to ν(C=O) of primary and secondary amides, and ν(N-H) of amides. The analysis of gaseous products of glycine decomposition at temperature 220-230 oC demonstrated formation of NH3 [21] as well as H2O and CO2, while liquid phase products various amides (formamide, acetamide, N-butylacetamide, n-butyramide and propionamide) and diones [22]. We propose that at to>220oC, zwitterion structure of glycine is disrupted, and glycine is losing some of amino groups, producing gaseous ammonia while remaining amino groups are involved in formation of oligomeric amide-types intermediates [22].
At temperatures above 230oC one observes continuous weight loss which is completed at ca. 620 oC, when no solid residues are remaining. In DRIFT spectra in this temperature range one observes gradual decrease of all observed IR peaks. The strongest remaining peaks are detected in the range of 3000-3150 cm-1 (broad peak) and 1640 cm-1. The appearance of these peaks is similar to the IR spectra of formamide and acetamide, and can be attributed to ν(N-H) and ν(C=O) in amides, thus confirming the formation of various amides as a products of glycine decomposition [21]. The amides and diones are the main products of glycine endothermic decomposition in oxygen-lean atmosphere [21,22].
It is noteworthy that the TGA behavior of dried glycine below 230 oC is the same in air, as observed in the present work, and under the N2 [42]. The main difference occurs at higher temperatures: under N2 the remaining weight is above 20% even at 900 oC, while it drops to 0% above 600 oC in air. Thus, the presented TGA and DRIFT data allow to suggest that the thermal decomposition of glycine in air also proceeds via first endothermic formation of amide-type intermediates, similarly to oxygen-lean atmosphere. However, in air these intermediates are eventually oxidized at temperatures above 230 oC, and totally decomposed above 600 oC.
Kinetic studies of glycine decomposition gave evidences that the first step (glycine to amides transformation) is a topochemical reaction, requiring formation of reaction nucleation sites, and certain incubation period, the length of which depends on the temperature [21]. After the induction period, the rapid growth of decomposition rate is observed, which may explain relatively sharp weight loss detected by TGA at 220 oC. Then the rate of decomposition is reaching the constant plateau, limited by the rate of reaction propagation. The second step of decomposition above 230 oC follows the kinetics of solid state thermal decomposition [42], and is characterized by relatively high activation energy (150-159 kJ/mol) [21,42].
3.1.3. Nitrate-Glycine Dried Solid Mixture (φ=1) (Figure 2C)
Thermodynamic [43] and polarographic [44] studies suggested that glycine forms relatively weak complexes with Mn2+, comparing to other cations, such as Cu2+, and Zn2+. Above the temperature of dehydration, the Mn-Gly complexes are decomposing into products, similar to pure glycine. However, the temperature of dehydration of complexes may be somewhat higher than that of pure glycine [18].
In the temperature range from ambient to 170oC one observes slow weight loss of the mixture glycine-nitrate, simultaneous with strong decrease in intensity of ν(OH) broad peak at 3450-3600 cm-1. One may suggest that dehydration of the mixture occurs in this temperature range, similar to one observed in the case of pure Mn(NO3)2.4H2O. The weight loss at 170 oC is ca. 6%, corresponding to the loss of one H2O entity of [Mn(gly)(H2O)4)(NO3)2 (5.5%) or [Mn(gly)(H2O)2)(NO3)2 (6.2%): the accuracy of our TGA measurements does not allow to distinguish between two possible compositions of dried solid mixture of nitrate-glycine.
At 170 oC very sharp weight loss is detected. This temperature is below the onset of decomposition of pure glycine (220 oC), suggesting the decomposition of glycine complex of Mn formed upon drying step. The weight loss during the decomposition of this complex is remarkably sharper than in the case of decomposition of pure nitrate or glycine, and points to auto-catalytic character of the decomposition. Contrary to the endothermic decomposition steps of pure Mn(II) nitrate and glycine, the decomposition of Mn glycine complex is exothermic (inset of Figure 1B), which may explain autocatalytic kinetics of the reaction. Alternatively, the products of initial decomposition of the complex, in particular ammonia and water vapor, may act as a catalyst of further decomposition of Mn glycine complex. In TGA curves the weight drop to ca. 5% of mass, which remains stable up to 600oC, and can be attributed to solid Mn oxide. The remaining mass is significantly lower than one expected for MnO2 (29.6%) or Mn3O4 (26.0%), undoubtedly indicating the loss of solid products due to eruptive evolution of gas products of decomposition.
Interestingly, the DRIFT spectra do not demonstrate the same sharp changes in bands appearance. It may be related to the fact the DRIFT analysis is performed with the solids mixed with KBr as a mean to adjust the intensity of IR signals. Dilution of the solid mixture by a neutral component changes the conditions of reaction self-propagation. Another interesting point is that contrary to decomposition of pure glycine, no clear indication of formation of amide-related IR peaks (ν(N-H) at 3300-3500 cm-1, and ν(C=O) at 1640-1680 cm-1) during the decomposition of its complex with Mn(II) have been observed, indicating different mechanism of decomposition of pure glycine and glycine as a ligand in the complex with Mn(II).
3.2. Analysis of the Products of SCS with Nitrate-Glycine Mixture
XRD diagrams of manganese oxides synthesized by nitrate-glycine SCS method are depicted in Figure 3 for varied fuel-to-salt φ ratio. In the case of nitrate-glycine mixture, for all φ values, a mixture of oxides has been obtained. All oxides demonstrated typical mesoporous structure of partially agglomerated oxide nanoparticles with the size in the range 25-40 nm (Figure 3B).
At low φ<1, Mn2O3 is the main phase, while for φ≥1, Mn3O4 + MnO mixture is formed. The same trend of formation of more reduced oxide for higher φ had been observed before [26,45]. According to Mn-O phase diagram [46], formation of more reduced oxides is thermodynamically preferable under the conditions of (i) higher temperatures and (ii) lower partial O2 pressure, pO2. In particular, at pO2=1 bar, temperature range of thermodynamic stability of Mn oxides are following:
- MnO2 :ambient to toC < 461oC
- Mn2O3: 461°C < toC < 755°
- Mn3O4: 755°C < toC < 1292°
- MnO: above 1292oC
This temperature ranges are in full agreement with our TGA results (Figure 1B) and study of slow thermal decomposition of Mn(NO3)2.4H2O in air: the main product of the decomposition up to ca. 485-500 oC is MnO2, while at temperatures above 520o C oxide Mn2O3 is the main product [39].
As the decomposition of a fuel is a main source of heat generation during SCS, increase in φ is expected to result in higher reaction temperature. Thermodynamic models of SCS predicts that the adiabatic temperature, Tad [31] is attained for stoichiometric quantities of nitrate/glycine are used, i.e. φ=0.89. Further increase in φ is expected to result in a slight decrease in SCS temperature due to stronger heat loss by escape of hot gaseous products, formed in bigger quantities from fuel than from nitrate decomposition. However, experimentally an increase in reaction temperature up to φ≈1 or even further is typically observed, while no decrease in synthesis temperature with increase in φ was detected. Thus, formation of Mn2O3 for low φ and Mn3O4 + MnO for φ≥1 can be explained by an increase in SCS temperature with higher content of glycine. It also may explain the decrease in BET surface area of oxide with increase in glycine content, which results in stronger sintering of oxide nanoparticles due to higher temperature of SCS reaction. In fact, the highest surface area of 40 m2/g was obtained with MnOx-NG-1 oxide, resulting from the optimal conditions for heat generation.
3.3. SCS Synthesis with Ammonium Citrate: Nitrate-Citrate, Nitrate-Citrate-Glycine, and Nitrate-Citrate-urea
3.3.1. Thermal Stability Studies with Nitrate-Citrate, Nitrate-Citrate-Glycine, and Nitrate-Citrate-Urea SCS Mixtures
In order to better understand the role of formation of intermediate compounds and complexes during the drying step of SCS, we performed the similar study of SCS processes with Mn(II)-nitrate mixture with ammonia citrate as a complexing agent and a sole fuel, as well as in combination with glycine and urea as fuels. The study has been performed with 1-1-1 molar ratio mixtures of Mn nitrate, ammonia citrate, and an additional fuel.
Citrate is strong chelating anion and readily forms stable complexes with Mn(II) [47,48,49,50], thus preventing formation of hydroxide. Tri-basic ammonium citrate was chosen as the source of citrate ions due the fact that pH of its solution is close to 7, similar to glycine and urea solutions, ensuring comparable conditions of drying step. Also, the exchange of anions with Mn(II) in solution results in the formation of ammonium nitrate [51,52,53], which upon drying and heating decomposes with strong exothermic effect, thus favoring SCS conditions.
The pH of an aqueous solution of (NH4)3Cit is close to 7, while the solution of Mn(NO3)2 and (NH4)3Cit had pH=4.6. At this pH citrate is reported to form strong and stable complexes with Mn(II) salts [54]. The structure of complexes formed at slightly acidic pH is disputed: both monodentate complex (NH4)4[Mn(Cit)2] [47] and binuclear bidentate (NH4)2n[Mn2(HCit)2(H2O)2]n [48] were suggested as based on XRD and FTIR characterization. At higher pH=7.0-8.0 mononuclear complex of Mn(III), namely (NH4)5[Mn(Cit)2].2H2O is formed due to simultaneous reaction with dissolved oxygen [47].
Figure 4A shows the FTIR spectra of dried Mn(NO)3, (NH4)3Cit, and their mixtures with glycine and urea. The FTIR spectra of (NH4)3Cit are in agreement with literature, namely characteristic broad IR band of carbonyl ν(O-H) at ca. 3200 cm-1, broad ν(N-H) at 2700 cm-1, a pair of bands of vs(COO-) at 1400 cm-1 and νa(COO-) at 1575 cm-1, ν(C-OH) at 1260 cm-1. In the case of Mn nitrate - citrate dried mixture, one observes an additional strong and broad ν(O-H) band related to water ligand presence. One may also notice a stronger separation between the centers of bands of vs(COO-) at 1390 cm-1 and νa(COO-) at 1610 cm-1, which can be explained by stronger coordination of citrate to manganese. On the other hand, these bands have clearly more contributions comparing to pure (NH4)3Cit, which may be an indication of various form of coordination of citrate with Mn, for example co-existence of both mono- and bidentate citrate in the dried mixture. This non-uniformity can be anticipated, considering that the structure of the complex depends on both metal-ligand ratio and pH of solutions, which can be changing during the evaporation of solvent. The appearance of small sharp band at 1750 cm-1 in the case of Mn(II) nitrate and citrate mixture can be attributed to ν(C=O) stretching vibration, related to partial protonation of citrate and formation in slightly acidic solution of Mn nitrate: for citric acid pKa1 = 3.18, pKa2 = 4.761, and pKa3 = 6.396, and, thus H2Cit- is expected to be a predominant citrate anion at pH=4.5.
In the case of dried solutions of Mn nitrate and ammonium citrate with glycine or urea, much lower intensity of ν(OH) stretching band at 3600 cm-1 is observed, which may be an indication that water ligands are substituted by glycine or urea in this case. The band of νa(COO-) at 1580-1620 cm-1 is superposed with ν(C-N) expected at 1590-1605 cm-1, which makes the analysis of their expect positions complicated. However, FTIR spectra are in agreement with assumption of formation of strong Mn(II) complex with citrate ligands also in the presence of glycine or urea in the initial solution.
TGA curves of the decomposition of the ammonium citrate and its mixture with Mn nitrate and with Mn nitrate and glycine are shown in Figure 4B. The thermal decomposition of ammonium citrate is not yet studied in details. The crystal structure of solid ammonium citrates is determined by hydrogen bonds, predominantly by N-H···O bonds [55], which are relatively weak and breaking with temperature. Thus, one may expect that thermal decomposition of ammonium citrate would have a similar mechanism to citric acid decomposition, which is a two-step process [56,57]. Namely, first step occurs simultaneously with melting of citric acid above 150 oC and results in formation of few stable intermediates, mostly cis- and trans-aconitic acid [57]. The intermediates are then slowly dehydrating forming corresponding anhydrides until total decomposition above 600 oC.
The dried mixture of Mn nitrate and ammonium citrate is stable up to the temperature of ≈150 oC before the decomposition of citrate starts. DRIFT spectra (Figure 5A) shows only the loss of water, as indicated by a disappearance of ν(OH) band at 3600 cm-1 in this temperature range. At temperatures above 200 oC TGA curves shows rapid mass loss, in agreement with fast and simultaneous decrease of intensity of IR bands attributed to nitrate and citrate detected above 150oC in DRIFT spectra. The decrease in the intensities of carbonyl-related bands (ν(OH) at 3200 cm-1 and ν(C-OH) at 1215 cm-1) occurs at lower temperatures (150-200oC) comparing to the carboxylate (vs(COO-) at 1390 cm-1 and νa(COO-) at 1610 cm-1) groups, which starts above 200 oC. It confirms that the mechanism of decomposition of Mn-citrate complex is similar to the one of the decomposition of citric acid and proceeds first via elimination of carbonyl group of citrate and formation of aconate-type intermediates [57]. Contrary to slow second step of the decomposition of pure ammonium citrate, the decomposition of nitrate and citrate mixture is nearly finished above 340 oC, according to TGA. At the same temperature in DRIFT spectra one observes only remaining IR bands attributed to the rest of nitrate, as in the case of pure Mn nitrate decomposition, or Mn nitrate - glycine SCS synthesis, described in the previous section. One may suggest that Mn acts as a catalyst of the decomposition of citrate ligands, resulting in its faster decomposition comparing to pure ammonium citrate. A strong band centered at 602 cm-1 appears above 300 oC, and can be attributed to ν(Mn-O) stretching, reported for MnO2 and Mn2O3 oxides [58].
The thermal decomposition of Mn nitrate - ammonium citrate - glycine mixture is similar to one of nitrate - citrate mixture, indicating that the presence of glycine does not influence the decomposition mechanism of manganese citrate complex. Contrary to nitrate-glycine mixture, there is no indication of autocatalytic decomposition of dried precursors neither in the case of nitrate-citrate nor in the case of nitrate-citrate-glycine mixtures. Moreover, one may argue from comparison of TGA curves for nitrate-citrate and nitrate-citrate-glycine mixtures that in the presence of glycine the decomposition of citrate is slower and is not finished yet below 380oC (at least under the conditions of TGA measurements). It can be suggested that the intermediate products of the decomposition of citrate (aconate-type anions) are stabilized by the presence of the intermediates of glycine decomposition (amides). Nevertheless, in contrast to pure glycine, nearly no intermediates of glycine thermal decomposition remains above 380oC in the case of Mn nitrate-citrate-glycine mixture.
Glycine may substitute water as a ligand in the initial mixture, as indicated by lower intensity of water-related ν(O-H) band. Also, the DRIFT spectra (Figure 5B) shows that the dehydration step occurs at somewhat lower temperature in the presence of glycine: the decrease in the intensity of ν(O-H) band is detected already below 100 oC, and the band nearly disappears at 150 oC. However, after the dehydration step, the DRIFT observations and the TGA behavior are very similar in the case of presence and absence of glycine in nitrate-citrate mixture. The decomposition starts with elimination of carbonyl group at temperatures above 150 oC and then gradual decrease in the intensities of other bands related to citrate above 200 oC.
The mixture of Mn nitrate-citrate-urea also remains stable with no changes in chemical composition at least up to 150 oC (Figure 5C). Above 200 oC one starts to observe a decrease in ν(OH) band related to carbonyl of citrate ligand, similarly to previous cases. Around 250 oC strong decrease in other citrate- and nitrate-related bands occurs with appearance of the band at 2200 cm-1, which can be attributed to ν(-C=N) or ν(-C≡N). This band can indicate formation of intermediates of urea decomposition, such as cyanuric acid, cyanic acid, and cyanamide, as previous detailed studies of urea thermal decomposition suggested [59,60]. It is noteworthy that while the intermediates of the decomposition of citrate and urea are still detectable in DRIFT up to ca. 400 oC, the TGA measurements demonstrate that the decomposition is fast finished at ca. 250 oC, and no slow decomposition of intermediates occurs in this case. This discrepancy can be explained by the influence of KBr of DRIFT pellet, allowing more efficient dissipation of heat than in the case of TGA measurements, and hints to strong exothermic effect of the decomposition of nitrate-citrate-urea mixture.
3.3.2. Solution Combustion Synthesis with Ammonium Citrate
During SCS synthesis the dried mixtures of nitrate-citrate, nitrate-citrate-glycine, and nitrate-citrate-urea rapidly decomposes within first few (1-4) minutes after contacting the heating plate. Within these minutes one observes melting of the mixture and formation of water vapor, until dried patches are formed. The decomposition reaction starts locally in one or few spots of the dried solid mixture and rapidly propagates within few or few tens of seconds until the whole solid mixture is converted and no further reaction is observed. However, it is important to emphasize that the propagation of the process is not instantaneous as in the case of nitrate-glycine 1:1 mixture, indicating either lower heat effect end/or slower kinetics of the decomposition in the presence of citrate. It is noteworthy that the oxides MnOx-NCG and MnOx-NCU have smaller average size of crystallites as estimated by XRD in comparison with MnOx-NG oxide, while also smaller SSA (see Table 3). It may indicate that small particles of MnOx-NCG and MnOx-NCU samples are more agglomerated due to slower ignition conditions and, thus, less efficient heat evacuation.
As discussed above, presence of glycine and urea does not strongly influence the first step of decomposition of Mn citrate complex, which occurs in all cases at nearly the same temperature above 150oC. The self-propagating process is most probably related to fast and exothermic decomposition of the intermediates of organic decomposition in the presence of Mn.
As SEM images in Figure 6B–D show, the oxides prepared by SCS using ammonium citrate have the morphology similar to one prepared by nitrate-glycine method, as described above : mesoporous structure consisted of partially agglomerated oxide nanoparticles. However, there are several important differences related to the utilization of ammonium citrate during the SCS synthesis.
3.4. Electrochemical Properties of Mn Oxides Prepared by SCS
The CV curves of Mn oxide electrodes measured in 1M NaOH at 10 mV/s are shown in Figure 7A. One detects a clear difference between the electrochemical properties of oxide samples MnOx-NG, MnOx-NCG, and MnOx-NCU, in comparison with oxide MnOx-NC. According to XRD data, the samples MnOx-NCG and MnOx-NCU contain only Mn3O4 oxide, which is also a predominant phase in MnOx-NG (with minor presence of MnO), while MnOx-NC consists of Mn2O3 oxide. Thus, observed difference can be attributed to the different electrochemical properties of two different Mn oxide phases.
Mn3O4 hausmannite has a spinel structure with Mn3+ cations occupying octahedral, and Mn2+ occupying tetrahedral sites. Despite mixed valency of Mn cations in spinel structure, it was demonstrated [11] that in aqueous solutions the average oxidation state of Mn at the surface is +3 or slightly above. The typical values of open circuit potential EOCP of Mn oxide electrodes were typically measured as 0.00-0.10 V vs. NHE, confirming that most of Mn at oxide surface are oxidized to Mn3+ state.
The CV curves in Figure 7A are in agreement with previous studies [8,11] of Mn3O4, demonstrating clear pair of peaks around 0.15 V vs. NHE, attributed to the following reversible reaction:
Reaction (4) can propagate further into the bulk of the oxide particles via solid state diffusion of a proton, thus giving the rise of pseudocapacitance phenomena via intercalation. The profile of CV curves and galvanostatic discharging curves (Figure 7D) are in qualitative agreement with this mechanism [61]. The analysis of sweep rate dependence of the CV currents by Dunn method (Figure 8) demonstrated that more than 90% of the CV current recorded at 10 mV/s is proportional to sweep rate and thus can be attributed to a process, which is not limited by solid state diffusion. It confirms that the main charge storage mechanism in the case of Mn3O4 particles in 1M NaOH is a reversible pseudocapacitance via proton intercalation. This high surface-controlled contribution might be also explained by the nanosizing of the Mn3O4 particles and then being referred to extrinsic pseudocapacitance.
In agreement with previous studies [62], the currents corresponding to reaction (4) in the case of Mn2O3 oxide are significantly weaker in comparison with Mn3O4 oxides. It has been also observed that the peaks related to reaction (4) of Mn2O3 are shifted ca. 40 mV to more positive potentials comparing to Mn3O4 oxide, indicating better stability of MnIII sites of Mn2O3 towards oxidation. DFT modeling of water adsorption on Mn3O4 surface [63] demonstrated that the molecular water adsorption is facilitated on MnII tetrahedral sites due to their both electronic and geometric configuration. Stronger water adsorption on Mn3O4 surface and thermodynamically more facile oxidation of MnIII sites are suggested as the factors explaining much higher currents of reaction (4) detected in the case of Mn3O4 oxides comparing to Mn2O3.
In contrast to Mn2O3, all Mn3O4 oxides demonstrate sufficient stability in 1000 galvanostatic cycles at 2 A/g (Figure 7C). A rapid decrease in charge capacitance of Mn3O4 oxides with cycling is a general problem of this oxide electrodes, and is commonly associated to the dissolution of Mn [8,64]. Indeed, we did not detect and changes in crystallographic structure of Mn oxides after 1000 cycles by post-mortem XRD analysis. Thus, we attribute the degradation of capacitance observed for MnOx-NCG and MnOx-NCU samples to dissolution of Mn3O4 during galvanostatic cycles. According to Pourbaix diagram of Mn, at potentials below -0.2 V NHE in 1M NaOH one may expect reduction of MnIII to MnII cations and formation of slightly soluble surface hydroxide Mn(OH)2. This hydroxide is further dissolved in NaOH and can be partially re-deposited upon scan to higher potentials, and partially lost to the bulk of electrolyte. This mechanism may explain better stability of MnOx-NG sample, which contains minor amount of MnO: this oxide is dissolved as Mn(OH)2 in 1M NaOH, thus creating higher local concentration of hydroxide and preventing the dissolution of Mn3O4 upon its reduction.
All oxide demonstrate a decrease in charge capacitance with an increase in charging rate (Figure 7B). This decrease is strongest for Mn2O3 oxide (MnOx-NC), while it is approximately the same for all Mn3O4 oxides. This decrease can be attributed to limitations related to either slow kinetics of reaction (4) and/or diffusion-related limitations of the propagation of this reaction.
The electrochemical properties of MnOx oxides were studied by electrochemical impedance spectroscopy. The Figure 9 shows the Nyquist and Bode plots (for phase angle) of 4 studied oxide samples measured at 0.00 V Hg/HgO. At high frequencies, the phase angle of impedance is close to 0o, indicating that the impedance is predominant by the resistance of an electrolyte. As the frequency decreases, as expected for capacitive materials, the phase angle is increasing to the values close to 90o. However, the ideal capacitive behavior is not observed even at low frequencies. This can be related to two factors. The impedance of the pseudocapacitance reaction can be partially controlled by the rate of charge transfer kinetics, which has a resistive contribution to the impedance. Second, the dispersion of the accessibility of the interface inside the pores of electrode layer results in the behavior best described by constant phase element (CPE) with the power a<1, also resulting in the lower phase angle. For all samples an increase in phase angle with frequency decrease is not uniform, demonstrating plateaus and, in some cases, local maximums. Such behavior is related to the complex character of the impedance, containing the contributions from double layer charging, and pseudocapacitance reaction, and to the influence of porous structure of the electrode layer. It is more informative in this case to analyze the behavior of the complex interfacial capacitance Cz, calculated as follows:
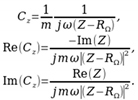 (5)
(5)In equation above, Z is measured electrochemical impedance, RΩ is a serial electrolyte resistance outside of the electrode deposit, m is the mass of the electrode deposit, ω is an angular frequency. Re(Cz) is a measurable interfacial capacitance, proportional to the surface specific capacitance and interfacial surface area. It is decreasing with increase in frequency due to (i) slowing down the charging of interfacial capacitance due to the influence of resistive components, such as interfacial charge transfer resistance, and the resistance of the electrolyte inside the pores, and (ii) shorter penetration of potential modulation into the porous electrode deposit. The imaginary component Im(Cz) indicates the loss of capacitance due to the influence of resistive components. Its maximum correspond to the reciprocal of characteristic response time of the impedance components, while its width is related to the dispersion in the polarizability of the interface [65].
In agreement with the data from CV and galvanostatic cycling, the interfacial capacitance decreases in the sequence MnOx-NCU > MnOx-NCG > MnOx-NG >> MnOx-NC (Figure 9C). It is noteworthy that MnOx-NCU also shows the fastest response to the potential modulation, as indicated by the position of Im(Cz) peak at highest frequencies comparing to other oxides. It may be tentatively attributed to either faster charge transfer during the reaction (4) or more open and accessible porous structure resulting from smaller resistance of the electrolyte inside the pores. The exact attribution of the behavior of -Im(Cz) plots requires analysis of its dependence on the potential and is beyond the point of the present manuscript.
Figure 9 also shows how the impedance of the oxide electrode samples changes after 1000 galvanostatic cycles of charging at 2 A/g (dashed curves). For all samples, except MnOx-NG, a loss of interfacial capacitance, as measured by Re(Cz), Figure 9C, was observed, while slight increase in capacitance was detected for MnOx-NG. These observations are in accordance with the data of Figure 7C on the evolution of the capacitance with the number of galvanostatic cycles. The peaks of -Im(Cz) plots shifts to higher frequencies after 1000 cycles for all samples, and especially for MnOx-NCG and MnOx-NCU. It can be interpreted as either faster charge transfer or smaller electrolyte resistance in pores resulting from the galvanostatic cycling. Thus, the main mechanism of the loss of capacitance cannot be attributed to a decrease in the surface specific charge capacitance, but rather to the decrease in surface area available for charge storage, resulting from the dissolution of the material.
4. Discussion
4.1. Nitrate-Glycine Synthesis
Concerning the thermal decomposition study via TD-DRIFTS and TGA analyses of dried nitrate, glycine and their mutual mixture with a φ=1.0 ratio, a given number of suggestions for the SCS mechanism is given as follows:
- During slow evaporation of solvent from nitrate and glycine mixed solution, the glycine complex of Mn(II) is formed, either [Mn(gly)(H2O)2](NO3)2, or [Mn(gly)(H2O)4](NO3)2. Formation of this complex ensures fine and uniform mixing of components of SCS mixture.
- The glycine complexes of Mn(II) are thermodynamically less stable than complexes of other transition metals [43,44] and easily decomposing upon heating [18]. The decomposition of this complex follows up its partial dehydration, and occurs at temperature 160-170 oC, which is below the decomposition of pure glycine (220 oC). It has been previously reported that decomposition of dried Mn nitrate-glycine mixture also occurs at lower temperature comparing to pure glycine under inert atmosphere [38].
- In comparison to a decomposition of pure nitrate and glycine, the first step of decomposition of dried mixture is fast, and results in formation of large amount of gas products. One may assume the “auto-catalytic” mechanism of glycine/nitrate decomposition with formation of glycine complex of Mn(II) as a catalytic intermediate. The fast kinetics of glycine-nitrate decomposition may be an indication of lowering of activation energy of this reaction, which is otherwise relatively high for both nitrate (210 kJ/mol) and glycine (155 kJ/mol) decompositions.
The observation of the SCS reaction also support the assumption of formation of complex intermediate. Indeed, dried mixture of components reacts instantaneously within first minute of the contact with heating plate at 350 oC and without any visible sign of phase transition. The only observation upon heating of dried mixture before ignition is formation of water vapor due to dehydration of complex. No liquid phase due to melting of Mn(NO3)2 (melting point tfo=37 oC) was observed.
4.2. Analysis of the Products of SCS with Nitrate-Glycine Mixture
Considering slow drying of the precursors mixture, and an instantaneous character of SCS process, one may expect uniform reaction conditions and formation of single oxide phase. Nevertheless, for all nitrate+glycine mixtures we always produced a mixture of oxides (see Table 3). In particular, for all φ≥1, a mixture of Mn3O4 (predominant phase) and MnO (minor component) has been formed, in agreement with previous studies [38]. The formation of a mixture of products can be related to the following:
- The formation of mixture of oxides can be attributed to the partial reduction of Mn3O4 to MnO, indicating high temperature generated during the SCS decomposition reaction : at p(O2)=1 bar, MnO formation is detected only above 820 oC (Figure 1B). MnO remains a minor product due to effective evacuation of generated heat by formed gaseous products. However, if Mn2O3 or Mn3O4 oxide reduction to MnO is the main source of this oxide, one would expect its systematically higher content formed with higher φ value (due to higher reaction temperature), which was not experimentally observed.
- The alternative explanation of formation of MnO as an SCS product is the precipitation of Mn(OH)2 hydroxide due to the hydrolysis of Mn(II) nitrate during the solution evaporation. The pH of the solution of Mn(II) nitrate is slightly acidic (pH=4.6), both in the absence and in the presence of glycine, and thus no precipitation of Mn(OH)2 (pKb=12.7) is expected from nitrate solution. However, Mn(II) hydroxide may be precipitated during the evaporation of solvent due its much lower solubility comparing to nitrate (0.34 mg/100 mL and 118 g/100 mL respectively). The precipitated Mn(OH)2 hydroxide is then decomposed during the SCS reaction to MnO. The latter is not oxidized to higher oxides due to the oxygen lean atmosphere within the SCS reaction.
It must be bear in mind that besides the composition of initial SCS mixture and φ ratio, other SCS conditions may strongly effect the Tad and pO2. Nitrate-glycine synthesis with very fast evaporation of solvent (in less than 20 min) on a heating plate resulted in formation of the same ε-MnO2 oxide for both φ=0.5, and φ=2.0 [24]. On the other hand, the main product of nitrate-glycine SCS (φ=1.5) with fast solvent evaporation in an oven at 500 oC is Mn3O4, while when slower evaporation is performed at lower temperature at 350 oC, the products are Mn2O3 and MnO2 [26]. Thus, the temperature ramp, the rate of evaporation and the mode of heating (bottom heating on a heating plate or all-around inside an oven) are also the important conditions to bear in mind. It may be speculated that the slower evaporation of solvent favorizes hydrolysis of Mn precursor salt and precipitation of Mn hydroxide, resulting in the mixture of final oxide products.
4.3. SCS Synthesis with Ammonium Citrate: Nitrate-Citrate, Nitrate-Citrate-Glycine, and Nitrate-Citrate-urea Mixtures
Three main points are listed below concerning the obtained manganese oxide particles and their differences in structural characteristics from nitrate-citrate, nitrate-citrate-glycine and nitrate-citrate-urea mixtures:
- In all 3 cases (Mn nitrate-citrate, nitrate-citrate-glycine, and nitrate-citrate-urea) only one crystalline oxide phase was detected, despite slower kinetics of decomposition and less uniform conditions of reaction propagation, comparing to nitrate-glycine synthesis. This observation support the assumption that the main source of inhomogeneity in the final products of SCS is formation of various forms of Mn precursors, such as metal complexes, dried salt, and hydroxide, during slow step of solvent evaporation. In the presence of citrate in the solution, Mn forms strong and stable complex with citrate ligands, which uniformly precipitates after solvent evaporation.
- In the case of ammonium citrate being the only fuel of SCS process, the only product of the reaction is Mn2O3 (Figure 6A), while in the presence of glycine and urea in the mixture, only Mn3O4 is formed. It can be argued that the presence of glycine or urea allows to reach higher temperature during the SCS reaction; alternatively, the decomposition of the intermediates of glycine or urea decomposition consumes oxygen resulting in lower local partial pressure p(O2). Both factors favorize formation of more reduced oxide, namely Mn3O4.
- Both XRD estimation of crystallite size, measurements of specific surface area, and SEM images points to smaller particles size in the case of nitrate-citrate-urea comparing to nitrate-citrate-glycine mixture. We attribute this effect to faster kinetics of second step of decomposition of nitrate-citrate-urea mixture, in which case formation of larger amount of smaller particles is favored, while particles are less sintered due to shorter reaction time. In both nitrate-citrate-glycine and nitrate-citrate-urea synthesis the particles are more sintered than in the case of nitrate-glycine synthesis, due to much faster reaction propagation and heat dissipation in the latter case.
4.4. Electrochemical Properties of Mn Oxides Prepared by SCS
The ensemble of electrochemical and physicochemical data allows to give the following tentative interpretation of the difference in structure, electrochemical properties, and cycling behavior of studied samples.
- MnOx-NG sample consists of relatively large (ca. 20 nm) particles, which are not strongly sintered because of explosive character of SCS reaction. The explosive character of SCS process is related to the formation of a weak complex between Mn(II) nitrate and glycine, which is easily decomposed upon heating and provide significant exothermic effect for instantaneous self-propagation of the reaction. The final oxide product contains ca. 20%mol. of MnO and 80% of Mn3O4, and the presence of MnO is related to the hydrolysis of Mn nitrate during the slow evaporation of solvent before SCS reaction. The MnOx-NG electrode shows moderate charge capacitance (70 F/g at 2 A/g discharge) and very stable performance. MnO oxide is not stable in 1M NaOH and forms hydroxide, which does not contribute to the charge capacitance; however its presence allows to prevent dissolution of Mn3O4 oxide upon reduction in the form of Mn hydroxide, which is the main mechanism of this material degradation. The capacitance can be further significantly improved by forming a composite with carbon materials, as it is demonstrated in previous studies [8].
- MnOx-NC sample consists of Mn2O3 oxide particles of ca. 20 nm, slightly sintered. Citrate forms stronger complex with Mn(II), and its decomposition is not sufficiently exothermic to generate temperature sufficient for Mn3O4 formation, which requires ca. 950 oC at p(O2)=0.3 bar. MnOx-NC oxide demonstrate low charge capacitance in 1M NaOH (initially 22 F/g at 2 A/g), which is fast degrading upon galvanostatic cycling. The degradation cannot be explained only by possible dissolution of Mn oxide, but suggests changes in surface structure or composition, which my results in strong increase in contact interparticle resistance.
- Addition of an equimolar amount of a fuel, either glycine (MnOx-NCG) or urea (MnOx-NCU), to Mn(II) nitrate - ammonium citrate mixture allows to increase an exothermic effect of the reaction and obtain Mn3O4 oxide nanoparticles. Formation of MnO is suppressed by the presence of citrate. The SCS reaction in these cases are slower than in the case of MnOx-NG, and take few seconds. The reaction is slower in the case of nitrate-citrate-glycine mixture in comparison with nitrate-citrate-urea mixture, which is explained by possible interactions between the intermediates of citrate and glycine decomposition. The slower rate of reaction results in more sintered particles in comparison to MnOx-NG synthesis. Nevertheless, MnOx-NCU oxide demonstrate highest charge capacitance due to strong and fast pseudocapacitance phenomena (130 F/g at 2 A/g). The high capacitance of this oxide can be explained by its relatively high SSA, providing fast charging rate, and moderate sintering of particles, decreasing the interparticle contact resistance. Upon cycling the capacitance of both MnOx-NCG and MnOx-NCU after initial increase within first 100 cycles, slowly decays, resulting from the dissolution of Mn3O4 upon reduction in the form of Mn(II) hydroxide. Further study of the mechanism of dissolution of Mn3O4 particles upon their electrochemical performance is needed to develop the strategy to avoid its degradation
5. Conclusions
Mesoporous manganese oxide materials have been synthesized by solution combustion synthesis (SCS) and tested for supercapacitors application. The structure and composition of oxides strongly depends on the choice of initial components of SCS mixture. In particular, appearance of a mixture of oxides, namely MnO and Mn3O4 for fuel-rich nitrate-glycine mixture (MnOx-NG-1-1, MnOx-NG-1-1.25, and MnOx-NG-1.5) is explained by a partial hydrolysis of manganese salt during slow evaporation of the solvent and formation of Mn(II) hydroxide. The ATR-FTIRS and DRIFTS data points to the formation of a glycine-complex of Mn(II) in solution with glycine ; this complex is weak and does not prevent the hydrolysis. Its decomposition is fast and exothermic, resulting in instantaneous propagation of combustion reaction, and relatively weak sintering of oxide particles of the final product. Addition of ammonium citrate leads to the formation of strong complex or mixture of complexes (e.g. mono- and bi-dentate complexes) with Mn(II). The formation of citrate complex prevents the hydrolysis of Mn(II) salt, thus providing only one crystalline oxide phase in the final product. In the absence of another fuel, i.e. from Mn(II) nitrate - ammonium citrate solution (MnOx-NC), only Mn2O3 is formed due to low temperature generated from combustion reaction. If equimolar quantity of another fuel, namely glycine or urea, is added, Mn3O4 is the only oxide product (MnOx-NCG and MnOx-NCU correspondingly). Presence of fuel component does not noticeably affect the formation of Mn(II) citrate complex, but provides higher temperature during the combustion reaction. Decomposition of citrate complex of Mn(II) is slower comparing to glycine complex, and thus, the propagation of combustion reaction is also slower, resulting in longer reaction time and stronger sintering of resulting oxides. Urea is more efficient fuel than glycine for Mn citrate decomposition, resulting in shorter reaction time and weaker sintering of final oxide.
The charge capacitance of oxides decreases in the sequence MnOx-NCU > MnOx-NCG ≈ MnOx-NG >> MnOx-NC. The weak capacitance of MnOx-NC oxide is related to the properties of Mn2O3, which is an oxide phase in the case of this sample, contrary to Mn3O4, which is the only or predominant oxide phase in the case of three other samples. The oxide MnOx-NCU demonstrated the highest charge capacitance in 1M NaOH (130 F/g at 2 A/g charging rate with 0.75 mg/cm2 loading). The capacitance of both MnOx-NCG and MnOx-NCU starts to slowly decrease after ca. 100 charging cycles, related to the dissolution of oxides. In contrast to these samples, the capacitance of MnOx-NG oxide increase continuously within at least 1000 cycles of charging, which is tentatively explained by the stabilizing effect of presence of MnO in this case.
Supplementary Materials
The following supporting information can be downloaded at the website of this paper posted on Preprints.org, Figure S1: N2 isotherm of the MnOx/Glycine sample; Figure S2. N2 isotherm of the MnOx/Glycine samples with different φ ratios; Figure S3. N2 isotherm of the MnOx/Urea sample; Figure S4. N2 isotherm of the MnOx/Glycine-Ammonium Citrate; Figure S5. MnOx/Urea-Ammonium Citrate; Figure S6. The CV curves for MnOx-NG (A) and MnOx-NCU (B) samples in 1M NaOH recorded at different sweep rates. The CV curves containing only the current contribution linear to sweep rate are depicted below for MnOx-NG (C) and MnOx-NCU (D) as a filled area figure.
Author Contributions
Conceptualization, S.N.P.; methodology, S.N.P.; validation, S.N.P. and T.K.; experimental work, T.K. and S.S.; resources, T.K. and S.S.; writing—original draft preparation, S.N.P. and T.K.; writing—review and editing, S.N.P. and T.K.; supervision, S.N.P.; project administration, S.N.P.; funding acquisition, S.N.P. All authors have read and agreed to the published version of the manuscript.
Funding
This research was funded by the INFINE ANR (France) project ANR-21-CE08-0025-01.
Data Availability Statement
The raw experimental data for the results discussed in the present paper can be provided by the authors of the manuscript on demand.
Acknowledgments
The authors are grateful to the staff of ICPEES for performing and assisting in the materials characterization. Special thanks are given to Prof. Corinne Petit (ICPEES) for helping with DRIFTS conceptualization.
Conflicts of Interest
The authors declare no conflicts of interest.
References
- Tarascon, J.M.; Armand, M. Issues and Challenges Facing Rechargeable Lithium Batteries. Nature 2001, 414, 359–367. [Google Scholar] [CrossRef] [PubMed]
- Poizot, P.; Laruelle, S.; Grugeon, S.; Dupont, L.; Tarascon, J.M. Nano-Sized Transition-Metal Oxides as Negative-Electrode Materials for Lithium-Ion Batteries. Nature 2000, 407, 496–499. [Google Scholar] [CrossRef] [PubMed]
- Lin, Z.; Goikolea, E.; Balducci, A.; Naoi, K.; Taberna, P.L.; Salanne, M.; Yushin, G.; Simon, P. Materials for Supercapacitors: When Li-Ion Battery Power Is Not Enough. Materials Today 2018, 21, 419–436. [Google Scholar] [CrossRef]
- Thackeray, M.M. Manganese Oxides for Lithium Batteries. Progress in Solid State Chemistry 1997, 25, 1–71. [Google Scholar] [CrossRef]
- Thackeray, M.M. Exploiting the Spinel Structure for Li-Ion Battery Applications: A Tribute to John B. Goodenough. Advanced Energy Materials 2021, 11, 1–8. [Google Scholar] [CrossRef]
- Shah, H.U.; Wang, F.; Toufiq, A.M.; Khattak, A.M.; Iqbal, A.; Ghazi, Z.A.; Ali, S.; Li, X.; Wang, Z. Electrochemical Properties of Single-Crystalline Mn3O4 Nanostructures and Their Capacitive Performance in Basic Electrolyte. International Journal of Electrochemical Science 2016, 11, 8155–8162. [Google Scholar] [CrossRef]
- Shah, H.U.; Wang, F.; Toufiq, A.M.; Ali, S.; Khan, Z.U.H.; Li, Y.; Hu, J.; He, K. Electrochemical Properties of Controlled Size Mn3O4 Nanoparticles for Supercapacitor Applications. Journal of Nanoscience and Nanotechnology 2018, 18, 719–724. [Google Scholar] [CrossRef]
- Kerangueven, G.; Faye, J.; Royer, S.; Pronkin, S.N. Electrochemical Properties and Capacitance of Hausmannite Mn3O4 - Carbon Composite Synthesized by in Situ Autocombustion Method. Electrochimica Acta 2016, 222, 755–764. [Google Scholar] [CrossRef]
- Wang, J.-G.; Jin, D.; Zhou, R.; Li, X.; Liu, X.; Shen, C.; Xie, K.; Li, B.; Kang, F.; Wei, B. Highly Flexible Graphene/Mn3O4 Nanocomposite Membrane as Advanced Anodes for Li-Ion Batteries. ACS Nano 2016, 10, 6227–6234. [Google Scholar] [CrossRef]
- Wang, H.; Cui, L.-F.; Yang, Y.; Sanchez Casalongue, H.; Robinson, J.T.; Liang, Y.; Cui, Y.; Dai, H. Mn3O4−Graphene Hybrid as a High-Capacity Anode Material for Lithium Ion Batteries. J. Am. Chem. Soc. 2010, 132, 13978–13980. [Google Scholar] [CrossRef]
- Dosaev, K.A.; Istomin, S.Ya.; Strebkov, D.A.; Tsirlina, G.A.; Antipov, E.V.; Savinova, E.R. AMn2O4 Spinels (A - Li, Mg, Mn, Cd) as ORR Catalysts: The Role of Mn Coordination and Oxidation State in the Catalytic Activity and Their Propensity to Degradation. Electrochimica Acta 2022, 428, 140923. [Google Scholar] [CrossRef]
- Patil, K.C.; Aruna, S.T.; Mimani, T. Combustion Synthesis: An Update. Current Opinion in Solid State and Materials Science 2002, 6, 507–512. [Google Scholar] [CrossRef]
- Chick, L.A.; Pederson, L.R.; Maupin, G.D.; Bates, J.L.; Thomas, L.E.; Exarhos, G.J. Glycine-Nitrate Combustion Synthesis of Oxide Ceramic Powders. Materials Letters 1990, 10, 6–12. [Google Scholar] [CrossRef]
- Kingsley, J.J.; Suresh, K.; Patil, K.C. Combustion Synthesis of Fine-Particle Metal Aluminates. J Mater Sci 1990, 25, 1305–1312. [Google Scholar] [CrossRef]
- Manoharan, S.S.; Patil, K.C. Combustion Synthesis of Metal Chromite Powders. J American Ceramic Society 1992, 75, 1012–1015. [Google Scholar] [CrossRef]
- Arul Dhas, N.; Patil, K.C. Combustion Synthesis and Properties of Fine Particle Spinel Manganites. Journal of Solid State Chemistry 1993, 102, 440–445. [Google Scholar] [CrossRef]
- Varma, A.; Mukasyan, A.S.; Rogachev, A.S.; Manukyan, K.V. Solution Combustion Synthesis of Nanoscale Materials. Chemical Reviews 2016, 116, 14493–14586. [Google Scholar] [CrossRef]
- Mrozek, R.; Rz, Z. Thermal Analysis of Manganese(II) Complexes With Glycine. 2001.
- De Bruijn, T.J.W.; De Ruiter, G.M.J.; De Jong, W.A.; Van Den Berg, P.J. Thermal Decomposition of Aqueous Manganese Nitrate Solutions and Anhydrous Manganese Nitrate. Part 2. Heats of Reaction. Thermochimica Acta 1981, 45, 279–292. [Google Scholar] [CrossRef]
- Nohman, A.K.H.; Ismail, H.M.; Hussein, G.A.M. Thermal and Chemical Events in the Decomposition Course of Manganese Compounds. Journal of Analytical and Applied Pyrolysis 1995, 34, 265–278. [Google Scholar] [CrossRef]
- Yablokov, V.Ya.; Smel’tsova, I.L.; Zelyaev, I.A.; Mitrofanova, S.V. Studies of the Rates of Thermal Decomposition of Glycine, Alanine, and Serine. Russ J Gen Chem 2009, 79, 1704–1706. [Google Scholar] [CrossRef]
- Weiss, I.M.; Muth, C.; Drumm, R.; Kirchner, H.O.K. Thermal Decomposition of the Amino Acids Glycine, Cysteine, Aspartic Acid, Asparagine, Glutamic Acid, Glutamine, Arginine and Histidine. BMC Biophys 2018, 11, 2. [Google Scholar] [CrossRef] [PubMed]
- Khaliullin, Sh.M.; Zhuravlev, V.D.; Bamburov, V.G. Solution-Combustion Synthesis of Oxide Nanoparticles from Nitrate Solutions Containing Glycine and Urea: Thermodynamic Aspects. Int. J Self-Propag. High-Temp. Synth. 2016, 25, 139–148. [Google Scholar] [CrossRef]
- Yu, P.; Zhang, X.; Chen, Y.; Ma, Y. Solution-Combustion Synthesis of ε-MnO2 for Supercapacitors. Materials Letters 2010, 64, 61–64. [Google Scholar] [CrossRef]
- Puértolas, B.; Smith, A.; Vázquez, I.; Dejoz, A.; Moragues, A.; Garcia, T.; Solsona, B. The Different Catalytic Behaviour in the Propane Total Oxidation of Cobalt and Manganese Oxides Prepared by a Wet Combustion Procedure. Chemical Engineering Journal 2013, 229, 547–558. [Google Scholar] [CrossRef]
- Piumetti, M.; Fino, D.; Russo, N. Mesoporous Manganese Oxides Prepared by Solution Combustion Synthesis as Catalysts for the Total Oxidation of VOCs. Applied Catalysis B: Environmental 2015, 163, 277–287. [Google Scholar] [CrossRef]
- Kéranguéven, G.; Faye, J.; Royer, S.; Pronkin, S.N. Electrochemical Properties and Capacitance of Hausmannite Mn3O4 – Carbon Composite Synthesized by in Situ Autocombustion Method. Electrochimica Acta 2016, 222, 755–764. [Google Scholar] [CrossRef]
- Kéranguéven, G.; Bouillet, C.; Papaefthymiou, V.; Simonov, P.A.; Savinova, E.R. How Key Characteristics of Carbon Materials Influence the ORR Activity of LaMnO3- and Mn3O4-Carbon Composites Prepared by in Situ Autocombustion Method. Electrochimica Acta 2020, 353, 136557. [Google Scholar] [CrossRef]
- Shi, J.; Sun, M.; Hu, H. One-Step Combustion Synthesis of C-Mn3O4/MnO Composites with High Electrochemical Performance for Supercapacitor. Mater. Res. Express 2018, 6, 035511. [Google Scholar] [CrossRef]
- Guo, H.; Zhang, Z.; Jiang, Z.; Chen, M.; Einaga, H.; Shangguan, W. Catalytic Activity of Porous Manganese Oxides for Benzene Oxidation Improved via Citric Acid Solution Combustion Synthesis. Journal of Environmental Sciences 2020, 98, 196–204. [Google Scholar] [CrossRef]
- Mollaei, Z.; Kermani, F.; Moosavi, F.; Kargozar, S.; Khakhi, J.V.; Mollazadeh, S. In Silico Study and Experimental Evaluation of the Solution Combustion Synthesized Manganese Oxide (MnO2) Nanoparticles. Ceramics International 2022, 48, 1659–1672. [Google Scholar] [CrossRef]
- Vratny, F. Infrared Spectra of Metal Nitrates. Appl Spectrosc 1959, 13, 59–70. [Google Scholar] [CrossRef]
- Laulicht, I.; Pinchas, S.; Samuel, D.; Wasserman, I. The Infrared Absorption Spectrum of Oxygen-18-Labeled Glycine. J. Phys. Chem. 1966, 70, 2719–2725. [Google Scholar] [CrossRef] [PubMed]
- Kumar, S.; Rai, A.K.; Singh, V.B.; Rai, S.B. Vibrational Spectrum of Glycine Molecule. Spectrochimica Acta Part A: Molecular and Biomolecular Spectroscopy 2005, 61, 2741–2746. [Google Scholar] [CrossRef] [PubMed]
- Popov, D.; Herak, R.; Prelesnik, B.; Ribar, B. The Crystal Structure of Manganese Nitrate Tetrahydrate Mn(NO3)2 · 4H2O. Zeitschrift für Kristallographie - Crystalline Materials 1973, 137, 280–289. [Google Scholar] [CrossRef]
- Nakamoto, K. Applications in Coordination Chemistry. In Infrared and Raman Spectra of Inorganic and Coordination Compounds; John Wiley & Sons, Ltd, 2008; pp. 1–273 ISBN 978-0-470-40588-8.
- Devereux, M.; Jackman, M.; McCann, M.; Casey, M. Preparation and Catalase-Type Activity of Manganese(II) Amino Acid Complexes. Polyhedron 1998, 17, 153–158. [Google Scholar] [CrossRef]
- Komova, O.V.; Mukha, S.A.; Ozerova, A.M.; Odegova, G.V.; Simagina, V.I.; Bulavchenko, O.A.; Ishchenko, A.V.; Netskina, O.V. The Formation of Perovskite during the Combustion of an Energy-Rich Glycine–Nitrate Precursor. Materials 2020, 13, 5091. [Google Scholar] [CrossRef]
- Hegedüs, A.J.; Horkay, K.; Székely, M.; Stefániay, W. Thermogravimetrische Untersuchung der Mangan(II)-oxid-Pyrolyse. Mikrochim Acta 1966, 54, 853–864. [Google Scholar] [CrossRef]
- Greenberg, J.; Hallgren, L.J. Infrared Absorption Spectra of Alkali Metal Nitrates and Nitrites above and below the Melting Point. The Journal of Chemical Physics 1960, 33, 900–902. [Google Scholar] [CrossRef]
- Gallagher, P.K.; Schrey, F.; Prescott, B. The Thermal Decomposition of Aqueous Manganese (II) Nitrate Solution. Thermochimica Acta 1971, 2, 405–412. [Google Scholar] [CrossRef]
- Huang, M.; Lv, S.; Zhou, C. Thermal Decomposition Kinetics of Glycine in Nitrogen Atmosphere. Thermochimica Acta 2013, 552, 60–64. [Google Scholar] [CrossRef]
- Casale, A.; De Robertis, A.; De Stefano, C.; Gianguzza, A.; Patanè, G.; Rigano, C.; Sammartano, S. Thermodynamic Parameters for the Formation of Glycine Complexes with Magnesium(II), Calcium(II), Lead(II), Manganese(II), Cobalt(II), Nickel(II), Zinc(II) and Cadmium(II) at Different Temperatures and Ionic Strengths, with Particular Reference to Natural Fluid Conditions. Thermochimica Acta 1995, 255, 109–141. [Google Scholar] [CrossRef]
- Yamashita, H.; Nozaki, T.; Fukuda, Y.; Kabata, T. A Polarographic Study of the Glycine Complexes of Copper(II), Lead(II), Cadmium(II), and Manganese(II). BCSJ 1991, 64, 697–698. [Google Scholar] [CrossRef]
- Wen, W.; Wu, J.-M. Nanomaterials via Solution Combustion Synthesis: A Step Nearer to Controllability. RSC Adv. 2014, 4, 58090–58100. [Google Scholar] [CrossRef]
- Fritsch, S.; Navrotsky, A. Thermodynamic Properties of Manganese Oxides. Journal of the American Ceramic Society 1996, 79, 1761–1768. [Google Scholar] [CrossRef]
- Matzapetakis, M.; Karligiano, N.; Bino, A.; Dakanali, M.; Raptopoulou, C.P.; Tangoulis, V.; Terzis, A.; Giapintzakis, J.; Salifoglou, A. Manganese Citrate Chemistry: Syntheses, Spectroscopic Studies, and Structural Characterizations of Novel Mononuclear, Water-Soluble Manganese Citrate Complexes. Inorganic Chemistry 2000, 39, 4044–4051. [Google Scholar] [CrossRef]
- Deng, Y.F.; Zhou, Z.H. Manganese Citrate Complexes: Syntheses, Crystal Structures and Thermal Properties. Journal of Coordination Chemistry 2009, 62, 778–788. [Google Scholar] [CrossRef]
- Strouse, J.; Layten, S.W.; Strouse, C.E. Structural Studies of Transition Metal Complexes of Triionized and Tetraionized Citrate. Models for the Coordination of the Citrate Ion to Transition Metal Ions in Solution and at the Active Site of Aconitase. J. Am. Chem. Soc. 1977, 99, 562–572. [Google Scholar] [CrossRef]
- Wang, W.; Zhang, X.; Chen, F.; Ma, C.; Chen, C.; Liu, Q.; Liao, D.; Li, L. Homo- and Hetero-Metallic Manganese Citrate Complexes: Syntheses, Crystal Structures and Magnetic Properties. Polyhedron 2005, 24, 1656–1668. [Google Scholar] [CrossRef]
- Feick, G.; Hainer, R.M. On the Thermal Decomposition of Ammonium Nitrate. Temperatures and Reaction Rate. Journal of the American Chemical Society 1954, 698, 5860–5863. [Google Scholar] [CrossRef]
- Chaturvedi, S.; Dave, P.N. Review on Thermal Decomposition of Ammonium Nitrate. Journal of Energetic Materials 2013, 31, 1–26. [Google Scholar] [CrossRef]
- Babrauskas, V.; Leggett, D. Thermal Decomposition of Ammonium Nitrate. Fire and Materials 2019, 1–19. [Google Scholar] [CrossRef]
- Grzybowski, A.K.; Tate, S.S.; Datta, S.P. Magnesium and Manganese Complexes of Citric and Isocitric Acids. J. Chem. Soc. A 1970, 241–245. [Google Scholar] [CrossRef]
- Wheatley, A.M.; Kaduk, J.A. Crystal Structures of Ammonium Citrates. Powder Diffr. 2019, 34, 35–43. [Google Scholar] [CrossRef]
- Barbooti, M.M.; Dhoaib, A.-S.A. Thermal Decomposition of Citric Acid. Thermochimica Acta 1986, 98, 119–126. [Google Scholar] [CrossRef]
- Wyrzykowski, D.; Hebanowska, E.; Nowak-Wiczk, G.; Makowski, M.; Chmurzyński, L. Thermal Behaviour of Citric Acid and Isomeric Aconitic Acids. Journal of Thermal Analysis and Calorimetry 2011, 104, 731–735. [Google Scholar] [CrossRef]
- Valletta, R.M.; Pliskin, W.A. Preparation and Characterization of Manganese Oxide Thin Films. THIN FILMS 1967, 114, 944–947. [Google Scholar] [CrossRef]
- Paleckiene, R.; Sviklas, A.; Slinksiene, R. Reaction of Urea with Citric Acid. Russ J Appl Chem 2005, 78, 1651–1655. [Google Scholar] [CrossRef]
- Schaber, P.M.; Colson, J.; Higgins, S.; Thielen, D.; Anspach, B.; Brauer, J. Thermal Decomposition (Pyrolysis) of Urea in an Open Reaction Vessel. Thermochimica Acta 2004, 424, 131–142. [Google Scholar] [CrossRef]
- Fleischmann, S.; Mitchell, J.B.; Wang, R.; Zhan, C.; Jiang, D.; Presser, V.; Augustyn, V. Pseudocapacitance: From Fundamental Understanding to High Power Energy Storage Materials. Chem. Rev. 2020, 120, 6738–6782. [Google Scholar] [CrossRef]
- Ryabova, A.S.; Napolskiy, F.S.; Poux, T.; Istomin, S.Ya.; Bonnefont, A.; Antipin, D.M.; Baranchikov, A.Ye.; Levin, E.E.; Abakumov, A.M.; Kéranguéven, G.; et al. Rationalizing the Influence of the Mn(IV)/Mn(III) Red-Ox Transition on the Electrocatalytic Activity of Manganese Oxides in the Oxygen Reduction Reaction. Electrochimica Acta 2016, 187, 161–172. [Google Scholar] [CrossRef]
- Garcês Gonçalves, P.R.; De Abreu, H.A.; Duarte, H.A. Stability, Structural, and Electronic Properties of Hausmannite (Mn3O4) Surfaces and Their Interaction with Water. Journal of Physical Chemistry C 2018, 122, 20841–20849. [Google Scholar] [CrossRef]
- Zhu, J.; Wu, Q.; Li, J. Review And Prospect of Mn 3 O 4 -Based Composite Materials For Supercapacitor Electrodes. ChemistrySelect 2020, 5, 10407–10423. [Google Scholar] [CrossRef]
- Jang, J.H.; Oh, S.M. Complex Capacitance Analysis of Porous Carbon Electrodes for Electric Double-Layer Capacitors. J. Electrochem. Soc. 2004, 151, A571. [Google Scholar] [CrossRef]
Figure 1.
ATR-FTIR spectra of dried precursors Mn(NO3)3·4H2O and Glycine, and their mixture with different ratios (A); TGA curves of in-air decomposition of Mn nitrate, Glycine, and their dried mixture (B), inset is the heat flow resulting from decomposition reaction.
Figure 1.
ATR-FTIR spectra of dried precursors Mn(NO3)3·4H2O and Glycine, and their mixture with different ratios (A); TGA curves of in-air decomposition of Mn nitrate, Glycine, and their dried mixture (B), inset is the heat flow resulting from decomposition reaction.
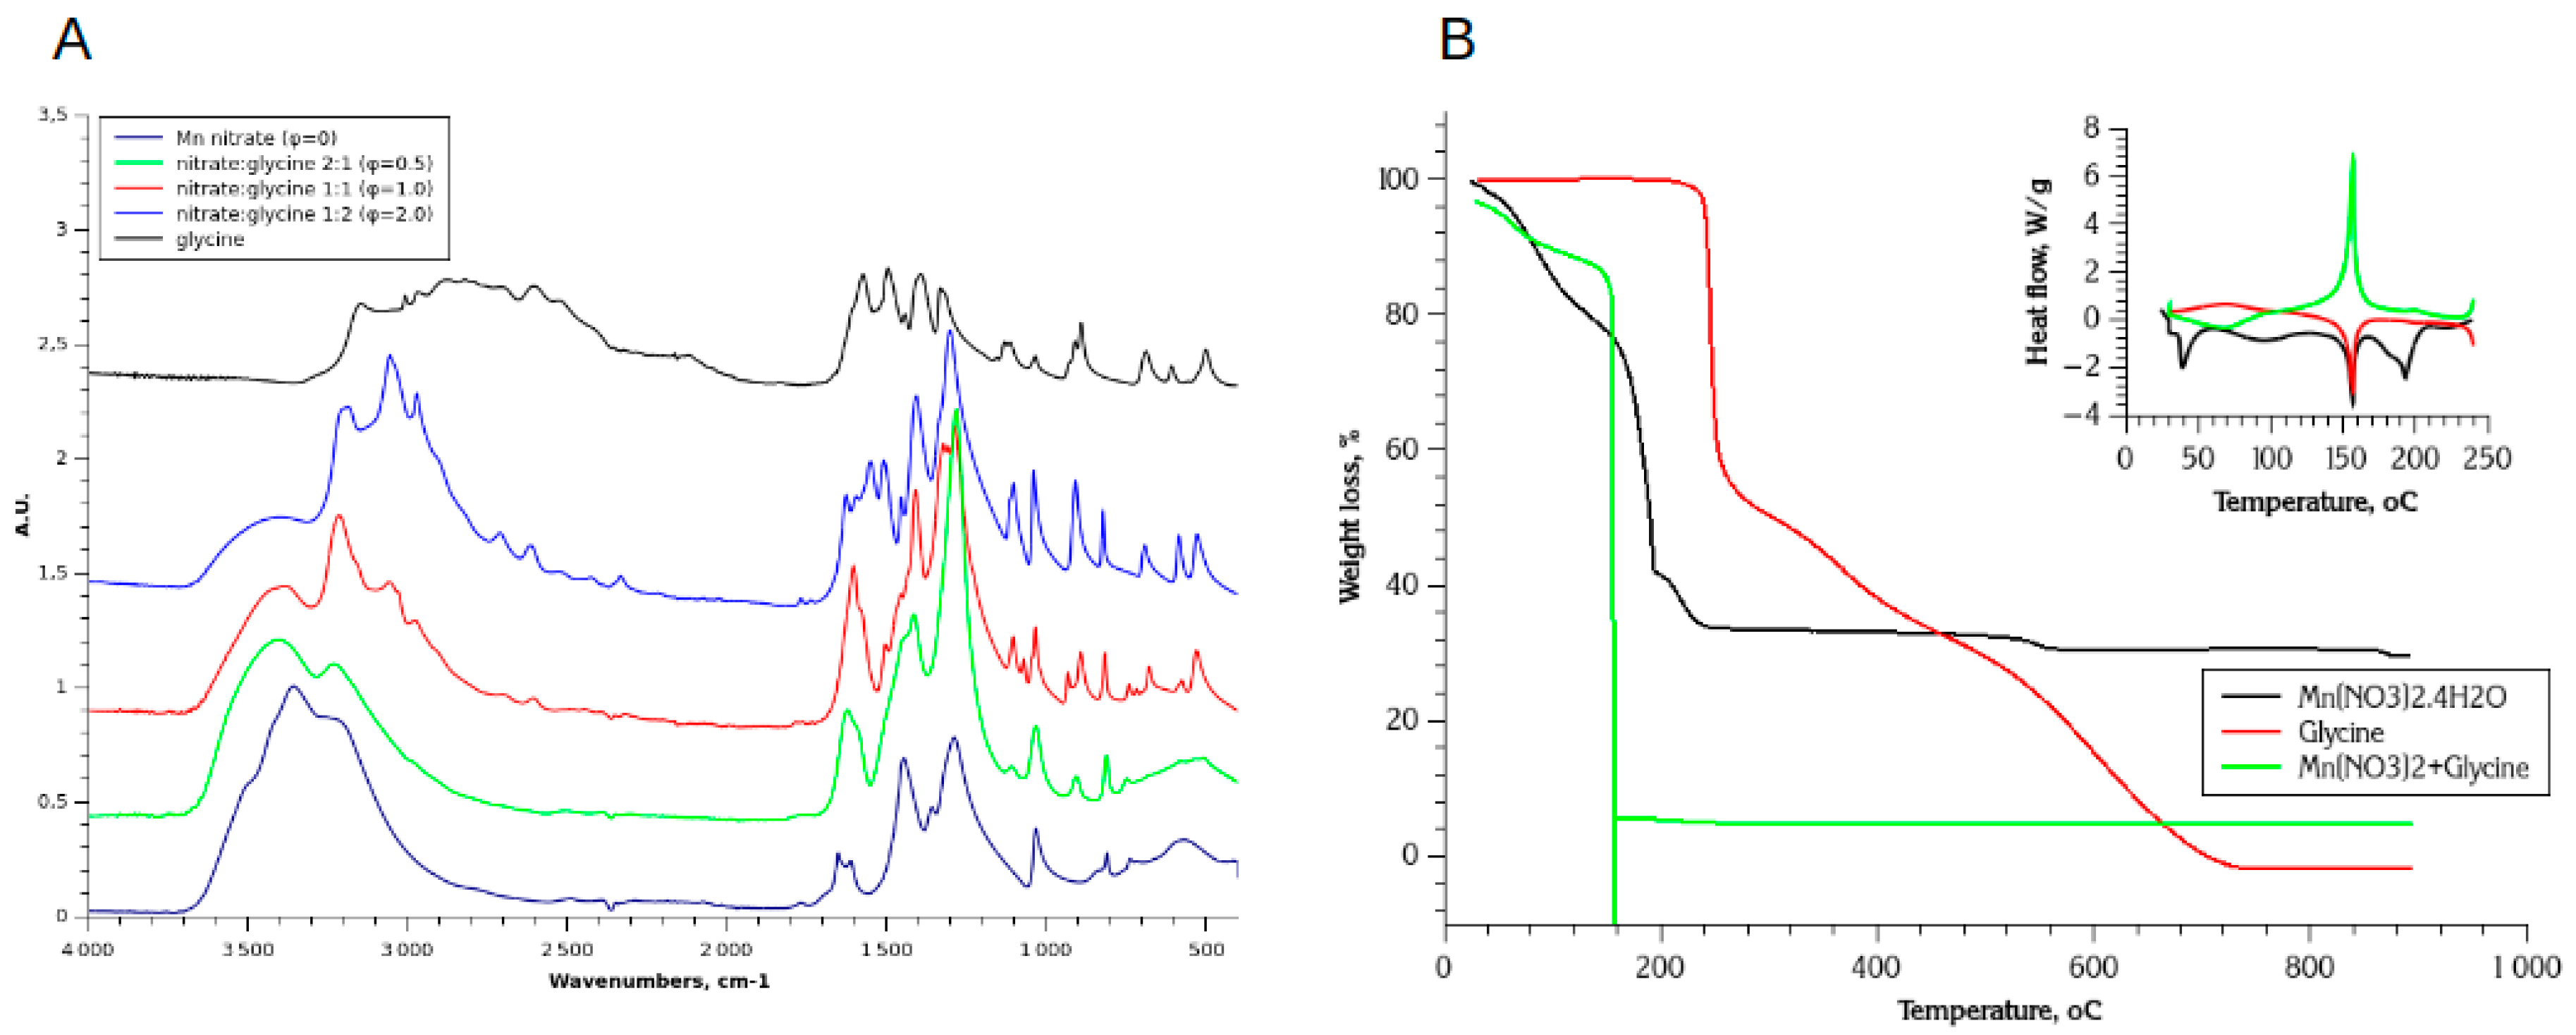
Figure 2.
DRIFT spectra of Mn(NO3)2 (A), Glycine (B), and their dried 1-1 mixture (C); the arrows shows the temperature for which the slice spectra are shown at the right side.
Figure 2.
DRIFT spectra of Mn(NO3)2 (A), Glycine (B), and their dried 1-1 mixture (C); the arrows shows the temperature for which the slice spectra are shown at the right side.
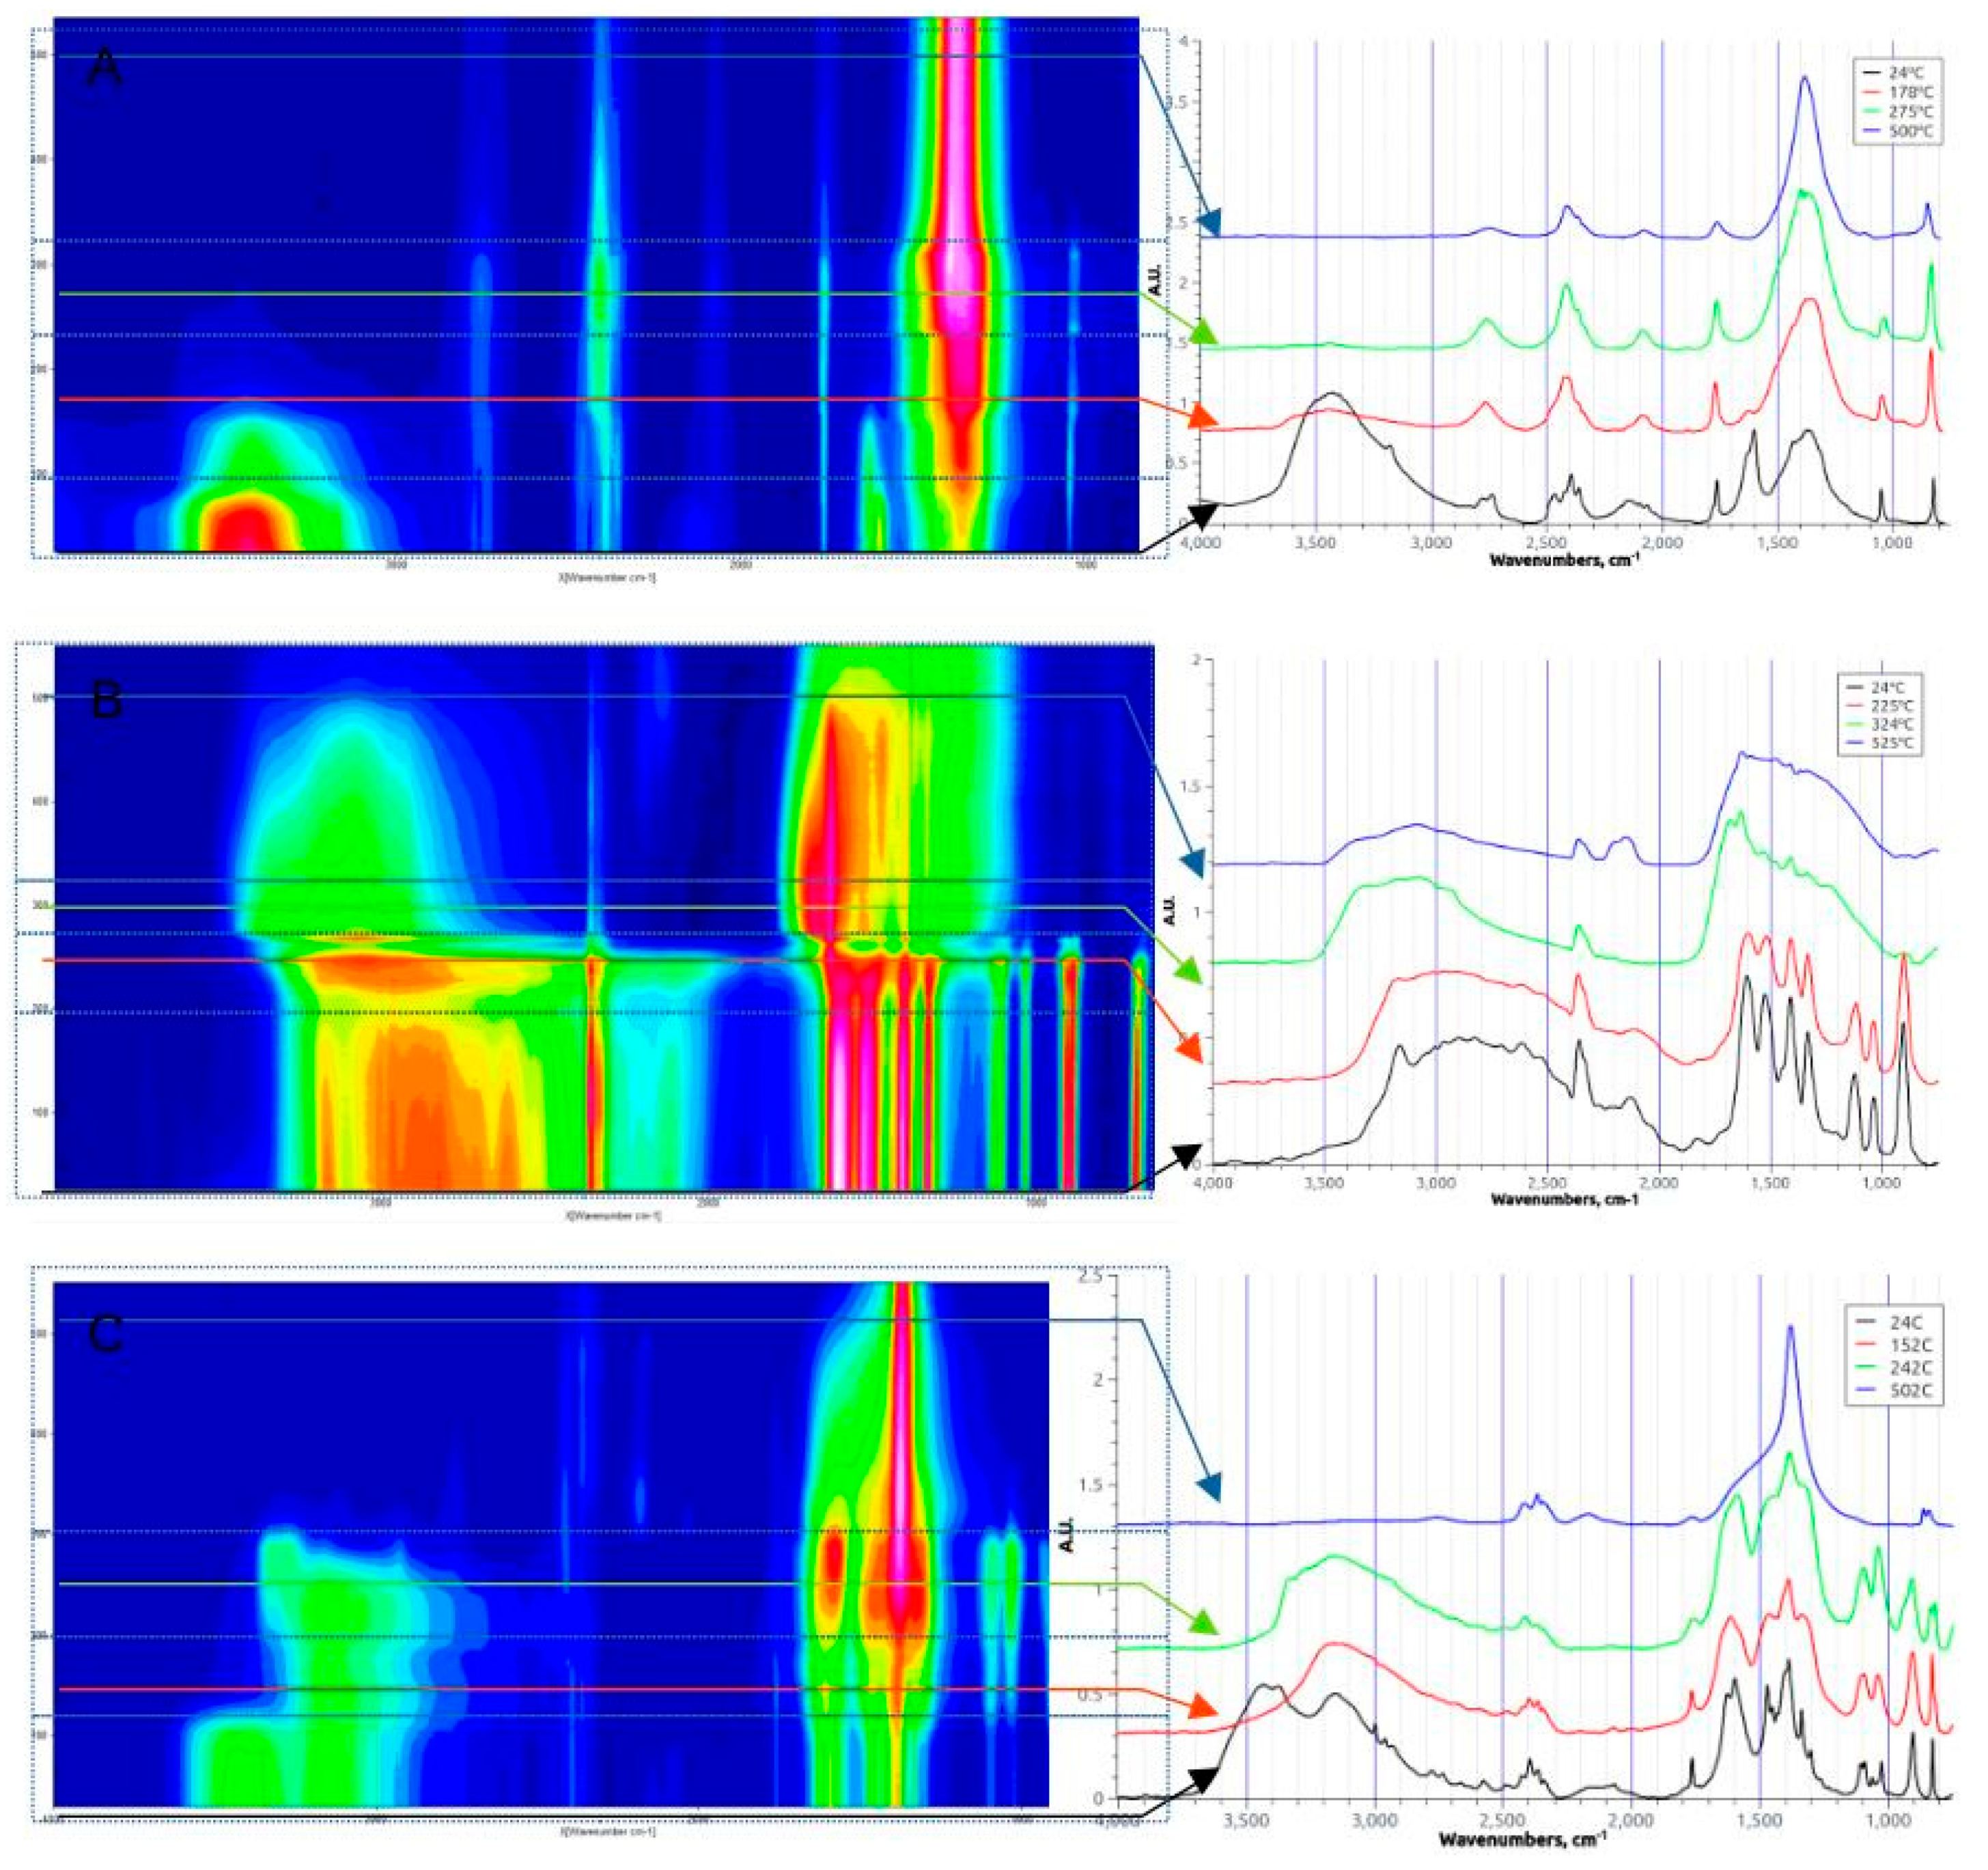
Figure 3.
XRD diagrams of Mn oxides prepared by SCS with nitrate-glycine mixture with different fuel-to-salt ratio φ (A). Typical SEM images of Mn oxide prepared by SCS with 1:1 nitrate-glycine mixture (B).
Figure 3.
XRD diagrams of Mn oxides prepared by SCS with nitrate-glycine mixture with different fuel-to-salt ratio φ (A). Typical SEM images of Mn oxide prepared by SCS with 1:1 nitrate-glycine mixture (B).
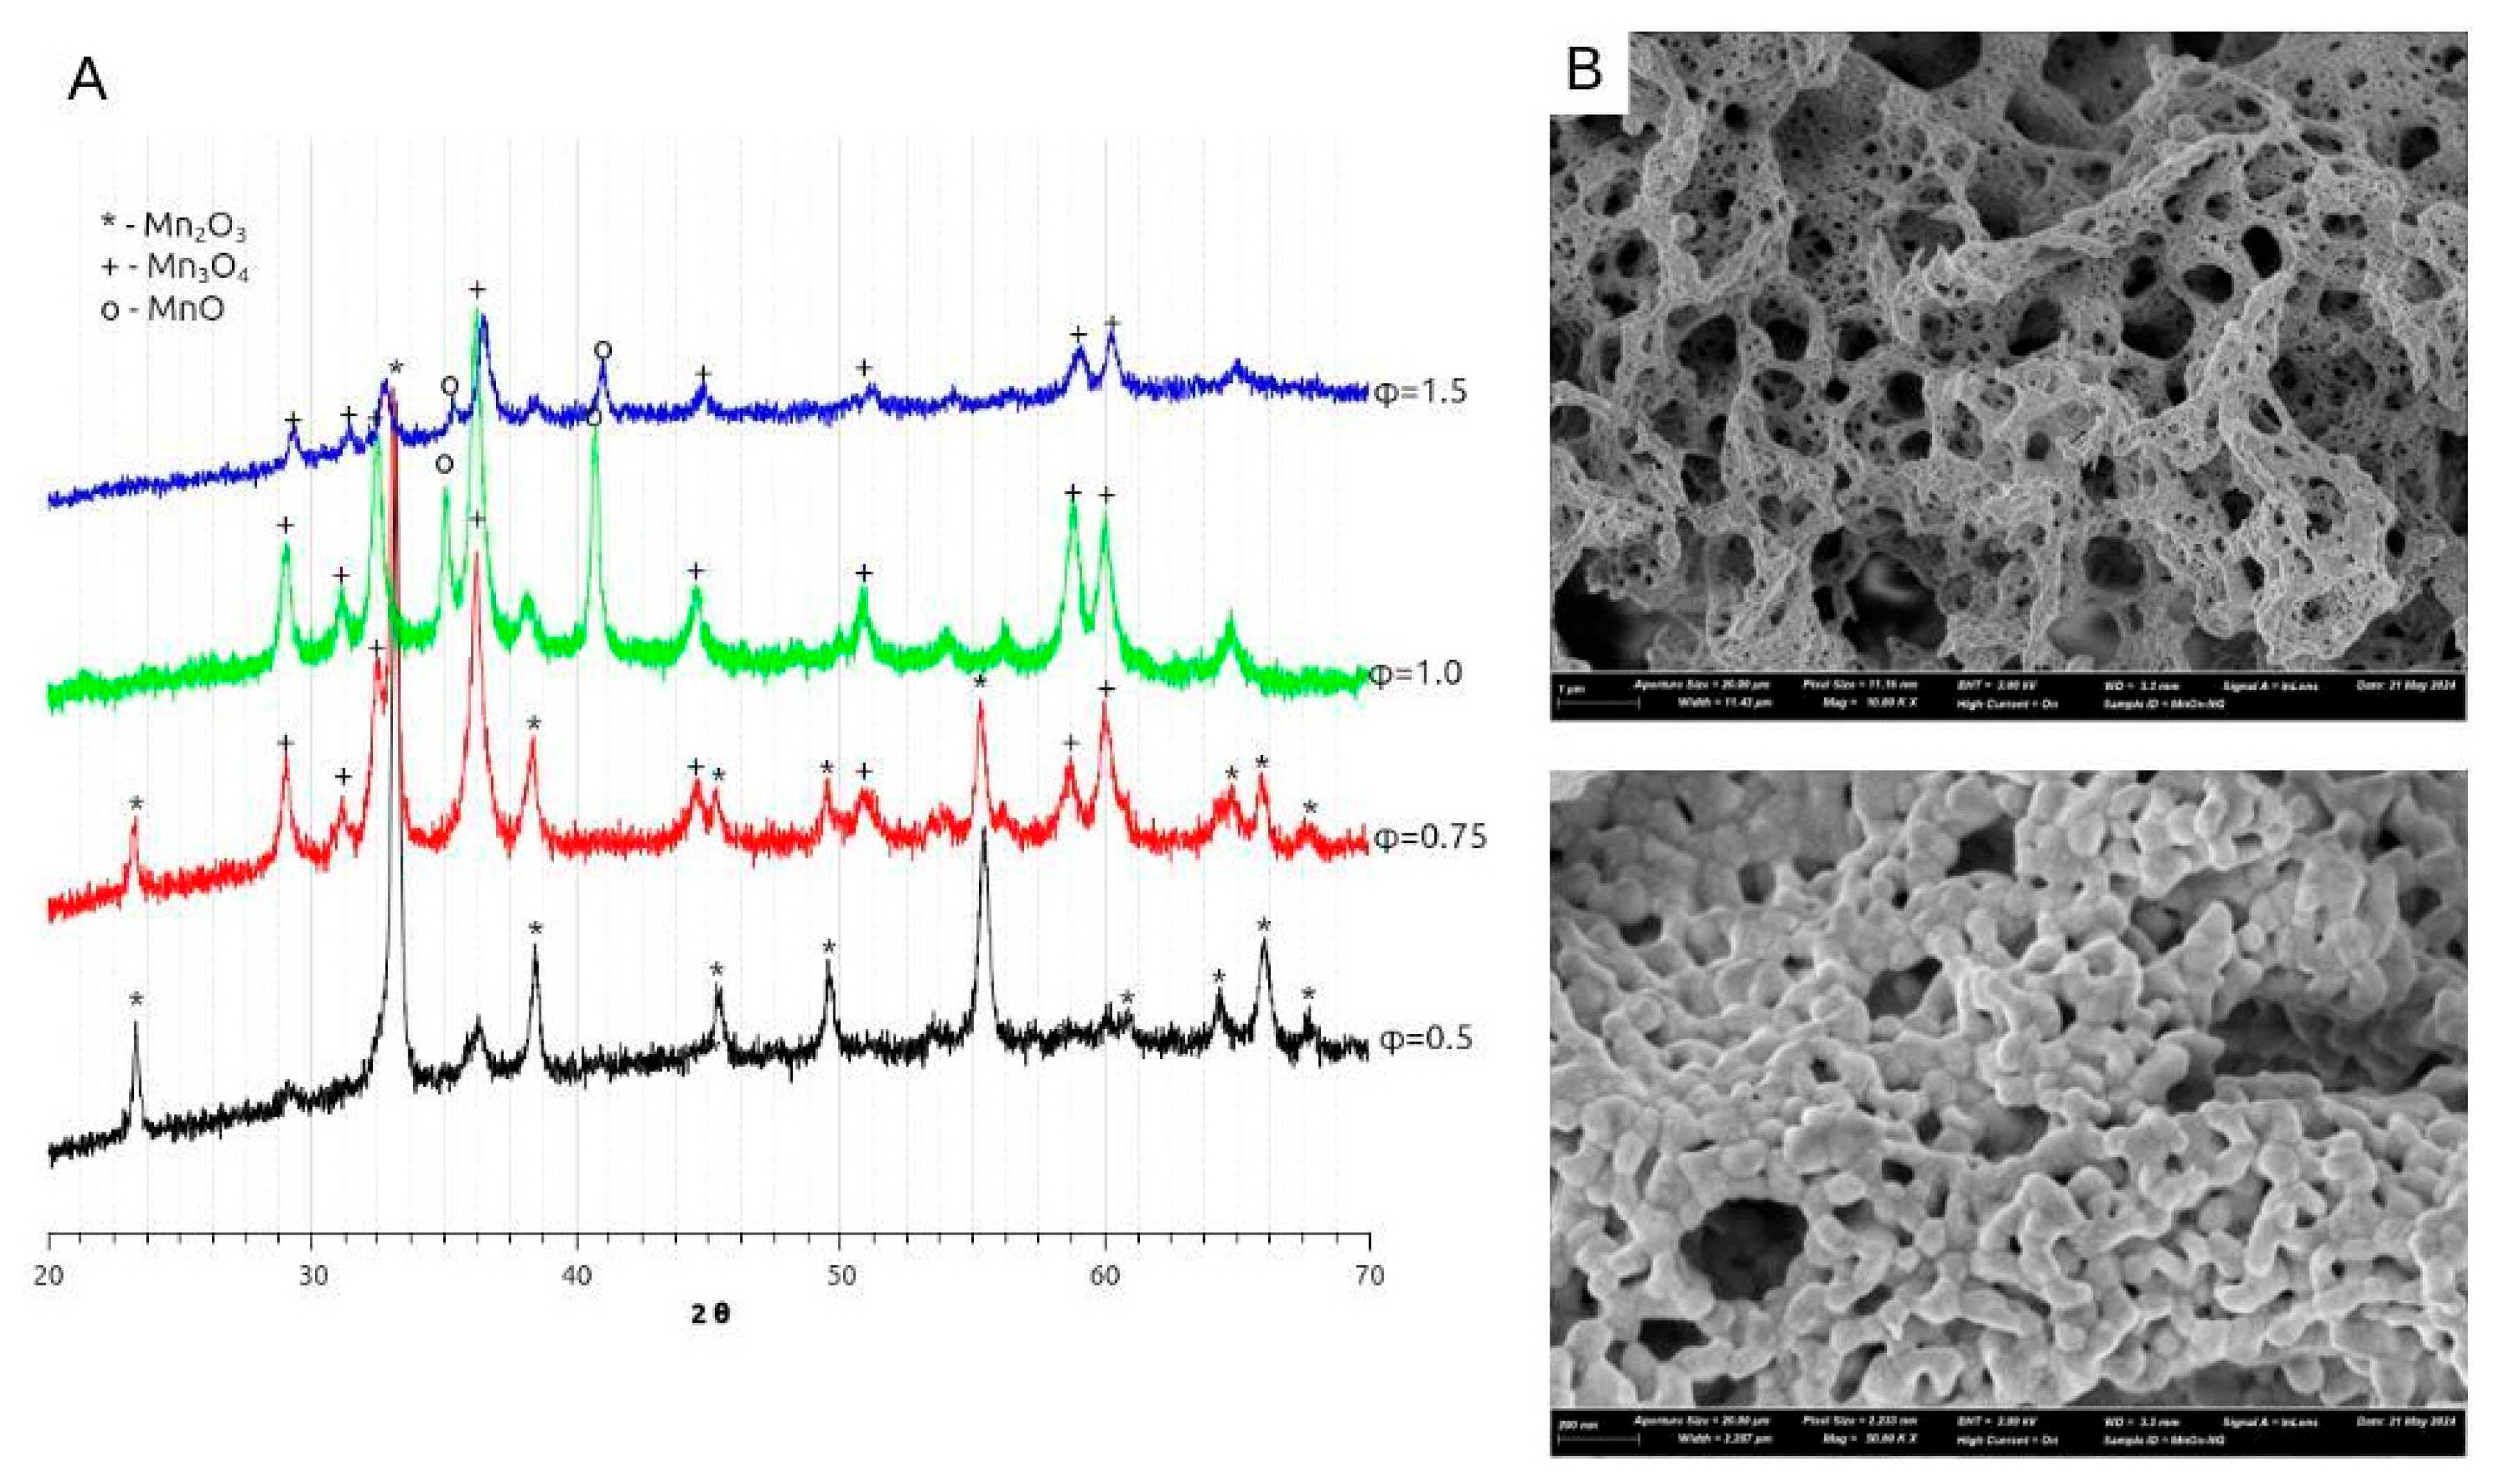
Figure 4.
ATR-FTIR spectra of SCS solid mixtures with ammonium citrate (A) ; TGA curves of in-air decomposition of SCS solid mixtures (B).
Figure 4.
ATR-FTIR spectra of SCS solid mixtures with ammonium citrate (A) ; TGA curves of in-air decomposition of SCS solid mixtures (B).
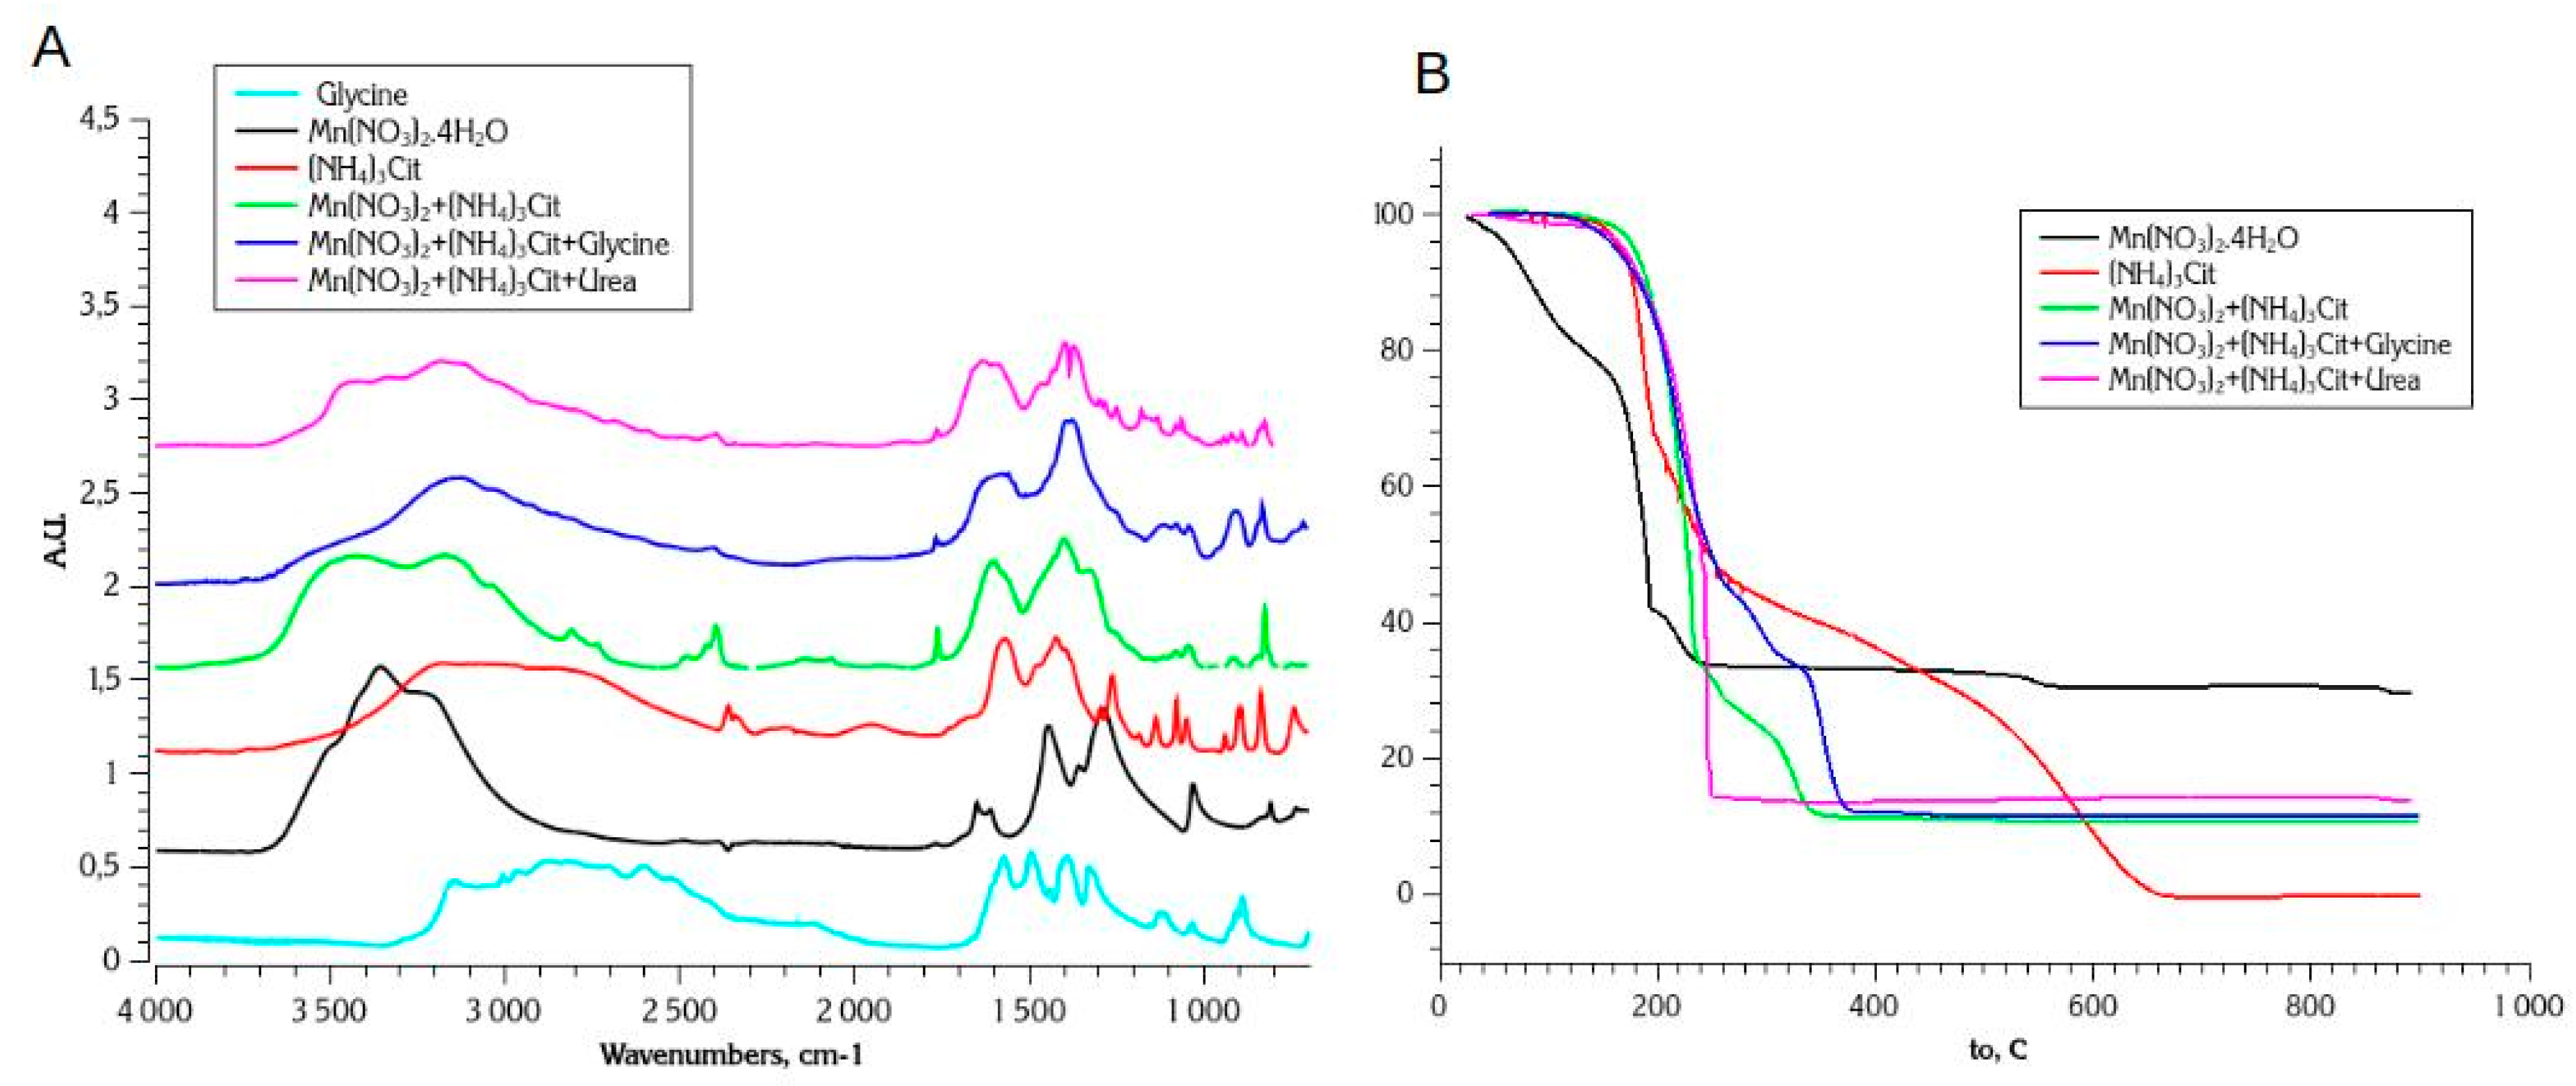
Figure 5.
DRIFT spectra of decomposition of SCS mixtures with ammonium citrate. Arrows indicate the temperature of slice spectra presented at the right side.
Figure 5.
DRIFT spectra of decomposition of SCS mixtures with ammonium citrate. Arrows indicate the temperature of slice spectra presented at the right side.
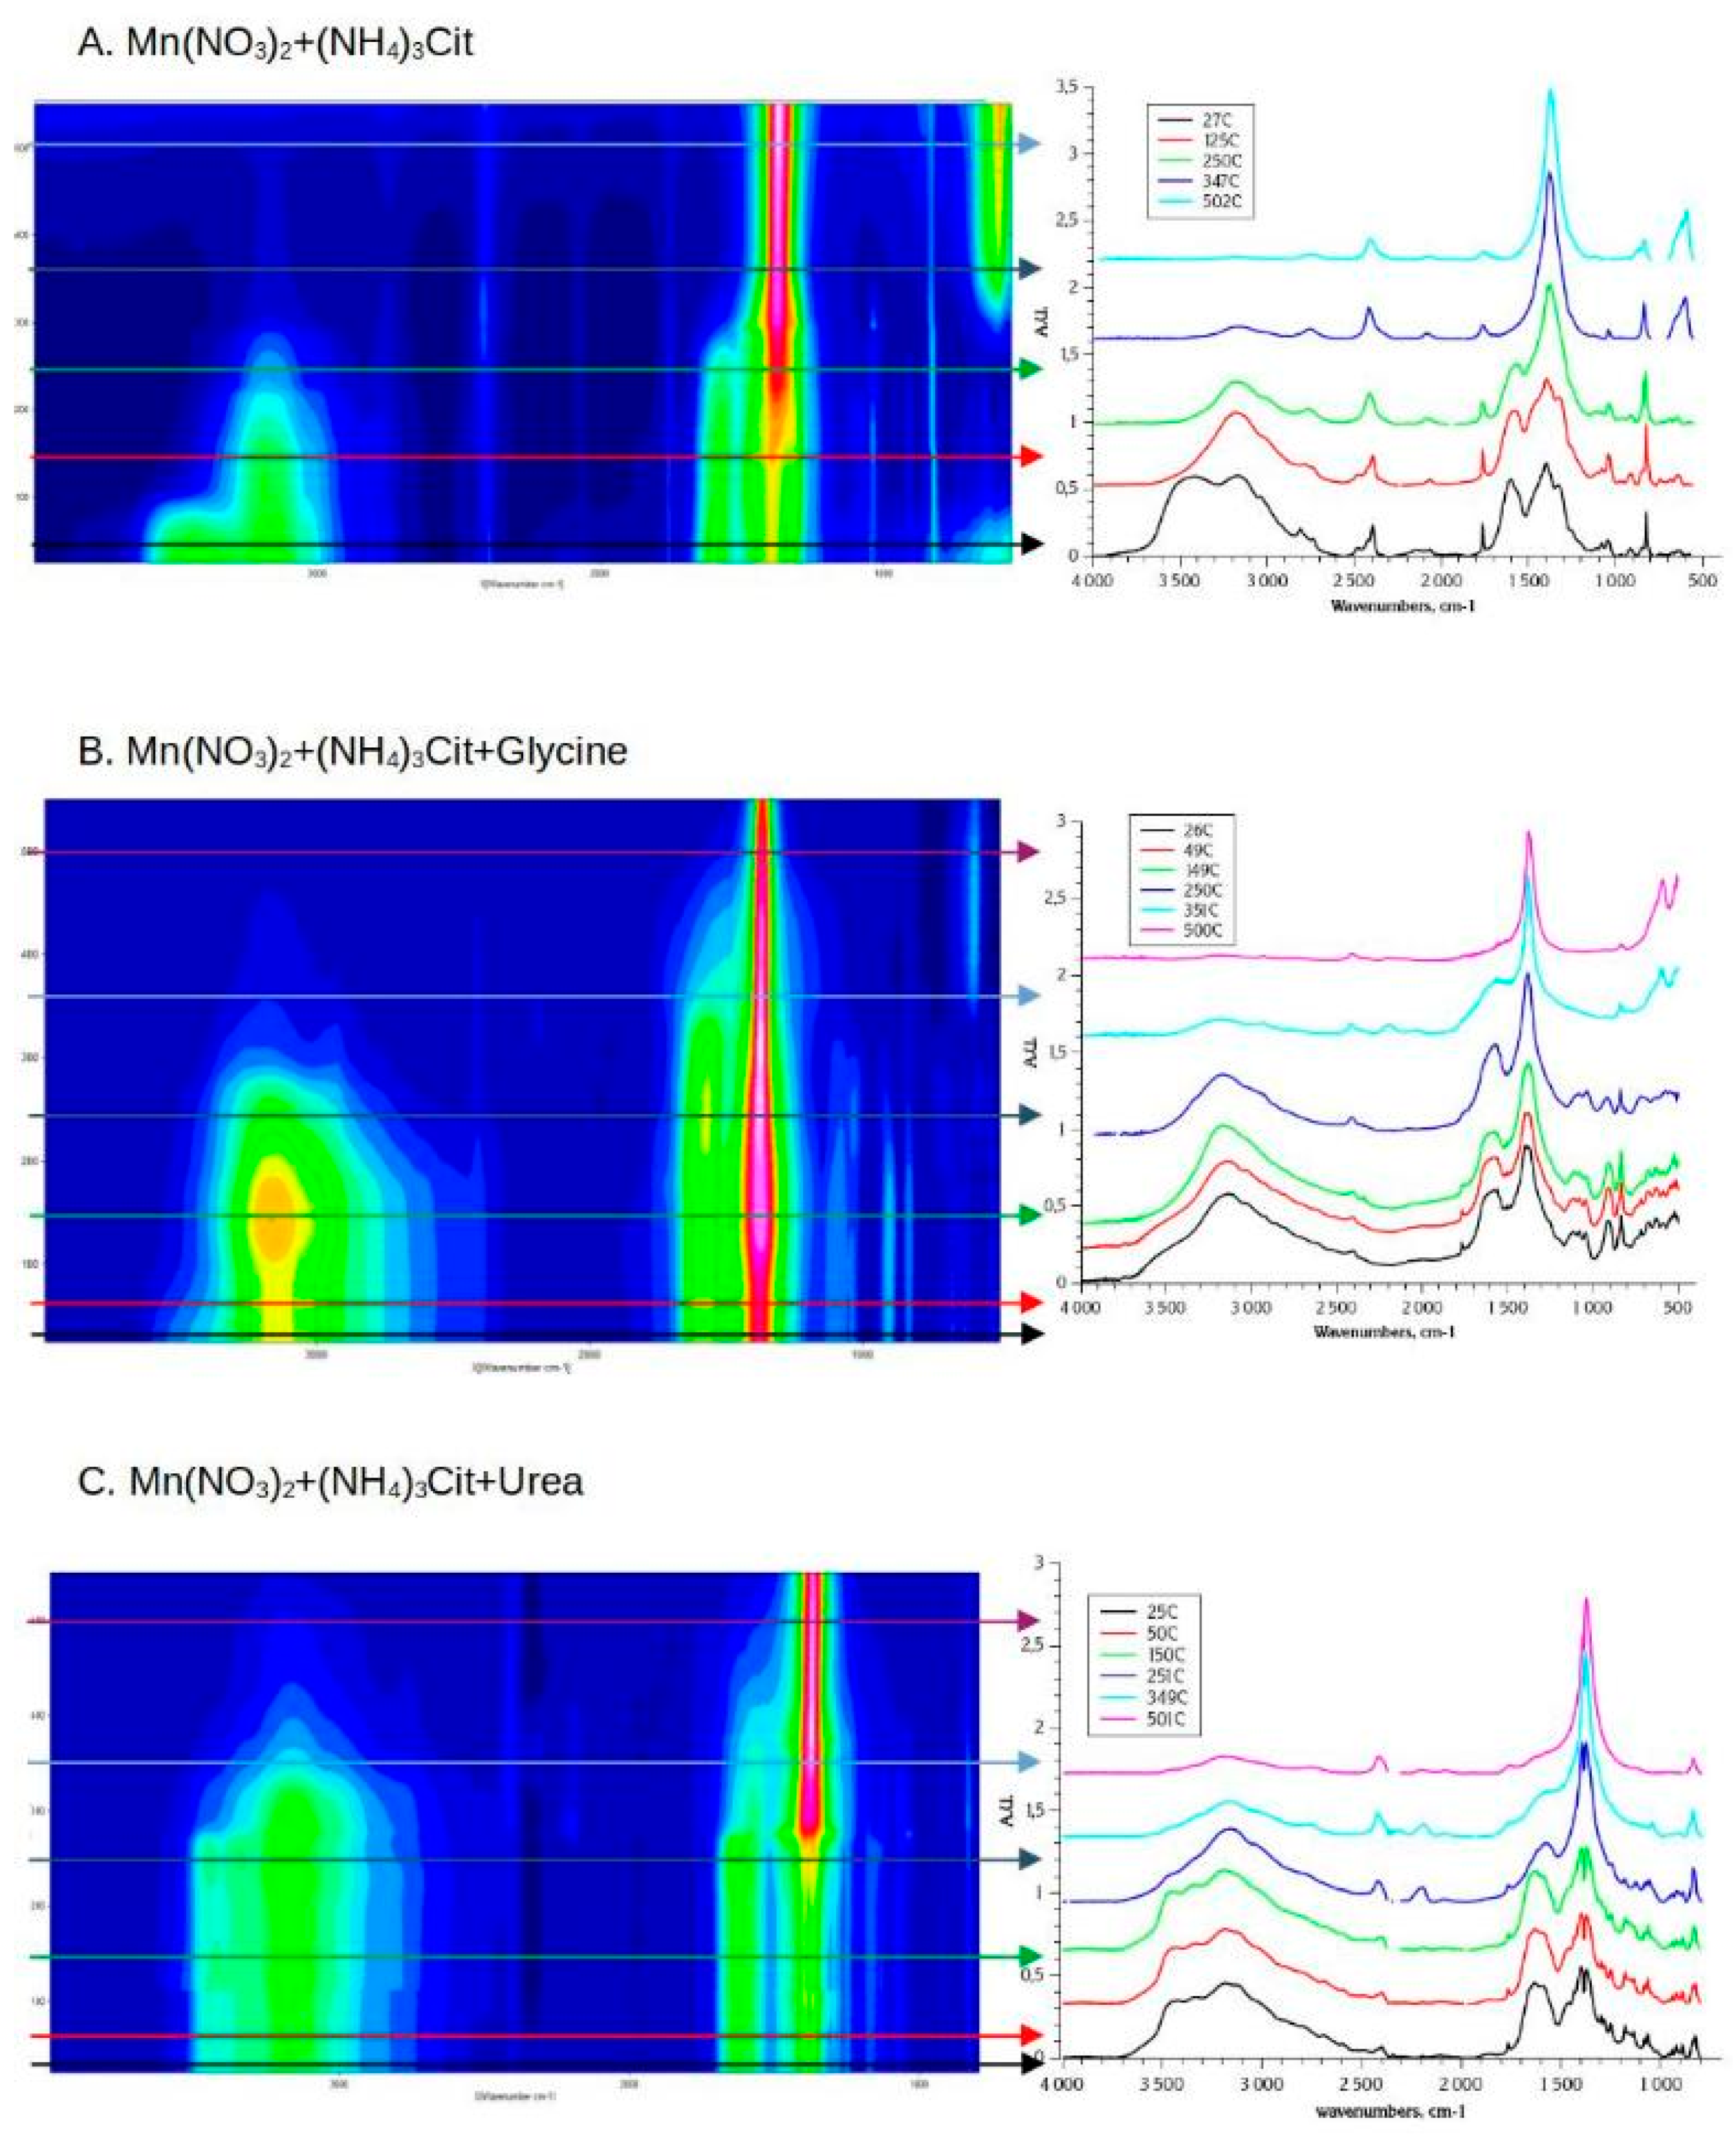
Figure 6.
XRD diagrams of Mn oxides synthesized by SCS using 1-1 nitrate-glycine, nitrate-citrate, and 1-1-1 nitrate-citrate-glycine and nitrate-citrate-urea mixtures (A) Typical SEM images of oxide synthesized with 1-1 nitrate-citrate (B), 1-1-1 nitrate-citrate-glycine (C), and 1-1-1 nitrate-citrate-urea mixtures (D).
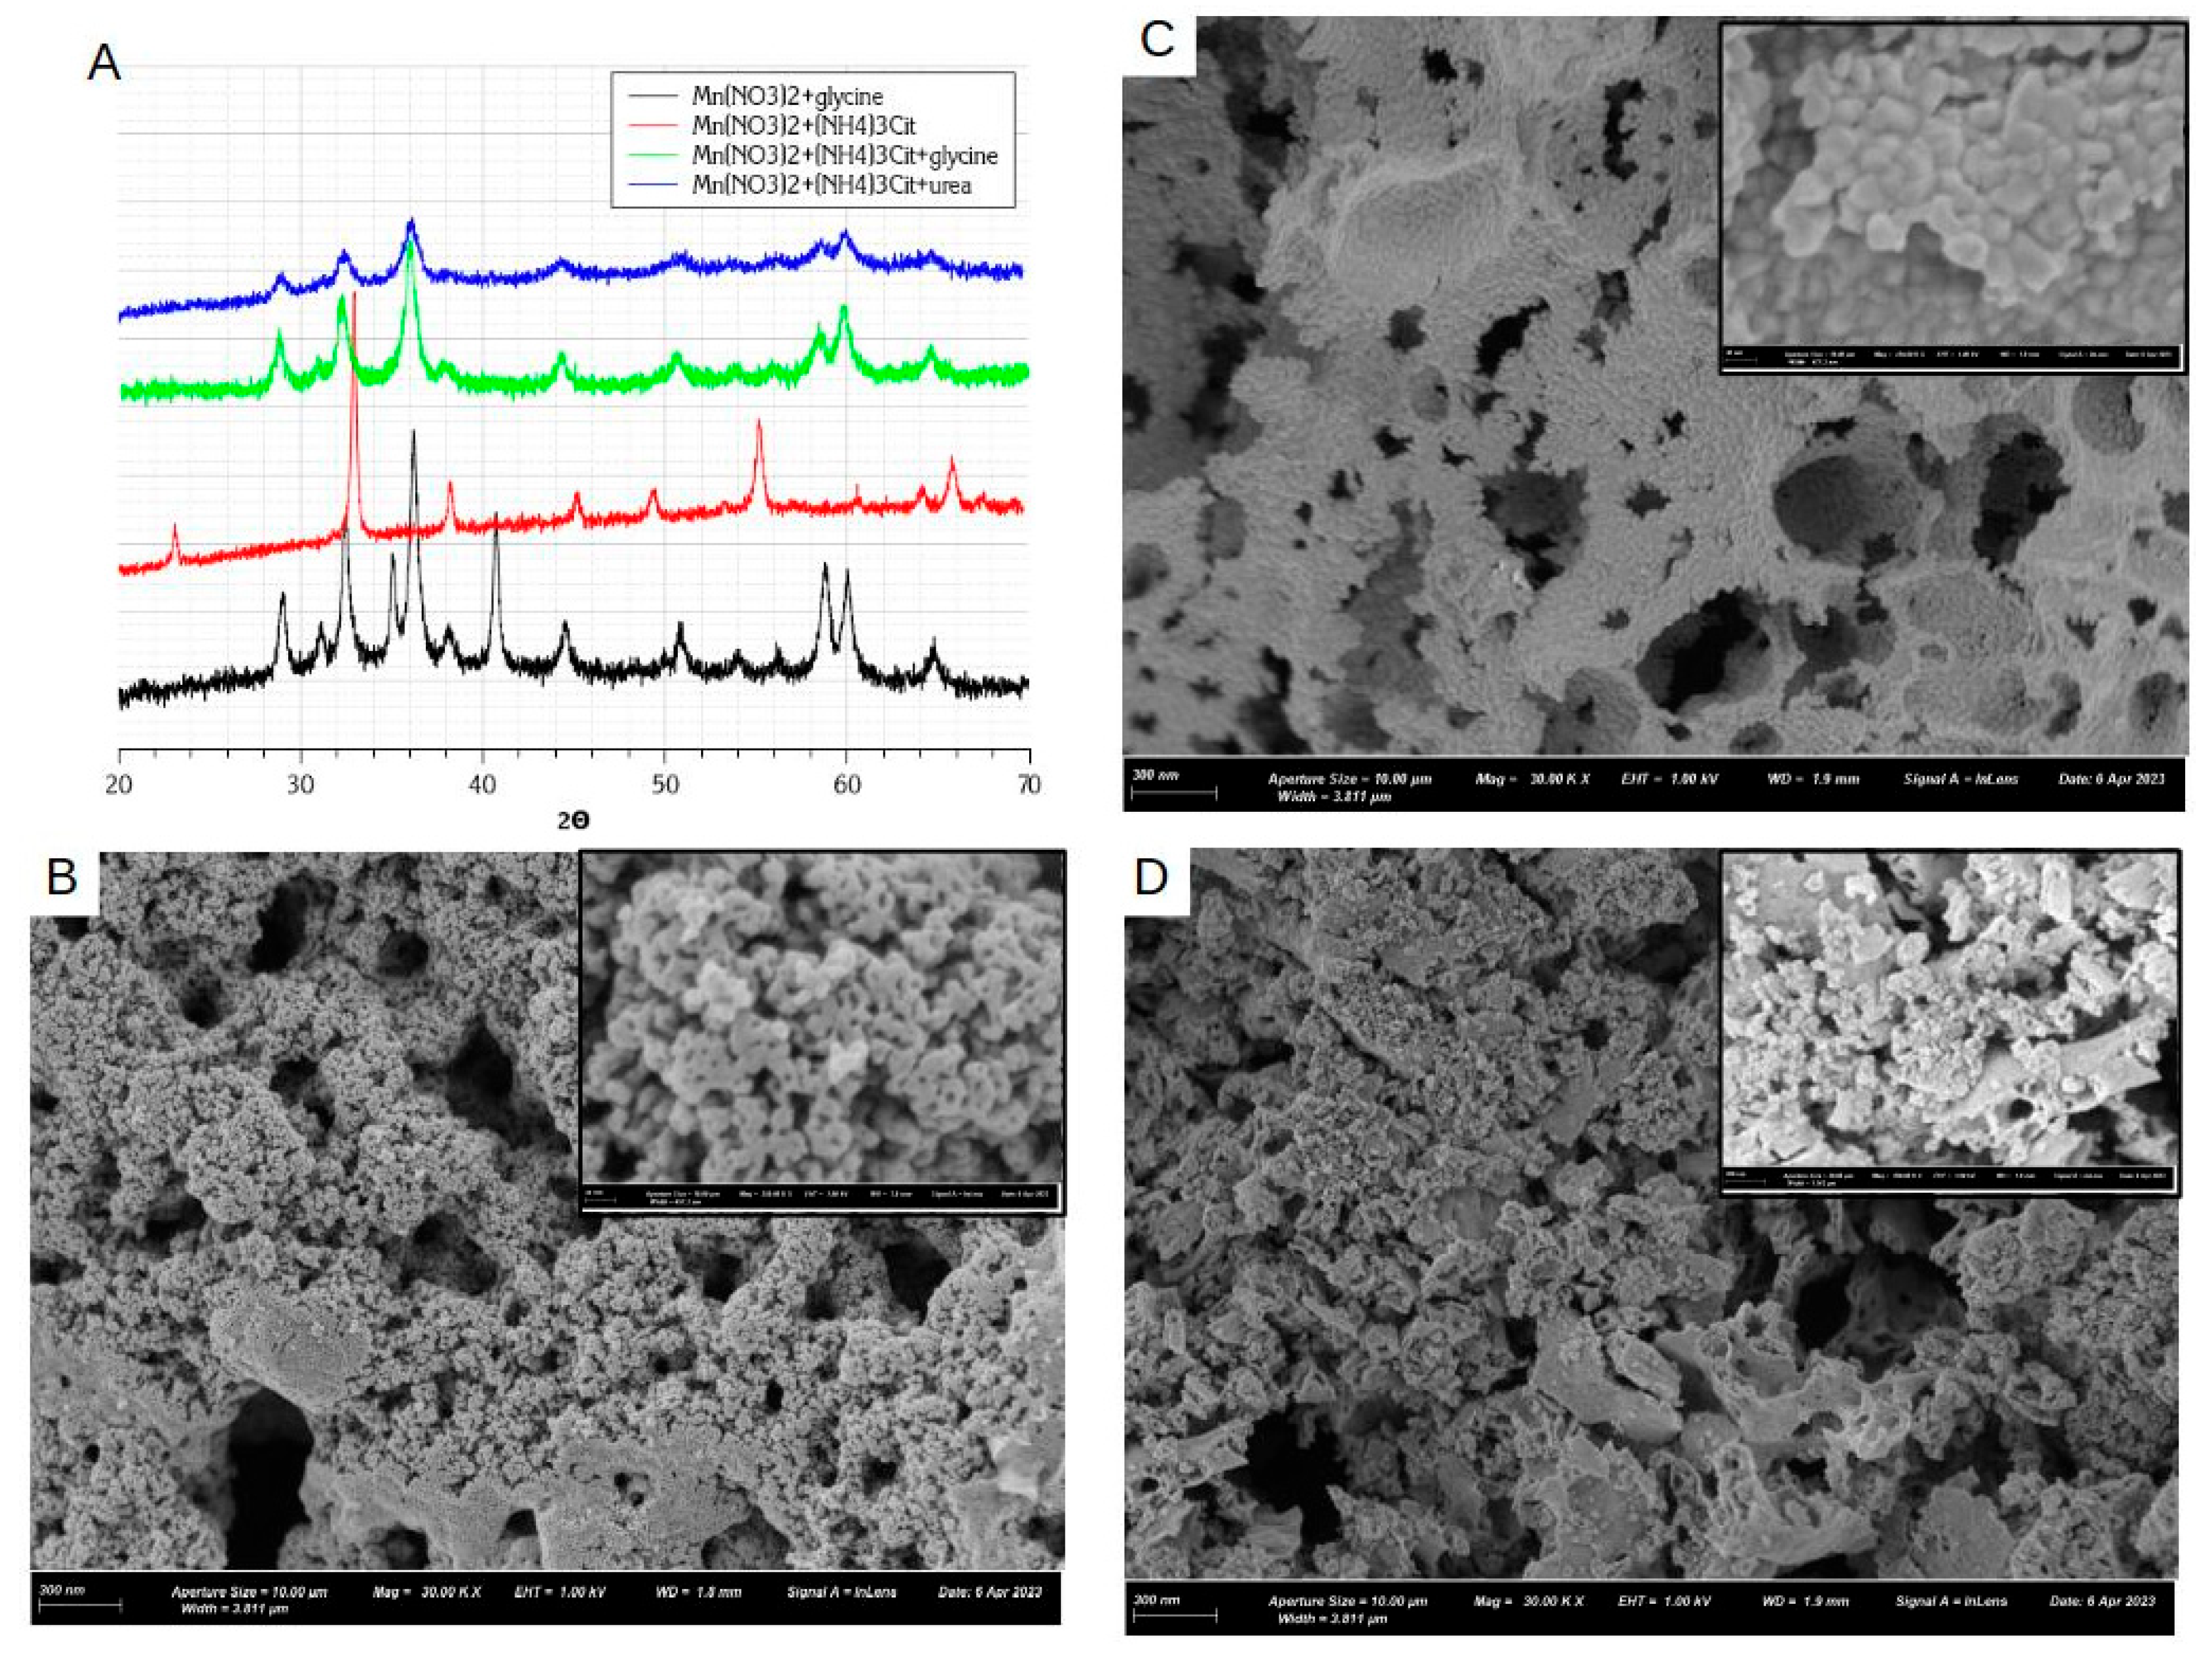
Figure 7.
CV curves of MnOx electrode materials in 1M NaOH at 20 mV/s (A) ; dependence of specific capacitance of MnOx on the charging rate (B) ; evolution of specific capacitance with galvanostatic charging cycling, measured at 2 A/g (C), chronopotentiogramms recorded during the galvanostatic cycling at 2 A/g.
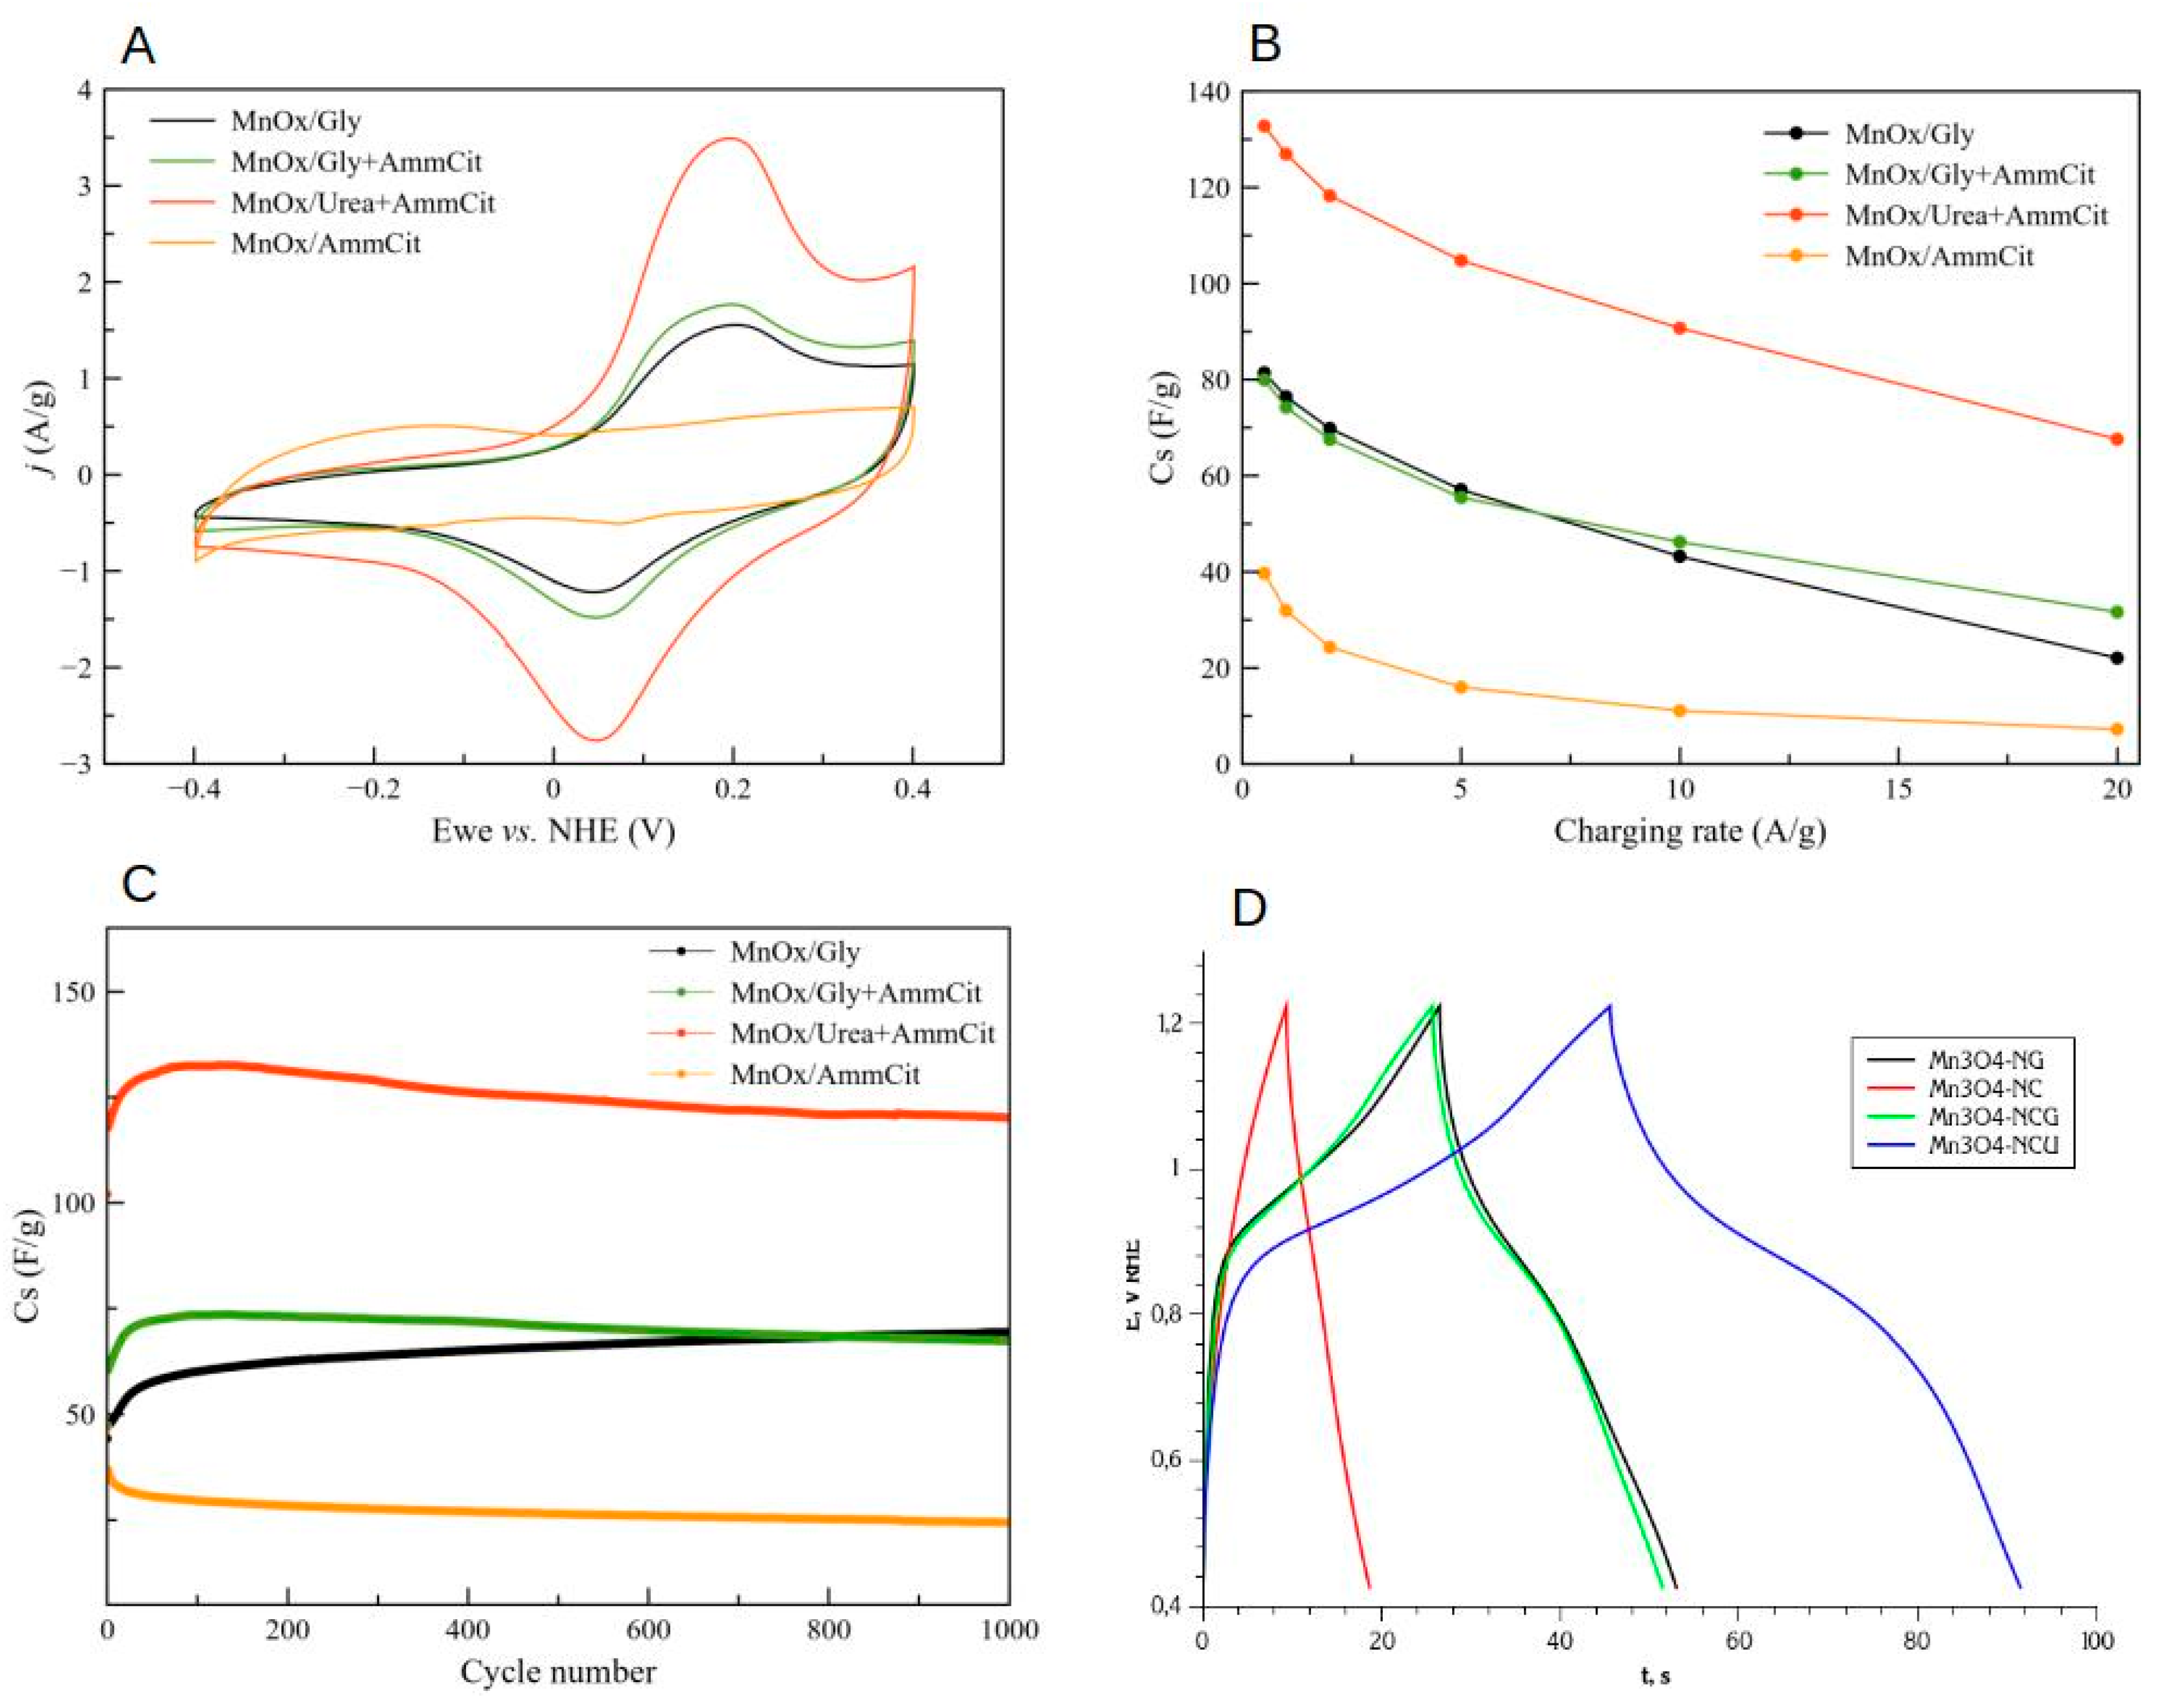
Figure 8.
Sweep rate dependence of the CV currents by Dunn method (A) with deconvolution of surface-controlled process for Mn3O4 synthetized with urea and ammonium citrate at a 10 mV/s scan rate in 1M NaOH (B).
Figure 8.
Sweep rate dependence of the CV currents by Dunn method (A) with deconvolution of surface-controlled process for Mn3O4 synthetized with urea and ammonium citrate at a 10 mV/s scan rate in 1M NaOH (B).
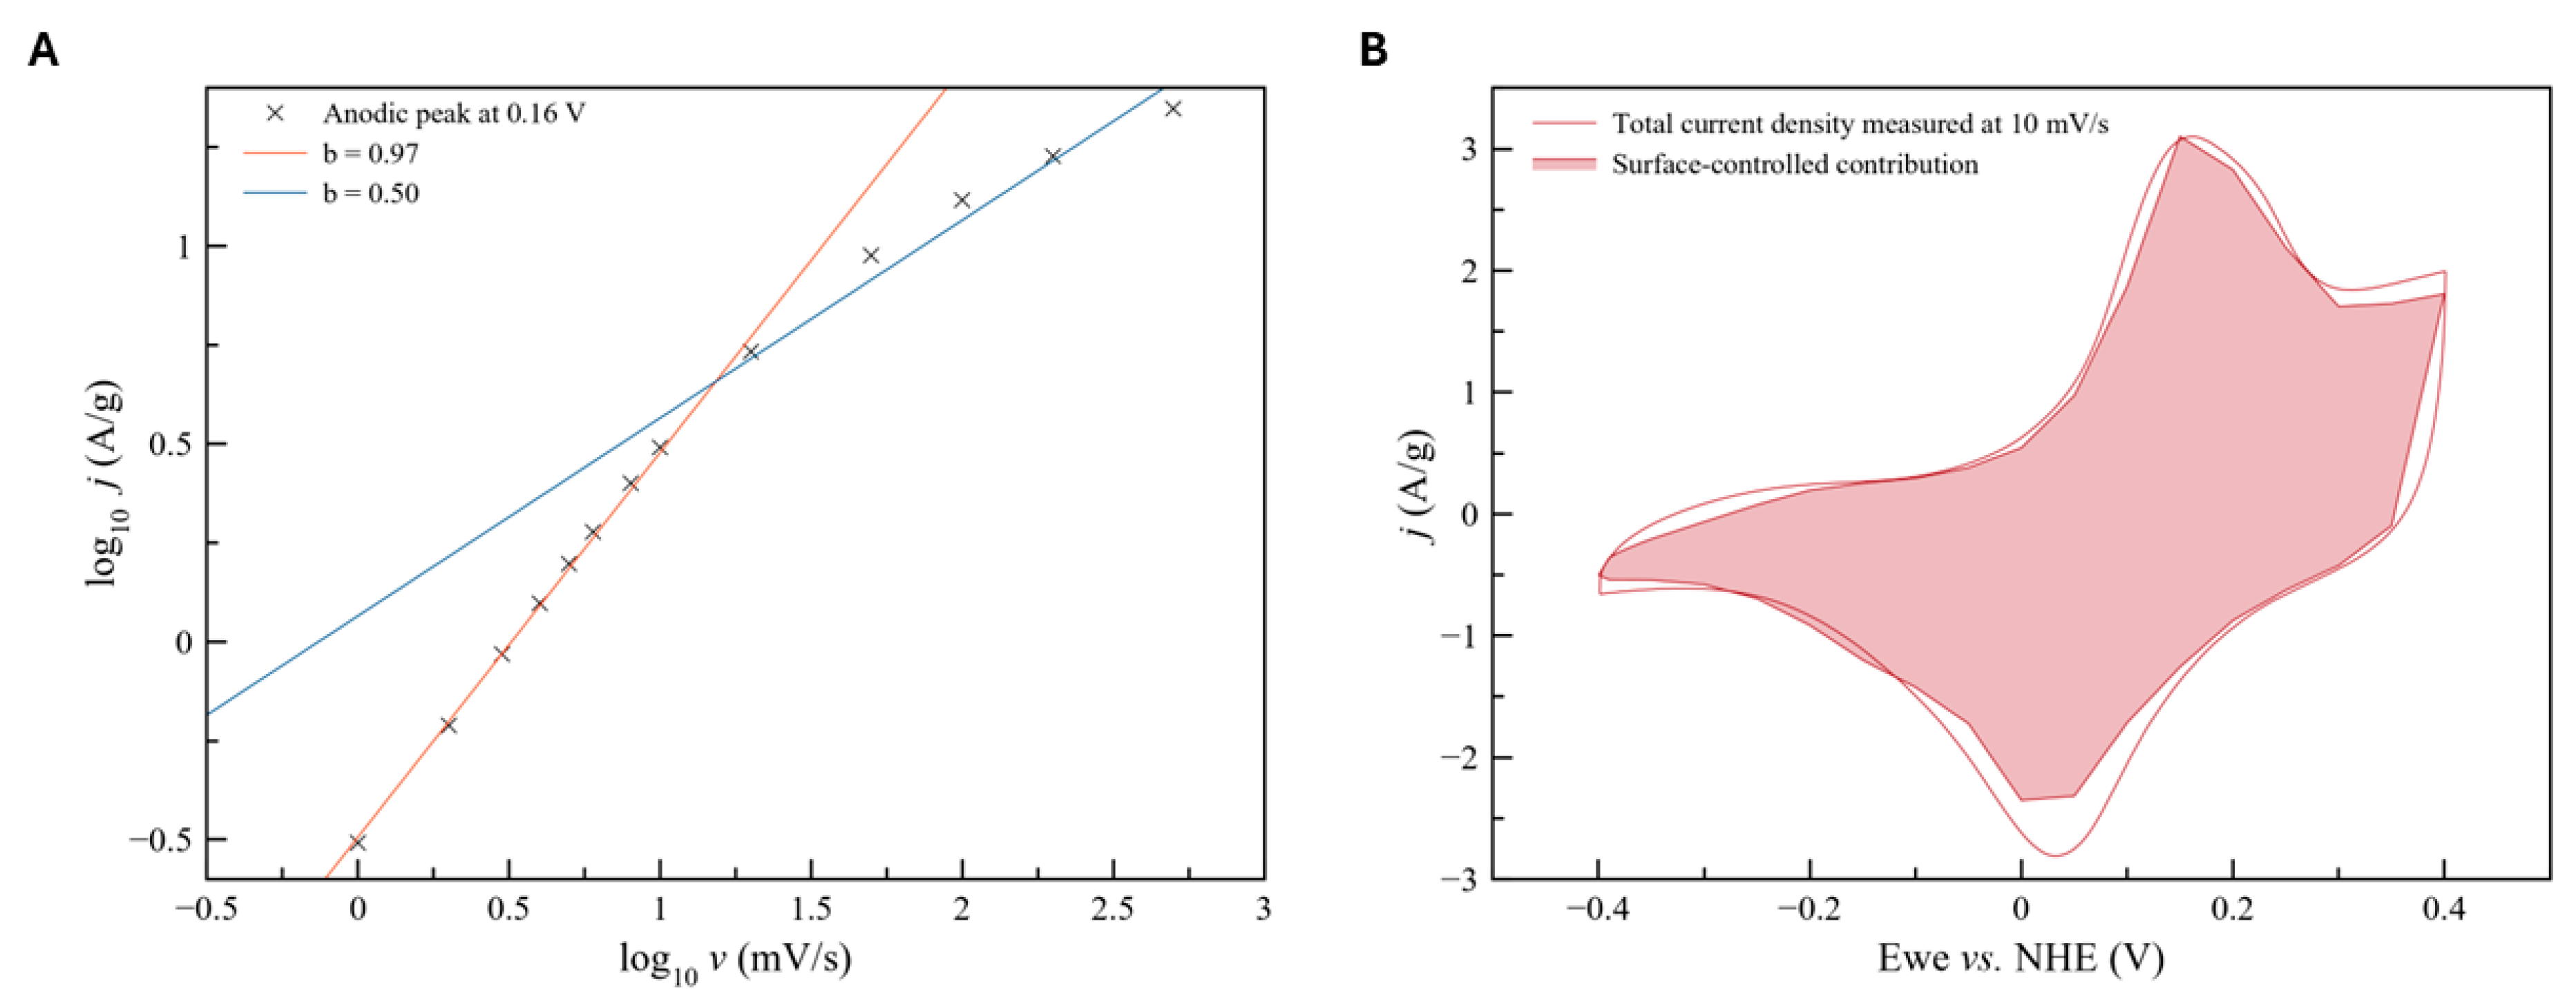
Figure 9.
Electrochemical impedance data for 4 studied oxide samples, measured in 1 M NaOH at 0,00 V Hg/HgO. Solid curves correspond to the initial state of the electrode, and dashed curves correspond to the data measured after 1000 galvanostatic charging cycles. The data shown as Nyquist plots (A), Bode plots showing impedance phase angle (B), real part (C) and imaginary part (D) of interfacial complex capacitance.
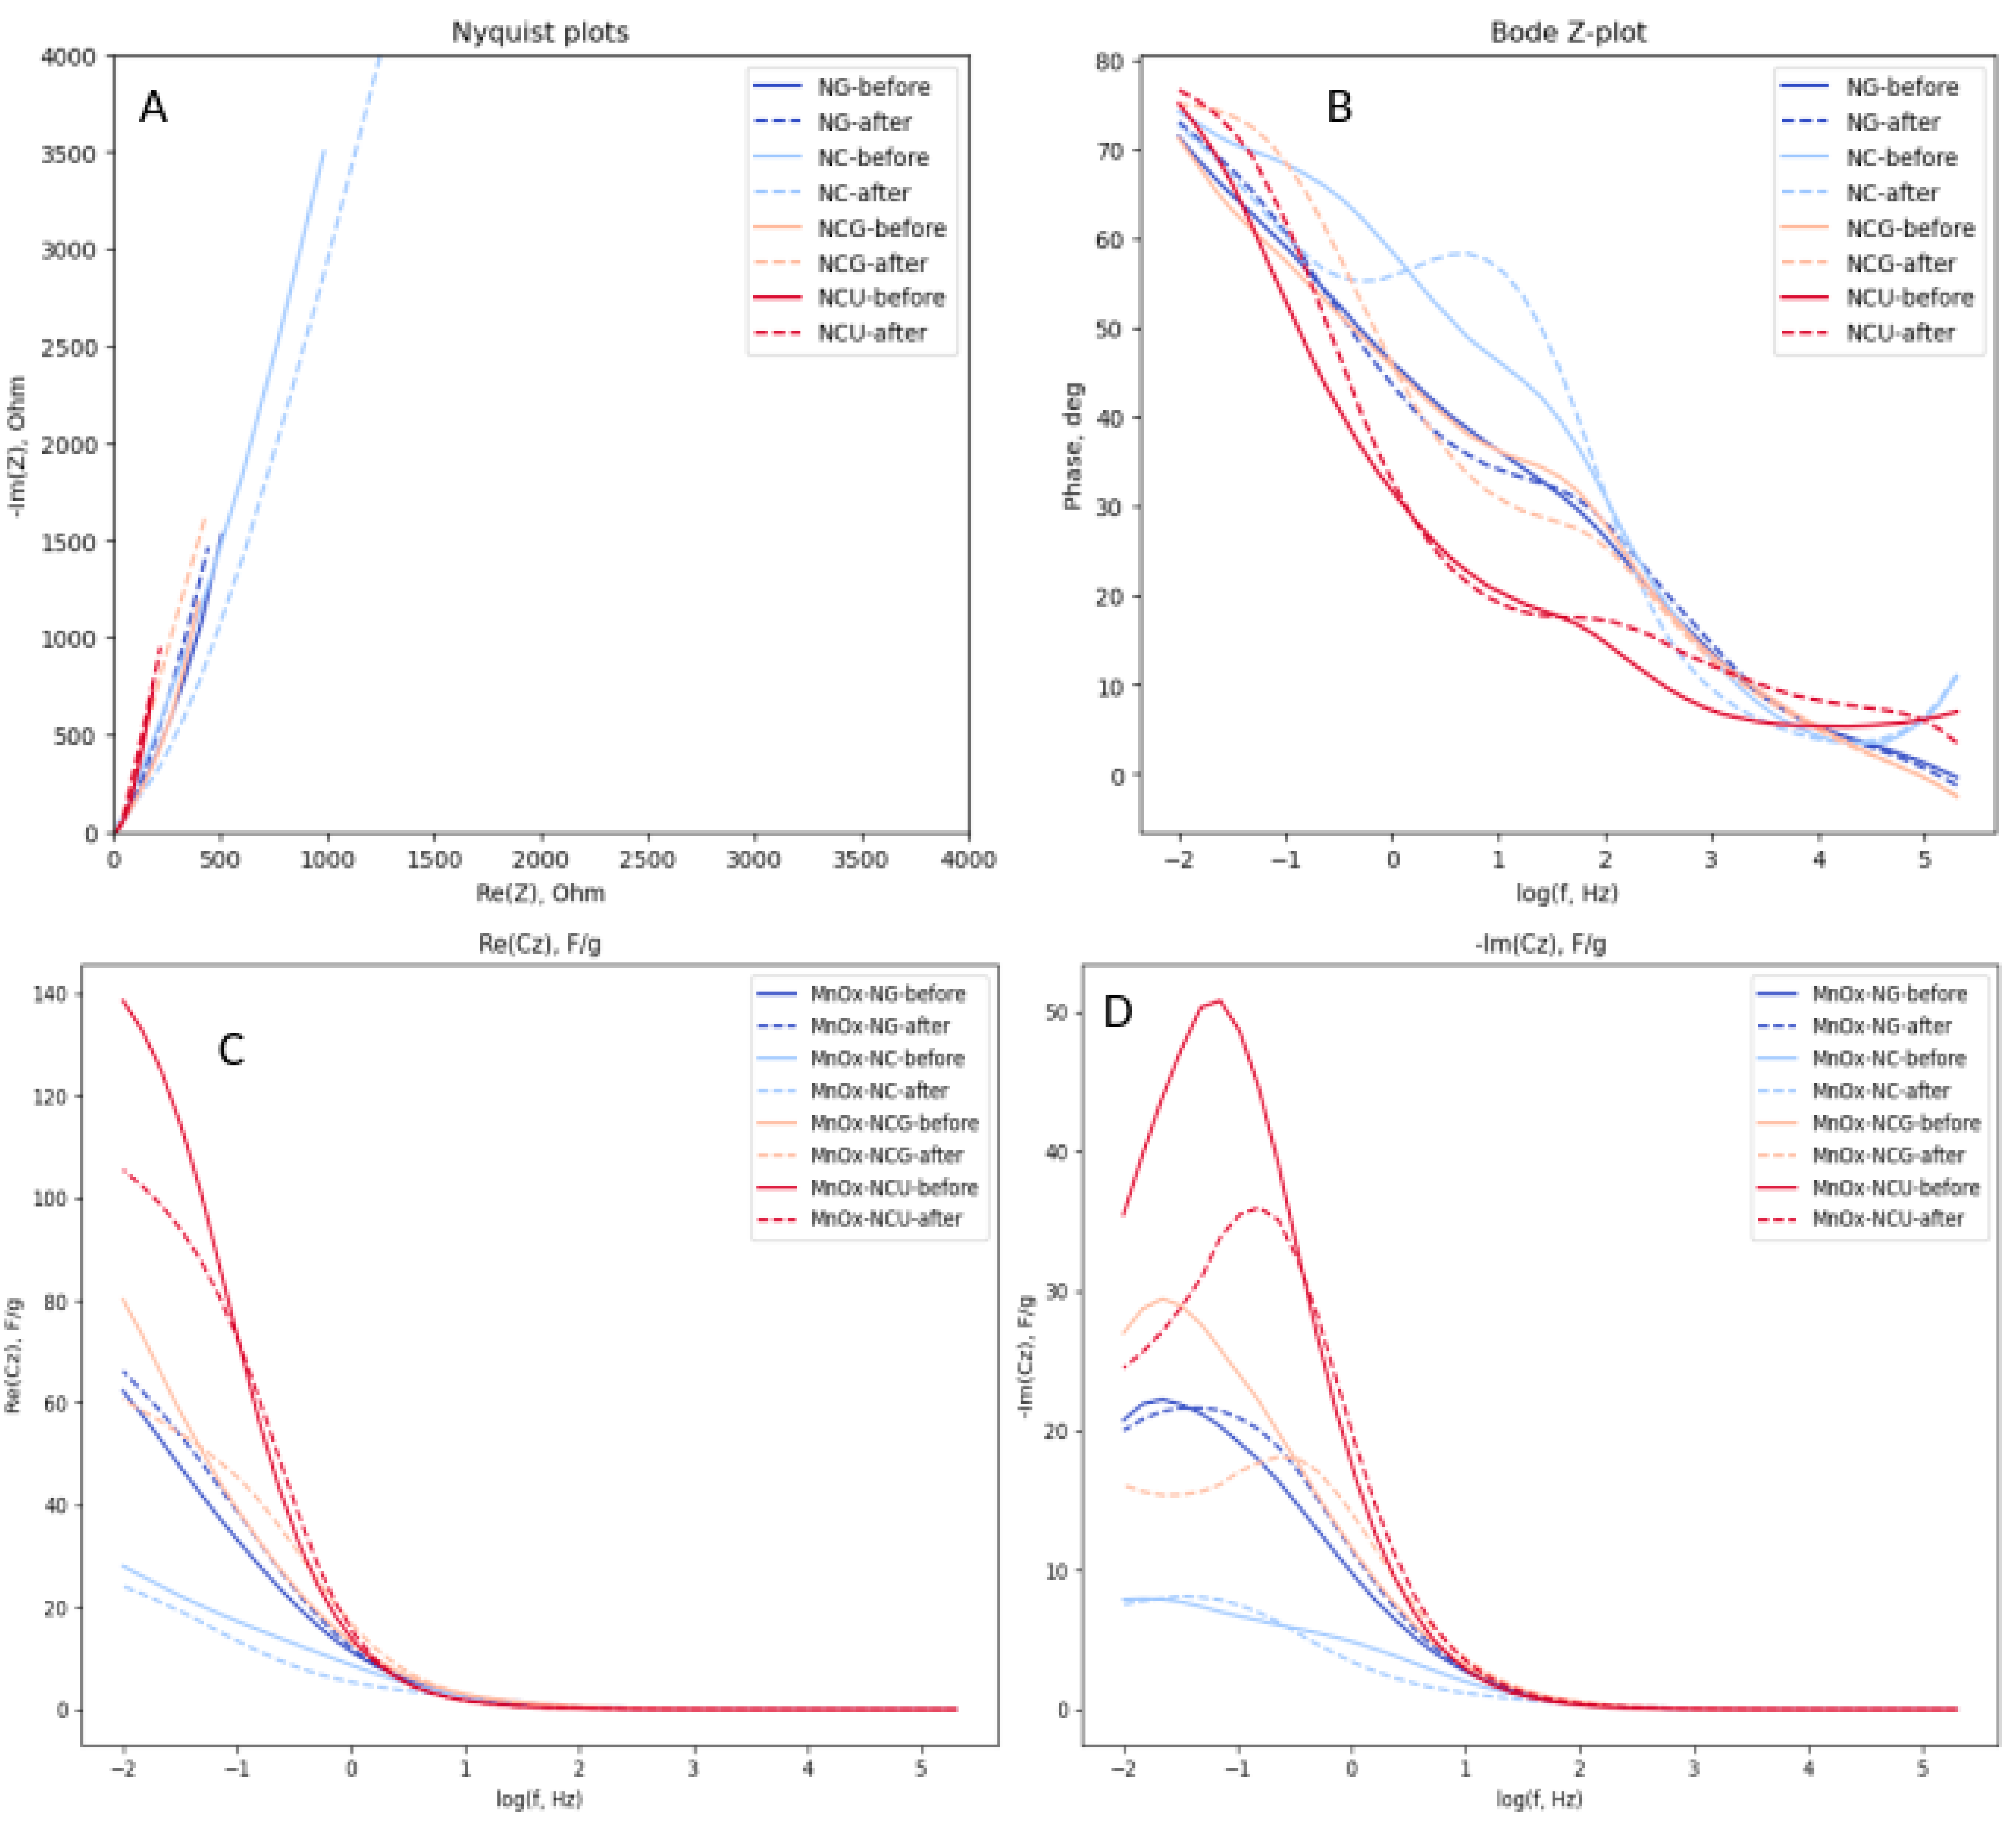

Table 1.
Decomposition reaction that may occur in the course SCS synthesis with Mn(NO3)2 and various fuels.
Table 1.
Decomposition reaction that may occur in the course SCS synthesis with Mn(NO3)2 and various fuels.
| Component | Reactions | Conditions | Heat effect (kJ/mol) | Reference |
|---|---|---|---|---|
| Mn(II) nitrate, Mn(NO3)2 | Mn(NO3)2 → [MnONO3] + NO2 → MnO2 + 2NO2 | ca.240 oC | 155±12 | [19,20] |
| MnO2 → Mn2O3 | 560-570 oC | ≈24 | ||
| Mn2O3 → Mn3O4 | above 800 oC | / | ||
| Glycine, C2H5NO2 | 4C2H5NO2 + 9O2 → 5H2O + 4CO2 + N2 | 210 oC | -972.98±0.12 | [21] |
| 4C2H5NO2 → 6H2O + 2NH3 + 6C + 2HNCO | 250 oC, no O2 | -528 | [22] |
Table 2.
Overview of studies of SCS synthesis of Mn oxides.
| Precursor | Fuel | Product | Conditions | Reference |
|---|---|---|---|---|
| Mn(NO3)2 | Glycine | ε-MnO2, 23 m2/g | Heating plate evaporation/ignition; φ=0.5 | [24] |
| ε-MnO2, 43 m2/g | φ=2.0; higher φ results in better crystallinity | |||
| Mn(NO3)2 | Glyoxalic acid | Mn3O4+Mn2O3, 43 m2/g | Oven heating up to 120oC (1h ramp, 1h hold), then annealing at 350oC for 4h | [25] |
| Ketoglutaric acid | Mn2O3+Mn3O4, 23 m2/g | |||
| Mn(NO3)2 | Glycine | Mn2O3; 43 m2/g, 21±4 nm | Oven heating at 600oC for 20 min; φ=0.5 | [26] |
| Mn3O4; 46 m2/g, 17±3 nm | 500oC, 30 min; φ=2 | |||
| Mn2O3+MnO2; 47 m2/g | 350oC, 120 min, φ=2 | |||
| Mn(NO3)2 | Glycine | Mn3O4; 32 m2/g | Slow evaporation in air, then heating plate ignition at 350oC | [27,28] |
| Mn3O4/C; 5-35 nm | + x% of Vulcan | |||
| MnAc2 | Ethanol | Mn3O4(85%) + MnO(15%) | Flame ignition of ethanol | [29] |
| Mn(NO3)2 | Citric acid | MnO2, 6.3 m2/g | Oven evaporation at 150oC for 5h, then annealing at 400oC for 3h in air; φ=0 | [30] |
| Mn3O4 + Mn2O3, 15.3 m2/g | φ=0.5 | |||
| Mn3O4, 31.7 m2/g | φ=1 | |||
| Mn2O3, 55.1 m2/g | φ=2 | |||
| Mn3O4 + Mn2O3, 38.2 m2/g | φ=4 | |||
| Mn(NO3)2 | Urea | 68%MnO2 + 32%Mn2O3, 7.5 m2/g | 330°C evaporation/ignition in ovenφ=0.2 | [31] |
| 32%MnO2 + 68%Mn2O3 | φ=0.3 | |||
| 22%MnO2 + 78%Mn2O3 | φ=0.4 | |||
| Mn2O3, 68±12 nm | φ=1 | |||
| 65%Mn3O4 + 35%MnO | φ=2 | |||
| Glycine | Mn2O3 | φ=0.2 | ||
| Mn2O3 | φ=0.3 | |||
| Mn2O3 | φ=0.5 | |||
| Mn3O4 | φ=1 | |||
| Mn3O4 | φ=2 |
Table 3.
Composition of initial mixtures (Mn(NO3)2·4H2O was used as metal precusor salt in all synthesis).
Table 3.
Composition of initial mixtures (Mn(NO3)2·4H2O was used as metal precusor salt in all synthesis).
| Name | Fuel | XRD attribution | Properties |
|---|---|---|---|
| MnOx-NG-0.5 | Glycine, φ=0.50 | Mn2O3 + [Mn3O4]1 | 23-26 nm(2), 17 m2/g |
| MnOx-NG-0.75 | Glycine, φ=0.75 | Mn2O3 + Mn3O4 | 18-27 nm, 4 m2/g |
| MnOx-NG-1.0 | Glycine, φ=1.00 | Mn3O4 + [MnO] | 19-22 nm, 40 m2/g |
| MnOx-NG-1.25 | Glycine, φ=1.25 | Mn3O4 + [MnO] | 19-20 nm, 18 m2/g |
| MnOx-NG-1.5 | Glycine, φ=1.50 | Mn3O4 + [MnO] | 20-22 nm, 14 m2/g |
| MnOx-NC-1.0 | (NH4)3Cit | Mn2O3 | 20-22 nm, 14 m2/g |
| MnOx-NCG-1.0 | NH4)3Cit + Glycine | Mn3O4 | 11.3 nm, 24 m2/g |
| MnOx-NCU-1.0 | NH4)3Cit + Urea | Mn3O4 | 9.3nm, 35 m2/g |
1 In square brackets a minor product is depicted. 2 Estimated from XRD data with Scherrer equation.
Table 4.
IR peak attributions for the manganese nitrate – glycine mixture.
| Precursor | IR band (position cm-1, observation)3 | Attribution |
|---|---|---|
| Mn(NO3)2.4H2O | 3430, st.br. 3185, s. 2736, m. 2147, m. 1762, st., s. 1601, st., s. 1435, sh. 1367, st. 1055, st. 826, st. |
ν(OH) ν1+ν4 2ν2 ν3 (NO3-) ν3 (NO3-) ν1 (NO3-) ν2 (NO3-) |
| Glycine, NH2CH2COOH | 3165, w, sh. 2820, w 2610, 2120, m 1604 1510 1412 1330 1110 1030 890 690 610 |
νa(NH3+) νs(CH) νs(NH3+) νa(COO-) + τ(NH3+) νa(COO-) δs(NH3+) νs(COO-) δ(CH2) + δ(NH2) ρ(NH3+) tw.(NH2) δ(NH2) + δ(CH2) ρ(COO-) ω(COO-) |
3 st. = strong, m. = medium, w = weak, br. = broad, s. = sharp, sh. = shoulder.
Disclaimer/Publisher’s Note: The statements, opinions and data contained in all publications are solely those of the individual author(s) and contributor(s) and not of MDPI and/or the editor(s). MDPI and/or the editor(s) disclaim responsibility for any injury to people or property resulting from any ideas, methods, instructions or products referred to in the content. |
© 2024 by the authors. Licensee MDPI, Basel, Switzerland. This article is an open access article distributed under the terms and conditions of the Creative Commons Attribution (CC BY) license (http://creativecommons.org/licenses/by/4.0/).
Copyright: This open access article is published under a Creative Commons CC BY 4.0 license, which permit the free download, distribution, and reuse, provided that the author and preprint are cited in any reuse.


