
Submitted:
15 October 2024
Posted:
16 October 2024
You are already at the latest version
Abstract
'Xinomavro' (V. vinifera L.) is an important native red wine grape variety in Northern Greece, particularly in PDO (Protected Designation of Origin) regions. Despite its significance, there is limited research on the effects of pruning type and severity on 'Xinomavro' vine physiology, yield, and berry quality across diverse environmental conditions. This study aimed to address this knowledge gap and provide growers with crucial information for optimizing vineyard management practices. The study was conducted over two consecutive years (2016 and 2017) in a vineyard in Thessaloniki, Northern Greece. Four treatments ( B12:12 buds on 6 spurs; B24:24 buds on 12 spurs; M12:12 buds on 2 canes; M24:24 buds on 4 canes) combining two bud load levels (12 or 24 count nodes) and two pruning types (short spurs or long canes) were applied to 'Xinomavro' vines in complete block randomized design. The vine water status, gas exchange, canopy characteristics, yield components, and berry composition were measured. Bud load and pruning type significantly influenced vine canopy development, microclimate, and yield components. Short pruning with high bud load (B24) resulted in denser canopies and higher yields, whereas cane pruning (M12 and M24) led to more open canopies and improved berry quality indicators. Treatment effects on berry composition were inconsistent across years, but showed a tendency for higher anthocyanin and total phenol content in cane-pruned vines. This study demonstrated that pruning type (short or long fruiting units) may have a greater impact on vine growth, yield, and berry composition than bud load alone in 'Xinomavro' vines. Cane pruning appears to be a more effective strategy for achieving vine balance and potentially improving grape quality under given experimental conditions.
Keywords:
Xinomavro
; Bud load
; Pruning type
; Vine balance
; Canopy management
; Berry composition
; Grape yield
; Viticulture practices
; Winegrape quality
1. Introduction
Modern viticulture faces the challenge of achieving a complex set of management objectives to ensure both financial viability and sustainability. These objectives include consistently meeting the stringent grape quality standards of the targeted market, while simultaneously achieving economically sustainable grapevine growth and yields. Achieving and maintaining an optimal equilibrium between vegetative and reproductive growth while achieving high quality grapes defines the concept of ‘vine balance’ [1]. While widely discussed in recent decades, the idea of ‘vine balance’, as discussed by [2], originates from the earlier work of [3]. Despite these pioneering and sound earlier works, traditional winemaking often assumes an inverse relationship between vine yield and grape quality; however, modern research suggests an optimum curve to describe this relationship: quality initially rises with yield, plateaus, and then declines as yield increases further [4]. Thus, achieving "vine balance" allows for a range of crop levels to produce suitable grape quality, demonstrating that optimal yield and quality are achievable within a balanced vineyard [4]. Achieving and maintaining an appropriate vine balance are important for effective vineyard management in the context of modern viticulture.
Adjusting the bud load or the number of nodes retained after winter pruning offers a practical method for regulating crop levels in grapevines only in part [5]. Previous research [5,6,7,8] suggests a positive relationship between pruning severity and yield; as pruning severity decreases (more buds are retained), yield generally increases. However, this relationship is not always linear because of the compensatory changes in other yield components [5,7,8]. A meta-analysis using mixed models by [9] revealed that the increase in vine yield owing to reduced pruning severity is attributed to a higher number of clusters, even though individual cluster weights decrease. Individual studies reported varying responses of cluster weight and other yield components to bud load, ranging from no observed effect [5] to inconsistent across years to inconsistent effects across years [7].
The microclimate within a grapevine canopy is primarily governed by the amount and spatial distribution of the leaf area, which interacts with prevailing atmospheric conditions [10]. Canopy density, a key factor influencing microclimate, directly affects the light environment within the canopy [11]. This light exposure, modulated by canopy density, subsequently influences berry temperature [12,13]. Adjusting the number and spatial arrangement of retained latent buds, in conjunction with vine yield, influences canopy wall characteristics including size and specific properties [14]. These modifications to vine microclimate and canopy structure subsequently affect grapevine growth, productivity [15,16], and berry composition [17]. Although previous studies have investigated the impact of pruning severity on berry composition [5,6,18,19], their findings were not always consistent across different experiments. In summary, while increasing bud numbers through less severe pruning generally leads to higher yields, this relationship is complex and moderated by vines’ compensatory mechanisms, long-term adjustments, and interactions with environmental and management factors. Therefore, given the context-dependent nature of bud load effects on grapevine growth, yield, and berry composition, conducting region-specific research on diverse grape-growing scenarios is crucial. Pruning to a specific number of buds per unit of dormant pruning weight has been suggested as a method for achieving an optimal vine balance [2,20].
In addition to bud load, pruning types also vary based on the fruiting units that retain buds after winter pruning. "Long" pruning, with canes of usually 6-12 buds as fruiting units, reduces vine vigor by limiting resource reserves, making it suitable for vigorous varieties or those with low bud fertility, especially in cool climates. It promotes bud fruitfulness, creates less dense canopies with better air circulation, and reduces the incidence of disease. However, it can lead to uneven bud burst and variable shoot growth. "Short" pruning, which retains short spurs (2-3 buds) on permanent cordons, typically enhances shoot vigor, bud burst uniformity, and grape maturation due to greater resource reserves in the permanent wood. However, it can increase disease incidence owing to increased shoot vigor and necessitate more shoot thinning.
Several studies have shown that pruning type may affect grapevine growth, yield, and berry composition [16,21,22,23]. For example, [22] found that long pruning resulted in decreased berry and cluster weights but higher vine yield. The responses of berry juice composition were inconsistent, whereas no changes were observed in berry skin phenolic content. Similarly, [23] did not observe significant differences in juice composition, anthocyanin content, or total phenol content between short and long pruning. However, this study simultaneously applied both pruning types to the same vine during a single growing season. Not all of these studies maintained an exact common bud load across pruning type treatments [16,22].
This study focuses on 'Xinomavro,’ an important native red wine grape variety in Northern Greece, particularly in PDO regions like Naoussa, Amyndeon, Rapsani, and Goumenissa. Despite its significance, there is a notable gap in research regarding the impact of pruning type and severity on 'Xinomavro' vine physiology, yield, and berry quality across diverse environmental conditions. As an exception, [24] studied responses of ‘Xinomavro” vines to three training systems (Lyre, Guyot, bilateral Royat) over one year. They compared short (Royat) and long (Guyot) pruning, with a common load of 10 buds. Although no significant effects were found on growth, yield, and berry composition, grapes from long-pruned vines had higher tannin monomer concentrations. Conversely, short-pruned vines produced grapes richer in skin tannins, potentially reducing astringency. These subtle effects suggest that grapes from short-pruned vines may be better suited for longer maceration during vinification. This lack of region-specific knowledge poses a challenge for growers seeking to optimize vineyard management practices. Our study directly addresses this knowledge gap by investigating the effects of bud load (pruning severity) and pruning type on 'Xinomavro' grapevine performance. The ultimate goal is to provide growers with critical information needed to tailor their vineyard management strategies and maximize grape production within their unique environmental contexts.
To achieve our research goal, a two-year field experiment was conducted to investigate the effects of varying bud loads and two distinct pruning types on the yield, fruit quality, and vegetative growth of ‘Xinomavro’ grapevines. This study completes a trilogy of research dedicated to optimizing important aspects of ‘Xinomavro’ cultivation [25,26].
2. Materials and Methods
2.1. Experimental Vineyard and Trial Design
This study spanned two consecutive years (2016 and 2017) and was conducted in a 0.6-hectare, 10-year-old vineyard situated in Thessaloniki, Northern Greece (37° 79' N, 22° 61' E), at an altitude of 60 m above mean sea level. Vineyard soil, classified as loamy clay (30% sand, 25% silt, and 45% clay), was managed using a clean surface cultivation system. The vineyard featured 'Xinomavro' (Vitis vinifera L.) grafted onto 1103P rootstock (V. rupestris × V. berlandieri) at a density of 4,000 vines per hectare. Vines were planted in a 1.0 m × 2.5 m within and between row layout, with rows oriented east-northeast to west-southwest (246° heading). A bilateral Royat training system with a vertical trellis system (three fixed pairs of foliage wires) was used.
Drip irrigation delivered consistent amounts of water across the two experimental years (91 mm in 2016 and 84 mm in 2017). Irrigation scheduling involved applying half of the water approximately 15 days before veraison, with the remainder split into two doses applied 10 days after veraison and 15 days before harvest. An onsite automatic weather station (iMETOS, Pessl Instruments GmbH, Weiz, Austria) recorded previously published weather data [26]. Crop evapotranspiration was estimated based on potential evapotranspiration calculated using the Penman-Monteith method. Standard local viticultural practices were followed for pest and canopy management as well as fertilization.
Within the vineyard, three vine rows were selected for the study, which were separated by two buffer rows. Each row contained four plots, with each plot comprising ten consecutive vines. Two bud load treatments were applied: 12 or 24 count nodes were retained per vine after winter pruning. These bud loads were further divided into two pruning types: retaining the nodes on 2-bud short spurs or 6-bud canes. The combination of the two bud load treatments (12 or 24 count nodes) and the two pruning types (2-bud short spurs or 6-bud canes) resulted in four treatment combinations applied to individual vines ( B12: 12 buds on 6 spurs; B24: 24 buds on 12 spurs; M12: 12 buds on 2 canes; M24: 24 buds on 4 canes). These treatment combinations were randomly allocated to four plots within each row, resulting in a total of 12 plots arranged in a 4 × 3 grid (4 plots × 3 rows) in a randomized complete block design with two fixed factors (bud load and pruning type) and three replications (rows).
2.2. Vine Water Potential and Leaf Gas Exchange
Measurements of stem water potential (Ψstem) started at the end of veraison, specifically on day of year (DOY) 218 in 2016 and DOY 216 in 2017. Subsequent measurements were conducted at intervals of 7–15 days until maturity ( 226, 235, 244, 253, and 260 in 2016, and 216, 223, 234, 249, 260, and 271 in 2017). These measurements were performed with a pressure chamber as outlined in [27]. On each measurement date, three mature leaves from the central vines of each plot were sampled. Ψstem was taken at solar noon (12:30–14:30 p.m. local time) from the leaves positioned between the 7th and 9th nodes of the primary shoots. To facilitate equilibrium between the leaf and stem water statuses for Ψstem measurements, leaves were bagged for 1 h in light-excluding black plastic bags with an aluminum foil cover for thermal insulation [27]. The average water potential values of the three leaves were used for statistical analysis.
Concurrently, the net assimilation rate (A, μmol CO2 m−2 S−1), stomatal conductance (gs, mol H2O m−2 S−1), transpiration rate (E, mmol H2O m−2 S−1), and leaf intrinsic water use efficiency (WUEi, calculated as A/gs, μmol CO2 mol−1 H2O) were measured using an LCi portable gas exchange system (ADC BioScientific Ltd., Hoddesdon, UK). Data were collected from three fully expanded, recently matured, sunlit leaves in each plot that received a photosynthetic photon flux density exceeding 1200 μmol m−2 s−1 in proximity to the leaves chosen for water potential measurements.
2.3. Leaf Area, Shoot Growth Production, and Grape Yield
Vine yield and its components were assessed at commercial harvest maturity on September 29, 2016, and September 25, 2017. During harvest, clusters were collected from the four central vines within each plot. All clusters were counted and weighed to determine vine yield (kg vine-1) and the average cluster weight (g). For each central vine, a representative sample of ten clusters was randomly selected from the total yield. These clusters were transported to the laboratory in insulated coolers for further analyses. Cluster weight (g), length (cm), and width (cm) were measured in the laboratory. Berries per cluster were counted to determine cluster compactness, which was calculated as the ratio of berry count to rachis length (berries · cm-1).
At full ripening, the total leaf area of the four vines from each treatment plot was estimated using the non-destructive method outlined in [28]. The exposed surface area (m2 vine-1) was calculated according to [29] for the vertical shoot-positioned vines. Canopy density (%) was determined as the percentage of actual total leaf area per vine relative to the exposed surface area. When the actual total leaf area exceeded the exposed surface area, a canopy density of 100% was assigned. Canopy density measurements exceeding 100% indicated shaded leaf area, calculated as the surplus leaf area relative to the total leaf area. Conversely, canopy densities below 100% indicated the presence of canopy gaps, expressed as the percentage of the unfilled surface area. During dormancy, the same four vines were assessed for pruning wood weight and cane count. The total pruning wood weight (kg) was recorded, and the mean weight per cane was calculated by dividing the total wood weight by the number of canes for each vine.
2.4. Berry Sampling and Must Analysis
The chemical composition of berry was analyzed across six sampling points, from veraison to harvest, during 2016 (days of the year [DOYs] 218, 226, 235, 244, 253, and 260) and 2017 (DOYs 216, 223, 234, 249, 260, and 271). At each sampling point, 200 berries were randomly selected from clusters on four central vines within each plot and transported to the laboratory in portable coolers. In the laboratory, 200-berry samples were weighed to determine the average berry weight. Each sample was divided into four 50-berry subsamples. One subsample was manually pressed to extract juice for analysis of total soluble solids (°Brix) using a digital refractometer (HI96841, HANNA Instruments, Woonsocket, RI, USA), pH using a laboratory pH meter (HI2020-02, HANNA Instruments, Woonsocket, RI, USA), and titratable acidity (g/L tartaric acid equivalent) via titration against 0.1 N sodium hydroxide. The remaining 150 berries (three 50-berry subsamples) were stored at -30°C for subsequent phenolic compound analysis.
2.5. Phenolic Content and Anthocyanins
Berry phenolic content was determined using whole berries, following the protocol established in [30]. For each plot, 50 berries were homogenized in a 125 mL plastic beaker using a Polytron at 25,000 rpm for 30 s. A 1 g aliquot of the homogenate was transferred to a centrifuge tube (in triplicate), combined with 10 mL of 50% (v/v) aqueous ethanol (pH 2), and mixed for 1 h. After centrifugation at 3,500 rpm for 10 min, the supernatant (0.5 mL) was added to 10 mL of 1 M HCl and mixed thoroughly. After a 3-hour incubation, the absorbance was measured at 520 nm and 280 nm using a 10 mm cell. The anthocyanin content (mg berry-1) was calculated from the absorbance at 520 nm, while total phenolics (absorbance units berry-1) were calculated from the absorbance at 280 nm.
2.6. Statistical Analysis
To evaluate the effects of two bud load levels and two pruning types on vine performance, a randomized complete block design, replicated in three blocks and repeatedly measured over two years, was used. A General Linear Model was employed to conduct an analysis of variance (ANOVA) for hypothesis testing and estimation of fixed and random effects. Bud load and pruning type were considered as fixed effects, whereas blocking (vine rows) was treated as a random effect. Data were averaged per plot and the mean values were used for statistical analysis. Results are presented as the mean of three replicates (n = 3). Post-hoc comparisons for mean separation were performed using Duncan's multiple range test to identify significant differences among the main effect means at p < 0.05.
To gain a more comprehensive insight into our dataset, we conducted Principal Component Analysis on nine variables. These variables, measured during the 2016 and 2017 harvests, encompassed the aspects of vine growth, microclimate, yield, and berry composition. The PCA results were subsequently visualized in a biplot. All statistical analyses were performed using IBM SPSS Statistics for Windows, version 22.0.
3. Results
3.1. Stem Water Potential and Gas Exchange
Treatment effects on stem water potential and gas exchange during berry maturation were generally insignificant, except for stem water potential in 2017, when short-pruned vines with a bud load of 24 (B24) exhibited higher values (Table S1). However, a significant growth season effect was observed, resulting in higher overall mean of Ψstem, stomatal conductance (gs), and net CO₂ assimilation (A) values in the first year of the experiment (Table S1). No significant interactions were found between the treatments or between treatments and growth season (Table S1).
3.2. Vine Canopy, Shoot Growth, and Microclimate
3.2.1. Leaf Area and Shoot Growth
Significant variations in the total leaf area and main leaf area were observed across the bud load and pruning type treatments (Figure 1A, 1B). Total main leaf area ranged from 1.5 to 3.4 m² vine⁻¹ in 2016 and from 1.2 to 3.5 m² vine⁻¹ in 2017 (Figure 1B). Regardless of pruning type, vines with higher bud loads consistently exhibited a significantly greater total leaf area at harvest in both years (Figure 1A). This effect was more pronounced in the short-pruned treatments (Figure 1A). Consequently, B24 vines (short pruned with 24 buds) developed the greatest total leaf area among all treatments, reaching 6.2 m² vine⁻¹ in 2016 and 5.9 m² vine⁻¹ in 2017 (Figure 1A). Conversely, when the higher bud load was maintained on canes (M24), the increase in total leaf area between the M12 and M24 treatments was less pronounced (Figure 1A). M24 vines exhibited total leaf area values similar to those of B12 vines (Figure 1A).
Mirroring the trend observed in total leaf area, the total area of the main leaves responded similarly to both bud load and fruiting unit type treatments (Figure 1B). However, vine secondary leaf area differed only between the short- and long-pruning treatments, with no significant bud load effects observed (Figure 1C). Short-pruned vines consistently displayed greater secondary leaf area compared to their long-pruned counterparts (Figure 1C).
Vines pruned to the higher bud load developed more shoots than the lower bud load-treated vines (Figure 2A). The mean shoot number per vine was consistently higher in the B24 treatment than in the M24 treatment (Figure 2A). The influence of fruiting unit type on mean shoot number was not consistent across the two years of the experiment for the lower bud load treatment (Figure 2A). The mean shoot per bud followed a reverse trend compared to the mean shoot per vine: vines with a high bud load had a lower ratio of shoots for each bud retained at pruning (Figure 2B).
Consistent with the observed trends in total leaf area (Figure 1A), the total weight of pruning wood in the following winter season was significantly influenced by both bud load and fruiting unit type treatments (Figure 3A). Pruning wood weight was notably higher in the B24 and M24 treatments than in the B12 and M12 treatments (Figure 3A). Furthermore, within a given bud load, short-pruned vines (B12 and B24) consistently exhibited greater pruning wood weight than their long-pruned counterparts (M12 and M24) (Figure 3A). In contrast to the observed variations in mean shoot number per vine, no significant differences in mean cane weight were detected between the treatments in either experimental year (Figure 3B).
3.2.2. Canopy Density and Cluster Temperature
The actual total leaf area, expressed as a percentage of the exposed leaf area, ranged from 100% for the B24 treatment for both years of experimentation, between 70-80% for B12 and M24 vines, whereas the lowest percentage of exposed leaf area was for the M12 vines (61% and 57% for the two years, respectively) (Figure 4A). Conversely, M12 vines had the lowest canopy density and the highest number of gaps, whereas B24 vines had a high percentage of overlapping leaves at 37% (2016) and 19% (2017) (Figure 4B). Vines from the B12 and M24 treatments showed intermediate values of canopy density, with no difference between them (Figure 4B).
Berry temperature was significantly increased in treatments receiving long pruning (M12 and M24), particularly compared to B24, whose grapes recorded the lowest temperature in both years of experimentation, apparently because of denser foliage (Figure 5).
3.3. Grape Production, Cluster Properties, and Vine Balance
Short-pruned vines consistently yielded higher grape yields under higher bud loads. Conversely, long-pruned vines under M24 treatment exhibited higher yields only in 2017 (Figure 6A).
Although no consistent responses in mean cluster weight were observed across bud load and fruiting unit type treatments (Figure 6B), increased bud load resulted in a higher mean number of clusters per vine, irrespective of pruning type (Figure 7A). In contrast, a lower bud load in short-pruned vines resulted in a greater number of clusters per shoot across both years of the experiment (Figure 7B). Across both years of the experiment, M24 treatment consistently resulted in lower berry weight throughout the ripening process (Figure S1). Despite the differences in grape yield, we did not observe consistent and significant differences in vine balance indices (ratios of total leaf area to grape yield and total pruning weight to grape yield; Figure S4).
The treatment effects were significant for several attributes of the cluster architecture and berry components (Table 1). Cane-pruned vines generally exhibited less compact clusters, with fewer berries per cluster (Table 1). However, this trend was consistent only with the M24 treatment (Table 1). In addition, cane pruning had a significant effect on berry anatomy of ‘Xinomavro’ vines with a consistent trend in both years, as the berries of treatments M12 and M24 tended to have an increased contribution of skin and seeds in the total weight of their berries compared to treatments B12 and B24 (Table 1).
3.4. Berry Composition
A significant effect of year was observed for several berry composition variables (Table 2). In the second year of the experiment, berry juice exhibited significantly higher titratable acidity, anthocyanin, and total phenol concentrations but lower pH values (Table 2). Although significant main effects on berry composition were evident within each year, these effects were not consistent across treatments and years (Table 2). Notably, significant interactions between bud load and pruning type were observed in berry composition (Table 2). The seasonal evolution of berry juice composition (Figure S2) and phenolic compounds (Figure S3) aligned with the responses to treatment and year effects. Despite the lack of consistency in the main effects on berry composition, the cane-pruned vines tended to have higher anthocyanin and total phenol contents (Table 2; Figure S3).
3.5. Multivariate Analysis and Data Overview
Principal component analysis was conducted using nine parameters related to vine growth, microclimate, yield, and berry composition. Applying Kaiser's criterion (eigenvalue > 1), two principal components were identified, which explained 76.28% of the total variation (Figure 8). PC1 accounted for 55.49% of the variance, whereas PC2 explained 20.79% (Figure 8).
Five parameters - percentage of canopy gaps, cluster temperature, clusters per vine, pruning wood weight, and total anthocyanins - exhibited high loadings (>0.500) only in PC1 (Figure 8). Total phenolics loaded highly only in PC2, whereas main leaf area, % skin weight, and grape density showed high loadings in both PCs. Figure 8 can be summarized as follows.
Treatment B24 (high bud load on short fruiting units) was positively correlated with higher grape yield and vegetative growth (vigor (main leaf area and pruning wood weight] ). Conversely, treatment B24 showed a negative correlation with % canopy gaps and cluster temperature. Treatment M12 (cane pruning with lower bud load) displayed the opposite trend in both years, exhibiting a less crowded canopy and a lower yield. Treatment M24 (cane pruning with higher bud load) followed a similar pattern, although it was less pronounced and only observed in 2016. These findings suggest that increasing bud load in short pruning systems may not effectively control vine vegetative and vine balance. Cane pruning appears to be a more effective strategy to achieve this balance.
Interestingly, the B12 treatment (low bud load on short fruiting units), particularly in 2016, did not show strong correlations with most variables, except for grape density, which was notably higher in both short pruning treatments (B12 and B24). Cane pruning was positively associated with increased skin weight and phenolic content, particularly in 2016.
These observations suggest that the load distribution (short or long fruiting units) may have a greater impact on vine growth, yield, and berry composition than bud load alone. Specifically, the B12 and B24 treatments resulted in higher shoot vegetative growth, grape yield, and cluster density. In contrast, the M12 and M24 treatments exhibited improved quality indicators, potentially linked to the observed increase in skin weight percentage. This increase in skin weight is likely due to the lower cluster density and reduced canopy density, leading to greater berry exposure to light. This hypothesis is supported by the higher berry temperatures observed in the M12 and M24 treatments (Figure 5).
4. Discussion
4.1. Vine Water Status and Gas Exchange
Stem water potential is widely recognized as a robust measure of the water status of grapevines [27]. According to [31], the recorded mean stem water potential values, as presented in Table S1, generally suggest that vines across all treatments experienced moderate water stress during berry maturation. This observation suggests that the quantity of applied water, despite being equally distributed across treatments, was insufficient to fully meet the total water requirements of the vines, resulting in a corresponding depletion of the available soil moisture during the maturation period. The absence of significant and consistent treatment effects on stem water potential (Table S1) indicated that variations in bud load and pruning type did not significantly alter the water status of 'Xinomavro' vines. Water availability is a critical factor that influences grapevine physiology and profoundly affects growth, yield, and berry composition [27,31]. Therefore, given the observed stability of vine water status across treatments in 'Xinomavro' vines (Table S1), it is plausible that any responses in productivity and berry composition are independent of alterations in vine water status.
In grapevines subjected to mild-to-moderate water deficits, stomatal conductance serves as a sensitive indicator of water stress intensity [32]. Specifically, gs rates within the range of 0.15 to 0.05 mol H2O m⁻² s⁻¹ are indicative of a moderate level of water deficit [33]. Thus, the gs values in Table S1 are consistent with Ψstem responses to bud load and pruning-type treatments.
The higher mean values for Ψstem, gs, and A observed in 2016 (Table S1) can be attributed to the contrasting climate profiles of the two growing seasons, as previously reported [26]. Specifically, the final month of berry maturation in 2017 experienced drier and warmer conditions than those in 2016. However, the lack of significant interaction between treatments and growth season (Table S1) suggests that these climatic differences, while influencing the overall vine physiology, did not substantially alter the main effects of bud load and pruning type on vine water status.
4.2. Vine Canopy and Microclimate
4.2.1. Leaf Area
The significant variation in total leaf area and its components – the main and the secondary leaf area – in response to the main effects (Figure 1A,B,C) indicates that bud load and pruning type treatments modified the vegetative growth of ‘Xinomavro’ vines. This variation in total leaf area was primarily driven by treatment-induced effects of two key factors: the number of shoots per vine and the constituent components of the total leaf area. The higher number of shoots observed in the high-bud load vines, as depicted in Figure 2A, supports this conclusion.
Since the total area of main leaves responded to both bud load and pruning type (Figure 1B) but the secondary leaf area was affected by pruning type only, being higher in short pruned vines (Figure 1C), it appears that leaf development was in part driven by the treatment effects on the secondary leaf area. Thus, the less pronounced effect of higher bud load in the long-pruned vines that eventually resulted in similar total leaf area for B12 and M24 vines (Figure 1A) can be explained by the differential increase in primary and secondary leaf area in response to pruning type effects (Figure 1C). Because of this differential increase, the B12 vines had the highest secondary leaf area (Figure 1C) from fast-growing lateral shoots that developed below the height of shoot trimming due to the increased vigor of the main shoots.
In contrast, in the long pruning treatments (M12 and M24), the lower growth vigor of the main shoots was accompanied by a lower percentage contribution of secondary leaf area to the total leaf area of the vine (28.2% for M12 and 30.1% for M24 in 2016 and 38.5% and 34.8% for 2017 compared to 56.6% for B12 and 45.2% for B24 in 2016 and 66.4% and 46.8%, respectively, for 2017). The lowest leaf area was recorded in the case of the M12 treatment (simple load on cane), that is, 2.7 m2 vine-1 (2016) and 2.6 m2 vine-1 (2017), which showed the lowest values for both primary and secondary leaf area.
The observed differences in shoot number per vine across treatments (Figure 2A) may have led to the differential expression of vine growth capacity, significantly affecting the allocation of resources between the short and long fruiting units. Specifically, vines pruned to short heads (B12 and B24) exhibited a more pronounced increase in secondary leaf area surface, typically associated with fast-growing shoots, than their long-pruned counterparts (M12 and M24). This difference could be attributed to the potentially greater availability of stored carbohydrates within the vine arms of short-pruned vines, as suggested previously [34].
4.2.2. Shoot Growth
Variations in shoot number per vine between short and long pruning under equivalent bud loads can be attributed to differences in shoot number per bud (Figure 2B). Short pruning treatments (B12 and B24) resulted in a higher average number of shoots per bud than the cane treatments (M12 and M24) (Figure 2B). Notably, the B12 treatment (simple load on short heads) demonstrated an average exceeding 1.5 shoots per bud (Figure 2B), indicating that excess vigor of B12 vines was manifested as non-count shoot development [8]. This phenomenon was less pronounced in the B24 and M12 vines and was absent in the M24 vines (double load in canes), where the value approached 1(Figure 2B). Given that excessive development of non-count shoots often signifies high shoot vigor in grapevines, the M24 treatment, combining the higher bud load with cane pruning, appears more favorable for 'Xinomavro' shoot growth in terms of shoot vigor under the given experimental conditions.
High bud load can potentially reduce bud burst rates in grapevines. Research by [6] and evidence from viticultural practice have shown that bud burst rates can fall below 100% (<1 shoot per bud left after pruning) under high-load conditions. This reduction is exacerbated in warm climates, with bud burst rates potentially dropping to 50% owing to incomplete winter bud differentiation [35]. Additionally, combining high bud loads with cane pruning can lead to poor bud burst in the middle of canes [36]. However, bud burst response to load manipulation is inconsistent and depends on factors such as varietal vigor and vineyard conditions. For instance, [8] observed a bud burst rate close to 120% in 'Chambourcin' (V. vinifera × V. rupestris) vines, even with a load of 40 buds per vine. Similarly, in the present study, the higher bud load (24 buds per vine) distributed across canes of 6-7 buds each did not negatively impact the bud burst rate (Figure 2B).
The patterns observed for dormant pruning weight in response to bud load and pruning type treatments were similar to those observed for the total leaf area (Figure 1A) and total area of main leaves (Figure 1B). These responses were supported by a strong, significant linear relationship observed between total leaf area and pruning wood weight across both years of the experiment (R2 = 0.698, p = 0.05 for 2016 and R2 = 0.843, p = 0.05, 2017). This strong relationship suggests that pruning weight is a reliable indicator of vine vegetative growth during the previous season [2].
4.2.3. Canopy Density, Cluster Shading and Microclimate
Canopy density is primarily determined by the number of shoots per unit length of the row and vigor of individual shoots [37]. In our study, both shoot number and shoot vigor varied in response to treatment effects. The higher ratio of actual leaf area to the exposed vine surface in B24 vines (Figure 4A), coupled with a lower percentage of canopy gaps and more shadowed leaves (Figure 4B), indicated increased canopy density in this treatment. Because each vine has a specified space defined by the within-row vine distance in a given vineyard, the increased shading in the canopy of the B24 vines was a direct result of their increased total leaf area (Figure 1A). The responses of canopy density to bud load and pruning type effects in the remaining treatments can be explained in an analogous manner.
The microclimate within a grapevine canopy is largely determined by the amount and spatial distribution of leaf area as well as its interaction with the surrounding atmospheric conditions [10]. Canopy density affects the light environment within a grapevine canopy [11]. In turn, the degree of light exposure in the canopy, which is affected by canopy density, influences berry temperature [12,13]. Clusters and berries in dense, shaded canopies tend to have lower temperatures than those in more exposed, less-dense canopies [12]. Consistent with these previous findings, our study observed lower berry temperatures in denser canopies of B24 vines compared to other treatments, particularly those subjected to long pruning (Figure 5). Overall, our data show that bud load and pruning type had a significant influence on canopy microclimate in ‘Xinomavro’ vines.
4.3. Yield Components
Previous research [5,6,7,8] indicates that as pruning severity decreases (i.e., more buds are retained), yield generally increases. For example, [7] found that increasing retained nodes from 24 to 72 per vine led to a linear yield increase from 4.8 to 12.7 kg vine-1 in the first year of their study in a ‘Sauvignon blanc’ vineyards. Similarly, [38] found that retaining more than five-fold more buds significantly increased the yield compared to retaining twice or fewer buds. The higher yields observed in the high bud load treatments (Figure 6A), except for the M24 vines in 2016, support these findings. However, this relationship is not always linear [5,7] due of the compensation that occurs through changes in other yield components. This highlights the need for longer-term studies (4-7 years) to assess the sustainability of pruning regimes and their impact on vine yield and growth [7].
Vine production is determined by both the number of clusters per vine and average cluster weight [7]. In the present study, a significant positive linear relationship was observed between grape number and bud number per vine across both years (R2 = 0.55, p < 0.01 for 2016 and R2 = 0.83, p < 0.001 for 2017). This relationship explains the lower number of clusters per vine in the lower bud treatments observed within each pruning-type treatment (Figure 7A). The absence of any significant and consistent influence of bud load and pruning type on mean cluster weight (Figure 6B) suggested that grape yield per vine was primarily determined by cluster number. This hypothesis is supported by the results of [9], who performed a data meta-analysis using mixed models to estimate the response ratio of vine yield components to several management practices: vine yield increases when pruning severity decreases owing to increased cluster number despite reduced cluster weights.
Given that the number of clusters per shoot was consistently higher only in B12 vines (Figure 7B), it appears that the number of clusters per vine in the other treatments was primarily determined by bud load rather than shoot fertility. Adequate bud fruitfulness in grapevines depends on the sufficient light exposure of buds during flower development [10]. The negative relationship between bud load and bud fertility has been explained in terms of increased shading within vine canopies [6]. Although significant differences in canopy density and shading were observed between treatments (Figure 4A,B), the lack of a consistent effect on shoot fertility suggests that these variations in canopy microclimate did not significantly impact this yield component.
When studying pruning system effects on inflorescence primordia initiation and inflorescence architecture in ‘Sauvignon Blanc’ vines, [21] reported that pruning type had no influence on flower number per inflorescence or the extent of primary branch development. Our study revealed that pruning type influenced cluster architecture, as evidenced by changes in cluster dimensions, berry number, and density; however, these changes were consistent only in the M24 vines (Table 1). Berry dimensions and weight, as factors influencing vine yield, tend to exhibit less variability than the number of clusters per vine or berries per cluster [7]. In our study, M24 vines consistently produced the smallest berries, whereas B12 vines yielded the largest (Figure S1, A, B). This aligns with previous research indicating that cane pruning generally results in smaller berries than spur pruning [22], and that berry weight tends to decrease with increasing pruning severity [6,8].
Smaller berries of red varieties are often preferred because of their supposedly higher skin-to-pulp ratio, which can lead to more concentrated wines [39]. However, this is not always true because berry components can decrease proportionally with size [40]. Despite the smaller berries in the M24 vines (Figure S1, A, B), both the skin and seed contributions to the overall berry mass increased (Table 1). This is likely due to the combined effect of reduced berry size and increased sunlight exposure in M24 vines [41], which is attributed to their more open canopies compared to B24 vines (Figure 4).
4.4. Berry Composition
Early studies have reported significant changes in berry juice composition in response to pruning treatments. For example, [6] found that sugar and acid concentrations decreased as bud load increased, while pH remained unchanged. The authors partially attributed these results to a concurrent reduction in the leaf surface area available for fruit ripening. Apart from berry juice constituents, the color density of berry skins has been reported to vary inversely with bud load [18]. However, this was not consistent across years, probably because of the influence of environmental factors [18]. Inconsistent responses of berry composition to pruning type have also been reported [22,42,43] in winegrapes. In table grapes, [44] reported that the influence of bud load on berry composition depends on variety.
The inconsistent treatment effects and strong interaction between bud load and pruning type on berry composition (Table 2) highlight the complex interplay of factors influencing berry composition. However, analysis of the interaction between bud load and pruning type on the total anthocyanin (F=24.23, p=0.0004) and total phenol (F=425.79, p<0.0001) concentrations provided insights into their combined effects. While bud load had variable effects on anthocyanin concentration, within each pruning type cane-pruned vines consistently yielded grapes with higher anthocyanin concentrations compared to spur pruning across bud loads and years. This suggests that pruning type has a more consistent effect on anthocyanin concentration than bud load does. For total phenols, the interaction between bud load and pruning type was even more pronounced, as indicated by the high F-value. At lower bud loads, cane pruning resulted in higher total phenol concentrations than spur pruning. However, this effect was reversed at higher bud load. Given the unclear effects of pruning severity and type on total anthocyanin and phenol contents (Table 2), it is possible that the observed differences in their concentrations were partly driven by the generally lower berry weights observed in cane-pruned treatments at harvest (Figure S1A,B).
Variations in berry composition are frequently linked to shifts in vine balance, which can be influenced by both management practices and environmental conditions [4]. Various indices have been employed to estimate vine balance, including the ratio of total leaf area to grape yield and the dimensionless Ravaz index, which represents the ratio of total pruning weight to grape yield [45]. For instance, a Ravaz index value between 5 and 10 is generally considered to be indicative of balanced vines [46]. However, this range may change because of varietal differences in growth characteristics [14,45]. Based on the typical Ravaz index range (5-10), the vines in this study could generally be classified as balanced, as shown in Figure S4B. The lack of significant treatment effects on the Ravaz index (Figure S4B) and the inconsistent effects observed in the ratio of foliar area to grape weight (Figure S4A) suggest that the observed impacts of bud load and pruning type on berry composition were not linked to vine balance. Given that the cane-pruned vines had more open canopies, particularly in the lower bud treatment (Figure 4B), any berry composition responses may have been driven by differences in grape exposure to light and cluster temperature (Figure 5).
5. Conclusions
This study provides valuable insights into the effects of bud load and pruning type on 'Xinomavro' grapevine performance. Our findings demonstrate the following.
Bud load and pruning type significantly influenced vegetative growth, canopy structure, and microclimate. Short pruning with a high bud load (B24) resulted in denser canopies and lower cluster temperatures, whereas cane pruning (M12 and M24) led to more open canopies and higher cluster temperatures.
Yield components were affected by the treatments, with higher bud loads generally increasing yield, primarily through increased cluster numbers. Cane pruning, particularly M24, consistently produced smaller berries with higher proportions of skin and seeds.
The berry composition showed complex responses to treatments, with significant interactions between bud load and pruning type. Cane-pruned vines tended to produce grapes with higher anthocyanin and total phenol contents, likely due to increased light exposure and smaller berry size.
The effects of bud load and pruning type on vine balance indices were inconsistent, suggesting that the observed differences in berry composition were more likely due to changes in canopy microclimate than alterations in source-sink relationships.
Multivariate analysis revealed that load distribution (short vs. long fruiting units) might have a greater impact on vine growth, yield, and berry composition than bud load alone.
These findings highlight the importance of pruning practices in managing 'Xinomavro' vineyards. Cane pruning, especially with higher bud loads, appears to offer a good balance between yield and quality. However, the choice between short and long pruning should consider the specific vineyard conditions and production goals. This consideration necessitates data from relevant research on the economic impact of selecting an optimal combination of bud load and pruning type system in 'Xinomavro' vineyards. Our study did not report such economic data, which constitutes a limitation. Future research should focus on longitudinal studies to evaluate the sustainability of these pruning regimes in terms of productivity and economic viability over multiple seasons. Additionally, investigating the interaction of these pruning practices with other management techniques, such as irrigation strategies or canopy management, could provide a more comprehensive understanding of optimizing 'Xinomavro' production in various environmental contexts.
Supplementary Materials
The following supporting information can be downloaded at Preprints.org: Table S1. The combined treatment effects of bud load (L), pruning type (T), and year (Y) on stem water potential (Ψ stem), stomatal conductance (gs), transpiration (E), and net assimilation (A) rate for 2016 and 2017; Figure S1. The effect of bud load and pruning type on berry weight. Figure S2. The effect of bud load and pruning type on the total soluble solids, titratable acidity, and pH; Figure S3. The effects of bud load and pruning type on the total anthocyanins and total phenolics per berry; Figure S4. The effect of bud load and pruning type on the ratio of total leaf area to grape yield and the ratio of yield to total pruning weight.
Author Contributions
Conceptualization, S.T. and S.K.; data curation, S.T., D.T., T.G., C.K., and A.A.; methodology, S.T. and S.K.; supervision, S.K.; writing—original draft preparation, S.T. and D.T.; writing—review and editing, S.T., D.T., and S.K. All authors have read and agreed to the published version of the manuscript.
Funding
This research received no external funding.
Data Availability Statement
The raw data supporting the conclusions of this article will be made available by the authors on request.
Conflicts of Interest
The authors declare no conflicts of interest.
References
- Gladstones, J.S. Viticulture and environment: A study of the effects of environment on grapegrowing and wine qualities, with emphasis on present and future areas for growing winegrapes in Australia; Winetitles: Adelaide, S. Aust., 1992 [reprint. 2002, ISBN 1875130128.
- Howell, G.S. Sustainable Grape Productivity and the Growth-Yield Relationship: A Review. Am. J. Enol. Vitic. 2001, 52, 165–174. [CrossRef]
- Ravaz, L.N. L'effeuillage de la vigne. Annales de L’Ecole Nationale d’agriculture de Montpellie 1911, 11, 216–244.
- Poni, S.; Gatti, M.; Palliotti, A.; Dai, Z.; Duchêne, E.; Truong, T.-T.; Ferrara, G.; Matarrese, A.M.S.; Gallotta, A.; Bellincontro, A.; et al. Grapevine quality: A multiple choice issue. Sci. Hortic. 2018, 234, 445–462. [CrossRef]
- Heazlewood, J.E.; Wilson, S.; Clark, R.J.; Gracie, A.J. Pruning effects on Pinot noir vines in Tasmania (Australia). Vitis 2006, 45, 165–171.
- Archer, E.; Fouche, G.W. Effect of Bud Load and Rootstock Cultivar on the Performance of V. vinifera L. cv. Red Muscadel (Muscat noir). SAJEV 1987, 8. [CrossRef]
- Greven, M.M.; Bennett, J.S.; Neal, S.M. Influence of retained node number on Sauvignon Blanc grapevine vegetative growth and yield. Australian Journal of Grape and Wine Research 2014, 20, 263–271. [CrossRef]
- Kurtural, S.K.; Dami, I.E.; Taylor, B.H. Effects of Pruning and Cluster Thinning on Yield and Fruit Composition of `Chambourcin' Grapevines. HortTechnology 2006, 16, 233–240. [CrossRef]
- Cameron, W.; Petrie, P.R.; Bonada, M. Effects of Vineyard Management Practices on Winegrape Yield Components. A Review Using Meta-analysis. American Journal of Enology and Viticulture 2024, 75. [CrossRef]
- Dry, P.R. Canopy management for fruitfulness. Australian Journal of Grape and Wine Research 2000, 6, 109–115. [CrossRef]
- Dokoozlian, N.K.; Kliewer, W.M. The Light Environment Within Grapevine Canopies. II. Influence of Leaf Area Density on Fruit Zone Light Environment and Some Canopy Assessment Parameters. Am J Enol Vitic. 1995, 46, 219–226. [CrossRef]
- Spayd, S.E.; Tarara, J.M.; Mee, D.L.; Ferguson, J.C. Separation of Sunlight and Temperature Effects on the Composition of Vitis vinifera cv. Merlot Berries. Am J Enol Vitic. 2002, 53, 171–182. [CrossRef]
- Tarara, J.M.; Lee, J.; Spayd, S.E.; Scagel, C.F. Berry Temperature and Solar Radiation Alter Acylation, Proportion, and Concentration of Anthocyanin in Merlot Grapes. Am J Enol Vitic. 2008, 59, 235–247. [CrossRef]
- Reynolds, A.G.; Vanden Heuvel, J.E. Influence of Grapevine Training Systems on Vine Growth and Fruit Composition: A Review. Am J Enol Vitic. 2009, 60, 251–268. [CrossRef]
- Greven, M.M.; Neal, S.M.; Hall, A.J.; Bennett, J.S. Influence of retained node number on Sauvignon Blanc grapevine phenology in a cool climate. Australian Journal of Grape and Wine Research 2015, 21, 290–301. [CrossRef]
- Miele, A.; Rizzon, L.A. Pruning and cluster thinning intensity on the composition of Cabernet Sauvignon grape. Revista Brasileira de Fruticultura 2013, 35, 1081–1092. [CrossRef]
- Smart, R.E.; Robinson, M.D.; New Zealand Ministry of Agriculture and Fisheries. Sunlight into wine : a handbook for winegrape canopy management; Winetitles: Adelaide, S. Aust., 1991, ISBN 1875130101.
- Hunter, J.J.; Harpe, A.C. The effect of rootstock cultivar and bud load on the colour of Vitis vinifera L. cv. Muscat noir (Red Muscadel) grapes. S. Afr. J. Enol. Vitic. 1987, 8, 1–5.
- Sabbatini, P.; Wierba, K.; Clearwater, L.; Howell, G.S. Impact of Training System and Pruning Severity on Yield, Fruit Composition, and Vegetative Growth of ‘Niagara’ Grapevines in Michigan. International Journal of Fruit Science 2015, 15, 237–250. [CrossRef]
- Howell, G.S.; Miller, D.P.; Edson, C.E.; Striegler, R.K. Influence of Training System and Pruning Severity on Yield, Vine Size, and Fruit Composition of Vignoles Grapevines. Am J Enol Vitic. 1991, 42, 191–198. [CrossRef]
- Eltom, M.; Winefield, C.S.; Trought, M. Effect of pruning system, cane size and season on inflorescence primordia initiation and inflorescence architecture of Vitis vinifera L. Sauvignon Blanc. Australian Journal of Grape and Wine Research 2014, 20, 459–464. [CrossRef]
- Wessner, L.F.; Kurtural, S.K. Pruning Systems and Canopy Management Practice Interact on the Yield and Fruit Composition of Syrah. American Journal of Enology and Viticulture 2013, 64, 134–138. [CrossRef]
- Peppi, M.C.; Kania, E. Effects of spur or cane pruning on fruit composition of ‘Cabernet Sauvignon’ grapes. In , 2017; pp 17–20, ISBN 9789462611535.
- Kyraleou, M.; Kallithraka, S.; Koundouras, S.; Chira, K.; Haroutounian, S.; Spinthiropoulou, H.; Kotseridis, Y. Effect of vine training system on the phenolic composition of red grapes (Vitis vinifera L. cv. Xinomavro). Journal International des Sciences de la Vigne et du Vin 2015, 49. [CrossRef]
- Theocharis, S.; Gkrimpizis, T.; Karadimou, C.; Alatzas, A.; Koundouras, S.; Taskos, D. Modulating ‘Xinomavro’ (Vitis vinifera L.) Vine Growth and Berry Composition: A Comparative Analysis of Rootstock Effects. Horticulturae 2024, 10, 490. [CrossRef]
- Theocharis, S.; Taskos, D.; Gkrimpizis, T.; Nikolaou, K.-E.; Miliordos, D.-E.; Koundouras, S. Optimizing ‘Xinomavro’ (Vitis vinifera L.) Performance by Post-Bloom Basal Leaf Removal Applications. Horticulturae 2024, 10, 340. [CrossRef]
- Choné, X. Stem Water Potential is a Sensitive Indicator of Grapevine Water Status. Annals of botany 2001, 87, 477–483. [CrossRef]
- Lopes, C.; Pinto, P.A. Easy and accurate estimation of grapevine leaf area with simple mathematical models. 55 Pages / VITIS - Journal of Grapevine Research, Vol. 44 No. 2 (2005): Vitis; VITIS - Journal of Grapevine Research, 2015. Vitis, 44 (2). Available online: https://ojs.openagrar.de/index.php/VITIS/article/view/4308.
- Sánchez-de-Miguel, P.; Baeza, P.; Junquera, P.; Lissarrague, J.R. Vegetative Development: Total Leaf Area and Surface Area Indexes. In Methodologies and Results in Grapevine Research; Delrot, S., Medrano, H., Or, E., Bavaresco, L., Grando, S., Eds.; Springer Netherlands: Dordrecht, 2010; pp 31–44, ISBN 978-90-481-9283-0.
- Iland, P. Techniques for chemical analysis and quality monitoring during winemaking; Patrick Iland Wine Promotions: Campbelltown, S. Aust., 2000, ISBN 064638435X.
- van Leeuwen, C.; Trégoat, O.; Choné, X.; Bois, B.; Pernet, D.; Gaudillère, J.-P. Vine water status is a key factor in grape ripening and vintage quality for red Bordeaux wine. How can it be assessed for vineyard management purposes? Journal International des Sciences de la Vigne et du Vin 2009, 43, 121–134. [CrossRef]
- Medrano, H.; Escalona, J.M.; Cifre, J.; Bota, J.; Flexas, J. A ten-year study on the physiology of two Spanish grapevine cultivars under field conditions: effects of water availability from leaf photosynthesis to grape yield and quality. Functional Plant Biology 2003, 30, 607–619. [CrossRef]
- Cifre, J.; Bota, J.; Escalona, J.M.; Medrano, H.; Flexas, J. Physiological tools for irrigation scheduling in grapevine (Vitis vinifera L.). Agriculture, Ecosystems and Environment 2005, 106, 159–170. [CrossRef]
- Candolfi-Vasconcelos, M.C.; Koblet, W. Yield, fruit quality, bud fertility and starch reserves of the wood as a function of leaf removal in Vitis vinifera-Evidence of compensation and stress recovering. Vitis -Geilweilerhof- 1990, 29, 199–221. [CrossRef]
- Benismail, M.C.; Bennaouar, M.; Elmribti, A. EFFECT OF BUD LOAD AND CANOPY MANAGEMENT ON GROWTH AND YIELD COMPONENTS OF GRAPE CV. 'CARDINAL' UNDER MILD CLIMATIC CONDITIONS OF AGADIR AREA OF MOROCCO. In ; International Society for Horticultural Science, 2007; pp 197–204.
- Howell, G.S.; Wolpert, J.A. Nodes Per Cane, Primary Bud Phenology, and Spring Freeze Damage to Concord Grapevines. a Preliminary Note. Am J Enol Vitic. 1978, 29, 229–232. [CrossRef]
- Kliewer, W.M.; Smart, R.E. Canopy manipulation for optimizing vine microclimate, crop yield and composition of grapes. In Manipulation of fruiting; Wright, C.J., Ed.; Butterworth, London, 1989; pp 275–291.
- Jones, T.H.; Cullis, B.R.; Clingeleffer, P.R.; Rühl, E.H. Effects of novel hybrid and traditional rootstocks on vigour and yield components of Shiraz grapevines. Australian Journal of Grape and Wine Research 2009, 15, 284–292. [CrossRef]
- Ivanišević, D.; Kalajdžić, M.; Drenjančević, M.; Puškaš, V.; Korać, N. The impact of cluster thinning and leaf removal timing on the grape quality and concentration of monomeric anthocyanins in Cabernet-Sauvignon and Probus (Vitis vinifera L.) wines. Oeno One 2020, 54, 63–74. [CrossRef]
- Mirás-Avalos, J.M.; Buesa, I.; Llacer, E.; Jiménez-Bello, M.A.; Risco, D.; Castel, J.R.; Intrigliolo, D.S. Water Versus Source–Sink Relationships in a Semiarid Tempranillo Vineyard: Vine Performance and Fruit Composition. American Journal of Enology and Viticulture 2017, 68, 11–22. [CrossRef]
- van Leeuwen, C.; Destrac-Irvine, A. Modified grape composition under climate change conditions requires adaptations in the vineyard. Oeno One 2017, 51, 147. [CrossRef]
- Keller, M.; Mills, L.J.; Wample, R.L.; Spayd, S.E. Crop Load Management in Concord Grapes Using Different Pruning Techniques. American Journal of Enology and Viticulture 2004, 55, 35–50. [CrossRef]
- Holt, H.E.; Francis, I.L.; Field, J.; Herderich, M.J.; Iland, P.G. Relationships between berry size, berry phenolic composition and wine quality scores for Cabernet Sauvignon (Vitis vinifera L.) from different pruning treatments and different vintages. Australian Journal of Grape and Wine Research 2008, 14, 191–202. [CrossRef]
- Baiano, A.; Terracone, C. Effects of bud load on quality of Beogradska besemena and Thompson seedless table grapes and cultivar differentiation based on chemometrics of analytical indices. Journal of the Science of Food and Agriculture 2012, 92, 645–653. [CrossRef]
- Santesteban, L.G.; Miranda, C.; Royo, J.B. Vegetative Growth, Reproductive Development and Vineyard Balance. In Methodologies and Results in Grapevine Research; Delrot, S., Medrano, H., Or, E., Bavaresco, L., Grando, S., Eds.; Springer Netherlands: Dordrecht, 2010; pp 45–56, ISBN 978-90-481-9283-0.
- Kliewer, W.M.; Dokoozlian, N.K. Leaf Area/Crop Weight Ratios of Grapevines: Influence on Fruit Composition and Wine Quality. American Journal of Enology and Viticulture 2005, 56, 170–181. [CrossRef]
Figure 1.
Effects of bud load and pruning type on leaf area characteristics: (A) total, (B) main, and (C) secondary areas. Significant differences (P <0.05) among treatments are indicated by different letters.
Figure 1.
Effects of bud load and pruning type on leaf area characteristics: (A) total, (B) main, and (C) secondary areas. Significant differences (P <0.05) among treatments are indicated by different letters.
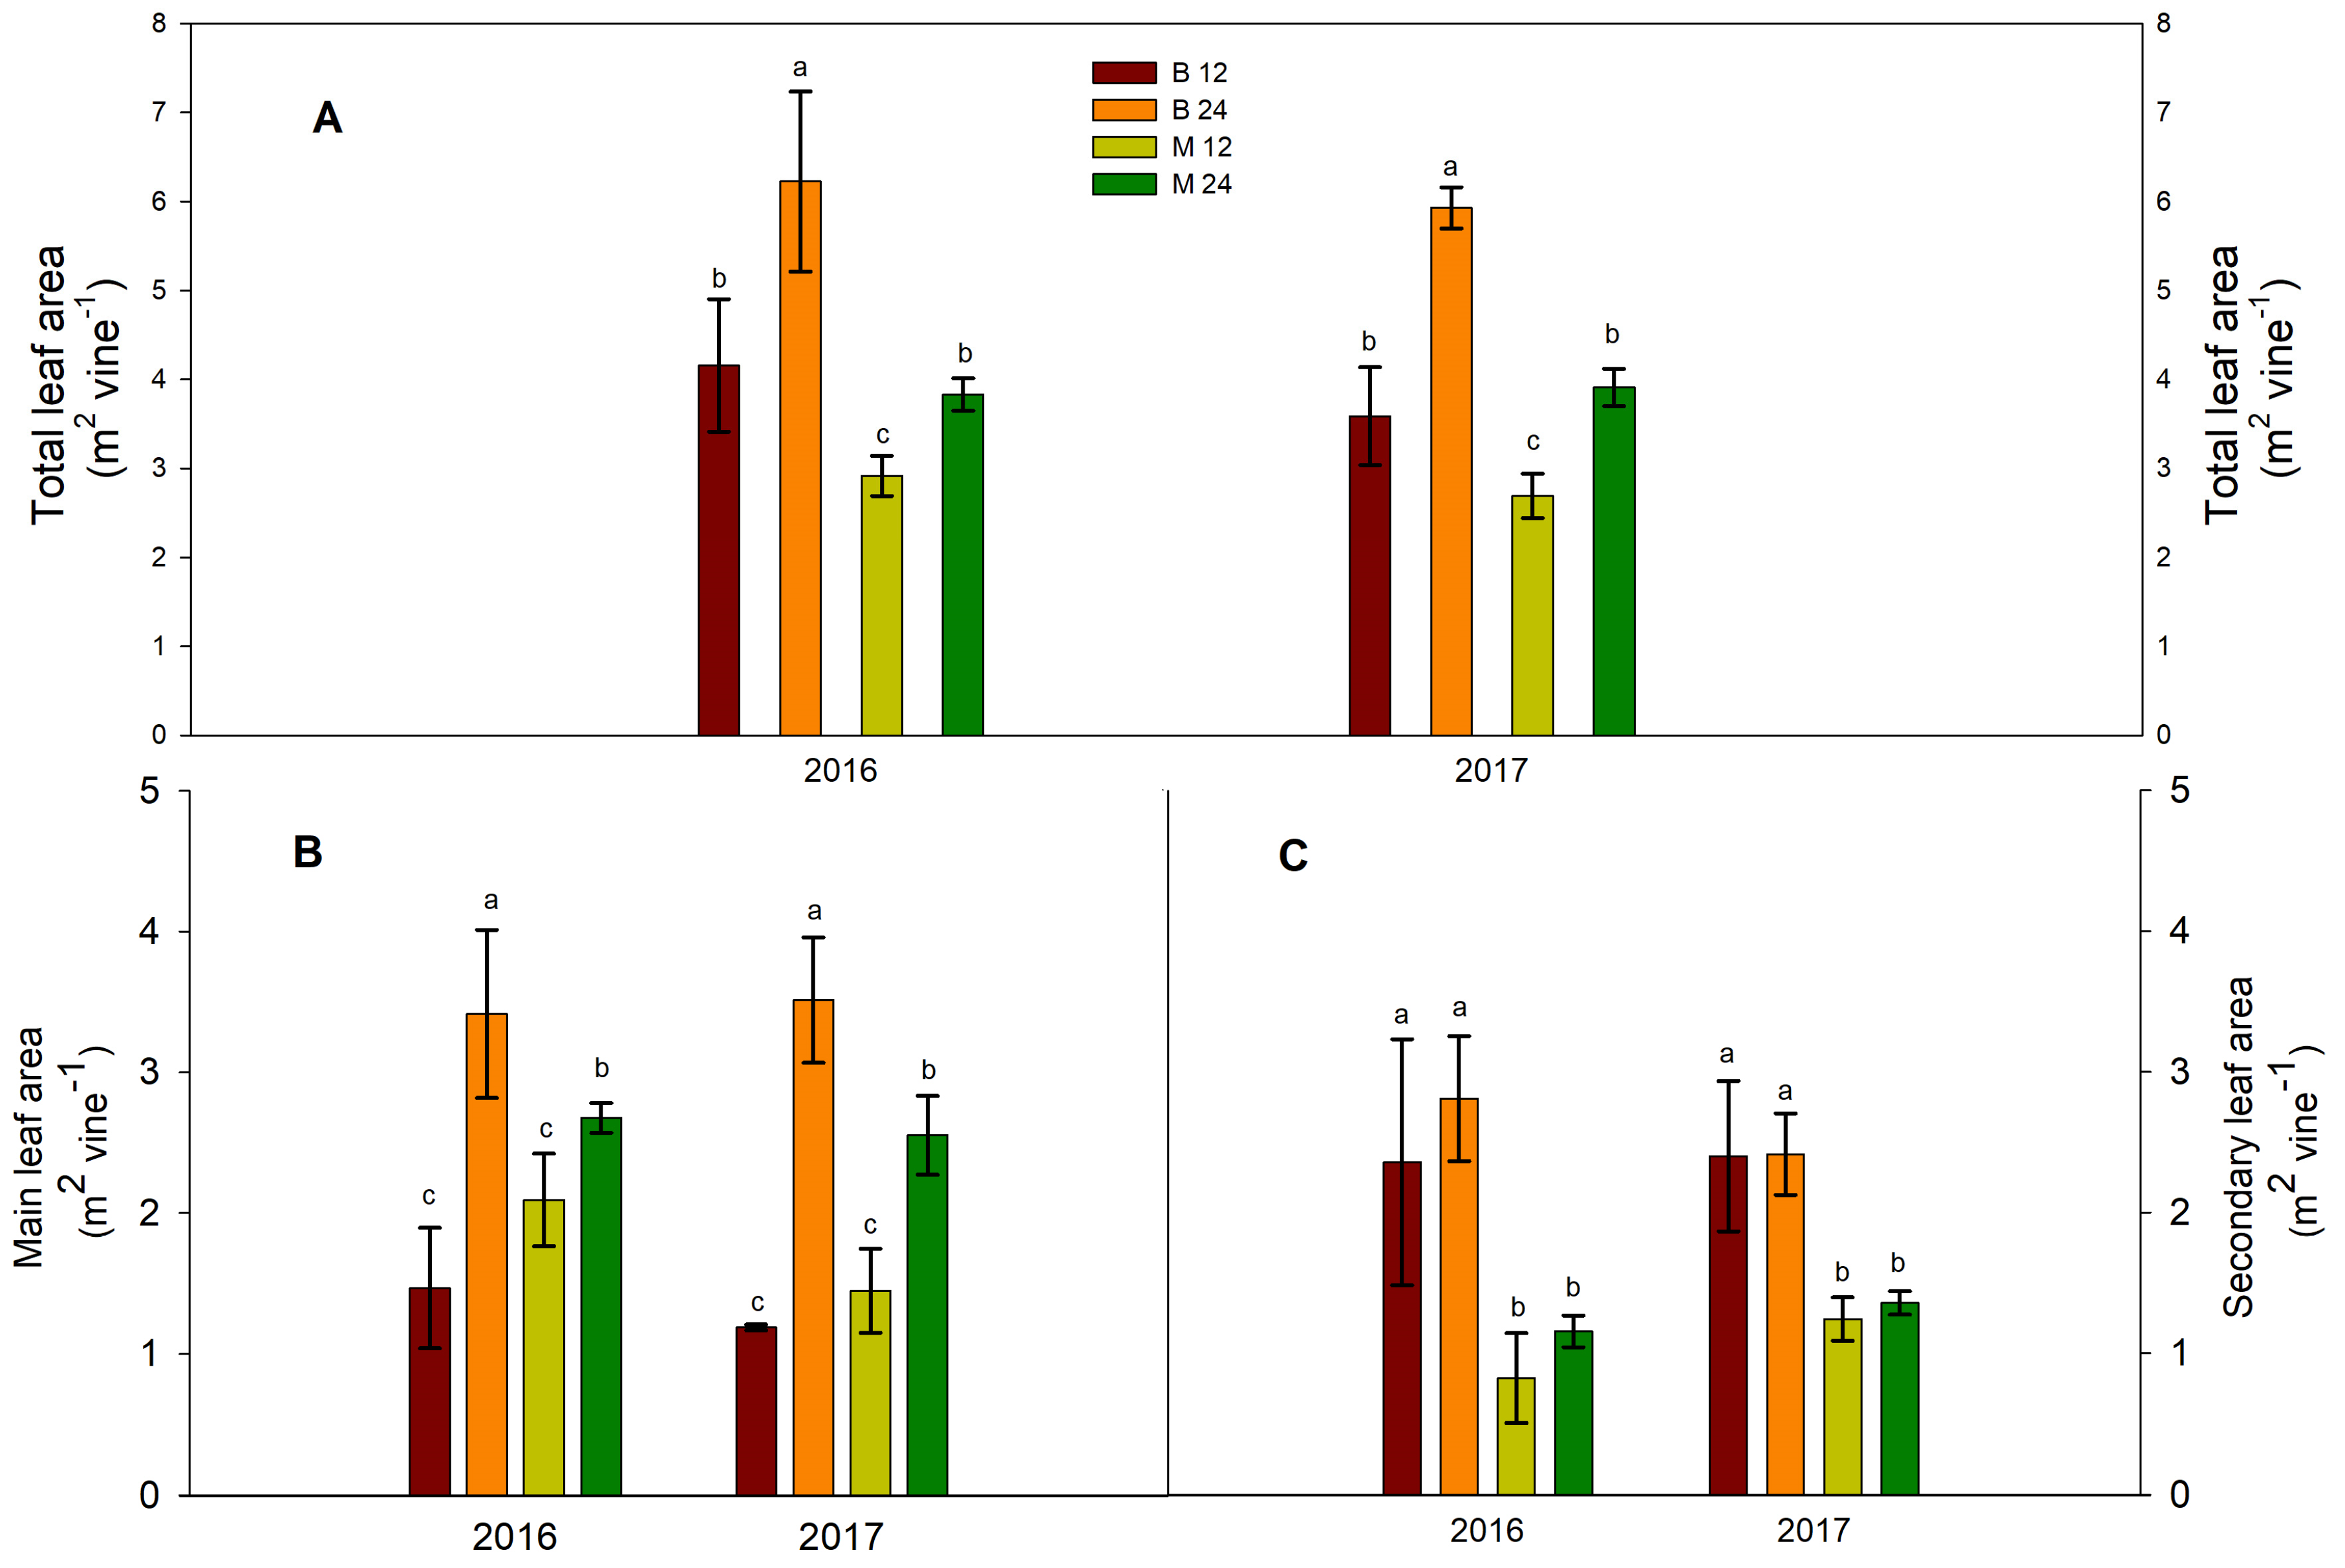
Figure 2.
Effects of bud load and pruning type on the mean number of shoots per vine (A) and the mean number of shoots per bud (B). Significant differences (P <0.05) among treatments are indicated by different letters.
Figure 2.
Effects of bud load and pruning type on the mean number of shoots per vine (A) and the mean number of shoots per bud (B). Significant differences (P <0.05) among treatments are indicated by different letters.
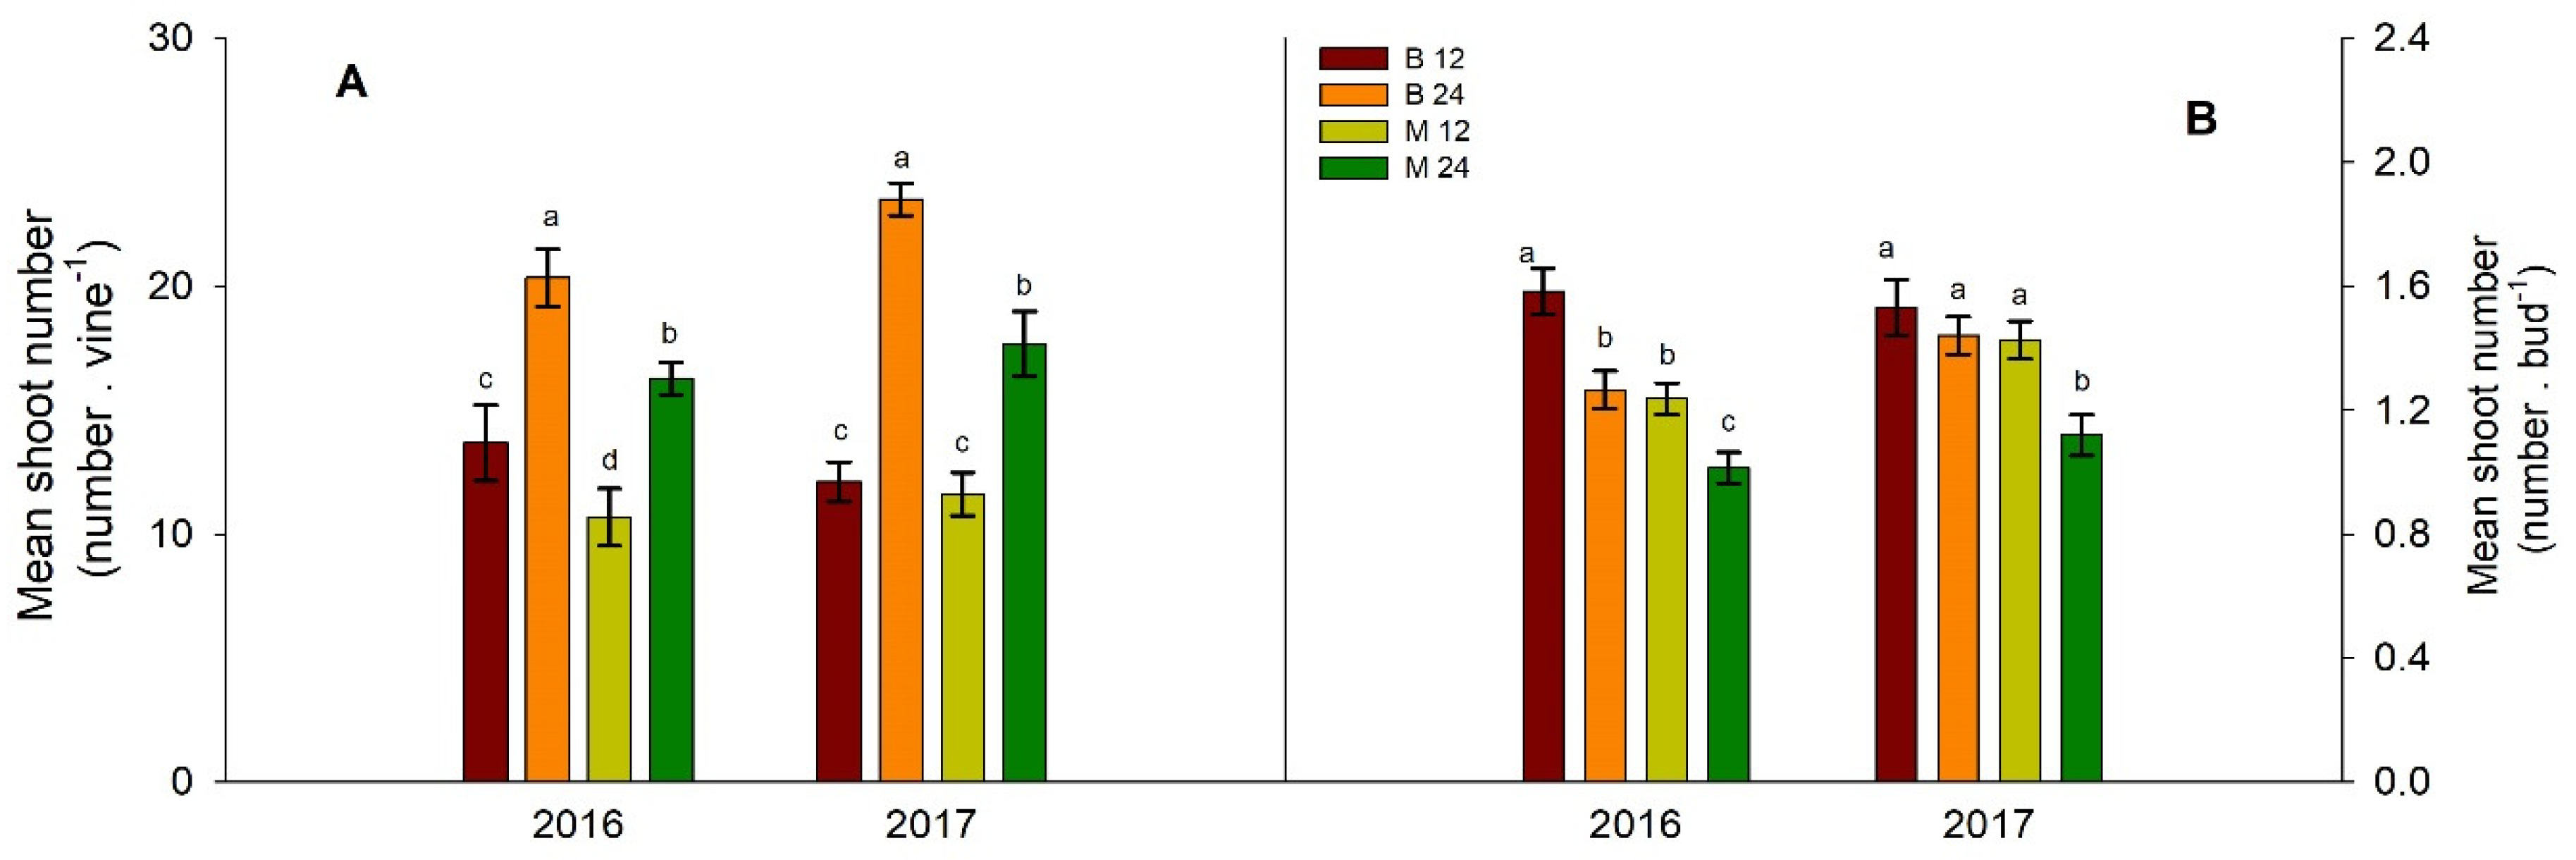
Figure 3.
Effects of bud load and pruning type on (A) pruning weight and (B) cane weight. Significant differences (P <0.05) among treatments are indicated by different letters. No significant differences were detected in cane weight.
Figure 3.
Effects of bud load and pruning type on (A) pruning weight and (B) cane weight. Significant differences (P <0.05) among treatments are indicated by different letters. No significant differences were detected in cane weight.
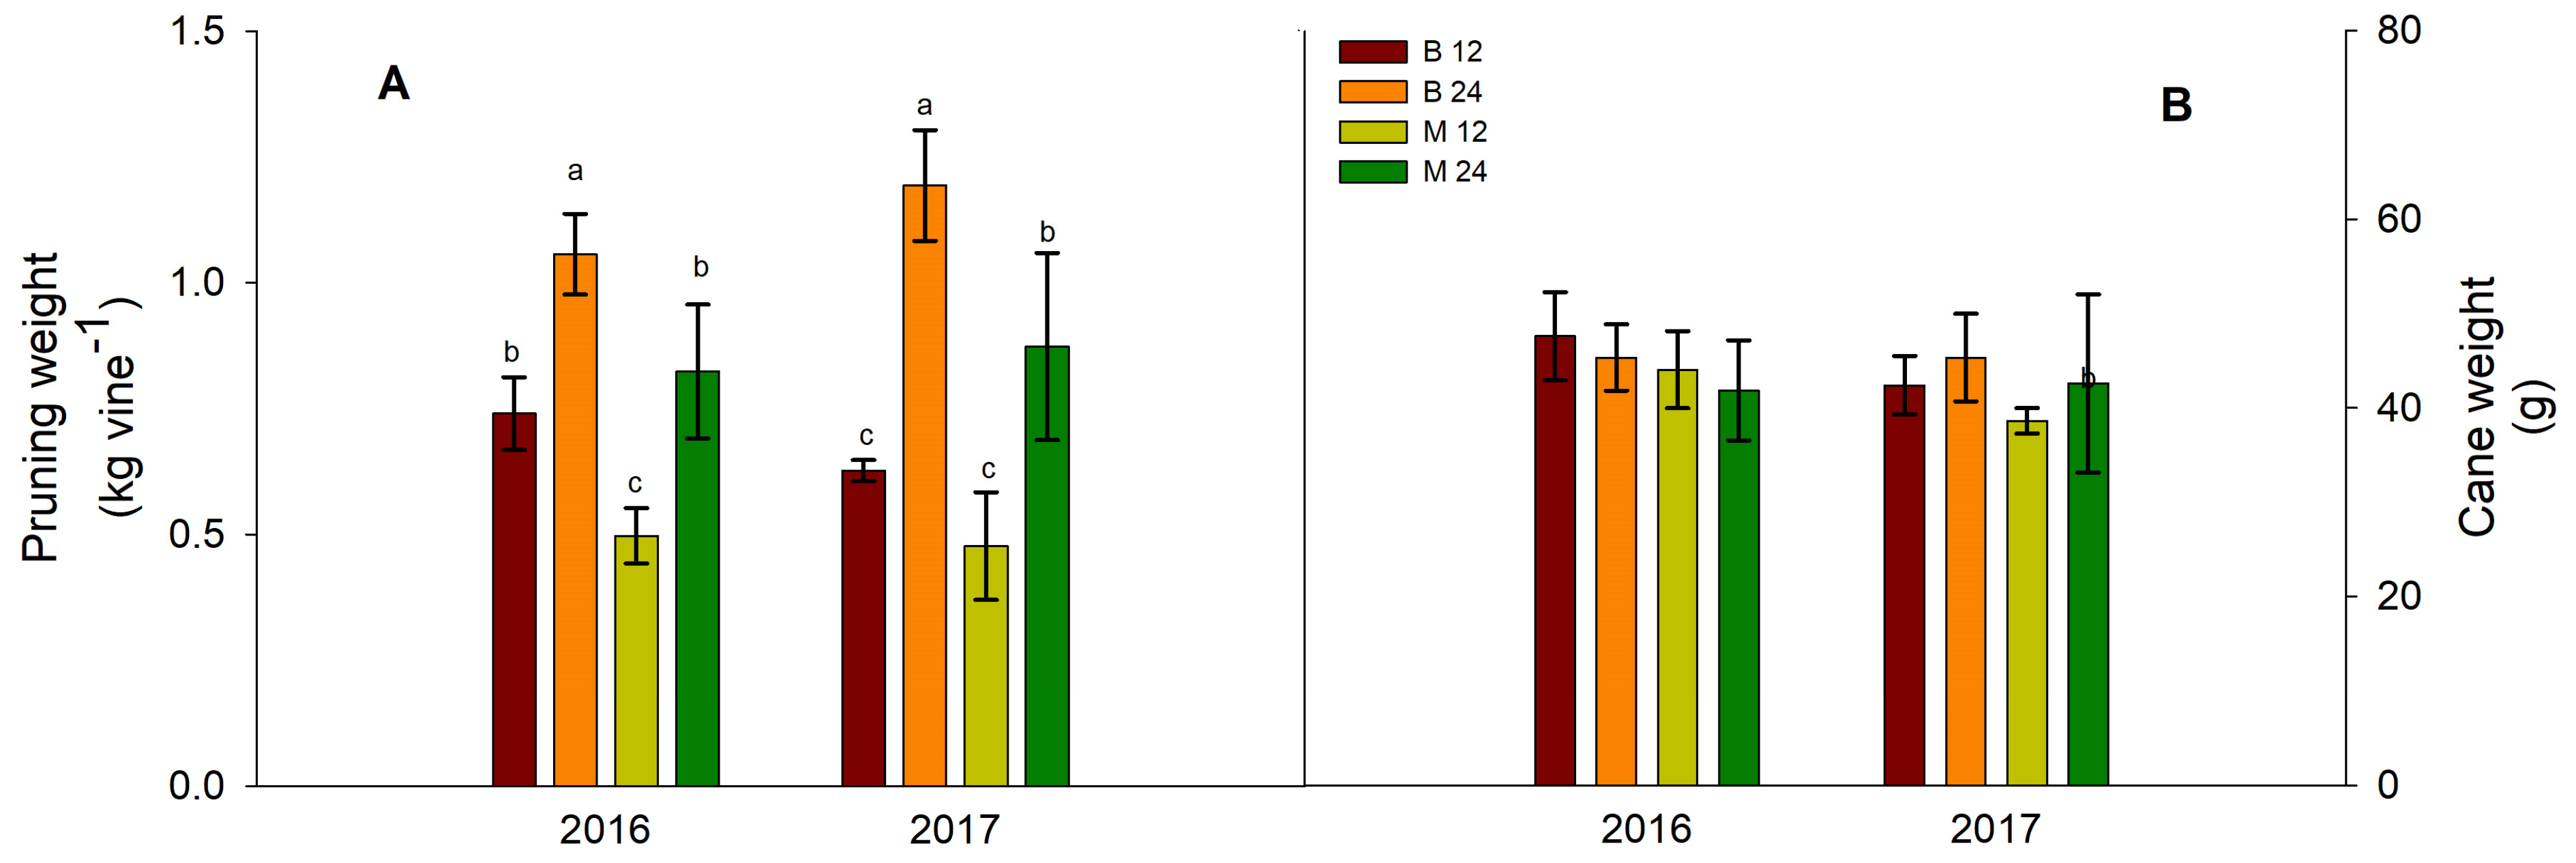
Figure 4.
Effect of bud load and pruning type on (A) % of exposed leaf area and (B) canopy density. Significant differences (P <0.05) among treatments are indicated by different letters.
Figure 4.
Effect of bud load and pruning type on (A) % of exposed leaf area and (B) canopy density. Significant differences (P <0.05) among treatments are indicated by different letters.
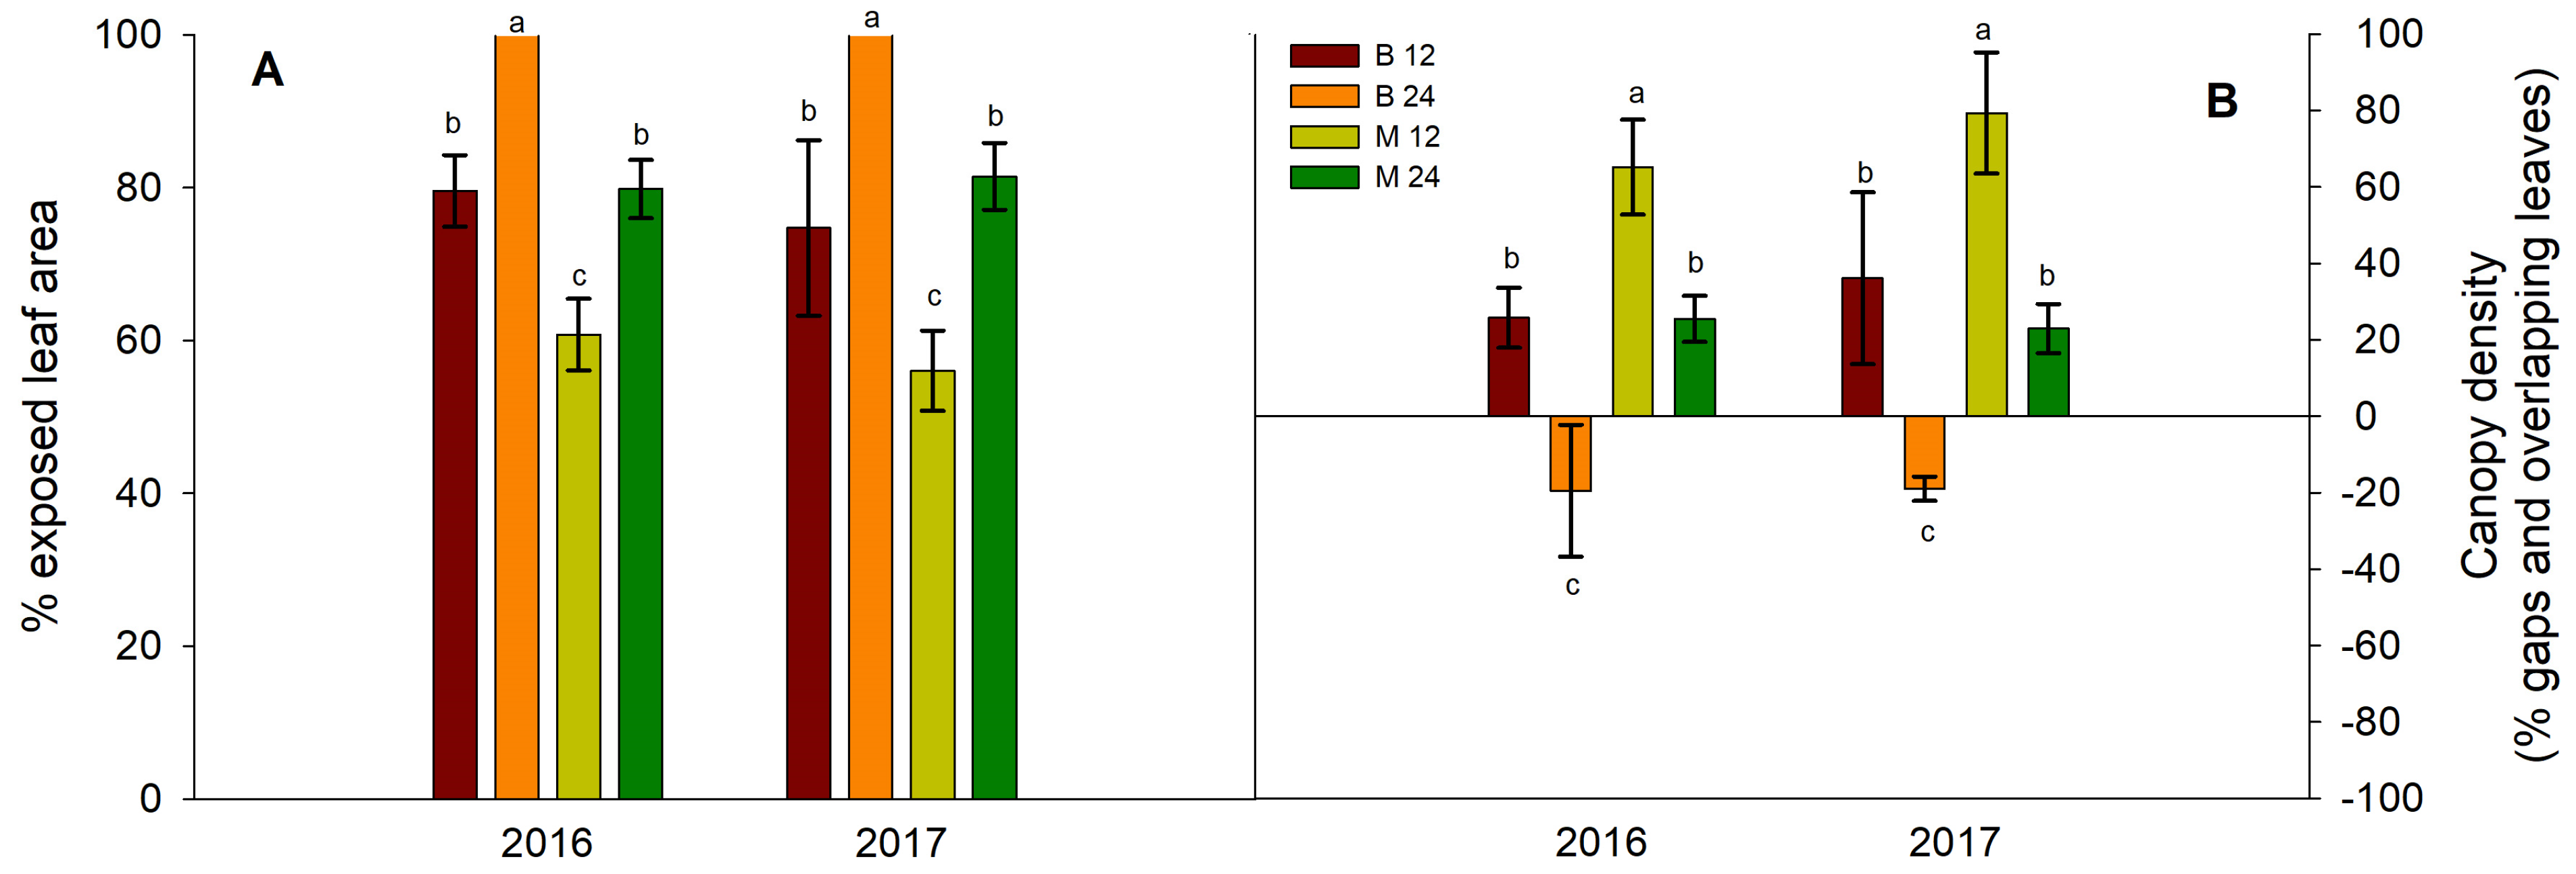
Figure 5.
Effects of bud load and pruning type on berry temperature. Significant differences (P <0.05) among treatments are indicated by different letters.
Figure 5.
Effects of bud load and pruning type on berry temperature. Significant differences (P <0.05) among treatments are indicated by different letters.
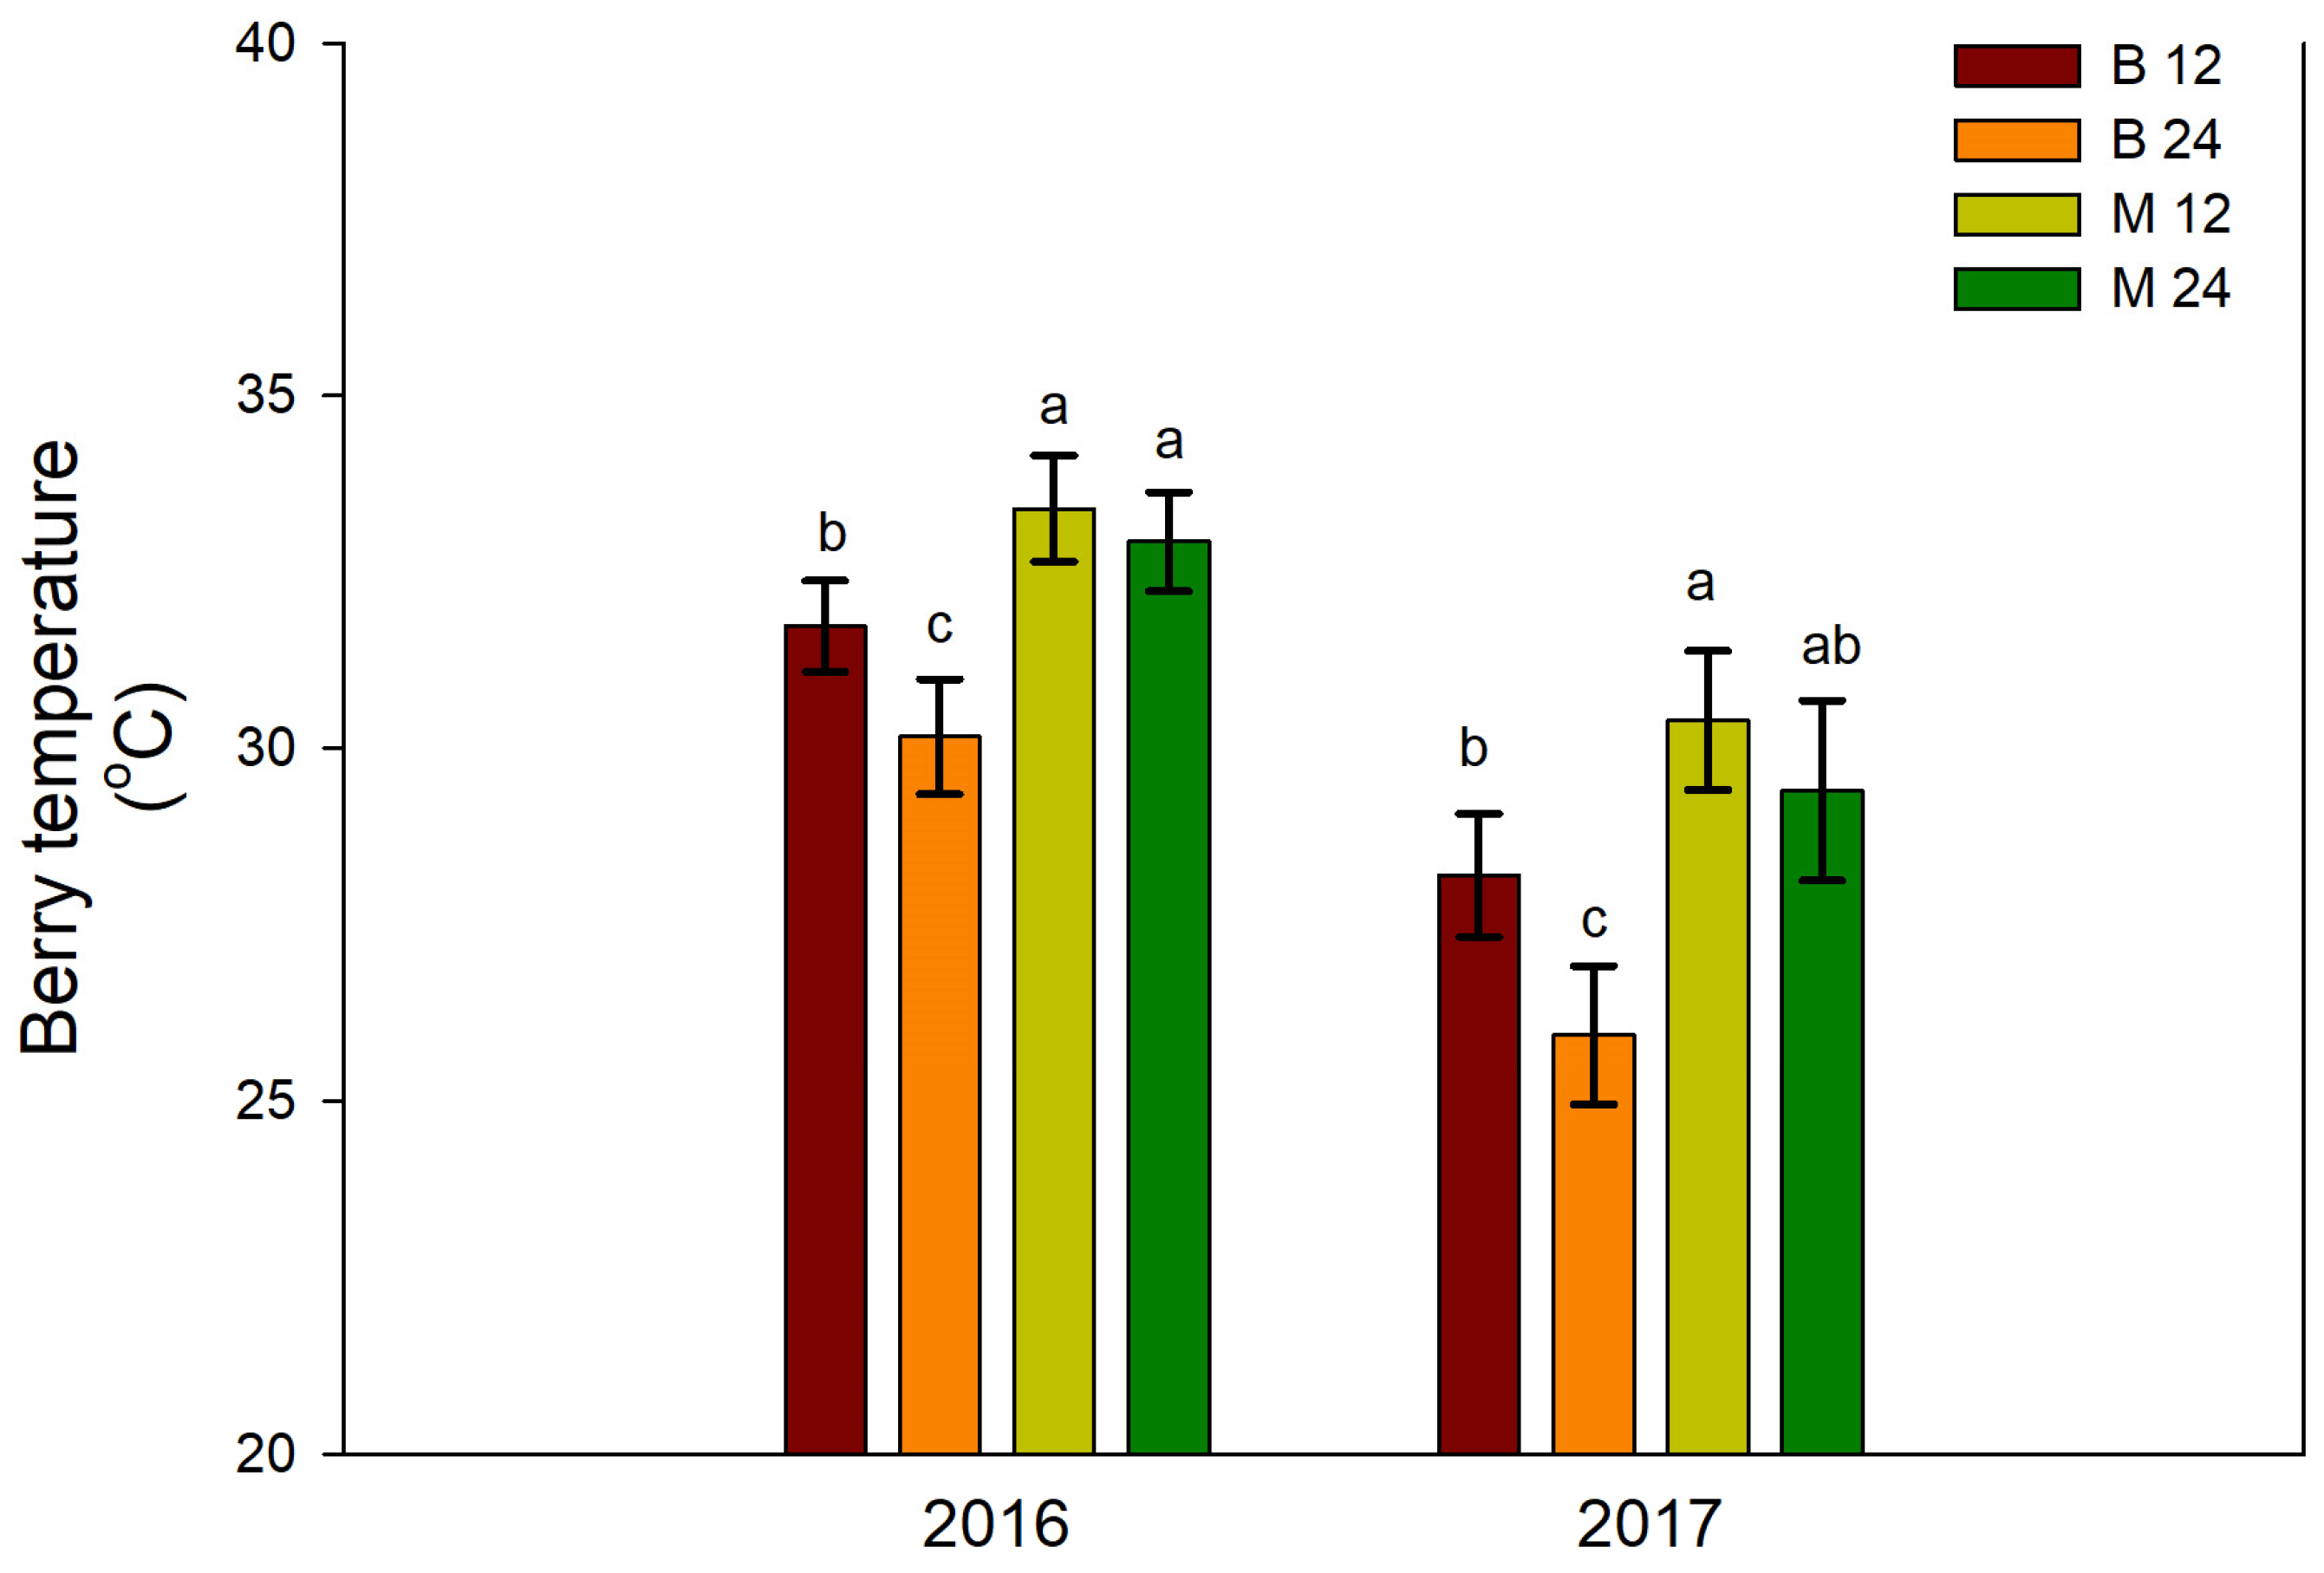
Figure 6.
Effects of bud load and pruning type on (A) yield and (B) cluster weight. Significant differences (P <0.05) among treatments are indicated by different letters.
Figure 6.
Effects of bud load and pruning type on (A) yield and (B) cluster weight. Significant differences (P <0.05) among treatments are indicated by different letters.

Figure 7.
Effect of bud load and pruning type on the mean number of clusters per vine (A) and mean number of clusters per shoot (B). Significant differences (P <0.05) among treatments are indicated by different letters.
Figure 7.
Effect of bud load and pruning type on the mean number of clusters per vine (A) and mean number of clusters per shoot (B). Significant differences (P <0.05) among treatments are indicated by different letters.
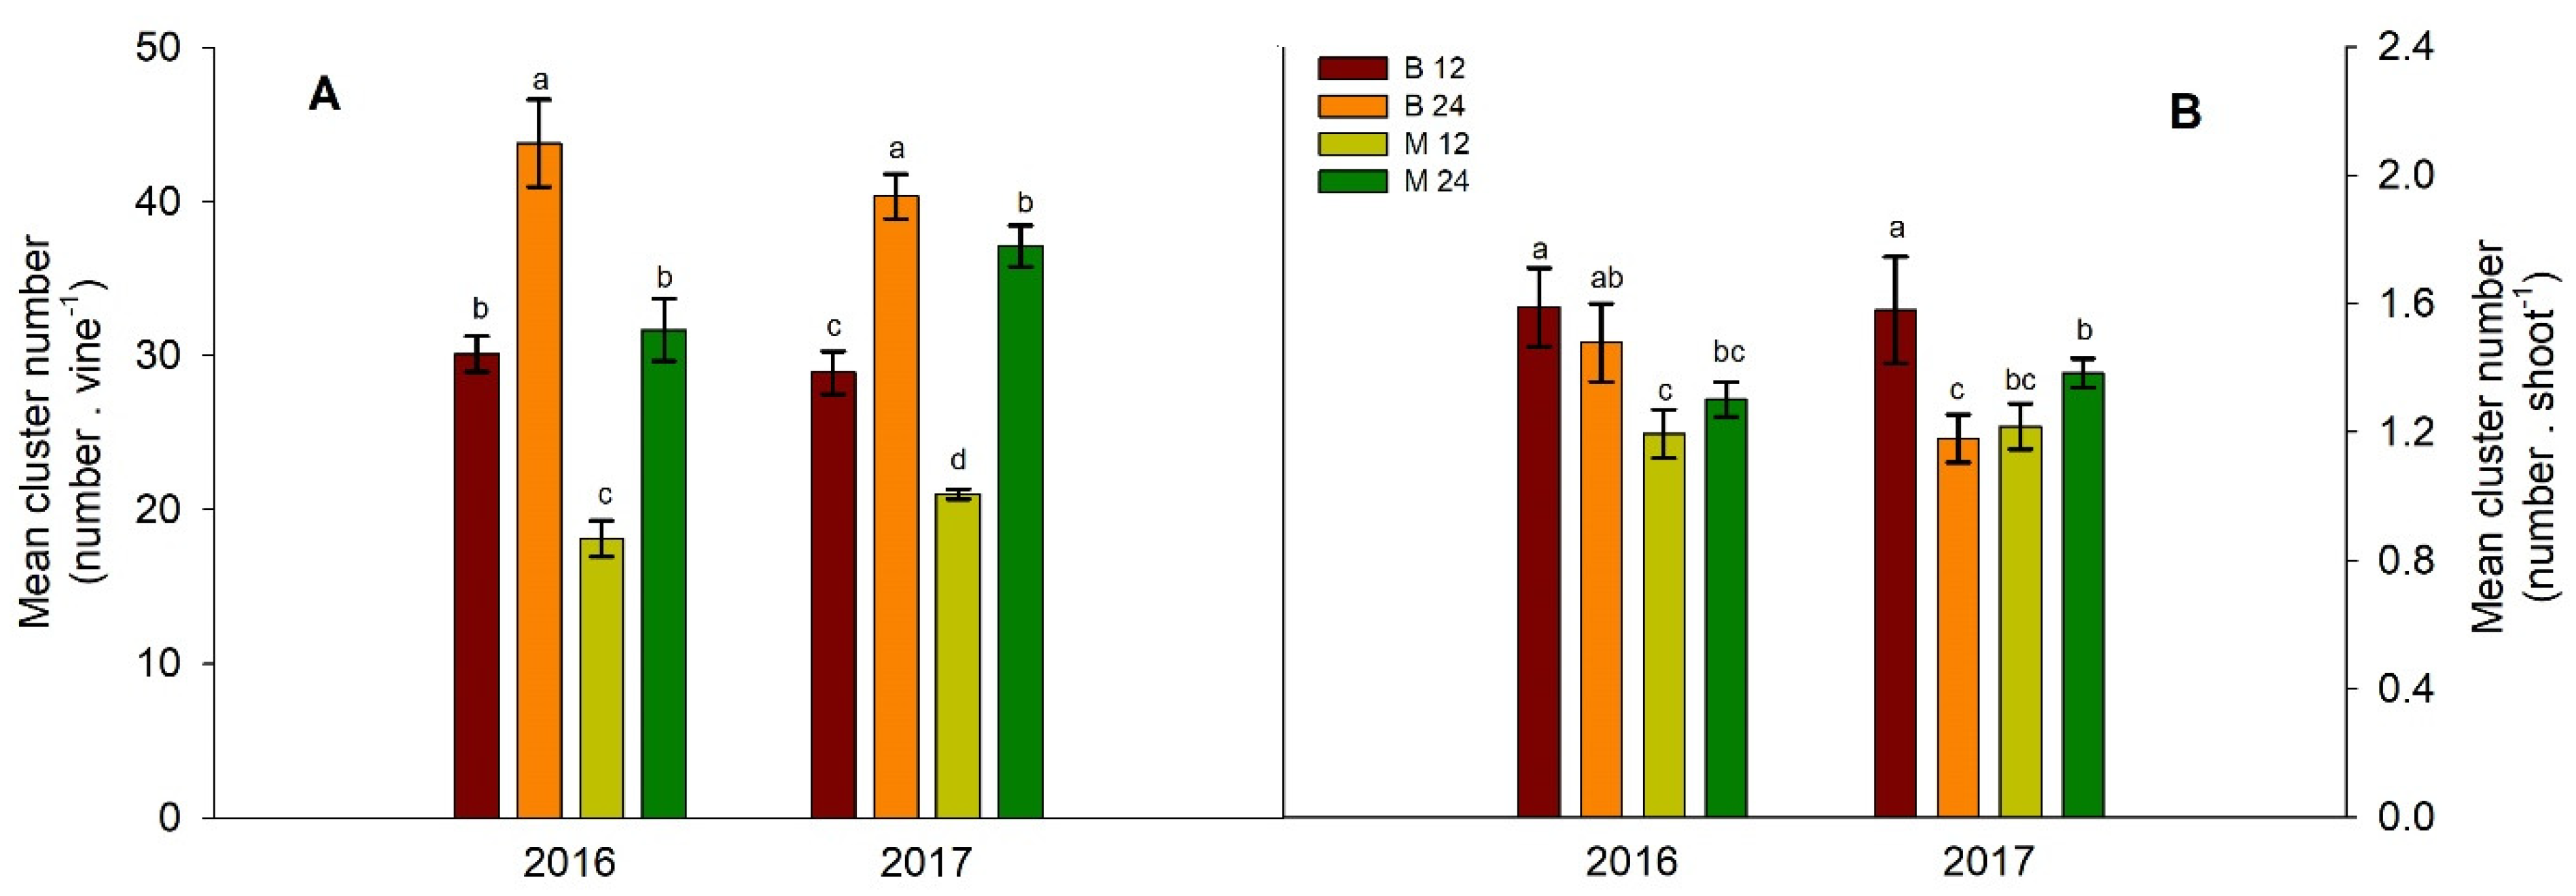
Figure 8.
Biplot of the Principal component analysis (PCA) for cv. Xinomavro vine growth, microclimate, yield, and berry composition.
Figure 8.
Biplot of the Principal component analysis (PCA) for cv. Xinomavro vine growth, microclimate, yield, and berry composition.
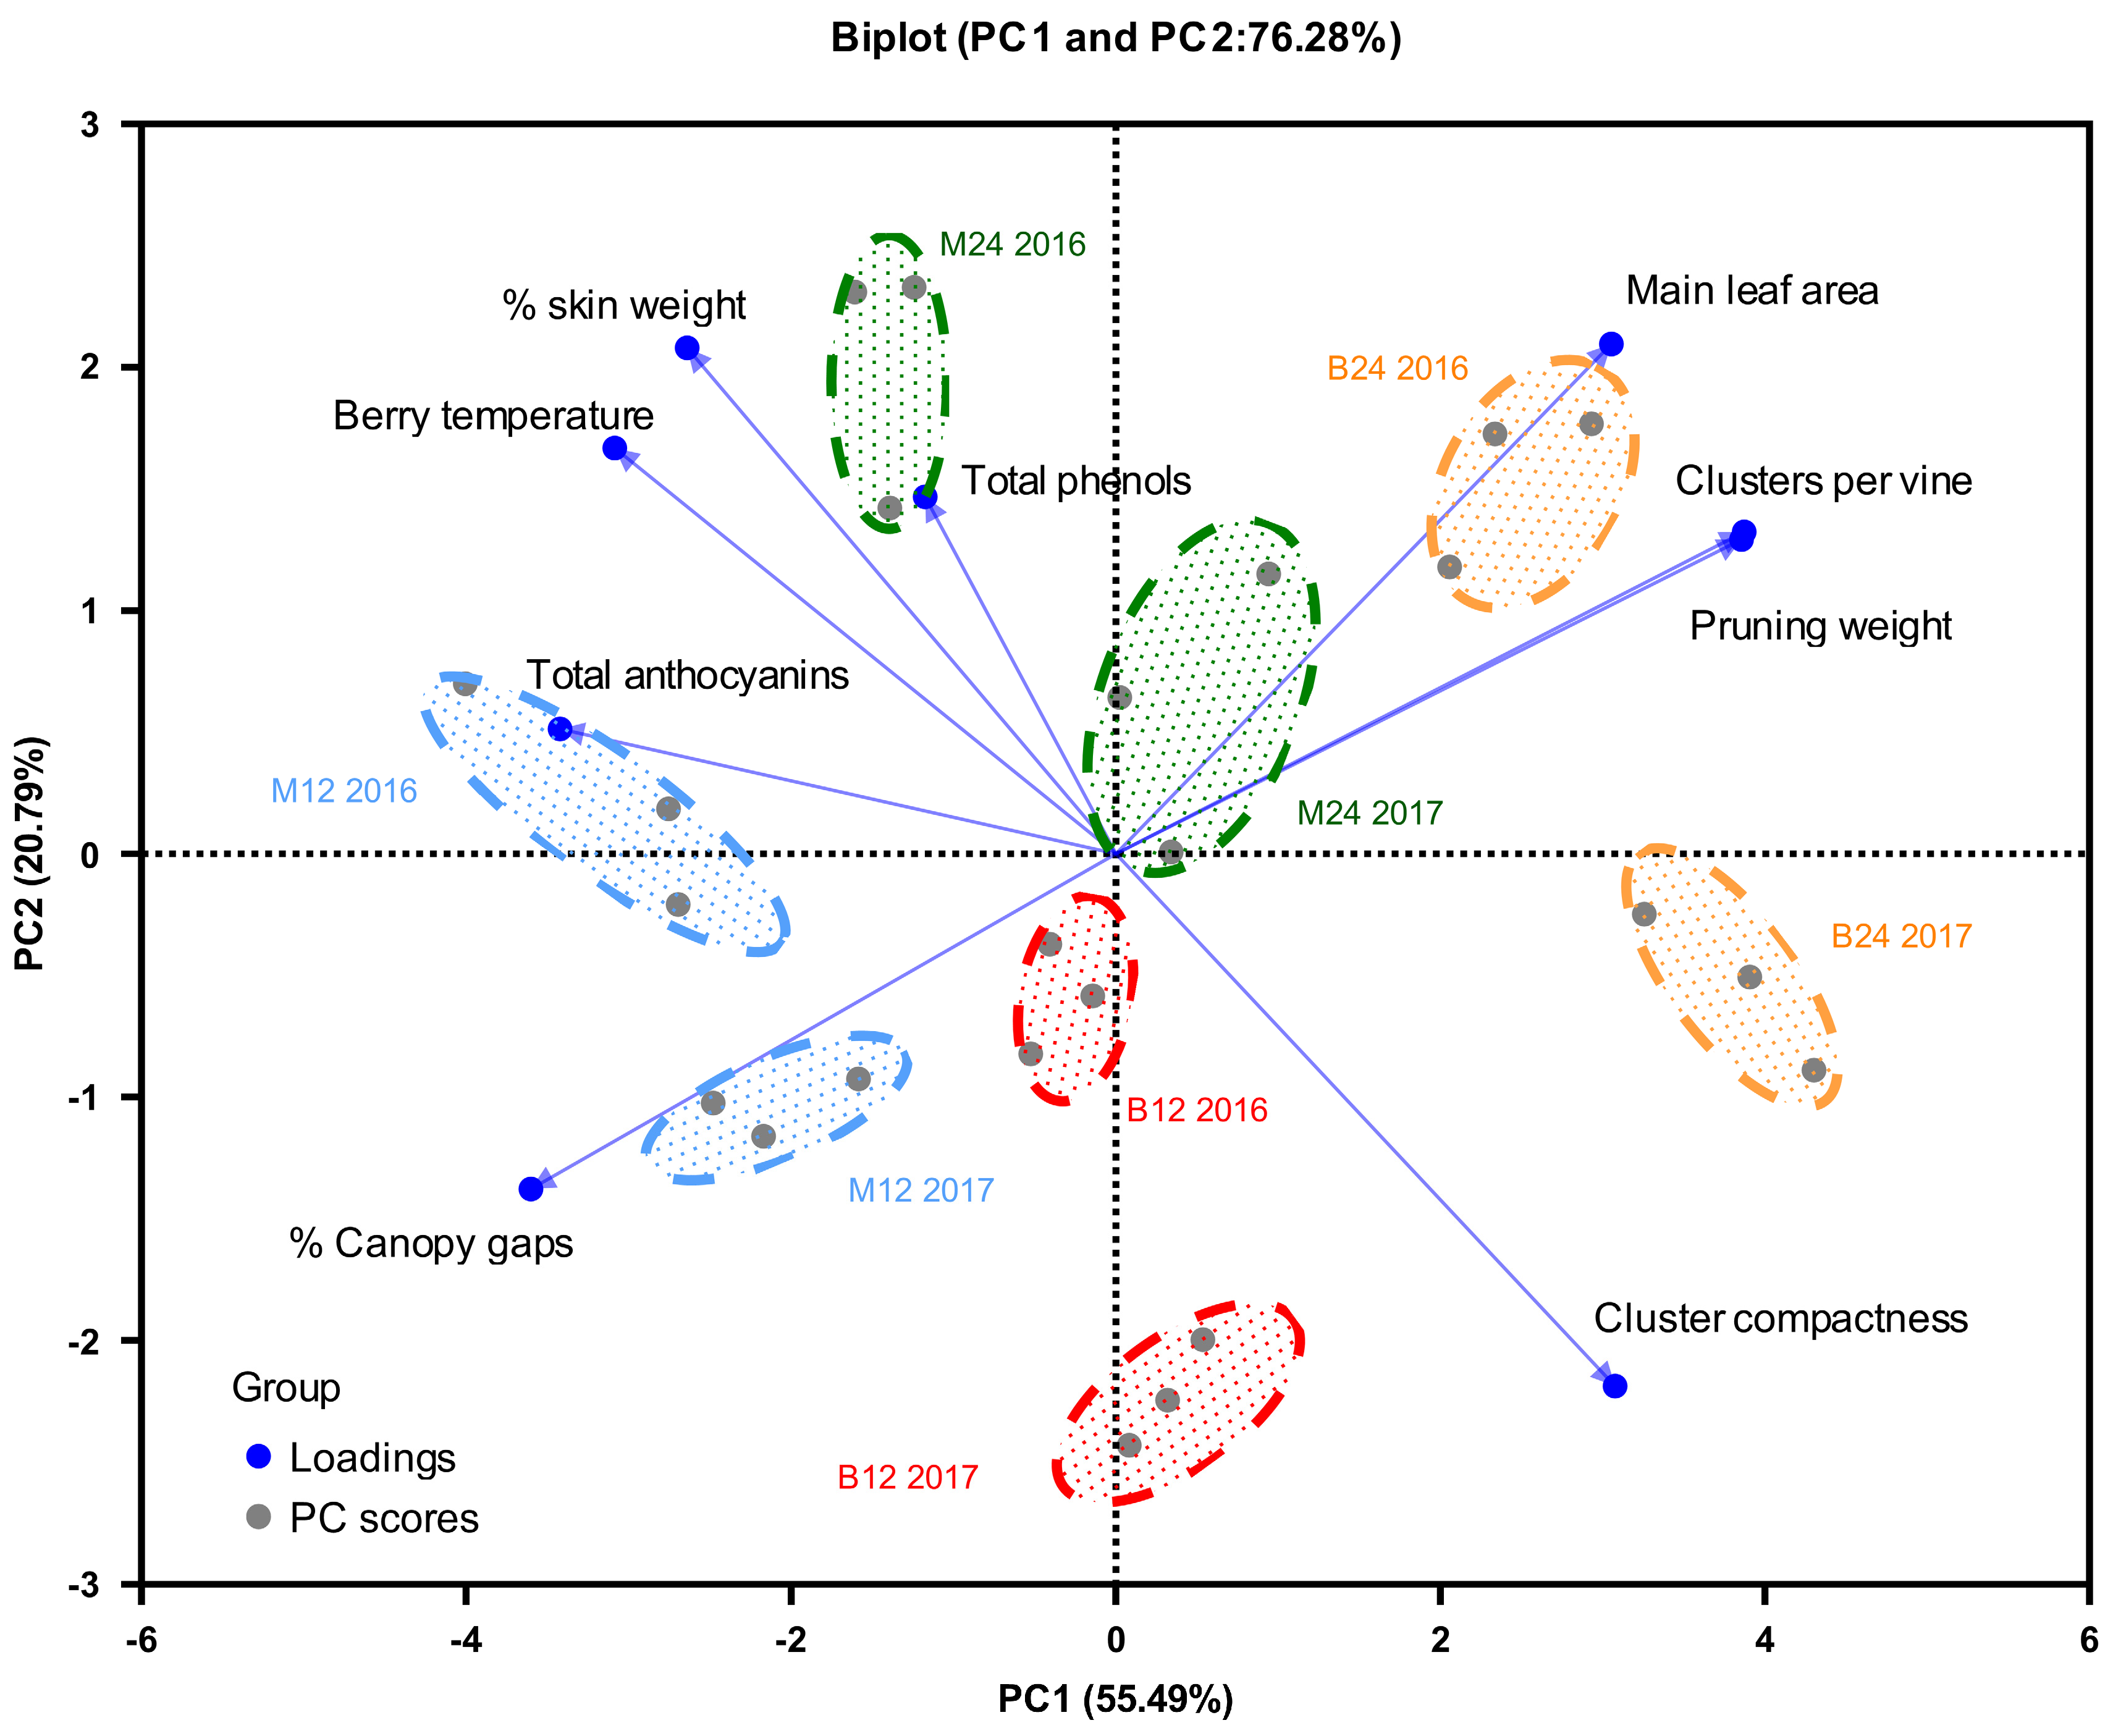

Table 1.
The combined treatment effects (B12: 12 buds on 6 spurs; B24: 24 buds on 12 spurs; M12: 12 buds on 2 canes; M24: 24 buds on 4 canes) of bud load (L), pruning type (T), and year effect (Y) on cluster architecture (length, width, berries per cluster, compactness) and berry components (% skin and seed weight) for 2016 and 2017. Means followed by different letters within each column and year are significantly different at P < 0.05, according to Duncan’s test. Asterisks indicate significant interactions at P < 0.05 (*) and P < 0.01 (**) significance levels ; ns indicates no significant interaction at P < 0.05.
| Year | Treatments | Cluster Length (cm) |
Cluster Width (cm) |
Berries per cluster | Cluster compactness (berries · cm-1) | (% skin weight) | (% seed weight) |
|---|---|---|---|---|---|---|---|
| 2016 | B 12 | 17,4 | 11,0 | 143 a | 8,3 a | 8,58 b | 2,18 b |
| B 24 | 16,4 | 9,6 | 133 ab | 8,1 a | 8,97 b | 1,39 c | |
| M 12 | 15,6 | 9,5 | 109 bc | 6,9 ab | 12,08 a | 3,63 a | |
| M 24 | 15,7 | 9,9 | 98 c | 6,2 b | 10,27 ab | 3,55 a | |
| C x T | ns | ns | ns | ns | ns | ns | |
| 2017 | B 12 | 16,7 b | 10,8 b | 169 b | 10,2 a | 7,91 b | 2,97 ab |
| B 24 | 17,6 a | 13,0 a | 198 a | 11,3 a | 8,40 b | 2,34 b | |
| M 12 | 15,3 c | 9,7 c | 121 c | 7,9 b | 12,67 a | 3,62 a | |
| M 24 | 15,5 c | 9,2 c | 124 c | 8,0 b | 12,70 a | 3,21 ab | |
| C x T | ns | ** | * | ns | ns | ns | |
| L * year | ns | * | * | ns | ns | ns |
Table 2.
The combined treatment effects (B12: 12 buds on 6 spurs; B24: 24 buds on 12 spurs; M12: 12 buds on 2 canes; M24: 24 buds on 4 canes) of bud load (L), pruning type (T), and year effect (Y) on berry composition at harvest. Means followed by different letters within each column and year are significantly different at P < 0.05, according to Duncan’s test. Asterisks indicate significant interactions at P < 0.05 (*), P < 0.01 (**), and P<0.001(***) significance levels; ns indicates no significant interaction at P < 0.05.
| Year | Treatments | Total soluble solids (oBrix) | Titratable acidity (g L-1) |
pH | Total anthocyanins (mg berry-1) | Total phenols (au berry-1) |
Total anthocyanins (mg g berry-1) | Total phenols (au g berry-1) |
|---|---|---|---|---|---|---|---|---|
| 2016 | B 12 | 22,7 a | 6,9 b | 3,1 b | 0,77 b | 2,18 c | 0,47 b | 1,32 b |
| B 24 | 20,5 b | 7,7 a | 3,2 a | 0,62 b | 2,40 b | 0,37 b | 1,45 b | |
| M 12 | 21,6 ab | 7,7 a | 3,3 a | 1,09 a | 2,32 b | 0,69 a | 1,48 b | |
| M 24 | 21,1 b | 8,3 a | 3,3 a | 1,07 a | 3,00 a | 0,74 a | 2,10 a | |
| C x T | * | ns | ns | ns | ns | ns | *** | |
| 2017 | B 12 | 22,2 a | 8,6 | 3,2 a | 0,78 bc | 2,30 b | 0,66 c | 1,93 b |
| B 24 | 19,6 b | 8,8 | 3,0 b | 0,71 c | 2,37 b | 0,88 bc | 2,88 a | |
| M 12 | 22,8 a | 8,6 | 3,1 ab | 1,02 a | 2,72 a | 1,19 a | 3,25 a | |
| M 24 | 22,7 a | 9,2 | 3,1 ab | 0,87 b | 2,33 b | 1,03 ab | 2,77 a | |
| C x T | ** | ns | * | ns | ns | *** | *** | |
| L * year | * | ns | * | * | * | * | * |
Disclaimer/Publisher’s Note: The statements, opinions and data contained in all publications are solely those of the individual author(s) and contributor(s) and not of MDPI and/or the editor(s). MDPI and/or the editor(s) disclaim responsibility for any injury to people or property resulting from any ideas, methods, instructions or products referred to in the content. |
© 2024 by the authors. Licensee MDPI, Basel, Switzerland. This article is an open access article distributed under the terms and conditions of the Creative Commons Attribution (CC BY) license (http://creativecommons.org/licenses/by/4.0/).
Copyright: This open access article is published under a Creative Commons CC BY 4.0 license, which permit the free download, distribution, and reuse, provided that the author and preprint are cited in any reuse.


