Preprint
Article

This version is not peer-reviewed.

Leaf Area Dynamics: Interactions with Vineyard Performance, Environment, and Viticultural Practices

A peer-reviewed article of this preprint also exists.

Submitted:

17 February 2025

Posted:

18 February 2025

You are already at the latest version

Abstract

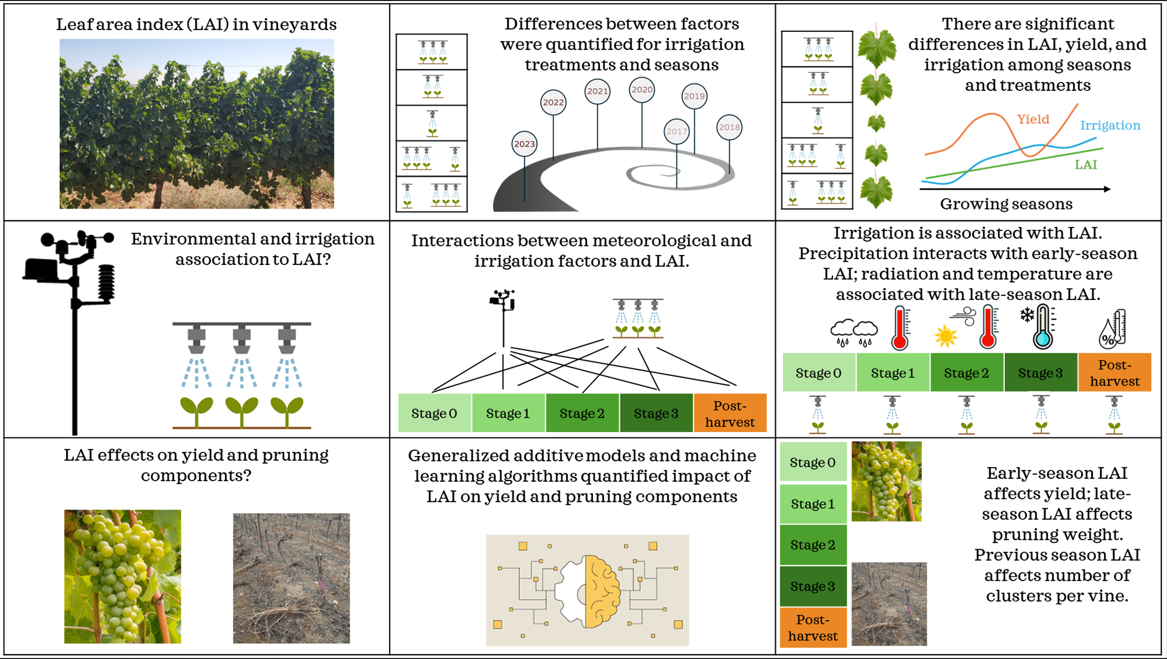
Leaf Area Index (LAI) is a key physiological metric in viticulture, associated with vine health, yield, and responsive to environmental and management factors. This study, conducted in a Mediterranean Sauvignon Blanc vineyard (2017–2023), examines how irrigation and environmental variables affect LAI across phenological stages and its impact on yield (clusters per vine, cluster weight, total yield) and pruning parameters (cane weight, pruning weight). Results show irrigation is the primary driver of LAI, with increased water availability promoting leaf area expansion. Environmental factors, including temperature, vapor pressure deficit, and solar radiation, influence LAI dynamics, with chilling hours playing a crucial role post-veraison. Excessive LAI (>1.6–1.7) reduces yield due to competition between vegetative and reproductive sinks. Early-season LAI correlates more strongly with yield, while late-season LAI predicts pruning weight and cane growth. Machine learning models reveal that excessive pre-veraison LAI in one season reduces cluster numbers in the next. This study highlights LAI as a critical tool for vineyard management. While irrigation promotes vegetative growth, excessive LAI can hinder fruit set and yield, emphasizing the need for strategic irrigation timing, canopy management, and climate adaptation to sustain long-term vineyard productivity.

Keywords: 
;  ;  ;  ;  ;  ;  

1. Introduction

Understanding and optimizing vine growth and productivity is crucial for sustainable viticulture. The leaf area index (LAI), defined as the leaf surface area per unit of ground area [1], is a critical physiological component in vineyards [2]. It serves as a robust indicator of vine health and vigor, directly influencing both yield [3,4] and pruning components [5], and strongly affected by the irrigation regime [6]. Leaf area controls the extent of interception of solar radiation [7], photosynthetic capacity [8], and evapotranspiration rates [9,10], thereby shaping fruit quality and vine development across phenological stages. Studies have demonstrated that optimal LAI values are essential for achieving high yields and effective resource allocation within the vine, as excessive or insufficient leaf area can adversely affect yield components such as clusters per vine, cluster weight, and total yield [11]. Furthermore, pruning components, including cane weight and pruning weight, have been shown to correlate strongly with LAI, highlighting its utility for vineyard management practices [12,13].
Phenology is the primary driver of vegetative development in vines. From budbreak to flowering, LAI increases rapidly, while the periods during bunch closure and veraison are characterized by minimal shifts in LAI values, with the exception of agrotechnical interventions [6,14,15]. During the post-veraison, and more substantially post-harvest stages, canopy senescence reduces leaf area, leading to decreasing LAI values until defoliation is complete and the vines enter winter dormancy [16,17].
The irrigation regime is a key factor in shaping LAI throughout the growing season. Water availability has been found to be a strong driver of vegetation growth, with higher irrigation amounts typically associated with increased LAI values [14]. Mancha et al. (2021)[18] showed increased LAI values in an irrigated ‘Tempranillo’ vineyard compared to lower LAI levels in rainfed vines. Bahat et al. (2021)[19] showed increased LAI values associated with micro terroir zones in a ‘Cabernet Sauvignon’ vineyard that were more susceptible to water accumulation due to constant terrain characteristics. However, a delicate balance exists between yield and leaf area responses to irrigation. While increased irrigation typically boost yield, it simultaneously elevates leaf area, potentially leading to resource competition between reproductive and vegetative sinks [11]. Generally, yield exhibits a linear correlation with LAI [20], though in vigorous varieties, excessive leaf area can result in over-shading, negatively impacting buds reproductivity and ultimately reducing yields [13].
Environmental factors profoundly influence leaf area, as they determine vegetation growth rates and canopy growth patterns [21,22]. The environmental factors affect vegetative growth at the different phenological stages, with varying and often interacting impacts. Williams (1987) highlighted the thresholds of the effect of growing degree days on leaf area in a ‘Thompson Seedless’ table grapes vineyard in California. Ramos (2017) found an impact of various meteorological factors on current shifts in the phenological cycle as well as in future decades, and distinguished between ‘Chardonnay’, ‘Parellada’, and ‘Macabeo’. Yu et al. (2021) [25] found higher LAI values in a ‘Merlot’ vineyard in California due to higher precipitation levels between budbreak and flowering. Similar findings were reported in a Californian ‘Zinfandel’ vineyard with regard to precipitation amounts prior to budbreak [26].
LAI is an integrator of the influence of various factors, including phenology, irrigation, agrotechnical practices, and environmental variables. Concurrently, it serves as a valuable indicator of yield and pruning components. This multifunctional nature positions LAI as a possible tool for assessing the combined impact of climatic and management practices on vineyard productivity. While LAI is a valuable tool for vineyard management, several key aspects of its temporal variability remain under-explored. The within-season effects of LAI on yield and pruning components have rarely been partitioned across different phenological stages. The impact of intra- and inter-seasonal LAI variability on long-term vineyard performance has not yet been assessed, thus the consequences of the lingering effects of LAI on productivity from one growing season to the next are not fully understood. An additional issue that received limited attention, is the interactive effects of irrigation and environmental factors on vegetative growth during the different phenological stages. With increasing climatic variability, the resilience of LAI as a proxy for vine health under stress conditions and fluctuations remains under-researched. Exploring the various responses and effects of grapevine LAI could inform adaptive viticulture practices.
The objective of this research was to describe the interplay between leaf area at different phenological stages and a range of environmental, viticultural, reproductive and vegetative factors. Specifically, this study aimed to: (1) Determine the influence of irrigation treatments and the multiseasonal variations on leaf area development.; (2) Quantify the relationships between leaf area at different phenological stages and key environmental and viticultural factors; and (3) Define the strength and nature of the effects of leaf area on grapevine yield and pruning components.

2. Materials and Methods
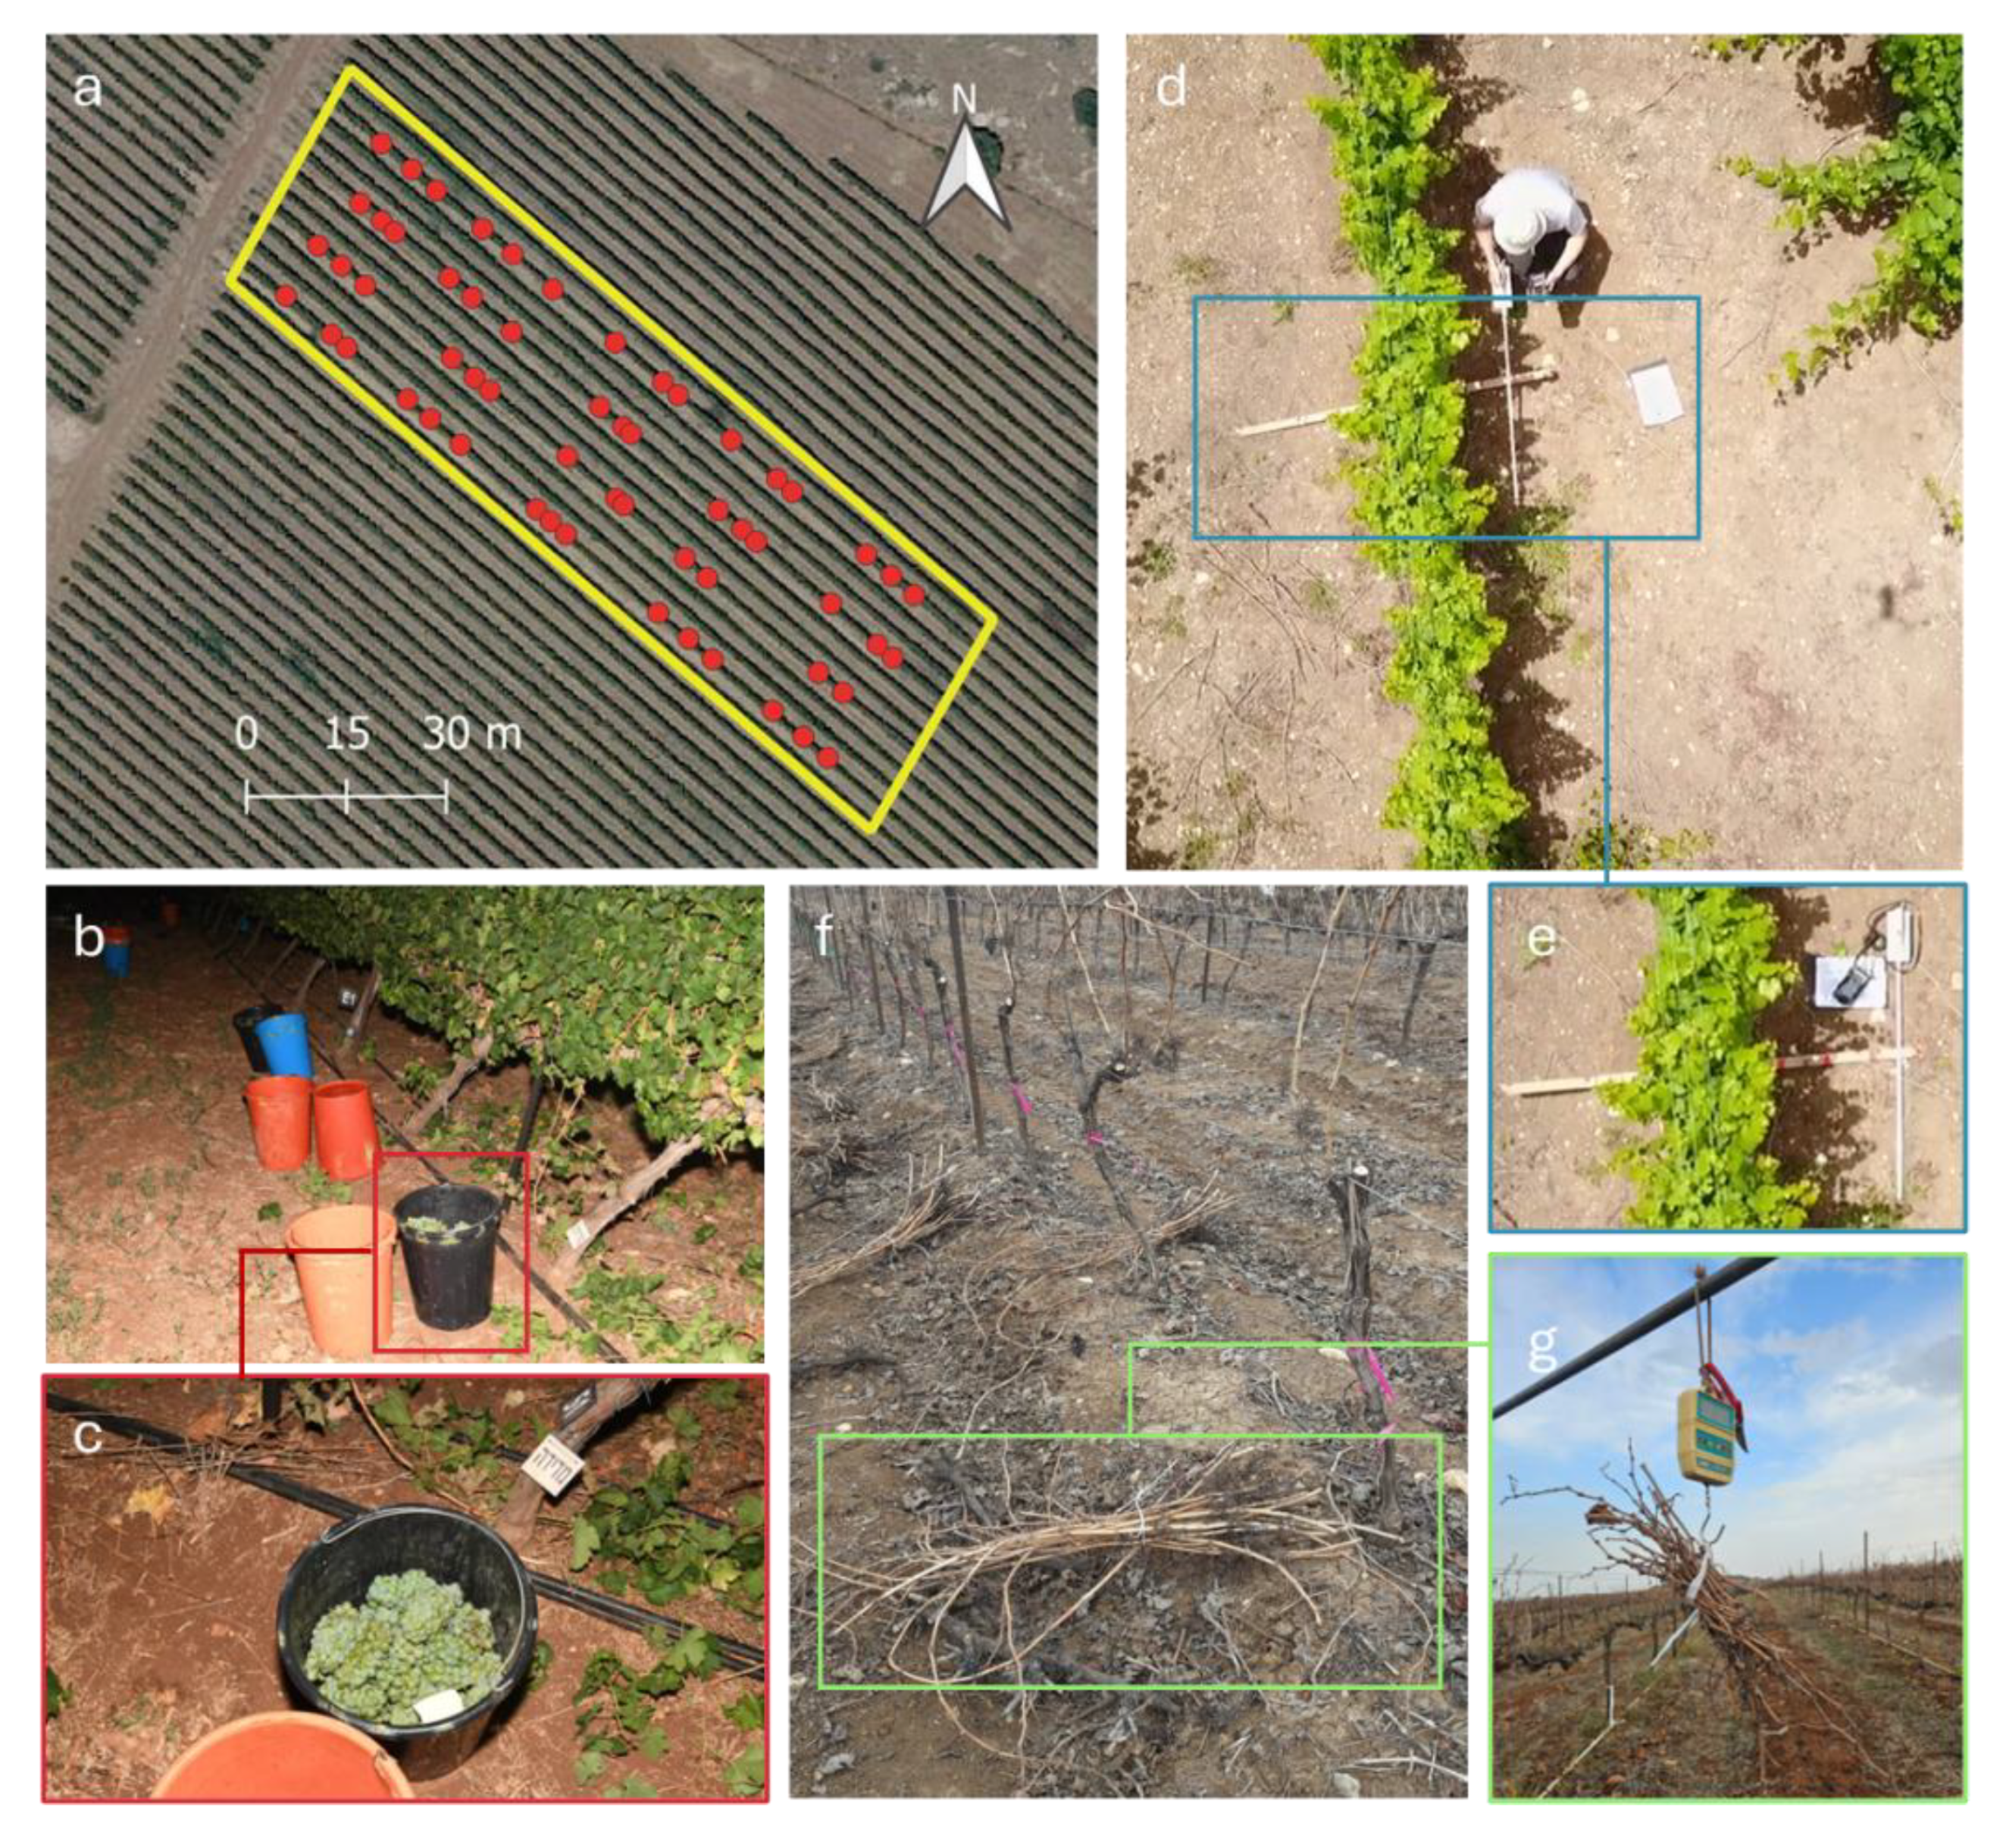
2.1. Study Site

The study was conducted in the Gilboa Mountain region (430 m above sea level) near Kibbutz Merav (32.44°N, 35.42°E), between 2017-2023. The experiment plot was located in a Vitis vinifera L. cv. ‘Sauvignon Blanc’ vineyard with vines grafted onto 1103 Paulsen rootstock , and planted in 2009. Vine and row spacing in this vineyard were 1.5m and 3m, respectively. The location is characterized by a Mediterranean climate, with warm and dry summers and a mean annual precipitation of 450 mm, typically occurring between October and May.

2.2. Experiment Design

The 4600 m2 experiment plot was delineated into 5 irrigation treatments in 4 blocks, and followed a spatially-balanced complete block (SBCB) design [27]. The technique used to determine the irrigation amounts was to calculate a predefined portion (i.e., irrigation coefficient) of crop evapotranspiration (ETc). ETc is defined as the amount of water consumed by the plant under standard conditions, where the plant is disease-free, has optimal soil-water content, and is well-fertilized [28]. The ETc values were computed using the LAI-Kc relationship equation developed by Munitz et al. (2019) [14]. This experiment included three sustained deficit irrigation (SDI) treatments, receiving low, medium, and high irrigation amounts (irrigation coefficients of 30%, 45%, and 60%, respectively) and two regulated deficit irrigation (RDI) treatments, with irrigation coefficients of 30% during phenological stages 1 and 2, and 60% during stage 3; and 60% during Stage 1, and 30% during stages 2 and 3. Further detail about the experiment can be found in Ohana-Levi et al. (2024, 2022b, 2022c) [4,11,29].
Each treatment contained 16 vines, with two outer vines on each side serving as buffers and the remaining 12 vines designated as measurement vines, resulting in a total of 240 measurement vines (12 vines * 4 replicates * 5 treatments); however, the leaf area index was measured only on 60 of these vines (3 vines * 4 replicates * 5 treatments, Figure 1a). Irrigation was delivered through a drip system with one line per row and in-line pressure-compensated 2.4 L h-1 UniRam drippers spaced at 0.5 m intervals (Netafim Ltd., Hatzerim, Israel). An irrigation control unit (Talgil Computing & Control Ltd., Haifa, Israel) managed the irrigation schedule for each of the five treatments independently.

2.3. Data Collection and Feature Engineering

This research utilized a dataset comprising field measurements (including yield components, plant vegetative characteristics, and irrigation data) and meteorological records obtained from a nearby official weather station. Phenological recordings and descriptive statistics for all measured yield components, field variables, and meteorological parameters are summarized in Tables 1 & 2.

2.3.1. Field Data

The measurement vines were numbered and tagged at the beginning of the experiment and sampled during each growing season and at harvest every year. The data were based on the same 60 measurement vines from which the vegetative records were collected.
Phenology: In each growing season, the dates of budbreak (Stage 0), flowering (Stage 1), bunch closure (Stage 2), veraison (Stage 3), and harvest were recorded, following Kennedy (2002) (Table 1). Post harvest stage was defined from harvest until September 30 of each season. The calculations of all features, aside from precipitation and chilling hours (Table 1), were conducted for each phenological stage of each growing season.
Yield and pruning components: Each season, during harvest and pruning (Table 1), the yield and pruning characteristics of the 240 measurement vines were meticulously recorded. In each season during harvest, the number of clusters, total yield (in kg vine-1, and then transformed to tons ha-1), and individual cluster weight (yield divided by cluster count) were determined for each vine (Figure 1b,c). During pruning, the number of canes, total pruning weight (Kg), and average cane weight (pruning weight divided by cane count) were recorded (Figure 1f,g). To align with LAI measurements, the yield and pruning data from the 60 corresponding measurement vines were utilized. All yield and pruning components were checked for outliers. These outliers were identified using the interquartile range (IQR) technique [4] and eliminated from the dataset.
Vegetative components: LAI was assessed for three designated vines within each experimental replicate (totaling 60 vines) on a weekly basis during each growing season using a canopy analysis system (SunScan model SS1-R3-BF3; Delta-T Devices, Cambridge, UK). This system employs a line-quantum sensor array sensitive to photosynthetically active radiation (PAR). Measurements were taken at regular intervals of 20 cm along the vine (Figure 1d,e). The non-destructive LAI values obtained from this method were validated against destructive measurements collected from 39 vines (across various cultivars and locations) using an area meter (model 3100; Li-Cor, Lincoln, Nebraska). A strong linear association (R² = 0.922, p < 0.001) was observed between the two methods [32]. For each measurement vine, average LAI values were calculated for each phenological stage. To investigate the influence of prior growing seasons' vegetative conditions on current reproductive and pruning characteristics, the mean LAI values for each phenological stage in each season were lagged. This means that for each growing season, the analysis included the corresponding LAI values from the preceding season's respective phenological stages.
Irrigation practices: The irrigation amounts varied as a function of the treatments applied in this experiment and the reference evapotranspiration (ETo) value preceding each irrigation event. Irrigation was recorded (mm) at the replicate scale and accumulated during each phenological stage throughout each growing season.

2.3.2. Meteorological Data

The meteorological records for the 7 growing seasons were collected from a meteorological station located 4.5 km north of the experimental plot (32.48°N, 35.41°E). The data collected included temperature (°C), relative humidity (%), wind speed (m/sec), solar radiation (MJ/m2), and precipitation (mm), at hourly intervals. The dataset was examined for missing values, and when gaps were lower than 6 hours, a weighted-moving average gap-filling technique was used to impute the data [33].
The meteorological factors were then engineered to feature the following representations (Table 2):
-
Total and Spring precipitation: The accumulated precipitation (mm) during the winter and spring preceding each growing season; Total precipitation and spring precipitation were accumulated from October 1 to April 30 and from March 1 to April 30 of each winter and spring, respectively. The range of values during the experimental period was very wide (250-555 mm in total, 24-134 mm in spring, Table 2), with quite high CVs (21.44% and 50.83%).
-
Temperature: Minimum, maximum, and mean daily temperature values were averaged across phenological stages for each season.
-
Vapor pressure deficit (VPD): Daily VPD values were calculated using the Magnus formula [34] and minimum, maximum and mean daily values were averaged across phenological stages for each growing season.
-
Total chilling hours: Accumulated number of cool hours during each winter preceding the growing seasons. They were calculated using the a scoring system: Hourly temperature below 7 °C = 1 chilling hour; between 7 °C and 10 °C = 0.5 chilling hour; between 10 °C and 18 °C = 0; and above 18 °C = − 1 chilling hour. The daily chilling hours were then summed, while negative chilling hours were counted as 0. Daily chilling hours were accumulated between November and April and provided as total seasonal chilling hours (Table 2). During the experimental period, the values ranged between 197 and 571 chilling hours, with a CV of 31.3%.
-
Reference evapotranspiration (ETo) : was calculated using the FAO Penman-Monteith equation [35]. The daily mean values were averaged for each phenological stage during each growing season. Values ranged between 2.3 and 8.2 mm day -1, with CV=27.5%.
-
Wind speed: hourly means were averaged for each phenological stage during each growing season, ranging between 4.5 and 7.4 mm sec-1.
-
Mean radiation: the hourly values were summed into daily records, and further averaged at the phenological stage scale. Values ranged between 14.2 and 28 MJ m-2 day-1.
-
Relative humidity (RH): Mean daily RH values were averaged for each phenological stage. Values ranged from 50% to 78%, with a low variance (CV=10.45%).
Preprocessing and data engineering was enabled using “dplyr”, “reshape2”, and “lubridate” packages in R [36,37,38].

2.4. Modeling Framework

2.4.1. Irrigation and Leaf Area Variations Among Seasons and Treatments

To address specific objective (1) and investigate the effects of irrigation and multi-seasonal variations on LAI, an analysis of variance (ANOVA) was conducted. Tukey's Honestly Significant Difference (HSD) post-hoc tests were subsequently employed to identify statistically significant differences of irrigation and yield among treatments and seasons. This analysis was enabled by package “agricolae” in R [39].

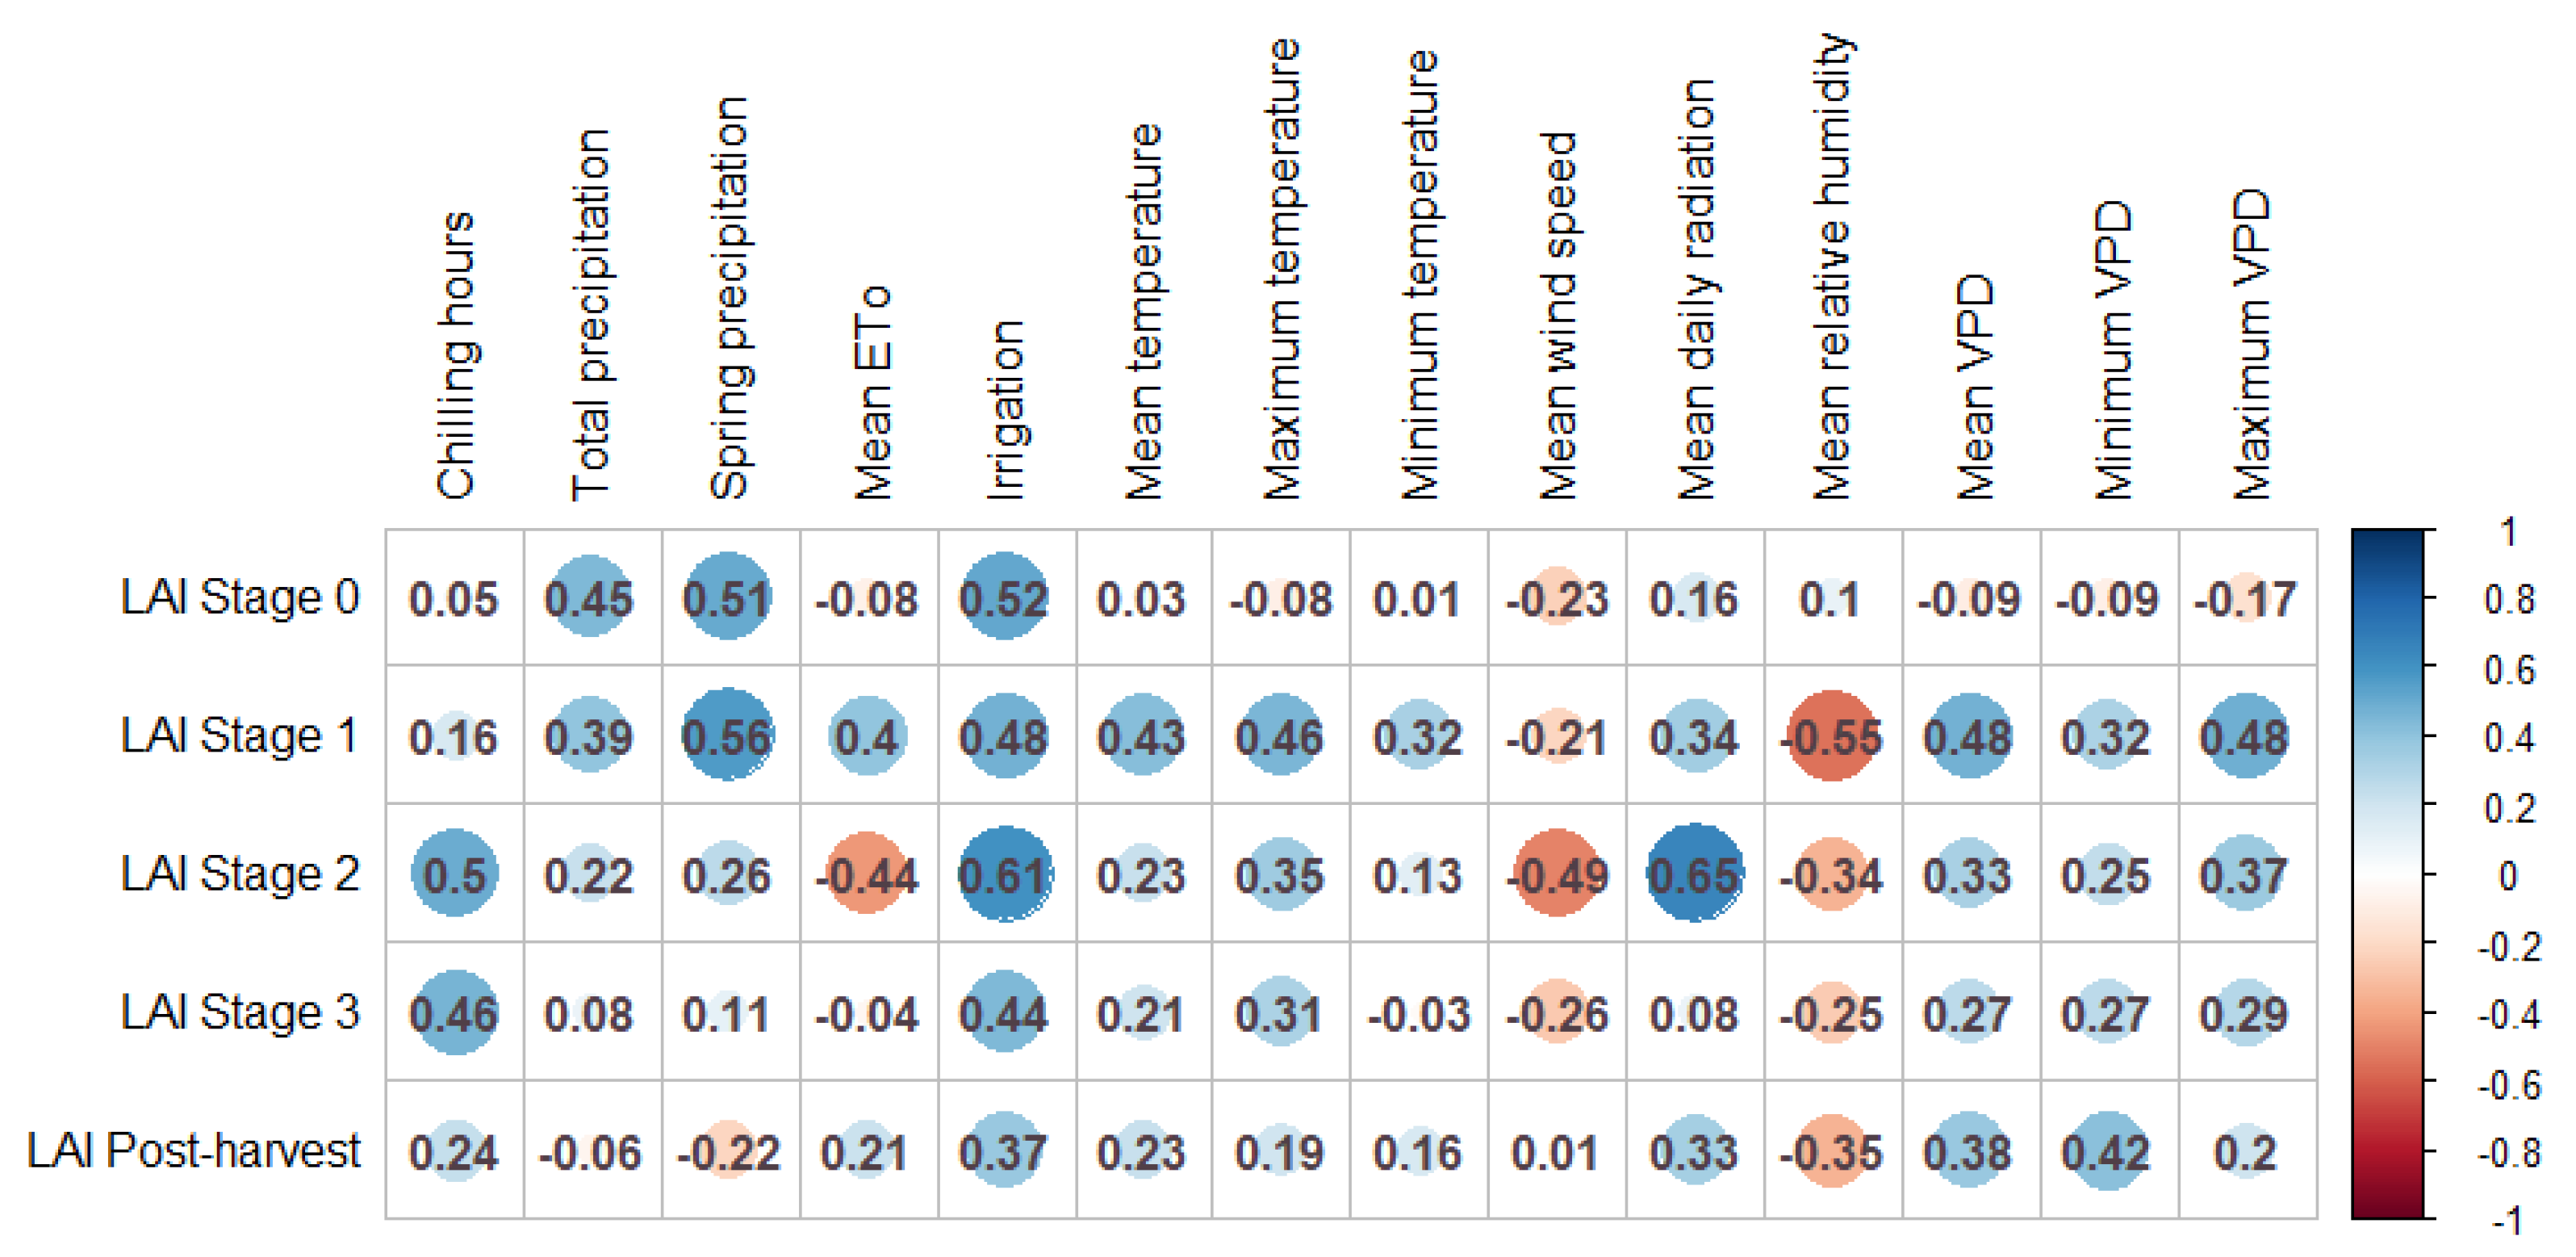
2.4.2. LAI Associations to Environmental and Irrigation Factors

The associations between LAI at different phenological stages and environmental and irrigation factors were quantified using Pearson correlation coefficients (r). Pearson's r can be positive or negative, indicating the direction of the linear relationship. Values closer to 1 or -1 signify a stronger relationship. A correlation matrix was subsequently generated to visualize these relationships. All analyses were performed using R [40], and visualized using "corrplot" package in R [41].

2.4.3. LAI Phenology Effects on Reproductive and Pruning Components

To fulfill specific objective (3) and quantify the degree and pattern of the effects of leaf area on grapevine yield and pruning components, a modeling framework was performed for the different phenological stages. Furthermore, the scope was broadened to investigate the effects of LAI at the previous season (at each phenological stage) on yield and pruning components. These issues were challenged using two approaches:
1.
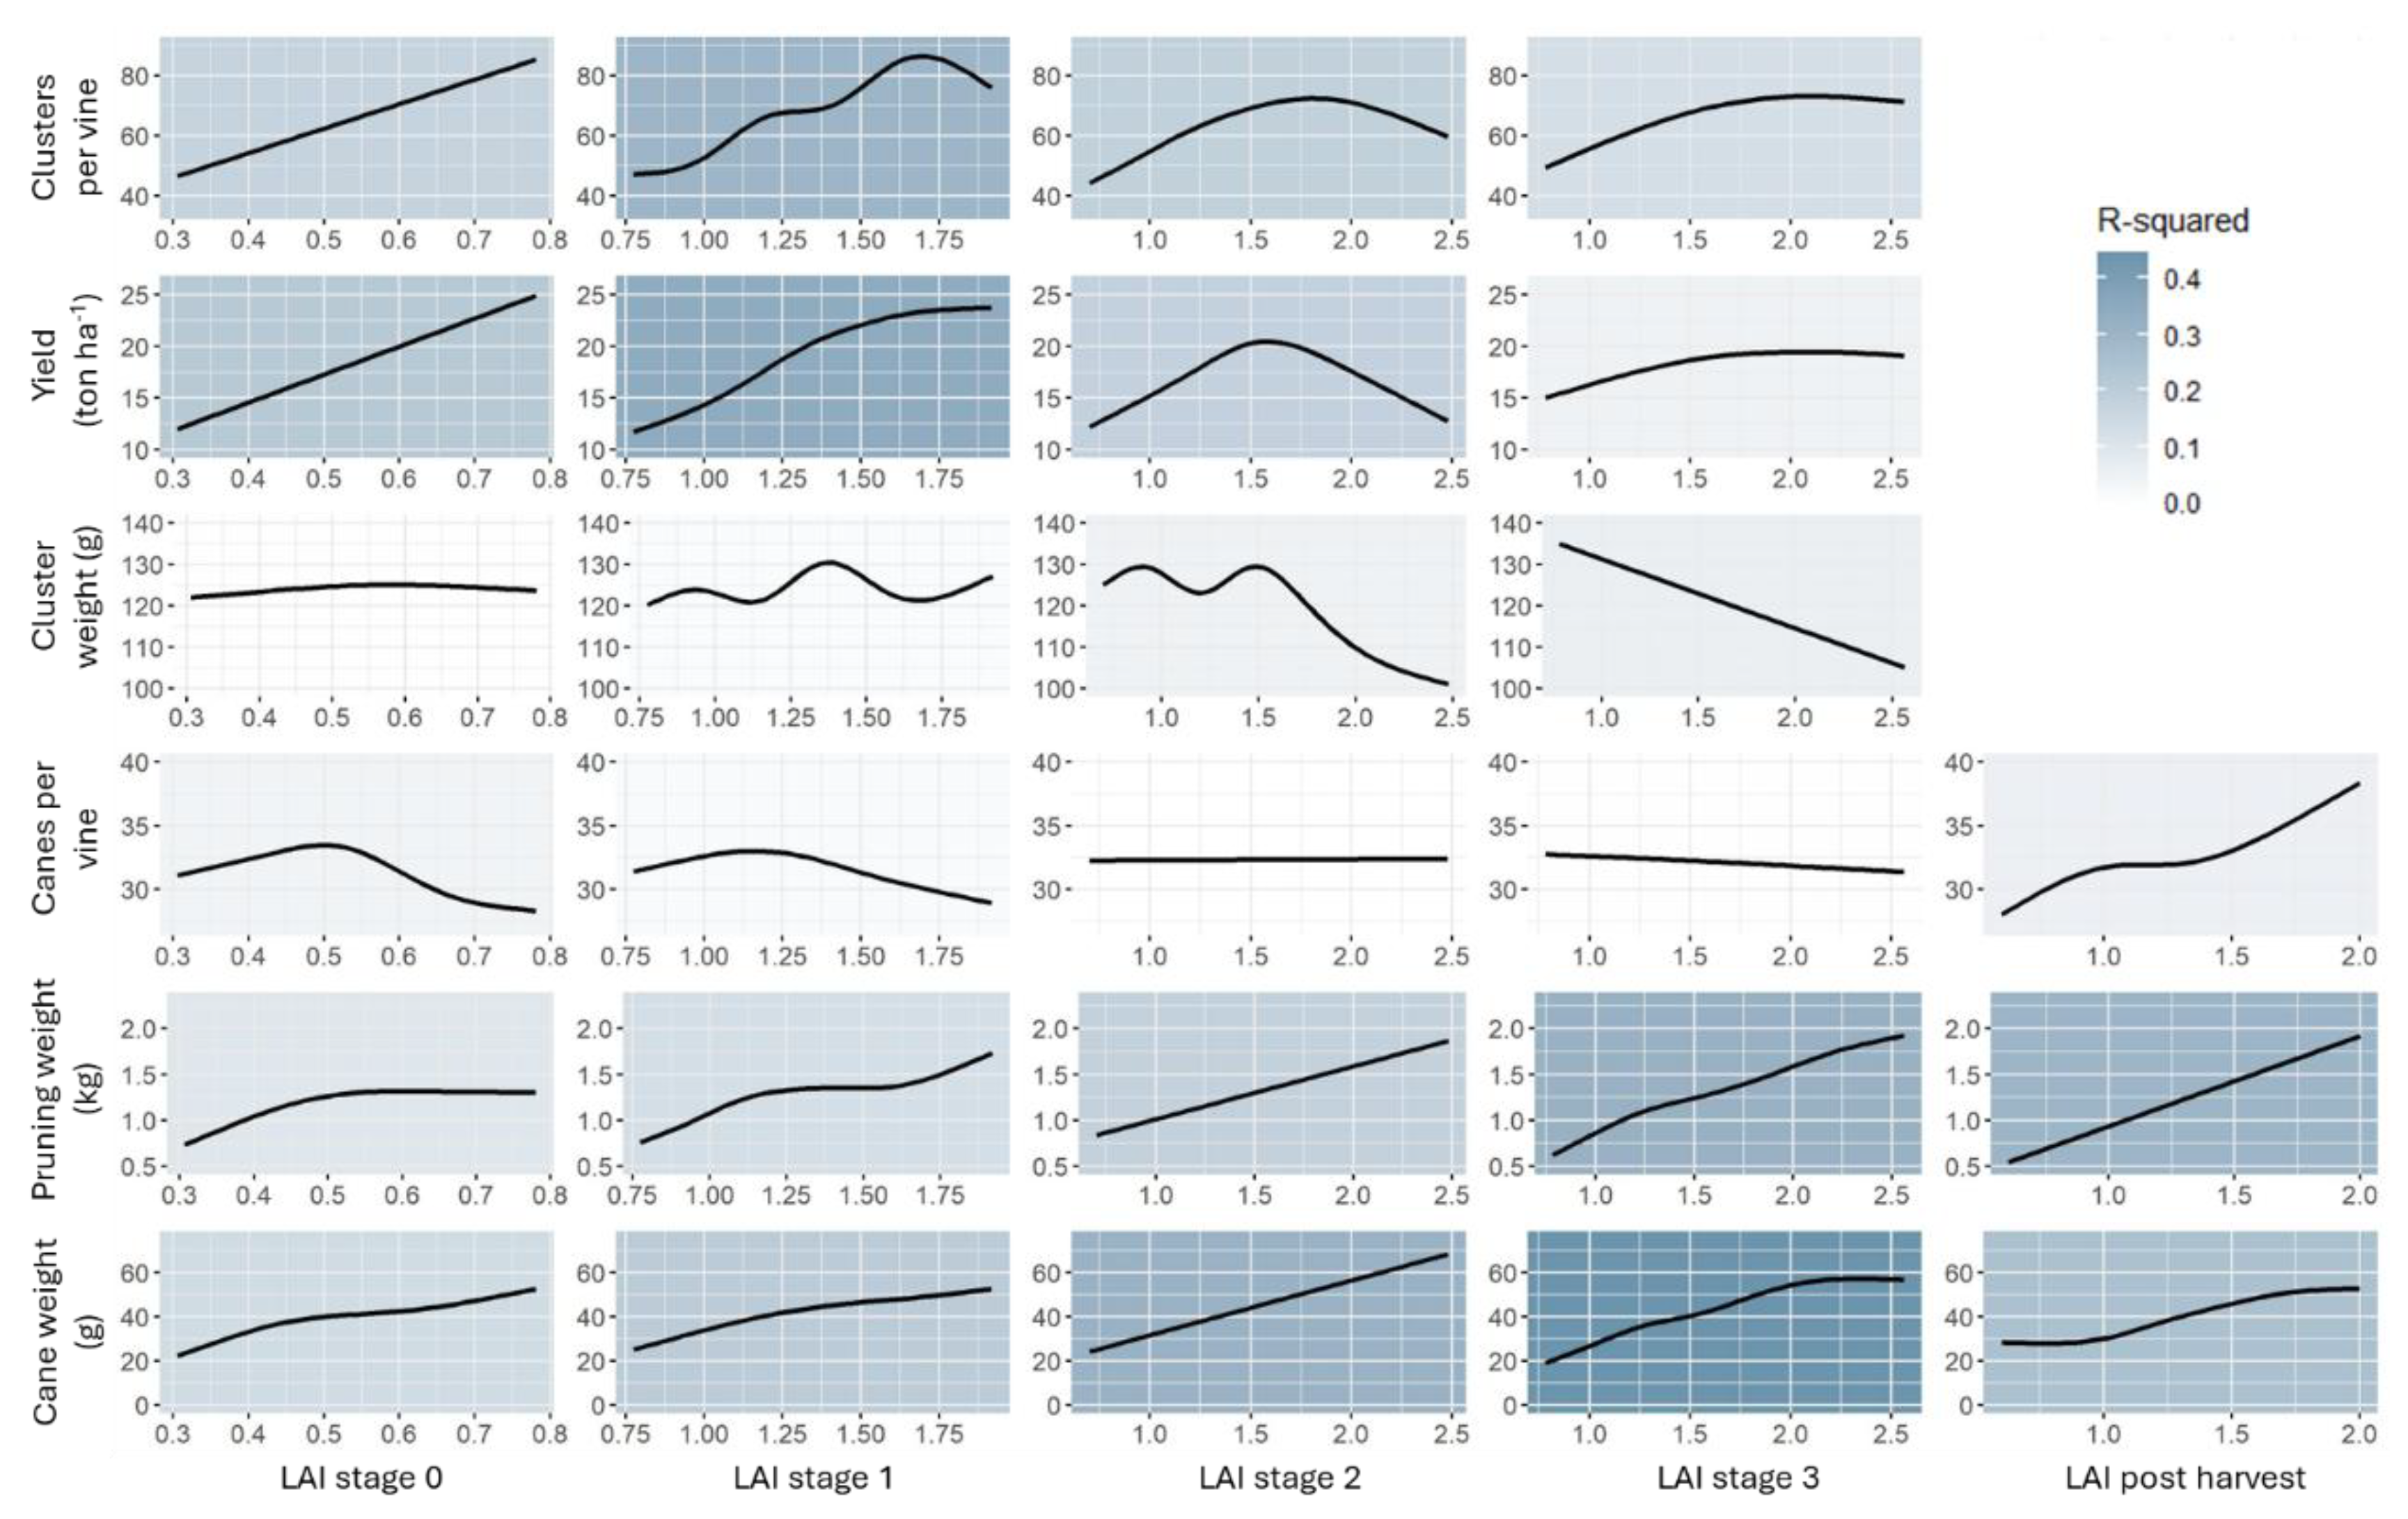
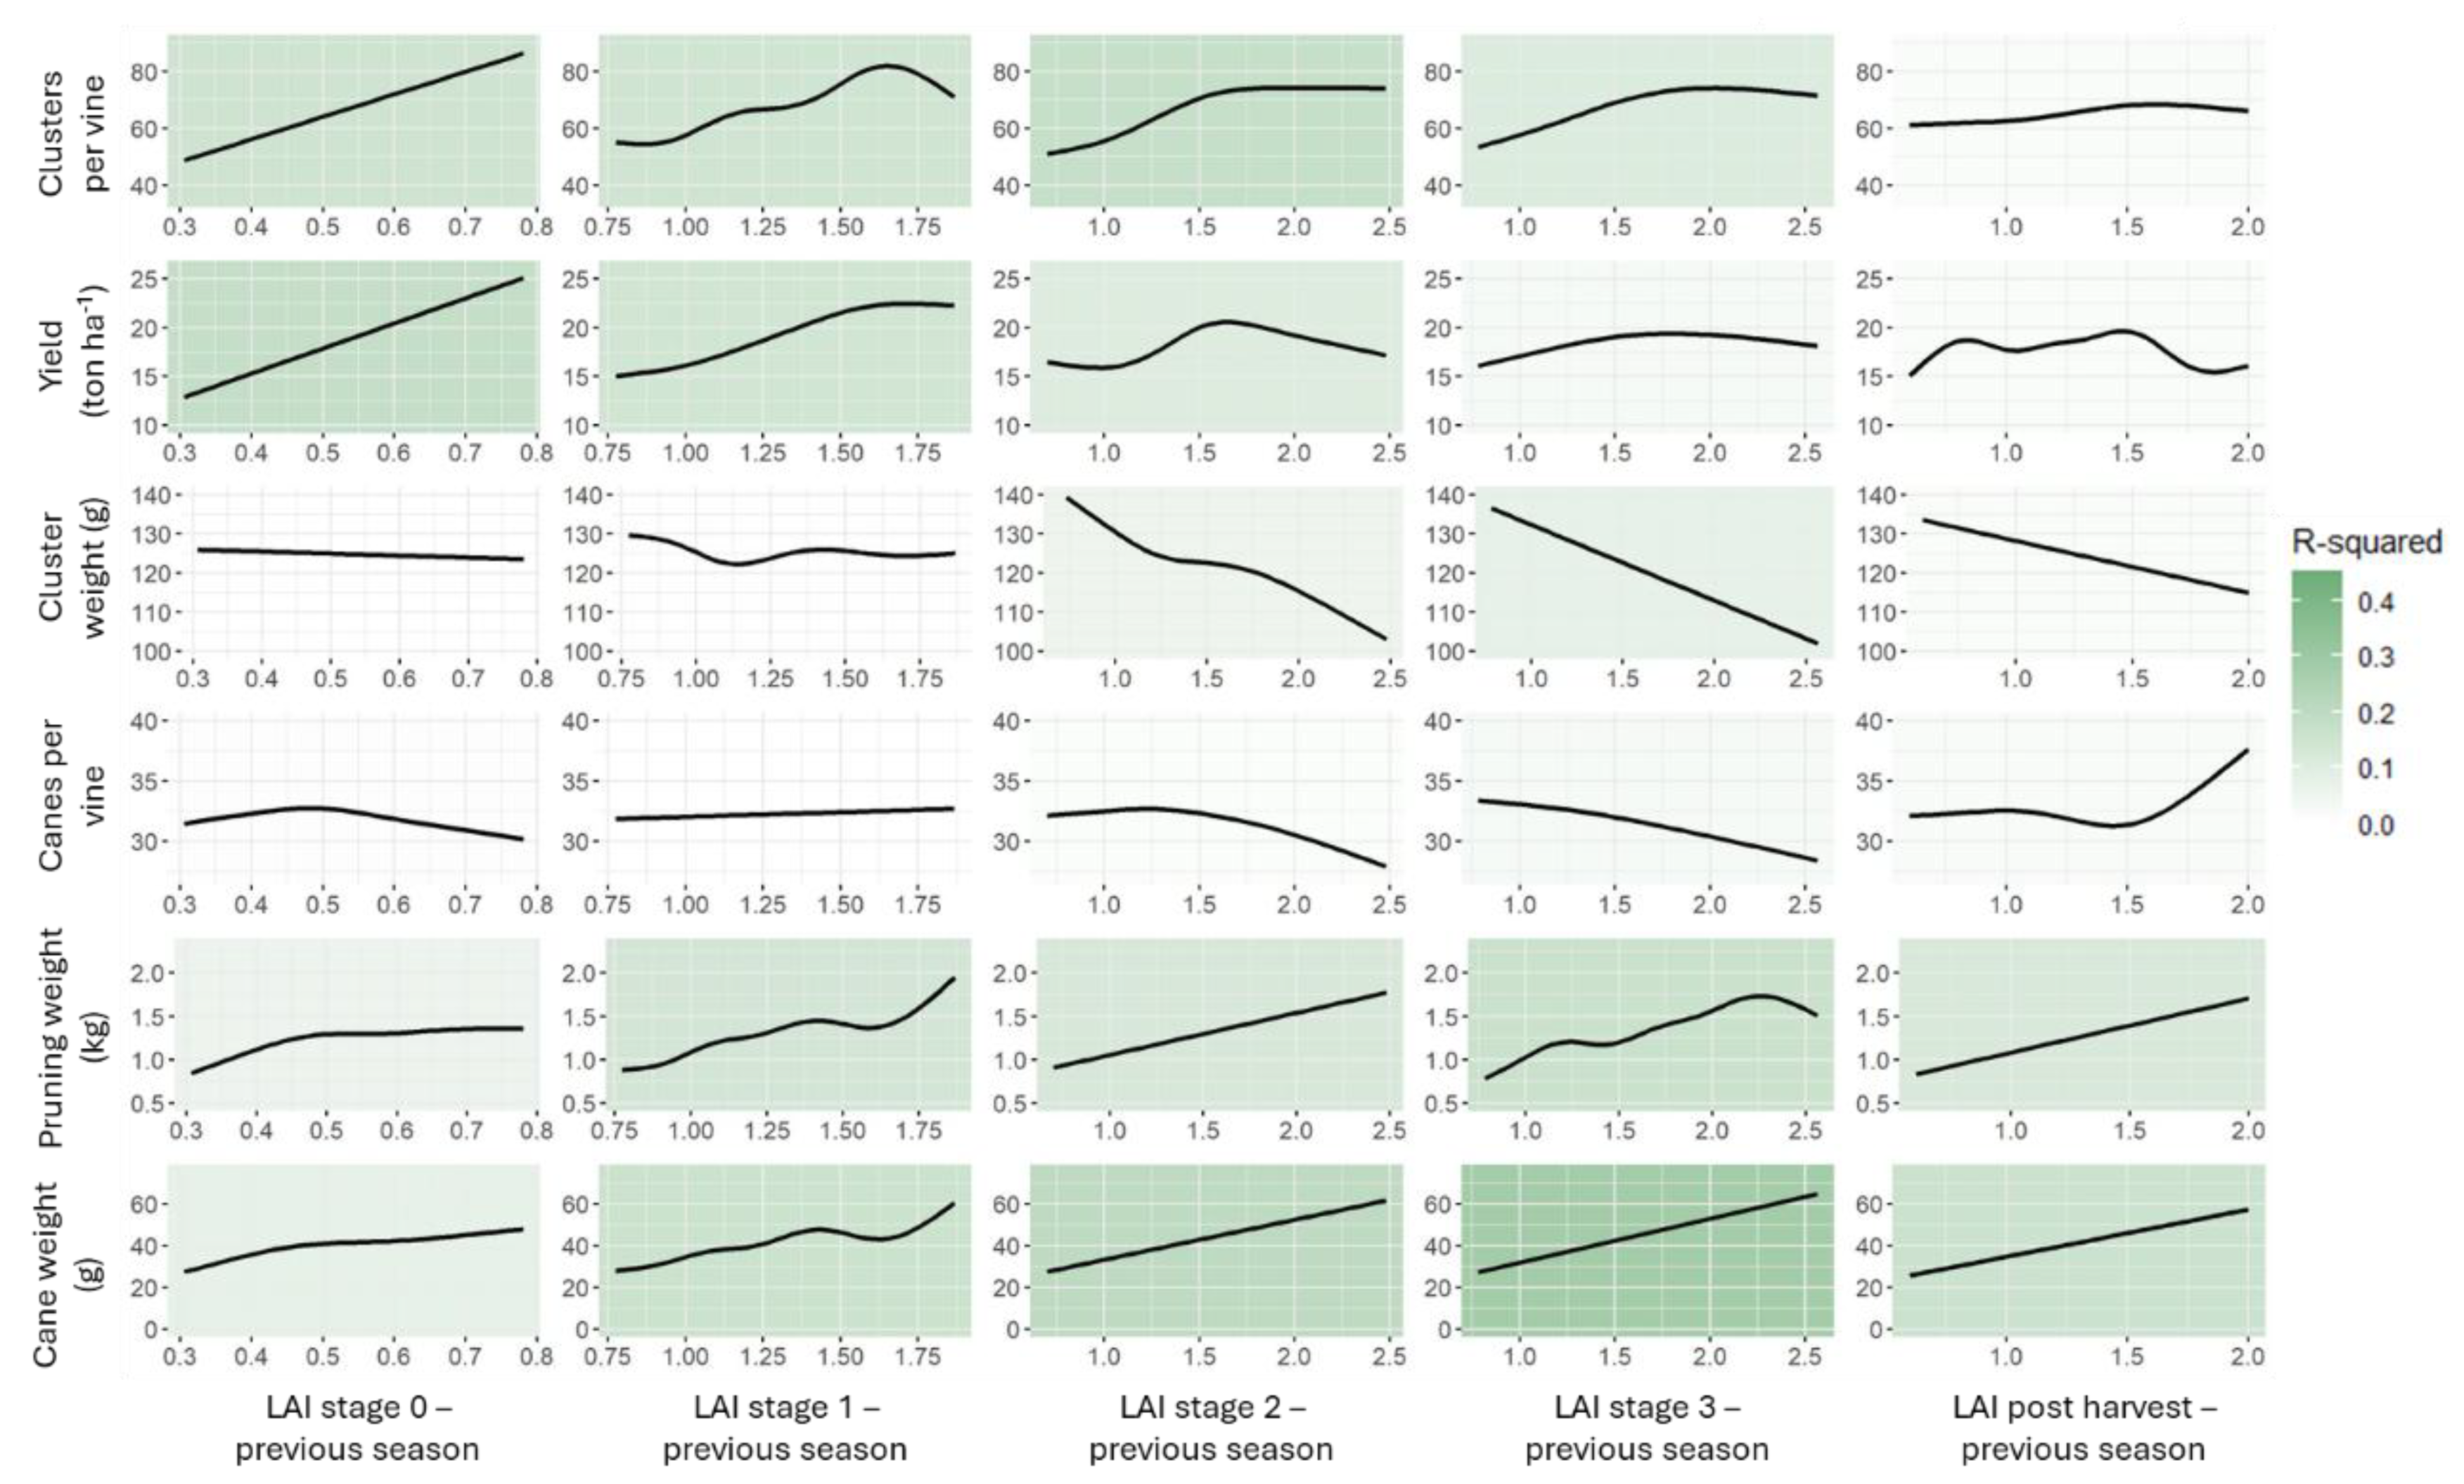
Yield and pruning components were separately analyzed against LAI values at each phenological stage, and against LAI values from the previous season. This analysis was conducted using the generalized additive model (GAM), to enable quantifying the non-linearity of some of the relationships. GAM is an additive model technique where the influence of each covariate is captured by a smooth function [42]. These smooth functions can adapt to both linear and non-linear relationships, providing greater flexibility compared to traditional linear models. The degree of smoothness in the model is controlled by a smoothing parameter, which helps to prevent overfitting by penalizing overly complex models [43]. In this study, the spline function was used for smoothing the covariates, and Gaussian distribution was assumed. All GAM models were applied using 8 knots to avoid overfitting the relationships. The coefficient of determination (R2) was extracted from each model to define the proportion of variance in the response variable explained by the model. In addition, for each model the partial dependent plot was extracted to visualize the patterns of relationship between LAI and each component. GAM models were fitted using the “mgcv” package in R [44], and the partial plots were produced using the “pdp” package [45]. Heatmaps were subsequently produced based on R2 values to enable comparison between the strengths of the different models, while incorporating the partial plots to illustrate the nature of the relationships between LAI and the respective components.
2.
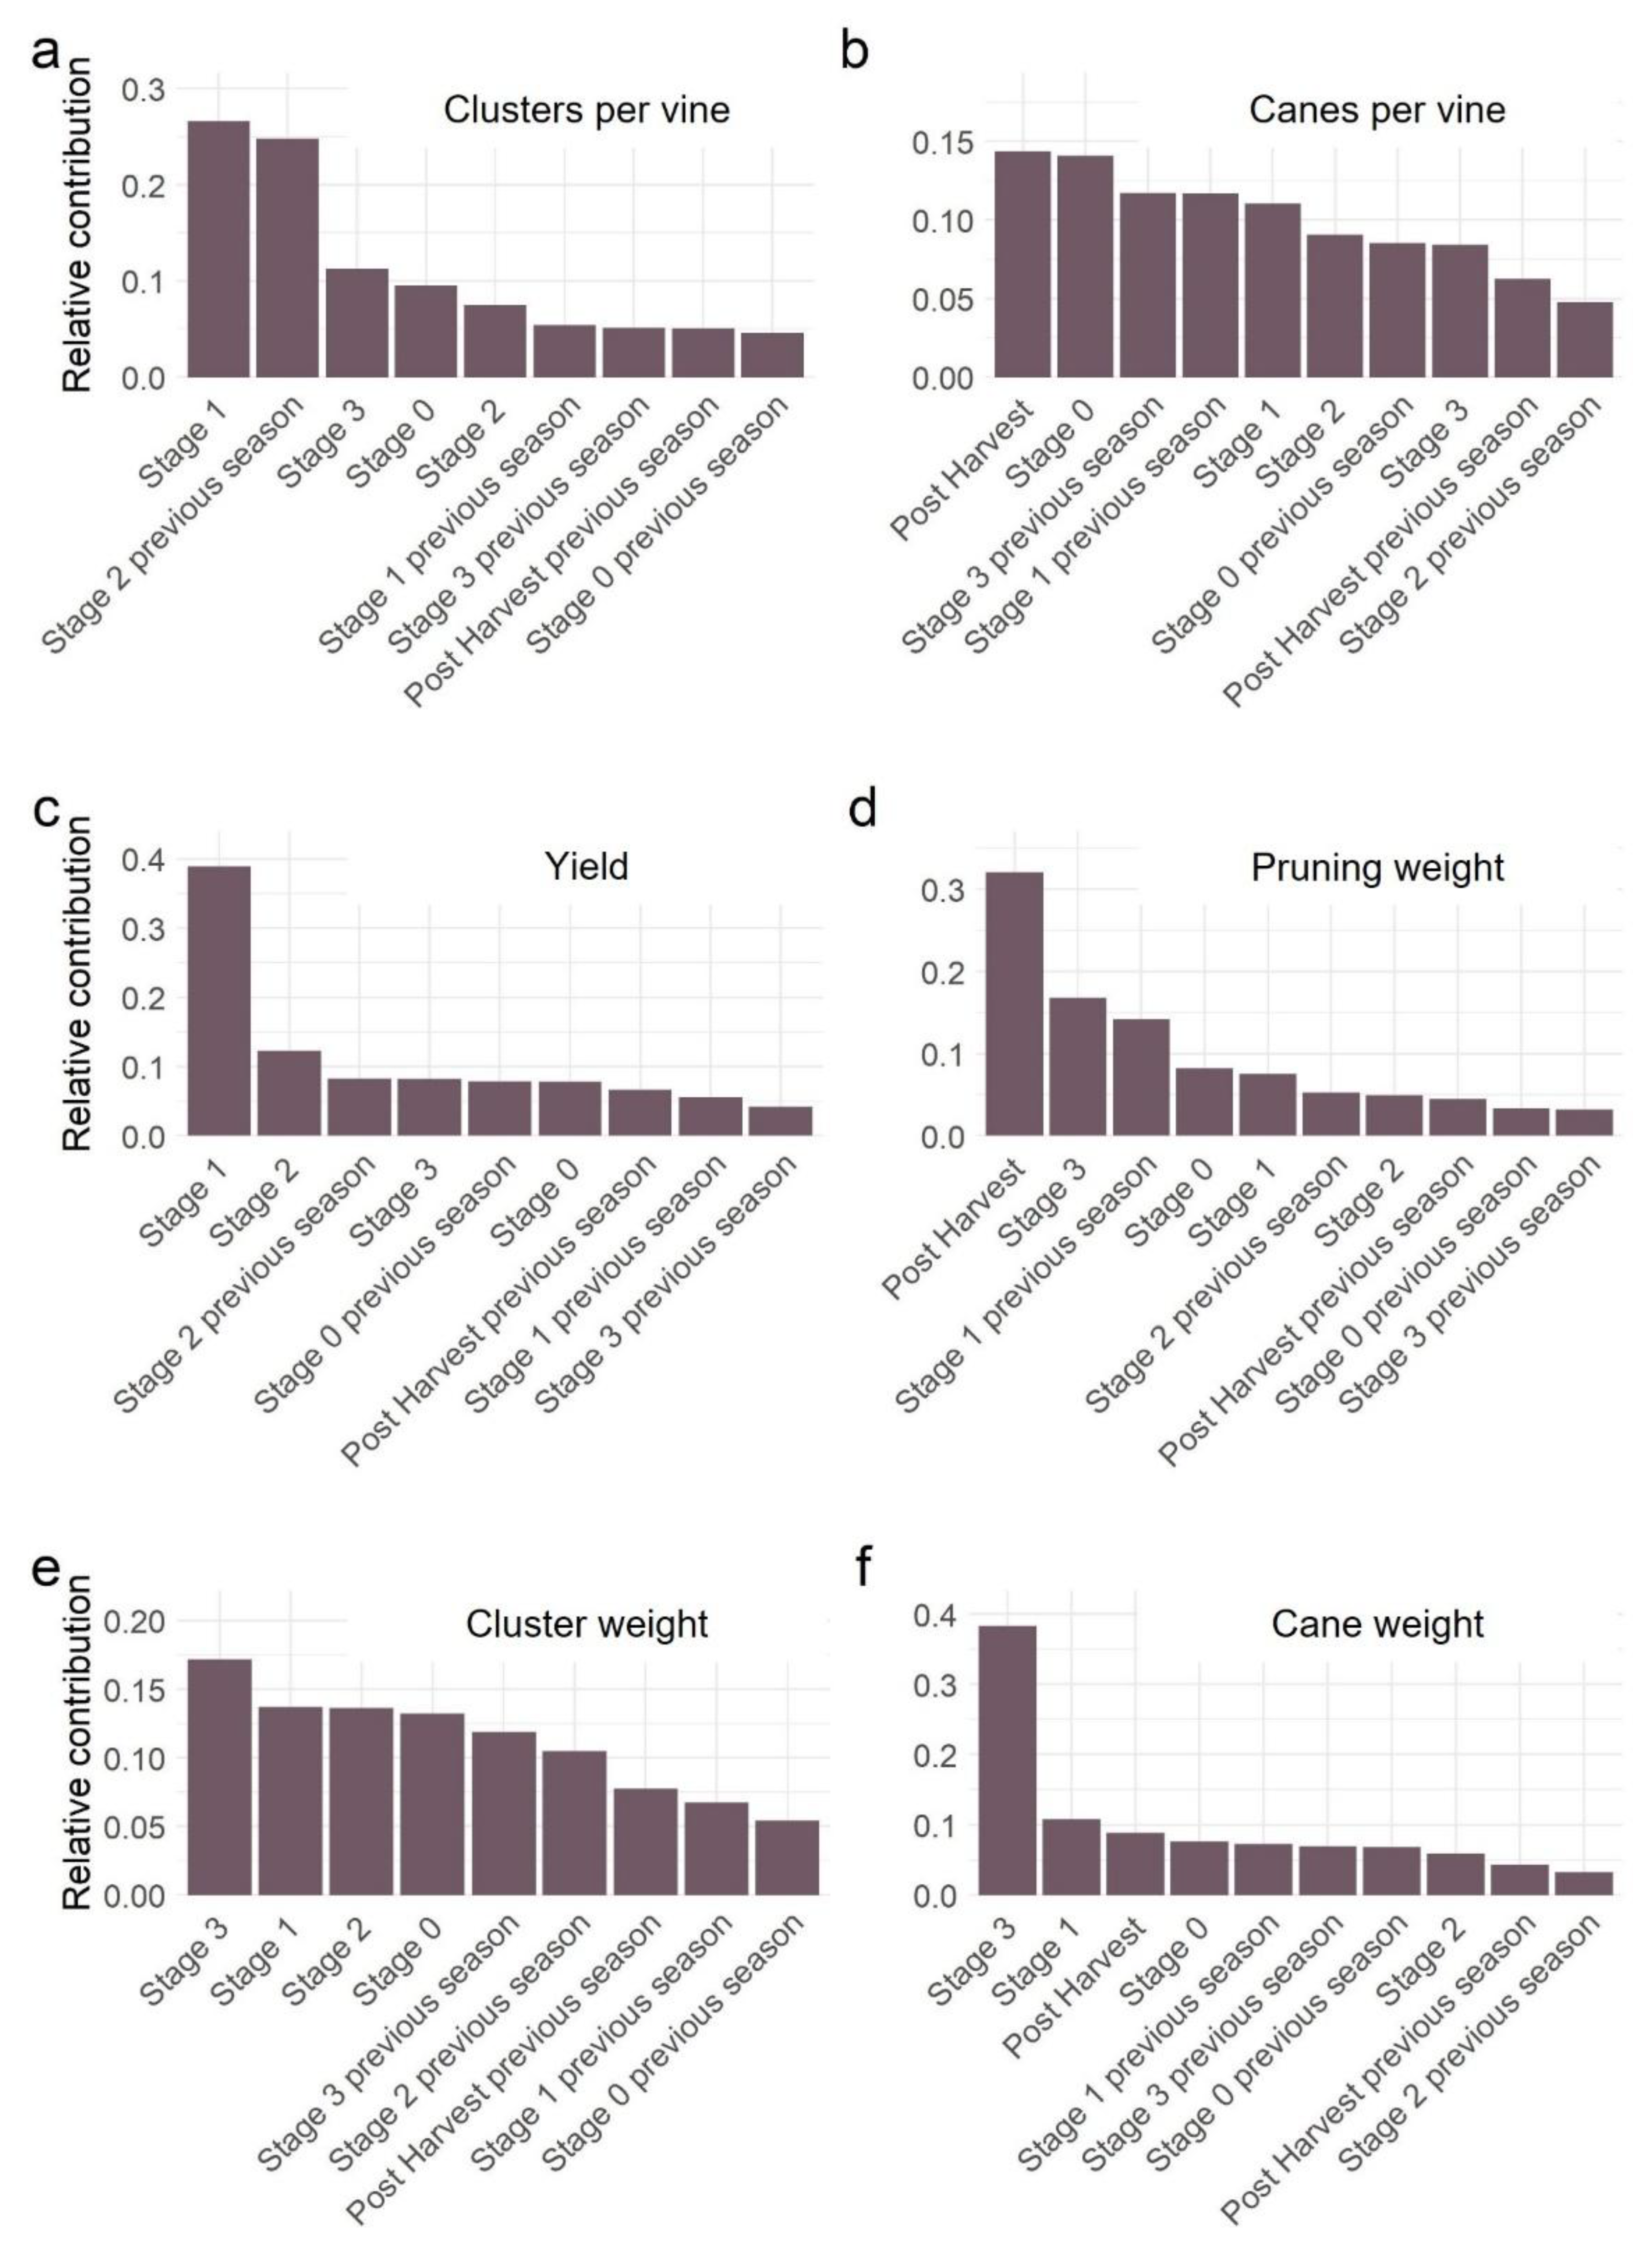
To determine the relative importance of LAI values at different stages (including the current and previous season) on yield and pruning components, we employed the eXtreme Gradient Boosting (XGBoost) algorithm. XGBoost is a powerful ensemble learning method that combines multiple decision trees to create a robust predictive model in an iterative manner, with each subsequent tree focusing on correcting the errors of its predecessors. XGBoost incorporates regularization techniques to prevent overfitting and can effectively handle complex relationships between variables [46]. Given the potential non-linearity and interactions between LAI at different stages and the yield/pruning components, XGBoost was selected for its ability to capture these complex relationships and its strong predictive performance. The objective parameter was set to optimize the regression using a squared error loss function, using a maximum of 100 iterations. Finally, the relative contribution of the features (e.g., LAI at the different stages at current and previous season) were extracted and visualized. The XGBoost algorithm was applied using the “xgboost” package in R [47] and the results were visualized using “ggplot2” [48]. To evaluate model reliability, a validation process was conducted for each yield and pruning component. The dataset was randomly split into training (80%) and testing (20%) subsets. The model was trained on the training set and then used to predict the component values for the test set. Model accuracy was assessed using the following metrics:
-
Pearson correlation (r): Measures the strength and direction of the linear relationship between predicted and observed values. Higher absolute values of 'r' indicate stronger correlations.
-
Paired t-test (t): Evaluates whether the mean predicted values differ significantly from the mean observed values in the test set.
-
Kolmogorov-Smirnov (D): Compares the distribution of predicted values to the distribution of observed values in the test set to assess whether they are statistically different.
-
Mean absolute error (MAE): Measures the average absolute difference between predicted and observed values. MAE was further normalized to the range of the test set to provide the error in percentage. MAE was calculated using the “Metrics” library in R [49].

3. Results

3.1. Irrigation and Leaf Area Variations Among Seasons and Treatments

LAI and irrigation amounts varied significantly among treatments (Table 3) and among seasons (Table 4). The High irrigation treatment resulted in higher LAI values (an average of 1.26 m2m-2), while the Low irrigation treatment had the lowest (averaged at 1.02 m2m-2). This corresponds directly to the amount of irrigation supplied to the SDI treatments. Among the RDI treatments, the High-to-Low treatment had higher LAI values than the Low-to-High treatment, despite receiving significantly lower irrigation amounts (2.42 vs 2.57 mm day-1, which are 355.2 vs 373.5 mm season-1). Although the High irrigation treatment received the highest amounts of water and had the highest vegetation levels, it did not result in the overall highest yield (Yield=18.7 ton ha-1, which is below the yield for the Medium treatment).
A significant increase in LAI was observed between consecutive seasons (Table 4). Similarly, irrigation amounts generally increased across seasons, with the exception of seasons 2017-2018 and 2021-2022, which did not show statistically significant differences in irrigation. There was no consecutive increasing trend for yield, although 2023 had the highest yield (24.8 ton ha-1), and was much higher than yield at the beginning of the experiment (2017 with 13.4 ton ha-1).

3.2. LAI Associations to Environmental and Irrigation Factors

The magnitude and direction of associations between LAI at different stages and environmental and irrigation factors varied considerably. At Stage 0, LAI exhibited the strongest positive correlations with irrigation amounts (r = 0.52), spring precipitation (r = 0.51), and total precipitation (r = 0.45). At Stage 1, LAI showed moderate positive associations with spring precipitation (r=0.56), maximum VPD (r = 0.48), mean VPD (r = 0.48), and irrigation (r = 0.48), while displaying a negative correlation with mean relative humidity (r = -0.55); these were followed by weaker associations to all temperature factors, minimum VPD, mean ETo, and total precipitation (0.32 < r < 0.46). Stage 2 was characterized by strong positive correlations between LAI and irrigation (r = 0.61), radiation (r = 0.65), and chilling hours (r = 0.50), and a negative correlation with wind speed (r = -0.49) as well as mean ETo (r = -0.44). At Stage 3, moderate positive associations were observed between LAI and chilling hours (r = 0.46) and irrigation (r = 0.44). In Post-harvest the strongest correlations were found with minimum VPD (r = 0.42), mean VPD (r = 0.38), and irrigation (r = 0.37).
Some factors exhibited minimal influence on LAI across most stages. Minimum temperature demonstrated a weak association, with the strongest correlation observed at Stage 1 (r = 0.32). Mean wind speed consistently exhibited a negative correlation with LAI, with the strongest effect at Stage 2 (r = -0.49) and weaker correlations at other stages (r < -0.26), while mean relative humidity was also negatively correlated. In contrast, chilling hours, total precipitation, irrigation, temperature, and VPD (except at Stage 0) consistently demonstrated positive associations with LAI.

3.3. LAI Phenology Effects on Reproductive and Pruning Components

The multimodeling approach facilitated the comparison of the magnitudes, directions, and patterns of the effects of LAI at different stages on yield and pruning components (Figure 3) and did the same for analyzing the effects of LAI of the current season on the components of the following season (Figure 4). The heatmap in Figure 3 reveals that the strongest effects were found for LAI at Stage 3 on cane weight (R2=0.43), and for LAI at Stage 1 on clusters per vine and yield (R2=0.33). Notably, R² values were nearly zero between LAI at all stages and cluster weight and canes per vine. Yield and clusters per vine were similarly responsive to LAI at each of the different stages, as well as pruning weight and cane weight. The following sections detail the specific patterns of these relationships.
Yield components: The highest response of yield components to LAI was during Stage 1, with weaker effects observed as the seasons progressed. In Stage 0, LAI exhibited a positive linear effect on yield components. During Stage 1, LAI positively influenced clusters per vine up to an LAI of 1.7, beyond which the effect became negative. Similarly, yield showed a positive relationship with LAI, with a breakpoint at LAI = 1.5, after which the relationship became more moderate. During Stage 2, LAI showed an optimum point for both clusters per vine (LAI=1.8) and yield (LAI=1.6), above and below which the number of clusters/yield values decreased. At Stage 3, weaker effects on cluster per vine and yield were observed, with a predominantly linear relationship at lower LAI values. No significant effect was observed on these components when LAI exceeded 1.6 and 1.7, respectively.
Pruning components: The response of the pruning components to LAI strengthened towards Stage 3, where the relationships were highest for cane weight, and stayed the same during Post-harvest for pruning weight. During Stage 0, a saturated effect was observed, with linear increases in pruning weight and cane weight up to LAI values of 0.5 and 0.42, respectively, followed by a plateau. During Stages 1 and 2, the effects were positive and linear for both components. In Stage 3 a linear relationship was observed between LAI and pruning weight, while a saturated pattern was observed for cane weight, with a breakpoint at LAI = 2. LAI at Post-harvest exhibited a linear effect on pruning weight, while an S-shaped relationship was observed for cane weight, with some influence only below an LAI of 1.6.
Figure 4 illustrates the effects of the previous season LAI at different stages on yield and pruning components. Overall, the strength of these relationships was weaker compared to those observed for the current season LAI. The strongest effects were observed for cane weight in response to LAI at previous season Stages 2 and 3 (R² = 0.20 and 0.28, respectively), and for yield in response to LAI at previous season Stage 0 (R² = 0.18). As with current season LAI, near-zero relationships were observed between LAI at all previous season stages and cluster weight and canes per vine. Specific patterns of effects are detailed hereinafter.
Yield components: During the previous season Stage 0, linear relationships were observed between LAI and both clusters per vine and yield. During the previous season Stage 1, clusters per vine exhibited an optimal response at LAI = 1.7, with a decline in cluster number beyond this point. Yield demonstrated an S-shaped relationship with an inflection point at LAI = 1.6. Clusters per vine at the previous season Stage 2 showed a saturated response, plateauing at LAI = 1.67, while yield decreased after an optimal LAI of 1.6. Previous season Stage 3 LAI had a weak effect on clusters per vine and yield, with breakpoints at LAI of 1.8 and 1.65, respectively. Negligible effects of LAI on yield components were found during the previous season Post-harvest.
Pruning components: During the previous season Stage 0, negligible relationships were observed between LAI and pruning components. In the previous season Stage 1, positive linear relationships were observed for both pruning weight and cane weight, becoming more pronounced at LAI values of 1.74 and 1.77, respectively. Cane weight showed a positive, linear response to LAI at previous season Stages 2, 3, and Post-harvest. Pruning weight had a linear response to LAI at the previous season Stage 3 and at Post-harvest. During the previous season Stage 3, there was an optimum LAI value at 2.2, with decreasing pruning weight value beyond this point.
Six multivariate models were developed, one for each of the yield and pruning components. These models incorporated LAI values from all phenological stages for the current and previous seasons. As shown in Table 5, all models resulted in a normalized MAE below 18.5%. However, the correlation coefficients for the cluster weight and canes per vine models were weak. Furthermore, the predicted values for cluster weight showed significant differences in distribution compared to the measured values, as indicated by a significant Kolmogorov-Smirnov test (D = 0.24, p < 0.05). Despite these findings, all models produced mean estimations that were not significantly different from the mean measured values (insignificant t-statistics).
The relative contributions of LAI at different stages across all XGBoost models highlighted the greater influence of current season LAI compared to previous season LAI (Figure 5). However, notable exceptions were observed. For instance, in the clusters per vine model (Figure 5a), LAI at Stage 1 and LAI at previous season Stage 2 exhibited similar levels of importance. Yield was most strongly influenced by LAI at Stage 1, followed by Stage 2 (Figure 5c). In the cluster weight model (Figure 5e), LAI at Stage 3 exhibited the highest influence, followed closely by Stages 1, 2, and 0.
The models for the pruning components demonstrated a greater influence of LAI during the later stages of the current season. For canes per vine, LAI at Post-harvest and Stage 0 exhibited the highest contributions (Figure 5b). In the pruning weight model, LAI at Post-harvest and Stage 3 were the most influential factors (Figure 5d). Finally, the cane weight model exhibited a substantially higher influence of LAI at Stage 3, followed by LAI at Stage 1.

4. Discussion

Grapevine canopy cover is highly responsive to water availability [6,50,51], since high water availability to the plant improves turgor pressure and promotes cell divisions in mitosis, which enhances vegetative growth. Spatial and temporal variations in water availability within a vineyard can be attributed to topographic heterogeneity [19,29], inter-seasonal variability in precipitation [52,53], and irrigation management practices [30]. This study demonstrates a significant impact of irrigation treatments on LAI (Table 3). Furthermore, a long-term increase in LAI was observed throughout the experimental period, irrespective of the meteorological conditions in each growing season. Yield, however, did not follow this trend across seasons, and did not correspond directly to the irrigation amounts. Grapevines exhibit adaptive responses to varying levels of water stress. For instance, extreme water stress in previous seasons can have long-term consequences for vine physiology and subsequent vegetative growth [e.g., 54,55]. This feedback is attributed to the influence of water availability on vine hydraulic properties [32,56]. Leaf morpho-anatomical traits, while influenced by current season conditions, are also shaped by the preceding season [57,58]. This adaptive mechanism is typical to certain varieties, with some exhibiting greater drought tolerance due to inherent anatomical differences [56]. And indeed, ‘Sauvignon Blanc’ is classified as a vigorous variety with low water use efficiency [59]. The observed increase in canopy vigor across seasons led to a corresponding increase in irrigation demands. Since irrigation amounts were calculated based on crop evapotranspiration (ETc), and higher leaf area translates to increased transpiration rates, a general upward trend in irrigation was observed (2 mm day-1 in 2017, 3.36 mm day-1 in 2023). This strong influence of irrigation on LAI and the presence of feedback mechanisms are evident in Figure 2, where irrigation emerges as the only factor consistently positively correlated (r > 0.3) with LAI across all phenological stages. Irrigation exhibited the strongest association with LAI at Stage 0, alongside spring precipitation, which was also the most influential factor at Stage 1. These findings corroborate previous studies highlighting the critical role of water availability in driving vegetative growth, particularly during early stages of the growing season, in water-limited environments [6,26].
Temperature, and consequently maximum and mean VPD (derived from temperature and relative humidity), exhibited a positive correlation with LAI during the initial stages of the season, followed by a decline in this association. Similarly, ETo showed a positive correlation with LAI at Stage 1 but exhibited a negative association at Stage 2. These findings align with previous research demonstrating that while higher temperatures can initially stimulate vegetative growth, they can become limiting factors as the season progresses and temperatures rise [23,60]. In contrast, chilling hours showed the strongest association with LAI during Stages 2 and 3. Sufficient winter chilling is crucial for uniform bud opening in grapevines [61], suggesting that the impact of balanced vegetative progression during the growing season will be strongest after the vegetative growth period. Wind speed consistently exhibited a negative correlation with LAI, with the strongest association observed at Stage 2 (r = -0.49). Plants exposed to higher wind speeds tend to exhibit reduced growth, resulting in smaller and more compact plants with smaller leaves [62]. This phenomenon, known as thigmomorphogenesis, describes the alterations in plant development in response to mechanical stimuli [63]. The impact of wind on LAI is likely cumulative, with the strongest effects observed later in the season as plants experience prolonged exposure to higher wind speeds, leading to a reduction in peak LAI values. Mean daily radiation exhibited the strongest association with LAI at Stage 2 (r = 0.65). Previous studies have demonstrated that higher solar radiation levels induce the development of thicker leaves with increased leaf mass per area, as radiation is a key determinant of leaf physiological characteristics [64]. The highest correlation between minimum VPD and LAI was found during Post-harvest. This finding may be circumstantial: the last three years of the experiment were characterized by the highest minimum VPD values, while also exhibiting higher LAI values due to excessive irrigation.
The effects of LAI at each phenological stage (during current and previous seasons) on yield and pruning components were assessed using univariate models. All R2 values were low (R2 < 0.44), suggesting that directly assessing yield and pruning based solely on LAI at specific stages is challenging. While vegetative vigor, as reflected by LAI, is crucial for yield and pruning [11,65,66], a multivariate approach, incorporating multiple factors like meteorology and vineyard history, is likely necessary for accurate yield/pruning estimation. Figure 3 illustrates the distinction between stages where LAI significantly influenced yield versus pruning components. Stage 1 exhibited the strongest associations with clusters per vine (R² = 0.29) and yield (R² = 0.34), aligning with previous research that showed the strong effect of higher pre-veraison irrigation amounts (with LAI serving as proxy) on yield at harvest [54,66,67]. Yield and clusters per vine were linearly affected by LAI until flowering, but from Stage 1 onward, yield and clusters per vine responded negatively above certain LAI thresholds. This trend is most likely due to competition for resources between vegetative and reproductive traits. Excessive canopy cover reduces light interception due to over-shading, hindering optimal photosynthesis [68] and limiting carbohydrate supply required for floral development [69], thereby preventing continuous increase in yield and/or number of clusters. In this current study, yield and number of clusters peaked at certain optima due to competing sinks. However, implementing various canopy management techniques may improve the response of yield to higher irrigation amounts, while mitigating vegetative competition [13].
Conversely to the yield components, pruning components were most affected by LAI during Stage 3. Post-veraison shoot maturation and subsequently thickening of the canes led to a stronger predictive force of late-season LAI on pruning components [70,71]. LAI during most of the growing season (Stages 1-Post-harvest) exhibited a positive, linear relationship with pruning weight and cane weight. However, during Stage 3, no further increase in cane weight was observed beyond an LAI of 2. Relationships between LAI and the number of canes per vine was negligible in all stages, emphasizing that higher irrigation levels (often reflected by higher LAI values) resulted in longer and heavier canes rather than increase in cane number. These findings correspond with other studies that reported an effect of higher irrigation levels on shoot length and mass in ‘Cabernet Sauvignon’ [72], ‘Tempranillo’ [73], ‘Merlot’ [50], as well as previous results from this experiment [29], while generally not affecting the number of shoots per vine [6].
The quantified effects of the previous season’s LAI on the yield and pruning components (Figure 4) all showed weak relationships (R2 < 0.29). LAI at later stages in previous season exhibited a stronger influence on the current season's pruning weight and cane weight, suggesting a cumulative, inter-seasonal effect. Pre-veraison LAI of the previous season demonstrated a stronger influence on the current season's yield and clusters per vine, aligning with findings from numerous studies. As detailed by Monteiro et al. (2021) [74], grapevine reproductive development spans two growing seasons. Bud fruitfulness, determined by the differentiation of anlagen in inflorescences during the initial vegetative cycle, sets the foundation for the subsequent season's yield potential by defining the number of clusters that will develop. While the yield potential is established in the previous season, its realization in the current season depends on the presence of optimal conditions. Suboptimal conditions, such as environmental stress [75], pests and diseases [76], canopy shading, and certain viticultural practices [77,78], can lead to bud necrosis and consequently a lower number of clusters [79]. Some varieties are more sensitive than others [77]. Furthermore, our results suggest that excessively high pre-veraison LAI (above 1.7 m² m⁻²) in the previous season may negatively impact cluster number in the subsequent season. This is likely attributed to increased canopy shading, which reduces light interception and consequently limits photosynthetic activity [68] and increases vegetative-reproduction competition.
The final approach synthesized LAI values from both the previous and current seasons across different phenological stages to assess their relative contributions to yield and pruning components. XGBoost models were employed for this analysis, demonstrating acceptable performance (normalized Mean Absolute Error (MAE) ranging from 13.8% to 18.5%, with no significant differences between model predictions and test set observations, Table 5). The number of clusters per vine was significantly influenced by both pre-veraison LAI in the previous season and current season. This aligns with the understanding that bud differentiation during the previous season establishes the yield potential, while conditions during the early stages of the current season impact bud necrosis. For similar reasons, LAI in Stage 1 of the current season emerged as a strong predictor of yield, highlighting the importance of vegetative conditions during the flowering period for overall yield. Cluster weight was found to be most affected by LAI during current season (summing to 58% of contributing factors). The most influential factor was LAI during veraison, which implicates that higher post-veraison irrigation levels will increase vegetation as well as the cluster weight. These findings support previous research in ‘Cabernet Sauvignon’ [80] and ‘Shiraz’ [81] that demonstrated an increase in cluster weight with higher post-veraison irrigation levels. Cane weight and pruning weight were both highly responsive to LAI at the end of the current growing season. These findings corroborate previous studies that have linked post-veraison vegetative growth to increased pruning weight [65,82].
This study demonstrated that increased irrigation does not always translate to a proportional increase in yield (Table 3, Table 4). In this experiment, high irrigation levels led to increased vegetative growth, which in turn increased water demand, creating a positive feedback loop that resulted in higher crop evapotranspiration (ETc) and further increased irrigation requirements. However, this feedback loop did not linearly translate to higher yields. As leaf area increased, diminishing returns were observed, with excessive vegetative growth ultimately negatively impacting yield. While this study did not incorporate extra canopy management practices, it highlights the importance of balanced vegetative growth for optimizing yield. In practical vineyard management, strategies such as hedging, topping, leaf removal, shoot positioning, and pruning should be considered to manage vegetative growth and maximize yield while minimizing water consumption.

5. Conclusions

This study highlights the complex relationship between irrigation management, environmental conditions, LAI, and grapevine performance in water-limited environments. Irrigation positively influenced LAI across all phenological stages, with positive feedback observed as increased vegetative growth led to higher water demands. However, this increased vegetative vigor did not correspond linearly to yield improvements, emphasizing the complex trade-offs between vegetative and reproductive growth. While irrigation drives vegetative growth, this study demonstrates the necessity to mitigate the adverse effects of excessive vigor. By optimizing the balance between vegetative and reproductive growth, vineyard managers can enhance yield while minimizing water use.
Early-season LAI was found to have a high impact on the development of number of clusters and overall yield, with diminishing returns observed when LAI exceeded optimal thresholds. Excessive canopy growth, likely driven by higher irrigation levels, resulted in resource competition, thereby limiting yield potential. Conversely, late-season LAI was most predictive of pruning components, reflecting the importance of post-veraison vegetative growth for structural development. The study highlights the cumulative, inter-seasonal impact of LAI on grapevine productivity. Pre-veraison LAI from the previous season influenced bud fruitfulness and cluster number in the current season, aligning with the understanding that yield potential is set during the preceding growing cycle. Excessively high LAI during the pre-veraison stage negatively affected cluster development, further supporting the need for balanced canopy management.
The findings provide valuable insights into the adaptive responses of grapevines to water availability and additional environmental conditions. In the current era of climate shifts and instability, there is significant importance in developing and applying tailored irrigation and canopy management strategies to achieve sustainable viticultural practices in water-scarce regions.
While this current study focused on one long-term experiment in ‘Sauvignon Blanc’, other varieties may reveal different sensitivity levels to LAI and their affecting factors, thereby underscoring the need to further explore these mechanisms in different settings, irrigation regimes, and varieties. Future studies should also explore finer-scale interactions between irrigation, climate variability, and genetic factors to refine predictive models and improve adaptive viticulture practices.

Author Contributions

Conceptualization, N.O.L and Y.N.; methodology, N.O.L and Y.N.; software, N.O.L.; validation, N.O.L.; formal analysis, N.O.L.; investigation, N.O.L and Y.N.; resources,Y.N.; data curation, Y.N.; writing—original draft preparation, N.O.L.; writing—review and editing, N.O.L and Y.N.; visualization, N.O.L.; supervision, Y.N.; project administration, Y.N.; funding acquisition, Y.N. All authors have read and agreed to the published version of the manuscript.

Funding

Please add: This research was funded by the Ministry of Agriculture and Rural Development, grant number 31-01-0010 and SupPlant LTD (during the 2021-2022 growing seasons). additional funding was provided by the Estates and Trusts Department, Ministry of Justice, during 2021.

Acknowledgments

The authors would like to express their sincere gratitude to Danielle Ferman-Mintz and Nave Hajaj for their dedicated fieldwork throughout the experiment. We also extend our thanks to Yossi Shtern, Ido Walk, and Shilat Saadon for their valuable contributions to data collection. We wish to express our deepest appreciation to Moshe Hernik, the vineyard owner and vine grower at Kibbutz Merav, for his unwavering dedication, continuous collaboration, and endless patience throughout the fieldwork.

Conflicts of Interest

The authors declare no conflicts of interest.

Abbreviations

The following abbreviations are used in this manuscript:
ETo Reference evapotranspiration
ETc Crop evapotranspiration
LAI Leaf area index
VPD Vapor pressure deficit
MAE Mean absolute error

References

  1. Watson, D.J. Comparative Physiological Studies on the Growth of Field Crops: I. Variation in Net Assimilation Rate and Leaf Area between Species and Varieties, and within and between Years. Ann. Bot. 1947, 11, 41–76. [CrossRef]
  2. White, W.A.; Alsina, M.M.; Nieto, H.; McKee, L.G.; Gao, F.; Kustas, W.P. Determining a robust indirect measurement of leaf area index in California vineyards for validating remote sensing-based retrievals. Irrig. Sci. 2018, 37, 269–280. [CrossRef]
  3. Sun, L.; Gao, F.; Anderson, M.; Kustas, W.; Alsina, M.; Sanchez, L.; Sams, B.; McKee, L.; Dulaney, W.; White, W.; et al. Daily Mapping of 30 m LAI and NDVI for Grape Yield Prediction in California Vineyards. Remote Sens. 2017, 9, 317. [CrossRef]
  4. Ohana-Levi, N.; Gao, F.; Knipper, K.; Kustas, W.P.; Anderson, M.C.; del Mar Alsina, M.; Sanchez, L.A.; Karnieli, A. Time-series clustering of remote sensing retrievals for defining management zones in a vineyard. Irrig. Sci. 2022, 1, 1–15. [CrossRef]
  5. Leolini, L.; Bregaglio, S.; Ginaldi, F.; Costafreda-Aumedes, S.; Di Gennaro, S.F.; Matese, A.; Maselli, F.; Caruso, G.; Palai, G.; Bajocco, S.; et al. Use of remote sensing-derived fPAR data in a grapevine simulation model for estimating vine biomass accumulation and yield variability at sub-field level. Precis. Agric. 2023, 24, 705–726. [CrossRef]
  6. Munitz, S.; Schwartz, A.; Netzer, Y. Effect of timing of irrigation initiation on vegetative growth, physiology and yield parameters in Cabernet Sauvignon grapevines. Aust. J. Grape Wine Res. 2020, 26, 220–232. [CrossRef]
  7. Williams, L.E.; Ayars, J.E. Grapevine water use and the crop coefficient are linear functions of the shaded area measured beneath the canopy. Agric. For. Meteorol. 2005, 132, 201–211. [CrossRef]
  8. Ben-Asher, J.; Tsuyuki, I.; Bravdo, B.-A.; Sagih, M. Irrigation of grapevines with saline water: I. Leaf area index, stomatal conductance, transpiration and photosynthesis. Agric. Water Manag. 2006, 83, 13–21. [CrossRef]
  9. Ohana-Levi, N.; Munitz, S.; Ben-Gal, A.; Schwartz, A.; Peeters, A.; Netzer, Y. Multiseasonal grapevine water consumption – Drivers and forecasting. Agric. For. Meteorol. 2020, 280, 107796. [CrossRef]
  10. Netzer, Y.; Yao, C.; Shenker, M.; Bravdo, B.A.; Schwartz, A. Water use and the development of seasonal crop coefficients for Superior Seedless grapevines trained to an open-gable trellis system. Irrig. Sci. 2009, 27, 109–120. [CrossRef]
  11. Ohana-Levi, N.; Cohen, Y.; Munitz, S.; Michaelovsky, R.; Ferman Mintz, D.; Hagag, N.; Getz, Y.; Netzer, Y. The response of yield, number of clusters, and cluster weight to meteorological factors and irrigation practices in grapevines: A multi-experiment study. Sci. Hortic. (Amsterdam). 2024, 326, 112761. [CrossRef]
  12. Somkuwar, S.G.; Taware, P.B.; Bondage, D.D.; Nawale, S. Influence of shoot density on leaf area, yield and quality of Tas-A-Ganesh grapes (Vitis vinifera L.) grafted on Dog Ridge rootstock. Int. Res. J. Plant Sci. 2012, 3, 94–99.
  13. Hunter, J.J. Implications of Seasonal Canopy Management and Growth Compensation in Grapevine. South African J. Enol. Vitic. 2000, 21, 81–91. [CrossRef]
  14. Munitz, S.; Schwartz, A.; Netzer, Y. Water consumption, crop coefficient and leaf area relations of a Vitis vinifera cv. “Cabernet Sauvignon” vineyard. Agric. Water Manag. 2019, 219, 86–94. [CrossRef]
  15. Ohana-Levi, N.; Munitz, S.; Ben-Gal, A.; Netzer, Y. Evaluation of within-season grapevine evapotranspiration patterns and drivers using generalized additive models. Agric. Water Manag. 2020, 228, 105808. [CrossRef]
  16. Lavee, S.; May, P. Dormancy of grapevine buds - facts and speculation. Aust. J. Grape Wine Res. 1997, 3, 31–46. [CrossRef]
  17. Picón-Toro, J.; González-Dugo, V.; Uriarte, D.; Mancha, L.A.; Testi, L. Effects of canopy size and water stress over the crop coefficient of a “Tempranillo” vineyard in south-western Spain. Irrig. Sci. 2012, 30, 419–432. [CrossRef]
  18. Mancha, L.A.; Uriarte, D.; Prieto, M.D.H. Characterization of the Transpiration of a Vineyard under Different Irrigation Strategies Using Sap Flow Sensors. Water 2021, Vol. 13, Page 2867 2021, 13, 2867. [CrossRef]
  19. Bahat, I.; Netzer, Y.; Grünzweig, J.M.; Alchanatis, V.; Peeters, A.; Goldshtein, E.; Ohana-Levi, N.; Ben-Gal, A.; Cohen, Y. In-season interactions between vine vigor, water status and wine quality in terrain-based management-zones in a ‘Cabernet Sauvignon’ vineyard. Remote Sens. 2021, 13, 1636. [CrossRef]
  20. Arab, S.T.; Noguchi, R.; Matsushita, S.; Ahamed, T. Prediction of grape yields from time-series vegetation indices using satellite remote sensing and a machine-learning approach. Remote Sens. Appl. Soc. Environ. 2021, 22, 100485. [CrossRef]
  21. Greer, D.H.; Weedon, M.M. Interactions between light and growing season temperatures on, growth and development and gas exchange of Semillon (Vitis vinifera L.) vines grown in an irrigated vineyard. Plant Physiol. Biochem. 2012, 54, 59–69. [CrossRef]
  22. Intrigliolo, D.S.; Castel, J.R. Response of grapevine cv. “Tempranillo” to timing and amount of irrigation: Water relations, vine growth, yield and berry and wine composition. Irrig. Sci. 2010, 28, 113–125. [CrossRef]
  23. Williams, L.E. Growth of ‘Thompson Seedless’ Grapevines: I. Leaf Area Development and Dry Weight Distribution. J. Am. Soc. Hortic. Sci. 1987, 112, 325–330. [CrossRef]
  24. Ramos, M.C. Projection of phenology response to climate change in rainfed vineyards in north-east Spain. Agric. For. Meteorol. 2017, 247, 104–115. [CrossRef]
  25. Yu, R.; Fidelibus, M.W.; Kennedy, J.A.; Kurtural, S.K. Precipitation before Flowering Determined Effectiveness of Leaf Removal Timing and Irrigation on Wine Composition of Merlot Grapevine. Plants 2021, Vol. 10, Page 1865 2021, 10, 1865. [CrossRef]
  26. Martínez-Lüscher, J.; Brillante, L.; Nelson, C.C.; Al-Kereamy, A.M.; Zhuang, S.; Kurtural, S.K. Precipitation before bud break and irrigation affect the response of grapevine ‘Zinfandel’ yields and berry skin phenolic composition to training systems. Sci. Hortic. (Amsterdam). 2017, 222, 153–161. [CrossRef]
  27. van Es, H.M.; Gomes, C.P.; Sellmann, M.; van Es, C.L. Spatially-Balanced Complete Block designs for field experiments. Geoderma 2007, 140, 346–352. [CrossRef]
  28. Allen, R.G.; Pereira, L.S.; Raes, D.; Smith, M. Crop evapotranspiration-Guidelines for computing crop water requirements-FAO Irrigation and drainage paper 56; Food and Agriculture Organization: Rome, 1998;.
  29. Ohana-Levi, N.; Mintz, D.F.; Hagag, N.; Stern, Y.; Munitz, S.; Friedman-Levi, Y.; Shacham, N.; Grünzweig, J.M.; Netzer, Y. Grapevine responses to site-specific spatiotemporal factors in a Mediterranean climate. Agric. Water Manag. 2022, 259, 107226. [CrossRef]
  30. Ohana-Levi, N.; Zachs, I.; Hagag, N.; Shemesh, L.; Netzer, Y. Grapevine stem water potential estimation based on sensor fusion. Comput. Electron. Agric. 2022, 198, 107016. [CrossRef]
  31. Kennedy, J. Understanding grape berry development. Pract. Winer. Vineyard 2002, 4, 1–5.
  32. Netzer, Y.; Munitz, S.; Shtein, I.; Schwartz, A. Structural memory in grapevines: Early season water availability affects late season drought stress severity. Eur. J. Agron. 2019, 105, 96–103. [CrossRef]
  33. Moritz, S.; Bartz-Beielstein, T. imputeTS: Time Series Missing Value Imputation in R. R J. 2017, 9, 207–218. [CrossRef]
  34. Xu, J.; Wei, Q.; Peng, S.; Yu, Y. Error of Saturation Vapor Pressure Calculated by Different Formulas and Its Effect on Calculation of Reference Evapotranspiration in High Latitude Cold Region. Procedia Eng. 2012, 28, 43–48. [CrossRef]
  35. Allen, R.G.; Pereira, L.S.; Raes, D.; Smith, M. Crop evapotranspiration-Guidelines for computing crop water requirements- Irrigation and Drainage Paper 56; FAO, 1998; Vol. 56;.
  36. Wickham, H.; Francois, R.; Henry, L.; Muller, K. dplyr: A Grammar of Data Manipulation. R package version 1.0.8. 2022.
  37. Leutner, B.; Horning, N.; Schwalb-Willmann, J.; Hijmans, R.J.; Maintainer, ] RStoolbox: Tools for Remote Sensing Data Analysis. R package version 0.2.6. 2019, Available online: https://CRAN.R-project.org/packa.
  38. Grolemund, G.; Wickham, H. Dates and Times Made Easy with lubridate. J. Stat. Softw. 2011, 40, 1–25.
  39. de Mendiburu, F. agricolae: Statistical Procedures for Agricultural Research. R package version 1.3-5 2021.
  40. R Core Team R: A language and environment for statistical computing 2021, Available online: https://www.R-project.org/.
  41. Taiyun Wei, M.; Taiyun Wei cre, A.; Simko aut, V.; Levy ctb, M.; Xie ctb, Y.; Jin ctb, Y.; Zemla ctb, J. Package “corrplot”: Visualization of a Correlation Matrix 2021, Available from https://github.com/taiyun/corrplot.
  42. Hastie, T.; Tibshirani, R. Generalized Additive Models. Stat. Sci. 1986, 1, 297–310. [CrossRef]
  43. Wood, S.N. Stable and Efficient Multiple Smoothing Parameter Estimation for Generalized Additive Models. J. Am. Stat. Assoc. 2012, 99, 673–686. [CrossRef]
  44. Wood, S.N. Generalized Additive Models; 2nd ed.; Chapman and Hall/CRC: New York, 2017; ISBN 9781315370279.
  45. Greenwell, B.M. pdp: An R package for constructing partial dependence plots. R J. 2017, 9, 421–436. [CrossRef]
  46. Chen, T.; Guestrin, C. XGBoost: A scalable tree boosting system. Proc. ACM SIGKDD Int. Conf. Knowl. Discov. Data Min. 2016, 13-17-August-2016, 785–794. [CrossRef]
  47. Chen, T.; He, T.; Benesty, M.; Khotilovich, V.; Tang, Y.; Cho, H.; Chen, K.; Mitchell, R.; Cano, I.; Zhou, T.; et al. xgboost: Extreme Gradient Boosting 2022.
  48. Wickham, H. ggplot2 : Elegant graphics for data analysis; Springer: Verlag, New York, 2016; ISBN 9780387981406.
  49. Hamner, B.; Frasco, M.; Ledell, E. Package “Metrics” - Evaluation Metrics for Machine Learning; 2018;.
  50. Munitz, S.; Netzer, Y.; Schwartz, A. Sustained and regulated deficit irrigation of field-grown Merlot grapevines. Aust. J. Grape Wine Res. 2016, 1, 1–8. [CrossRef]
  51. Intrigliolo, D.S.; Castel, J.R. Effects of Irrigation on the Performance of Grapevine cv. Tempranillo in Requena, Spain. Am. J. Enol. Vitic. 2008, 59, 30–38. [CrossRef]
  52. Camps, J.O.; Ramos, M.C. Grape harvest and yield responses to inter-annual changes in temperature and precipitation in an area of north-east Spain with a Mediterranean climate. Int. J. Biometeorol. 2012, 56, 853–864. [CrossRef]
  53. Ramos, M.C.; Mulligan, M. Spatial modelling of the impact of climate variability on the annual soil moisture regime in a mechanized Mediterranean vineyard. J. Hydrol. 2005, 306, 287–301. [CrossRef]
  54. Junquera, P.; Lissarrague, J.R.; Jiménez, L.; Linares, R.; Baeza, P. Long-term effects of different irrigation strategies on yield components, vine vigour, and grape composition in cv. Cabernet-Sauvignon (Vitis vinifera L.). Irrig. Sci. 2012. [CrossRef]
  55. Zufferey, V.; Spring, J.L.; Verdenal, T.; Dienes, A.; Belcher, S.; Lorenzini, F.; Koestel, C.; Rösti, J.; Gindro, K.; Spangenberg, J.; et al. The influence of water stress on plant hydraulics, gas exchange, berry composition and quality of Pinot Noir wines in Switzerland. OENO One 2017, 51, 37–57. [CrossRef]
  56. Hochberg, U.; Degu, A.; Gendler, T.; Fait, A.; Rachmilevitch, S. The variability in the xylem architecture of grapevine petiole and its contribution to hydraulic differences. Funct. Plant Biol. 2014, 42, 357–365. [CrossRef]
  57. Herrera, J.C.; Savoi, S.; Dostal, J.; Elezovic, K.; Chatzisavva, M.; Forneck, A.; Savi, T. The legacy of past droughts induces water-sparingly behaviour in Grüner Veltliner grapevines. Plant Biol. 2024. [CrossRef]
  58. Shtein, I.; Wolberg, S.; Munitz, S.; Zait, Y.; Rosenzweig, T.; Grünzweig, J.M.; Ohana-Levi, N.; Netzer, Y. Multi-seasonal water-stress memory versus temperature-driven dynamic structural changes in grapevine. Tree Physiol. 2021, 41, 1199–1211. [CrossRef]
  59. Lavoie-Lamoureux, A.; Sacco, D.; Risse, P.A.; Lovisolo, C. Factors influencing stomatal conductance in response to water availability in grapevine: A meta-analysis. Physiol. Plant. 2017, 159, 468–482. [CrossRef]
  60. Buttrose, M.S. Some Effects of Light Intensity and Temperature on Dry Weight and Shoot Growth of Grape-Vine. Ann. Bot. 1968, 32, 753–765. [CrossRef]
  61. Lavee, S. Grapevine (Vitis Vinifera) Growth and Performance in Warm Climates. Temp. Fruit Crop. Warm Clim. 2000, 343–366. [CrossRef]
  62. Gardiner, B.; Berry, P.; Moulia, B. Review: Wind impacts on plant growth, mechanics and damage. Plant Sci. 2016, 245, 94–118. [CrossRef]
  63. Jaffe, M.J. Thigmomorphogenesis: The response of plant growth and development to mechanical stimulation - With special reference to Bryonia dioica. Planta 1973, 114, 143–157. [CrossRef]
  64. Pollastrini, M.; Di Stefano, V.; Ferretti, M.; Agati, G.; Grifoni, D.; Zipoli, G.; Orlandini, S.; Bussotti, F. Influence of different light intensity regimes on leaf features of Vitis vinifera L. in ultraviolet radiation filtered condition. Environ. Exp. Bot. 2011, 73, 108–115. [CrossRef]
  65. Dobrowski, S.Z.; Ustin, S.L.; Wolpert, J.A. Grapevine dormant pruning weight prediction using remotely sensed data. Aust. J. Grape Wine Res. 2003, 9, 177–182. [CrossRef]
  66. Netzer, Y.; Suued, Y.; Harel, M.; Ferman-Mintz, D.; Drori, E.; Munitz, S.; Stanevsky, M.; Grünzweig, J.M.; Fait, A.; Ohana-Levi, N.; et al. Forever Young? Late Shoot Pruning Affects Phenological Development, Physiology, Yield and Wine Quality of Vitis vinifera cv. Malbec. Agric. 2022, Vol. 12, Page 605 2022, 12, 605. [CrossRef]
  67. Santesteban, L.G.; Miranda, C.; Royo, J.B. Regulated deficit irrigation effects on growth, yield, grape quality and individual anthocyanin composition in Vitis vinifera L. cv. “Tempranillo.” Agric. Water Manag. 2011, 98, 1171–1179. [CrossRef]
  68. Reynolds, A.G.; Vanden Heuvel, J.E. Influence of Grapevine Training Systems on Vine Growth and Fruit Composition: A Review. Am. J. Enol. Vitic. 2009, 60, 251–268. [CrossRef]
  69. Vasconcelos, M.C.; Castagnoli, S. Leaf Canopy Structure and Vine Performance. Am. J. Enol. Vitic. 2000, 51, 390–396. [CrossRef]
  70. Uriarte, D.; Mancha, L.A.; Moreno, D.; Bejarano, M.A.; Valdés, E.; Talaverano, I.; Prieto, M.H. Effects of timing of water deficit induction on “Doña Blanca” white grapevine under semi-Arid growing conditions of south-western Spain. Acta Hortic. 2017, 1150, 493–500. [CrossRef]
  71. Bindon, K.A.; Dry, P.R.; Loveys, B.R. The interactive effect of pruning level and irrigation strategy on water use efficiency of Vitis vinifera L. cv. Shiraz. South African J. Enol. Vitic. 2008, 29, 59–70. [CrossRef]
  72. Hamman, R.A.J.; Dami, I.E. Effects of irrigation on wine grape growth and fruit quality. Horttechnology 2000, 10, 162–168.
  73. Intrigliolo, D.S.; Castel, J.R.; Cárcel, S. Effects of crop level and irrigation on yield and wine quality of tempranillo grapevines in a dry year. Acta Hortic. 2008, 792, 371–378. [CrossRef]
  74. Monteiro, A.I.; Malheiro, A.C.; Bacelar, E.A. Morphology, Physiology and Analysis Techniques of Grapevine Bud Fruitfulness: A Review. Agric. 2021, Vol. 11, Page 127 2021, 11, 127. [CrossRef]
  75. Collins, C.; Rawnsley, B. Factors influencing primary bud necrosis (PBN) in Australian vineyards. Acta Hortic. 2005, 689, 81–86. [CrossRef]
  76. Rumbolz, J.; Gubler, W.D. Susceptibility of grapevine buds to infection by powdery mildew Erysiphe necator. Plant Pathol. 2005, 54, 535–548. [CrossRef]
  77. Collins, C.; Coles, R.; Conran, J.G.; Rawnsley, B. The progression of primary bud necrosis in the grapevine cv. Shiraz (Vitis vinifera L.): A histological analysis. Vitis 2006, 45, 57–62. [CrossRef]
  78. Lavee, S.; Melamu, H.; Ziv, M.; Bernstein, Z. Necrosis in grapevine buds (Vitis vinifera cv. Queen of Vineyard) I. Relation to vegetative vigor1). Vitis 1981, 20, 8–14.
  79. Monteiro, A.I.; Ferreira, H.; Ferreira-Cardoso, J. V; Malheiro, A.C.; Bacelar, E.A.; Deloire, A. Assessment of bud fruitfulness of three grapevine varieties grown in northwest Portugal. OENO One 2022, 56, 385–395. [CrossRef]
  80. Intrigliolo, D.S.; Lizama, V.; García-Esparza, M.J.; Abrisqueta, I.; Álvarez, I. Effects of post-veraison irrigation regime on Cabernet Sauvignon grapevines in Valencia, Spain: Yield and grape composition. Agric. Water Manag. 2016, 170, 110–119. [CrossRef]
  81. Petrie, P.R.; Cooley, N.M.; Clingeleffer, P.R. The effect of post-veraison water deficit on yield components and maturation of irrigated Shiraz (Vitis vinifera L.) in the current and following season. Aust. J. Grape Wine Res. 2004, 10, 203–215. [CrossRef]
  82. García-Fernández, M.; Sanz-Ablanedo, E.; Pereira-Obaya, D.; Ramón Rodríguez-Pérez, J.; Lukáš, J.; Hamouz, P.; Antonio Dominguez-Gómez, J. Vineyard Pruning Weight Prediction Using 3D Point Clouds Generated from UAV Imagery and Structure from Motion Photogrammetry. Agron. 2021, Vol. 11, Page 2489 2021, 11, 2489. [CrossRef]
Figure 1. Experimental setup and measurement protocol. Schematic representation of the vineyard plot and location of measurement vines (a); Hand-harvesting of clusters from individual measurement vines (b,c); Leaf area index (LAI) measurement using the SunScan canopy analysis system (d,e); Pruning and weighing of canes from each measurement vine (f,g).
Preprints 149593 g001
Figure 2. A correlation matrix providing the correlation coefficients for various environmental factors and irrigation against leaf area index (LAI) at different phenological stages. Each environmental/irrigation factor corresponds to the same period as the mean LAI values for the different stages. ‘Sauvignon Blanc’, Merav, 2017-2023.
Preprints 149593 g002
Figure 3. A heatmap combined with patterns of effects of leaf area index (LAI) during each stage on yield and pruning components. ‘Sauvignon Blanc’, Merav, 2017-2023.
Preprints 149593 g003
Figure 4. A heatmap combined with patterns of effects of leaf area index (LAI) of the previous season during each stage on yield and pruning components of the current season. ‘Sauvignon Blanc’, Merav, 2017-2023.
Preprints 149593 g004
Figure 5. Relative contribution of leaf area index (LAI) for the different phenological stages of the current and previous season. The six models include clusters per vine (a), canes per vine (b), yield (c), pruning weight (d), cluster weight (e), and cane weight (f).
Preprints 149593 g005
Table 1. Description of the Vitis vinifera ‘Sauvignon Blanc’ phenological growth stages and pruning timing within the growing season and their duration. The dates were averaged from data collected during 7 successive growing seasons (2017–2023) in Merav vineyard.
Stage 0 Budbreak-Flowering Stage 1 Flowering-Bunch closure Stage 2 Bunch closure-Veraison Stage 3 Veraison-Harvest Stage 4
Post Harvest
Pruning
Range of start dates March 7-
April 6
April 18 –
May 14
May 30 –
June 11
June 23 –
July 18
July 27 –
August 19
February 5 – March 7
Mean start date March 19 May 6 June 4 June 29 August 9 February 22
Average duration 48 29 25 41 52 -
Table 2. Descriptive statistics of the factors collected from the field and meteorological station, including the minimum, maximum, median, mean, standard deviation, and coefficient of variation. Sauvignon Blanc, Merav, 2017-2023.
Category Variable Min Max Median Mean SD CV (%)
Yield components Clusters per vine 23 110 62 64.17 19.28 30.05
Yield (ton ha-1) 5.19 34.81 17.57 18.16 5.85 32.2
Cluster weight (g) 51.66 199 121 123.79 25.91 20.93
Pruning components Canes per vine 16 48 32 32.33 6.11 18.91
Pruning weight (Kg) 0.19 2.54 1.16 1.23 0.47 38.27
Cange weight (g) 0 78.89 36.03 38.4 14.45 37.63
Leaf area index Mean LAI at Stage 0 (m2 m-2) 0.31 0.78 0.52 0.52 0.1 19
Mean LAI at Stage 1 (m2 m-2) 0.77 1.92 1.19 1.22 0.24 19.3
Mean LAI at Stage 2 (m2 m-2) 0.7 2.48 1.4 1.39 0.36 26.02
Mean LAI at Stage 3 (m2 m-2) 0.78 2.56 1.33 1.41 0.38 27.21
Mean LAI at Post-harvest (m2 m-2) 0.6 2 1.2 1.22 0.27 21.96
Irrigation treatments Irrigation per season (mm) 191.7 710.8 397.1 396.4 126.6 31.93
Meteorology
(at the phenological stage scale)
Total (seasonal) precipitation (mm) 250.8 555.3 441.8 421.53 90.39 21.44
Spring precipitation (mm) 23.8 134.4 73.9 72.09 36.64 50.83
Mean temperature (°C) 9.62 26.64 22.99 21.26 4.76 22.39
Maximum temperature (°C) 13.37 36.93 30.06 27.78 5.98 21.54
Minimum temperature (°C) 6.79 21.74 17.74 16.57 4.2 25.36
Mean vapor pressure deficit (kPa) 0.3 1.96 1.17 1.11 0.37 33.85
Minimum vapor pressure deficit (kPa) 0.02 0.45 0.18 0.18 0.1 57.03
Maximum vapor pressure deficit (kPa) 0.64 4.77 2.82 2.57 0.95 37.07
Chilling hours 197.5 571.5 409.25 390.5 122.14 31.28
Mean ETo (mm day-1) 2.32 8.16 6.69 6.07 1.67 27.52
Mean wind speed (m sec-1) 4.53 7.4 5.62 5.72 0.62 10.81
Mean radiation (MJ m-2 day-1) 14.18 28.11 22.3 22.93 3.92 17.08
Mean relative humidity (%) 49.61 77.89 66.69 65.97 6.89 10.45
Table 3. Differences in multiseasonal leaf area index (LAI) values and irrigation amounts among treatments. The statistical differences were computed using analysis of variance followed by post-hoc Tukey HSD test. Sauvignon Blanc, Merav, 2017-2023.
Treatment Mean LAI (mm2 mm-2) Mean irrigation amount
(mm day-1)
Yield (ton ha-1)
Low 1.02 d 1.85 e 16.9 e
Medium 1.17 b 2.85 b 19 a
High 1.28 a 3.8 a 18.7 b
Low to High 1.08 c 2.57 c 18.3 c
High to Low 1.17 b 2.42 d 18 d
Table 4. Differences of multiseasonal leaf area index (LAI) values and irrigation amounts among growing seasons. The statistical differences were computed using analysis of variance followed by post-hoc Tukey HSD test. Sauvignon Blanc, Merav, 2017-2023.
Season Mean LAI (mm2 mm-2) Mean irrigation amount (mm day-1) Yield (ton ha-1)
2017 0.93 g 2.00 e 13.4 f
2018 1.02 f 1.96 e 15.3 e
2019 1.07 e 2.60 d 21.4 c
2020 1.13 d 2.89 c 21.9 b
2021 1.25 c 3.13 b 13.2 g
2022 1.29 b 3.05 b 17.0 d
2023 1.34 a 3.36 a 24.8 a
Table 5. Validation metrics for each XGBoost model, including correlation (r), t-test (t) and Kolmogorov-Smirnov (D) with their corresponding p-values, and mean absolute error (MAE) and MAE normalized to the range of the test set (%).
Metric n Correlation t-test
(p-value)
KS test
(p-value)
MAE
(normalized to the range)
Clusters per vine train=350;
test=88
66.82 t = -0.127
(p = 0.899)
D = 0.136
(p = 0.387)
11.45 (14.49%)
Yield (ton ha-1) train=372;
test=94
62.16 t = -0.069
(p = 0.945)
D = 0.17
(p = 0.131)
40.3 (13.82%)
Cluster weight (g) train=370;
test=92
39.46 t = -0.101
(p = 0.92)
D = 0.239
(p = 0.01)
22.5 (17.5%)
Canes per vine train=256;
test=64
8.69 t = -0.211
(p = 0.833)
D = 0.185
(p = 0.211)
5.72 (18.46%)
Pruning weight (Kg) train=319;
test=80
52.66 t = 0.529
(p = 0.598)
D = 0.162
(p = 0.241)
0.346 (16.47%)
Cane weight (g) train=265;
test=68
53.95 t = 1.408
(p = 0.162)
D = 0.235
(p = 0.05)
10.1 (15.81%)
Disclaimer/Publisher’s Note: The statements, opinions and data contained in all publications are solely those of the individual author(s) and contributor(s) and not of MDPI and/or the editor(s). MDPI and/or the editor(s) disclaim responsibility for any injury to people or property resulting from any ideas, methods, instructions or products referred to in the content.
Copyright: This open access article is published under a Creative Commons CC BY 4.0 license, which permit the free download, distribution, and reuse, provided that the author and preprint are cited in any reuse.
Prerpints.org logo

Preprints.org is a free preprint server supported by MDPI in Basel, Switzerland.

Subscribe

Disclaimer

Terms of Use

Privacy Policy

Privacy Settings

© 2025 MDPI (Basel, Switzerland) unless otherwise stated