
Submitted:
19 September 2024
Posted:
20 September 2024
You are already at the latest version
Abstract
Biomass fuel pellets exhibit variations in quality due to differences in feedstock sources. Moni-toring processing parameters is crucial for converting biomass into high-quality energetic pellets. This study examined the effects of selected parameters on the properties of cocoa pod husk pellets produced using a modified pelleting machine. The pellets were produced by varying the com-pression ratio (0.8, 1.0, 1.2), moisture content (10, 15, 20%) and binder quantity (0, 2.5, 5 wt%). A Box-Behnken design was employed to structure the experiment. The pellets were analyzed for density, proximate composition (moisture, volatile matter, fixed carbon, and ash contents), and higher heating value to assess their quality. The results were subjected to ANOVA at a 95% con-fidence level. The cocoa pod husk pellets had a bulk density of 0.28-0.41 g/cm³, moisture content of 13.22-19.30% (db), volatile matter of 48.61-57.83%, fixed carbon of 21.25-23.10%, ash content of 3.49-12.99%, and higher heating values of 18.28-19.30 MJ/kg. Significant differences were observed at the 95% confidence level (p≤0.05). Compression ratio, binder quantity and moisture content were found to affect the physicochemical properties of the pellets.
Keywords:
Biomass
; cocoa pod husk
; pellets
; biofuel
; compression ratio
1. Introduction
Nigeria spans over 98.3 million hectares, with more than 35% (34 million hectares) under cultivation, making agriculture the largest sector of the nation's economy [1]. Agricultural activities generate residues rich in carbohydrates and lignin, which can be harnessed for renewable energy production [2]. The use of bio-residues as a renewable energy source offers a sustainable solution to meet the growing energy needs of the global population [3]. In 2004, Jekayinfa and Scholz [4] estimated that the energy potential of agricultural residues in Nigeria was equivalent to 20.81 million tons of oil, covering approximately 82% of the country's annual energy consumption.
Nigeria is currently the fourth-largest producer and third-largest exporter of cocoa globally, having recently overtaken Ecuador [5]. The country accounts for 6.5% of global cocoa production, ranking behind Ivory Coast, Indonesia, and Ghana. Cocoa is predominantly grown in southwestern states, including Ondo, Oyo, Osun, Ogun, and Ekiti [6]. Cocoa pod husks (CPH), a byproduct of cocoa farming, are abundant, with around 1 million tonnes produced annually. While some of the husks are used as animal feed, much remains underutilized, leading to waste accumulation and the spread of black pod disease when left on plantations [7].
Effective management of agricultural residues is essential for preventing frequent fire outbreaks caused by bush burning, which can destroy cocoa and kola pod heaps and reduce plantation productivity. Additionally, there is a pressing need for alternative energy sources to meet Nigeria's growing energy demands. As the world’s population increases, interest in using agricultural residues for renewable energy has grown.
The use of biomass for renewable energy is critical to combating climate change, as deforestation and fossil fuel consumption are major contributors. Biomass energy can help reduce global warming by replacing carbon-rich fossil fuels [8]. Accumulated cocoa pod husks can cause waterlogging and occupy valuable agricultural space, adversely affecting crop production. Densifying these residues can address these issues, improve environmental conditions, and enhance agricultural productivity.
Biomass and its derivatives hold substantial potential to replace fossil fuels and be integrated into existing energy technologies [9]. However, biomass's complex nature requires thorough investigation into manufacturing parameters to understand its self-bonding mechanisms during densification, which can improve its use as a fuel [10]. Previous research has explored the densification of various biomass types, including corncob [12,13], poplar wood [14], Mitrogyna ciliata [15], and livestock feed [16], focusing on how process and material parameters affect the final product. In Nigeria, pelletizing machines have traditionally been used to produce animal feed. However, a recent study by Jekayinfa et al. [17] adapted this technology for renewable energy production from biomass, specifically focusing on the effects of processing parameters (compression ratio, moisture content, and feedstock conditioning) on the physicochemical properties of cocoa pod husk (CPH) pellets.
2. Materials and Methods
2.1. Description of the Pelleting Machine
The modified pelletizing machine developed by Jekayinfa et al. [17] was used for this study. The machine consists of a compression chamber, an auger and a die plate. The compression chamber, or barrel, is where pressure is applied to the material being pelletized. It is made of cast iron, with a thickness of 10 mm, an internal diameter of 80 mm, and a length of 200 mm. The chamber has a hopper opening at the top, measuring 90 mm in diameter, which serves as the inlet for materials to be pelletized. The barrel is attached to the machine's frame via tentacle-like arms for support.
The auger, also made of cast iron, transports the material from the bottom of the hopper to the die plate. It has a 25 mm diameter shaft, an external diameter of 70 mm, a flight measuring 22.5 mm, and a pitch of 50 mm. The die plate acts as a back wall, retaining the pressure generated by the auger, while its perforations (die holes) allow the compressed material to exit the chamber as pellets. The die plate is made of mild steel, with a diameter of 100 mm and a thickness of 6 mm. It contains 48 cylindrical die holes, each 5 mm in diameter, through which the material is extruded. The orthographic projection and exploded view of the pelletizer are shown in Figure 1a and b [17].
2.2. Experimental Procedure
Sample Sourcing and Preparation: Cocoa pod husk used for this study was sourced from the crop processing unit of the Cocoa Research Institute of Nigeria (CRIN), Ibadan. The pod husks were ground to powdery form using attrition mill, materials were bagged for further processing.
Preparation of binder: starch was used as a binding agent for this study. A 100 mL of distilled or deionized water was placed in a 250 mL beaker and brought to boiling point on a hot plate. A smooth paste was made with 1 g of soluble starch and a small volume (several millilitres) of distilled water. The boiling water was gently poured inside the bucket containing the paste and stirred gently until a firm viscous starch solution is obtained. The starch solution was allowed to cool to room temperature before usage.
Feedstock Conditioning: The moisture content of pellets was determined using ASTM E871 [18] standard method. According to the standard, moisture content of the samples was determined by oven-drying method. A known mass of sample (Wi) was dried in an oven at 105 ± 1oC until three consecutive weights (Wf) of sample is equal [19]. The percent moisture in the analysis sample is calculated using Equation 1 [20].
where: Wi is the initial weight (g), and Wf is the final weight (g)
The feedstock materials were brought to the required moisture content of 10, 15 and 20% (wb) by adding an adequate weight of water required using Equation 2 [21] for moisture content determination.
The binder was added to the ground feedstock in three different proportions: 0%, 2.5%, and 5% starch content by weight, following the EN 14961 [22] standard in preparation for the experiment. The feedstock was measured, and the appropriate binder percentage was calculated. The materials were then thoroughly mixed in a bowl using a pestle until a uniform paste was achieved.
Experimental Setup: The experiment was conducted using the modified pelleting machine, which was connected to a power source. A known mass and volume of feedstock were poured into the hopper, and the machine was operated until all the material was processed into pellets. The collected pellets were weighed, dried, and stored. The factors considered for the experiment included the die compression ratio (0.8, 1.0, 1.2), moisture content (10%, 15%, 20%), and binder content (0%, 2.5%, 5%).
Design of Experiment: A Box-Behnken design was used to structure the experiment, utilizing Design Expert 12.0.3.0 software. Three independent variables at three levels each—compression ratio (0.8, 1.0, 1.2), binder content (0%, 2.5%, 5%), and moisture content (10%, 15%, 20%)—were studied. The dependent variables analyzed were bulk density, moisture content, volatile matter, fixed carbon, ash content, and Higher Heating Value (HHV). A total of 15 experiments were generated. The pellet characteristics were subjected to analysis of variance (ANOVA), with results accepted based on a significance level of P ≤ 0.05.
Determination of Pellet Characteristics: Bulk Density: The bulk density was determined following ASTM E873 [23] test procedures. A sample of known weight was packed into a measuring cylinder, and the bulk density was calculated by dividing the sample weight (g) by the measured volume (cm³). The measurement was repeated in triplicate, and the average value was recorded. Bulk density was calculated using the formula in Equation 3 [24].
Where: BD is the bulk density (g/cm3), W1 is the mass of the container with sample (g), W0 is the mass of the container (g), and V is the volume occupied by pellet (cm3).
Moisture Content: The moisture content of the pellets was determined using the method previously described.
Ash Content: The ash content of the pellets was measured following ASTM D1102 [25] standard procedures. A clean, empty crucible was ignited in a muffle furnace at 525 ± 25°C for 30 minutes, then cooled slightly in a desiccator. The crucible was weighed on an analytical balance to the nearest 0.1 mg, and a known mass of the test specimen was placed inside. The crucible was then placed in the furnace at about 100°C, with the temperature gradually increasing to 525°C to carbonize the sample without flaming [26].
When specimen is completely combusted as indicated by the absence of black particles, the crucible was removed from the furnace and allowed to cool in a desiccator. The weight of the crucible with ash was taken and recorded. The ash content is calculated using Equation 4 [27].
Where: WC is the weight of empty crucible (g), WCA is the weight of crucible with ash (g), B is the weight of test sample (g).
Volatile Matter Content: ASTM E872 [28] was used to determine the volatile matter of the produced pellets. Volatile matter is determined by establishing the loss in weight resulting from heating text sample under controlled conditions. A crucible with cover was weighed and record as Wc. A known mass of sample was placed in the crucible, covered and weighed and record as initial weight, Wi. The covered crucible with sample was placed in the furnace and was maintained at a temperature of 950 ± 20°C for a total of exactly 7 min. The crucible was removed from the furnace and allowed to cool in a desiccator. The cooled, covered crucible with sample was weighed and record as final weight, Wf. the weight loss is calculated in percentage as shown in Equation 5 [29]
Where: A is the weight loss (%), Wc is the weight of crucible and cover (g), Wi is the initial weight (g), Wf is the final weight (g).
The volatile matter (%) in the analysis sample is calculated using Equation 6
Where: VM is the volatile matter (%), A is the weight loss (%), B is the moisture, (%)
Fixed Carbon Content: this was determined based on methods of ASTM E870 [30] standard, fixed carbon was calculated as difference of the summation of moisture, ash and volatile matter content from 100 using Equation 7 [31].
Where: FC is the fixed carbon (%), MC is the moisture content (%), AC is the ash content (%), VM is the volatile matter (%).
Higher Heating Value (HHV): The higher heating value (HHV) of the pellets were determined using Equation 8 [32] as a function of fixed carbon content thus:
Where: HHV= higher heating value (MJ/kg), FC = fixed carbon content of biomass fuel (wt%)
3. Results
The quality attributes of the CPH at varying processing condition is presented in Table 2.
3.1. Bulk Density
The effect of compression ratio, binder, and CPH moisture content on bulk density is illustrated in Figure 2. Figure 2a presents the influence of die compression ratio on the bulk density of the pellets. The highest bulk density value of 0.368 g/cm³ was observed at a compression ratio of 1.2, while the lowest value of 0.316 g/cm³ occurred at a compression ratio of 0.8. These results fall within the range of 0.24–0.96 g/cm³ reported by Okewole and Igbeka [33] for fish feed pellets produced using a pelleting press. Jekayinfa et al. [34] also found a bulk density range of 0.282–0.793 g/cm³ for rice bran pellets. The data indicate that bulk density increases as the die compression ratio rises, from 0.32 g/cm³ at a ratio of 0.8 to 0.36 g/cm³ at 1.2.
Figure 2b shows the impact of binder content on pellet bulk density, with the highest value of 0.353 g/cm³ occurring at 0.0 wt% binder and the lowest value of 0.321 g/cm³ at 5.0 wt% binder. This is lower than the 0.609 g/cm³ reported by Tasarov et al. [35] for wood pellets. The figure also reveals that bulk density decreases with increasing binder content. The use of binding agents affects pellet length, and larger particle sizes, higher moisture content, and increased production temperature and pressure tend to raise bulk density [36].
The bulk density (BD) of the CPH pellets increases as the binder content decreases and the compression ratio increases. However, it decreases with higher CPH moisture content. An opposite effect, where bulk density increased with moisture content, was reported by Okewole and Igbeka [33]. The regression equation representing the relationship between the factors and their interaction is shown in Equation 9. The model's significance was evaluated using analysis of variance (ANOVA) at a 95% confidence level. The ANOVA results, as shown in Table 3, indicate that the interaction between compression ratio and binder content, compression ratio and moisture content, and binder content and CPH moisture content all have a significant effect on the bulk density of CPH pellets. According to the regression equation, an increase in compression ratio and the interaction between compression ratio and binder content will lead to a higher bulk density of the CPH pellets. Conversely, an increase in binder content, moisture content, the interaction between compression ratio and CPH moisture content, and the interaction between binder content and CPH moisture content will reduce the bulk density of the CPH pellets.
3.2. Proximate Composition
3.2.1. Proximate Composition as Affected by Compression Ratio
It was observed that the moisture content of CPH pellets increases with higher compression ratios. The highest moisture content of 18.28% (db) was observed at a compression ratio of 1.2, while the lowest was 14.62% at a compression ratio of 0.8. Additionally, the volatile matter in the CPH pellets initially decreased with increasing compression ratio but then increased. The highest volatile matter, 53.89%, was found at a compression ratio of 0.8, and the lowest, 46.97%, was at a compression ratio of 1.0. Fixed carbon content decreased initially with higher compression ratios before increasing again. The highest fixed carbon content, 22.22%, was at a compression ratio of 1.2, and the lowest, 21.93%, was at a compression ratio of 1.0. The ash content also decreased with higher compression ratios, with the highest value of 9.38% at a compression ratio of 0.8 and the lowest of 6.67% at a ratio of 1.2. Figure 3a to Figure 3c illustrate the effects of compression ratio, binder, and moisture content on the proximate composition of CPH pellets. These values differ significantly from those reported by Sanchez et al. [37] for densified fuel made from waste wood in Piura, Peru, which had 10% moisture, 83.41% volatile matter, 15.29% fixed carbon, and 1.3% ash content. Similarly, Ikelle and Chukwuma [38] reported 2.87% moisture, 30.42% volatile matter, 45.01% fixed carbon, and 21.70% ash content for briquettes made from 80% coal and 20% corncob, noting that the higher fixed carbon value was due to the addition of coal.
3.2.2. Proximate Composition as Affected by Binder Content
Figure 3b shows the effect of binder on CPH pellet proximate compositions. The moisture content and volatile matter increased with an increase in binder. The highest and lowest value of moisture content of 16.88 and 15.76% was obtained at 5.0 and 0.0 wt% binder, respectively and the corresponding values recorded for volatile matter content are 56.17 and 50.61% obtained at 5.0 and 0.0 wt% binder, respectively. For fixed carbon content, it was observed in Figure 3b, that fixed carbon increases with an increase in binder content and later decreased. The highest and lowest value of 22.02 and 18.02% was obtained at 2.5 and 0.0 wt% binder, respectively for fixed carbon content. Also, CPH pellet’s ash content showed a decrease with increasing binder. The highest value of 10.93% for ash content was obtained at 0.0 wt% binder and the lowest value of 5.29% was obtained at 5.0 wt% binder. The result obtained is within the 12 – 18% obtained by Čolović et al. [39] for switchgrass pellets.
3.2.3. Proximate Composition as Affected by Moisture Content
Figure 4 shows the effect of CPH moisture content on CPH pellet’s proximate composition. It was observed that moisture content, fixed carbon and ash contents increase with increasing CPH moisture content and volatile matter show a decrease with increasing CPH moisture content. The highest value of 19.93% moisture content, 22.34% fixed carbon and 8.52% ash contents were obtained at 20% CPH moisture content and the lowest value of 15.55% moisture content, 21.6% fixed carbon and 7.86% ash contents were obtained at 10% CPH moisture content. For volatile matter content, the highest and lowest value of 54.95 and 51.88% were obtained at 10 and 20% CPH moisture content, respectively. The values obtained are similar to the mean values 80.22% volatile matter, 15.83% fixed carbon and 4.43% ash contents reported by Liu et al. [27] for wood and rice husk pellets. The high value of volatile matter includes the moisture content present in the material which was not determined separately. Jindaporn et al. [40] studied mixing ratios and binder types on properties of biomass pellets and recorded 8.53,67.21, 3.22 and 21.03% for moisture, volatile matter, ash and fixed carbon contents, respectively. Gonzalez et al. [41] recorded similar increase in volatile matter with decreasing moisture content and binder addition. The values obtained are higher in volatile matter content and fixed carbon than the values obtained in this study. This may be due to the type of materials used for pellet production.
The regression equations predicting the Moisture Content (MC) of pellets, Volatile Matter (VM), Fixed Carbon Content (FCC), Ash Content and Higher Heating Value (HHV) is presented in Equations 10 – 14 respectively.
3.2. Higher Heating Value
Figure 5a- c show the effect of compression ratio, binder and CPH moisture content, respectively on HHV of the CPH pellets. Figure 5a shows that HHV increases with increasing compression ratio to a maximum of 18.55 M/kg and further increase in compression ratio decreases HHV of CPH pellets. Figure 5b shows a decrease in HHV with increasing binder to a minimum of 18.43 MJ/kg and further increases in binder content increases HHV. Finally, Figure 5c shows that HHV increases with increasing CPH moisture content. In each case, the highest and lowest value 18.55 and 18.46 MJ/kg were obtained at 1.0 and 0.8 compression ratio, respectively. The highest value of 18.61 MJ/kg was obtained at 5.0 wt% binder and lowest value of 18.44 MJ/kg for HHV was obtained at 2.5 wt% binder. Likewise, the highest value and lowest value of 18.74 and 18.35 MJ/kg were obtained at 20 and10% CPH moisture content, respectively. The result obtained is higher than the 14.98 MJ/kg obtained by Iftikhar et al. [42] for wheat and rice straw pellets. Ferreira et al. [43] studied the use of waste wood pellets as an alternate energy source and recorded 20.39 MJ/kg higher heating value for pellets of 50 – 50% Dinizia excelsa and Manilkara elata. Their values are however higher than the values obtained in this study, this may be due to the pellet’s material being a mixture of two woody biomass.
Equation 14 shows the regression equation for HHV of cocoa pod husk pellets. The equation shows that increases in compression ratio, CPH moisture content will increase HHV of cocoa pod husk pellets while increases in binder will decrease HHV of cocoa pod husk pellets. The result of the ANOVA presented in Table 8 shows that the model P-value and F-value of 0.0046 and 46.74, respectively signifies that the models in Equation 4.6 is significant and the R2 value of 0.9929 implies that the equation can predict HHV of CPH pellets with 99.29% accuracy.
5. Conclusions
The study examined how processing parameters affect the quality attributes of cocoa pod-husk pellets. The parameters investigated included moisture content, binder ratio, and compression ratio, while the quality attributes measured were bulk density, moisture level, ash content, volatile matter, and higher heating value. The findings revealed that the compression ratio, binder ratio, and feedstock moisture content significantly influence the bulk density, ash content, and fixed carbon content of the pellets, which in turn affect their calorific value. Specifically, the higher heating value of the pellets increased with higher compression ratios, binder content, and feedstock moisture levels. The results indicate that cocoa pod husk pellets are viable for power generation and can serve as an alternative to raw biomass. Additionally, mathematical models were developed to estimate the physicochemical properties of cocoa pod-husk pellets.
Author Contributions
Conceptualization, S.O.J.; methodology, S.O.J.; software, S.O.J.; validation, S.O.J. and C.C.E..; formal analysis S.O.J. and C.C.E..; investigation, S.O.J..; resources, S.O.J. and C.C.E..; data curation, S.O.J. and C.C.E..; writing—original draft preparation, S.O.J.; writing—review and editing, S.O.J.; visualization, S.O.J. and C.C.E..; supervision, S.O.J; project administration, S.O.J; funding acquisition, S.O.J. All authors have read and agreed to the published version of the manuscript.
Funding
This research received no external funding.
Data Availability Statement
The original contributions presented in the study are included in the article/supplementary material, further inquiries can be directed to the corresponding author.
Acknowledgments
The first author (SOJ) wishes to acknowledge the Alexander von Humboldt Foundation of Germany for the Award of Equipment Subsidy, which has greatly aided the timely execution of this research.
Conflicts of Interest
The authors declare no conflicts of interest.
References
- Jekayinfa, S.O., Linke, B., and Pecenka, R. Biogas production from selected crop residues in Nigeria and estimation of its electricity value. Int J Renew Energy Technol. 2015;6(2):101–18. [CrossRef]
- Jekayinfa, S.O., Orisaleye, J.I., and Pecenka, R. An Assessment of Potential Resources for Biomass Energy in Nigeria. Resources. 2020;9(8):43–92. [CrossRef]
- Ola, F.A. and Jekayinfa, S.O. Pyrolysis of sandbox (Hura crepitans) shell: effect of pyrolysis parameters on biochar yield. Res Agric Eng. 2015;61(4):170–6. [CrossRef]
- Jekayinfa, S.O. and Scholz, V. Assessment of availability and cost of energetically usable crop residues in Nigeria. Nat gas. 2007;24(8):25.
- Beg, M.S., Ahmad, S., Jan, K., and Bashir, K. Status, supply chain and processing of cocoa-A review. Trends food Sci \& Technol. 2017;66:108–16. [CrossRef]
- Kehinde, A.D., Adeyemo, R., and Ogundeji, A.A. Does social capital improve farm productivity and food security? Evidence from cocoa-based farming households in Southwestern Nigeria. Heliyon. 2021;7(3):e06592. [CrossRef]
- Adeleye, A.O. and Sridhar, M.K.C. Effects of Composting on Three CPH Based Fertilizer Materials Used for Cocoa Nursery. Int J Sci Technoledge. 2015;3(12):53.
- Ouattara, L.Y., Kouassi, E.K.A., Soro, D., Soro, Y., Yao, K.B., Adouby, K., et al. Cocoa pod husks as potential sources of renewable high-value-added products: A review of current valorizations and future prospects. BioResources. 2021;16(1):1988–2020. [CrossRef]
- Orisaleye, J.I., Jekayinfa, S.O., Braimoh, O.M., and Edhere, V.O. Empirical models for physical properties of abura (Mitragyna ciliata) sawdust briquettes using response surface methodology. Clean Eng Technol. 2022;7:100447. [CrossRef]
- Orisaleye, J.I., Abiodun, Y.O., Ogundare, A.A., Adefuye, O.A., Ojolo, S.J., and Jekayinfa, S.O. Effects of Manufacturing Parameters on the Properties of Binderless Boards Produced from Corncobs. Trans Indian Natl Acad Eng. 2022;7(4):1311–25. [CrossRef]
- Orisaleye, J.I., Jekayinfa, S.O., Adebayo, A.O., Ahmed, N.A., and Pecenka, R. Effect of densification variables on density of corn cob briquettes produced using a uniaxial compaction biomass briquetting press. Energy Sources, Part A Recover Util Environ Eff. 2018;40(24):3019–28. [CrossRef]
- Orisaleye, J.I., Jekayinfa, S.O., Pecenka, R., and Onifade, T.B. Effect of densification variables on water resistance of corn cob briquettes. Agron Res. 2019;17(4):1722–34. [CrossRef]
- Orisaleye, J.I., Jekayinfa, S.O., Pecenka, R., Ogundare, A.A., Akinseloyin, M.O., and Fadipe, O.L. Investigation of the effects of torrefaction temperature and residence time on the fuel quality of corncobs in a fixed-bed reactor. Energies. 2022;15(14):5284. [CrossRef]
- Orisaleye, J.I., Jekayinfa, S.O., Dittrich, C., Obi, O.F., and Pecenka, R. Effects of feeding speed and temperature on properties of briquettes from poplar wood using a hydraulic briquetting press. Resources. 2023;12(1):12. [CrossRef]
- Orisaleye, J.I., Jekayinfa, S.O., Ogundare, A.A., Shittu, M.R., Akinola, O.O., and Odesanya, K.O. Effects of Process Variables on Physico-Mechanical Properties of Abura (Mitrogyna ciliata) Sawdust Briquettes. Biomass. 2024;4(3):671–86. [CrossRef]
- Orisaleye, J.I., Ogundare, A.A., Oloyede, C.T., Ojolo, S.J., and Jekayinfa, S.O. Effect of preconditioning and die thickness on pelleting of livestock feed. Aust J Multi-Disciplinary Eng. 2024;20(1):13–25. [CrossRef]
- Jekayinfa, S.O., Ola, F.A., Akande, F.B., Adesokan, M.A., and Abdulsalam, I.A. Modification and Performance Evaluation of a Biomass Pelleting Machine. AgriEngineering. 2024;6(3):2214–28. [CrossRef]
- ASTM E871. Standard test method for moisture analysis of particulate wood fuels. American Society for Testing and Materials (ASTM) Philadelphia; 2013.
- Ogunlade, C.A. and Aremu, A.K. Energy consumption Pattern as affected by machine operating parameters in mechanically expressing oil from Pentaclethra macrophylla: Modeling and optimization. Clean Eng Technol. 2021;5:100300. [CrossRef]
- Ogunlade, C.A. and Aremu, A.K. Modeling and optimisation of oil recovery and throughput capacity in mechanically expressing oil from African oil bean (Pentaclethra macrophylla Benth) kernels. J Food Sci Technol. 2020;57(11):4022–31. [CrossRef]
- Ogunlade, C.A. and Aremu, A.K. Influence of processing conditions on some physical characteristics of vegetable oil expressed mechanically from Pentaclethra macrophylla Benth kernels: Response surface approach. J Food Process Eng. 2019;42(2):e12967. [CrossRef]
- EN 14961-2. Solid biofuels-Fuel specifications and classes-Part 2: Wood pellets for non-industrial use. European Union; 2011.
- ASTM E873-82. Standard test method for bulk density of densified particulate biomass fuels. Am Soc Test Mater. 2014;
- Japhet, J.A., Tokan, A., and Muhammad, M.H. Production and characterization of rice husk pellet. Am J Eng Res. 2015;4(12):112–9.
- ASTM D1102. standard test method for ash in wood. ASTM International West Conshohocken; 2013.
- Ismail, B. Ash Content Determination. Food analysis laboratory manual. Springer, Cham; 2017. 117–119 p. [CrossRef]
- Liu, K. Effects of sample size, dry ashing temperature and duration on determination of ash content in algae and other biomass. Algal Res. 2019;40:101486. [CrossRef]
- ASTM E872. Standard test method for volatile matter in the analysis of particulate wood fuels. Annual Book of ASTM Standard, American Society for Testing and Materials. 2013.
- García, R., Pizarro, C., Lavín, A.G., and Bueno, J.L. Biomass proximate analysis using thermogravimetry. Bioresour Technol. 2013;139:1–4. [CrossRef]
- ASTM E870. Standard Test Methods for Analysis of Wood Fuels. American Society for Testing and Materials (ASTM) Philadelphia.; 2019.
- Imran, A.M., Widodo, S., and Irvan, U.R. Correlation of fixed carbon content and calorific value of South Sulawesi Coal, Indonesia. In: IOP Conference Series: Earth and Environmental Science. 2020. p. 012–106. [CrossRef]
- Acar, S., Ayanoglu, A., and Demirbas, A. Determination of higher heating values (HHVs) of biomass fuels. Uluslararasi Yakitlar Yanma Ve Yangin Derg. 2016;(3):1–3.
- Okewole, O.T. and Igbeka, J. Effect of some operating parameters on the performance of a pelleting press. Agric Eng Int CIGR J. 2016;18(1):326–38.
- Jekayinfa, S.O., Abdulsalam, I.A., Ola, F.A., Akande, F.B., and Orisaleye, J.I. Effects of binders and die geometry on quality of densified rice bran using a screw-type laboratory scale pelleting machine. Energy Nexus. 2024;100275. [CrossRef]
- Tarasov, D., Shahi, C., and Leitch, M. Effect of Additives on Wood Pellet Physical and Thermal Characteristics: A Review. ISRN For. 2013;2013:1–6. [CrossRef]
- Tumuluru, J.S. and Wright, C.T. A review on biomass densification technologie for energy application. 2010; [CrossRef]
- Sánchez, E.A., Pasache, M.B., and Garcia, M.E. Development of briquettes from waste wood (sawdust) for use in low-income households in Piura, Peru. In: Proceedings of the World Congress on Engineering. 2014. p. 2–4.
- Ikelle, I.I. and Anyigor, C. Comparative thermal analysis of the properties of coal and corn cob briquettes. IOSR J Appl Chem. 2014;7(6):93–7.
- Čolović, R., Vukmirović, Dj., Matulaitis, R., Bliznikas, S., Uchockis, V., Juškienie, V., et al. Effect of die channel press way length on physical quality of pelleted cattle feed. Food Feed Res. 2010;37(1):1–6.
- Jamradloedluk, J. and Lertsatitthanakorn, C. Influences of Mixing Ratios and Binder Types on Properties of Biomass Pellets. In: Energy Procedia. Elsevier B.V.; 2017. p. 1147–52. [CrossRef]
- González, W.A., López, D., and Pérez, J.F. Biofuel quality analysis of fallen leaf pellets: Effect of moisture and glycerol contents as binders. Renew Energy. 2020;147:1139–50. [CrossRef]
- Iftikhar, M., Asghar, A., Ramzan, N., Sajjadi, B., and Chen, W. yin. Biomass densification: Effect of cow dung on the physicochemical properties of wheat straw and rice husk based biomass pellets. Biomass and Bioenergy. 2019;122:1–16. [CrossRef]
- Ferreira, G., Brito, T.M., Da Silva, J.G.M., Minini, D., Dias Júnior, A.F., Arantes, M.D.C., et al. Wood waste pellets as an alternative for energy generation in the Amazon Region. BioEnergy Res. 2023;16(1):472–83. [CrossRef]
Figure 1.
(a) Orthographic (third angle) view of the pelletizing machine. (b) Exploded views of the machine [7].
Figure 1.
(a) Orthographic (third angle) view of the pelletizing machine. (b) Exploded views of the machine [7].
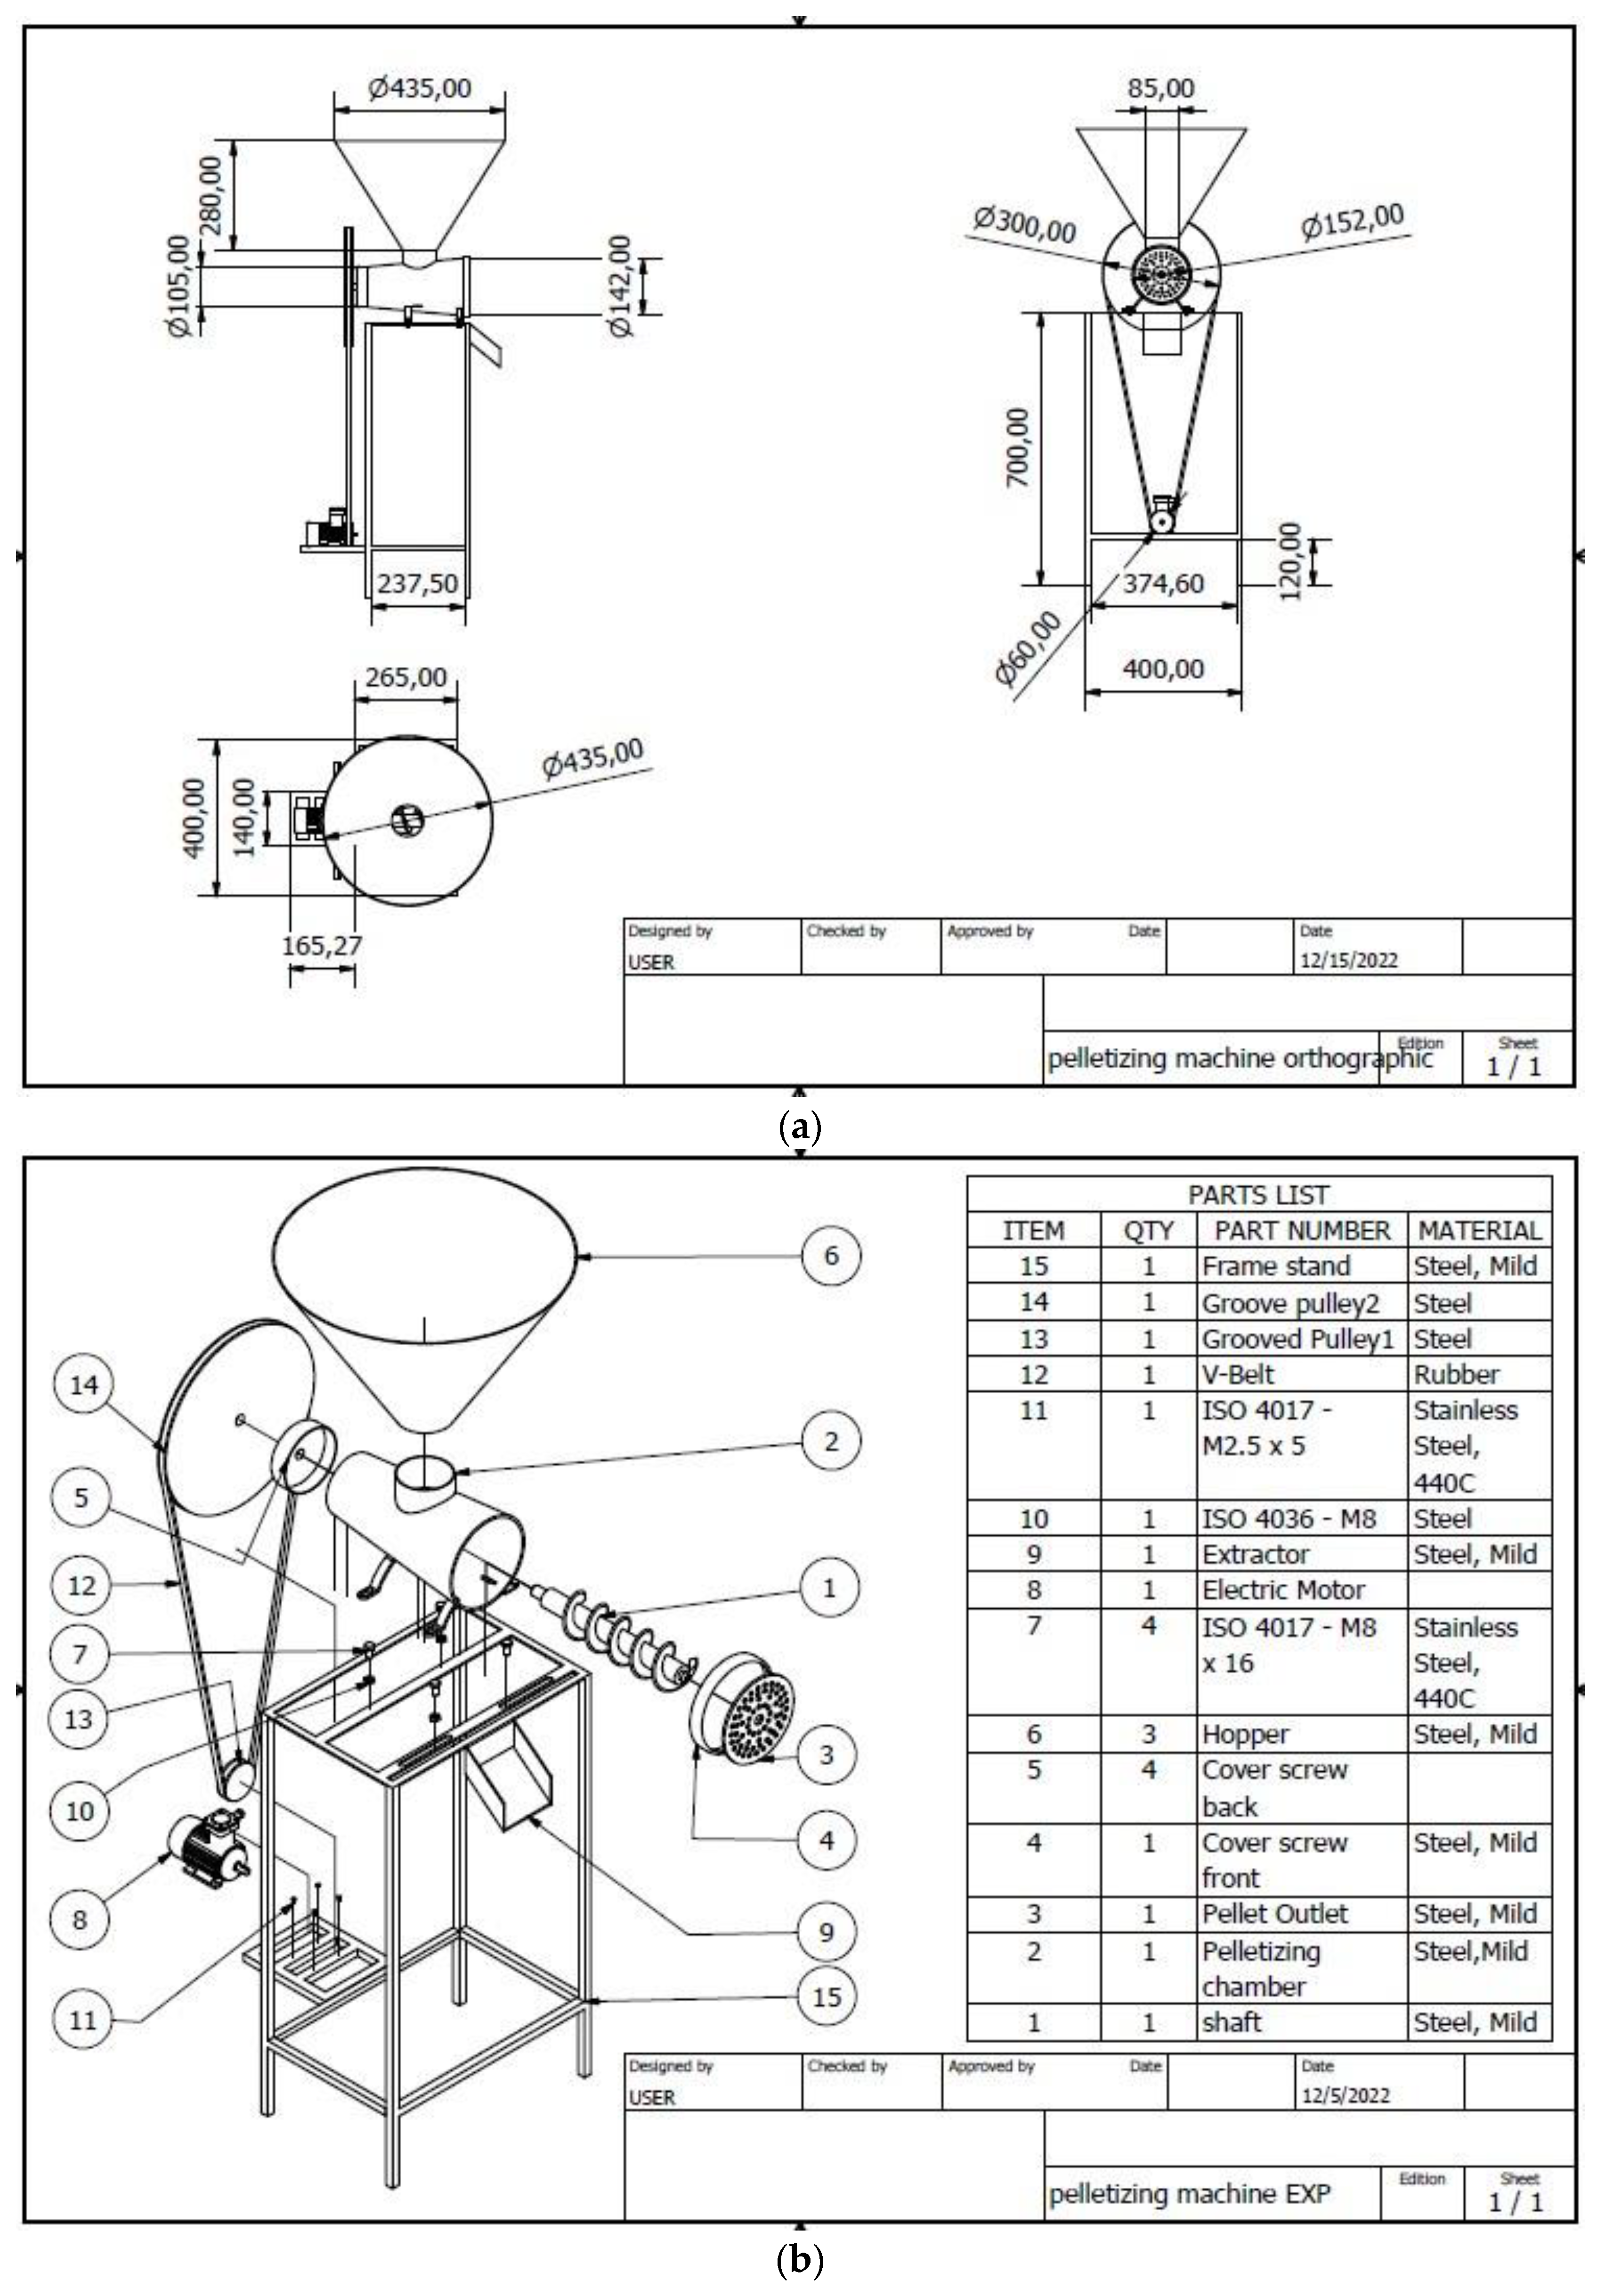
Figure 2.
Bulk density of Cocoa Pod-Husk (CPH) Pellets as affected by: (a) Compression ratio, (b) Additive Content, (c) Moisture content.
Figure 2.
Bulk density of Cocoa Pod-Husk (CPH) Pellets as affected by: (a) Compression ratio, (b) Additive Content, (c) Moisture content.
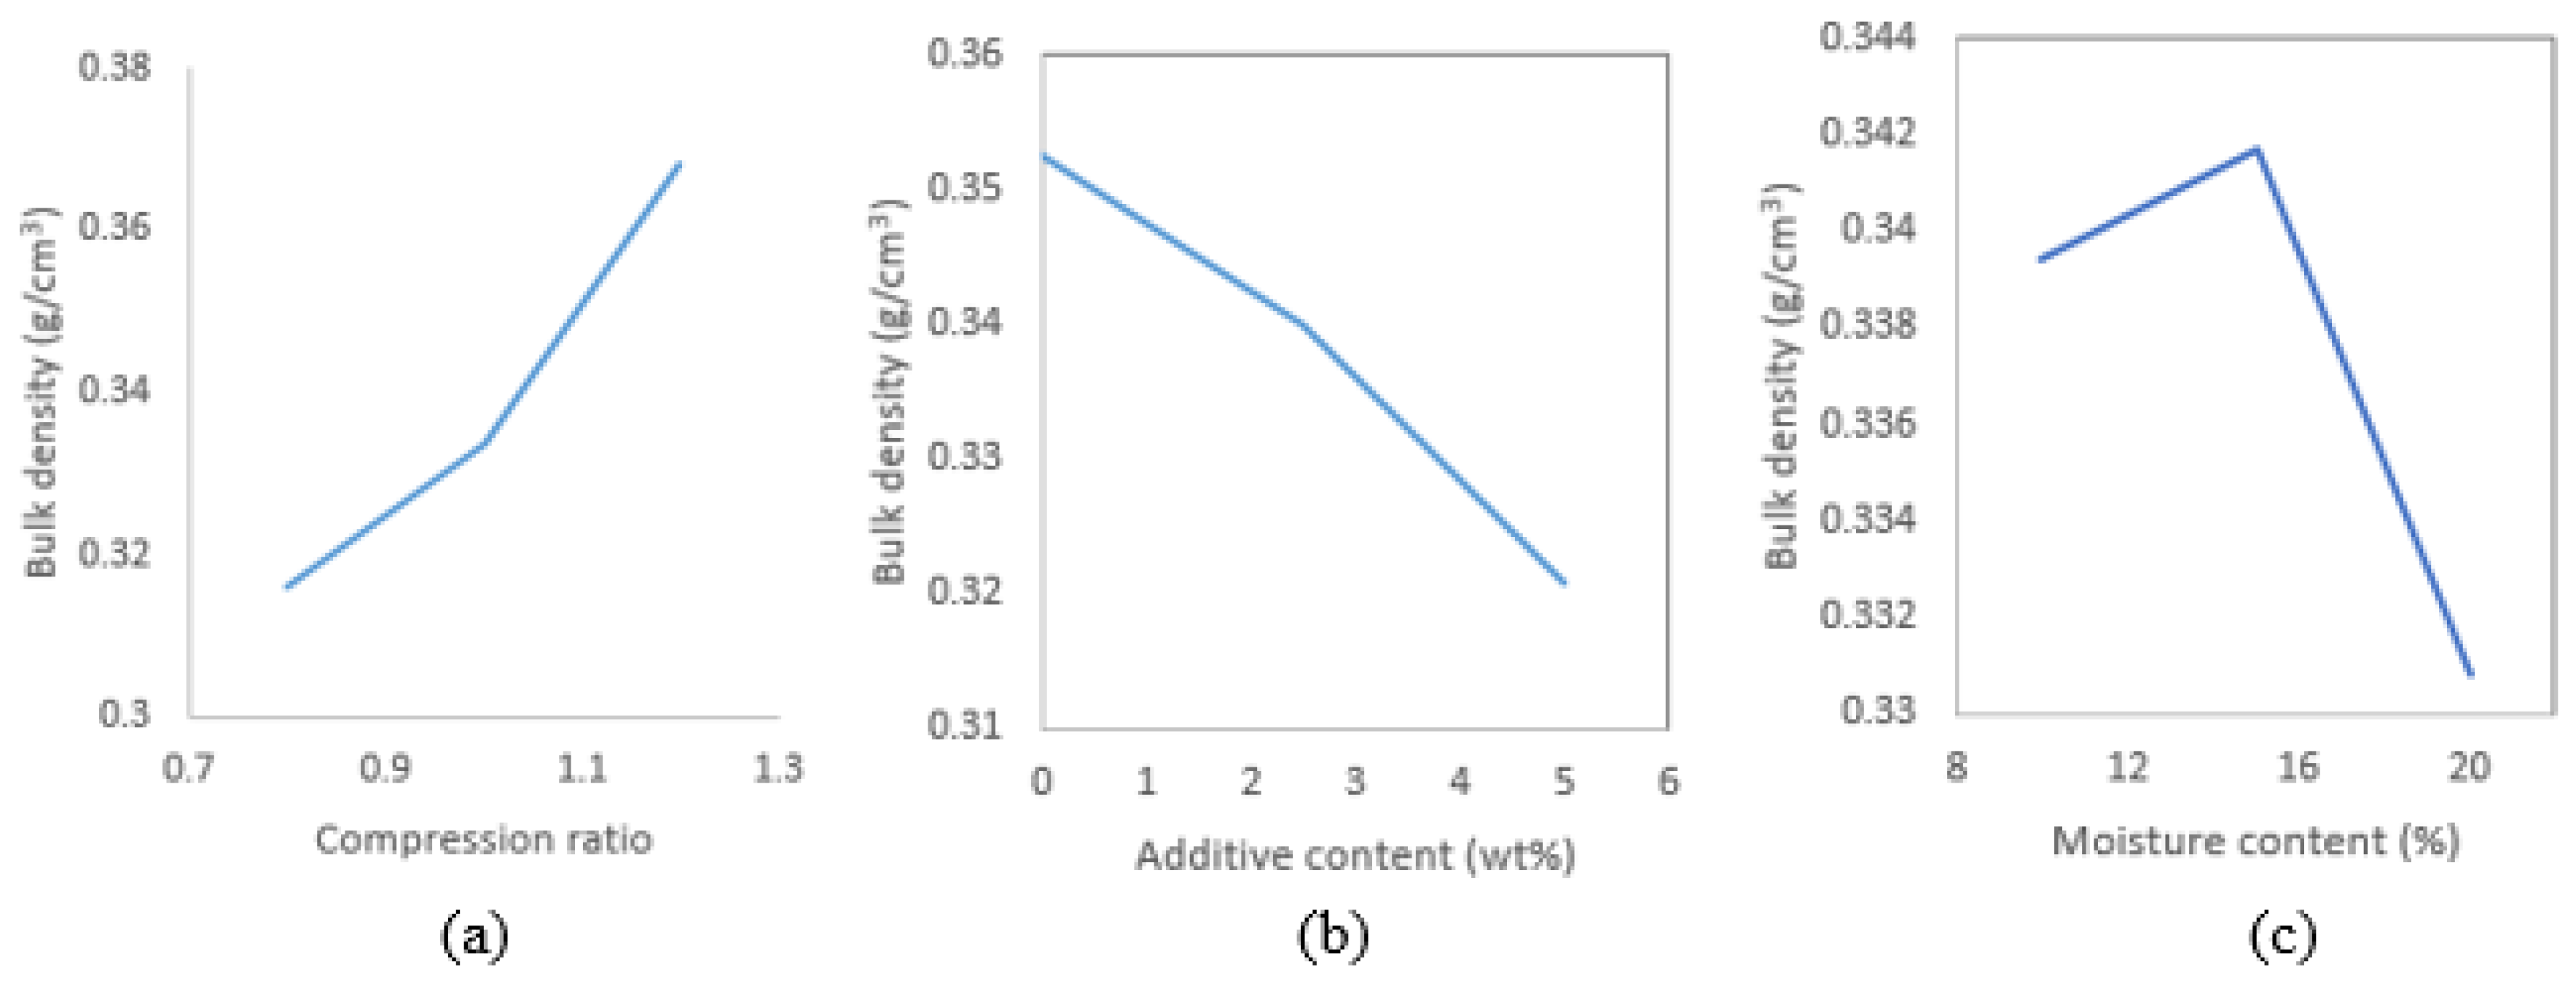
Figure 3.
Effect of Processing Parameters on Cocoa Pod Husk Pellets Proximate Composition; (a) Compression Ratio, (b) Binder.
Figure 3.
Effect of Processing Parameters on Cocoa Pod Husk Pellets Proximate Composition; (a) Compression Ratio, (b) Binder.
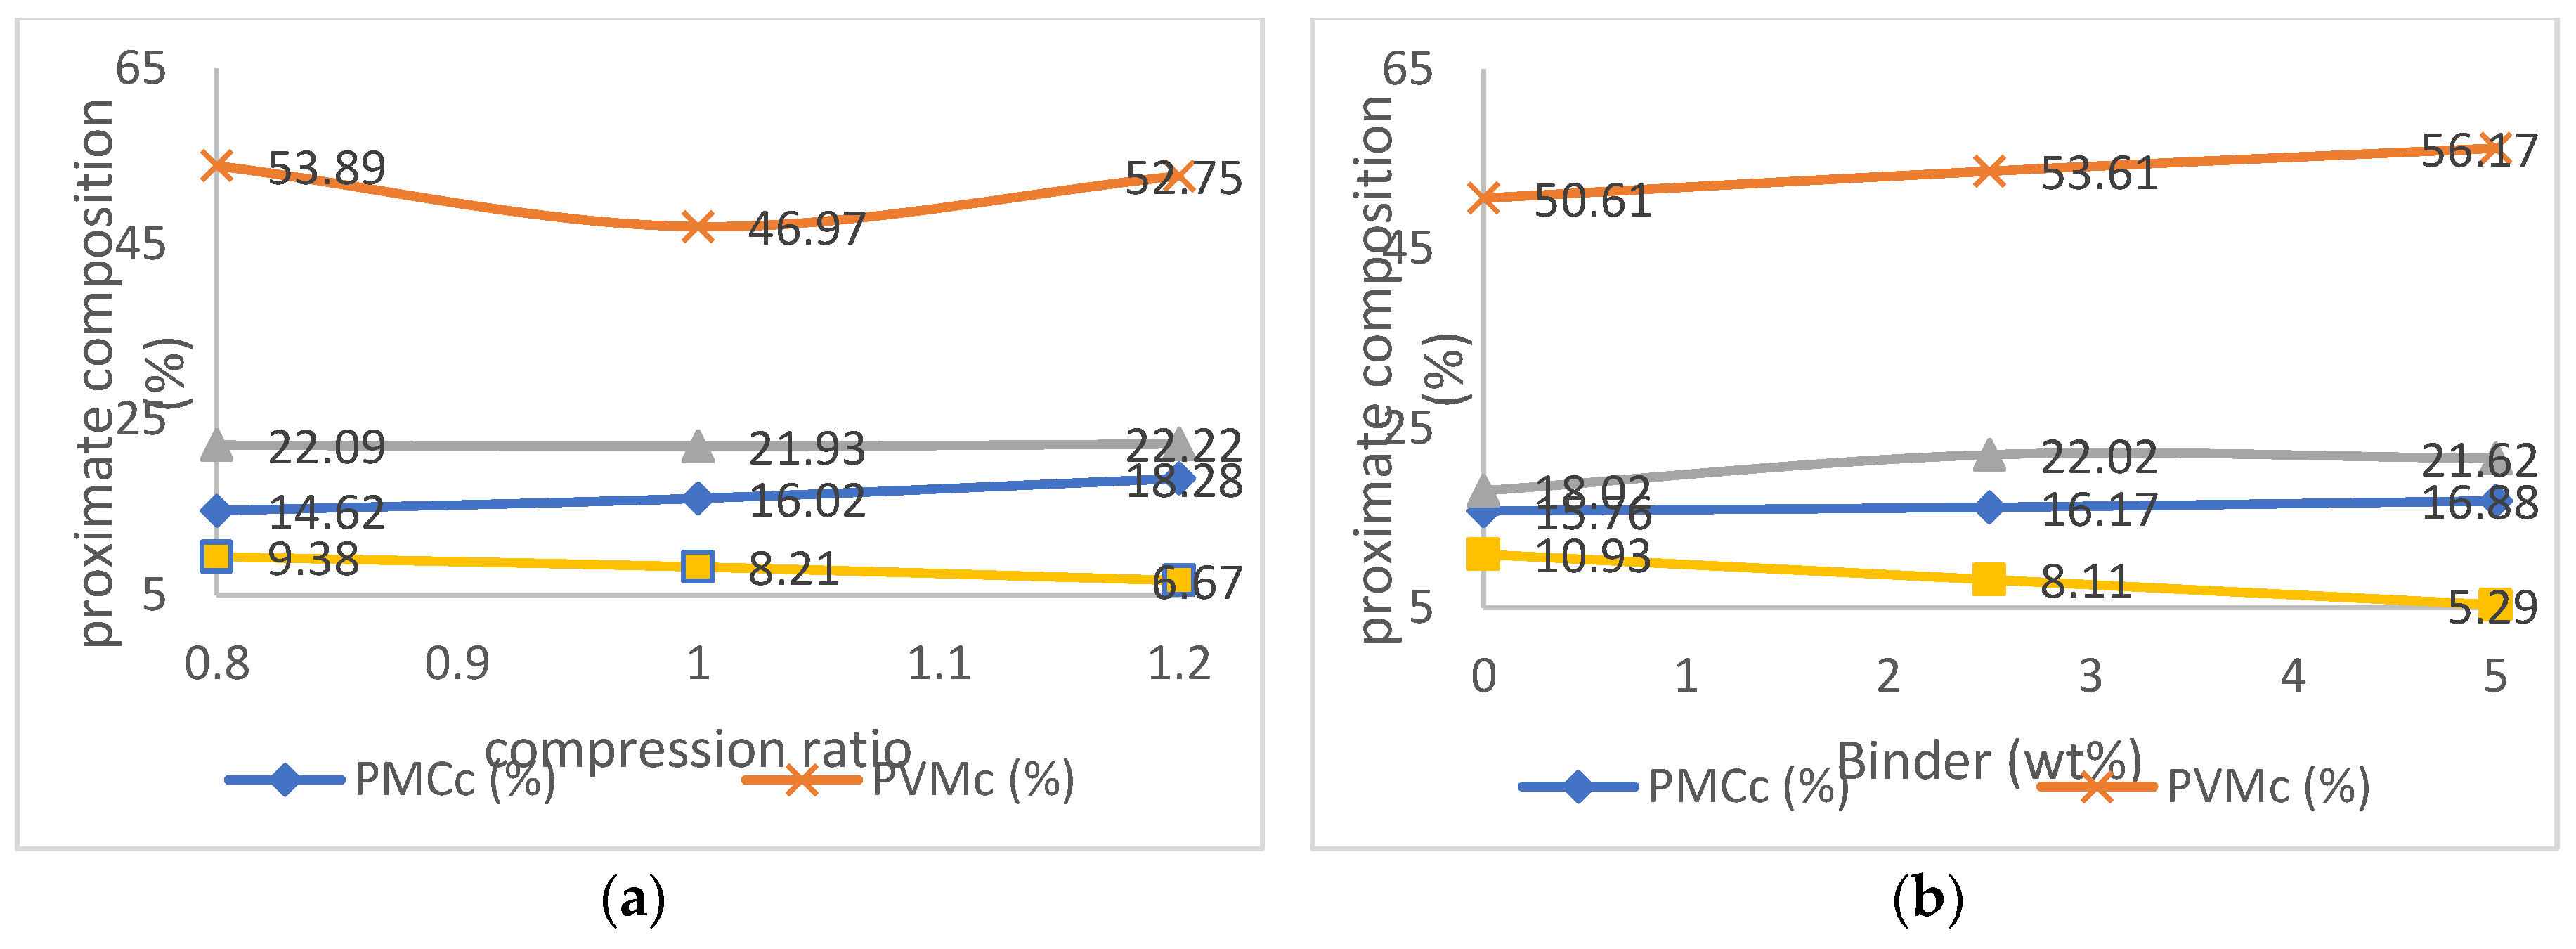
Figure 4.
Effect of Moisture Content on Cocoa Pod Husk Pellets Proximate Composition.
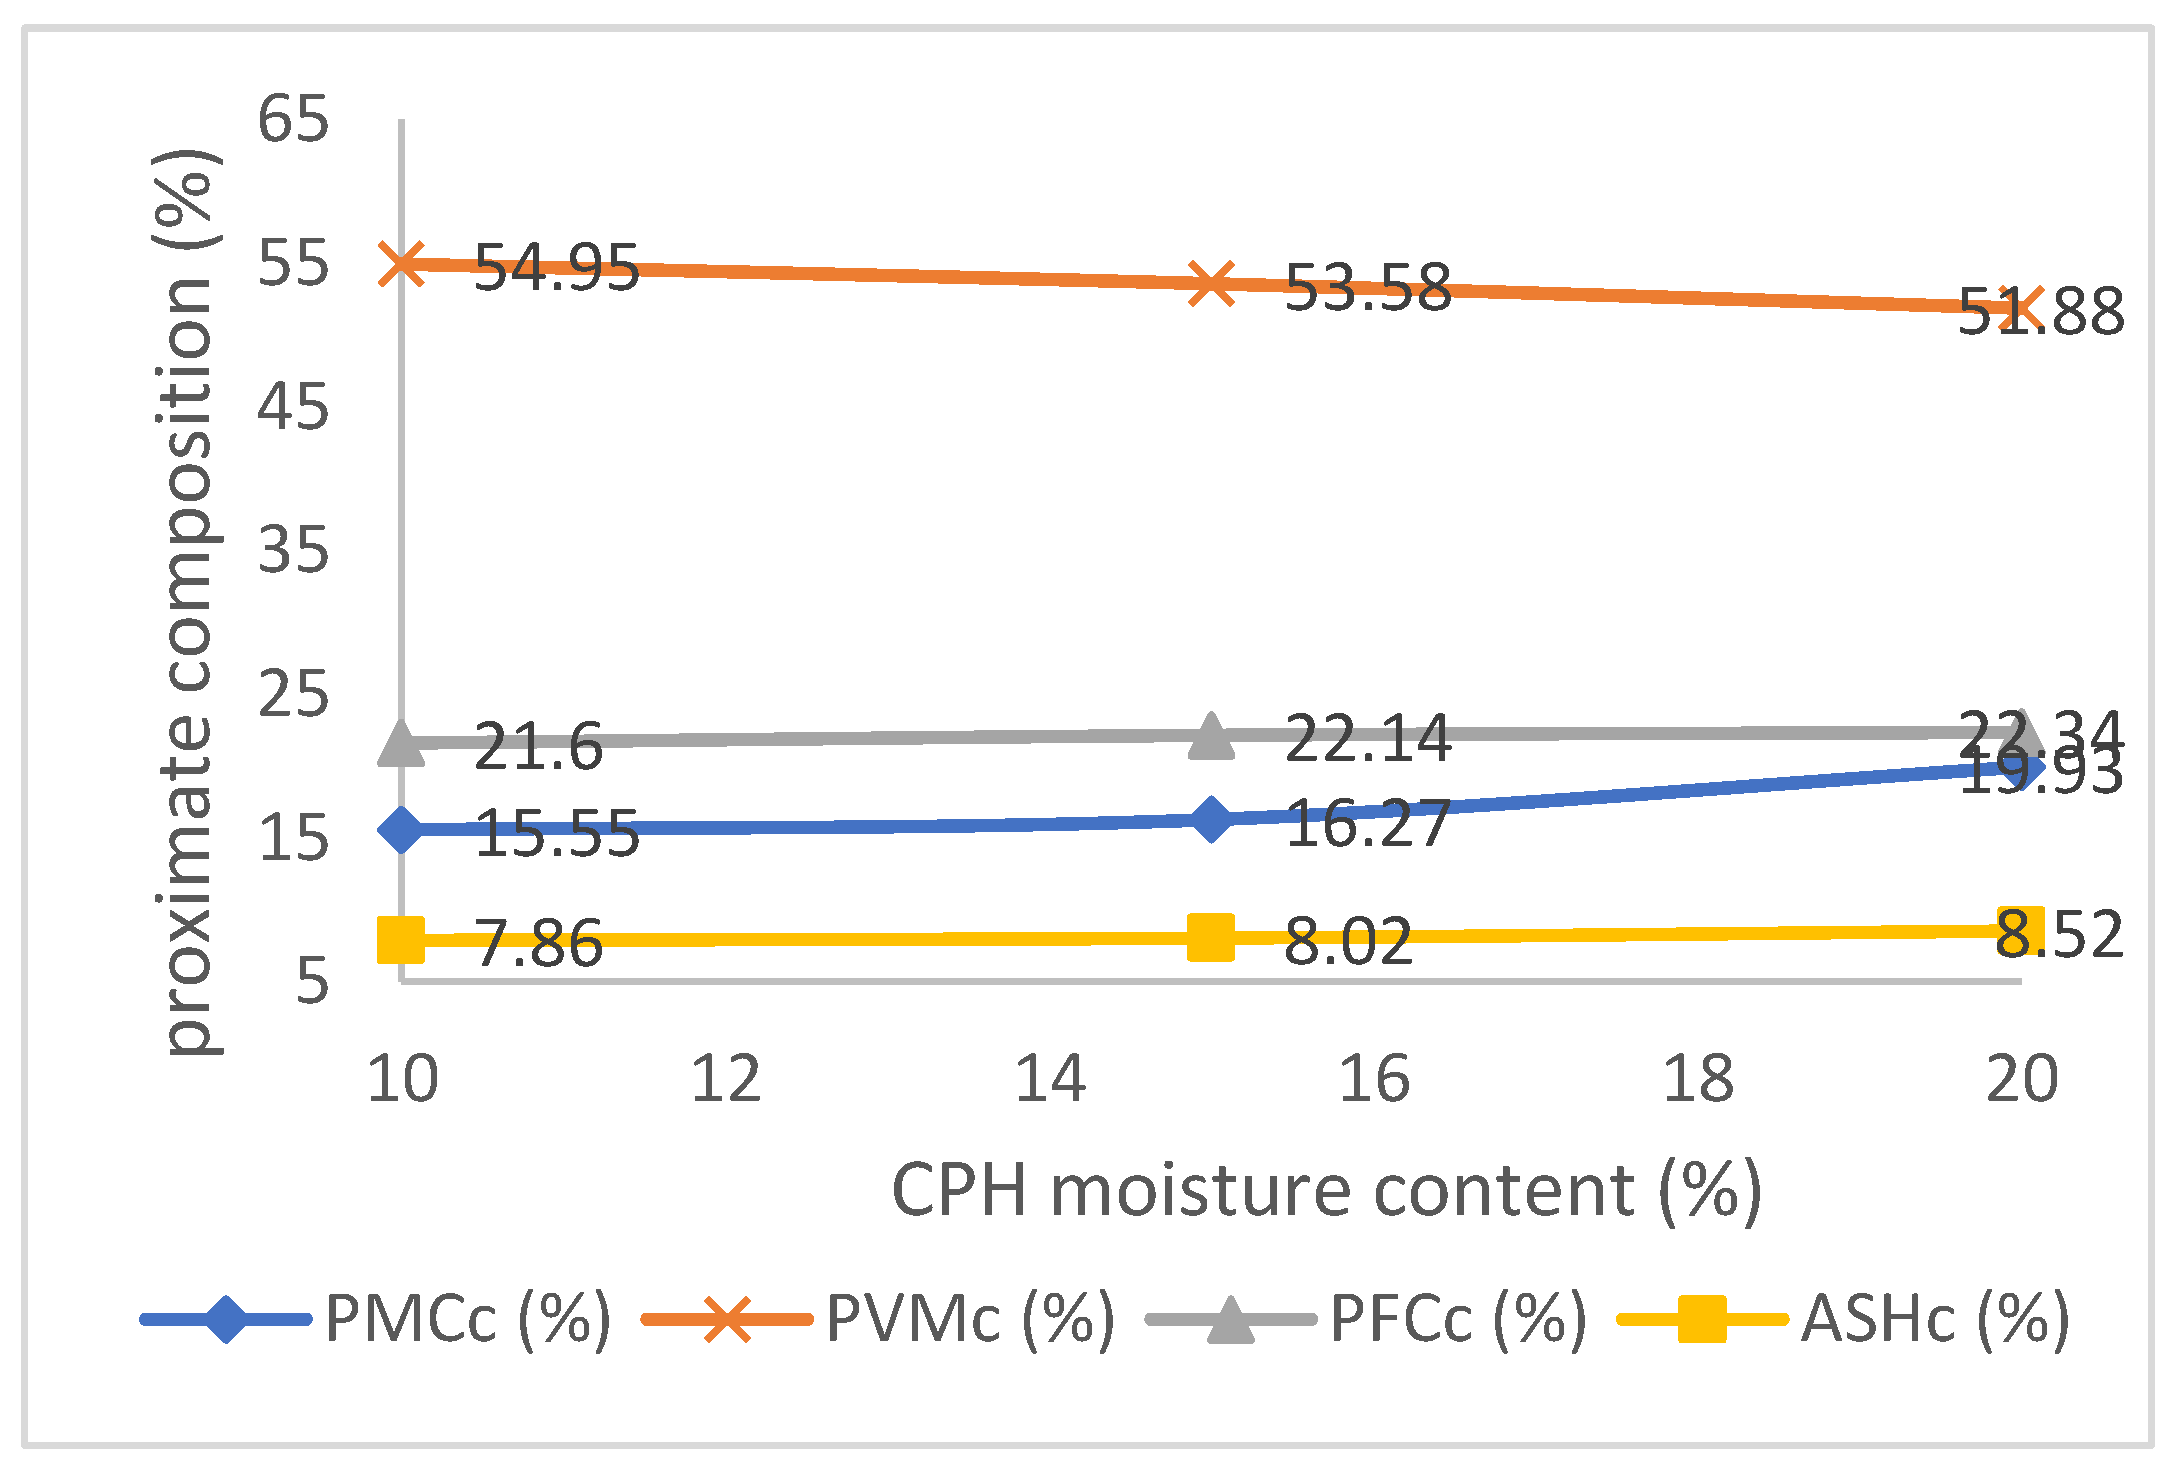
Figure 5.
Effects of (a) compression ratio, (b) binder and (c) moisture content on higher heating value of CPH pellets.
Figure 5.
Effects of (a) compression ratio, (b) binder and (c) moisture content on higher heating value of CPH pellets.
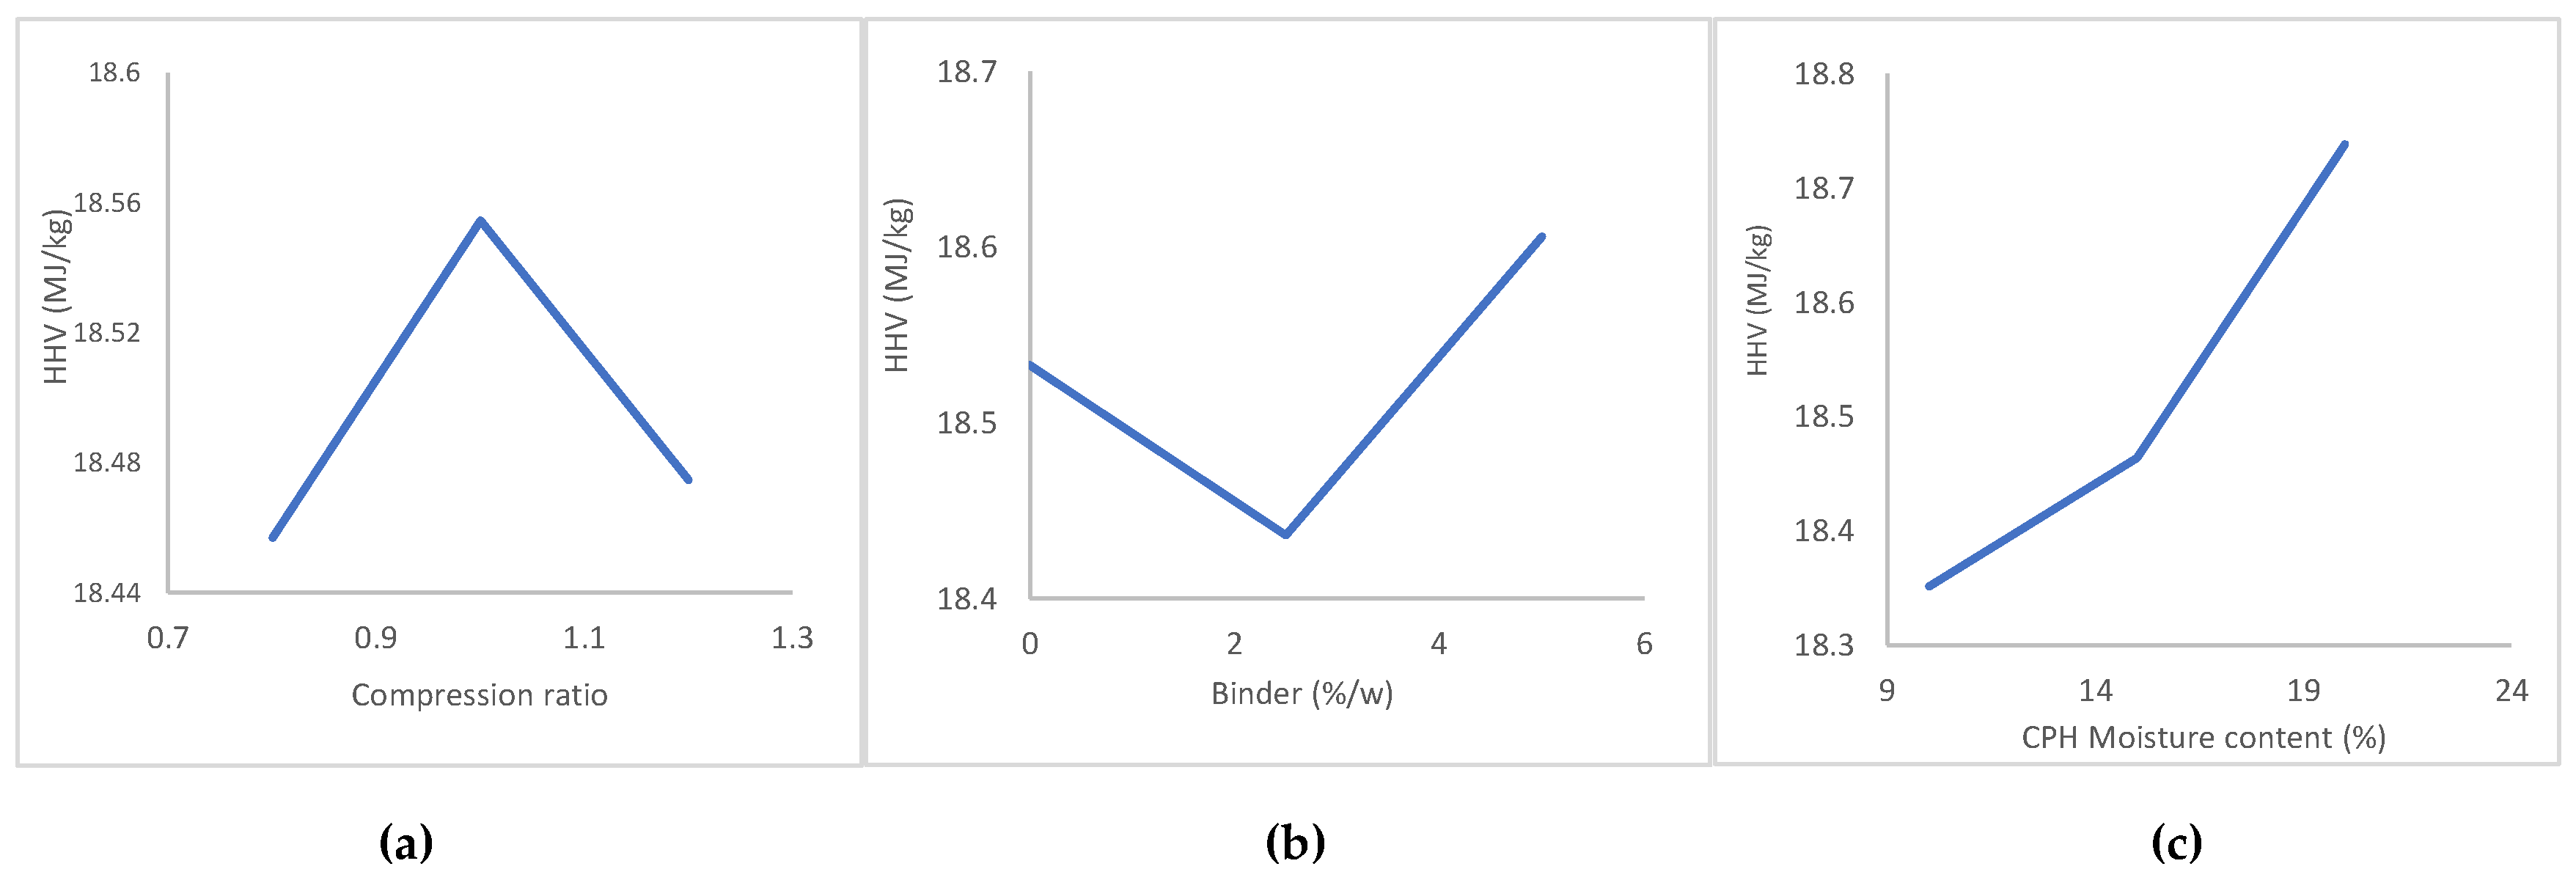

Table 2.
Quality Characteristics of Cocoa Pod Husk Pellet.
| Run | A | B (%/w) | C (%) | BD (g/cm3) | PMC (%) | PVM (%) | PFC (%) | ASH (%) | HHV (MJ/kg) |
|---|---|---|---|---|---|---|---|---|---|
| 1 | 1.2 | 0.0 | 15 | 0.360 | 18.02 | 50.82 | 22.31 | 8.44 | 18.492 |
| 2 | 1.0 | 5.0 | 20 | 0.290 | 16.45 | 55.75 | 21.50 | 5.88 | 18.894 |
| 3 | 1.0 | 0.0 | 10 | 0.337 | 15.50 | 51.74 | 21.85 | 10.45 | 18.402 |
| 4 | 0.8 | 5.0 | 15 | 0.291 | 15.77 | 55.45 | 21.30 | 6.86 | 18.831 |
| 5 | 1.0 | 0.0 | 20 | 0.360 | 16.28 | 48.61 | 22.82 | 11.85 | 18.592 |
| 6 | 1.2 | 2.5 | 10 | 0.409 | 16.67 | 54.14 | 21.25 | 7.44 | 18.284 |
| 7 | 0.8 | 0.0 | 15 | 0.354 | 13.22 | 51.26 | 23.10 | 12.99 | 18.647 |
| 8 | 1.0 | 2.5 | 15 | 0.354 | 16.00 | 53.97 | 22.03 | 8.00 | 18.437 |
| 9 | 1.0 | 2.5 | 15 | 0.323 | 16.13 | 54.52 | 21.94 | 7.41 | 18.419 |
| 10 | 0.8 | 2.5 | 20 | 0.340 | 15.67 | 52.76 | 22.03 | 9.04 | 18.437 |
| 11 | 1.0 | 5.0 | 10 | 0.332 | 16.19 | 57.83 | 21.35 | 4.91 | 18.304 |
| 12 | 1.0 | 2.5 | 15 | 0.340 | 15.60 | 53.41 | 22.00 | 8.94 | 18.431 |
| 13 | 1.2 | 2.5 | 20 | 0.333 | 19.30 | 50.40 | 23.00 | 7.30 | 18.627 |
| 14 | 0.8 | 2.5 | 10 | 0.280 | 13.83 | 56.08 | 21.93 | 8.63 | 18.418 |
| 15 | 1.2 | 5.0 | 15 | 0.370 | 19.12 | 55.63 | 22.33 | 3.49 | 18.496 |
A: compression ratio; B: Percentage binder; C: moisture content; BD: pellet bulk density; PMC: pellet moisture content; PVM: pellet volatile matter; PFC: pellet fixed carbon; ASH: pellet ash content; HHV: pellet higher heating value.
Table 3.
Analysis of variance results for cocoa pod husk pellets bulk density.
| Source | Sum of Squares | df | Mean Square | F-value | p-value | Conclusion |
|---|---|---|---|---|---|---|
| Model | 0.0145 | 6 | 0.0024 | 17.04 | 0.0004 | significant |
| A-CR | 0.0053 | 1 | 0.0053 | 37.65 | 0.0003 | significant |
| B-additive | 0.0020 | 1 | 0.0020 | 14.32 | 0.0054 | significant |
| C-MC | 0.0001 | 1 | 0.0001 | 1.04 | 0.3384 | not significant |
| AB | 0.0013 | 1 | 0.0013 | 9.30 | 0.0158 | significant |
| AC | 0.0046 | 1 | 0.0046 | 32.53 | 0.0005 | significant |
| BC | 0.0011 | 1 | 0.0011 | 7.44 | 0.0260 | significant |
| ABC | 0.0000 | 0 | ||||
| Pure Error | 0.0005 | 2 | 0.0002 | |||
| Cor Total | 0.0157 | 14 | ||||
| Fit Statistics | Std. Dev. | 0.0119 | R² | 0.9274 | ||
| Mean | 0.3382 | Adj. R² | 0.8730 | |||
| C.V.% | 3.52 | Pred. R² | 0.7426 | |||
| Adeq Prec. | 15.2426 |
Table 4.
ANOVA results for cocoa pod husk pellets moisture content.
| Source | Sum of Squares | df | Mean Square | F-value | p-value | |
|---|---|---|---|---|---|---|
| Model | 33.80 | 6 | 5.63 | 12.01 | 0.0013 | Significant |
| A-CR | 26.72 | 1 | 26.72 | 56.93 | < 0.0001 | Significant |
| B-additive | 2.54 | 1 | 2.54 | 5.42 | 0.0483 | Significant |
| C-MC | 3.80 | 1 | 3.80 | 8.09 | 0.0217 | Significant |
| AB | 0.5256 | 1 | 0.5256 | 1.12 | 0.3208 | not significant |
| AC | 0.1560 | 1 | 0.1560 | 0.3325 | 0.5801 | not significant |
| BC | 0.0676 | 1 | 0.0676 | 0.1440 | 0.7142 | not significant |
| ABC | 0.0000 | 0 | ||||
| Pure Error | 0.1526 | 2 | 0.0763 | |||
| Cor Total | 37.56 | 14 | ||||
| Moisture cocoa | Std. Dev. | 0.6851 | R² | 0.9000 | ||
| Mean | 16.25 | Adjusted R² | 0.8251 | |||
| C.V.% | 4.22 | Predicted R² | 0.5232 | |||
| Adeq Precision | 11.6832 | |||||
Table 5.
Analysis of variance result for cocoa pod husk pellets volatile matter.
| Source | Sum of Squares | df | Mean Square | F-value | p-value | Conclusion |
|---|---|---|---|---|---|---|
| Model | 83.61 | 6 | 13.93 | 17.85 | 0.0003 | Significant |
| A-CR | 2.60 | 1 | 2.60 | 3.33 | 0.1055 | not significant |
| B-additive | 61.77 | 1 | 61.77 | 79.11 | < 0.0001 | significant |
| C-MC | 18.82 | 1 | 18.82 | 24.10 | 0.0012 | significant |
| AB | 0.0961 | 1 | 0.0961 | 0.1231 | 0.7348 | not significant |
| AC | 0.0441 | 1 | 0.0441 | 0.0565 | 0.8181 | not significant |
| BC | 0.2756 | 1 | 0.2756 | 0.3530 | 0.5688 | not significant |
| ABC | 0.0000 | 0 | ||||
| Pure Error | 0.6161 | 2 | 0.3080 | |||
| Cor Total | 89.85 | 14 | ||||
| VM cocoa | Std. Dev. | 0.8836 | R² | 0.9305 | ||
| Mean | 53.49 | Adjusted R² | 0.8783 | |||
| C.V.% | 1.65 | Predicted R² | 0.6899 | |||
| Adeq Precision | 14.2882 | |||||
Table 6.
Analysis of variance results for fixed carbon content of cocoa pod husk pellets.
| Source | Sum of Squares | df | Mean Square | F-value | p-value | Conclusion |
|---|---|---|---|---|---|---|
| Model | 4.74 | 9 | 0.5264 | 36.90 | 0.0005 | significant |
| A-CR | 0.0351 | 1 | 0.0351 | 2.46 | 0.1775 | not significant |
| B-additive | 1.62 | 1 | 1.62 | 113.56 | 0.0001 | significant |
| C-MC | 1.10 | 1 | 1.10 | 77.29 | 0.0003 | significant |
| AB | 0.8281 | 1 | 0.8281 | 58.05 | 0.0006 | significant |
| AC | 0.6806 | 1 | 0.6806 | 47.71 | 0.0010 | significant |
| BC | 0.1681 | 1 | 0.1681 | 11.78 | 0.0186 | significant |
| A² | 0.1807 | 1 | 0.1807 | 12.67 | 0.0162 | significant |
| B² | 0.0088 | 1 | 0.0088 | 0.6151 | 0.4684 | not significant |
| C² | 0.0931 | 1 | 0.0931 | 6.52 | 0.0510 | not significant |
| ABC | 0.0000 | 0 | ||||
| Pure Error | 0.0042 | 2 | 0.0021 | |||
| Cor Total | 4.81 | 14 | ||||
| FC cocoa | Std. Dev. | 0.1194 | R² | 0.9852 | ||
| Mean | 22.05 | Adjusted R² | 0.9585 | |||
| C.V.% | 0.5417 | Predicted R² | 0.7747 | |||
| Adeq Precision | 18.8168 | |||||
Table 7.
Analysis of variance (ANOVA) result for cocoa pod husk pellets ash content.
| Source | Sum of Squares | df | Mean Square | F-value | p-value | Conclusion |
|---|---|---|---|---|---|---|
| Model | 79.84 | 6 | 13.31 | 20.90 | 0.0002 | significant |
| A-CR | 14.72 | 1 | 14.72 | 23.12 | 0.0013 | significant |
| B-binder | 63.79 | 1 | 63.79 | 100.21 | < 0.0001 | significant |
| C-MC | 0.8712 | 1 | 0.8712 | 1.37 | 0.2757 | not significant |
| AB | 0.3481 | 1 | 0.3481 | 0.5468 | 0.4807 | not significant |
| AC | 0.0756 | 1 | 0.0756 | 0.1188 | 0.7392 | not significant |
| BC | 0.0462 | 1 | 0.0462 | 0.0726 | 0.7944 | not significant |
| ABC | 0.0000 | 0 | ||||
| Pure Error | 1.19 | 2 | 0.5954 | |||
| Cor Total | 84.94 | 14 | ||||
| Std. Dev. | 0.7979 | R² | 0.9400 | |||
| Mean | 8.11 | Adj. R² | 0.8951 | |||
| C.V.% | 9.84 | Pred. R² | 0.7393 | |||
| Adeq Prec. | 15.3383 | |||||
Table 8.
ANOVA result for HHV of CPH pellets.
| Source | Sum of Squares | df | Mean Square | F-value | p-value | Conclusion |
|---|---|---|---|---|---|---|
| Model | 0.1455 | 9 | 0.0162 | 46.74 | 0.0046 | significant |
| A-CR | 0.0003 | 1 | 0.0003 | 0.9254 | 0.4070 | not significant |
| B-binder | 0.0136 | 1 | 0.0136 | 39.45 | 0.0081 | significant |
| C-MC | 0.0344 | 1 | 0.0344 | 99.32 | 0.0021 | significant |
| AB | 0.0108 | 1 | 0.0108 | 31.35 | 0.0113 | significant |
| AC | 0.0261 | 1 | 0.0261 | 75.58 | 0.0032 | significant |
| BC | 0.0005 | 1 | 0.0005 | 1.35 | 0.3295 | not significant |
| A² | 0.0037 | 1 | 0.0037 | 10.78 | 0.0463 | significant |
| B² | 0.0013 | 1 | 0.0013 | 3.81 | 0.1459 | not significant |
| C² | 0.0016 | 1 | 0.0016 | 4.74 | 0.1177 | not significant |
| ABC | 0.0000 | 0 | ||||
| Pure Error | 0.0002 | 2 | 0.0001 | |||
| Cor Total | 0.1466 | 12 | ||||
| Std. Dev. | 0.0186 | R² | 0.9929 | |||
| Mean | 18.46 | Adjusted R² | 0.9717 | |||
| C.V.% | 0.1008 | Predicted R² | NA⁽¹⁾ | |||
| Adeq Precision | 21.4865 |
Disclaimer/Publisher’s Note: The statements, opinions and data contained in all publications are solely those of the individual author(s) and contributor(s) and not of MDPI and/or the editor(s). MDPI and/or the editor(s) disclaim responsibility for any injury to people or property resulting from any ideas, methods, instructions or products referred to in the content. |
© 2024 by the authors. Licensee MDPI, Basel, Switzerland. This article is an open access article distributed under the terms and conditions of the Creative Commons Attribution (CC BY) license (http://creativecommons.org/licenses/by/4.0/).
Copyright: This open access article is published under a Creative Commons CC BY 4.0 license, which permit the free download, distribution, and reuse, provided that the author and preprint are cited in any reuse.


