
Submitted:
02 May 2025
Posted:
05 May 2025
You are already at the latest version
Abstract
Plant carbon has been used as one of the natural edible colorants, but it must meet the requirements of carbonization conditions and vegetable materials. To evaluate the effects of carbonization conditions on the properties of resulting biochar products from coffee husk, the process parameters were designed by the combinations of heating rate (i.e., 10 and 20°C/min), pyrolysis temperature (i.e., 800 and 850°C) and residence time (i.e., 0, 30 and 60 min) in this work. Based on the thermochemical properties like proximate anal-ysis and thermogravimetric analysis, this lignocellulose-rich biomass is an excellent precursor for producing carbon materials. Although the pore properties of resulting biochar products were not positively related to the carbonization conditions, but the maximal Brunner-Emmett-Teller (BET) surface area of 155.59 m2/g and 354.96 m2/g) were obtained at 850°C for holding 30 min under the heating rates of 10 and 20°C/min, respectively. The data on the observations by the scanning electron microscopy (SEM), energy dispersive X-ray spectroscopy (EDS) and Fourier-transform infrared spectroscopy (FTIR) of coffee husk and resulting biochar were in accordance with the changes on their textures and elemental compositions. Under the proper carbonization conditions, the resulting plant carbon derived from coffee husk had a special feature due to its high values of carbon content (> 90wt%), microporosity (> 70wt%), and BET surface area (> 350 m2/g).
Keywords:
natural edible colorant
; coffee husk
; carbonization
; plant carbon
; pore property
; chemical property
1. Introduction
Coffee may be the most important drink around the world. It has a special flavor (or aroma), black color and biological constituents for beneficial health, thus becoming one of the most traded commodities. However, the coffee by-products, derived from its compositions like skin, parchment, mucilage, pulp and silver [1,2,3,4,5], will be inevitably generated during the coffee cherry processing. Among them, coffee husk is the major solid residue from the coffee bean production, accounting for 30-50wt% of the total coffee bean produced. Due to its richness in lignocellulosic compositions (i.e., hemicellulose, cellulose, lignin) and bioactive/biological constituents (i.e., antioxidants, vitamins, enzymes, lipids, proteins, caffeine), coffee husk posed the potential for a variety of valorization approaches and/or value-added applications, including skincare, organic fertilizers, animal feeds, foods., biofuel, cosmetics and pharmaceuticals. Therefore, several review paper have been published in recent years [6,7,8,9,10,11,12].
Generally, pyrolysis refers to the thermal decomposition of the lignocellulosic sample in an inert atmosphere (i.e., the limited oxygen, or the absence of oxygen). The charcoal (or biochar), bio-oils and non-condensable gases will be formed in the carbonization process. Their corresponding yields and compositions depend on starting sample, heating rate, and temperature and its holding time (or residence time). Regarding the production of biochar products from coffee husk, only few researches were studied in recent years [13,14,15,16,17,18]. Domingues et al. investigated the production of biochar products from coffee husk and other biomasses at 350, 450, and 750°C [13]. The resulting products were characterized to identify agronomic and environmental benefits for the purpose of soil quality enhancement. Schellekens et al. produced the biochar products from five Brazilian agricultural residues (including coffee husk) at different charring temperatures (i.e., 350, 450, and 750°C) and also determined their molecular characterization [14]. Asfaw et al. studied the production of biochar from coffee husk at 750°C for holding 3 hours [15], focusing on its chemical compositions for reusing it as an organic fertilizer. Concerning the reuse of coffee husk-based biochar as an adsorbent in the removal of dye from water [16], Nguyen et al. adopted a slow pyrolysis process at 500°C for holding 2 hours under a heating rate of 10°C/min. More recently, the researches by Ngalani et al. [17] and Setiawan et a. [18] aimed at producing biochar products from coffee husk at relative low pyrolysis temperatures (< 600°C) and reusing them as acid soil amendments. In brief, the carbonization processes of the above-mentioned studies only performed at low-mediate pyrolysis temperatures, and had not focus on the production of resulting biochar products with higher pore properties.
In Taiwan, the natural edible colorants must be in accordance with the regulation (“Sanitation Standards for Natural Edible Colorants”), which was promulgated by the central competent authority (i.e., Ministry of Health and Welfare) under the authority of the Food Safety and Sanitation Act. According to the regulation, plant (or vegetable) carbon, one of the natural edible colorants, must be produced by the carbonization of vegetable materials such as wood, cellulose, peat and coconut and other shells at a temperature of above 800°C. To increase the added value of the biochar product in the commercial market, spent coffee grounds (SCG, one of coffee by-products) were preliminarily carbonized at a heating rate of 10°C/min up to 850°C for holding 30 min in the previous study [19], showing that highly porous biochar can be produced from the carbonization of SCG. In the present study, the proximate analysis, calorific value and thermogravimetric analysis (TGA) of a coffee husk were initially analyzed to be used as a baseline information. Subsequently, the carbonization at high temperature for producing biochar products under various process conditions (i.e., heated at 10 and 20°C/min up to 800 and 850°C by holding 0, 30 and 60 min, respectively) was performed by following the foregoing regulation. The pore properties, textural and chemical characteristics of resulting biochar products were further determined by using nitrogen adsorption/desorption analyzer, scanning electron microscopy (SEM), energy dispersive X-ray spectroscopy (EDS) and Fourier-transform infrared spectroscopy (FTIR). These data were further correlated with the carbonization process conditions.
2. Materials and Methods
2.1. Coffee Husk
Coffee husk used in this work was taken from a local coffee bean manufacturer (Taiwu Township, Pingtung County, Taiwan). As shown in Figure 1, it is a flake with yellow color. This coffee by-product was derived from parchment during the washing and drying processes [1,2,3,4,5]. The biomass sample was dried in an air-circulation oven (set at 105°C) for overnight and then used in all property determinations (except for proximate analysis) and carbonization experiments without pretreatments like shredding and sieving. Due to the fact that it is a characteristic of moisture sorption, the dried coffee husk sample was placed in an another air-circulation oven set at about 60°C.
2.2. Thermochemical Properties and Thermogravimetric Analysis of Coffee Husk
To evaluate the potential for producing plant carbon products from coffee husk, its thermochemical properties and thermogravimetric analysis (TGA) were first determined in the work [20]. We adopted the TGA instrument (Model: TGA-51; Shimadzu Co., Tokyo, Japan) where the dried coffee husk (about 0.2 g) was heated from 25 to 900°C at various heating rates (i.e., 5, 10, 15 and 20°C/min) under an inert atmosphere by passing nitrogen gas with a flowrate of 50 cm3/min. On the other hand, the proximate analysis (including moisture, ash, volatile matter, and fixed carbon) of the biomass sample was also determined by using the Standard Methods of the American Society for Testing and Materials (ASTM). Its calorific value was obtained by an adiabatic bomb calorimeter (Model: CALORIMETER ASSY 6200; Parr Co., Moline, IL, USA). To provide the illustrative contrast, the elemental compositions and oxygen-containing functional groups on the surface of the dried coffee husk sample were also measured, which will be descried in Sec. 2.4.
2.3.Carbonization Experiments
In this work, the carbonization experiments at high temperature (≥ 800°C) were carried out in a vertical fixed-bed furnace with steel-mesh sample holder, which has been described in the previous studies [21,22,23]. The temperature profile was from 25°C (room temperature) to the specified carbonization temperature under a nitrogen (N2) gas (flow rate of 500 cm3/min). To evaluate the effects of carbonization conditions and also meet the official regulation for the requirements of plant carbon production, the process parameters included heating rate, carbonization temperature and holding time, which were designed by the combinations of heating rate (i.e., 10 and 20°C/min), pyrolysis temperature (i.e., 800 and 850°C) and residence time (i.e., 0, 30 and 60 min). Therefore, twelve experiments were totally performed. About 5 g of the dried coffee husk sample was used for each experiment. Post-washing treatment was performed to remove fine particles or residues from the crude biochar products in a 250-ml Erlenmeyer flask. The mixture solution with deionized water (150 ml each batch) was stirred on a hot plate at about 80°C for 30 min, and then decanted (solid-liquid separation) for three times. Finally, the solid fraction was placed into an air-circulation oven at about 105℃ overnight. The resulting plant carbon (i.e., biochar) product was denoted by taking an example. Herein, 1CFSW853 referred to the resulting biochar was produced from the coffee solid waste (CFSW) by a heating rate of 10°C/min up to 850°C for holding 30 min.
2.4. Determinations of Textural and Chemical Characteristics of Coffee Husk-Based Biochar Products
In this work, the pore properties of coffee husk-based biochar products focused on specific surface area, which was determined by an automatic adsorption/desorption instrument (Model: ASAP 2020 Plus; Micromeritics Co., Norcross, GA, USA). In the analysis, the Brunner-Emmett-Teller (BET) theory was initially used to measure the surface area of resulting carbon materials by using nitrogen (N2) molecule as a probe at -196°C [24,25], giving important information on their physical pore structures and the potential for adsorption capacities. Prior to this N2 isotherm analysis, the degassing for heating the sample under vacuum (condition: ≤ 10 μmHg at 200°C for about 10 hours) was performed to remove the moisture and also prevent condensation of vapor. Based on the relative pressure (P/P0) of ranging from 0.05 to 0.30, the BET surface area can be calculated by plotting a linear line with high correlation coefficient values (> 0.995). According the data on the BET surface area values, some resulting biochar products with higher surface area will be further determined to obtain their pore properties, including pore volume and pore size distribution. Herein, the data on micropore surface area and micropore volume were estimated by the t-plot method, which was based on the Harkins & Jura thickness model [24]. In addition, the Barrett–Joyner–Halenda (BJH) equation was used to plot the pore size distribution [24], featuring the mesopore (pore width or diameter: 2 - 50 nm) size range. On the other hand, the porous textures and chemical properties of some resulting biochar products and the coffee husk sample on the surface were observed by the sophisticated instruments, including the scanning electron microscopy (Model: S-3000N; Hitachi Co., Tokyo, Japan), the energy dispersive X-ray spectroscopy (Model: 7021-H; HORIBA Co., Kyoto, Japan), and the Fourier transform infrared spectroscopy (Model: FT/IR-4600, JASCO Co., Tokyo, Japan).
3. Results and Discussion
3.1. Thermochemical Characteristics of Coffee Husk
Table 1 listed the data on the proximate analysis and calorific value of coffee husk. Obviously, this precursor biomass featured high organic (i.e., volatile matter + fixed carbon) and low ash contents on a dry basis, which shall be consistent with its high calorific value (i.e., 19.87 MJ/kg). Based on the thermochemical properties of coffee husk, it will be an excellent precursor for producing carbon materials like biochar under the proper carbonization conditions [26]. To further get its proper pyrolysis or carbonization conditions, the thermal analysis tool was performed to explore the thermal decomposition behaviors of the dried coffee husk by the thermogravimetric analysis (TGA). Figure 2 showed its TGA curves and the derivative thermogravimetry (DTG) curves under four different heating rates (i.e., 5, 10, 15 and 20°C/min). Due to the nonconductive feature of lignocellulosic material [27], it was observed that these curves for all the stages shifted to the right side (higher temperature intervals) as the heating rate was increased from 5 to 20°C/min. As similar to other lignocelluloses, the most significant weigh change ranged from 250°C to 450°C, which referred to the thermal decomposition of lignocellulosic organics (i.e., hemicellulose, cellulose, and lignin). In general, hemicellulose composition will be first decomposed at lower pyrolysis temperature range (250-350°C) with a shoulder peak at about 300°C [28,29]. As compared to hemicellulose, the thermal decomposition (or pyrolysis) of cellulose often takes place in a relatively high temperature range (300-400°C). In contrast to hemicellulose and cellulose, the thermal decomposition stage of lignin occurred over a wider temperature range (300-450°C). The thermal decomposition behaviours of the lignocellulosic components were closely related to their chemical structures. Among them, lignin is the most stable because of its large polymer with a tridimensional structure. The last pyrolysis stage at higher temperatures (> 450°C) referred to char forming for lignocellulose biomass. The process temperature of high than 800°C was adopted in the present study, implying that the resulting biochar will be highly charred, but has a relative lower yield.
3.2. Pore Properties of Resulting Biochar Products
Table 2 summarized the data on the Brunner-Emmett-Teller (BET) surface area of resulting biochar products derived from coffee husk. Table 3 further provided the pore properties of the optimal biochar products (i.e., 1CFSW853 and 2CFSW853) produced at the carbonization conditions of 850°C for holding time of 30 min under 10 and 20°C/min, respectively. To echo the results in Table 2 and Table 3, Figure 3 showed the nitrogen adsorption-desorption isotherms (at - 196°C) of the resulting biochar product with the maximal pore properties (i.e., 2CFSW853). Based on the results in Table 2 and Table 3 and Figure 3, the main findings were addressed as follows:
- Except for the carbonization conditions at 800°C for holding time of 60 min, the data on the BET surface area of resulting biochar products produced at 20°C/min seem to be significantly higher those produced at 10°C/min as seen in Table 2. It will be beneficial for operation cost due to the shorter production time of carbonization process at higher heating rate.
- The data on the BET surface area of resulting biochar products were not consistent with pyrolysis temperature and its holding time. However, the maximal pore properties (i.e., BET surface area values of 155.59 m2/g and 354.96 m2/g) were obtained at the process conditions of 850°C for holding 30 min under the heating rates of 10 and 20°C/min, respectively.
- Figure 3 further showed the nitrogen adsorption-desorption isotherms of the optimal biochar products (i.e., 1CFSW853 and 2CFSW853), indicating that the combinations of Type I isotherm (major) and Type VI isotherm (minor). The former referred to microporous materials, but the latter featured mesoporous materials with the pore size range of 2.0-50.0 nm [24]. By analyzing the data on nitrogen adsorption-desorption isotherms, we can further depict the pore size distribution curves of resulting biochar products using the 2D-NLDFT-HS model for a more accurate description of the textural characteristics [30]. Herein, these curves were not shown, but were observed at the significant micropore at about 1.6 nm.
3.3. Textural and Chemical Characteristics of Resulting Biochar Products
As described above, the resulting biochar products featured the porous structure based on the nitrogen adsorption-desorption isotherms. To observe the morphological texture, some biochar products were performed by the scanning electron microscopy (SEM). Figure 4 provided the SEM images of coffee husk and the optimal plant carbon product (i.e., 2CFSW853) with two magnifications (i.e., ×500 and ×1,000). Obviously, the precursor biomass showed the plant cell wall structure with nonporous texture [31]. By contrast, the resulting biochar product exhibited a porous texture on the smooth and rigid surface. On the other hand, the resulting biochar also displayed the shrinking rod–like structure in the carbon matrix, which could be derived from its vascular organization in the lignocellulosic biomass (i.e., coffee husk) under the severe carbonization.
To note the changes on the elemental compositions of coffee husk and its resulting biochar products, the energy dispersive X-ray spectroscopy (EDS), a common attachment to the SEM [31], was used in this work. As seen and listed in Figure 5, the carbon (C) and oxygen (O) contents (by molar percentage) of dried coffee husk were 47.93 % and 52.02%, respectively. The ratio (i.e., 47.53/52.02 = 0.92) was close to the molar ratio (about 1.0) of cellulose (C6H12O6) in all plants. However, the carbon contents of two optimal plant carbon products (i.e., 1CFSW853 and 2CFSW853) were higher than 90wt%, showing high charring extents during the severe carbonization processes at 850°C for holding 30 min. Meanwhile, the oxygen contents were reduced significantly. The results could be due to the thermal decomposition of lignocelluloses, thus releasing light gases (e.g., H2O, H2, CO, CO2) at higher pyrolysis temperatures and longer holding times.
Figure 6 further depicted various oxygen/hydrogen-containing functional groups of coffee husk (denoted as CFS) and the typical biochar product (i.e., 1CFSW853). According to the data on the functional groups of carbon materials [32,33,34,35], the peak at around 3430 cm-1 should correspond to the hydroxyl (O-H) functional group stretching vibration derived from adsorbed water molecule (H2O) and/or hydrogen-bonded biochar. The peak at about 2920 cm−1 may be attributed to C-H stretching in the biochar product. Furthermore, the peak at about 1643 cm−1 can be due to the oxygen-containing functional groups like C=O, C–O or in-plane vibration of O–H from carboxylic group. The peak at about 1040 cm−1 could correspond to the stretching vibration of C–O group in polysaccharides, or carbohydrates. On the other hand, the peak heights or regions of the biochar product in Figure 6 were significantly reduced when compared to those of coffee husk, which were consistent with the data on the EDS results shown in Figure 5.
4. Conclusions
Coffee husk is one of major by-products during the coffee bean production. Although this biomass poses the potential for producing carbon materials, the limited studies focused on the carbonization processes at higher pyrolysis temperatures and faster heating rates. In the present work, the experiments were performed by the combinations of two heating rates (i.e., 10 and 20°C/min), two pyrolysis temperatures (i.e., 800 and 850°C) and three holding times (i.e., 0, 30 and 60 min). It was found that coffee husk is an excellent precursor for producing carbon materials based on its thermochemical properties like very low ash content. Although the pore properties of resulting biochar products were not positively related to the carbonization conditions, but the maximal Brunner-Emmett-Teller (BET) surface area of 155.59 m2/g and 354.96 m2/g) were obtained at 850°C for holding 30 min under the heating rates of 10 and 20°C/min, respectively. The changes on the textures and elemental compositions were in accordance with the observations by the scanning electron microscopy (SEM), energy dispersive X-ray spectroscopy (EDS) and Fourier-transform infrared spectroscopy (FTIR) of coffee husk and resulting biochar products. In conclusions, the plant carbon derived from coffee husk and produced at the proper carbonization conditions had a special feature due to its high values of carbon content (> 90wt%), microporosity (> 70wt%), and BET surface area (> 350 m2/g). Furthermore, this biochar product could be a value-added specialty, which may be one of natural edible colorants in the market according to the Taiwan’s regulation.
Author Contributions
Conceptualization, W.-T.T. and W.-J.H.; formal analysis, H.-M.M.J., Y.-C.Y., H.-H.T.; data curation, H.-M.M.J., Y.-C.Y.; writing—original draft preparation, W.-T.T.; writing—review and editing, W.-T.T.; supervision, W.-T.T. and W.-J.H.
Funding
This industrial/academic research received the funding from the local government (Pingtung County, Taiwan) under the Small Business Innovation Research (SBIR) Project of 2024.
Institutional Review Board Statement
Not applicable.
Informed Consent Statement
Not applicable.
Data Availability Statement
Data is contained within the article.
Acknowledgments
Sincere appreciation was expressed to acknowledge the National Pingtung University of Science and Technology for their assistances in the scanning electron microscopy (SEM) and the energy-dispersive X-ray spectroscopy (EDS) analyses.
Conflicts of Interest
The authors declare no conflict of interest.
References
- Murthy, P.S.; Naidu, M.M. Sustainable management of coffee industry by-products and value addition—A review. Resour Conserv Recycl 2012, 66, 45–58. [Google Scholar] [CrossRef]
- Hoseini, M.; Cocco, S.; Casucci, C.; Cardelli, V.; Corti, G. Coffee by-products derived resources. A review. Biomass Bioenergy 2021, 148, 106009. [Google Scholar] [CrossRef]
- Sisti, L.; Celli, A.; Totaro, G.; Cinelli, P.; Signori, F.; Lazzeri, A.; Bikaki, M.; Corvini, P.; Ferri, M.; Tassoni, A.; Navarini, L. Monomers, Materials and Energy from Coffee By-Products: A Review. Sustainability 2021, 13, 6921. [Google Scholar] [CrossRef]
- Santos, É.M.D.; Macedo, L.M.D.; Tundisi, L.L.; Ataide, J.A.; Camargo, G.A.; Alves, R.C.; Oliveira, M.B.P.P.; Mazzola, P.G. Coffee by-products in topical formulations: A review. Trends Food Sci Technol 2021, 111, 280–291. [Google Scholar] [CrossRef]
- Pyrzynska, K. Useful extracts from coffee by-products: A brief review. Separations 2024, 11, 334. [Google Scholar] [CrossRef]
- Janissen, B.; Huynh, T. Chemical composition and value-adding applications of coffee industry by-products: A review. Resour Conserv Recycl 2018, 128, 110–117. [Google Scholar] [CrossRef]
- Klingel, T.; Kremer, J.I.; Gottstein, V.; Rajcic de Rezende, T.; Schwarz, S.; Lachenmeier, D.W. A Review of coffee by-products including leaf, flower, cherry, husk, silver skin, and spent grounds as novel foods within the European Union. Foods 2020, 9, 665. [Google Scholar] [CrossRef]
- Sugebo, B. A review on enhanced biofuel production from coffee by-products using different enhancement techniques. Mater Renew Sustain Energy 2022, 11, 91–103. [Google Scholar] [CrossRef]
- Mora-Villalobos, J.A.; Aguilar, F.; Carballo-Arce, A.F.; José-Roberto Vega-Baudrit, J.R.; Trimino-Vazquez, H.; Villegas-Peñaranda, L.R.; Stöbener, A.; Eixenberger, D.; Bubenheim, P.; Sandoval-Barrantes, M.; Liese, A. Tropical agroindustrial biowaste revalorization through integrative biorefineries—review part I: coffee and palm oil by-products. Biomass Conv Bioref 2023, 13, 1469–1487. [Google Scholar] [CrossRef]
- Rodrigues, R.; Oliveira, M.B.P.P.; Alves, R.C. Chlorogenic acids and caffeine from coffee by-products: A review on skincare applications. Cosmetics 2023, 10, 12. [Google Scholar] [CrossRef]
- Machado, M.; Ferreira, H.; Oliveira, M.B.P.P.; Alves, R.C. Coffee by-products: An underexplored source of prebiotic ingredients. Crit Rev Food Sci Nutr 2024, 64(20), 7181–7200. [Google Scholar] [CrossRef]
- Castro-Díaz, R.; Silva-Beltrán, N.P.; Gámez-Meza, N.; Calderón, K. The Antimicrobial effects of coffee and by-products and their potential applications in healthcare and agricultural sectors: A state-of-art review. Microorganisms 2025, 13, 215. [Google Scholar] [CrossRef] [PubMed]
- Domingues, R.R.; Trugilho, P.F.; Silva, C.A.; Melo, I.C.N.Ad.; Melo, L.C.A.; Magriotis, Z.M.; Sannchez-Monedero, M.A. Properties of biochar derived from wood and high-nutrient biomasses with the aim of agronomic and environmental benefits. PLoS ONE 2017, 12(5), e0176884. [Google Scholar] [CrossRef]
- Schellekens, J.; Silva, C.A.; Buurman, P.; Rittl, T.F.; Domingues, R.R.; Justi, M.; Vidal-Torrado, P.; Trugilho,P. F. Molecular characterization of biochar from five Brazilian agricultural residues obtained at different charring temperatures. J Anal Appl Pyrolysis 2018, 130, 106–117. [Google Scholar] [CrossRef]
- Asfaw, E.; Nebiyu, A.; Bekele, E.; Ahmed, M.; Astatkie, T. Coffee-husk biochar application increased AMF root colonization, P accumulation, N2 fixation, and yield of soybean grown in a tropical Nitisol, southwest Ethiopia. J Plant Nutr Soil Sci 2019, 181, 419–428. [Google Scholar] [CrossRef]
- Nguyen, X.C.; Nguyen, T.T.H.; Nguyen,T. H.C.; Le, Q.V.; Vo, T.Y.B.; Tran, T.C.P.; La, D.D.; Kumar, G.; Nguyen, V.K.; Chang, S.W.; Chung, W.J.; Nguyen, D.D. Sustainable carbonaceous biochar adsorbents derived from agro-wastes and invasive plants for cation dye adsorption from water. Chemosphere 2021, 282, 131009. [Google Scholar] [CrossRef] [PubMed]
- Ngalani, G.P.; Ondo, J.A.; Njimou, J.R.; Njiki, C.P.N.; Prudent, P.; Ngameni, E. Effect of coffee husk and cocoa pods biochar on phosphorus fixation and release processes in acid soils from West Cameroon. Soil Use Manag 2023, 39(2), 817–832. [Google Scholar]
- Setiawan, A.; Nurjannah, S.; Riskina, S.; Fona, Z. ; Muhammad; Drewery, M.; Kennedy, E.M.; Stockenhuber, M. Understanding the thermal and physical properties of biochar derived from pre-washed arabica coffee agroindustry residues. Bioenergy Res, 2025; 18, 16. [Google Scholar]
- Lee, Y.-R.; Huang, H.-L.; Tsai, C.-H.; Tsai, W.-T. Valorization of coffee residue from convenience store and retail mass-selling store for producing highly porous carbon materials and Taiwan perspectives. Energies 2024, 17, 683. [Google Scholar] [CrossRef]
- Mosek, O.; Johnston, C.T. Thermal analysis for biochar characterisation. In Biochar: A Guide to Analytical Methods. Singh, B.; Camps-Arbestain, M.; Lehmann, J., Eds.; CRC Press, Boca Raton (FL, USA), 2017; pp. 283–296.
- Tsai, W.T.; Huang, P.C. Characterization of acid-leaching cocoa pod husk (CPH) and its resulting activated carbon. Biomass Convers Biorefin 2018, 8, 521–528. [Google Scholar] [CrossRef]
- Tsai, W.T.; Jiang, T.J. Mesoporous activated carbon produced from coconut shell using a single-step physical activation process. Biomass Convers Biorefin 2018, 8, 711–718. [Google Scholar] [CrossRef]
- Tsai, W.T.; Hsu, C.H.; Lin, Y.Q.; Tsai, C.H.; Chen, W.S.; Chang, Y.-T. Enhancing the pore properties and adsorption performance of cocoa pod husk (CPH)-derived biochars via post-acid treatment. Processes 2020, 8, 144. [Google Scholar] [CrossRef]
- Condon, J.B. Surface Area and Porosity Determinations by Physisorption: Measurements and Theory; Elsevier: Amsterdam, The Netherlands, 2006. [Google Scholar]
- Lowell, S.; Shields, J.E.; Thomas, M.A.; Thommes, M. Characterization of Porous Solids and Powders: Surface Area, Pore Size and Density. Springer: Dordrecht, Netherlands, 2006.
- Bansal, R.C.; Donnet, J.B.; Stoeckli, F. Active Carbon. Marcel Dekker: New York, 1988.
- Chen, D.; Cen, K.; Zhuang, X.; Gan, Z.; Zhou, J.; Zhang, Y.; Zhang, H. Insight into biomass pyrolysis mechanism based on cellulose, hemicellulose, and lignin: Evolution of volatiles and kinetics, elucidation of reaction pathways, and characterization of gas, biochar and bio-oil. Combust Flame 2022, 242, 112142. [Google Scholar] [CrossRef]
- Yang, H.; Yan, R.; Chen, H.; Lee, D.H.; Zheng, C. Characteristics of hemicellulose, cellulose and lignin pyrolysis. Fuel 2007, 86, 1781–1788. [Google Scholar] [CrossRef]
- El-Sayed, S.A.; Khass, T.M.; Mostafa, M.E. Thermal degradation behaviour and chemical kinetic characteristics of biomass pyrolysis using TG/DTG/DTA techniques. Biomass Conv. Bioref 2024, 14, 17779–17803. [Google Scholar] [CrossRef]
- Jagiello, J.; Castro-Gutierrez, J.; Canevesi, R.L.S.; Celzard, A.; Fierro, V. Comprehensive analysis of hierarchical porous carbons using a dual-shape 2D-NLDFT model with an adjustable slit-cylinder pore shape Boundary. ACS Appl Mater Interfaces 2021, 13(41), 49472–49481. [Google Scholar] [CrossRef]
- Joseph, S.D.; Munroe, P.R. Application of scanning electron microscopy to the analysis of biochar-related materials. In Biochar: A Guide to Analytical Methods. Singh, B.; Camps-Arbestain, M.; Lehmann, J., Eds.; CRC Press, Boca Raton (FL, USA), 2017; pp. 272–282.
- Li, L.; Yao, X.; Li, H.; Liu, Z.; Ma, W.; Liang, X. Thermal stability of oxygen-containing functional groups on activated carbon surfaces in a thermal oxidative environment. J Chem Eng Jpn 2004, 47(1), 21–27. [Google Scholar] [CrossRef]
- Islam, M.S.; Ang, B.C.; Gharehkhani, S.; Afifi, A.B.M. Adsorption capability of activated carbon synthesized from coconut shell. Carbon Lett 2016, 20, 1–9. [Google Scholar] [CrossRef]
- Johnston, C.T. Biochar analysis by Fourier-transform infra-red spectroscopy. In Biochar: A Guide to Analytical Methods. Singh, B.; Camps-Arbestain, M.; Lehmann, J., Eds.; CRC Press, Boca Raton (FL, USA), 2017; pp. 199–228.
- Qiu, C.; Jiang, L.; Gao, Y.; Sheng, L. Effects of oxygen-containing functional groups on carbon materials in supercapacitors: A review. Mater Des 2023, 230, 111952. [Google Scholar] [CrossRef]
Figure 1.
Coffee husk used in this work.
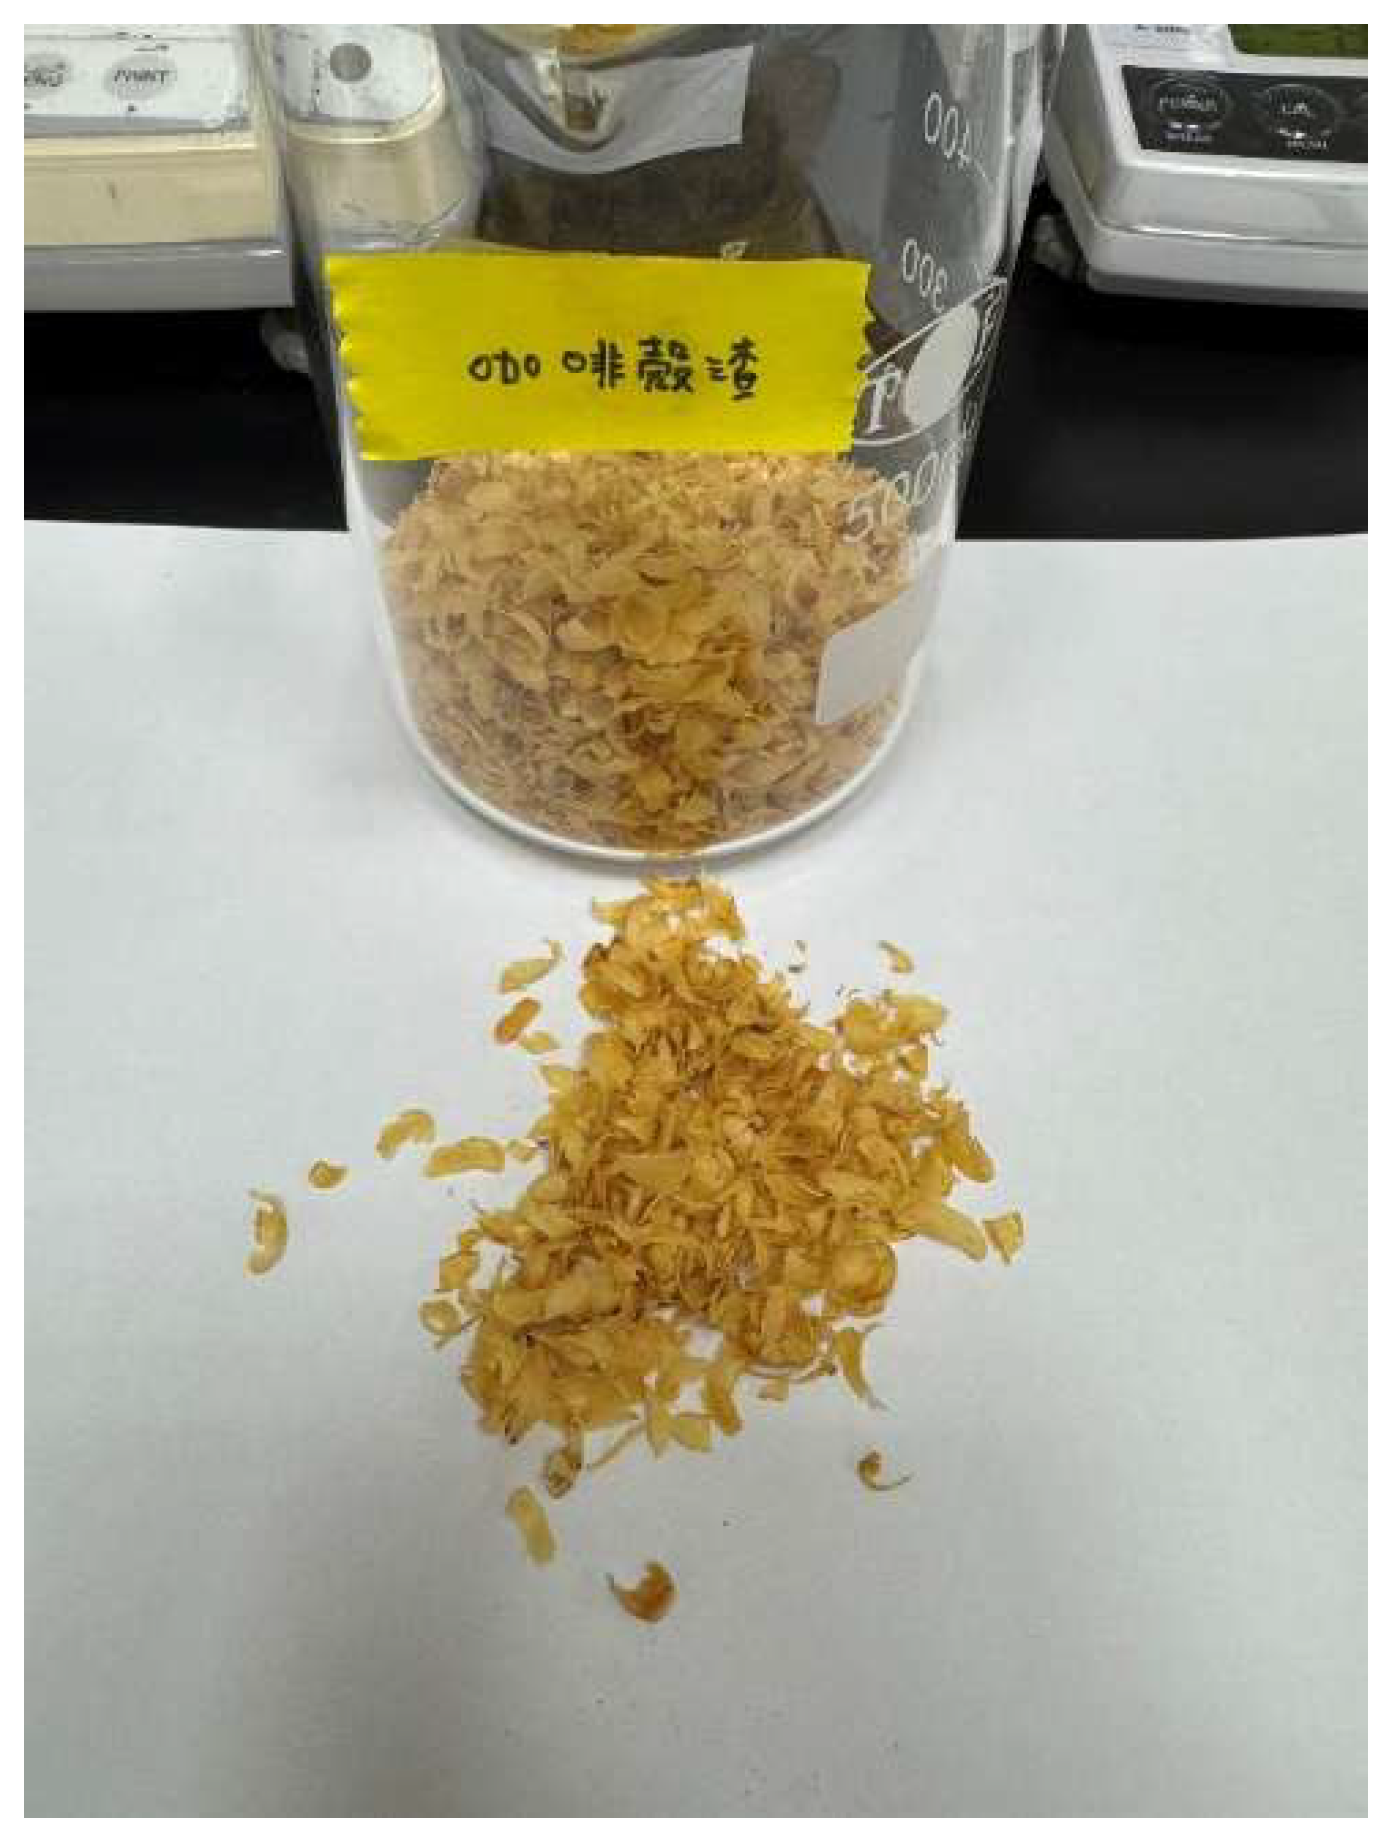
Figure 2.
(a) Thermogravimetric analysis curves of coffee husk and (b) its derivative thermogravimetry (TGA/DTG) curves at the heating rates of 5, 10, 15 and 20°C/min.
Figure 2.
(a) Thermogravimetric analysis curves of coffee husk and (b) its derivative thermogravimetry (TGA/DTG) curves at the heating rates of 5, 10, 15 and 20°C/min.
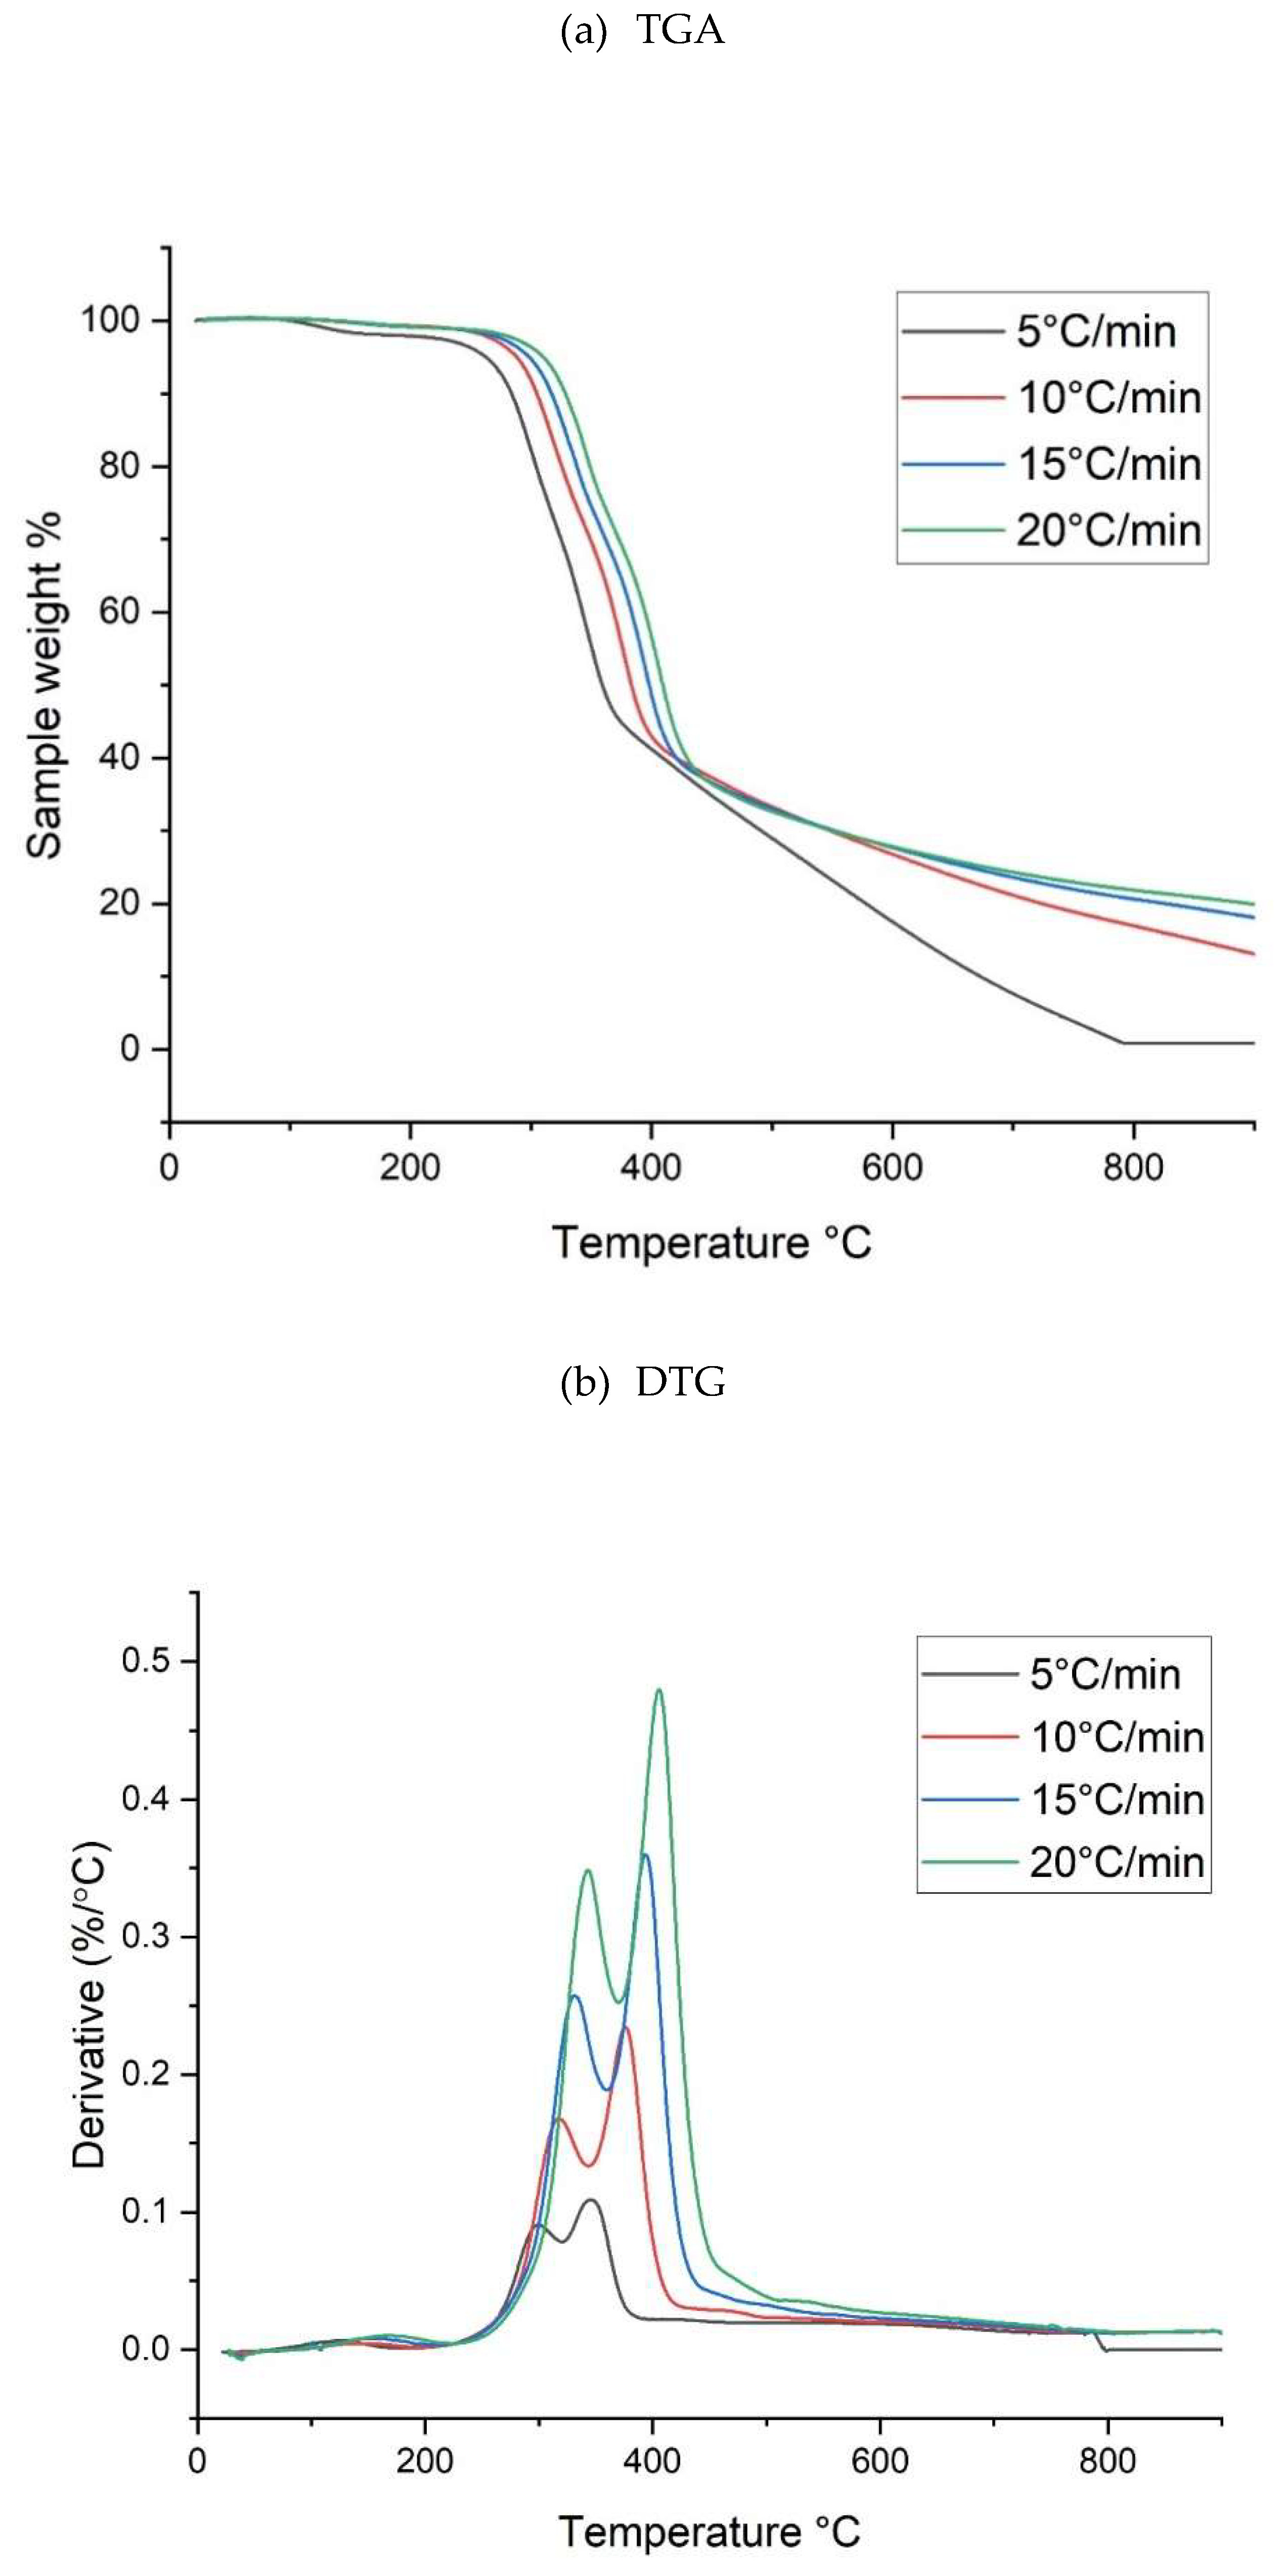
Figure 3.
N2 adsorption-desorption isotherms of optimal plant carbon products (i.e., 1CFSW853 and 2CFSW853).
Figure 3.
N2 adsorption-desorption isotherms of optimal plant carbon products (i.e., 1CFSW853 and 2CFSW853).
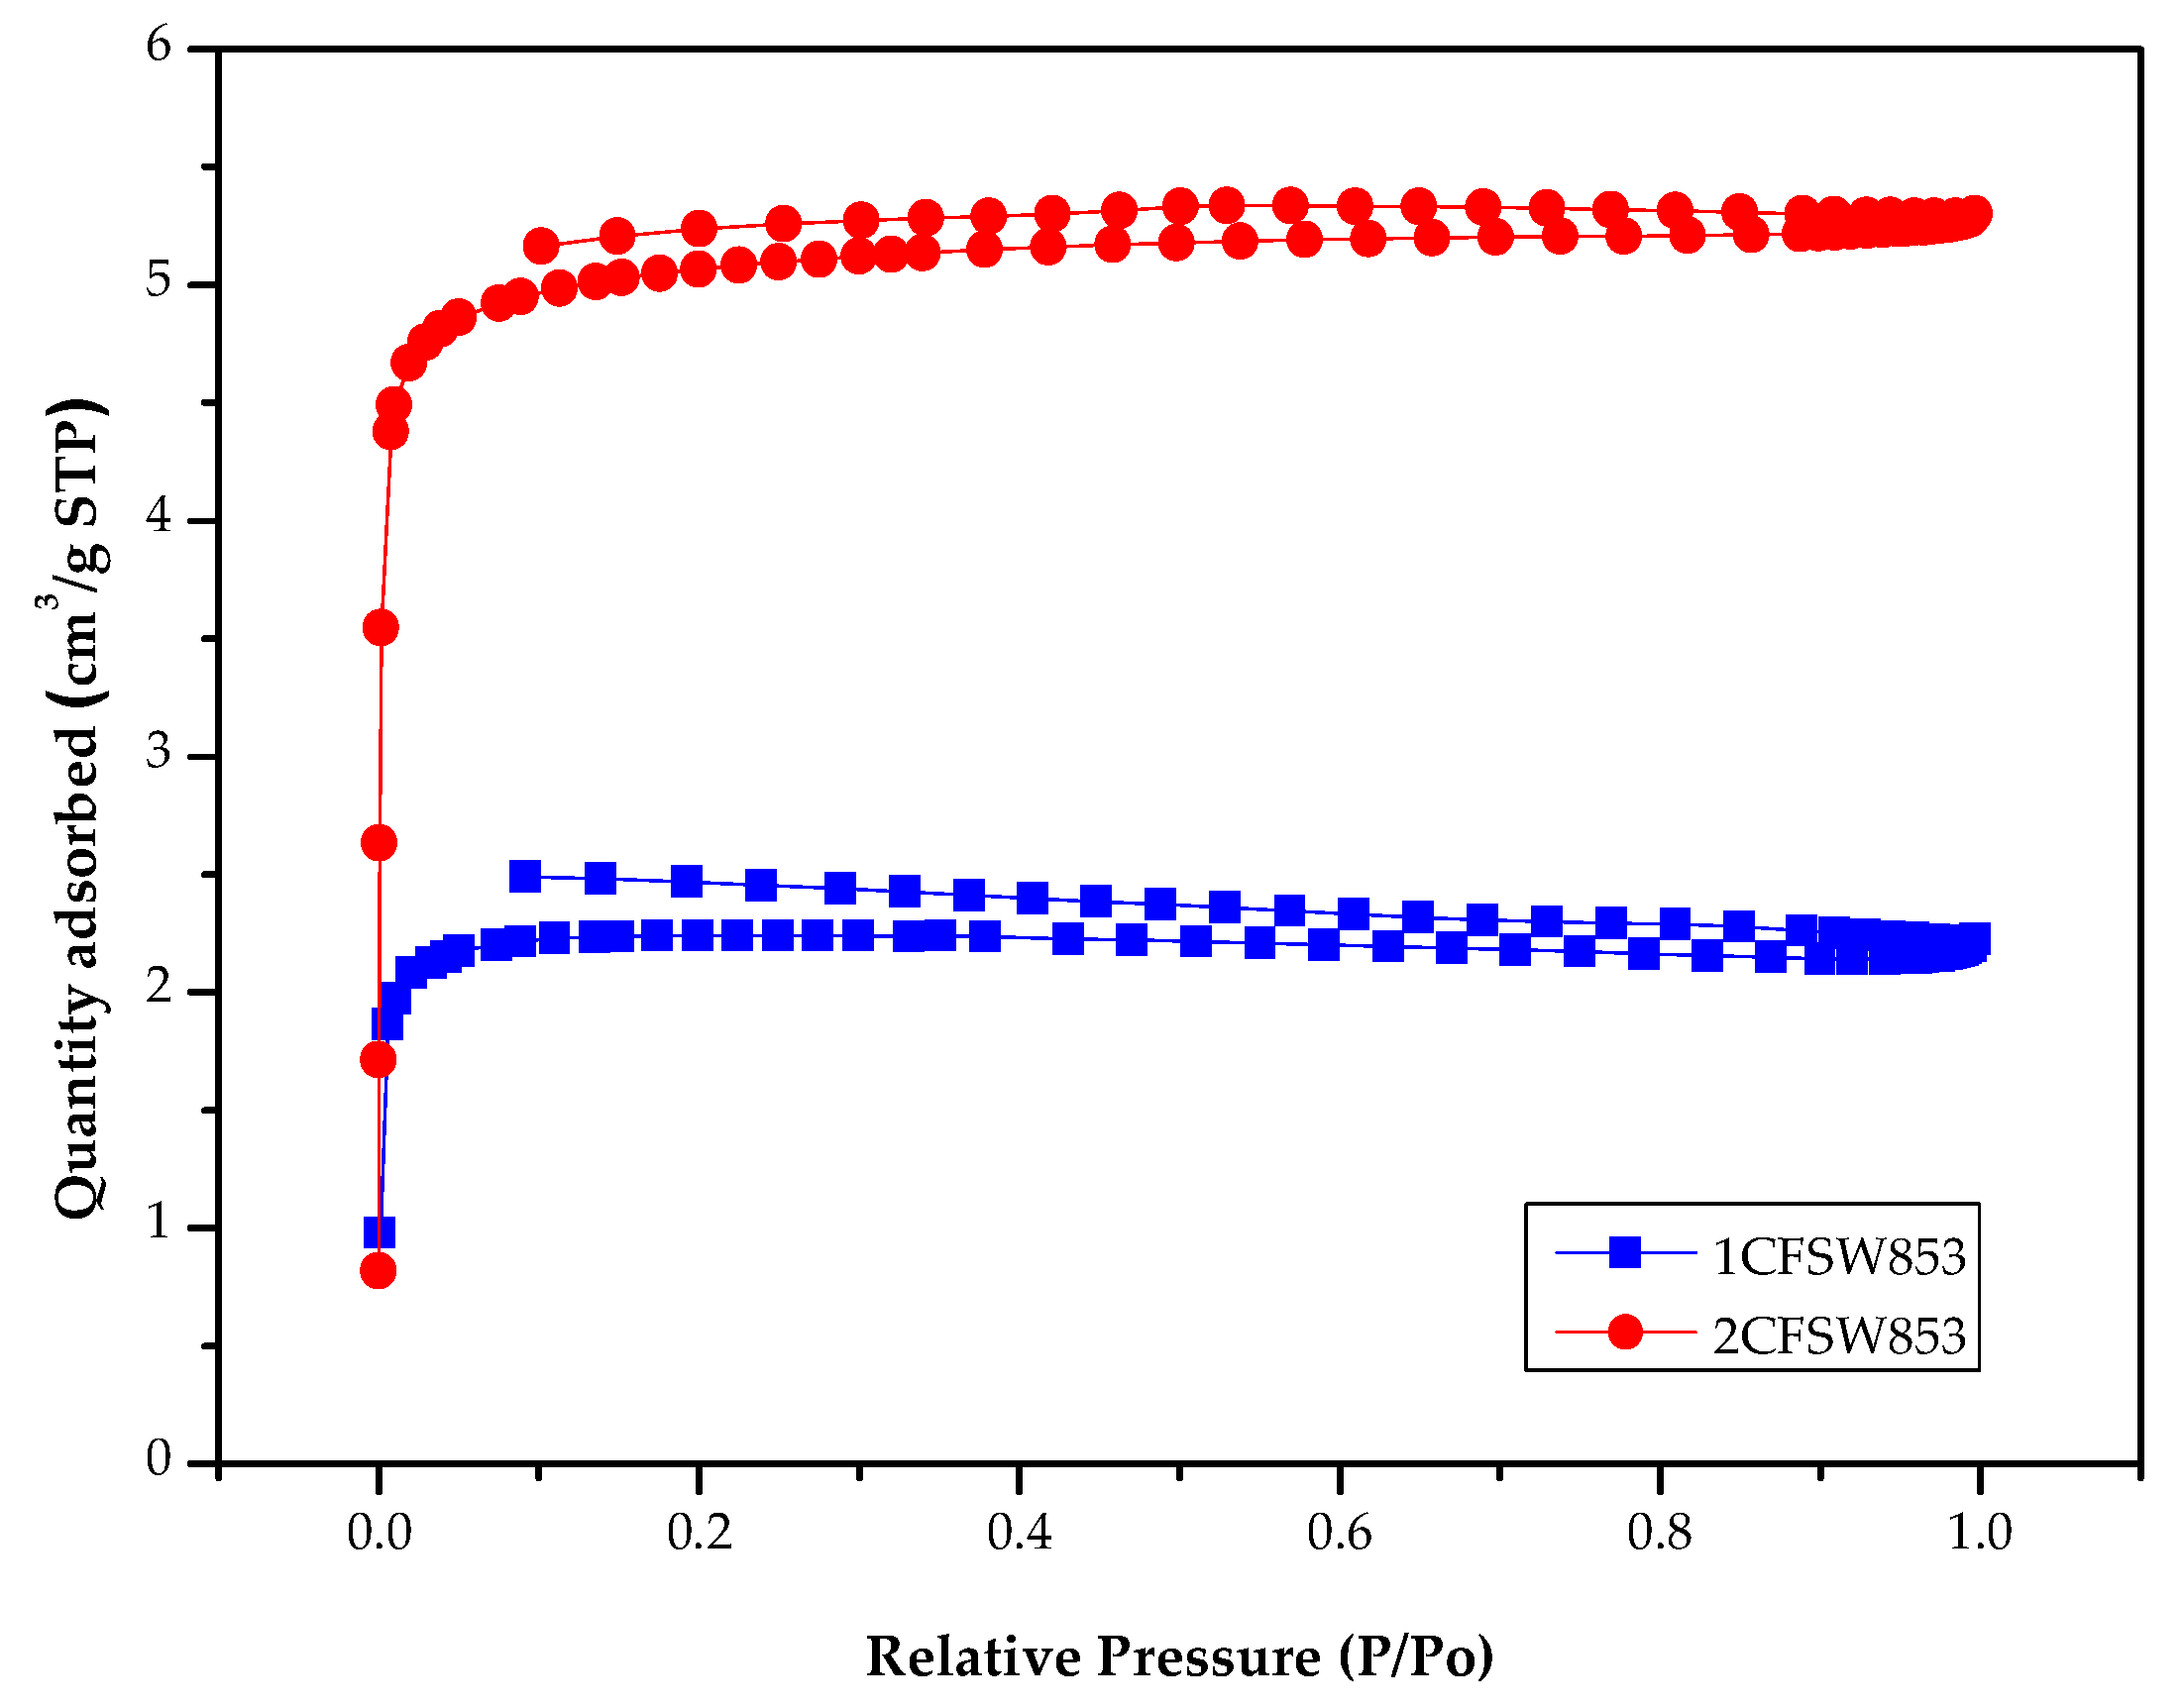
Figure 4.
SEM images (Left: ×500; Right: ×1,000) of (a) coffee husk and (b) the optimal biochar product (i.e., 2CFSW853).
Figure 4.
SEM images (Left: ×500; Right: ×1,000) of (a) coffee husk and (b) the optimal biochar product (i.e., 2CFSW853).
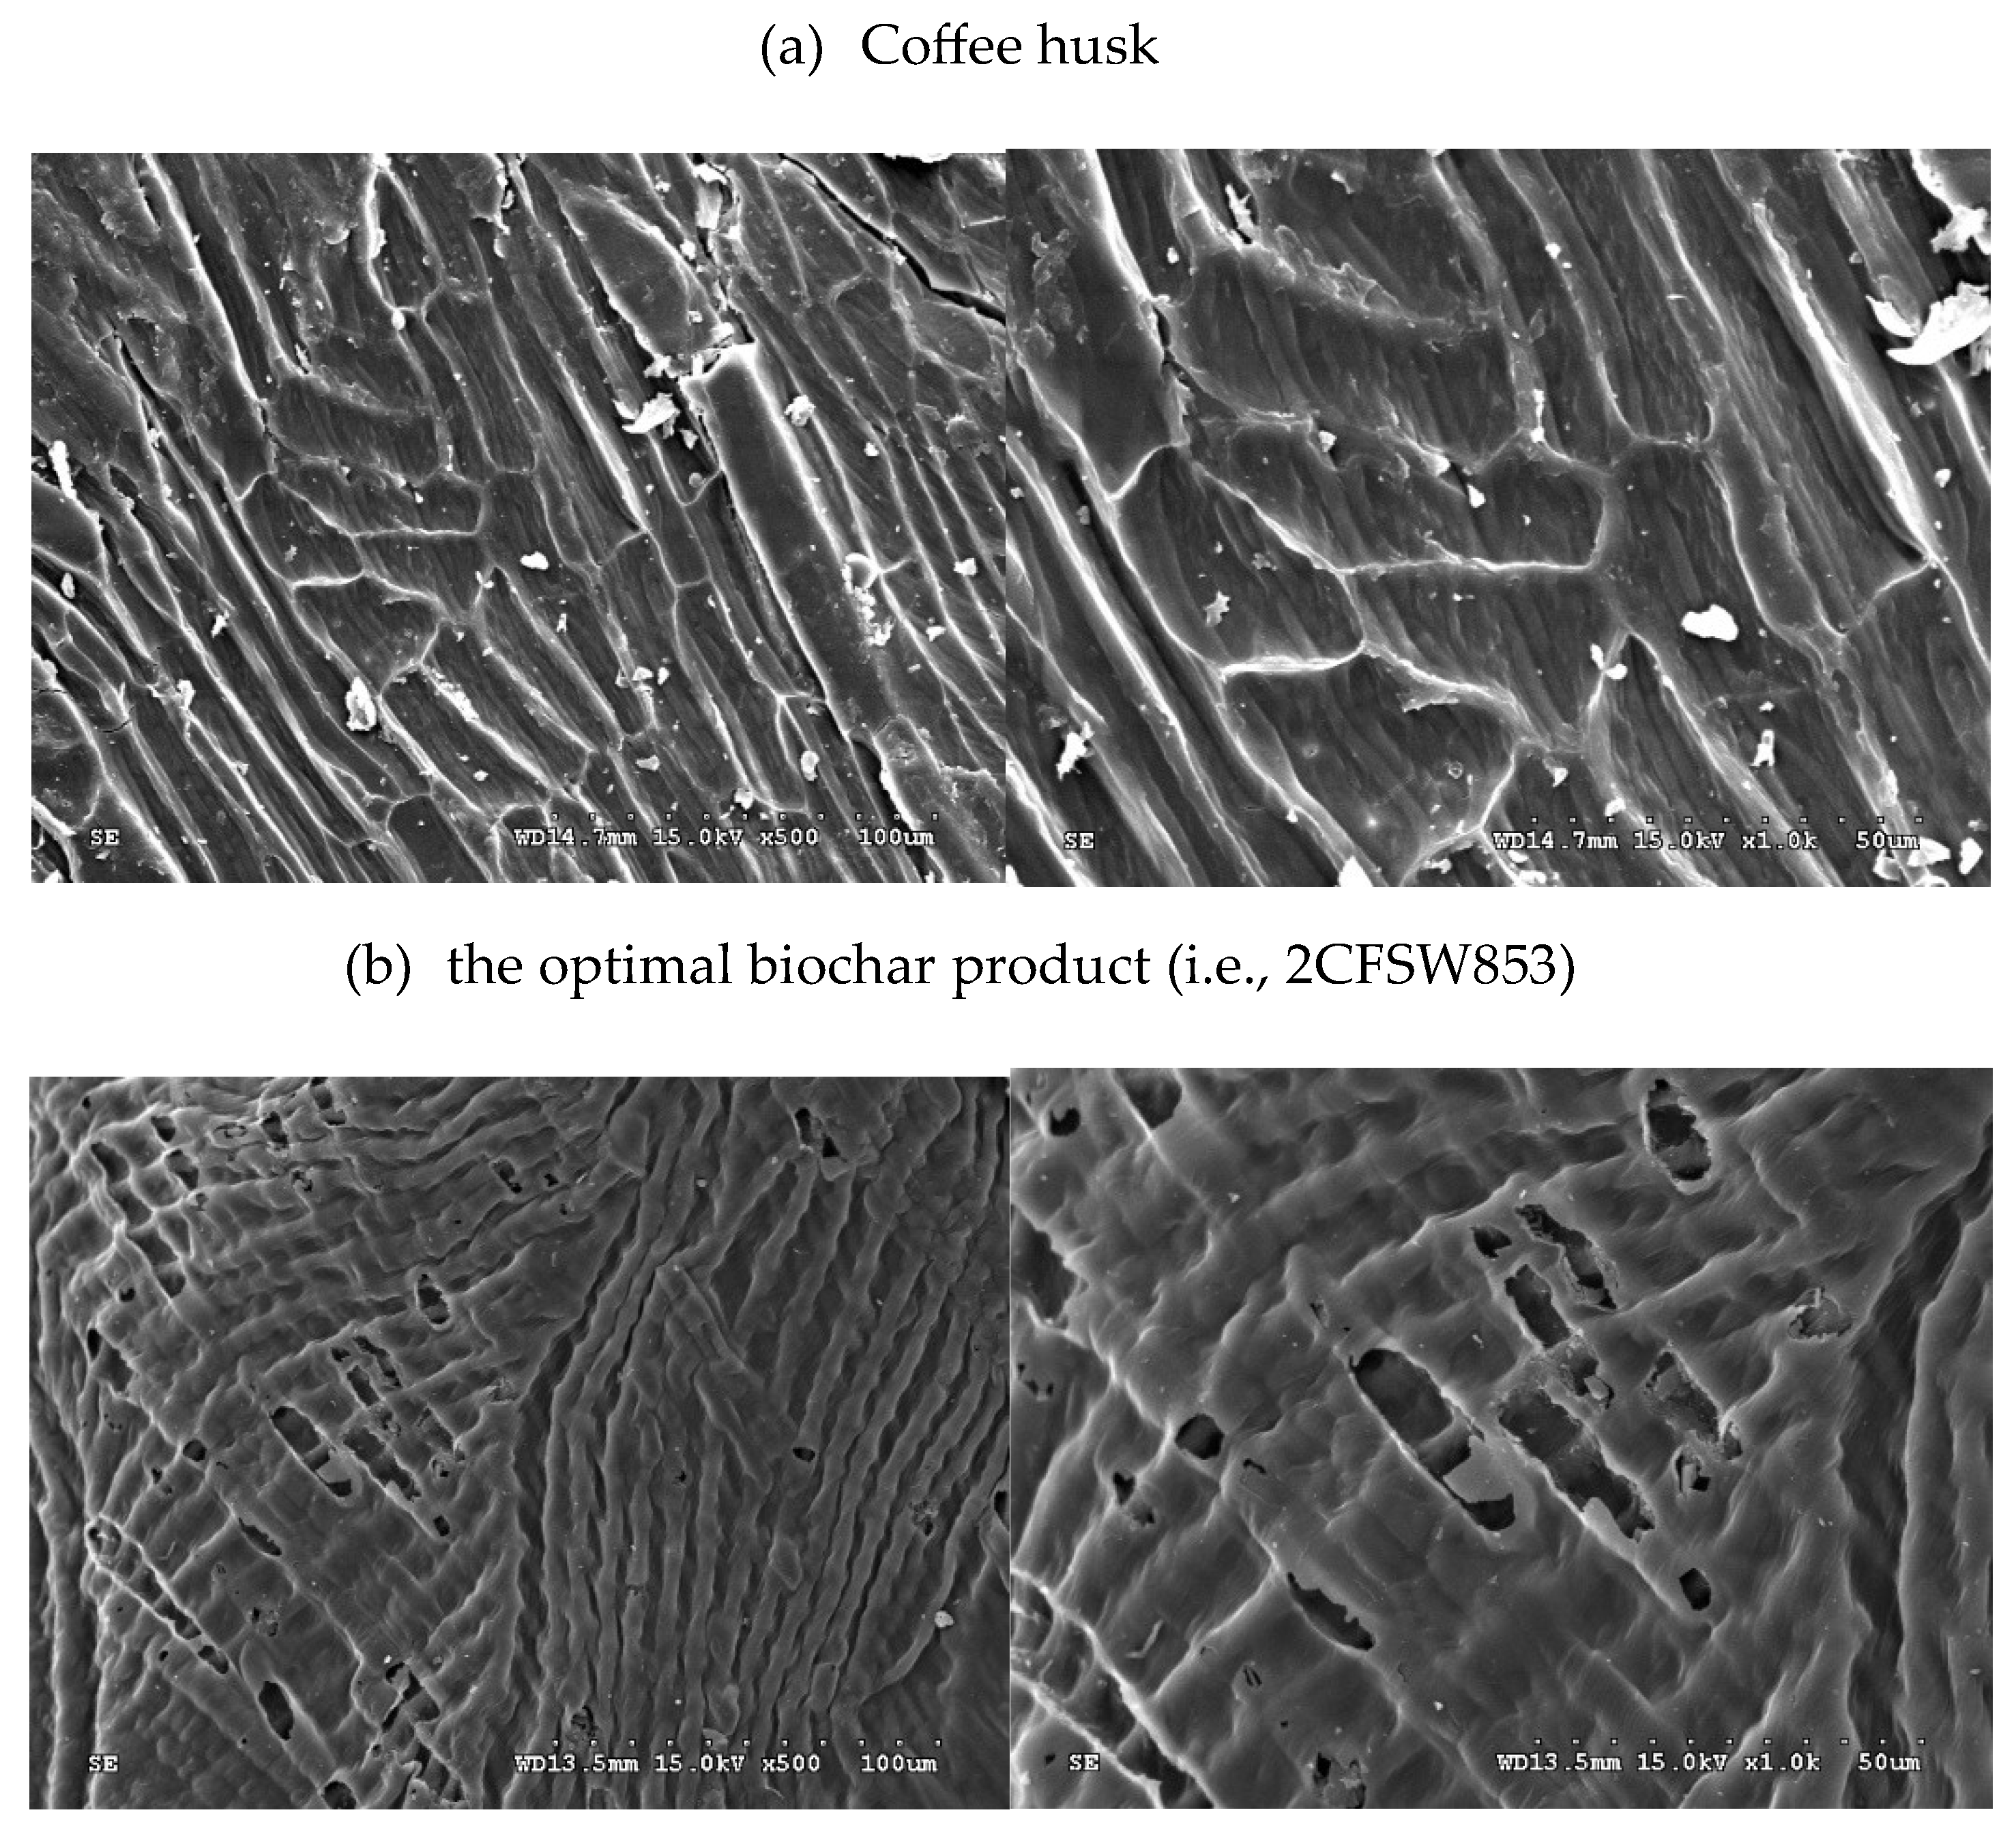
Figure 5.
Elemental compositions of (a) coffee husk, and plant carbon products (b) 1CFSW853 and (c) 2CFSW853 by EDS analysis.
Figure 5.
Elemental compositions of (a) coffee husk, and plant carbon products (b) 1CFSW853 and (c) 2CFSW853 by EDS analysis.
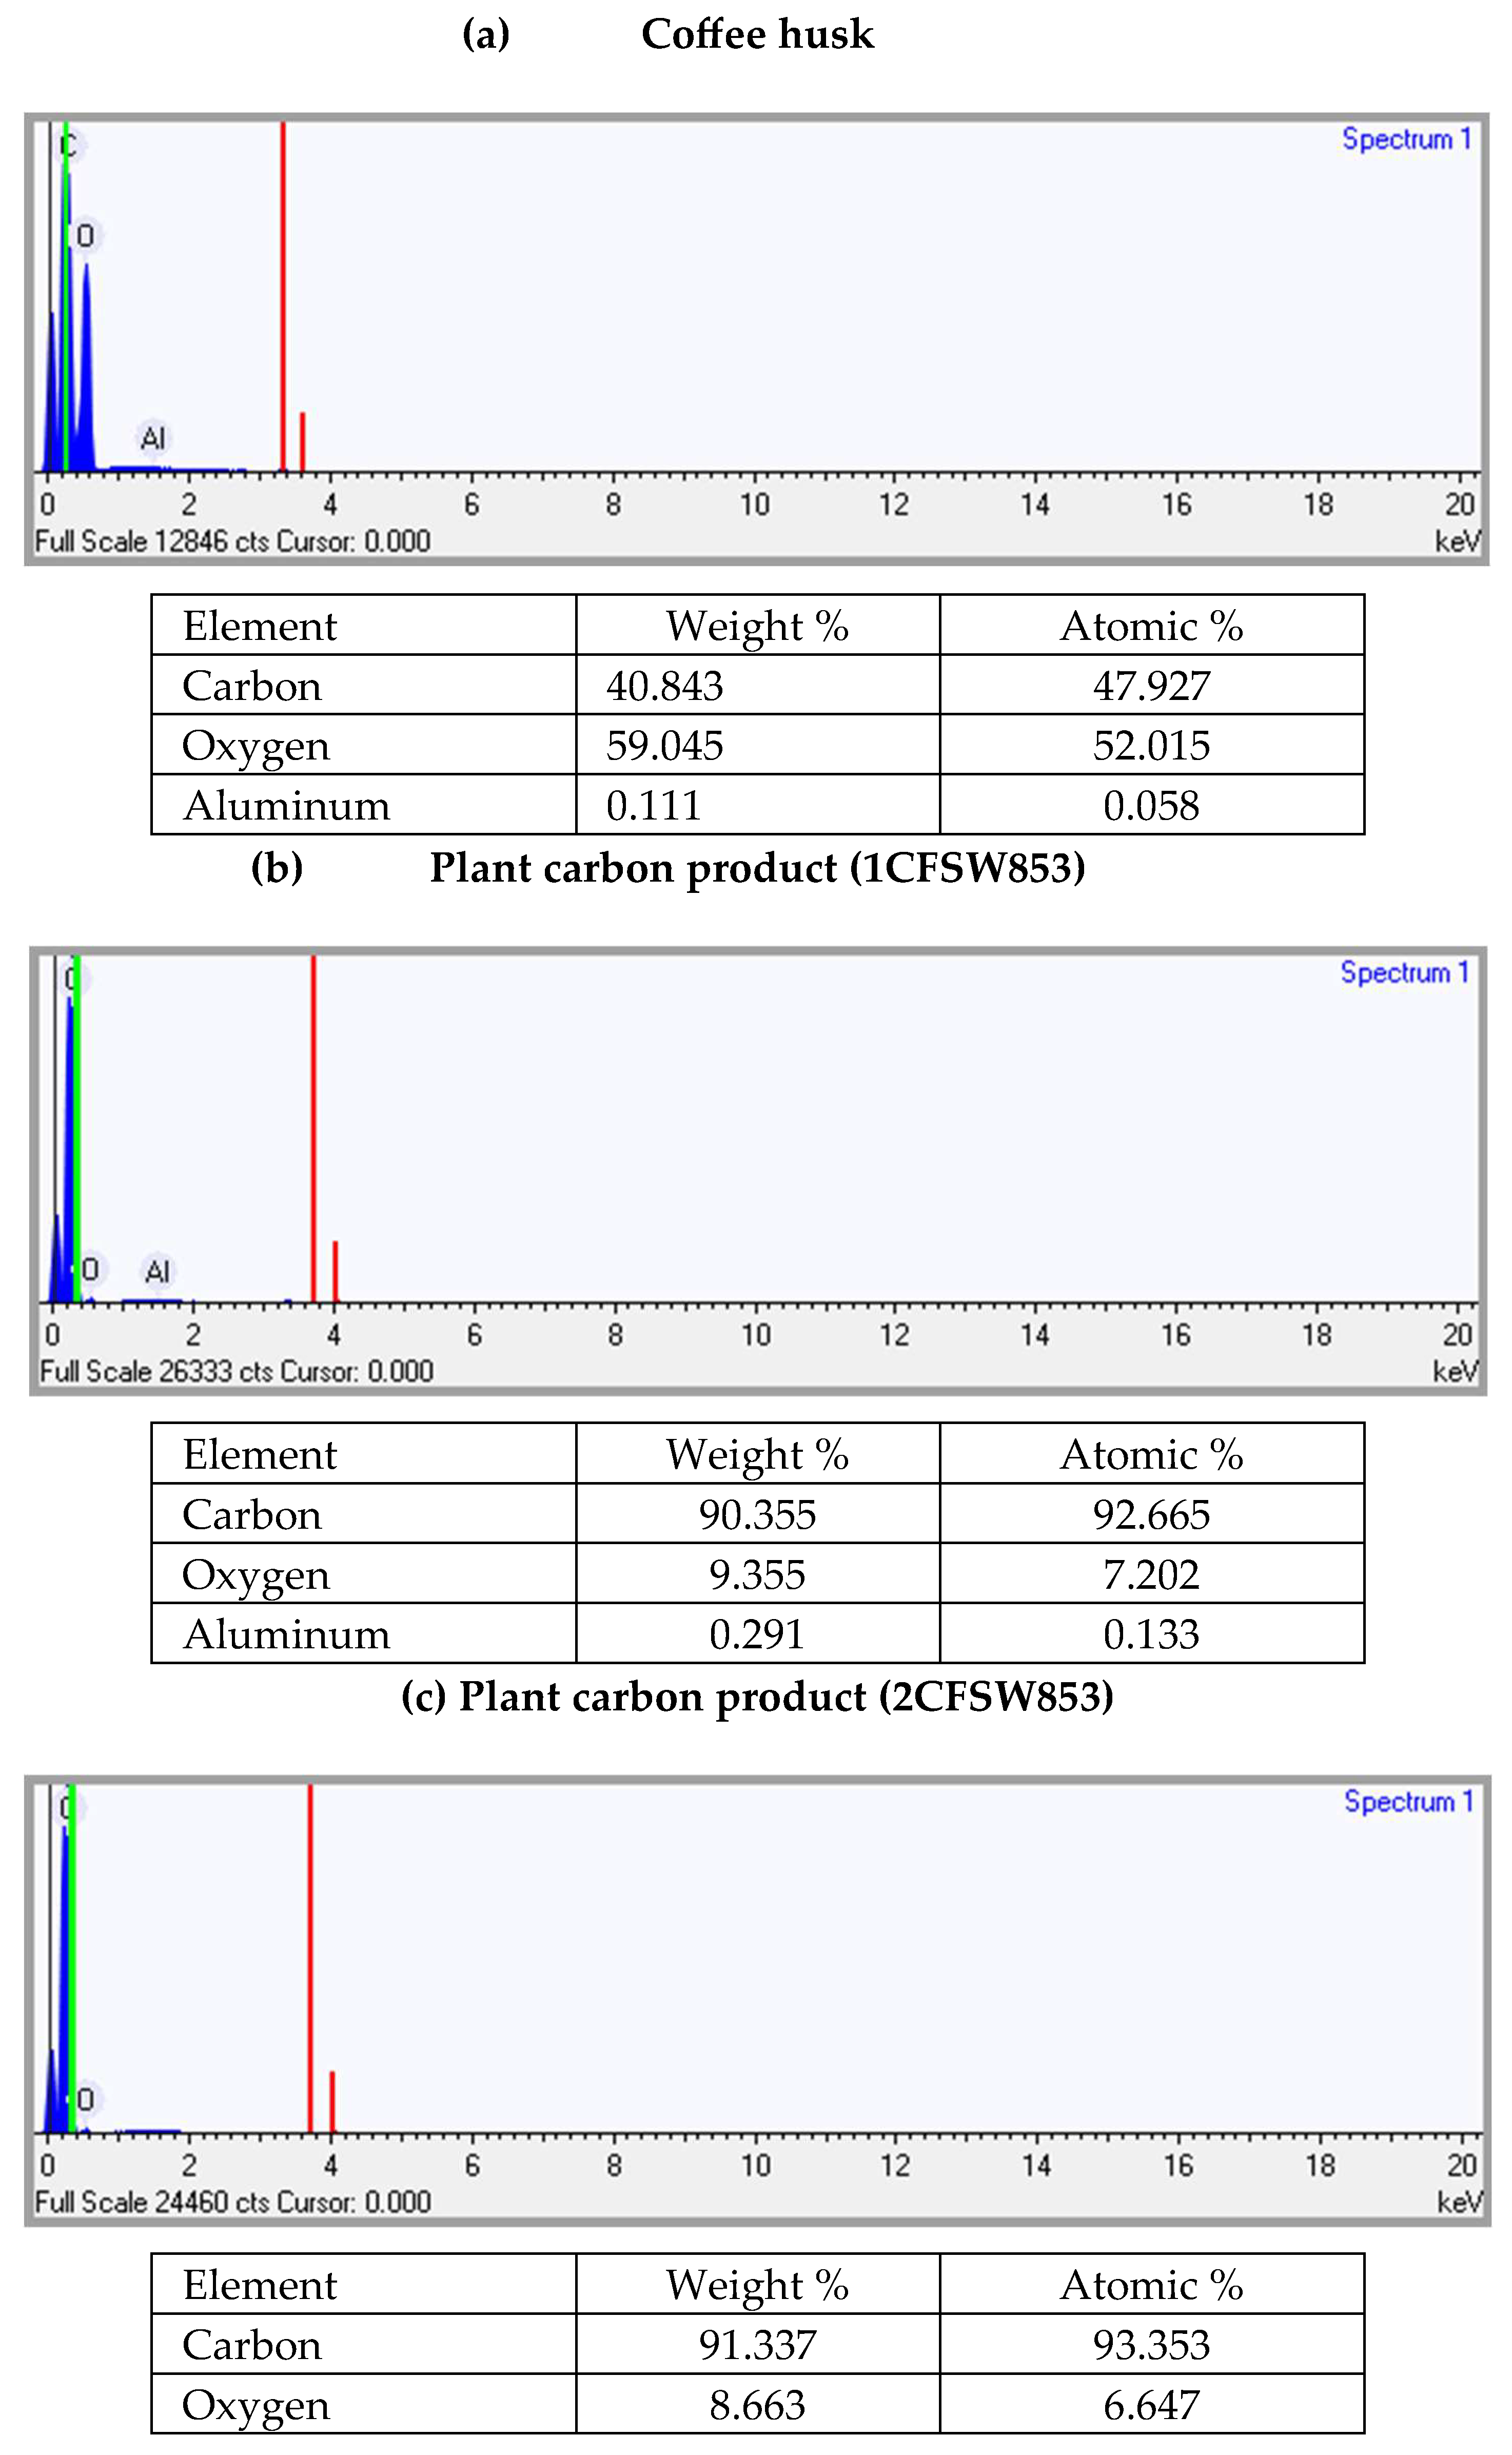
Figure 6.
Fourier Transform infrared spectroscopy (FTIR) spectra of coffee husk (CFS) and the resulting plant carbon (2CFSW853).
Figure 6.
Fourier Transform infrared spectroscopy (FTIR) spectra of coffee husk (CFS) and the resulting plant carbon (2CFSW853).
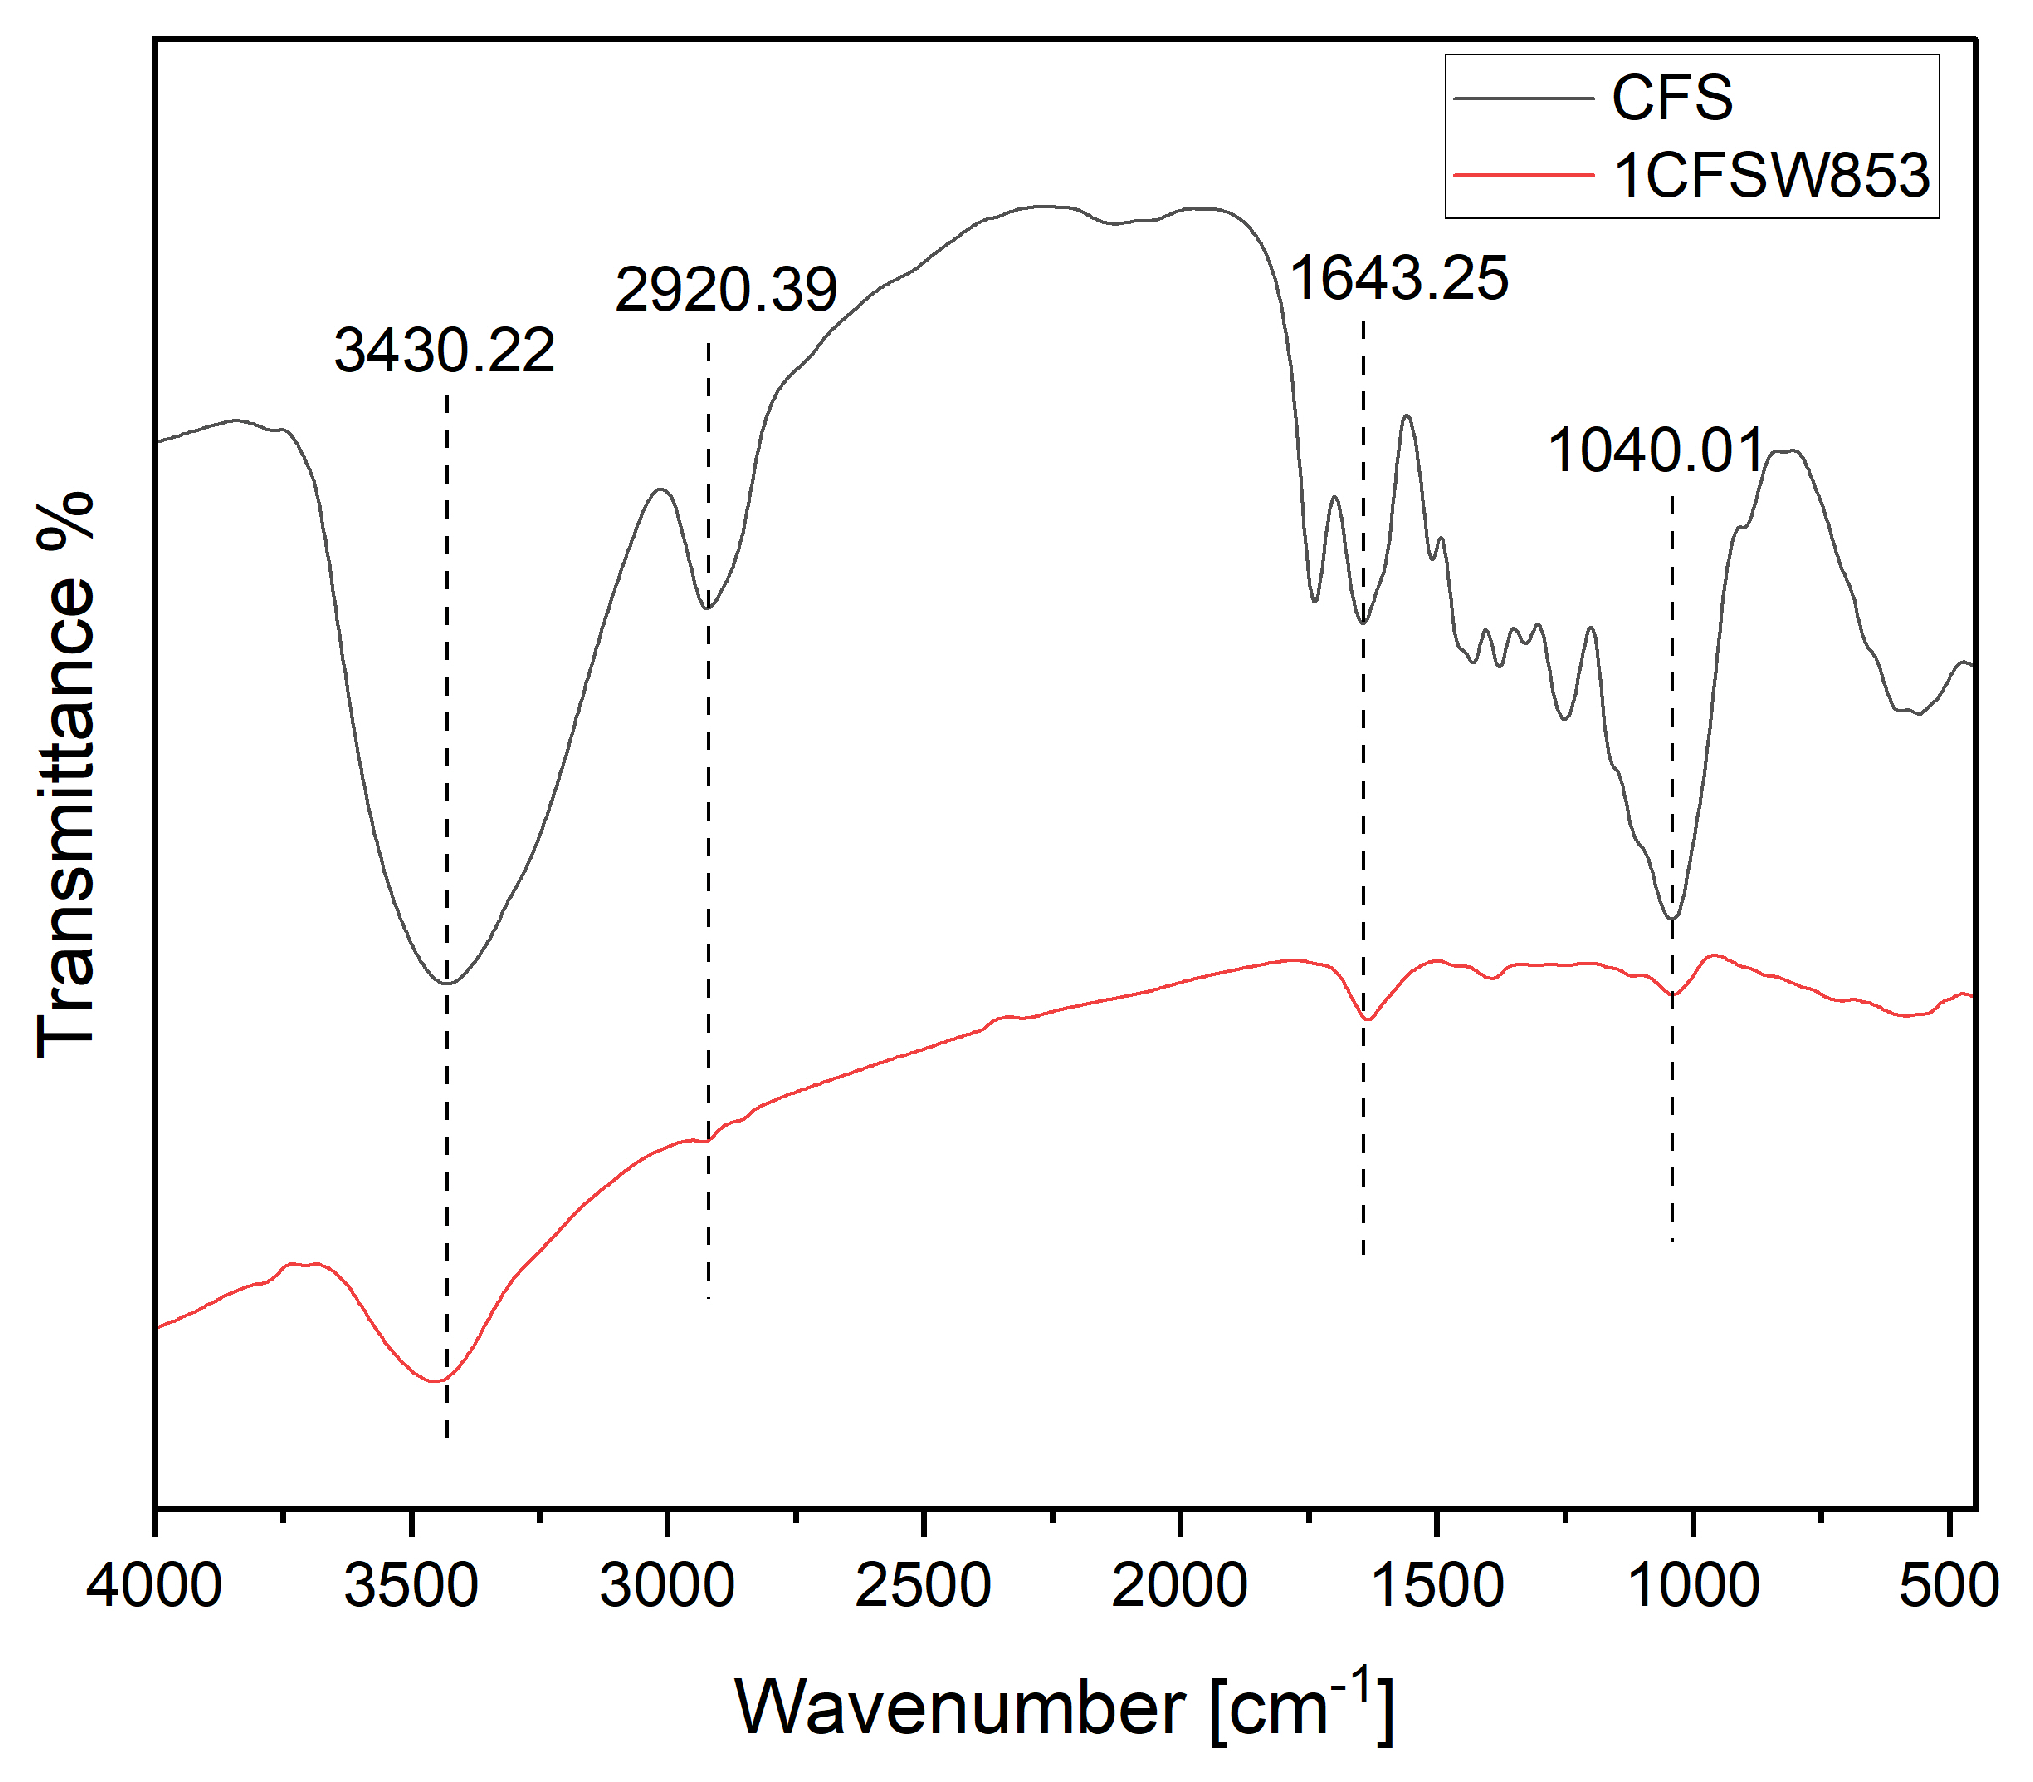

Table 1.
Proximate analysis and calorific value of coffee husk.
| Property a | Value |
|---|---|
| Proximate analysis | |
| Moisture (wt%) b | 10.82 ± 0.09 |
| Ash (wt%) c (wt%) | 0.30 ± 0.14 |
| Volatile matter c (wt%) | 83.57 ± 0. 33 |
| Fixed carbon c, d (wt%) | 16.13 |
| Calorific value b (MJ/kg) | 19.87 ± 0.11 |
a Mean ± standard deviation for three determinations of an as-received coffee husk sample. b As-received basis. b Dry basis. d By difference.
Table 2.
BET surface area values of of CF-based plant carbon products and theor carbonization conditions.
Table 2.
BET surface area values of of CF-based plant carbon products and theor carbonization conditions.
| Carbonization conditions | Plant carbon product code | BET surface area a#break#(m2/g) | ||
|---|---|---|---|---|
| Heating rate (°C/min) | Pyrolysis temperature (°C) | Holding time (min) | ||
| 10 | 800 | 0 | 1CFSW800 | 16.97 |
| 30 | 1CFSW803 | 55.39 | ||
| 60 | 1CFSW806 | 138.57 | ||
| 850 | 0 | 1CFSW850 | 66.53 | |
| 30 | 1CFSW853 | 155.59 | ||
| 60 | 1CFSW856 | 16.97 | ||
| 20 | 800 | 0 | 2CFSW800 | 164.38 |
| 30 | 2CFSW803 | 222.36 | ||
| 60 | 2CFSW806 | 41.73 | ||
| 850 | 0 | 2CFSW850 | 74.81 | |
| 30 | 2CFSW853 | 354.96 | ||
| 60 | 2CFSW856 | 49.33 | ||
a Based on relative pressure range of 0.05-0.10 (4-5 points).
Table 3.
Pore properties of optimal plant carbon products.
| Pore property | Plant carbon product code | |
|---|---|---|
| 1CFSW853 | 2CFSW853 | |
| Surface area | ||
| Single point surface area (m2/g, at P/P0 of about 0.2751) | 158.64 | 361.35 |
| BET surface area (m2/g) a | 155.59 | 354.96 |
| t-plot micropore area (m2/g) b | 107.68 | 266.30 |
| t-plot external surface area (m2/g) | 47.91 | 88.66 |
| Pore volume | ||
| Single point adsorption total pore volume of pores less than about 380 nm (cm3/g, at P/Po of about 0.995) | 0.0763 | 0.183 |
| t-plot micropore volume (cm3/g) b | 0.0545 | 0.130 |
a Based on relative pressure range of 0.050-0.275 (11 points). b Obtained by using the t-plot method.
Disclaimer/Publisher’s Note: The statements, opinions and data contained in all publications are solely those of the individual author(s) and contributor(s) and not of MDPI and/or the editor(s). MDPI and/or the editor(s) disclaim responsibility for any injury to people or property resulting from any ideas, methods, instructions or products referred to in the content. |
© 2025 by the authors. Licensee MDPI, Basel, Switzerland. This article is an open access article distributed under the terms and conditions of the Creative Commons Attribution (CC BY) license (http://creativecommons.org/licenses/by/4.0/).
Copyright: This open access article is published under a Creative Commons CC BY 4.0 license, which permit the free download, distribution, and reuse, provided that the author and preprint are cited in any reuse.


