
Submitted:
15 September 2024
Posted:
16 September 2024
You are already at the latest version
Abstract
Recent increases in the demand for automotive lithium-ion batteries (LIBs) have led to higher needs for critical materials like lithium, cobalt, nickel, and graphite. Consequently, recovering materials from spent batteries has gained importance. This study aimed to (1) develop a mechanical pre-treatment method for separating and concentrating materials from spent NCM622 cells, and (2) evaluate the economic, environmental, and scarcity potentials of these fractions. The pre-treatment involved grinding and granulometric separation, producing six particle-size fractions. Analysis showed that the finest fraction (n < 0.5 mm) had 85% of lithium, 77.4% of cobalt, 75.1% of manganese, and 68.5% of nickel. This fraction represented 40.4% of the processed mass and had the highest economic value (USD 3,669/ton NCM cell). This fraction was also prioritized for recycling due to its superior environmental and scarcity considerations.
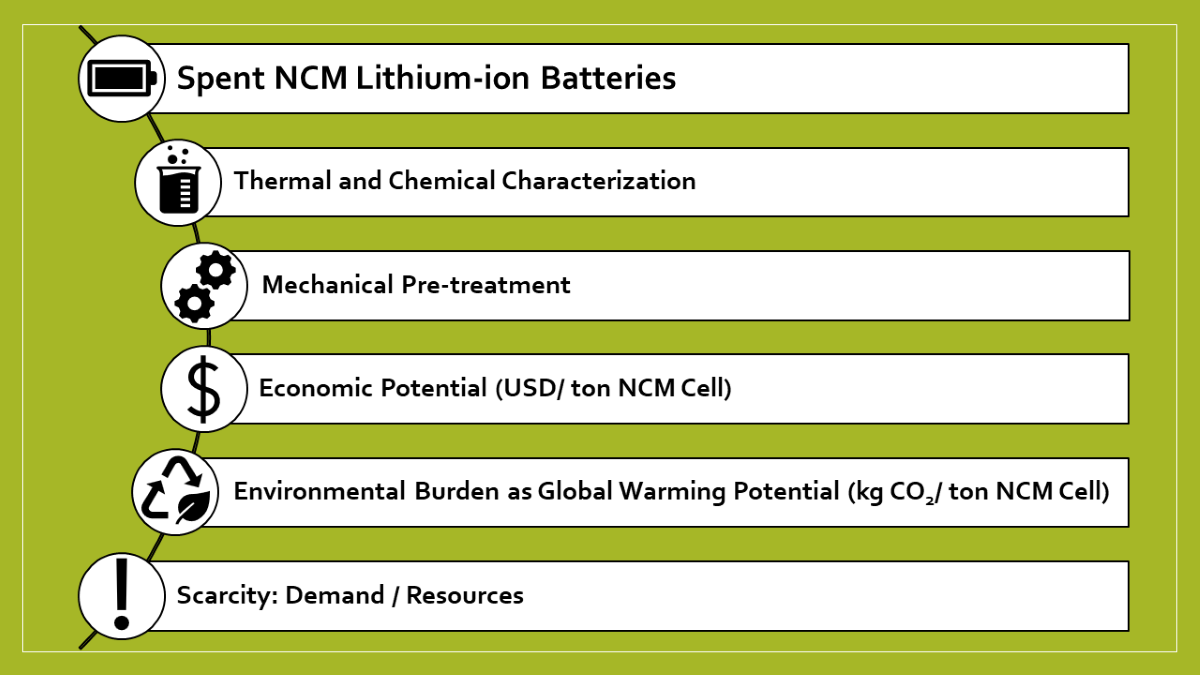
Keywords:
Spent Lithium-Ion Batteries
; NCM Cell
; Recycling
; Economic Potential
; Environmental Impact
; Scarcity
1. Introduction
According to a report published by the International Energy Agency (IEA), demand for automotive lithium-ion batteries (LIBs) increased by about 65% in 2022, driven by the increase in sales of electric vehicles. The outlook is that sales of electric vehicles will continue to increase exponentially in the coming years, mainly in regions such as China, the United States, and Europe, and expand to developing countries [1].
LIBs comprise an anode electrode, a cathode electrode, a separator, electrolytes, and a steel casing. The anode electrode is constituted of a polymer binder and carbon material, such as graphite, deposited on a copper foil. The cathode electrode comprises acetylene black, polymer binder, and lithium transition metal oxides coated on an aluminum foil. Polyvinylidene fluoride (PVDF), copolymer, and polypropylene (PP) stand out as the predominant binders employed in commercial LIBs. The commonly employed separators encompass microporous polyolefin membranes, including polypropylene (PP), polyethylene (PE), and fluorinated polymers. Meanwhile, diverse LIBs utilize distinct ion electrolytes. For instance, lithium-ion battery electrolytes often feature lithium salts like lithium hexafluorophosphate (LiPF6), lithium tetrafluoroborate (LiBF4), lithium bis(trifluoromethanesulfonyl)imide (LiTFSI), or others, dissolved in polar aprotic alkyl carbonate solvents, such as ethylene carbonate/dimethyl carbonate (EC/DMC) [2].
Currently, Lithium nickel cobalt manganese oxides (NCM) batteries dominate the lithium-ion battery market with a share of about 60% [1,3]. The NCM term represents a family of cathodic materials used in LIBs with variations stoichiometric in the composition, for example NCM111 (LiNi0.33Co0.33Mn0.33O2), NCM523 (LiNi0.5Co0.2Mn0.3 O2), NCM622 (LiNi0.6Co0.2Mn0.2O2), and NCM811 (LiNi0.8Co0.1Mn0.1O2). NCM111, containing the same proportions of nickel, manganese, and cobalt, was the first commercially used cathode material but currently, cathodes containing smaller amounts of cobalt, such as NCM622 and NCM811, are increasingly used [1,3,4]. Cations containing a higher nickel ratio present a benefit, besides using a lower cobalt ratio, and a higher energy density [5,6]. However, these materials are more difficult to manufacture, due to the tendency to form lithium off-stoichiometric phases during the thermal treatment, which can result in a high irreversible first-cycle capacity loss [7,8,9,10].
However, the market share scenario for LIB technologies could change quickly if in the future innovative technologies with superior properties emerge. Trends for the future of battery technologies, with a focus on lithium-based batteries, point to advanced nickel (Ni) rich NCM battery (NCM811), lithium-sulfur (Li-S) battery, solid-state lithium (solid-Li) battery, and lithium-air (Li-Air) battery. With emphasis particularly on advanced nickel-rich NCM batteries (NCM811) [11].
The increase in demand for automotive LIBs has a direct impact on increasing demands for critical materials such as lithium, cobalt, nickel, and graphite. This continuous and rapid increase in demand for these minerals is a source of concern worldwide. In 2022, for example, the automotive battery industry responded by about 60% of lithium demands, and, despite the increase in its production, lithium demands exceeded supplies. As a result, lithium carbonate prices have increased significantly, in such a way that at the beginning of 2023, prices reached levels up to six times above the average prices practiced during the 2015-2020 period [1]. In the cobalt case, increases in prices and the possibility of disruption in mineral supply (about 70% of world cobalt mine production comes from Congo - a region marked by internal conflicts), contributed to the use of cathodes rich in nickel and with lower cobalt content. However, the use of this type of cathode caused an increase in nickel prices, in 2022 which reached double the average price in the period 2015 - 2020. Associated with the price increase, there is a growing concern related to supply risks [1,3,4]. Regarding graphite, another important component, growth in its use in batteries has been 250% since 2018 [4].
Another source of concern is the huge quantity of LIBs will that reach the end-of-life (EOL) in the coming years. Inadequate disposal of these spent batteries may cause health and environmental impacts due presence of toxic materials in their composition. On the other hand, the spent LIBs could as a source of critical minerals [12,13]. However, the concentration of metals of high economic value present in LIBs depends on the type of battery analyzed. NCM LIBs, for example, contain in their composition Li, Co, Ni, Mn, Cu, and graphite. According to Dunn et al. [14], 11–12% of cobalt, 7–8% of lithium, and 10–12% of nickel internal demand in the US in 2030, and 15–18%, 9–11%, and 15–17%, respectively, in 2035, could be met by retired supply assuming closed-loop recycling [14]. However, one of the challenges for recycling these devices, in general, is the different configurations used in the batteries, which makes it difficult to standardize recycling methods [12,13]. These factors have led to an increase in the number of research related to the recycling of LIBs. Currently, several LIB recycling plants are under construction or in the planning phase in several countries [4].
Mechanical, hydrometallurgical, and pyrometallurgical processes, or a combination of these processes, are then usually used in the recovery of valuable metals from spent NCM LIBs [12]. Each of these processes has advantages and disadvantages and their application depends on several factors (economic, technical, and social, among others). Generally, mechanical processing is used such a pre-treatment to separate and concentrate the metals of interest into different fractions that, posteriorly, will be recovered by other processes. Mechanical processing includes comminution and classification processes, such as shredding, milling, screening, and others [15]. As a result of mechanical processing, a fraction containing a mixture of materials contained in the cathode and anode and impurities is obtained, this fraction is known as black mass. This fraction can subsequently be treated hydrometallurgically to obtain the metals of interest [16].
Thus, the objectives of this study were (1) to thermally characterize the materials contained in spent NCM lithium-ion batteries, (2) to quantify the amount of polymers and metals in the NCM cell to obtain reference values, (3) to develop a route of mechanical pre-treatment aiming separate and concentrate materials of interest, and (4) determine the potential of the fractions obtained through the mechanical treatment process. The prospective evaluation of particle size fractions derived from mechanical pre-treatment has been devised to delineate priority fractions for recycling, incorporating considerations of (1) economic viability, (2) environmental impact, and (3) supply risk factors. The potential assessment, considering the three factors (economic, environmental, and supply), is an aspect especially important but few times explored in literature. The main novelty of the study was the assessment to identify the particle size fractions, which are obtained by mechanical pre-treatment, which are priorities for recycling for decision-making by recycling companies, optimizing their resources and efforts.
2. Material and Methods
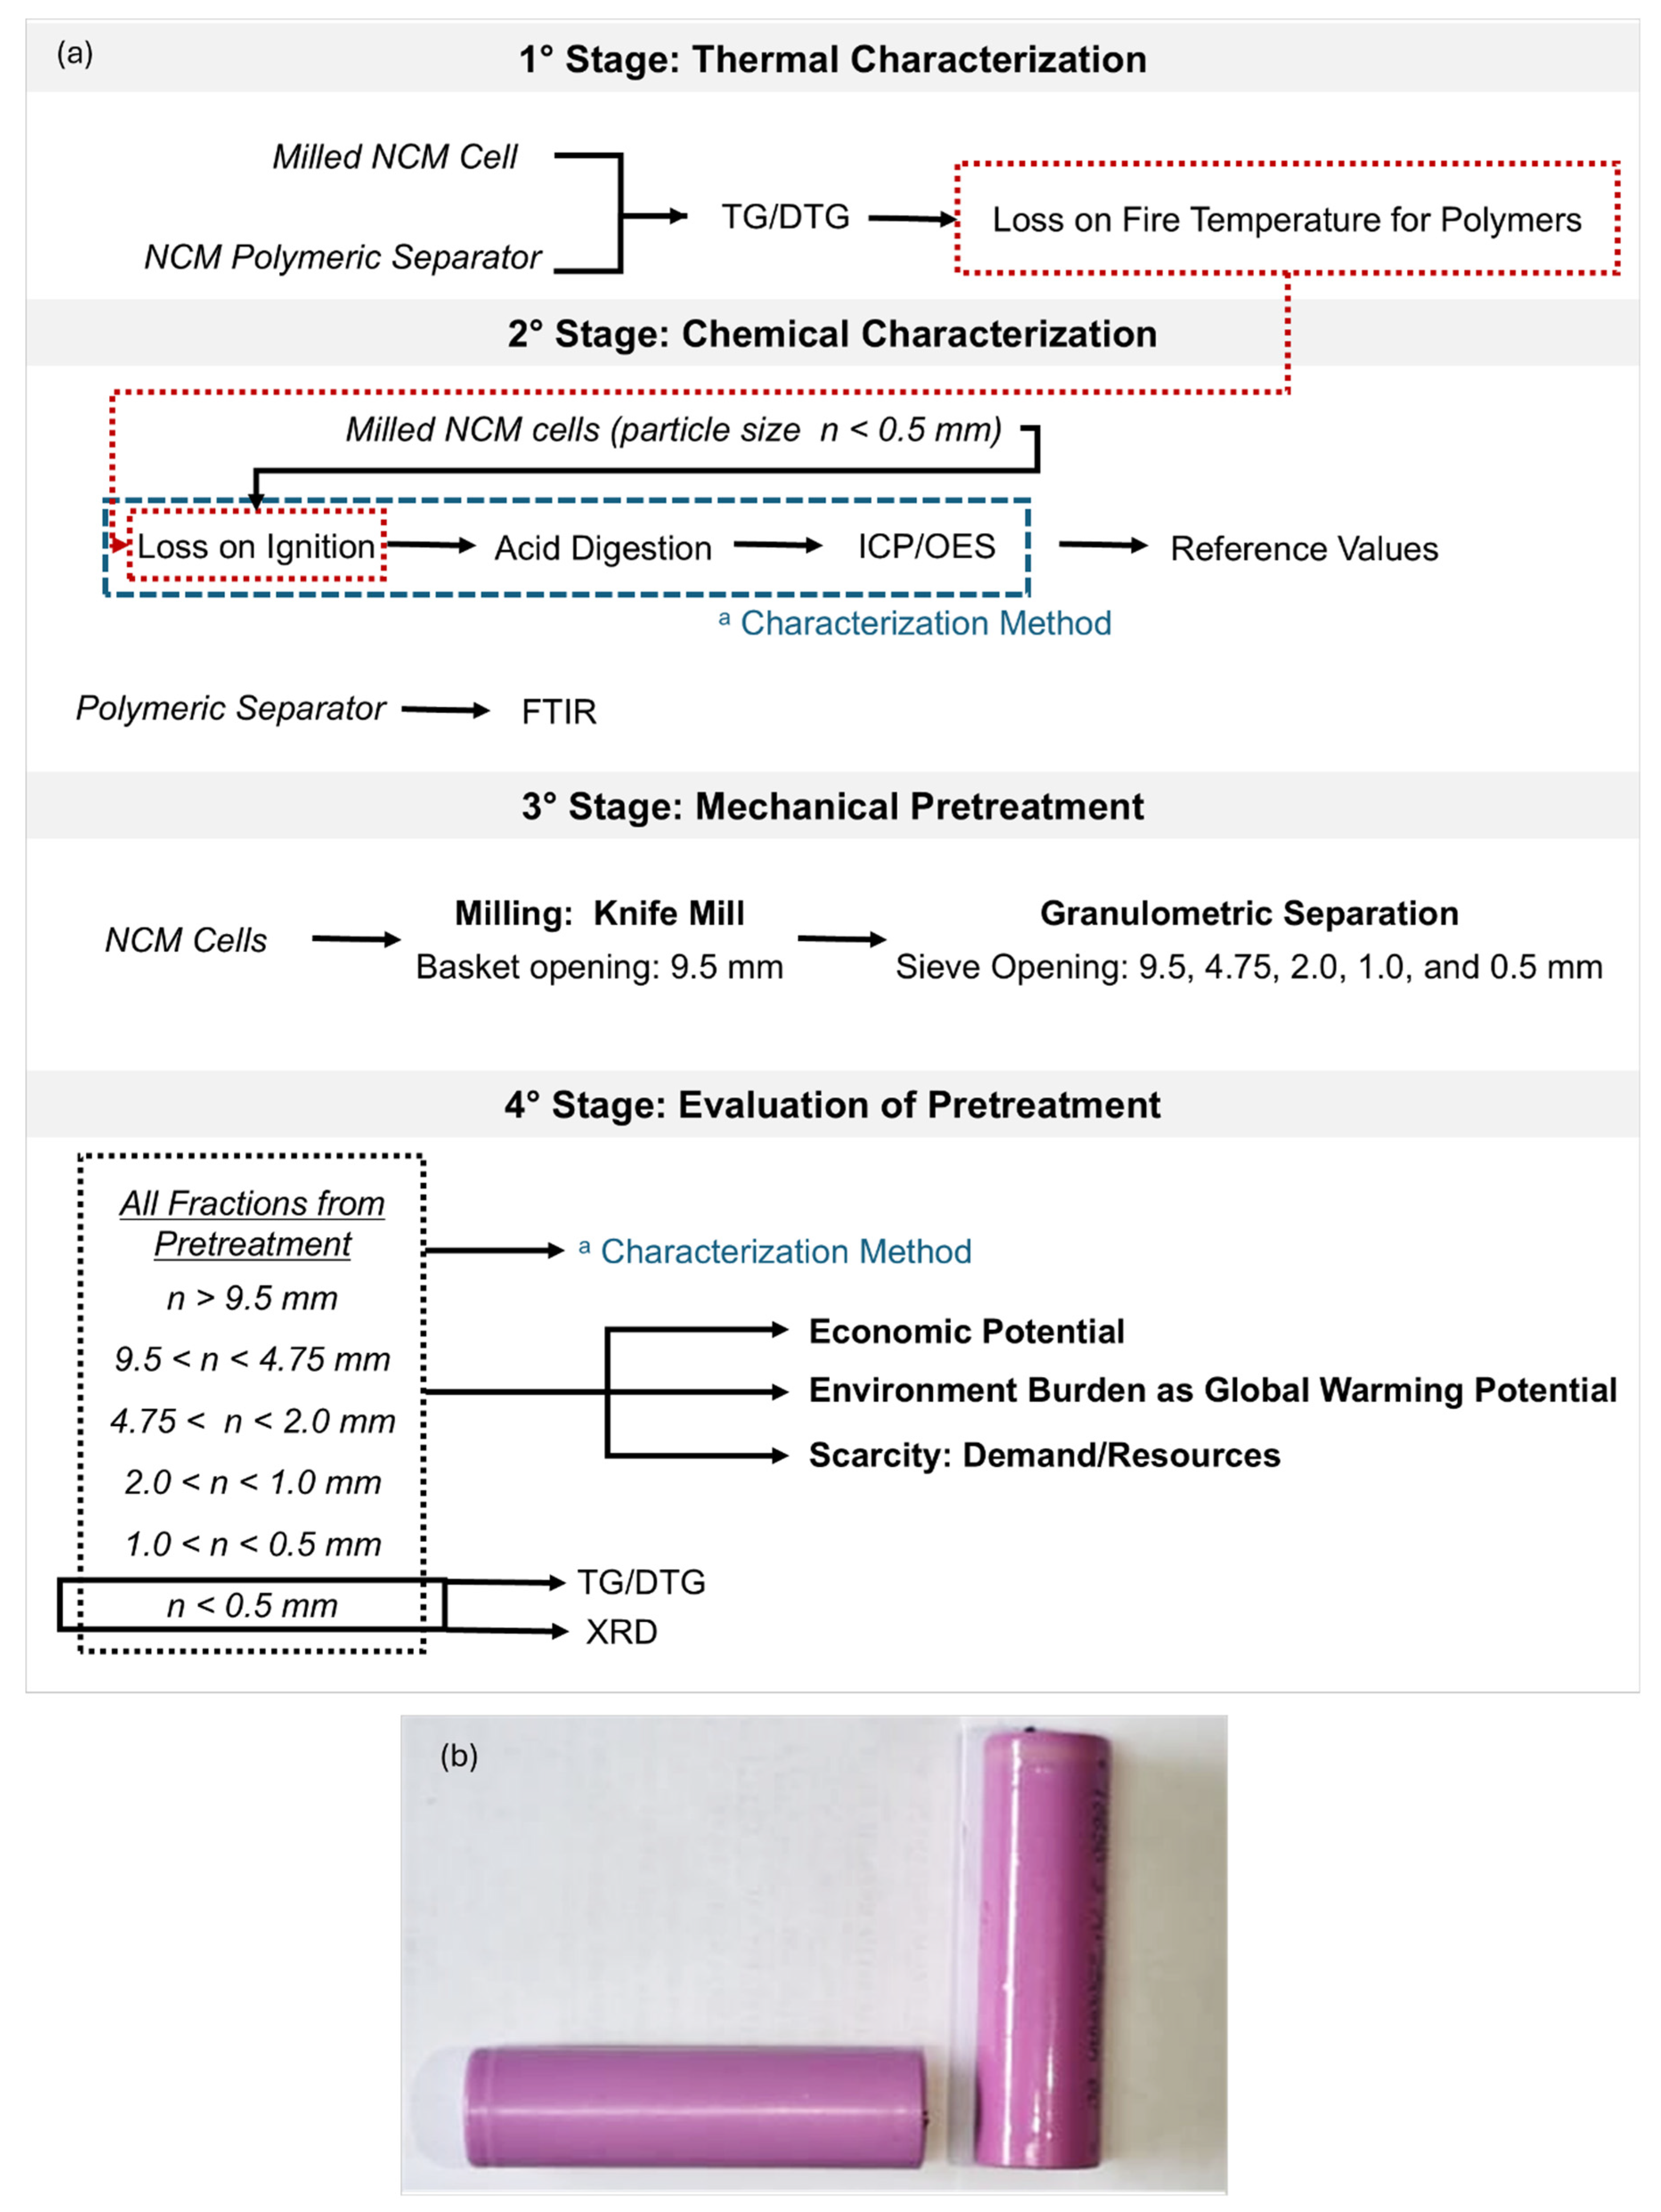
The methodology of the study and the lithium cells used is illustrated in the Figure 1a.
Unusable cells available on the local market were collected to be used in this work, which are cells destined for micromobility (Figure 1b). The cells are cylindrical and have Nickel Cobalt Manganese (NCM) cathode material. The cells are 18650-type batteries, with dimensions of 18.6 mm in diameter and 65.3 mm in length, manufactured in China in 2023, featuring a nominal capacity of 2,200mAh, 3.7 V voltage, and weighing 45g. Initially, the cells, arranged in an electrical series circuit, were discharged utilizing resistors to facilitate controlled and secure energy dissipation. This monitored discharge method was selected to eliminate residual voltage and avoid contamination that occurs from immersing individual cells in salt solutions, which impairs the efficiency of metal recovery [17,18,19].
2.1. Characterization of NCM Cells
This preliminary study characterized the composition of Li-ion cells with Nickel Cobalt Manganese cathode material to obtain reference values to evaluate the effectiveness of mechanical pre-treatment.
2.1.1. Thermogravimetric Analysis and Loss on Ignition Temperature
One of the aims of the mechanical pre-treatment proposed in this work was to mill the NCM cells into a larger particle size to keep the polymeric separators in larger particle size fractions, reducing their contamination in the finer fractions. To assess the quantity of these polymers, such as polypropylene and polyethylene, loss-on-fire tests were carried out. To define the ideal loss-on-fire temperature, two TG/DTG analyses were carried out under an oxidizing atmosphere: (1) a sample of milled NCM cell, whose particle size was n < 0.5 mm, and (2) a sample of cell separator, whose fragment was obtained by manual disassemble of a cell. In these analyses, it was used an equipment model Q50 of TA Instruments. The temperatures varied from 0 to 900°C, under a heating rate of 20°C.min-1 [20,21]. Based on the thermogravimetric analysis, a temperature was defined to carry out the loss on ignition and identify the Roasted Organic Compounds’ (ROC) percentage mass for all samples in this study aiming to establish a parameter that indicates the amount of polymers.
Figure 1.
(a) Methodology, and (b) photography of the spent NCM cells used in this study.
2.1.2. Chemical Characterization of NCM Cells
Approximately 500 g (11 cells with an average mass of 45g) of NCM cells were comminuted in a Retsch model SM300 knife mill (rotation speed of 1500 rpm The milled material was quartered, and 6 samples of approximately 5 g each were subjected to loss on ignition in a muffle furnace at the temperature identified in the thermogravimetric analysis of the separators, for 1 hour under an oxidizing atmosphere. After reaching room temperature, these samples underwent acid digestion with aqua regia for 2h, with heating (temperature 70-80ºC), and a solid-liquid ratio of 1/40. After filtration, the liquid fraction containing the solubilized metals was analyzed by Inductively Coupled Plasma Optical Emission Spectrometry (ICP-OES), Agilent model 5110. These results were set as reference values to evaluate the subsequent recycling process. The amount of graphite present in the anode material was not measured.
In addition, the polymeric separator of the NCM cell, which was removed manually and characterized separately, were chemically identified using Fourier transform infrared spectroscopy (FTIR) analysis. The FTIR spectrophotometer used was a Perkin Elmer Spectrum 1000 model, using the horizontal ATR accessory (H-ATR).
2.2. Mechanical Pre-Treatment for Recycling
The mechanical pre-treatment involved grinding approximately 500 g (11 cells with an average mass of 45g) of NCM cells for a single cycle using Retsch model SM300 knife mill (rotation speed of 1500 rpm), which basket opening was 9.5 mm, operating at a feed rate of 10 g/min, resulting in a milling time of 50 minutes. The milled material was collected and subjected to a series of bench sieves with a vibration system, featuring openings at 9.5, 4.75, 2.0, 1.0, and 0.5 mm. The electromagnetic sieve shaker for particle size analysis was from the Bertel brand. During sieving, 50 g of milled material was introduced into the system every 15 minutes. Mechanical pre-treatment yielded six particle size fractions: (1) n > 9.5 mm, (2) 4.75 < n < 9.5 mm, (3) 2.0 < n < 4.75 mm, (4) 1.0 < n < 2.0 mm, (5) 0.5 < n < 1.0 mm, and (6) n < 0.5 mm. The mass percentage of each fraction was calculated [22].
2.2.1. Chemical Evaluation of All Fractions
Following homogenization and quartering of the obtained fractions from mechanical pre-treatment, three samples of 5 g from each fraction underwent ignition loss, acid digestion, and analysis by ICP-OES, following the same procedures as previously reported. The concentrations of aluminum, cobalt, copper, iron, lithium, manganese, nickel, and the Roasted Organic Compounds (ROC) of each fraction were calculated.
A fraction may have a high concentration of the material of interest but have a relatively low mass in relation to the total amount of cells processed. For this reason, calculating the mass percentage distribution of the element (metals and ROC) is important to check whether the mechanical pre-treatment has been effective in separating and concentrating it. The mass percentage distribution of each element within each fraction was calculated using the Equation (1):
where (Equation (1))
Mass percentage distribution of element “e” in fraction “n”, in %;
Average percentage concentration of element “e” in fraction “n”, identified by ICP-OES;
Mass percentage of the “n” particle size fraction in relation to the quantity of cells processed in mechanical pre-treatment; and
Sum of all six concentration products of the of the element “e” in each fraction by the percentage of each fraction.
To assess the potential of the pre-treatment developed, the mass (in kg) of each element of interest (metals and ROC) contained in each of the different particle size fractions was estimated if 1000 kg of the NCM cells studied were processed, using Equation (2).
where (Equation (2))
Mass of element “e” in fraction “n” if 1000 kg of the NCM cells studied were processed, in kg;
Average percentage concentration of element “e” in fraction “n”, identified by ICP-OES, in %; and
Mass percentage of the “n” particle size fraction in relation to the quantity of cells processed in mechanical pre-treatment, in %.
2.2.2. Black Mass (Fraction < 0.5mm): TG/DTG and X-ray Diffraction
This black mass used in these analyses was obtained by mechanical pre-treatment, i.e., grinding and sieving only, and was not subjected to a loss on ignition.
The black mass sample underwent a TG/DTG analysis, using the Q50 model from TA Instruments whose temperatures varied from 0 to 900°C, under a heating rate of 20°C.min-1 (ASTM-E1131, 2015; ASTM-E473, 2014).
For the X-ray diffraction analysis (XRD), the black mass sample was ground in an agate mortar to achieve a particle size of 0.045 mm (#325 mesh). The analysis was performed by the Aeris Panalytical Research Edition, using Cu source (with Cu-Kα radiation source with λ = 1.54Å), with the detector refined to the PHD range 8-11.27 kV, step size of 0.022º, and 2θ angular interval from 15º to 85º.
2.2.3. Economic, Environmental, and Scarcity Potential Evaluation
These assessments were carried out using the methodology developed by Cenci et al. (2024).
2.2.3.1. Economic Potential
The economic potential parameter refers to the market value of materials in relation to the quantity present in the fractions of the best recycling process. The economic value (EV) of each material (m) was determined by multiplying the mass fraction of each material by its market value (Table 1), as expressed in Equation (3). The values were normalized to the base of 1,000 kg.
where (Equation (3))
in fraction “n” if 1000 kg of the NCM cells studied were processed;
Mass of element “e” in fraction “n” if 1000 kg of the NCM cells studied were processed;
: Mass conversion factor from element “e” to material “m”;
: Market value of material “m”

Table 1.
Materials analyzed with their mass conversion factors and market values in USD/kg.
| Element | Material | Mass Conversion Factor | Market Value (USD/kg) |
| Al | Aluminum | 1 | 2.290 1 |
| Co | Cobalt | 1 | 26.625 1 |
| Cu | Copper | 1 | 9.10 1 |
| Fe | Steel Rebar | 1 | 0.425 1 |
| Li | Li2CO3 | 5.322 | 11.78 1 |
| Mn | Mn2O3 | 4.260 | 1.25 2 |
| Ni | Nickel | 1 | 15.80 1 |
Sources: 1 (Daily Metal Prices, 2024); 2 (Business Analytiq, 2024).
For all materials except manganese, the market values were sourced from the Daily Metal Prices website [23], whose values were collected on July 2024. For the element Li, the values were obtained from compounds Li₂CO₃ and required a mass conversion to an elementary base. For manganese, the market value was sourced from the Business Analytiq website [24], which value were found on July 2024. The value was obtained from compound Mn2O3 and required a mass conversion to an elementary base. All other elements assumed 99% purity. This assessment of economic potential does not factor in the expenses associated with recovery processes and the manufacturing of raw materials derived from mechanically pre-treated materials. Additionally, this calculation does not account for material losses. The aim of the economic potential estimative was to identify the priority fractions obtained through pre-treatment for recycling based on economic considerations.
2.2.3.2. Environmental Burden as Global Warming Potential
Each material carries an environmental burden (EBm) through its life cycle. Equation (4) assesses the environmental burden in the cradle-to-gate approach by multiplying the environmental impact (GWP in this study) by the mass fraction.
Global warming potential (GWP) values were collected from the study of Nuss and Eckelman (2014). This approach highlights materials with a high environmental burden associated with primary ores treatment, making them attractive for recycling. Other environmental impact categories could be considered, such as land use, acidification, and ecotoxicity. The calculation used the following values in kg CO2-eq/kg: 8.8 for Al, 8.3 for Co, 2.8 for Cu, 1.5 for Fe, 7.1 for Li, 1.0 for Mn, and 6.5 for Ni. The values were adjusted in relation to the mass percentage of each fraction to inform the kilograms of CO2-eq per ton of NCM cells processed. The objective of the environmental burden as a global warming potential estimate was to identify the priority fractions obtained through pre-treatment for recycling based on environmental considerations.
2.2.3.3. Scarcity
To assess material scarcity, Equation (3) integrates criteria of raw material scarcity, market scarcity (linked to supply risk), and significance in the scrap. Variables α, β, and γ represent weights assigned to each criterion. In this study, weights of 1 for α and γ, and 3 for β were adopted to emphasize the importance of supply risk. However, alternative weight values can be applied.
The equation evaluates the fraction of available mineral resources demanded for future applications, incorporating data from studies on future demand (2016-2050) [25,26]. Supply risk values for the European Union were used due to geopolitical variations. The mass fraction over demand prioritizes materials with high potential recovery from scrap. The values were adjusted about the mass percentage of each fraction to indicate which fraction obtained from mechanical pre-treatment is a priority for recycling, considering the risk of supply.
3. Results and Discussion
3.1. Characterization of NCM Cells
3.1.1. Thermogravimetric Analysis and Loss on Ignition Temperature
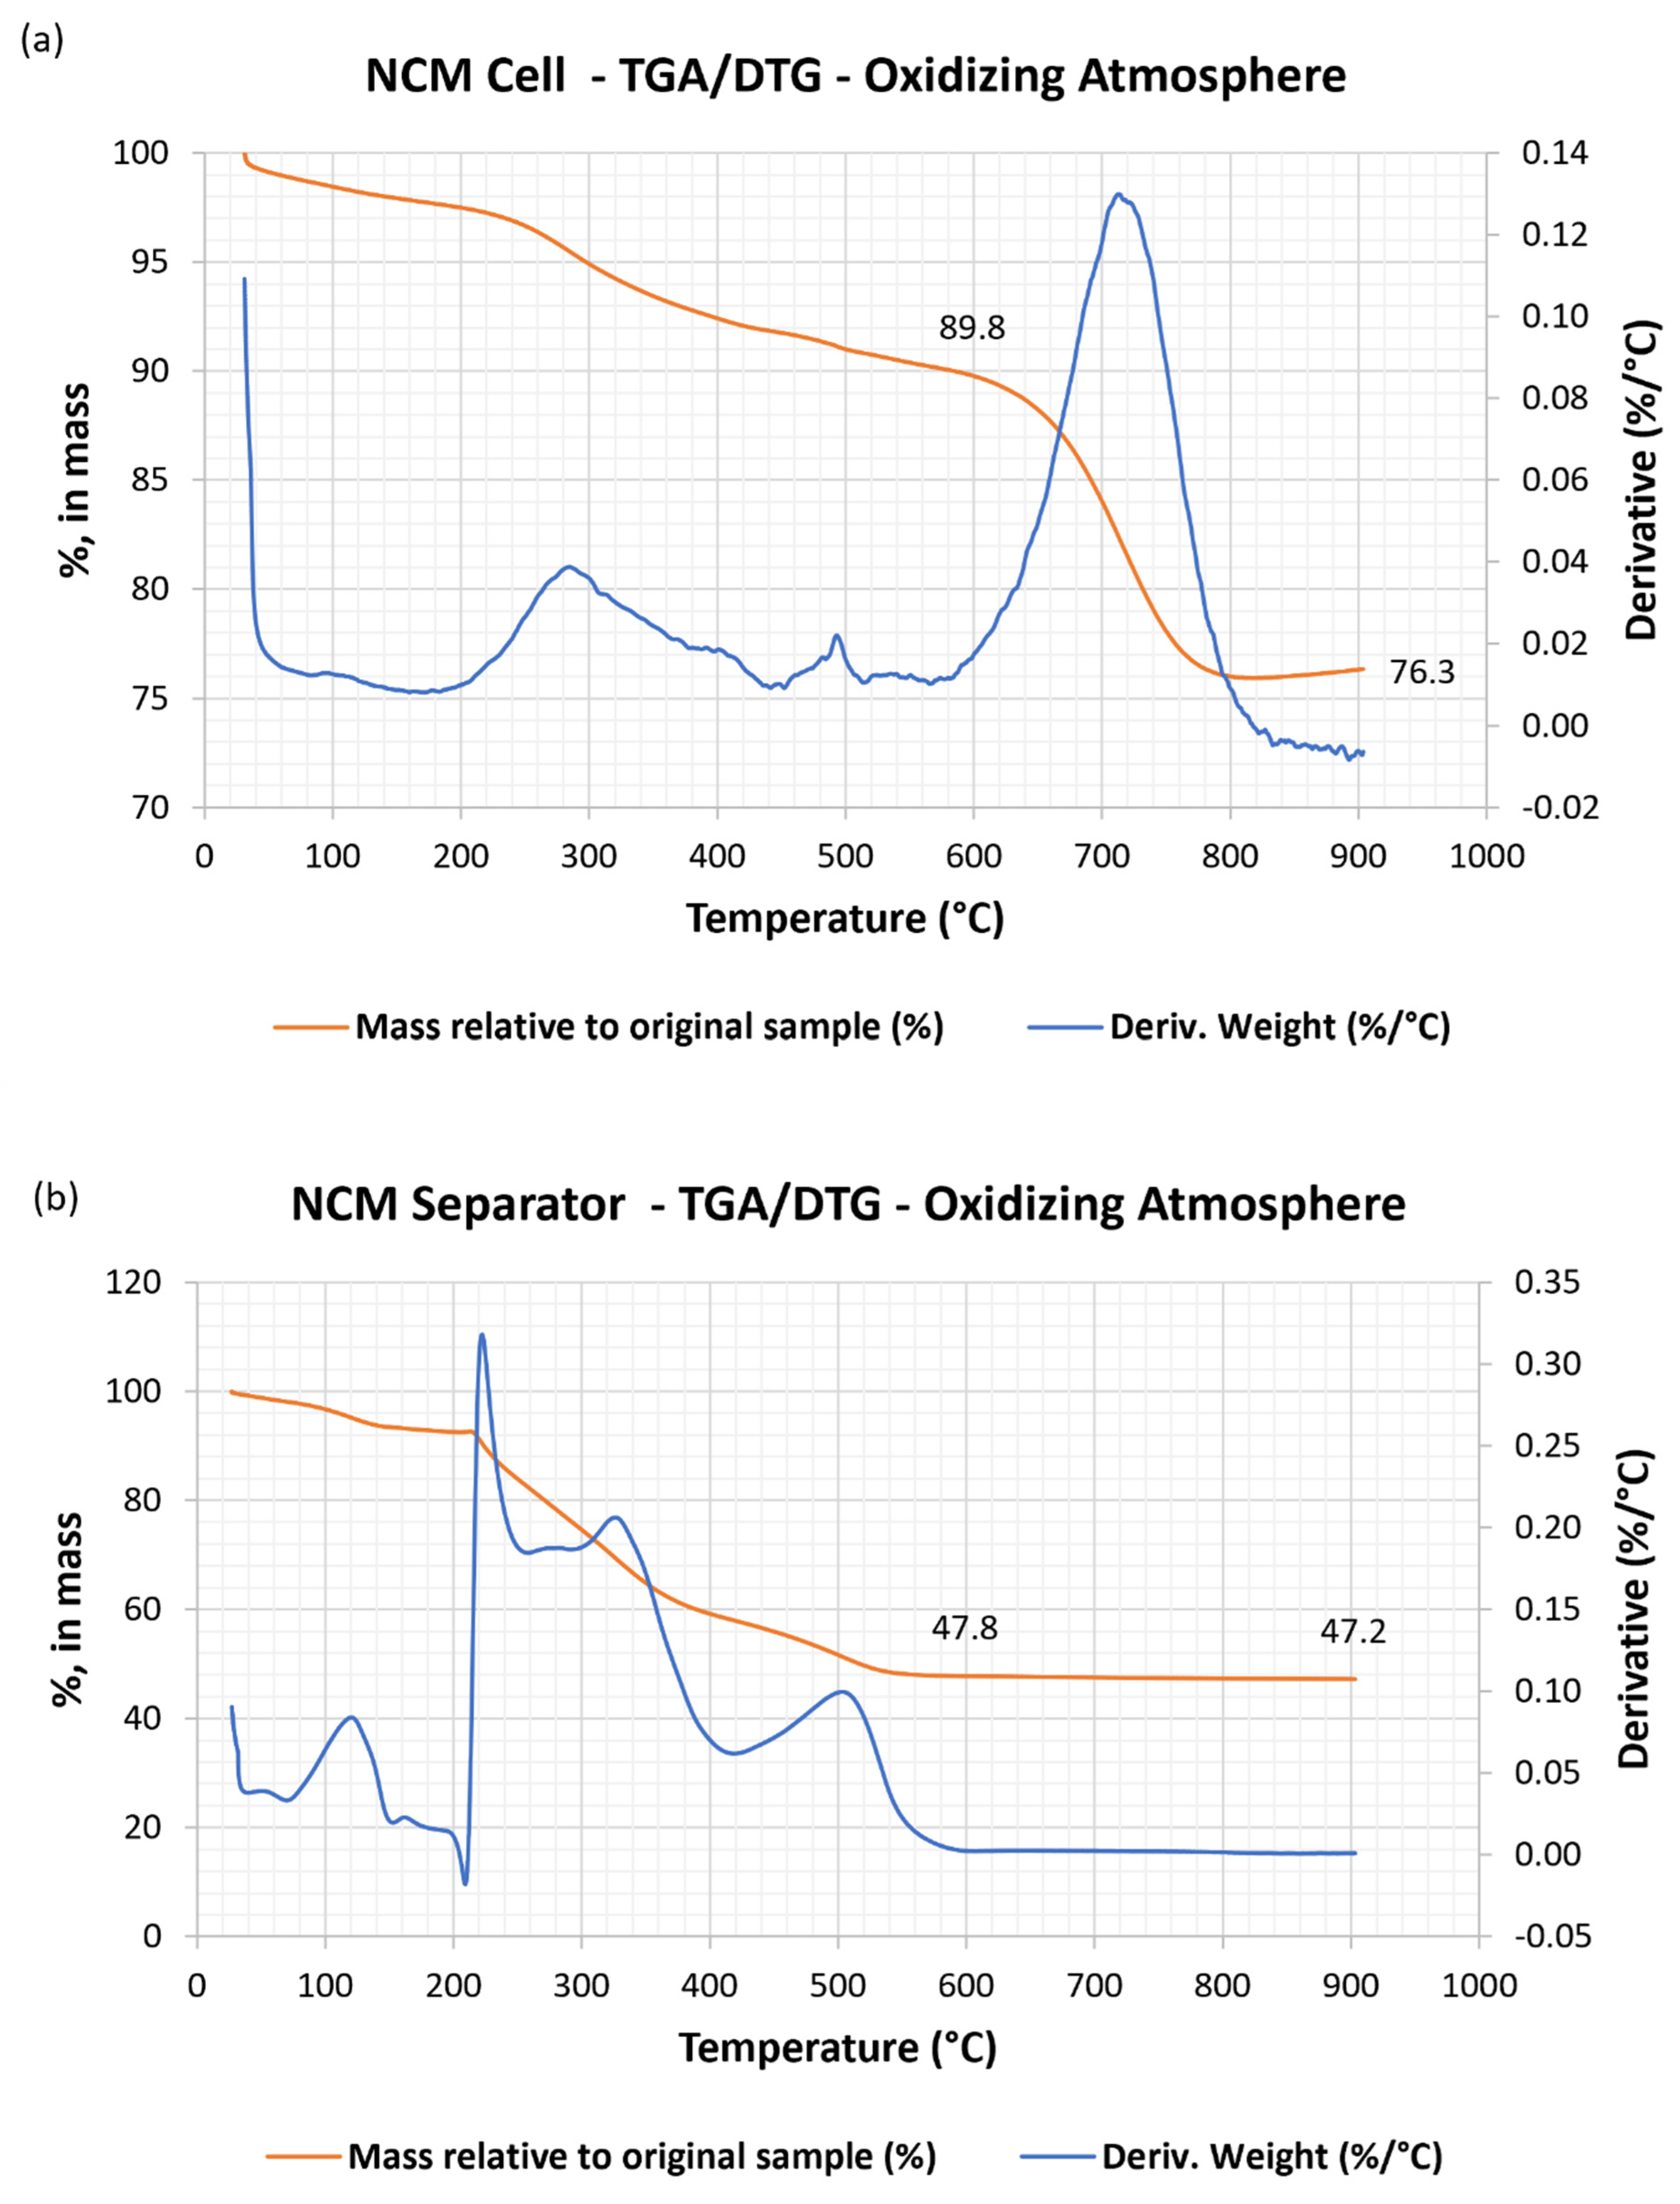
By the TG/DTG analysis of the milled cell (Figure 2a), the beginning of the thermal decomposition process was observed with a slight weight loss below 200°C which can be attributed to residual electrolyte [27]. A second weight loss, more pronounced (approximately 8.0%) was observed between 225-600ºC and was attributed to the decomposition of polymeric materials such as polyethylene (PE) and Polyvinylidene fluoride (PVDF) [28,29]. The third weight loss (approximately 13.5%) was observed between 600-800ºC and can be attributed to the decomposition of graphite [30,31]. Also is observed a high percentage (approximately 76.3%) of residual material, in other words, a material that does not decompose at temperatures below 900 ºC. This high percentage of undecomposed material can be attributed to the presence of metallic material in the sample [32].
In the TG/DTG analysis of the cell polymeric separator (Figure 2b), there was also a first stage below 225°C and a second stage 225-600°C, similar to the stages seen in the TG analysis of the milled cell (Figure 2a). In the second stage, the weight loss was more evident (approximately 45.0 %) and can be attributed to decomposition of polymeric material from the separator. In the DTG analysis, it is possible to observe two peaks in the second stage, which indicates that the separator is made of polyethylene and polyvinylidene fluoride (PE/PVDF) [28]. Furthermore, it is possible to observe a high residue (approximately 47.0%) that can be attributed to the presence of inorganic material in the separator. Nanoparticles of aluminum oxide (Al2O3) or silicon oxide (SiO2), for example, are used in some types of separators to improve some of their properties [33,34].
By the analysis of these results (Figure 2b), it was possible to stablish the temperature of 600°C as the ignition loss temperature to be used in the samples throughout the study.
Figure 2.
TG/DTG analysis under an oxidizing atmosphere of (a) milled NCM cell, whose particle size was n < 0.5 mm (b) cell separator, whose fragment was obtained by disassembling the cell.
Figure 2.
TG/DTG analysis under an oxidizing atmosphere of (a) milled NCM cell, whose particle size was n < 0.5 mm (b) cell separator, whose fragment was obtained by disassembling the cell.
3.1.2. Chemical Characterization of NCM Cells
Figure 3a shows the mass percentage and their standard deviations of Roasted Organic Compounds (ROC) at 600°C, aluminum, cobalt, copper, iron, lithium, manganese, and nickel in the studied NCM cells. Given the contribution of ROC in the cell mass, an FTIR analysis was performed aiming to discover its composition. Figure 3b shows the FTIR of the separator from the NMC cell studied. The absorption bands in 2916 and 2848 cm-1 can be attributed to CH2 asymmetric and symmetric stretching, bands in 1462 and 1472 cm-1 to the bending deformation CH2, and bands in 730 and 719 cm-1 to the rocking deformation, all these bands are typically of polyethylene (PE) [35,36,37,38]. However, absorption bands in 1403 cm-1 can be attributed to bending deformation CH2, 1186, and 1081 cm-1 to the symmetric stretching vibration of CF2. Furthermore, the bands in 778, 846, and 977 cm-1 are typical of polyvinylidene fluoride (PVDF) [39,40,41]. Thus, it is possible to state that the separator is composed of PE coated with PVDF. The other absorption bands can be attributed to the presence of residual carbon and Al2O3, corroborating the results observed in the TGA analysis of the separator (Figure 2b).
3.2. Mechanical Pre-Treatment for Recycling
3.2.1. Chemical Evaluation of All Fractions
The fractions obtained by pre-treatment can be seen in Figure 4a.
In the n > 9.5mm fraction, there was a notable amount of polymer bands (white color) coming from the separators. It was observed that the white material (polymeric separators) content, decreased as the particle size decreased, indicating a tendency for these polymers to concentrate in the coarser fractions The ductility of polymeric separators, an inherent property of thermoplastic materials results in low brittleness, leading to a reduced grinding efficiency and particle size reduction during knife mill process. The ROC parameter was an indication of the mass percentage of this separator.
The n < 0.5 mm fraction was rich in cathodic and anodic material, and consequently the binder and residual organic electrolyte were present in them. Furthermore, the n < 0.5 mm fraction (Figure 4a) had a black color because of the high amount of graphite, which comes from the anode material.
The mechanical process adopted, based on grinding and sieving, showed 3.9% losses in the form of dust to the environment. In various comminution processes, material losses can primarily happen during the grinding phase. Fine particles may escape from the mills and get drawn into the exhaust system. Hence, it is crucial that mills are designed to minimize environmental losses. The concentrations of each fraction are presented in Table 2.
The fraction n < 0.5 mm had 39.2 ± 1.8 of ROC, which was associated with the amount of binder, graphite, and some residual electrolyte. On the other hand, the fraction n > 9.5 mm had 37.8 ± 5.6 of ROC, which was associated with the polymeric separator (Table 2 and Figure 4a). The fraction 1 < n < 9.5 mm had the highest concentration of aluminum and copper. And the n > 4.75 mm fraction had the highest concentration of iron. Considering the concentrations of lithium, nickel, cobalt, and manganese in the particle size fraction n < 0.5, the black mass obtained had cathode material NCM622 or LiNi0.6Co0.2Mn0.2O2.
Elemental distribution in each particle size fraction obtained by mechanical pre-treatment is shown in Figure 4b. The value reported indicates the percentage in relation to the total amount of the element present in the entire cell that was concentrated in each particle size fraction. These results are fundamental to verifying the separation efficiency of mechanical pre-treatment.
Some cathodic material might be lost to the coarser fractions. However, this material generally tends to accumulate in the finer fractions. As can be seen in Figure 4b, 85% of all lithium in the cell was concentrated in the fraction with particle size n < 0.5 mm, and the remaining 15% of lithium was lost in the fractions n > 0.5 mm. Besides, 77.4% of the cobalt, 75.1% of the manganese, and 68.5% of the nickel of the entire cell were concentrated in the n < 0.5 mm fraction. This fraction showed low contamination values for aluminum (2.2%), copper (3.2%), and iron (3.4%), whose percentages are related to the total element content of the entire cell. The fraction n < 0.5, which can be called the black mass, represented 40.4% of the mass of all the cells processed.
The fraction 1 < n < 9.5 mm had 89% of the total amount of aluminum in the cell, and 11% was lost to other fractions. 84 % of all copper was also separated in 1 < n < 9.5 mm, and 16% was lost to other fractions. In addition, 95% of all iron remained in the n > 2 mm fraction, and 5% was lost to other fractions (Figure 4b).
This study focused on mechanically processing cylindrical cells, but pouch and prismatic cells have different casing materials that affect the composition of the coarser fraction, where materials like steel, aluminum, and polymers are concentrated. Recycling processes may vary with these cell types due to differences in casing size and composition, leading to differences in particle size distribution across product fractions [17,42,43,44,45].
The estimated amount of material separated into each fraction, if 1000 kg of milled NCM cells were subjected to the same process, is reported in Figure 4c. The figures do not consider losses since this factor depends on operating conditions. For each ton of pretreated cell, 188.7 kg of iron, 102.4 kg of polymers, 78.6 kg of aluminum, and 73.1 kg of copper would be generated at n > 2 mm. For each ton of cell processed, the black mass (n < 0.5 mm) would contain 27.5 kg of cobalt, 20.2 kg of lithium, 35.6 kg of manganese, and 91.7 kg of nickel, for a total of 174.9 kg of cathode material. This cathode material would be contaminated with 2.0 kg of aluminum, 2.8 kg of copper, and 6.9 kg of iron (Figure 4c). It would not be possible to recover 100% of these metals in subsequent recovery processes (via hydrometallurgy and pyrometallurgy, for example) as there are always losses. However, this study serves as an indication of the granulometric fraction richest in certain metals.
3.2.2. Black Mass (Fraction < 0.5mm): TG/DTG and X-ray Diffraction
The DTG in Figure 5 shows a large peak observed at 710°C that can be attributed to the ROC maximum decomposition rate. The 37.5% mass loss of this peak is compatible with the ROC percentage of 39.2 ± 1.8 % (Table 2). The X-ray diffraction (XRD) analysis of the black mass obtained by mechanical pre-treatment indicates the presence of graphite and Lithium Nickel Cobalt Manganese Oxide phases (Figure 5). Amorphous materials such as polymeric separators are not identified by the analysis.
3.2.3. Economic, Environmental, and Scarcity Potential Evaluation
The potential evaluation of the particle size fractions obtained by mechanical pre-treatment (Figure 6) was designed to indicate the priority fractions for recycling, considering economic (Figure 6a), environmental (Figure 6b) and supply risk aspects (Figure 6c). The values given indicate the order of magnitude, since they do not consider (1) process losses, (2) the efficiency of recovery of the metals mentioned, (3) economic costs, and (4) greenhouse gas emissions from subsequent recycling stages. This analysis also did not account for polymers, graphite, and electrolytic solutions.
3.2.3.1. Economic Potential
As can be seen in Figure 6a, the fraction n < 0.5 mm had the highest economic potential (USD 3,669/ton NCM cell), which was four times more than the second-highest potential fraction, i.e., 2 < n < 4.75 mm (USD 870/ton NCM cell). In contrast, the fraction of black mass (n < 0.5 mm) obtained by the same mechanical process but from LFP cells ranged from 881-1,120 USD/ton LFP cell [22]. This elevated economic potential of the black mass from NCM cells was due to the market value of cobalt (26.62 USD/kg) and lithium carbonate (11.78 USD/kg), both of which are critical raw materials, in addition to nickel (15.80 USD/kg). These results show that the black mass of NCM cells has greater economic potential than the black mass of LFP cells, not considering the costs of the recycling process. Besides, nickel (USD 323/ton NCM cell) was the metal with the highest economic potential in the fraction 2 < n < 4.75 mm. Copper (USD 378/ton NCM cell) was the metal with the highest economic potential in the fraction 4.75 < n < 9.5 mm (Figure 6a).
3.2.3.2. Environmental Burden as Global Warming Potential
In the environmental assessment (Figure 6b), was determined which fractions should be prioritized for recycling to reduce CO2 equivalent emissions per 1 ton of NCM cells obtained through primary production. The fraction n < 0.5 mm represented 103,788 kg CO2-eq/ton NCM cell, primarily due to the presence of nickel, cobalt, and lithium. In contrast, the fraction of black mass (n < 0.5 mm) obtained by the same mechanical process but from LFP cells ranged from 183-388 kg CO2-eq /ton LFP cell [22]. These results indicate that the production of cathode material from NCM cells through primary production results in more carbon emissions than the production of cathode material from LFP cells, disregarding emissions related to the recycling process. The fraction 2 < n < 9.5 mm had an environmental burden as a global warming potential of 122,925 kg CO2-eq, primarily due to the presence of aluminum, iron, copper, and nickel (Figure 6b).
3.2.3.3. Scarcity
Among all the metals present in NCM lithium-ion cells, cobalt and lithium stand out the most in terms of supply risk. The supply risk for n < 0.5 mm was 6.54 (Figure 6c), seven times higher than the second-highest index fraction (2 < n < 4.75 mm). Moreover, the fraction of black mass (n < 0.5 mm) obtained by the same mechanical process but from LFP cells ranged from 1.80-1.84 [22]. Therefore, the n < 0.5 mm fractions are the priority for recycling, considering their scarcity (Figure 6c).
4. Conclusions
The mechanical pre-treatment, which involved grinding and particle size separation, concentrated lithium nickel cobalt manganese oxide, and graphite in the finest fraction (particle size n < 0.5mm), which represented 40.4% on average of the entire mass of NCM cells processed. The fraction n < 0.5 mm had the highest economic potential (USD 3,669/ton NCM cell), which was four times more than the second-highest potential fraction, i.e., 2 < n < 4.75 mm (USD 870/ton NCM cell). In the environmental assessment, the fraction n < 0.5 mm represented 103,788 kg CO2-eq, primarily due to the presence of nickel, cobalt, and lithium. The fraction 2 < n < 9.5 mm had an environmental burden as a global warming potential of 122,925 kg CO2-eq, because of the presence of aluminum, iron, copper, and nickel. Among all the metals present in NCM lithium-ion cells, cobalt and lithium stand out the most in terms of supply risk. The supply risk for n < 0.5 mm was 6.54, seven times higher than the second-highest index fraction (2 < n < 4.75 mm). The n < 0.5 mm fraction (black mass) was the priority for recycling and had greater economic, environmental, and supply risk potential than the black mass of LFP cells.
Author Contributions
Conceptualization: Priscila Silva Silveira Camargo and Hugo Marcelo Veit; Methodology: Priscila Silva Silveira Camargo and Marcelo Pilotto Cenci; Formal analysis and investigation: Priscila Silva Silveira Camargo, Maryanne Hoffmann Cardoso, Roberta dos Reis Costantin, Angela Cristina Kasper, and Felipe Antonio Lucca Sánchez; Writing - original draft preparation: Priscila Silva Silveira Camargo, Maryanne Hoffmann Cardoso, Roberta dos Reis Costantin, and Angela Cristina Kasper; Writing - review, and editing: Priscila Silva Silveira Camargo, Angela Cristina Kasper, Felipe Antonio Lucca Sánchez, and Hugo Marcelo Veit; Funding acquisition: Hugo Marcelo Veit Resources: Hugo Marcelo Veit Supervision: Hugo Marcelo Veit.
Acknowledgments
The authors would like to thank the Brazilian institutions UFRGS- Federal University of Rio Grande do Sul, CNPq-Conselho Nacional de Desenvolvimento Científico e Tecnológico (140764/2021-6 and 382072/2023-5), and CAPES-Coordenação de Aperfeiçoamento de Pessoal de Nível Superior (88887.501183/2020-00 and 88887.374501/2019-00) for supporting this project.
References
- IEA, I.E.A. Global EV Outlook 2023. Geo 2023, 9–10. [Google Scholar]
- Yi, C.; Zhou, L.; Wu, X.; Sun, W.; Yi, L.; Yang, Y. Technology for Recycling and Regenerating Graphite from Spent Lithium-Ion Batteries. Chinese J. Chem. Eng. 2021, 39, 37–50. [Google Scholar] [CrossRef]
- Armand, M.; Axmann, P.; Bresser, D.; Copley, M.; Edström, K.; Ekberg, C.; Guyomard, D.; Lestriez, B.; Novák, P.; Petranikova, M.; et al. Lithium-Ion Batteries – Current State of the Art and Anticipated Developments. J. Power Sources 2020, 479, 228708. [Google Scholar] [CrossRef]
- USGS Mineral Commodity Summaries 2023. 2023, 210. [CrossRef]
- Noh, H.-J.; Youn, S.; Yoon, C.S.; Sun, Y.-K. Comparison of the Structural and Electrochemical Properties of Layered Li[NixCoyMnz]O2 (x = 1/3, 0.5, 0.6, 0.7, 0.8 and 0.85) Cathode Material for Lithium-Ion Batteries. J. Power Sources 2013, 233, 121–130. [Google Scholar] [CrossRef]
- Bak, S.-M.; Hu, E.; Zhou, Y.; Yu, X.; Senanayake, S.D.; Cho, S.-J.; Kim, K.-B.; Chung, K.Y.; Yang, X.-Q.; Nam, K.-W. Structural Changes and Thermal Stability of Charged LiNi x Mn y Co z O 2 Cathode Materials Studied by Combined In Situ Time-Resolved XRD and Mass Spectroscopy. ACS Appl. Mater. Interfaces 2014, 6, 22594–22601. [Google Scholar] [CrossRef]
- McCalla, E.; Carey, G.H.; Dahn, J.R. Lithium Loss Mechanisms during Synthesis of Layered LixNi2−xO2 for Lithium Ion Batteries. Solid State Ionics 2012, 219, 11–19. [Google Scholar] [CrossRef]
- Bi, Y.; Wang, T.; Liu, M.; Du, R.; Yang, W.; Liu, Z.; Peng, Z.; Liu, Y.; Wang, D.; Sun, X. Stability of Li 2 CO 3 in Cathode of Lithium Ion Battery and Its Influence on Electrochemical Performance. RSC Adv. 2016, 6, 19233–19237. [Google Scholar] [CrossRef]
- Shkrob, I.A.; Gilbert, J.A.; Phillips, P.J.; Klie, R.; Haasch, R.T.; Bareño, J.; Abraham, D.P. Chemical Weathering of Layered Ni-Rich Oxide Electrode Materials: Evidence for Cation Exchange. J. Electrochem. Soc. 2017, 164, A1489–A1498. [Google Scholar] [CrossRef]
- Chen, Y.; Song, S.; Zhang, X.; Liu, Y. The Challenges, Solutions and Development of High Energy Ni-Rich NCM/NCA LiB Cathode Materials. J. Phys. Conf. Ser. 2019, 1347, 012012. [Google Scholar] [CrossRef]
- Jiang, S.; Zhang, L.; Hua, H.; Liu, X.; Wu, H.; Yuan, Z. Assessment of End-of-Life Electric Vehicle Batteries in China: Future Scenarios and Economic Benefits. Waste Manag. 2021, 135, 70–78. [Google Scholar] [CrossRef]
- Yun, L.; Linh, D.; Shui, L.; Peng, X.; Garg, A.; LE, M.L.P.; Asghari, S.; Sandoval, J. Metallurgical and Mechanical Methods for Recycling of Lithium-Ion Battery Pack for Electric Vehicles. Resour. Conserv. Recycl. 2018, 136, 198–208. [Google Scholar] [CrossRef]
- Li, P.; Luo, S.; Zhang, L.; Liu, Q.; Wang, Y.; Lin, Y.; Xu, C.; Guo, J.; Cheali, P.; Xia, X. Progress, Challenges, and Prospects of Spent Lithium-Ion Batteries Recycling: A Review. J. Energy Chem. 2024, 89, 144–171. [Google Scholar] [CrossRef]
- Dunn, J.; Kendall, A.; Slattery, M. Electric Vehicle Lithium-Ion Battery Recycled Content Standards for the US – Targets, Costs, and Environmental Impacts. Resour. Conserv. Recycl. 2022, 185, 106488. [Google Scholar] [CrossRef]
- Bertuol, D.A.; Toniasso, C.; Jiménez, B.M.; Meili, L.; Dotto, G.L.; Tanabe, E.H.; Aguiar, M.L. Application of Spouted Bed Elutriation in the Recycling of Lithium Ion Batteries. J. Power Sources 2015, 275, 627–632. [Google Scholar] [CrossRef]
- Ahuis, M.; Aluzoun, A.; Keppeler, M.; Melzig, S.; Kwade, A. Direct Recycling of Lithium-Ion Battery Production Scrap – Solvent-Based Recovery and Reuse of Anode and Cathode Coating Materials. J. Power Sources 2024, 593, 233995. [Google Scholar] [CrossRef]
- Colledani, M.; Gentilini, L.; Mossali, E.; Picone, N. A Novel Mechanical Pre-Treatment Process-Chain for the Recycling of Li-Ion Batteries. CIRP Ann. 2023, 72, 17–20. [Google Scholar] [CrossRef]
- Zhang, G.; Yuan, X.; He, Y.; Wang, H.; Zhang, T.; Xie, W. Recent Advances in Pretreating Technology for Recycling Valuable Metals from Spent Lithium-Ion Batteries. J. Hazard. Mater. 2021, 406, 124332. [Google Scholar] [CrossRef]
- Ku, H.; Jung, Y.; Jo, M.; Park, S.; Kim, S.; Yang, D.; Rhee, K.; An, E.M.; Sohn, J.; Kwon, K. Recycling of Spent Lithium-Ion Battery Cathode Materials by Ammoniacal Leaching. J. Hazard. Mater. 2016, 313, 138–146. [Google Scholar] [CrossRef]
- ASTM-E473 Standard Terminology Relating to Thermal Analysis and Rheology. ASTM Int. 2014, 1–3.
- ASTM-E1131 Standard Test Method for Compositional Analysis by Thermogravimetry. ASTM Int. 2015, 08, 6.
- Camargo, P.S.S.; Gomes Osório Torres, G.; Pacheco, J.A.S.; Cenci, M.P.; Kasper, A.C.; Veit, H.M. Mechanical Methods for Materials Concentration of Lithium Iron Phosphate (LFP) Cells and Product Potential Evaluation for Recycling. Environ. Sci. Pollut. Res. 2024. [Google Scholar] [CrossRef]
- Daily Metal Prices Metal Price Charts 2024.
- Business Analytiq Manganese Price July 2024 2024.
- Ortego, A.; Calvo, G.; Valero, A.; Iglesias-Émbil, M.; Valero, A.; Villacampa, M. Assessment of Strategic Raw Materials in the Automobile Sector. Resour. Conserv. Recycl. 2020, 161, 104968. [Google Scholar] [CrossRef]
- Valero, A.; Valero, A.; Calvo, G.; Ortego, A. Material Bottlenecks in the Future Development of Green Technologies. Renew. Sustain. Energy Rev. 2018, 93, 178–200. [Google Scholar] [CrossRef]
- Niu, B.; Xu, Z.; Xiao, J.; Qin, Y. Recycling Hazardous and Valuable Electrolyte in Spent Lithium-Ion Batteries: Urgency, Progress, Challenge, and Viable Approach. Chem. Rev. 2023, 123, 8718–8735. [Google Scholar] [CrossRef] [PubMed]
- Miandad, R.; Rehan, M.; Barakat, M.A.; Aburiazaiza, A.S.; Khan, H.; Ismail, I.M.I.; Dhavamani, J.; Gardy, J.; Hassanpour, A.; Nizami, A.S. Catalytic Pyrolysis of Plastic Waste: Moving toward Pyrolysis Based Biorefineries. Front. Energy Res. 2019, 7, 1–17. [Google Scholar] [CrossRef]
- Park, K.B.; Kim, J.S. Pyrolysis Products from Various Types of Plastics Using TG-FTIR at Different Reaction Temperatures. J. Anal. Appl. Pyrolysis 2023, 171, 1–10. [Google Scholar] [CrossRef]
- Slough, G. Thermogravimetric Analysis of Powdered Graphite for Lithium-Ion Batteries. TA Instruments, 1–5.
- Nazarov, V.I.; Makarenkov, D.A.; Retivov, V.M.; Popov, A.P.; Aflyatunova, G.R.; Sivachenko, L.A.; Sotnik, L.L. Features of the Pyrolysis Process of Waste Batteries Using Carbon Black as an Additive in the Construction Industry. Constr. Mater. Prod. 2023, 6. [Google Scholar] [CrossRef]
- Silveira, A.V.M.; Santana, M.P.; Tanabe, E.H.; Bertuol, D.A. Recovery of Valuable Materials from Spent Lithium Ion Batteries Using Electrostatic Separation. Int. J. Miner. Process. 2017, 169, 91–98. [Google Scholar] [CrossRef]
- Finegan, D.P.; Cooper, S.J.; Tjaden, B.; Taiwo, O.O.; Gelb, J.; Hinds, G.; Brett, D.J.L.; Shearing, P.R. Characterising the Structural Properties of Polymer Separators for Lithium-Ion Batteries in 3D Using Phase Contrast X-Ray Microscopy. J. Power Sources 2016, 333, 184–192. [Google Scholar] [CrossRef]
- Heidari, A.A.; Mahdavi, H. Recent Development of Polyolefin-Based Microporous Separators for Li−Ion Batteries: A Review. Chem. Rec. 2020, 20, 570–595. [Google Scholar] [CrossRef]
- Gulmine, J. V.; Janissek, P.R.; Heise, H.M.; Akcelrud, L. Polyethylene Characterization by FTIR. Polym. Test. 2002, 21, 557–563. [Google Scholar] [CrossRef]
- Signoret, C.; Edo, M.; Caro-Bretelle, A.S.; Lopez-Cuesta, J.M.; Ienny, P.; Perrin, D. MIR Spectral Characterization of Plastic to Enable Discrimination in an Industrial Recycling Context: III. Anticipating Impacts of Ageing on Identification. Waste Manag. 2020, 109, 51–64. [Google Scholar] [CrossRef] [PubMed]
- Brogly, M.; Bistac, S.; Bindel, D. Advanced Surface FTIR Spectroscopy Analysis of Poly(Ethylene)-Block-Poly(Ethylene Oxide) Thin Film Adsorbed on Gold Substrate. Appl. Surf. Sci. 2022, 603. [Google Scholar] [CrossRef]
- Mark Jordi FTIR for Identification of Contamination. Jordi 2017.
- Martins, P.; Lopes, A.C.; Lanceros-Mendez, S. Electroactive Phases of Poly(Vinylidene Fluoride): Determination, Processing and Applications. Prog. Polym. Sci. 2014, 39, 683–706. [Google Scholar] [CrossRef]
- Saviello, D.; Toniolo, L.; Goidanich, S.; Casadio, F. Non-Invasive Identification of Plastic Materials in Museum Collections with Portable FTIR Reflectance Spectroscopy: Reference Database and Practical Applications. Microchem. J. 2016, 124, 868–877. [Google Scholar] [CrossRef]
- Pražanová, A.; Kočí, J.; Míka, M.H.; Pilnaj, D.; Plachý, Z.; Knap, V. Pre-Recycling Material Analysis of NMC Lithium-Ion Battery Cells from Electric Vehicles. Crystals 2023, 13. [Google Scholar] [CrossRef]
- Wilke, C.; Kaas, A.; Peuker, U.A. Influence of the Cell Type on the Physical Processes of the Mechanical Recycling of Automotive Lithium-Ion Batteries. Metals (Basel). 2023, 13, 1901. [Google Scholar] [CrossRef]
- Pinegar, H.; Smith, Y.R. End-of-Life Lithium-Ion Battery Component Mechanical Liberation and Separation. JOM 2019, 71, 4447–4456. [Google Scholar] [CrossRef]
- Wilke, C.; Kaas, A.; Peuker, U.A. Influence of the Cell Type on Yield and Composition of Black Mass Deriving from a Mechanical Recycling Process of Automotive Lithium-Ion Batteries. Next Sustain. 2024, 4, 100050. [Google Scholar] [CrossRef]
- Blankemeyer, S.; Wiens, D.; Wiese, T.; Raatz, A.; Kara, S. Investigation of the Potential for an Automated Disassembly Process of BEV Batteries. Procedia CIRP 2021, 98, 559–564. [Google Scholar] [CrossRef]
Figure 3.
(a) Mass percentage and their standard deviations of Roasted Organic Compounds (ROC) at 600°C, aluminum, cobalt, copper, iron, lithium, manganese, and nickel in the studied NCM cells. ROC indicates the polymers of separators, binders, and organic electrolytes thermally degraded at 600°C. (b) FTIR analysis of the separator of the NCM cell studied.
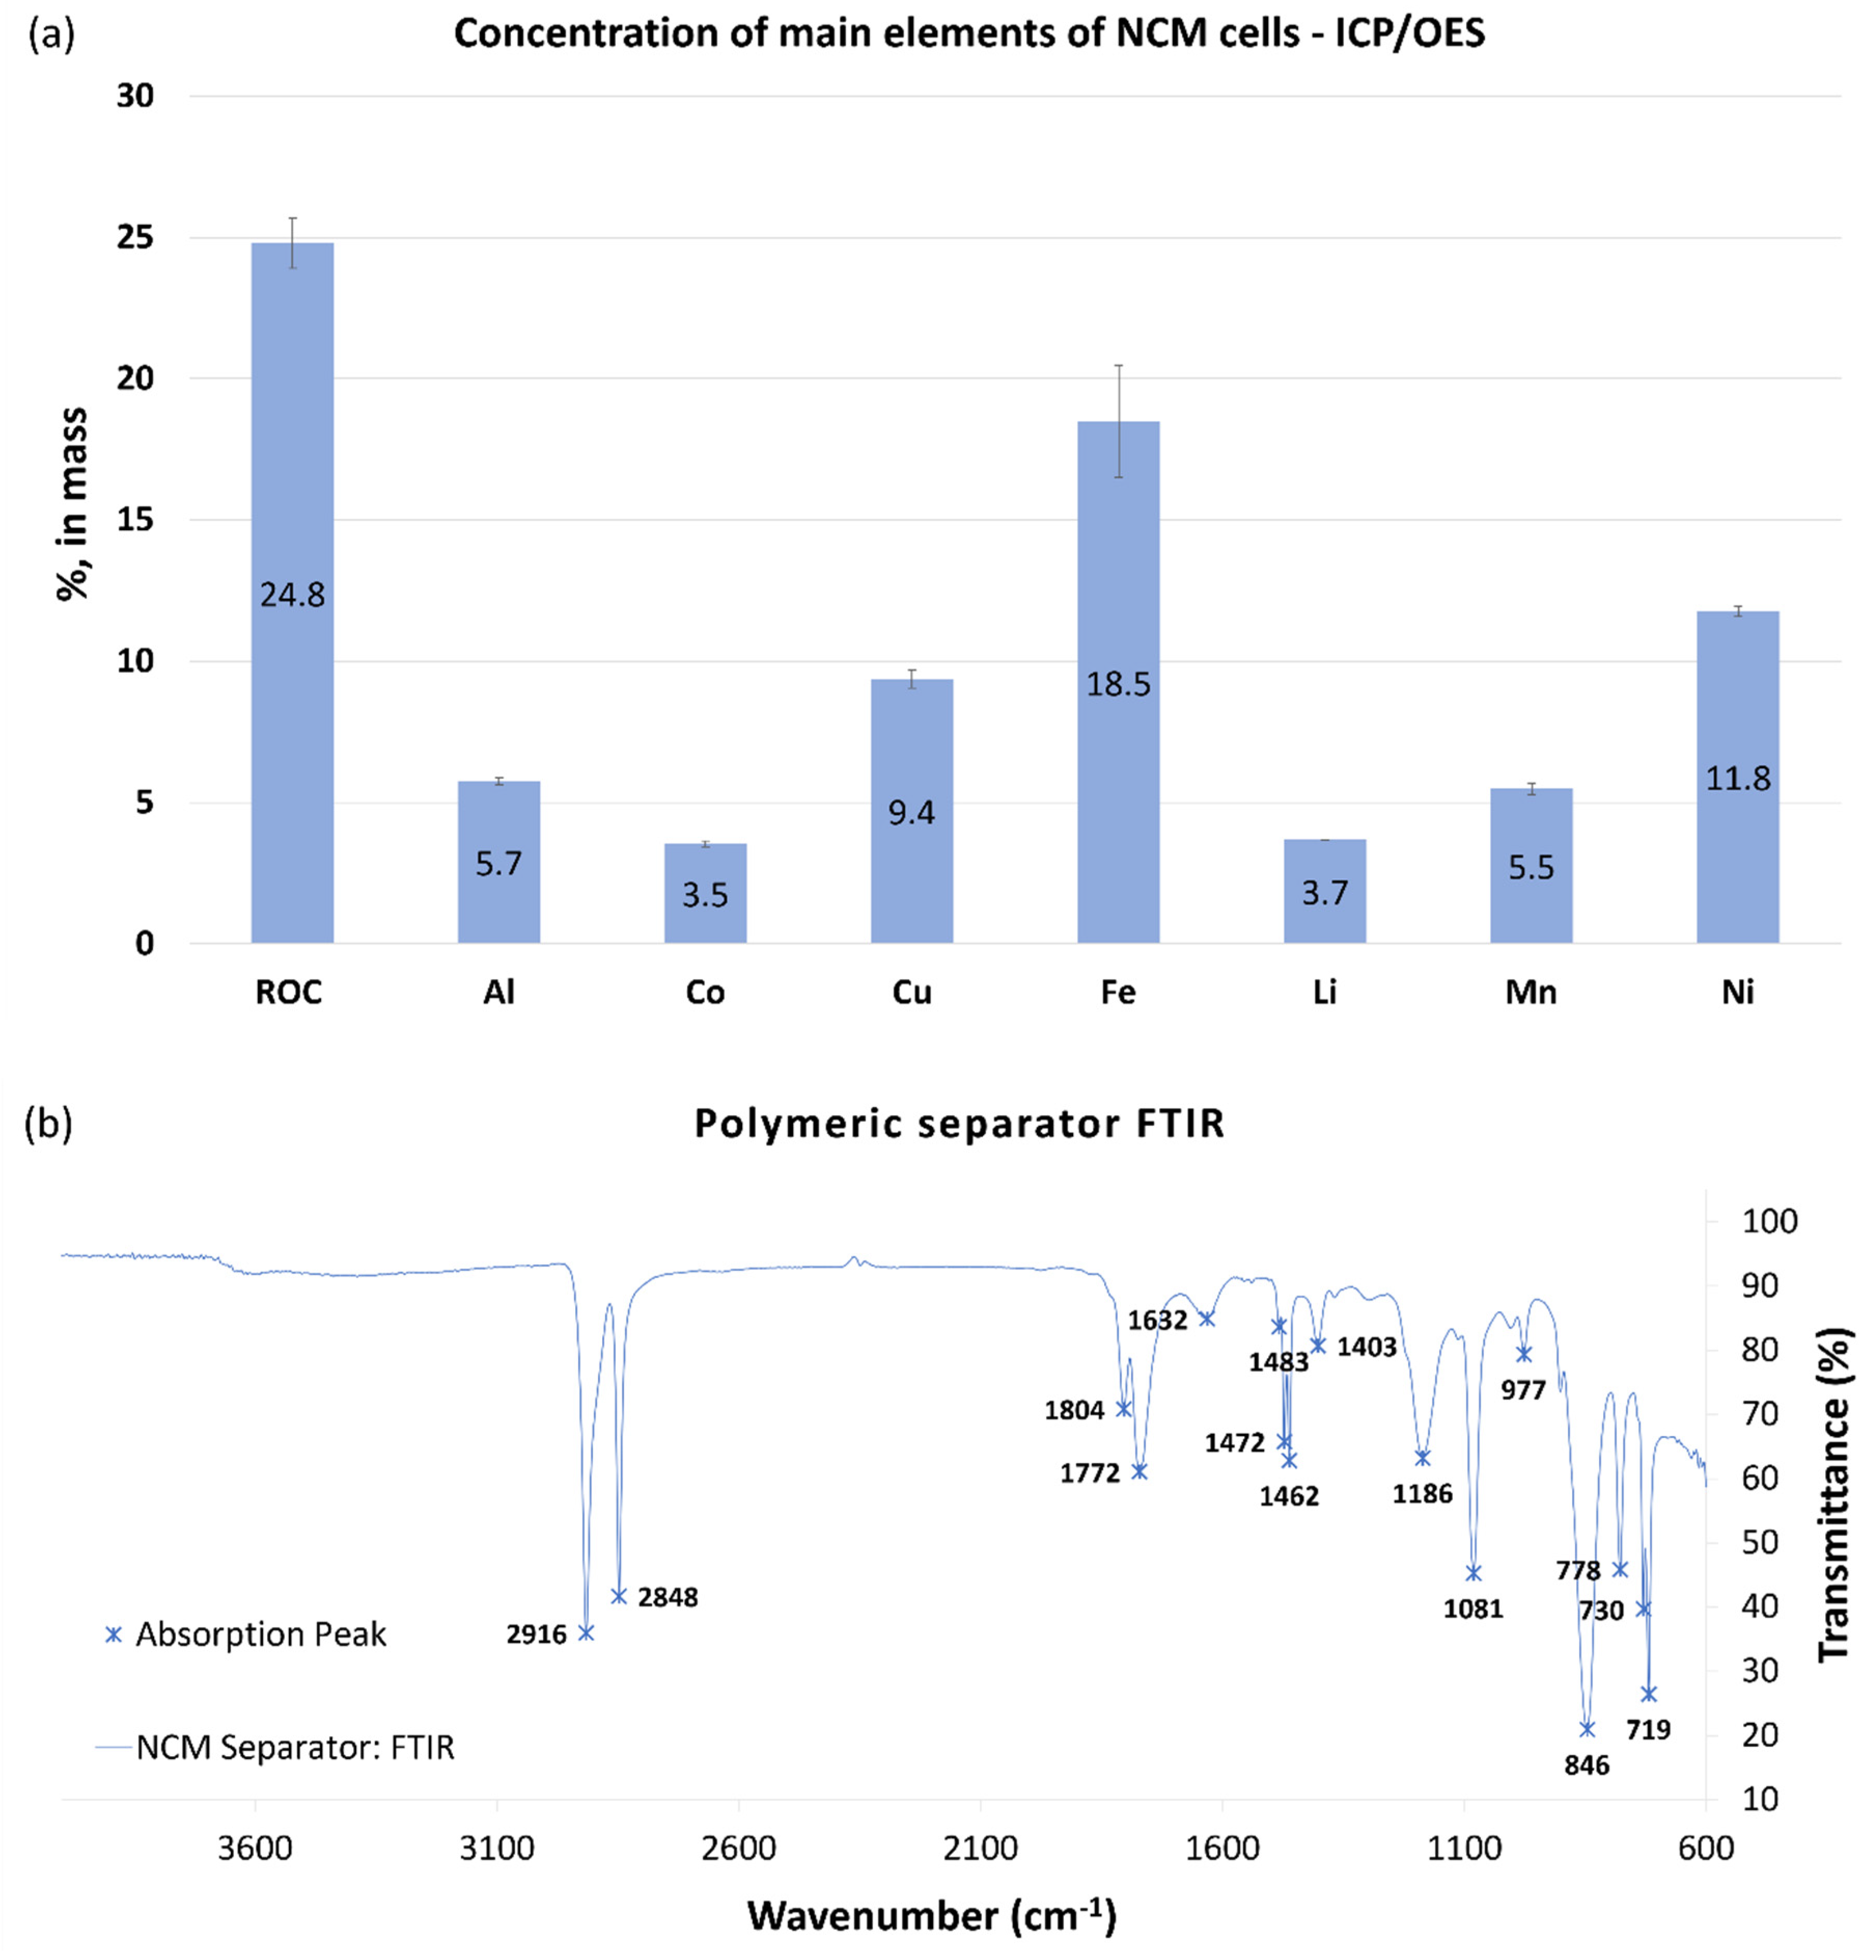
Figure 4.
(a) Particle size fractions obtained by mechanical pre-treatment of grinding and sieving of NCM cells. (b) Percentage mass distribution of the main elements in the granulometric fractions obtained by mechanical pre-treatment. The data shows the ratio of the mass of the element found in the fraction to the total mass of the element identified in the characterization of the NCM cell. (c) Distribution in kilograms of metals and ROC in each particle size fraction for 1 ton of processed NCM cells. ROC indicates the polymers of separators, binders, and organic electrolytes thermally degraded at 600°C.
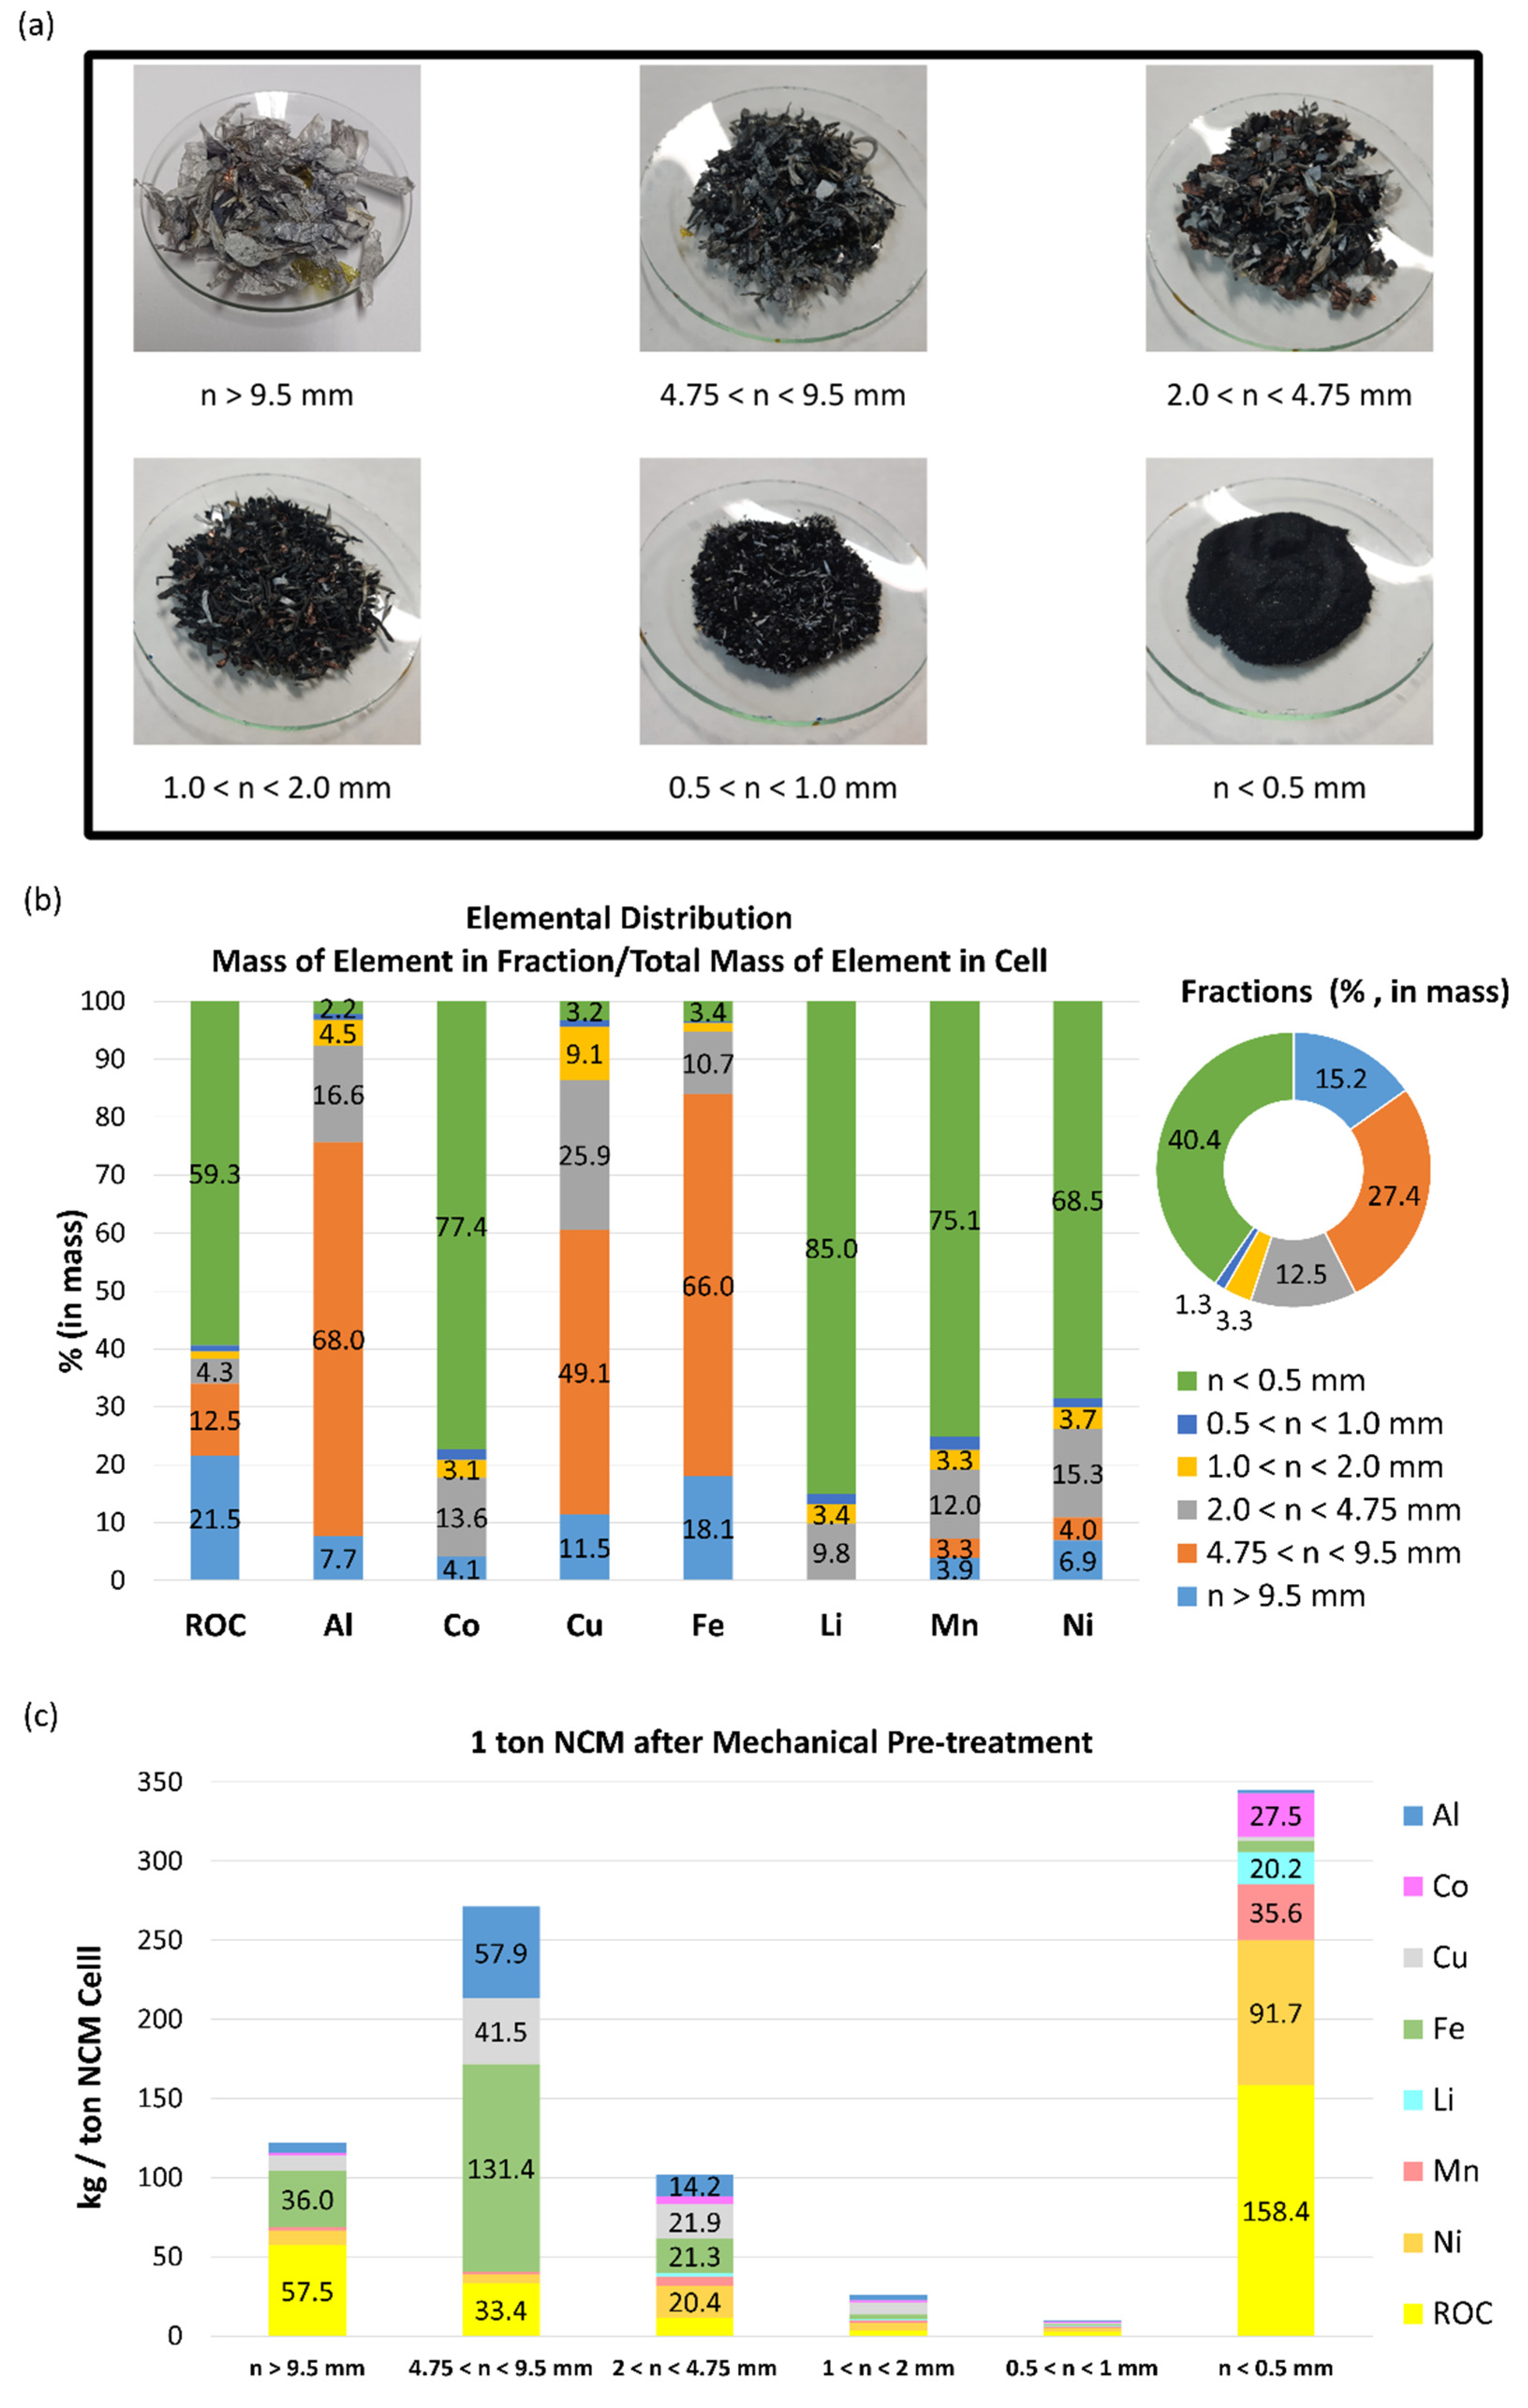
Figure 5.
(a) TG/DTG analysis of cell black mass, under an oxidizing atmosphere, which was obtained by mechanical pre-treatment (n < 0.5 mm). (b) X-ray diffraction (XRD) analysis of the black mass obtained by mechanical pre-treatment of NCM cells.
Figure 5.
(a) TG/DTG analysis of cell black mass, under an oxidizing atmosphere, which was obtained by mechanical pre-treatment (n < 0.5 mm). (b) X-ray diffraction (XRD) analysis of the black mass obtained by mechanical pre-treatment of NCM cells.
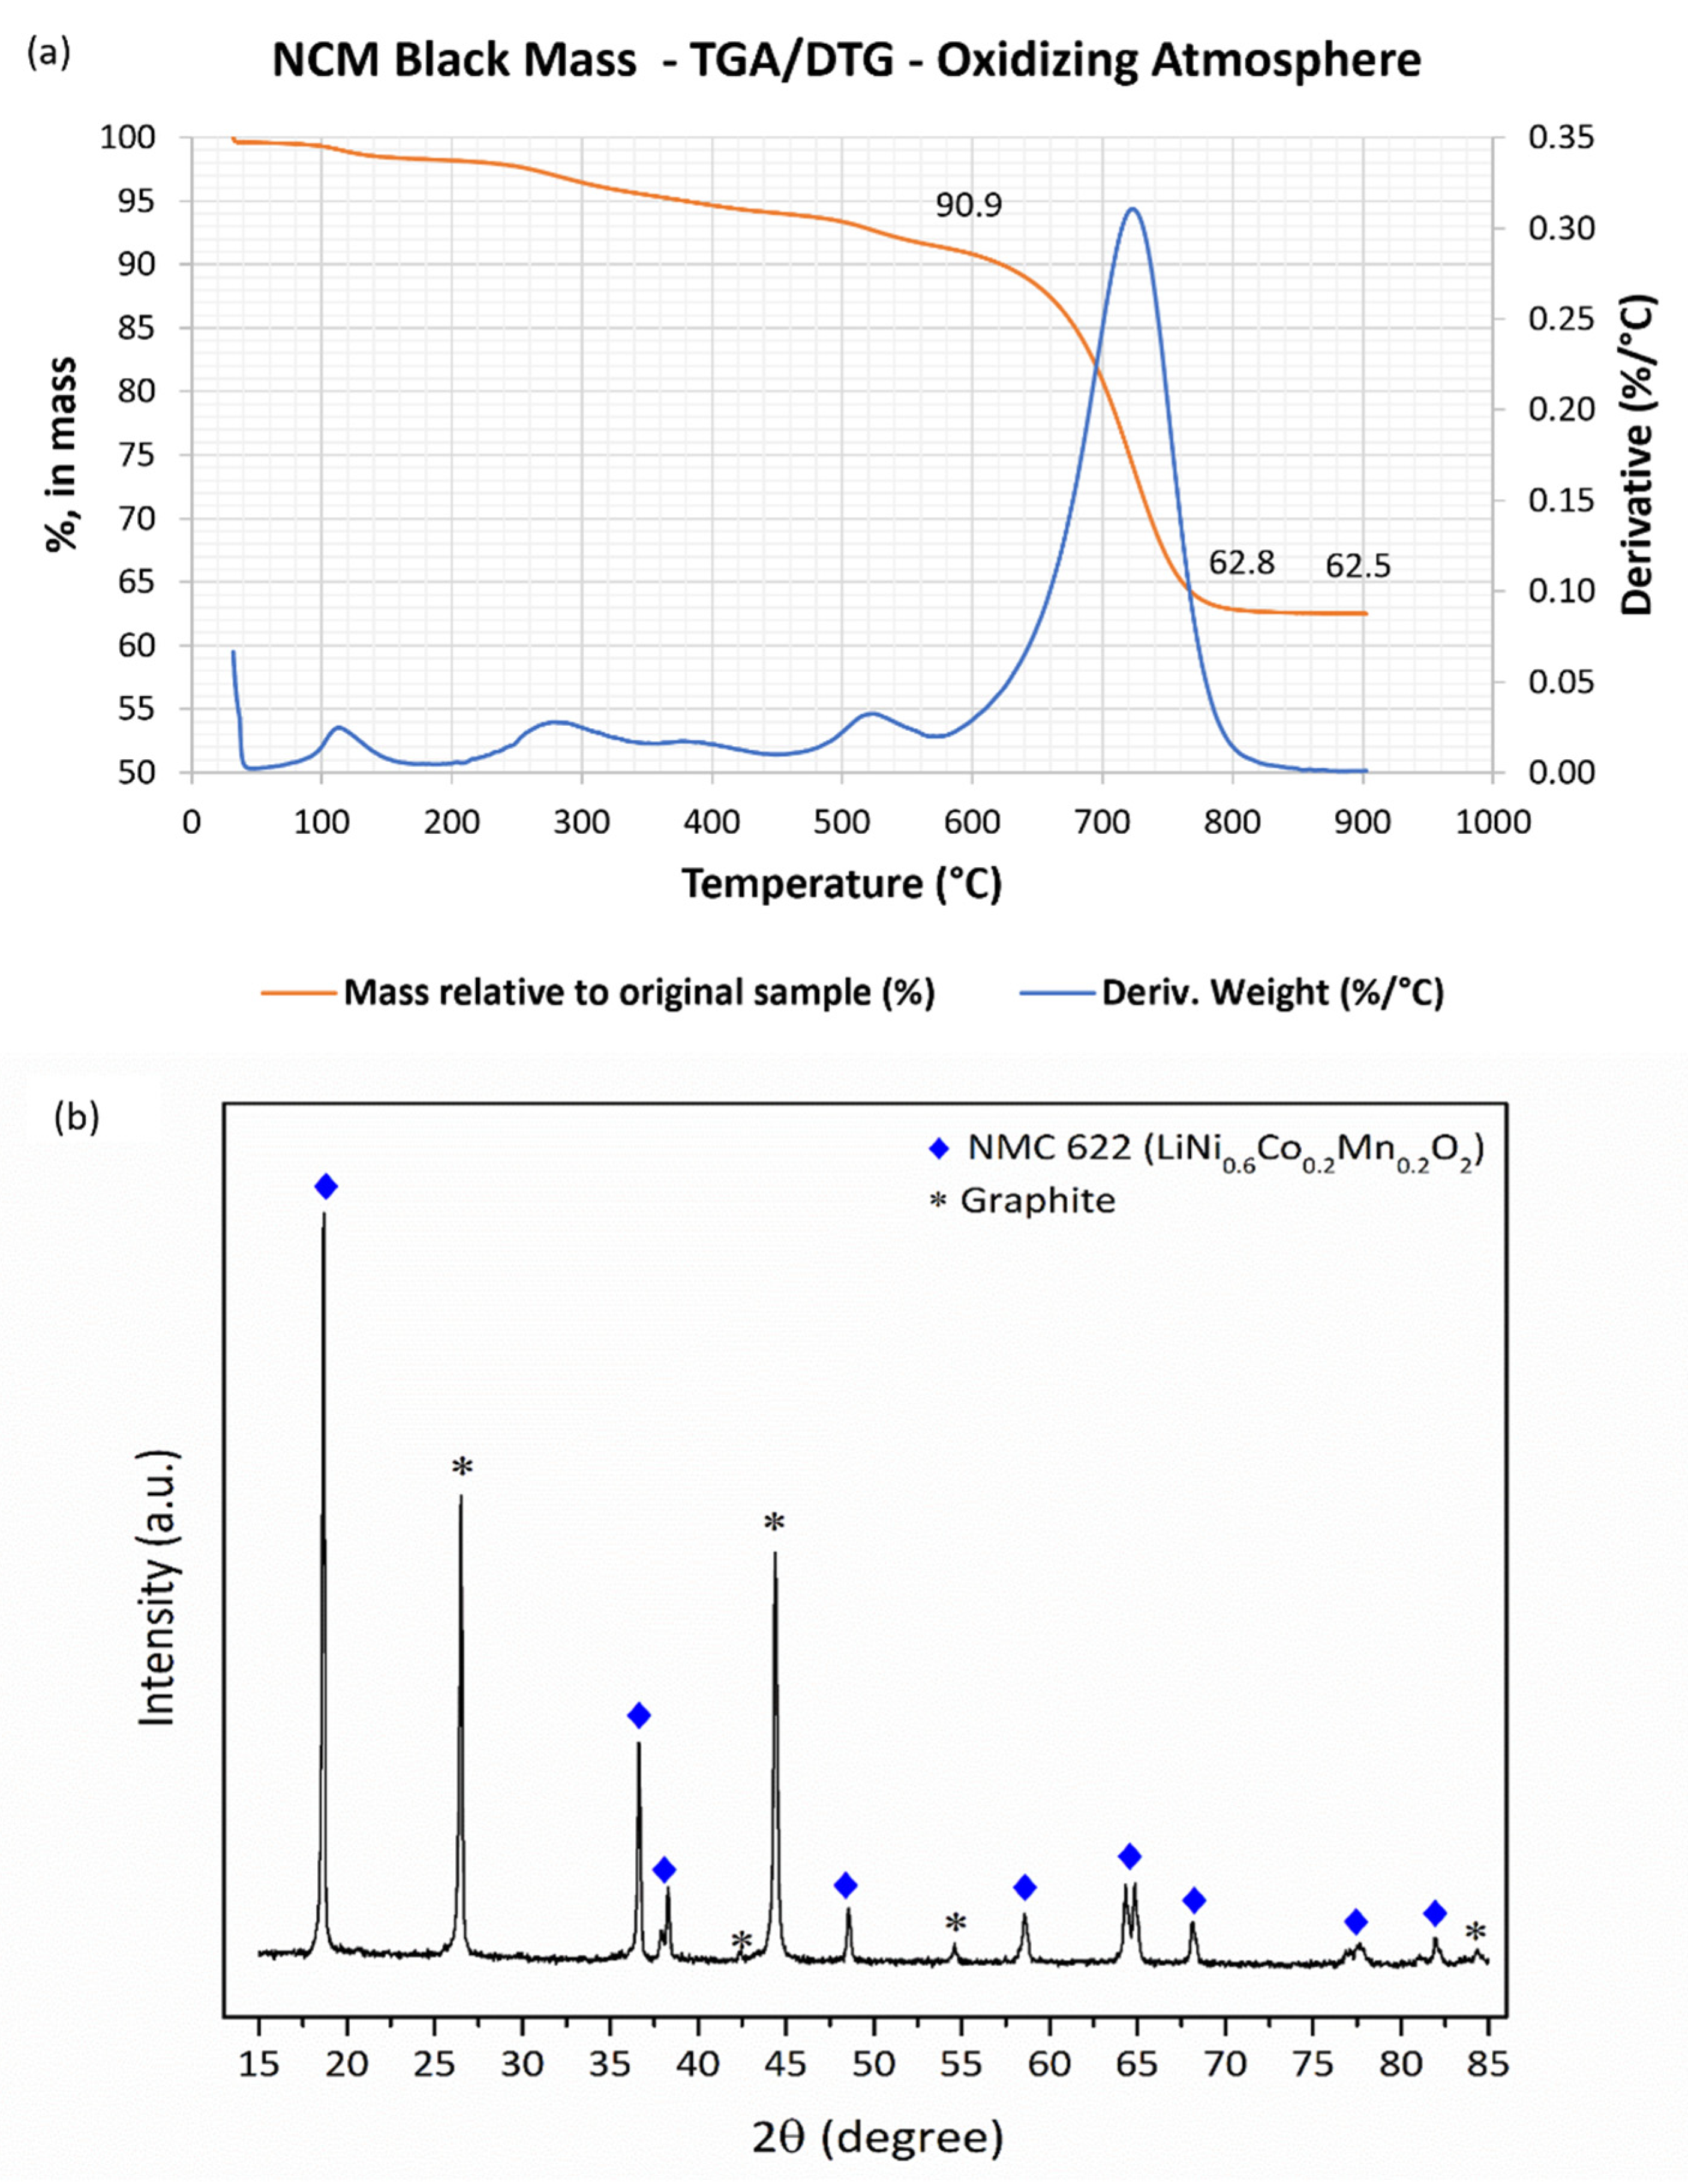
Figure 6.
(a) Economic potential (in US dollars) of the particle size fractions obtained by processing 1 ton of NCM cells. (b) Environmental burden as global warming potential (in kg CO2-eq/ton NCM Cell) of the particle size fractions obtained by processing 1 ton of NCM cells. (c) Supply risk (scarcity) of the fractions obtained by mechanical pre-treatment.
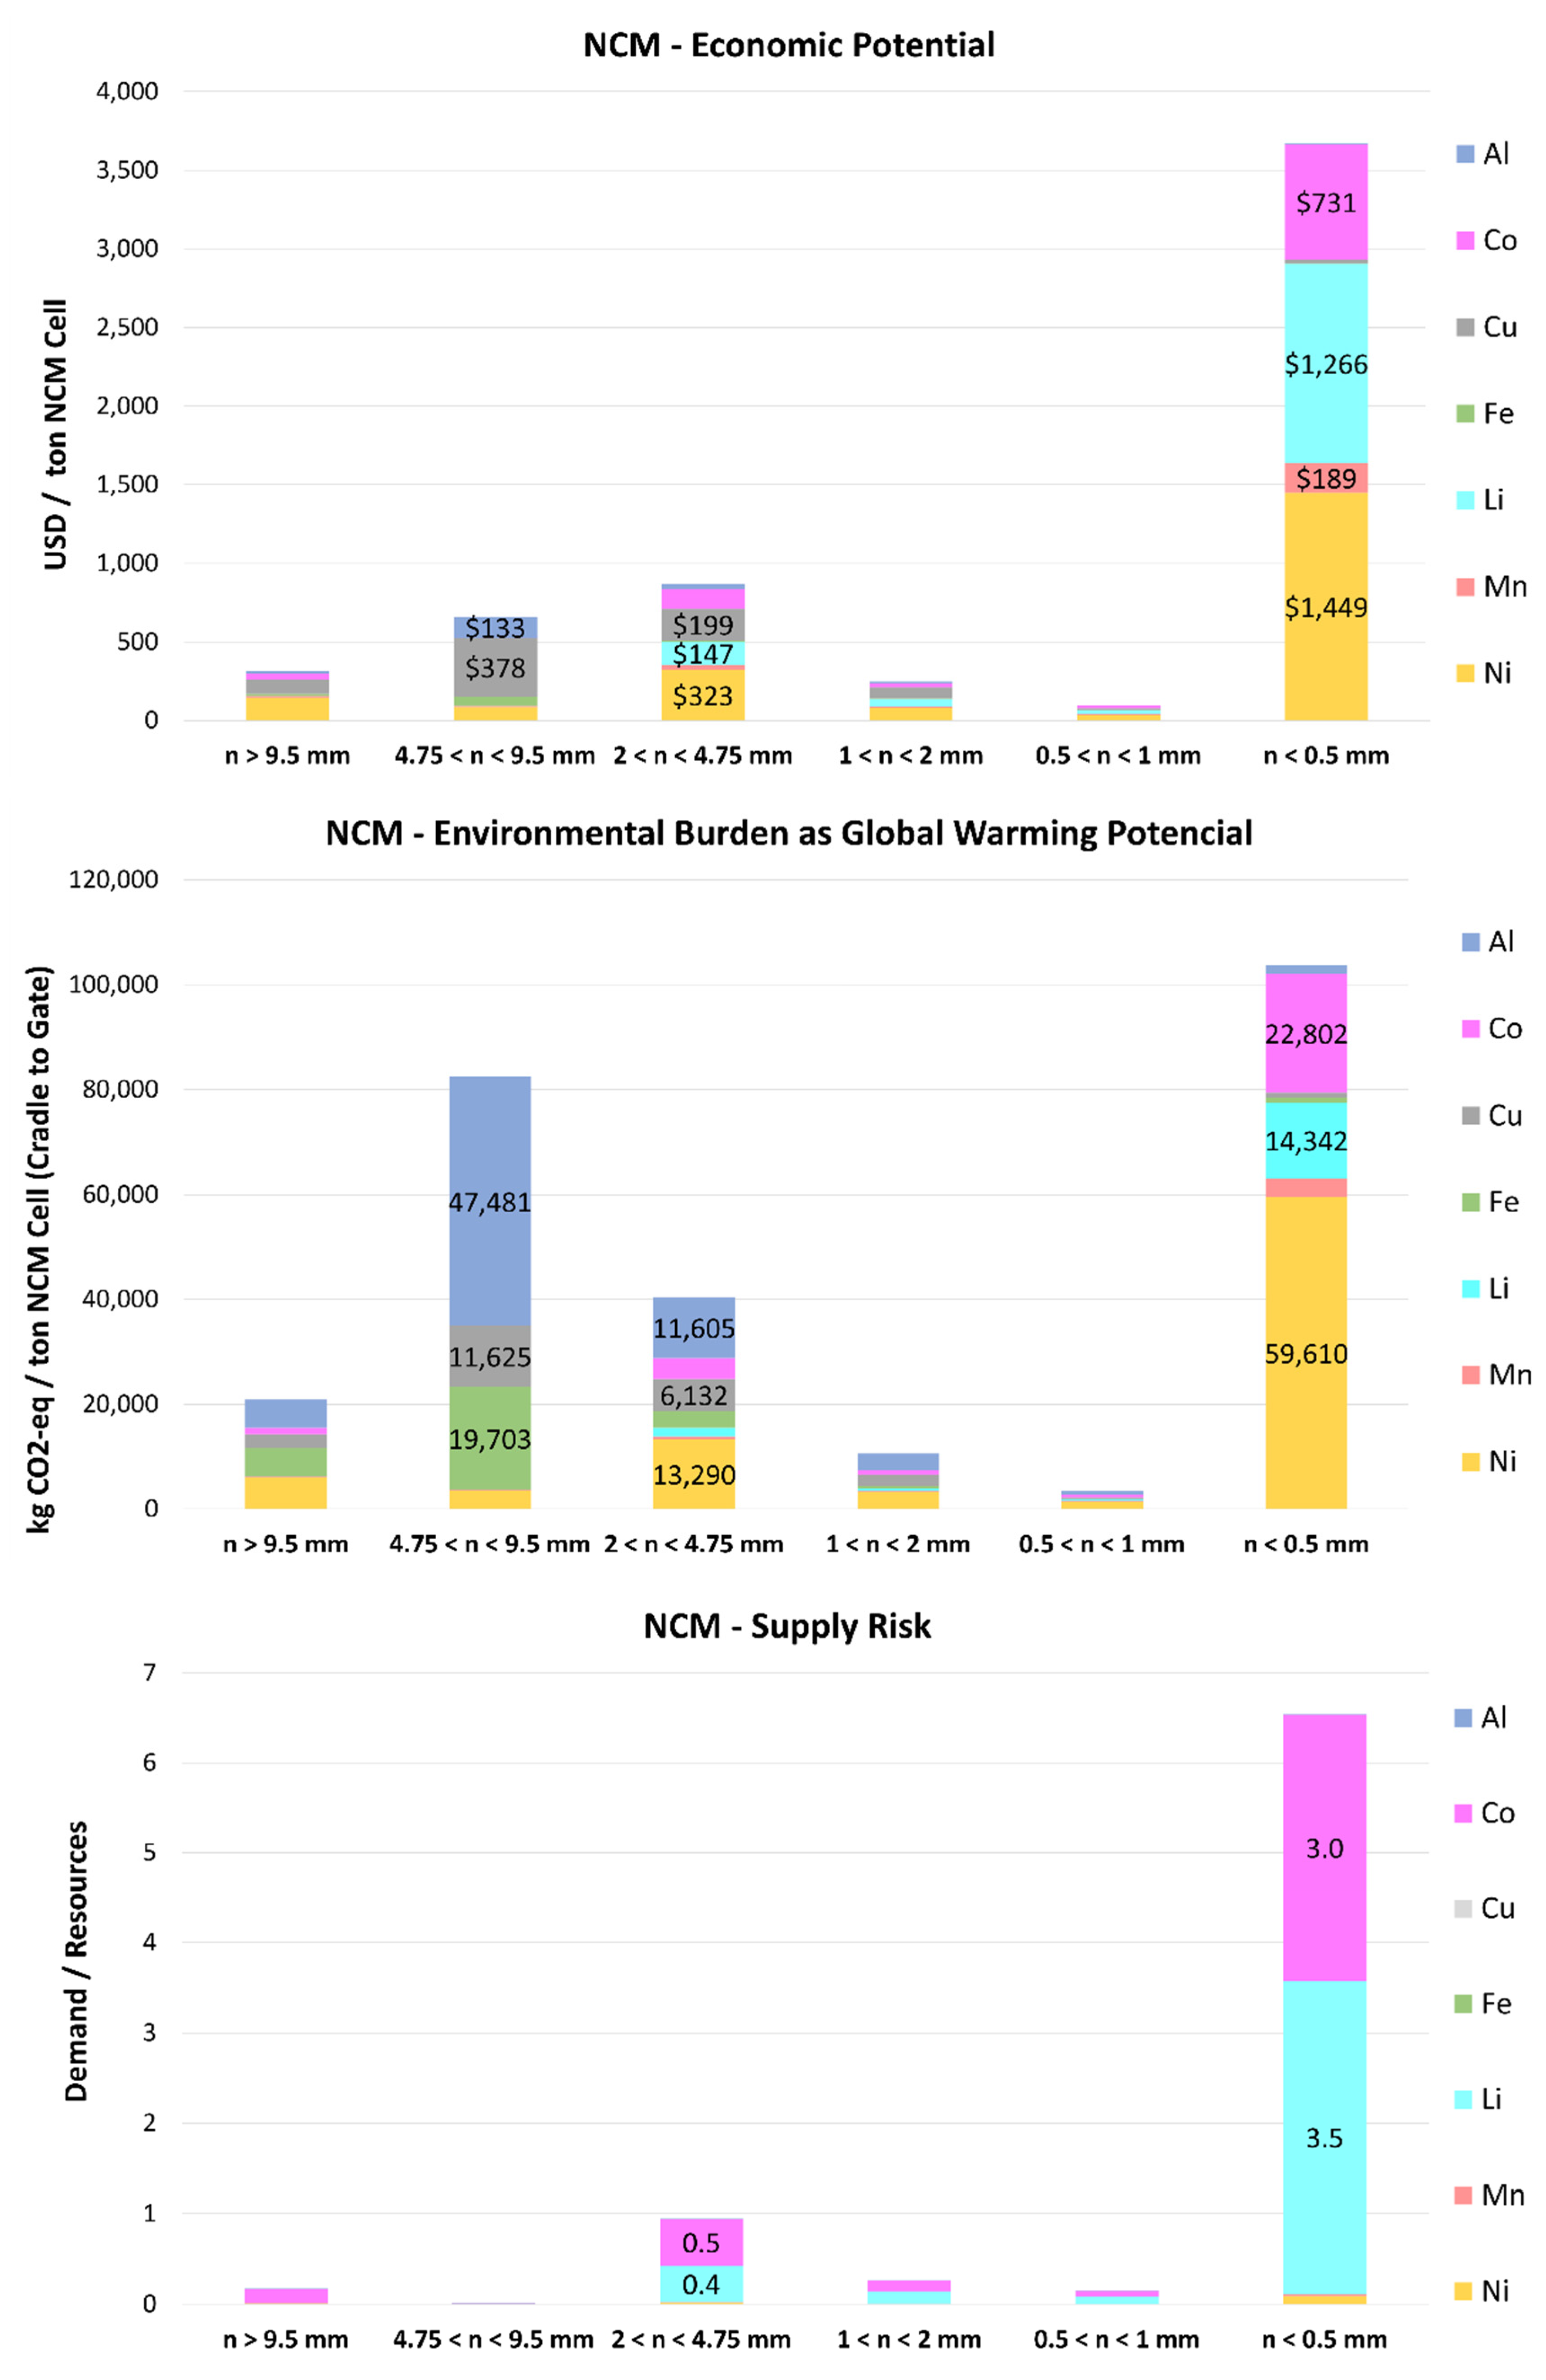
Table 2.
Percentage concentration (by mass) of the particle size fractions obtained by pre-treatment in the NCM cells studied.
Table 2.
Percentage concentration (by mass) of the particle size fractions obtained by pre-treatment in the NCM cells studied.
| Concentrations of the fractions obtained by mechanical pre-treatment (%, in mass) | |||||||
| n > 9.5 mm | 4.75 < n < 9.5 mm | 2 < n < 4.75 mm | 1 < n < 2 mm | 0.5 < n < 1 mm | n < 0.5 mm | ||
| ROC | 37.8 ± 5.6 | 12.2 ±0.6 | 9.2 ± 0.8 | 9.8 ± 1.6 | 22.3 ± 1.6 | 39.2 ± 1.8 | |
| Al | 4.3 ± 1.3 | 21.1 ± 1.4 | 11.3 ± 1.4 | 11.7 ± 1.4 | 6.1 ± 0.9 | 0.5 ± 0.0 | |
| Co | 1.0 ± 0.3 | 0.0 ± 1.3 | 3.9 ± 0.6 | 3.3 ± 0.5 | 5.0 ± 0.8 | 6.8 ± 1.6 | |
| Cu | 6.4 ± 1.1 | 15.2 ± 10.6 | 17.5 ± 2.3 | 23.4 ± 2.4 | 7.7 ± 1.8 | 0.7 ± 0.2 | |
| Fe | 23.7 ± 1.7 | 47.9 ± 5.4 | 17.1 ± 2.6 | 9.1 ± 0.8 | 4.8 ± 0.3 | 1.7 ± 0.9 | |
| Li | < LD | < LD | 1.9 ±0.3 | 2.4 ± 1.0 | 3.4 ± 0.6 | 5.0 ± 1.1 | |
| Mn | 1.2 ± 0.3 | 0.6 ± 0.2 | 4.6 ± 0.3 | 4.8 ± 0.3 | 8.7 ± 1.4 | 8.8 ± 1.8 | |
| Ni | 6.1 ± 1.2 | 2.0 ± 0.2 | 16.4 ± 1.2 | 15.1 ± 1.5 | 16.7 ± 1.7 | 22.7 ± 1.1 | |
Disclaimer/Publisher’s Note: The statements, opinions and data contained in all publications are solely those of the individual author(s) and contributor(s) and not of MDPI and/or the editor(s). MDPI and/or the editor(s) disclaim responsibility for any injury to people or property resulting from any ideas, methods, instructions or products referred to in the content. |
© 2024 by the authors. Licensee MDPI, Basel, Switzerland. This article is an open access article distributed under the terms and conditions of the Creative Commons Attribution (CC BY) license (http://creativecommons.org/licenses/by/4.0/).
Copyright: This open access article is published under a Creative Commons CC BY 4.0 license, which permit the free download, distribution, and reuse, provided that the author and preprint are cited in any reuse.


